1. Introduction
Diesel engines are widely used in transportation, industry, agriculture, and construction owing to their high efficiency, reliability and durability. However, compared with gasoline engines, a compression ignition (CI) engine emits more pollutants, especially nitrogen oxides (NO
x) and particulate matter (PM) [
1]. The trade-off relationship that exists between the two main pollutions makes traditional emission-reduction techniques inefficient. The application of alternative fuels is one of the effective ways to address this requirement, while helping to alleviate the shortage of fossil fuels.
Among the alternative fuels, Fischer-Tropsch (F-T) fuel is a promising option for CI engines, and is produced to liquid by F-T synthesis from a wide range of natural materials such as coal, natural gas, and biomass. Some researches indicate that F-T fuel has a higher mass heating value and cetane number (CN) than commercial diesel fuel [
2,
3], which are important properties for fuel used in CI engine. The F-T fuel synthesis from coal is called CFT, and the F-T fuel synthesis from natural gas is known as GTL (Gas to Liquid), which both have been studied extensively with regard to combustion [
4,
5], emissions, and power output. Lapuerta et al. [
6] investigated the emissions of GTL fuel derived from a low temperature F-T process, and found that GTL has the potential to reduce the PM emissions. The research of Torregrosa et al. [
7] reached a similar conclusion. Li et al. [
8] found that GTL significantly reduced regulated emissions, with average reductions of 21.2% in CO, 15.7% in HC, 15.6% in NO
x, and 22.1% in smoke compared to diesel, as well as average reductions of 85.3% and 43.9% in the unregulated emission of total ultrafine particles number and mass, respectively. Hao et al. [
9] investigated the unregulated emissions from CFT, for instance, carbonyl emissions, and concluded that CFT could reduce the level of the total and individual carbonyl compounds. The marked reduction in pollution suggested that F-T fuel is more environmentally friendly than diesel fuel. In addition, GTL exhibited almost the same power output and torque output as diesel, while improving fuel economy [
10]. Based on the above research results, it can be revealed that there are a similar combustion and emission characteristics between CFT and GTL, but from the perspectives of resource abundance, environmental and economic constraints, there are some differences between CFT and GTL [
11]. With the continued development of the F-T process, CFT can be designed to meet or even exceed the required specifications of fossil diesel [
12,
13]. At present, CFT is commercially produced in countries where coal reserves are abundant, such as South Africa and China [
3,
14,
15]. CFT has been selected as the alternative fuel used in CI engine for this study, considering China’s energy reserves are coal rich, with less gas.
So far, power performance, economy, and emission characteristics are the main optimization targets of alternative fuel design for CI engines. The combustion-induced vibration response can significantly affect the fatigue life and maintenance cost of engine structures. If fuel design of alternative blended fuels could improve the combustion characteristic and its responding vibration response of CI engines, it may also be of benefit in improvement of service life and operational reliability of CI engines. However, the study on the difference of vibration and noise caused by the combustion behavior of different alternative fuels has not been sufficiently deep and extensive concerned.
The mechanical vibration signal of a CI engine is the result of multiple excitations arising from factors such as gas combustion pressure shock, piston side thrust force excitation, valve seating shock, and the inertia force in the crank-connecting rod mechanism. These excitations have cyclical and non-stationary time-varying characteristics. The study and analysis of the vibration signal are helpful for the fault diagnosis [
16,
17,
18], knock detection [
19,
20], identification of combustion characteristics [
21,
22,
23,
24,
25], and improving the noise vibration and harshness (NVH) performance of the whole engine. The two main excitation source of engine vibration are the pressure shock caused by rapid combustion in the chamber and impact of piston assembly driven by the fuel combustion. Therefore, the change in the combustion state of the air-fuel mixture has great influence on the engine vibration signal. The vibration states of engine fueled with diesel fuel and biodiesel are markedly different due to the differences in the rise rate and oscillation of in-cylinder pressure [
26,
27,
28]. Li et al. [
29] found that the advanced ignition of biodiesel is the main cause of the nonlinear increase in root mean square (RMS) of vibration response near the combustion top dead center (TDC).The study by Taghizadeh-Alisaraei et al. concluded that the RMS and kurtosis values of engine body vibration increase when ethanol is added to diesel [
30]. Meanwhile, the RMS value of dual-fuel engine vibration is lower than that of diesel engine, and the frequency component distribution of dual-fuel engine vibration is narrow [
31].
Different alternative fuels have different combustion behaviors due to their diverse physical and chemical properties, which gives the engine different vibration behaviors. Therefore, for the evaluation of alternative fuels, in addition to the combustion and emission characteristics, a certain understanding of the corresponding vibration characteristics, including typical amplitudes and frequency distributions, must be developed. The diffusive combustion and multi-point ignition mode of CI engine necessitates high compression ratios, resulting in vibration and noise that is greater than that of spark ignition engines. Hence, the vibration performance of CI engine fueled with alternative fuels should be given special attention. Especially for light-duty high-speed diesel engines used in passenger vehicles, vibration and noise reduction are very important for the comfort experience of passengers. At present, there are a few studies about CFT as the fuel of CI engine, and most of those few studies focus on the performance, combustion, and emission performance of CFT, while the vibration characteristics of CFT have been largely unstudied. In this study, based on the combustion characteristics of a CI engine fuelled by CFT, the influence of CFT and CFT-diesel blends on the vibration performance is investigated, using acceleration signal analysis of the engine head and block.
3. Results and Discussion
3.1. Analysis of Combustion Pressure
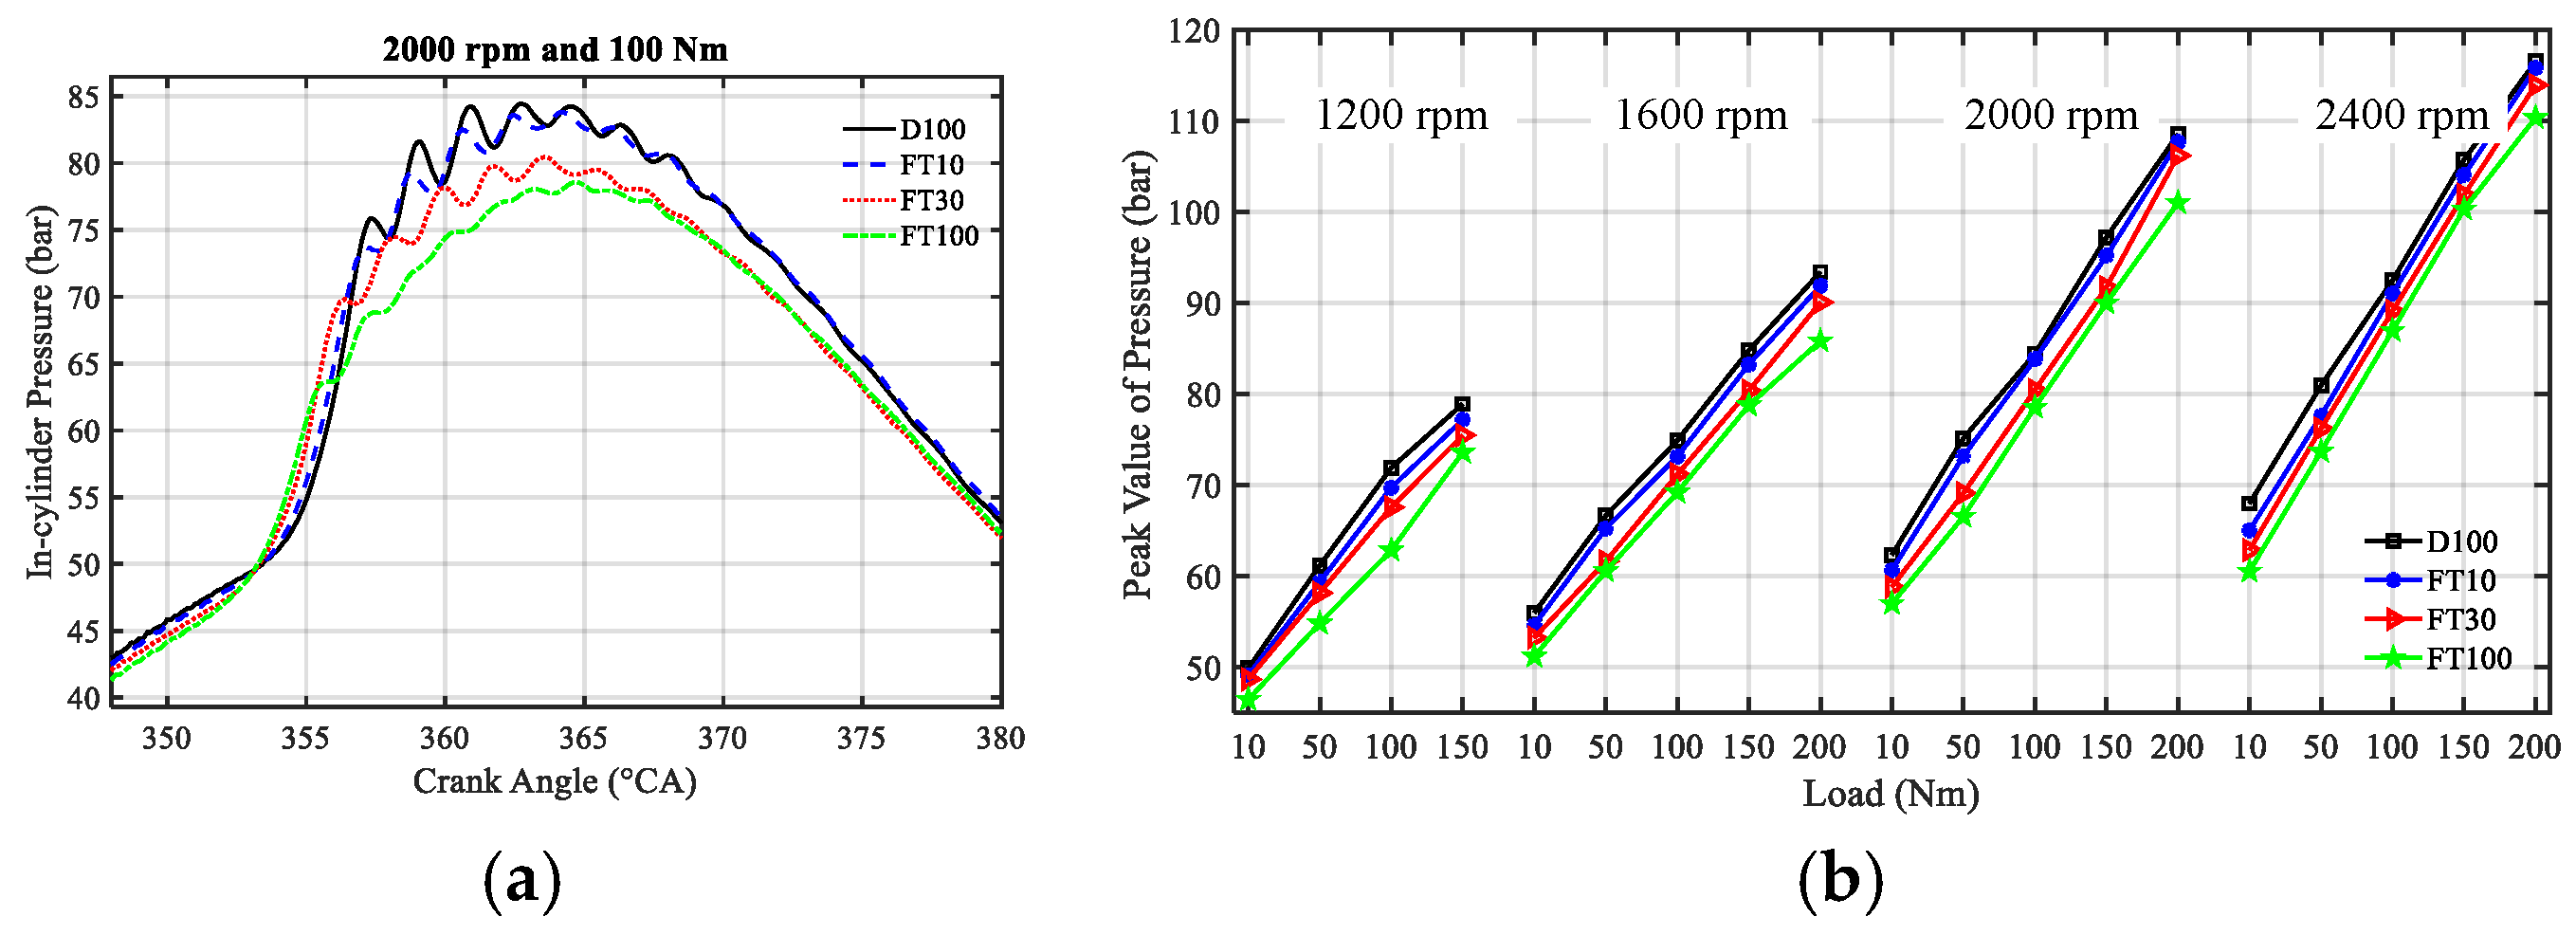
Figure 2a shows the in-cylinder combustion pressure curve of the engine at a speed of 2000 rpm and torque of 100 Nm. The peak value of pressure decreases gradually with increasing CFT proportion in the blended fuels. The peak pressure value increases with the growth of speed and load, and the trend becomes more obvious with the increase in load, as illustrated in
Figure 2b. When using blended fuels, there is an observable decrease in the peak value of combustion pressure with the increase in the proportion of CFT. This is mainly because the LHV of CFT is smaller than that of petro-diesel, and so, CFT used in diesel engine provides less heat under the same conditions.
Figure 2a also indicates that the amplitude of combustion pressure oscillation is relatively high when D100 is used in the engine, while for the other fuels, the oscillation amplitude decreases gradually as the proportion of CFT increases. The oscillation amplitude is the smallest when FT100 is used, which means that CFT has a smooth combustion feature due to the satisfactory evaporation characteristic allow the formation of an even mixture.
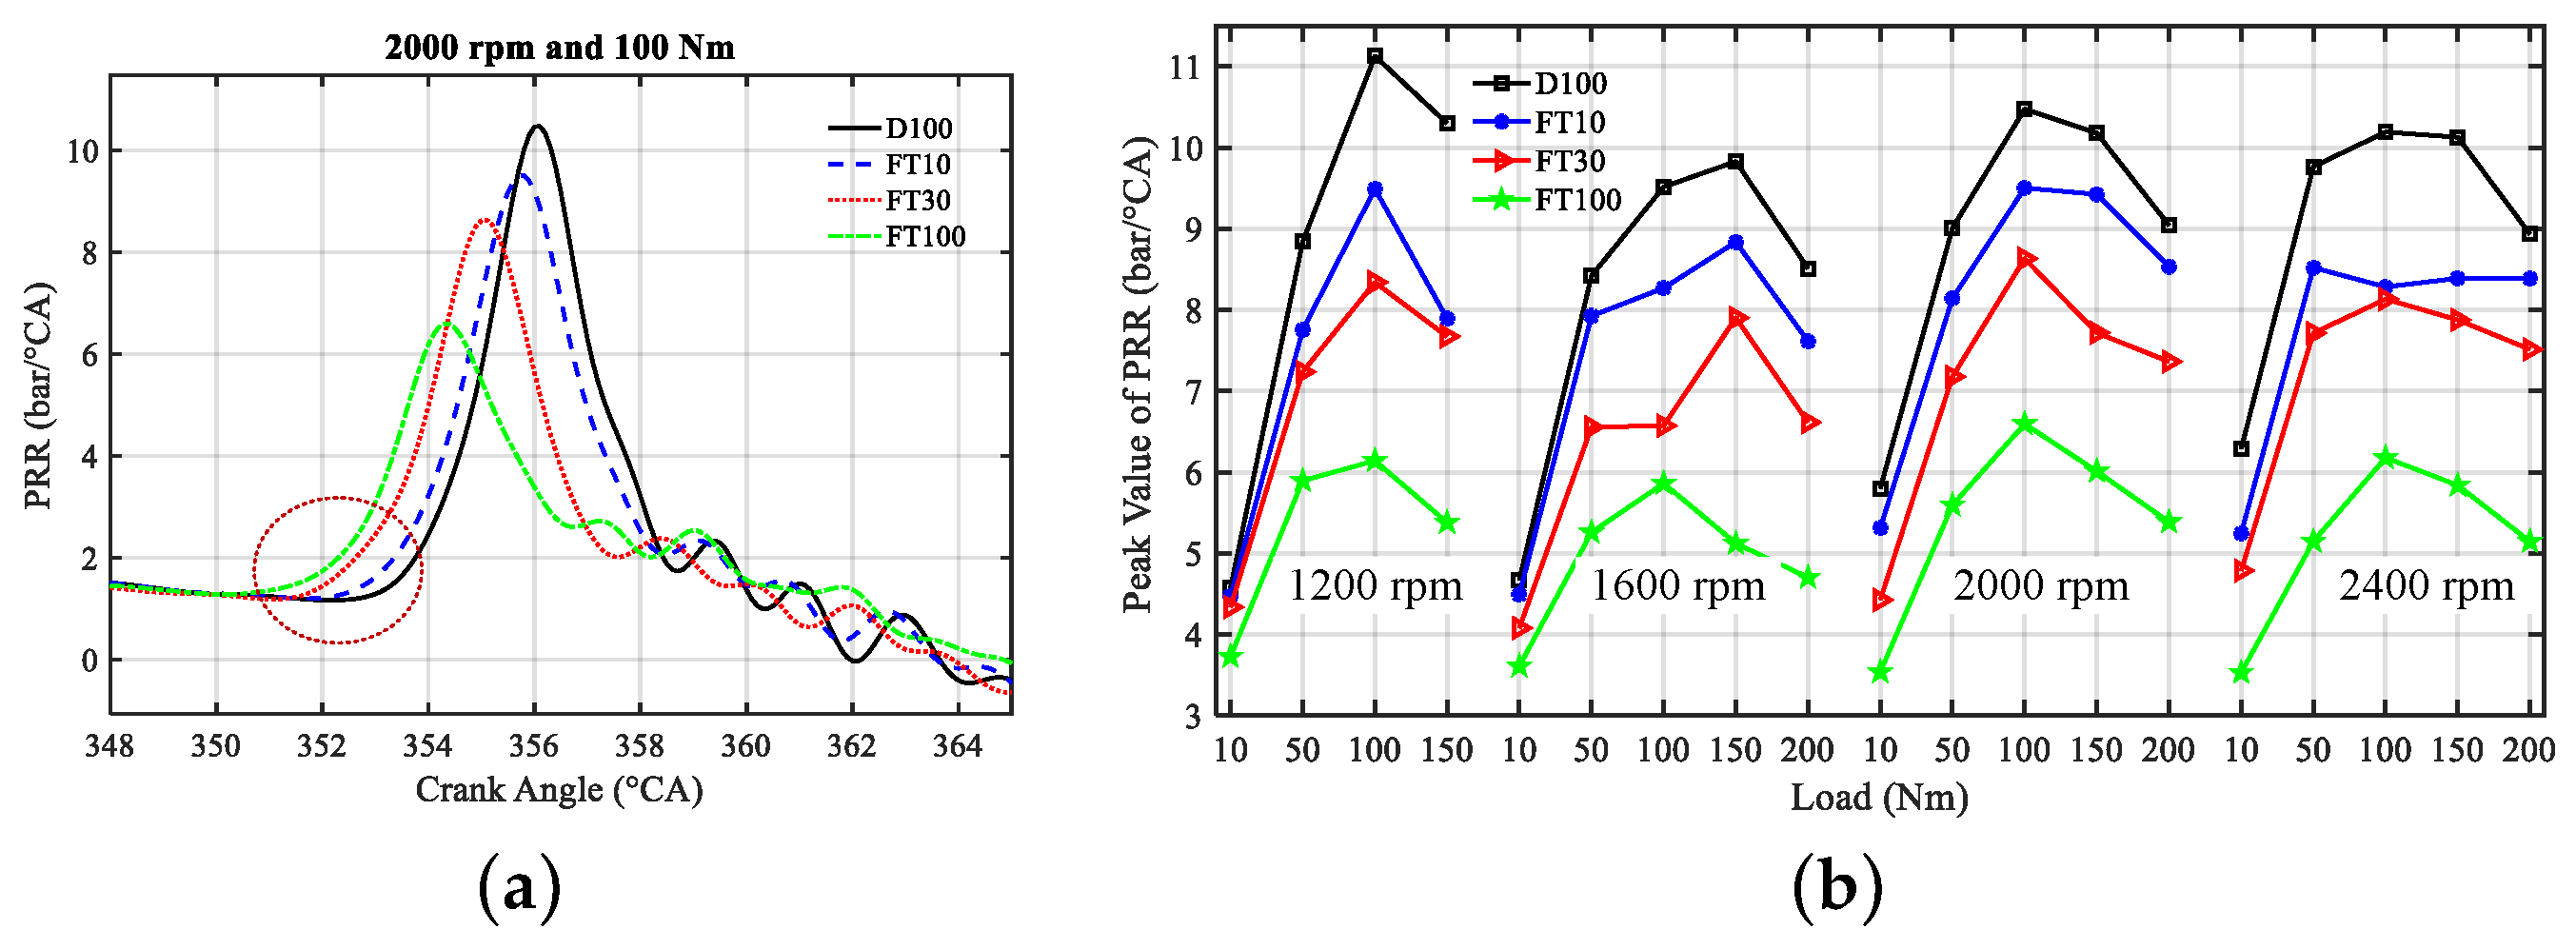
Combustion pressure shock is the main excitation source that causes the vibration of mechanical structures in an engine. The higher the change rate of pressure, the greater the influence on the engine structure. In order to effectively distinguish the differences in combustion pressure when these four fuels are used, the pressure rise rate (PRR) is calculated for extracting the phase information of ignition and the maximum PRR accurately.
Figure 3a details the variation of PRR at a speed of 2000 rpm and load of 100 Nm. With the increase in CFT proportion, the peak value of PRR gradually decreases, and the phase of the peak PRR is gradually advanced because of an increase in the CN of blended fuels. The circle drawn with dotted lines in
Figure 3a illustrates that the start timing of combustion is advanced with the increase in the proportion of CFT.
Figure 3b indicates that the maximum PRR changes dramatically with the load, that is, the maximum PRR first increases gradually and then reduces with load.
The CFT fuel is easier to be compression ignited compared with petro-diesel due to its high CN which could shorten the ignition delay period, and result in a less combustible gas mixture. In addition, due to CFT would release fewer heat energy due to its low LHV. In the end, the phase of maximum PRR will be advanced, and the peak value will be reduced.
In the vibration analysis of CI engine, the excitation produced by combustion pressure of the fuel-air mixture in the cylinder is the main source of engine vibration. The gas pressure excitation is mainly composed of the compressing force, pressure increment generated by combustion and high frequency oscillation of the gas pressure. The first two components subject the engine chamber and all its connected components to the strong impact of dynamic loads, which produces complex vibration response of engine body. The third component is generated mainly by the shock of gas pressure oscillation due to the uneven distribution of temperature and pressure of the gas in the chamber during the combustion process. These pressure waves undergo multiple reflections within the combustion chamber to form a high-frequency gas pressure oscillation.
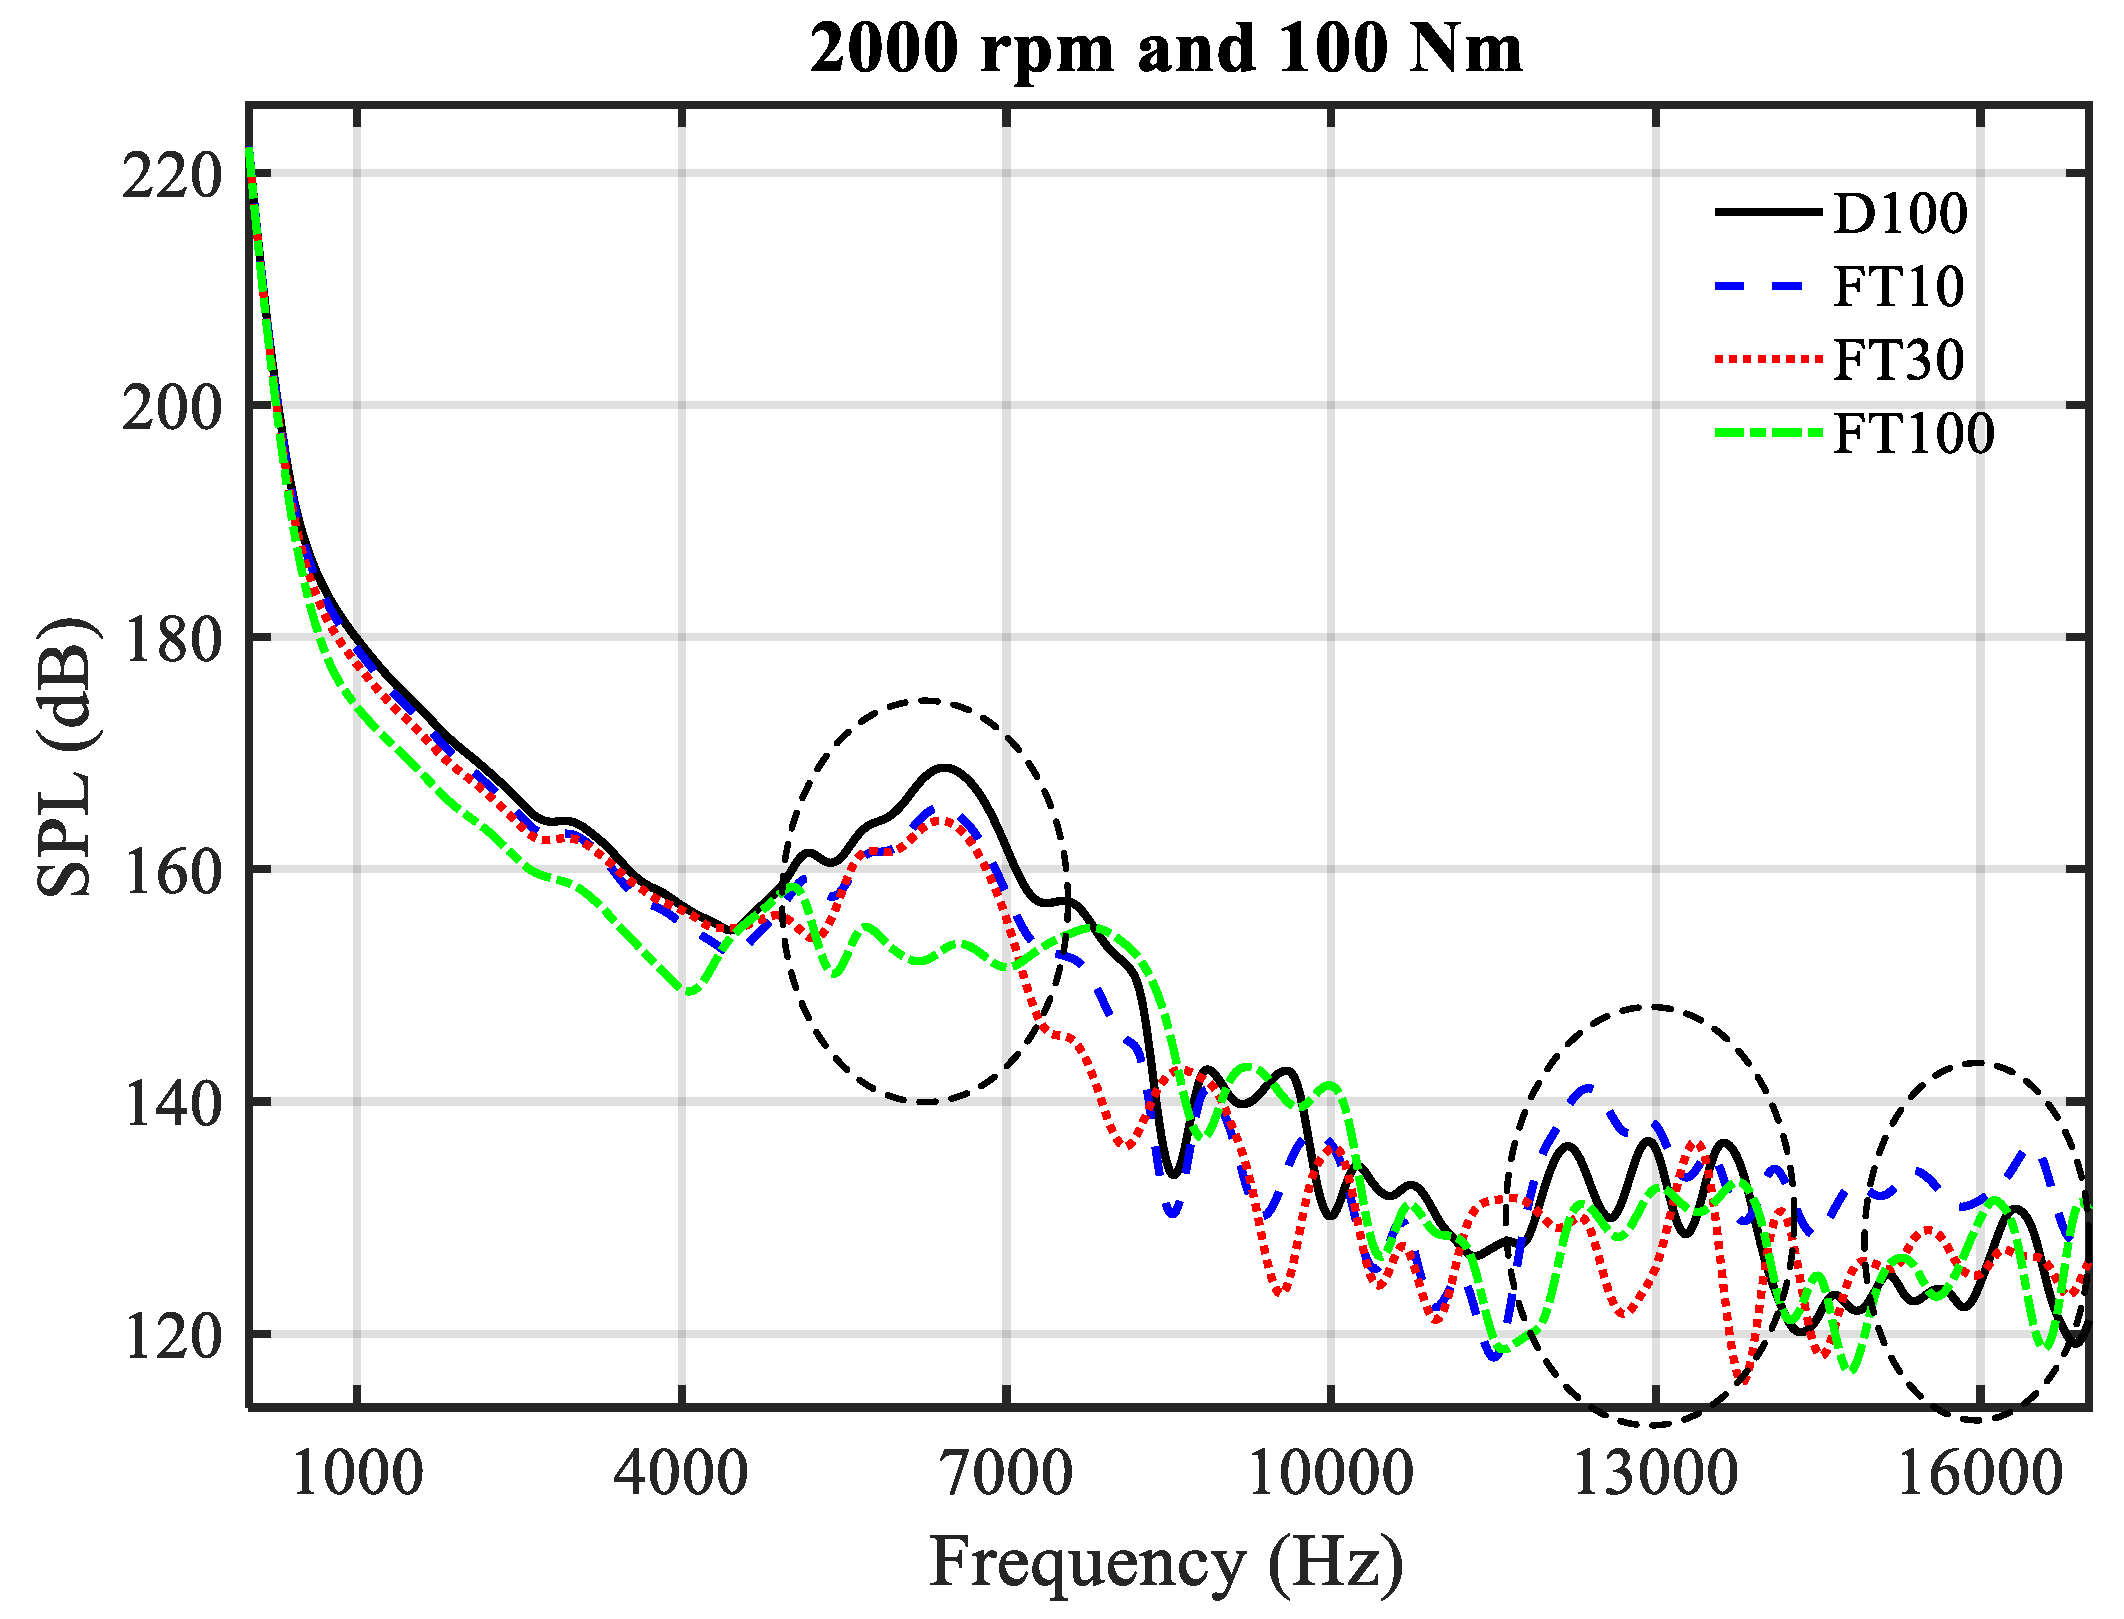
Combustion pressure in cylinder has typical acoustic characteristics which involves abundant time-domain and frequency-domain information. For a better understanding of vibration feature related with combustion, the spectrum of the in-cylinder pressure would be analyzed. Subsequently, the sound pressure level (SPL) spectrum of the cylinder pressure signal is calculated, and the reference sound pressure is selected as 20 μPa.
Figure 4 illustrates the comparison of the combustion pressure spectrum when using different fuels at 2000 rpm and 100 Nm. In the low frequency band of less than 500 Hz, the amplitude decreases rapidly, which reflects the frequency characteristics of the smooth curve of gas combustion pressure in the cylinder. The higher the peak pressure values in the cylinder, the greater the amplitude of the low frequency component becomes. In the middle frequency band of 500–4000 Hz, the decreasing trend becomes slow, the amplitude decreases gradually with the increase in the proportion of CFT, and the difference between each fuel is more obvious than in the low frequency band. This frequency band reflects the peak PRR value of the gas in the chamber. The higher the peak PRR value, the greater the energy in the middle frequency band becomes, as shown in
Figure 3a. In the high-frequency band above 4 kHz, the amplitude oscillation becomes strong, and the energy concentration phenomenon occurs approximately at the frequencies of 4–7, 13 and 16 kHz. The high-frequency components result from the cylinder pressure oscillation in the cylinder, which also reflects the maximum acceleration of combustion pressure change.
In conclusion, combustion pressure oscillation is the main source of the high-frequency component of CI engine vibration. The strength of the pressure oscillation is related to the combustion PRR, pressure rise acceleration, peak value of combustion pressure, and crank angle phases of these three quantities. The vibration caused by pressure oscillation will eventually be transmitted to the engine surface.
The mechanical vibration of the engine is closely associated with the pressure change resulting from the mixture combustion in chamber. At the same time, because of the damping effect of the mechanical components on the gas pressure spectrum in the CI engine, the vibration spectrum caused by combustion is quite different from the SPL spectrum in the cylinder, but the level of the SPL spectrum has an important influence on the vibration signal of combustion. The in-cylinder combustion pressure of a CI engine is relatively high, and the vibration amplitude is also obvious.
3.2. Time Domain Analysis of Vibration Signal
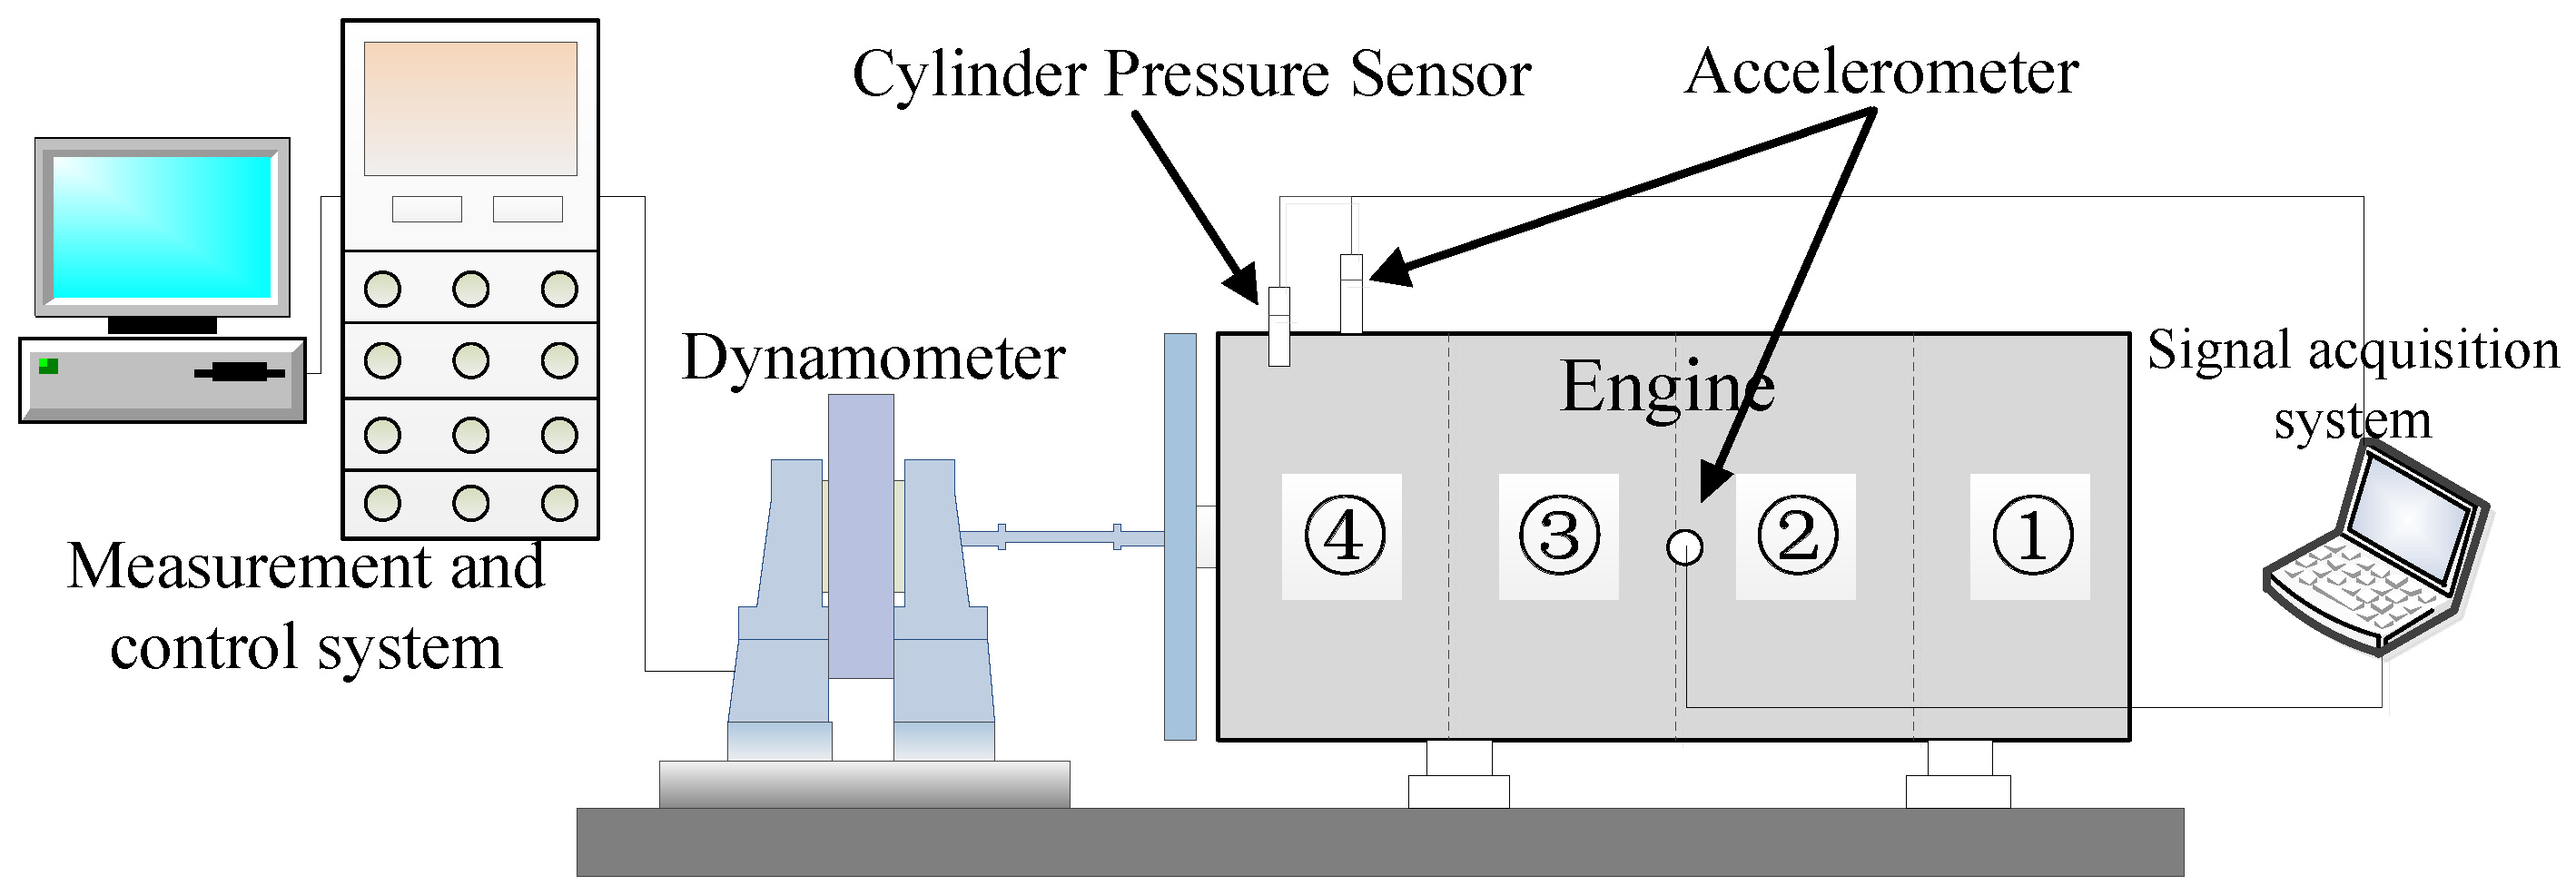
The excitations acting on the engine mechanical components will vary with the movement. For the engine head, the main excitation sources include the gas pressure shock, transient impact due to seating of the intake and exhaust valves, and gas throttling shock during exhaust valve opening. These excitations act on the engine head in accordance with crank angle. Under the steady operation condition, the excitation sources acting on the engine block mainly include the gas pressure shock in the chamber, inertia force of the piston-connecting rod mechanism, and piston side thrust force. Under each test condition, the influence of other engine operating parameters on engine vibration is the same, except for the difference of fuel type.
Figure 5a,b show the time-domain vibration signals collected from the engine head and block, respectively, during one complete working cycle at the speed of 2000 rpm and load of 10 Nm. In the two figures, the vibration of each cylinder has been shown according to the firing order. The amplitude of the vibration signal in the fourth cylinder is the maximum compared with the other three cylinders0 because the acceleration sensor is located close to the fourth cylinder. The firing order of the test engine is 1-3-4-2-1, and combined with the valve timing angle, the sequence of events in
Figure 5a from left to right is that TDC of the first cylinder, exhaust valve closing (EVC) of the fourth cylinder, TDC of the third cylinder, inlet valve closing (IVC) of the fourth cylinder, TDC of the fourth cylinder, EVC of the fourth cylinder, and TDC of the first cylinder. In practice, the vibration characteristic of these events can be altered when a failure occurs at a certain position, and this failure can be identified by detecting the change in the phase and intensity arising of abnormal vibration signal from the failure. Compared with petro-diesel, the influence of the different combustion characteristics of alternative fuel used in CI engine on the vibration signal has a similar effect.
The vibration amplitudes of the other cylinders decrease with the increase of distance from the fourth cylinder in
Figure 5a. From the vibration signal near the TDC of the fourth cylinder, which is approximately 350 °CA, it can be seen that with increasing CFT proportion, the amplitude of the vibration signal decreases. In summary, the application of CFT has the potential to reduce the vibration energy of a CI engine. The same conclusion can be obtained from the engine block vibration signal in the time domain shown in
Figure 5b, which is approximately 540 °CA.
In order to intuitively compare the effects of blended fuel used in the engine on vibration characteristic, RMS values of engine head and block vibration signals are shown in
Figure 6a,b, respectively, which summarize the average RMS values of vibration acceleration signals for all blended fuels in the mentioned operation condition. RMS value is the root mean square of the signal and is used to represent the energy in the signal. It can be clearly seen from the two figures that the change of the RMS value of the four fuels is almost the same under all operation conditions.
The RMS values show a rising trend as the load and speed increase. For higher loads and speeds, the engine combustion becomes more powerful, and the vibration is influenced by the changes in the high combustion pressure in the chamber. The RMS value rises with the increase in CFT concentration in diesel fuel, and the engine structure vibration is weakened. Therefore, although using CFT will reduce the engine power due to its lower LHV, the vibration energy is smaller. CFT helps to reduce the vibration level of the vehicle, which could also be seen from the PRR curve in
Figure 3. It also can be seen from
Figure 6 that the difference in RMS values of four fuels is insignificant under low-load operating conditions.
CFT has a higher CN and a shorter ignition delay period compared with petro-diesel. As proportion of the pre-mixed combustion decreases, the PRR and combustion pressure peak values drop, resulting in smoother combustion and less combustion-related excitation. Therefore, the fuel with high CN is advantageous in reducing vibration. In short, under the low speed and load condition, the influence of fuel quality on engine vibration is small. However, under the high speed and load condition, CFT fuel for diesel engine will significantly reduce the vibration intensity of diesel engine. Therefore, according to the characteristics of CFT, the vibration of diesel engine can be reduced by improving fuel quality.
3.3. Frequency Domain Analysis of Vibration Signal
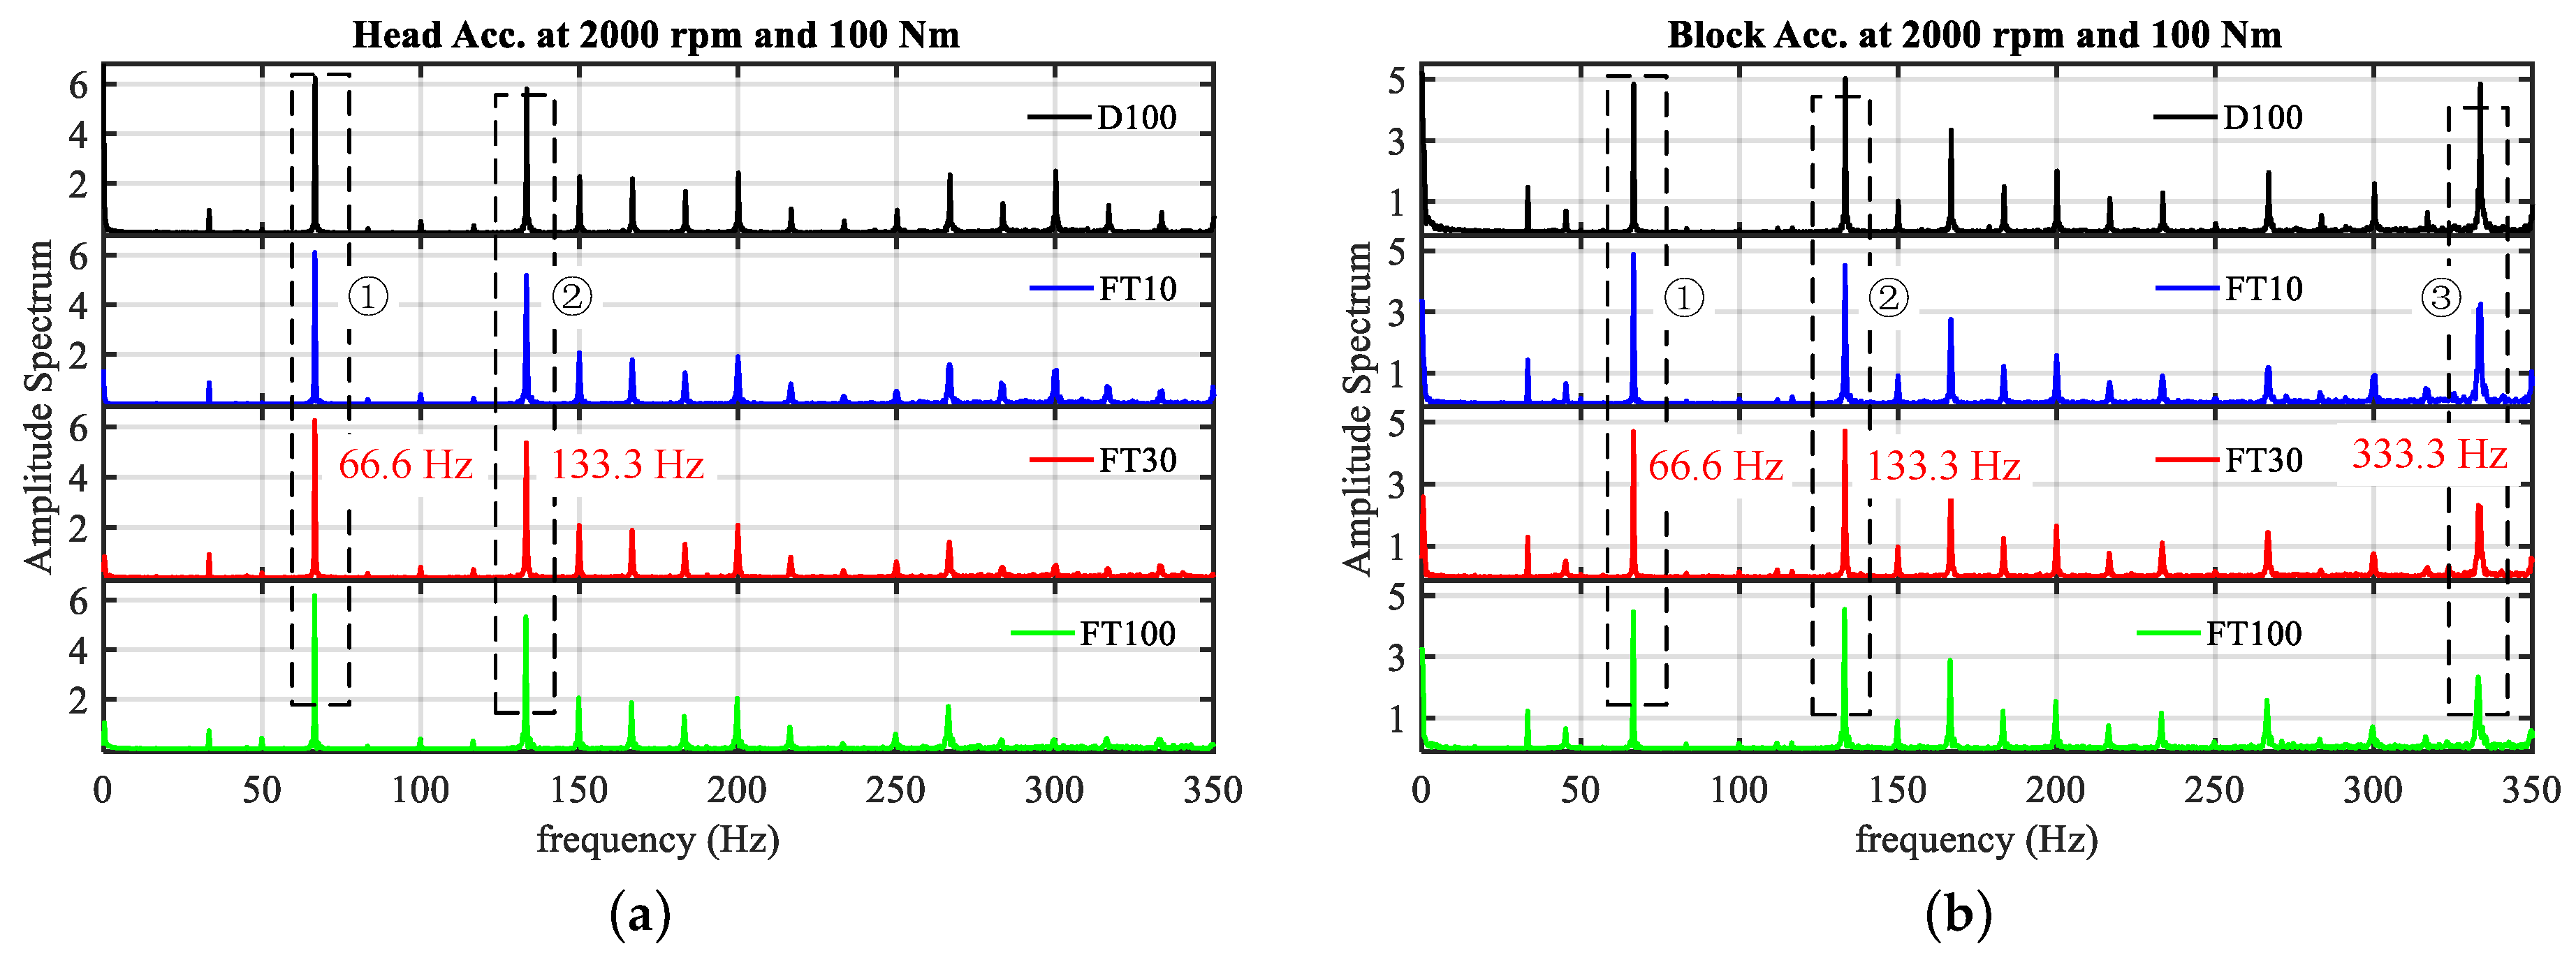
The frequency characteristic of the engine vibration signal is important for the NVH performance of the vehicle, passengers, and drivers. CI engine is rotary power machinery, and the rotation of the parts supplies a certain excitation which generates an amplitude response in the engine structure during normal operation. During a complete working cycle (720°), the crankshaft rotates two revolutions for the test engine. In each revolution (360°), combustion events happen twice, and intake and exhaust valve seating events happen once in each cylinder for the engine. For example, when the engine speed is 2000 rpm, the rotational frequency is 33.3 Hz, the frequency of combustion events is 66.6 Hz (2000/60/2 × 4 = 66.6 Hz), the frequency of valve seating events is 133.3 Hz (2000/60/2 × 8 = 133.3 Hz), as shown in
Figure 7a,b. The amplitude at the two characteristic frequencies (66.6 and 133.3 Hz) is the largest, indicating that combustion shock and valve seating impact are the two main excitation sources for the engine head.
In
Figure 7b, a large amplitude frequency at 333.3 Hz (10 times of rotational frequency) can be observed in addition to the two characteristic frequencies. Analysis of the forces on the engine body suggests that the accelerometer that measures engine block vibration is also sensitive to the piston side thrust impact because the reciprocating motion of the piston assembly and the inertial forces resulting from combustion act in the horizontal direction. From the principles of CI engine dynamics [
17], the frequency of the piston side thrust impact event during the up and down motion of the piston is 333.3 Hz (2000/60/2 × 5 × 4 = 333.3 Hz). Therefore, this value is the characteristic frequency of the piston side thrust impact events during the up and down motion of the piston assembly.
Figure 7b also indicates that the engine block mainly bears the action of three excitations: the combustion pressure shock, valve seating impact, and piston side thrust.
Besides, the amplitude of the frequency at 333.3 Hz decreases significantly with the increase in CFT proportion as observed in
Figure 7b. This is because the piston side thrust is the result of the combination of the combustion force and the reciprocating inertia force of the piston assembly. The inertia force is equivalent under the same speed, so the smaller the peak in-cylinder pressure (
Figure 2), the smaller the piston side thrust, and the smaller the excitation response amplitude.
It can be seen from the above analysis that there are differences among the main excitation forces acting on different engine parts. In the subsequent analysis, the vibration of the different parts should be analyzed with due emphasis. The characteristic frequencies of the routine events in the engine are not affected by the fuel combustion behavior in the cylinder. However, the combustion of fuel in the chamber will directly affect the combustion excitation force and the piston side thrust force, which affect the dynamic response and high-frequency radiation noise of the engine. Varying the engine condition will change the frequency and amplitude of the corresponding frequency in the spectrum diagram.
3.3.1. Engine Head Vibration Signal Analysis
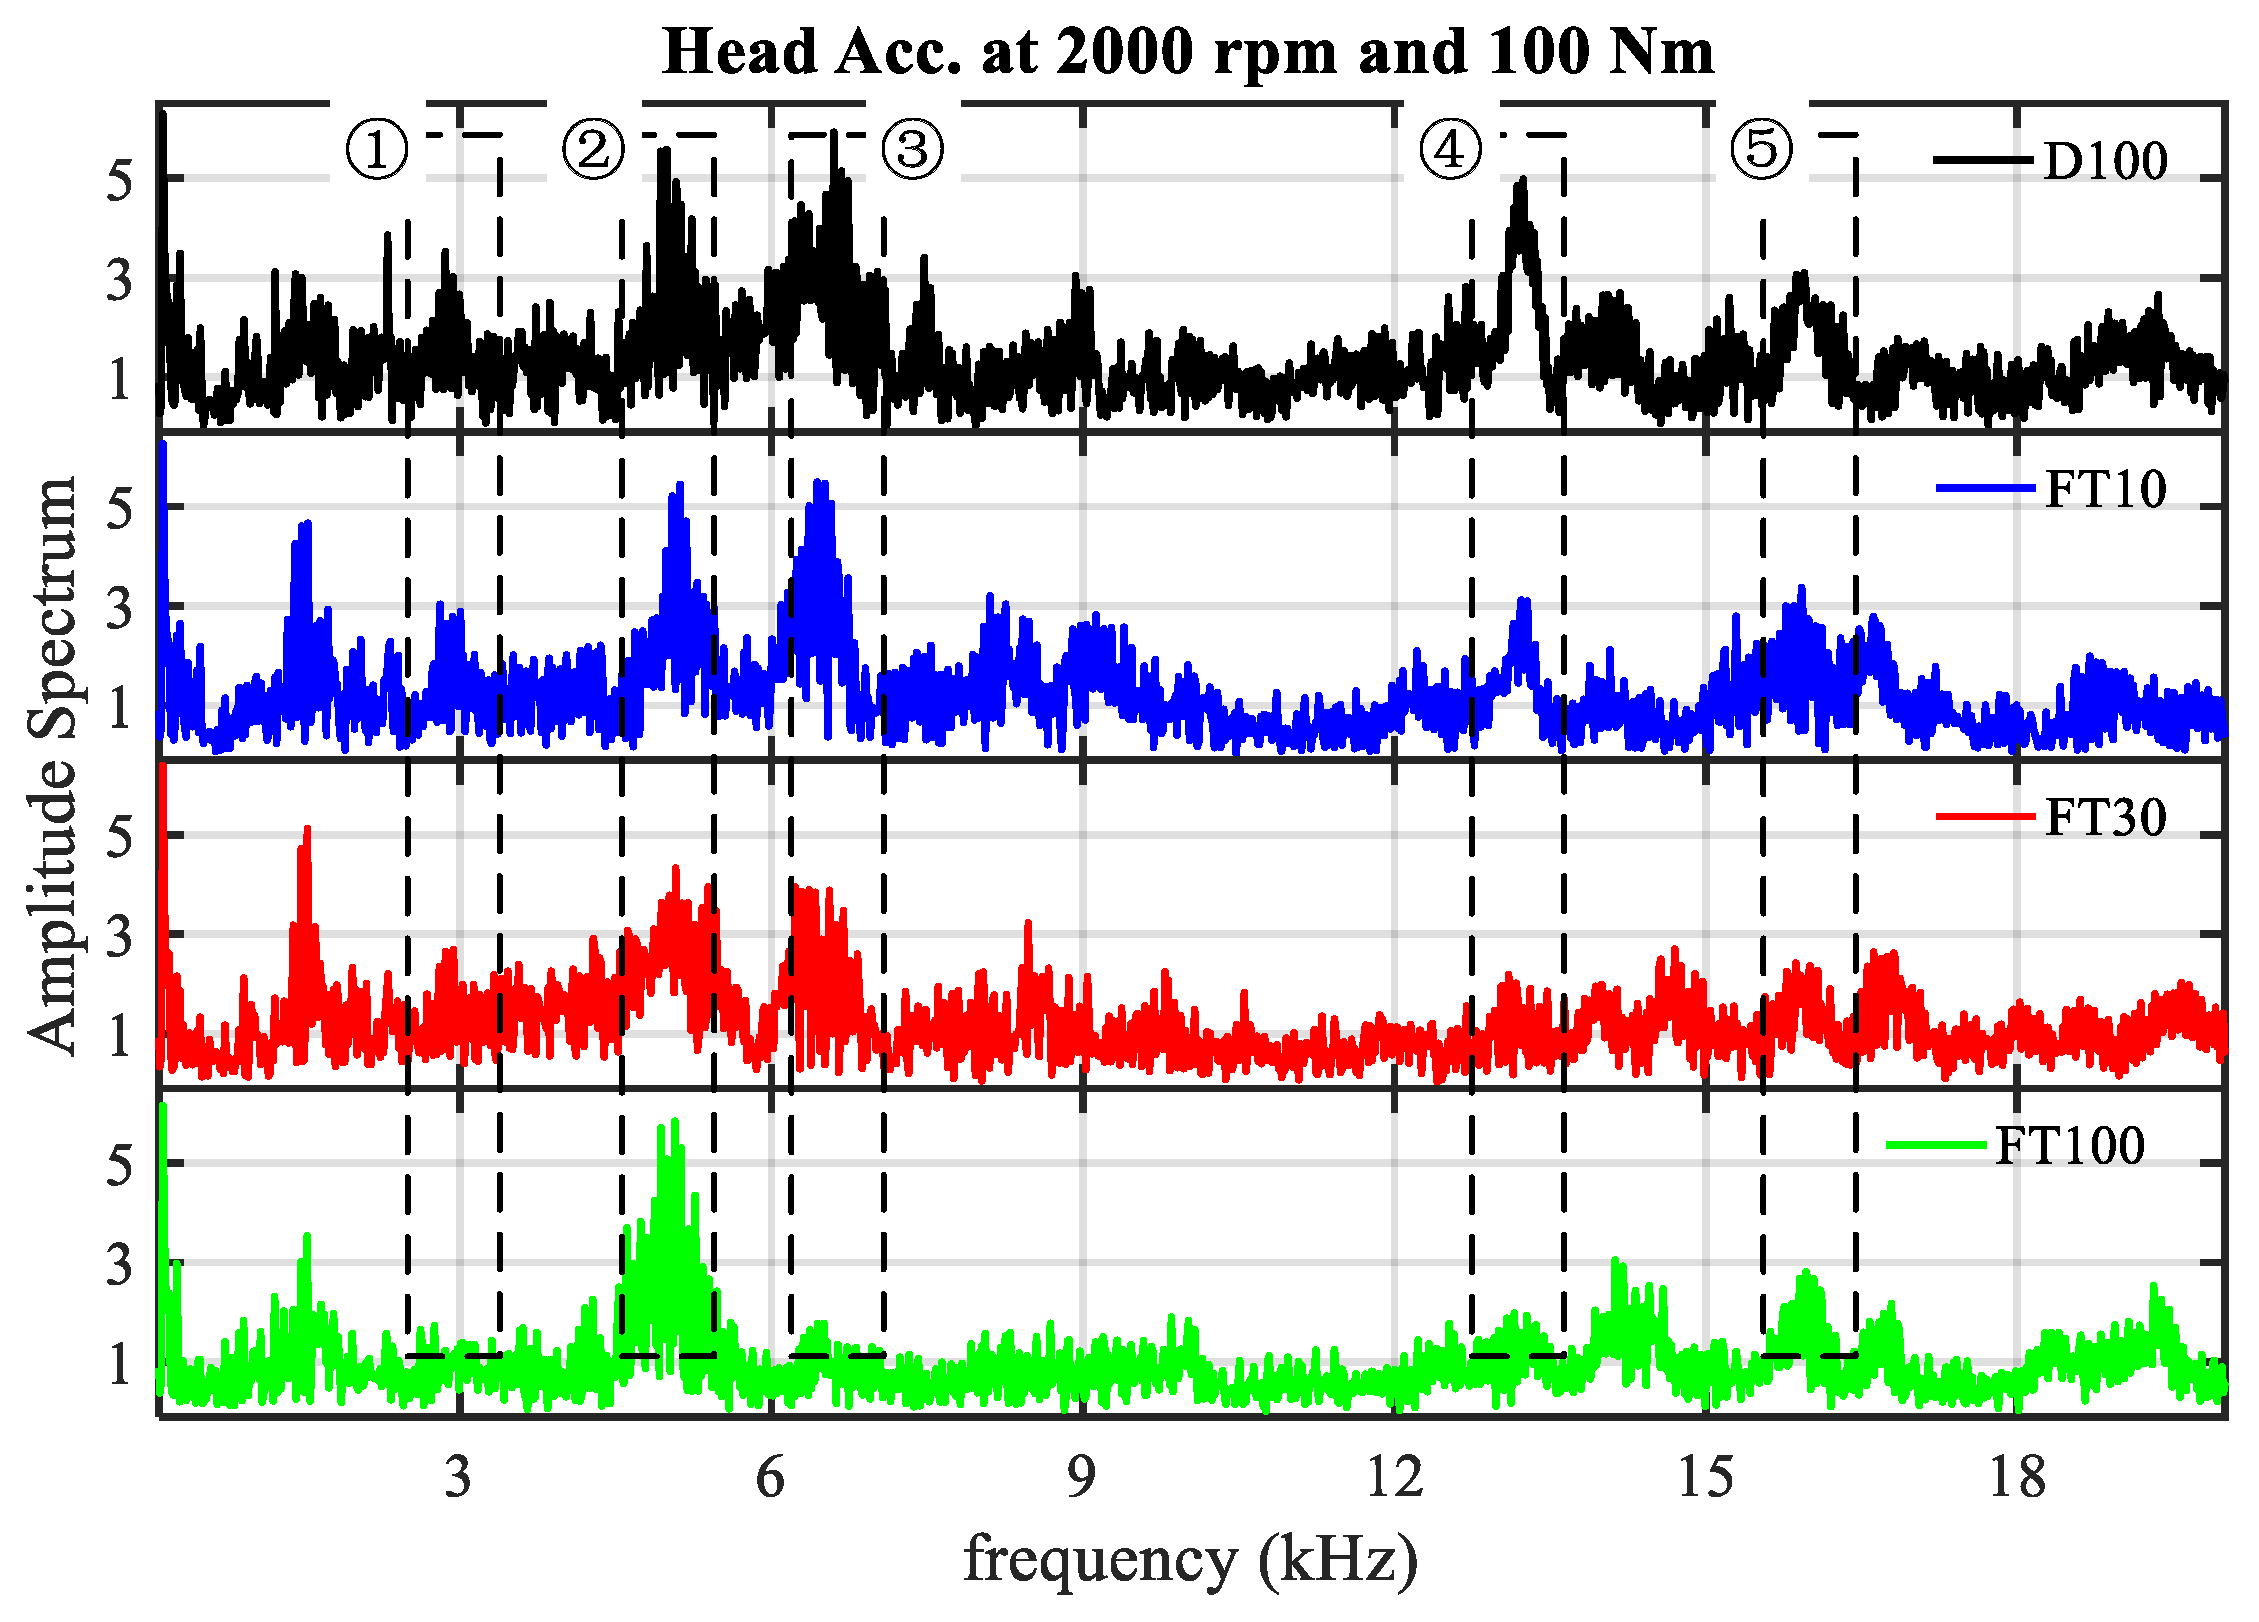
In order to study the influence of CFT and CFT blends on the vibration characteristics of CI engine, the amplitude spectrum curve of the engine head vibration signal at a rotational speed of 2000 rpm and load of 100 Nm as shown in
Figure 5a is obtained by the fast Fourier transformation (FFT). The transformation results are in
Figure 8. The frequency band of vibration acceleration of the engine head is relatively wide. There are high amplitudes in the frequency range of 1~9 kHz and approximately 13 and 16 kHz. Combined with the SPL spectrum of the combustion pressure curve in
Figure 4, it is found from
Figure 8 that there are four frequency components in the highlighted response area: 5, 6.48, 13.2 and 16 kHz, which are the dynamic response frequencies of engine head induced by combustion.
In order to facilitate the identification and analysis of the time at which a particular frequency event occurs, a continuous wavelet transformation (CWT) is applied to the raw acceleration signal of the engine head (as shown in
Figure 5a) is shown in 2D in
Figure 9. The mother wavelet used by the transformation is the Morlet, and the critical contents are clearly highlighted by the CWT analysis. For the subsequent analysis, valve-close timing information is also indicated because, compared with exhaust valve opening (EVO) and inlet valve opening (IVO), the dominant response is still caused by the combined IVC and EVC [
32]. At 360 °CA, the prominent response energy areas are in frequencies of 5, 6.48, 13.2, and 16 kHz. These four frequencies are the excitation responses of the combustion and pressure oscillation from the time-frequency distribution. The response energy area at the frequency content of 5 kHz remains basically unchanged for all fuels, but the response energy areas of the other three frequency contents are weaken with the increase in CFT proportion. The principal frequency content induced by the combustion pressure impact is approximately 5 kHz; meanwhile, the high-frequency response energy is significantly reduced, especially around 6.48 kHz, when blended fuels are burned.
3.3.2. Engine Block Vibration Signal Analysis
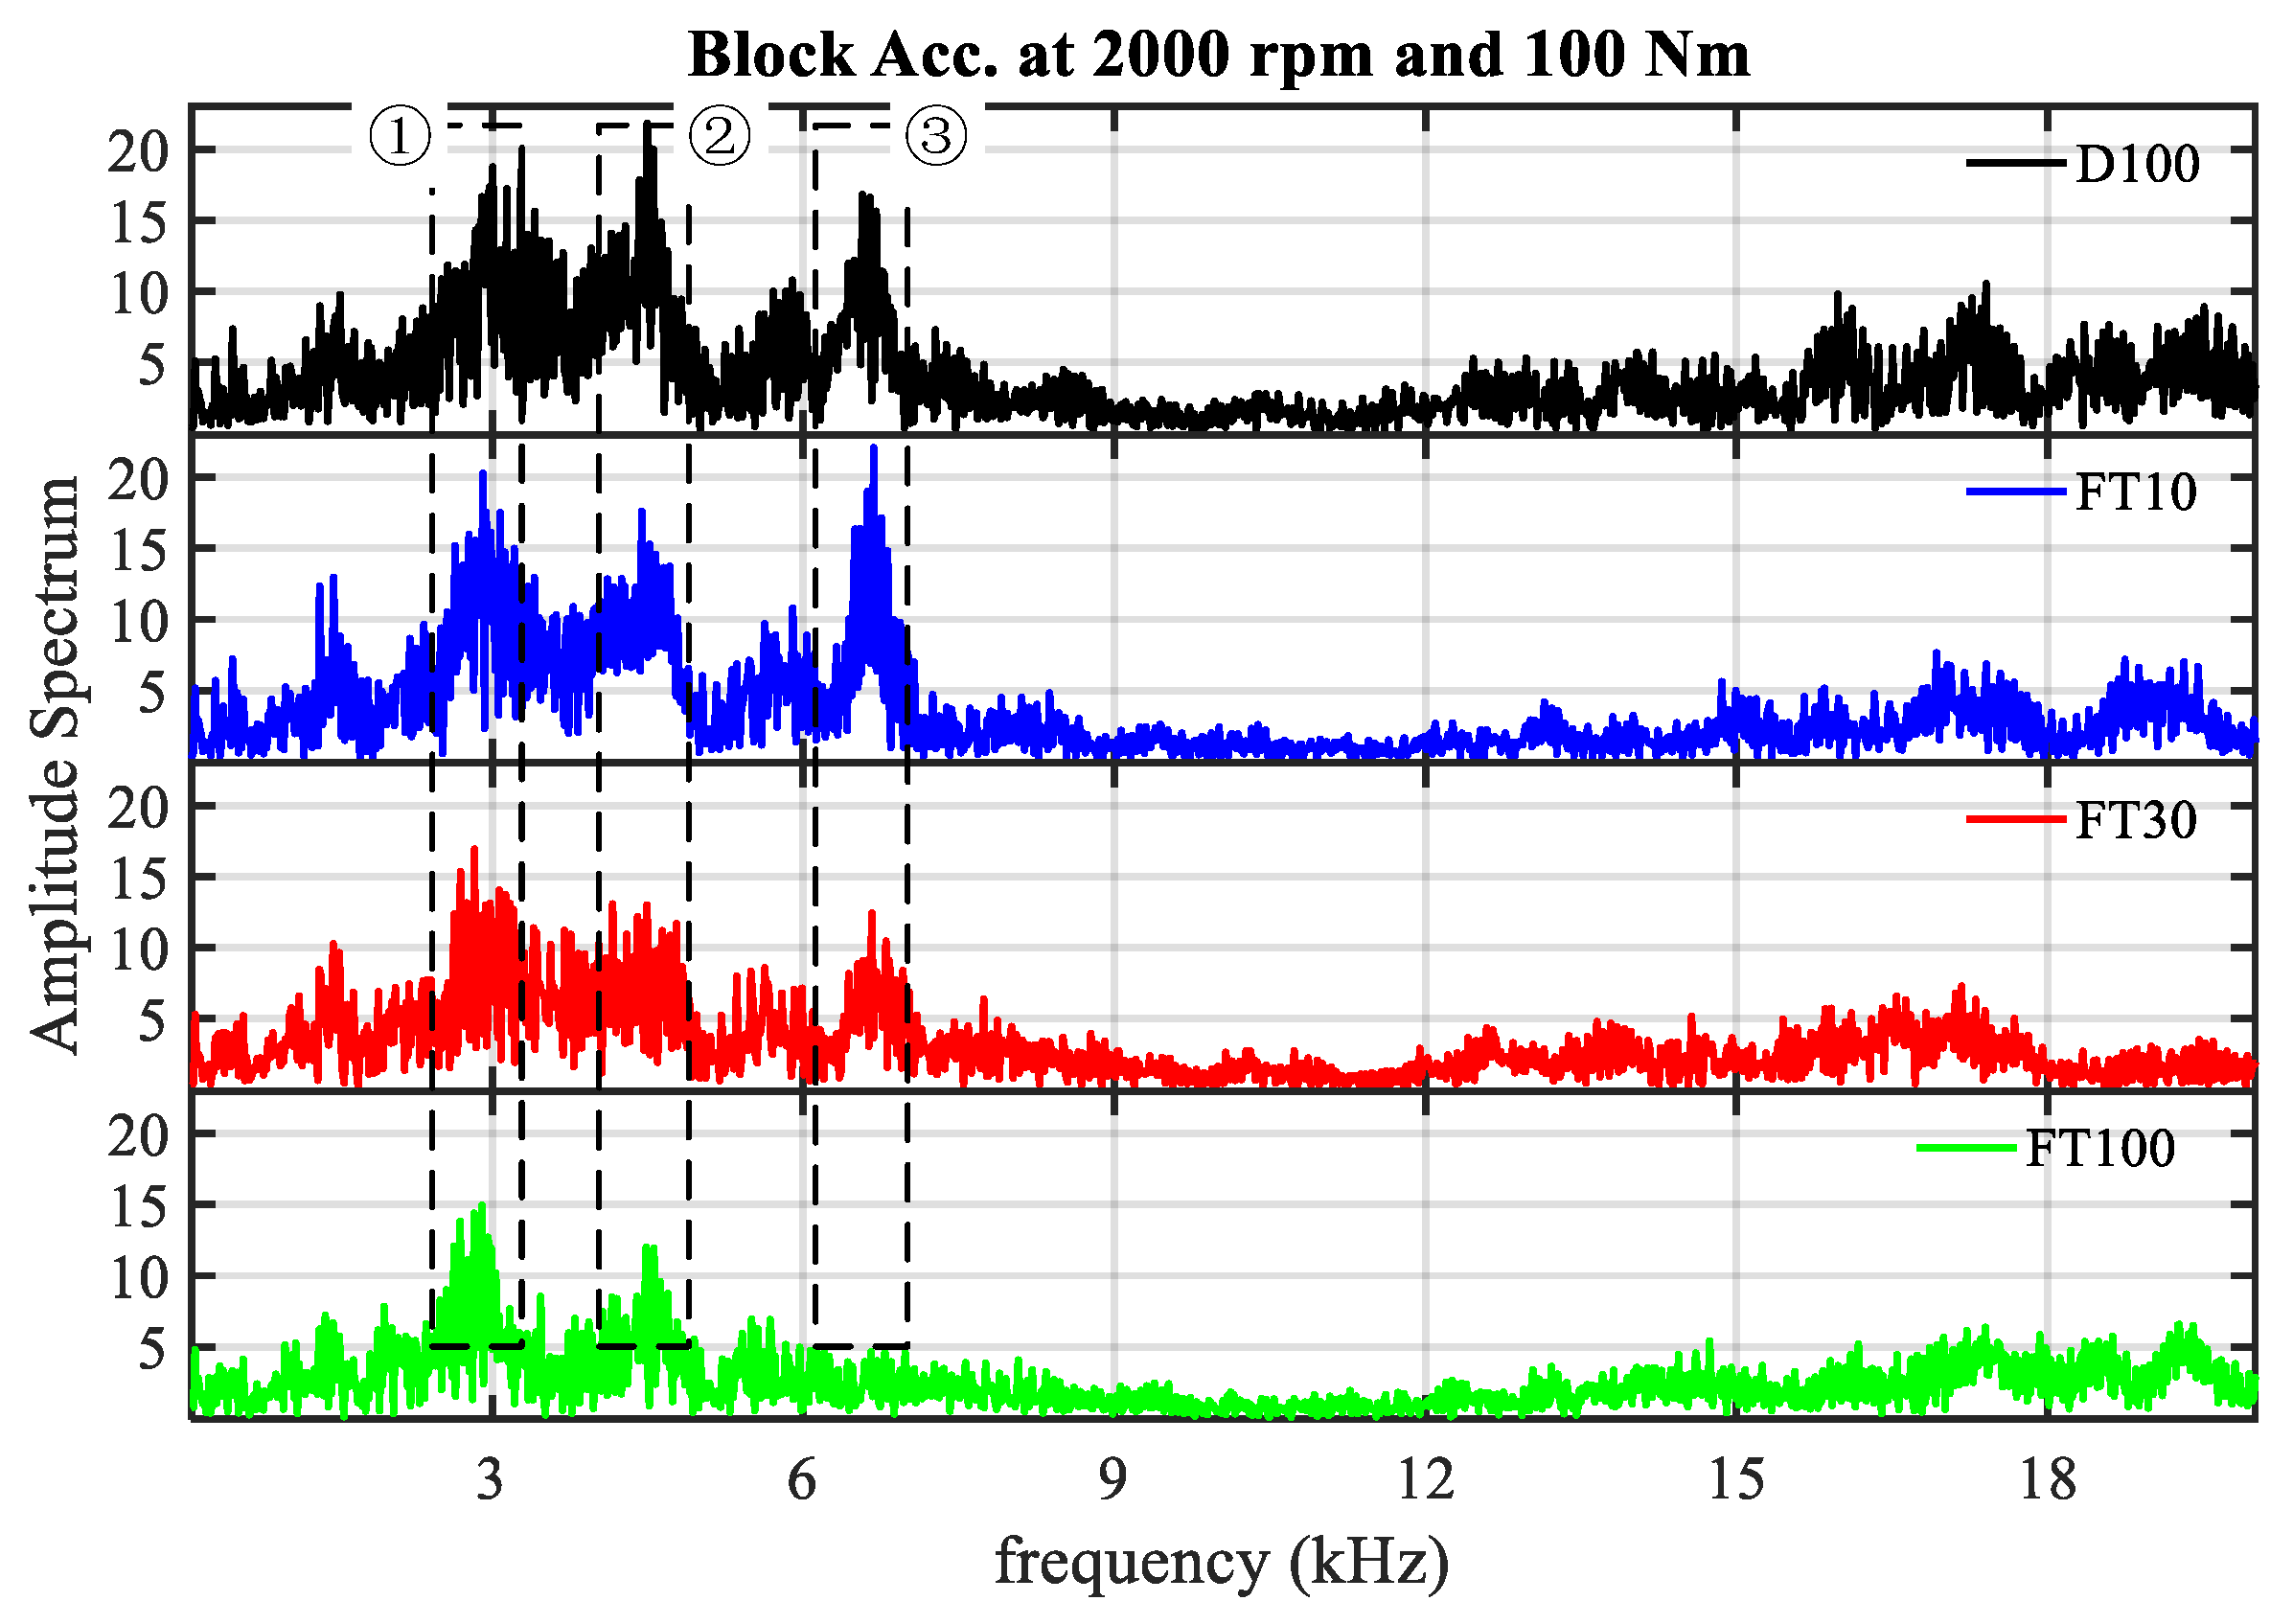
The amplitude spectrum curve of the engine block vibration signal (shown in
Figure 5b) is obtained by FFT transformation, and the transformation result is shown in
Figure 10. It is evident that the engine block vibration is mainly distributed in the frequency band below 8 kHz. The frequency bands of engine block vibration acceleration is concentrated in 2.5–3.5, 4–5 and 6–7 kHz. Due to its complexity, different parts of the CI engine have different response frequencies and modal frequencies. The first frequency band in the signal spectrum of the block vibration is not obvious in the signal spectrum of the head vibration. The amplitude of three frequency bands tends to a decrease with the increase in CFT. Meanwhile, the amplitude corresponding to FT10 at a frequency of approximately 6.5 kHz is higher than that of petro-diesel. Combined with the conclusions from the analysis of engine head vibration acceleration, it can be speculated that the frequency band at 5 and 7 kHz may be the response to the combustion event excitation.
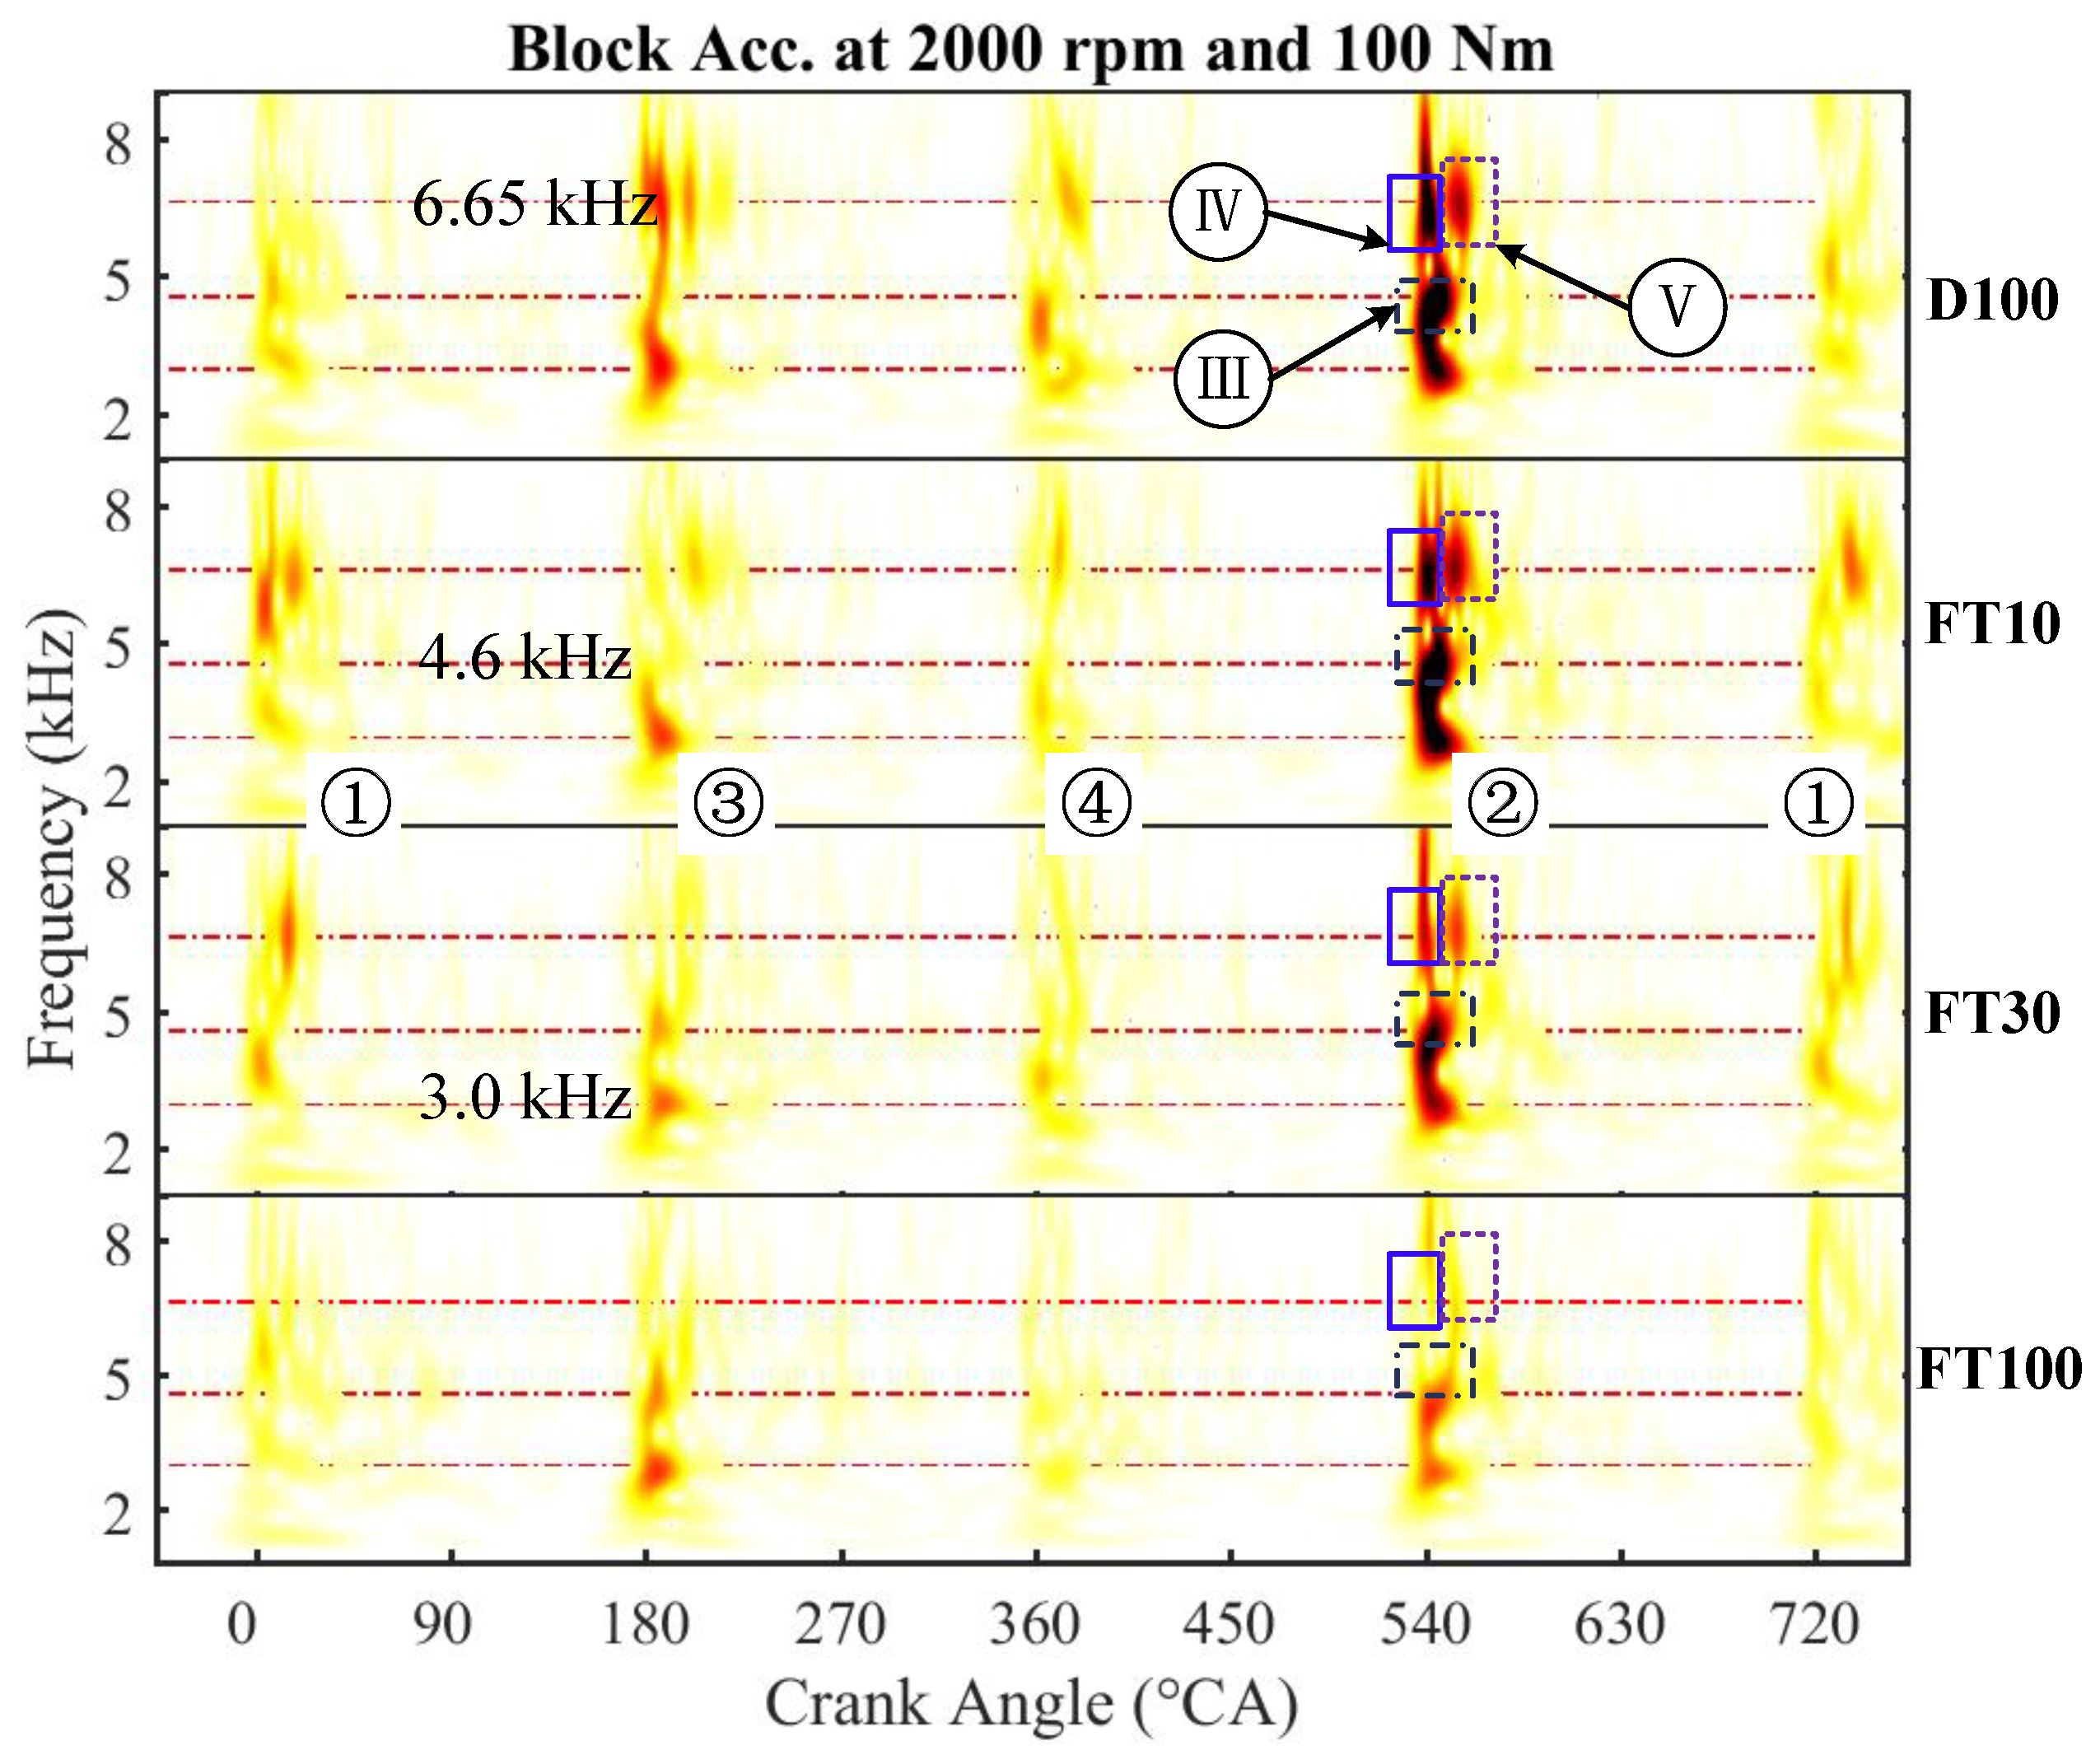
To verify the above speculation, the time-frequency transformation of the vibration signal as shown in
Figure 5b is carried out, and the result is shown in 2D in
Figure 11. The vibration response of the second cylinder near the 540 °CA position is mainly analyzed because, as the engine block vibration accelerometer has a minimum distance from the second cylinder, the vibration response energy at 540 °CA is the largest.
At the frequency of 6.7 kHz, there are two highlighted response energy areas at 180 °CA and 540 °CA for petrodiesel fuel, and the one that is closer to the TDC is caused by the combustion excitation. It is found from the longitudinal comparison of response energy of the two positions for different fuels, that the response areas are weakened rapidly with the increase in CFT proportion. The right-side highlighted response energy area at 6.7 kHz should be the piston side thrust impact response, which weakens with the increase in CFT proportion. However, its attenuation is not as fast as the left-side one caused by the combustion excitation. Therefore, the response area is driven by the piston side thrust impact. The piston side thrust is affected by combustion excitation to some degree, and the block vibration accelerometer is more sensitive to the piston slap events, so that a clear piston side thrust response area could still be seen, while under the same conditions, the response area driven by combustion was relatively weak. In addition, the frequency bands around 3 and 4.6 kHz are combustion excitation responses as the highlighted response area is closer to TDC.
3.3.3. Evaluation of Vibration Signals for Diesel-CFT Fuel Blends
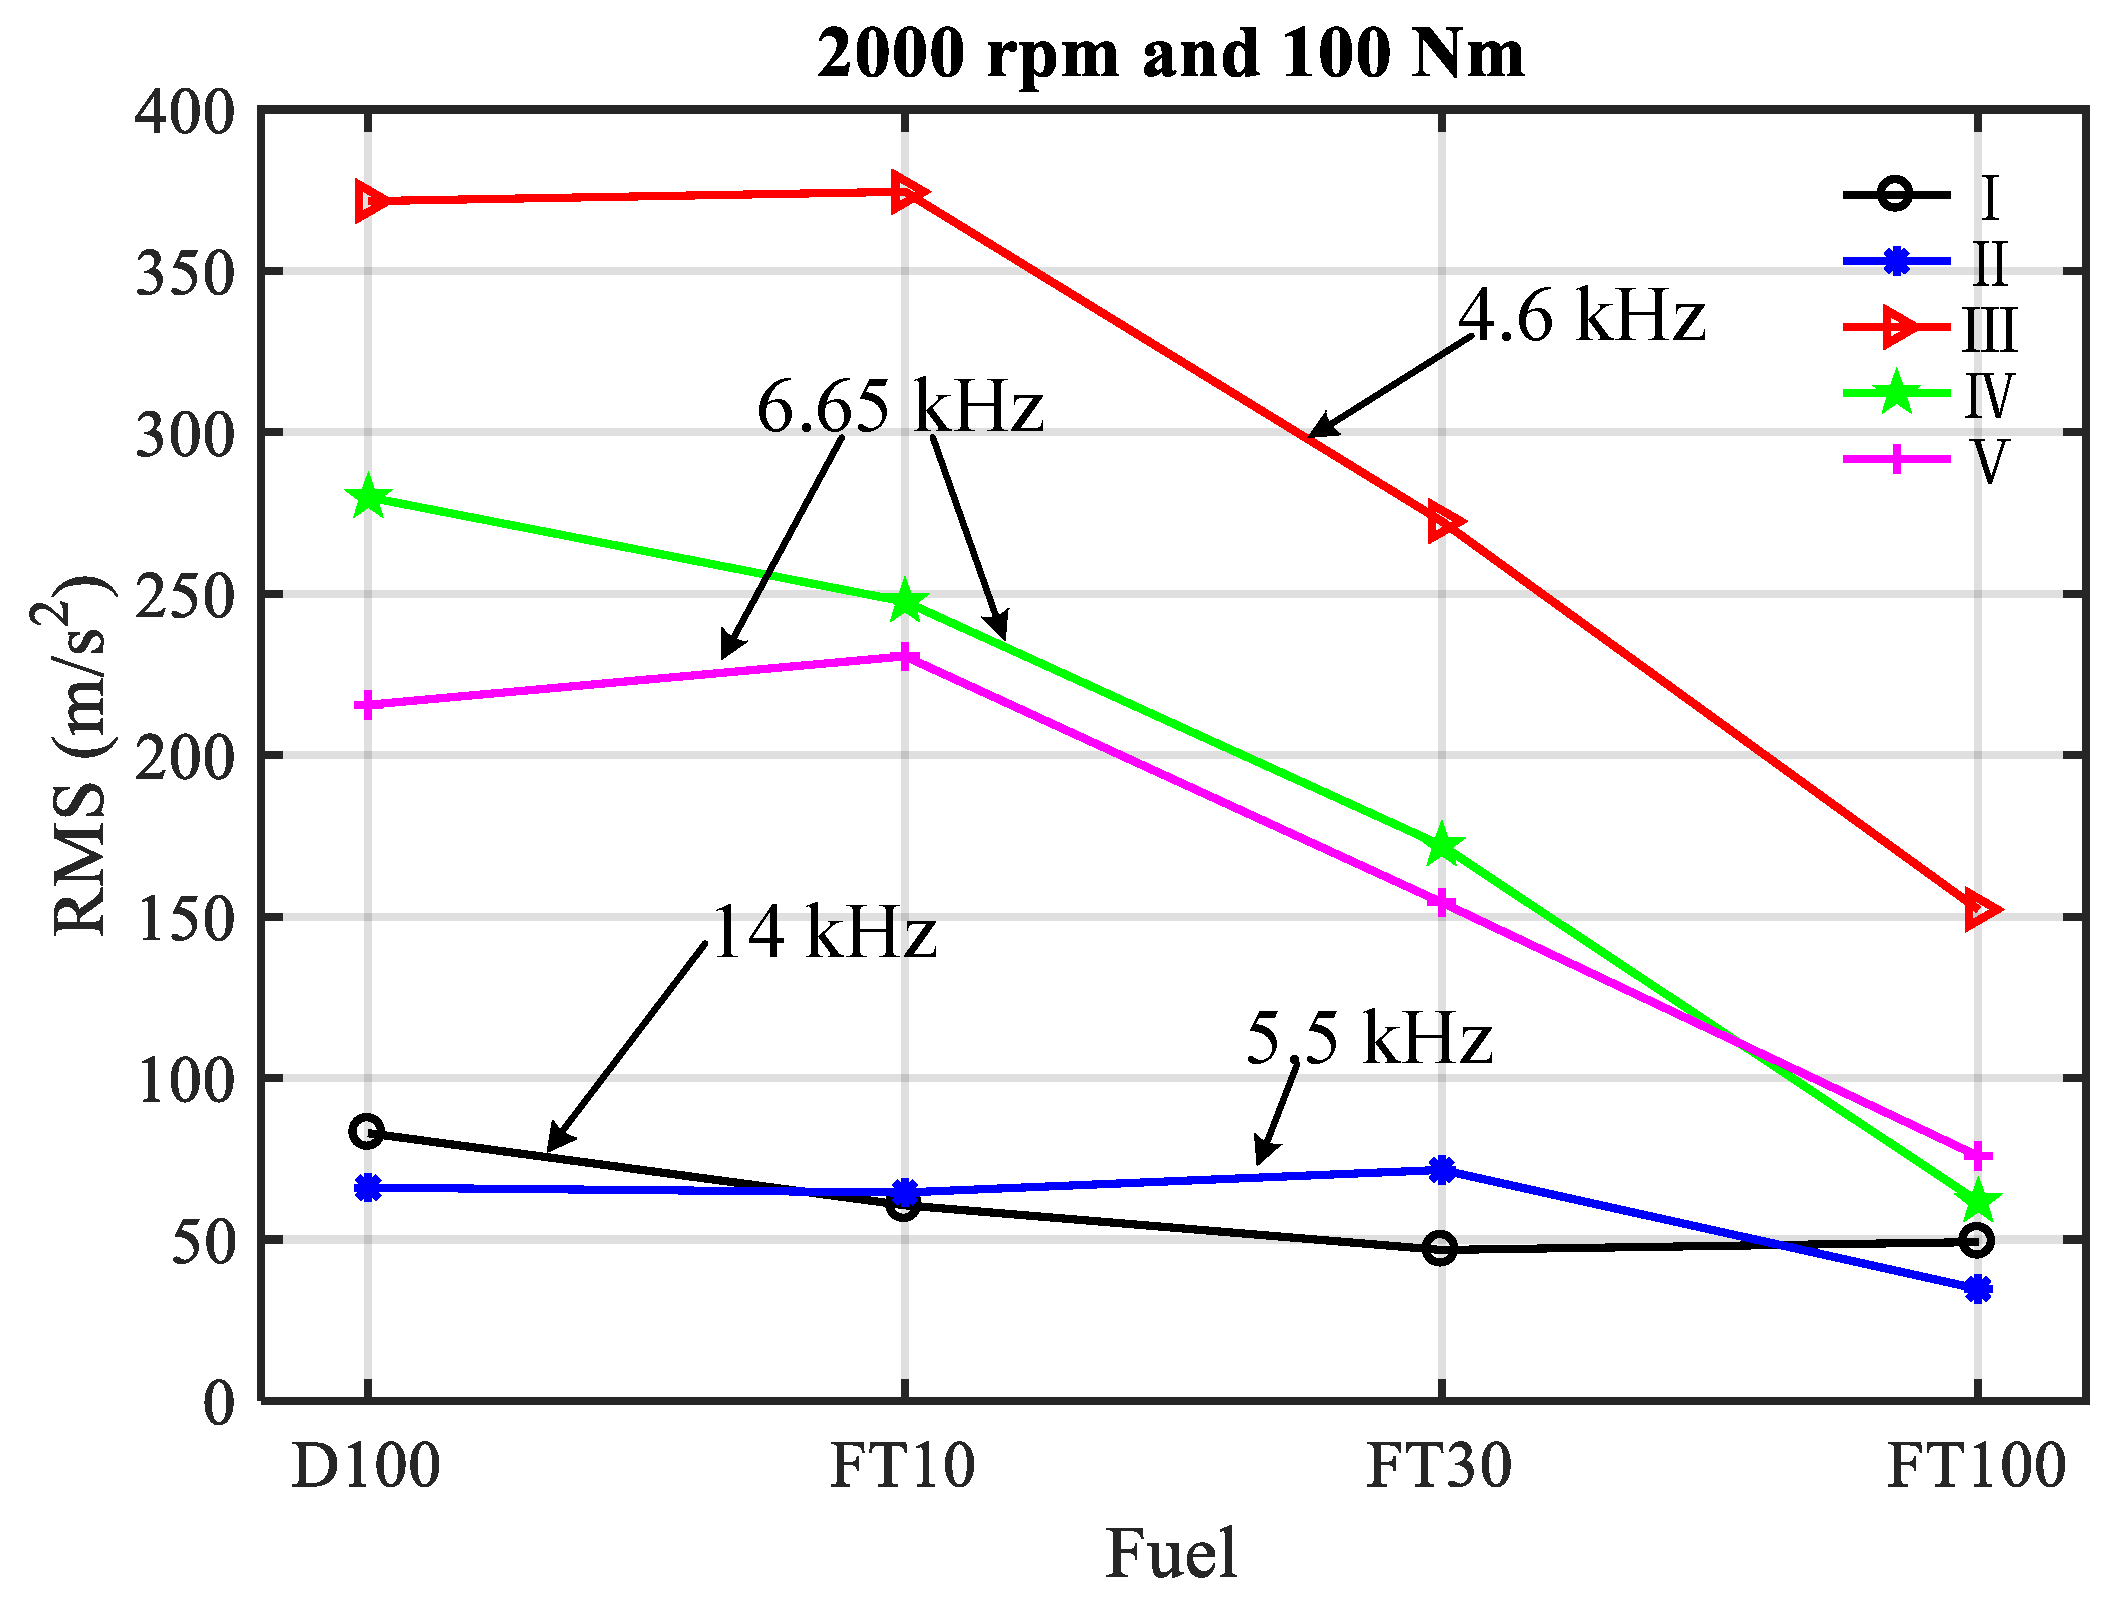
The numbers I, II marked in
Figure 9 and III, IV, V marked in
Figure 10 represent the main vibration events related to combustion. I is caused by the vibration energy of combustion pressure-driven high-frequency oscillation for the engine head. II denotes the main response induced by combustion pressure for the engine head. III and IV represent two main vibration responses excited by the combustion pressure on the engine block. V signifies the response inspired by the piston side thrust force on engine block. The RMS values of the five marked time-frequency areas were calculated in order to ascertain the effects of the blended fuel on the areas, and the results are shown in
Figure 12.
It can be perceived that the response energy of each area attends to decrease with the increase of CFT proportion, overall. But the RMS-I of FT30 is significantly less than the value of II. This means that the vibration response of FT30 is greater around 5.5 kHz, while the vibration response around 14 kHz is smaller. Compared with FT100, the combustion of FT30 is more powerful due to the higher heating value. Moreover, the combustion of FT30 presents only moderate concerns regarding the atomization [
30] because CFT is more volatile relative to D100. So, FT30 generates fewer high-frequency contents. In addition, the RMS of FT10 is maximum for V. It may be that the addition of a small proportion of CFT has less impact on the cylinder pressure. However, it may weaken the attenuation effect on the side thrust of the piston by diluting the oil film due to its low viscosity [
33]. Thus, the accelerometer could receive more excitation energy induced by the piston side thrust force. For other blended fuels, RMS-V values decrease with the increase in CFT proportion such that the effect of cylinder pressure reduction on the side thrust is more significant.
4. Conclusions
In this study, the combustion and vibration characteristics of a CI engine using CFT blended fuels were investigated. The four fuels used are diesel, 10%, 30%, and 70% CFT in petro-diesel, and pure CFT, respectively. A four-cylinder engine was operated at loads of 10, 50, 100, 150, and 200 (except 1200 rpm) Nm loads and speeds of 1200, 1600, 2000, and 2400 rpm.
The peak values of the combustion pressure and PRR decrease with the increase in CFT proportion. The phases of peak value and ignition timing also advance gradually. There are three frequency contents of energy concentration caused by cylinder pressure oscillation at approximately 4–7, 13, and 16 kHz from the SPL pressure spectrum.
Maximum amplitudes of vibration signals of the engine head and block in the time domain reduce with the increase of CFT proportion. RMSs of the signals enlarge with the increase of rotational speed, increasing at first and then decreasing as the load is augmented. RMSs reduce with the increase of CFT proportion under most operation conditions.
The frequency components of head vibration signals are abundant and the responses induced by combustion are quite notable. There are four frequency contents at 5, 6.48, 13.2 and 16 kHz from the spectrogram and CWT diagram. The highlighted areas in the CWT diagram of the larger three frequency contents are weaken with the increase in CFT proportion, and the highlighted area at 5 kHz is basically unchanged. The engine head vibration signal is more sensitive to high-frequency combustion excitation.
The frequency component of block vibration signal is mainly distributed below 8 kHz. There are three frequency contents around 3, 4.6 and 6.65 kHz in spectrogram and CWT diagrams. The left-side highlighted areas of 6.65 kHz and the responses of frequency contents at 3 and 4.6 kHz are related to combustion excitation, and these responses are weakened rapidly with the increase in CFT proportion. The right-side highlighted area of 6.65 kHz is impacted by the piston side thrust. These responses are also weakened with increasing in the CFT proportion, except for FT10.
In brief, CFT has the ability to reduce CI engine vibration. The results and conclusion of this study can pave the way for the optimal design and development of fuel blends based on vibration analysis.


