Article

Temperature and Velocity Effects on Mass and Momentum Transport in Spacer-Filled Channels for Reverse Electrodialysis: A Numerical Study

by
Zohreh Jalili
1,2,*,
Jon G. Pharoah
3,
Odne Stokke Burheim
1 and
Kristian Etienne Einarsrud
2
1
Department of Energy and Process Engineering, Norwegian University of Science and Technology (NTNU), 7491 Trondheim, Norway
2
Department of Materials Science and Engineering, Norwegian University of Science and Technology (NTNU), 7491 Trondheim, Norway
3
Department of Mechanical and Materials Engineering, Queen’s University, Kingston, ON K7L 3N6, Canada
*
Author to whom correspondence should be addressed.
Energies 2018, 11(8), 2028; https://doi.org/10.3390/en11082028
Submission received: 2 July 2018 / Revised: 27 July 2018 / Accepted: 2 August 2018 / Published: 4 August 2018

Abstract

:
Concentration polarization is one of the main challenges of membrane-based processes such as power generation by reverse electrodialysis. Spacers in the compartments can enhance mass transfer by reducing concentration polarization. Active spacers increase the available membrane surface area, thus avoiding the shadow effect introduced by inactive spacers. Optimizing the spacer-filled channels is crucial for improving mass transfer while maintaining reasonable pressure losses. The main objective of this work was to develop a numerical model based upon the Navier–Stokes and Nernst–Planck equations in OpenFOAM, for detailed investigation of mass transfer efficiency and pressure drop. The model is utilized in different spacer-filled geometries for varying Reynolds numbers, spacer conductivity and fluid temperature. Triangular corrugations are found to be the optimum geometry, particularly at low flow velocities. Cylindrical corrugations are better at high flow velocities due to lower pressure drop. Enhanced mass transfer and lower pressure drop by elevating temperature is demonstrated.

1. Introduction

Salinity gradient energy, also known as blue energy, is a sustainable and renewable source of energy. The energy is obtained by mixing two aqueous solutions with different salinities, and applying membrane-based technologies [1,2,3,4,5]. The energy generated can be significant, depending on the relative salt concentrations of the streams [1]. The energy of river water mixing with the sea water is approximately equal to 2 kJ per liter river water, which is equivalent to the energy of a waterfall with the height of 200 m [6,7]. Several researchers studied membrane-based technologies such as pressure retarded osmosis (PRO), reverse electrodialysis (RED) and capacitive mixing (CapMix) to control and harness this energy [4,5,6,8,9,10,11]. Among the mentioned methods, RED is more robust due to earlier return on invested capital (ROIC), better tunability, easier maintenance, longer life time, less sensitivity to bio-fouling and smaller physical footprint [1]. Reverse electrodialysis relies on selective-permeable membranes known as ion exchange membranes [1,5,12]. Kingsbury et al. [12] and Li et al. [13] reported that energy can be stored and generated through electrodialysis (ED) and reverse electrodialysis (RED) as an opposite process of ED. Therefore, a concentration battery, which is highly scalable in both small scale and large scale [
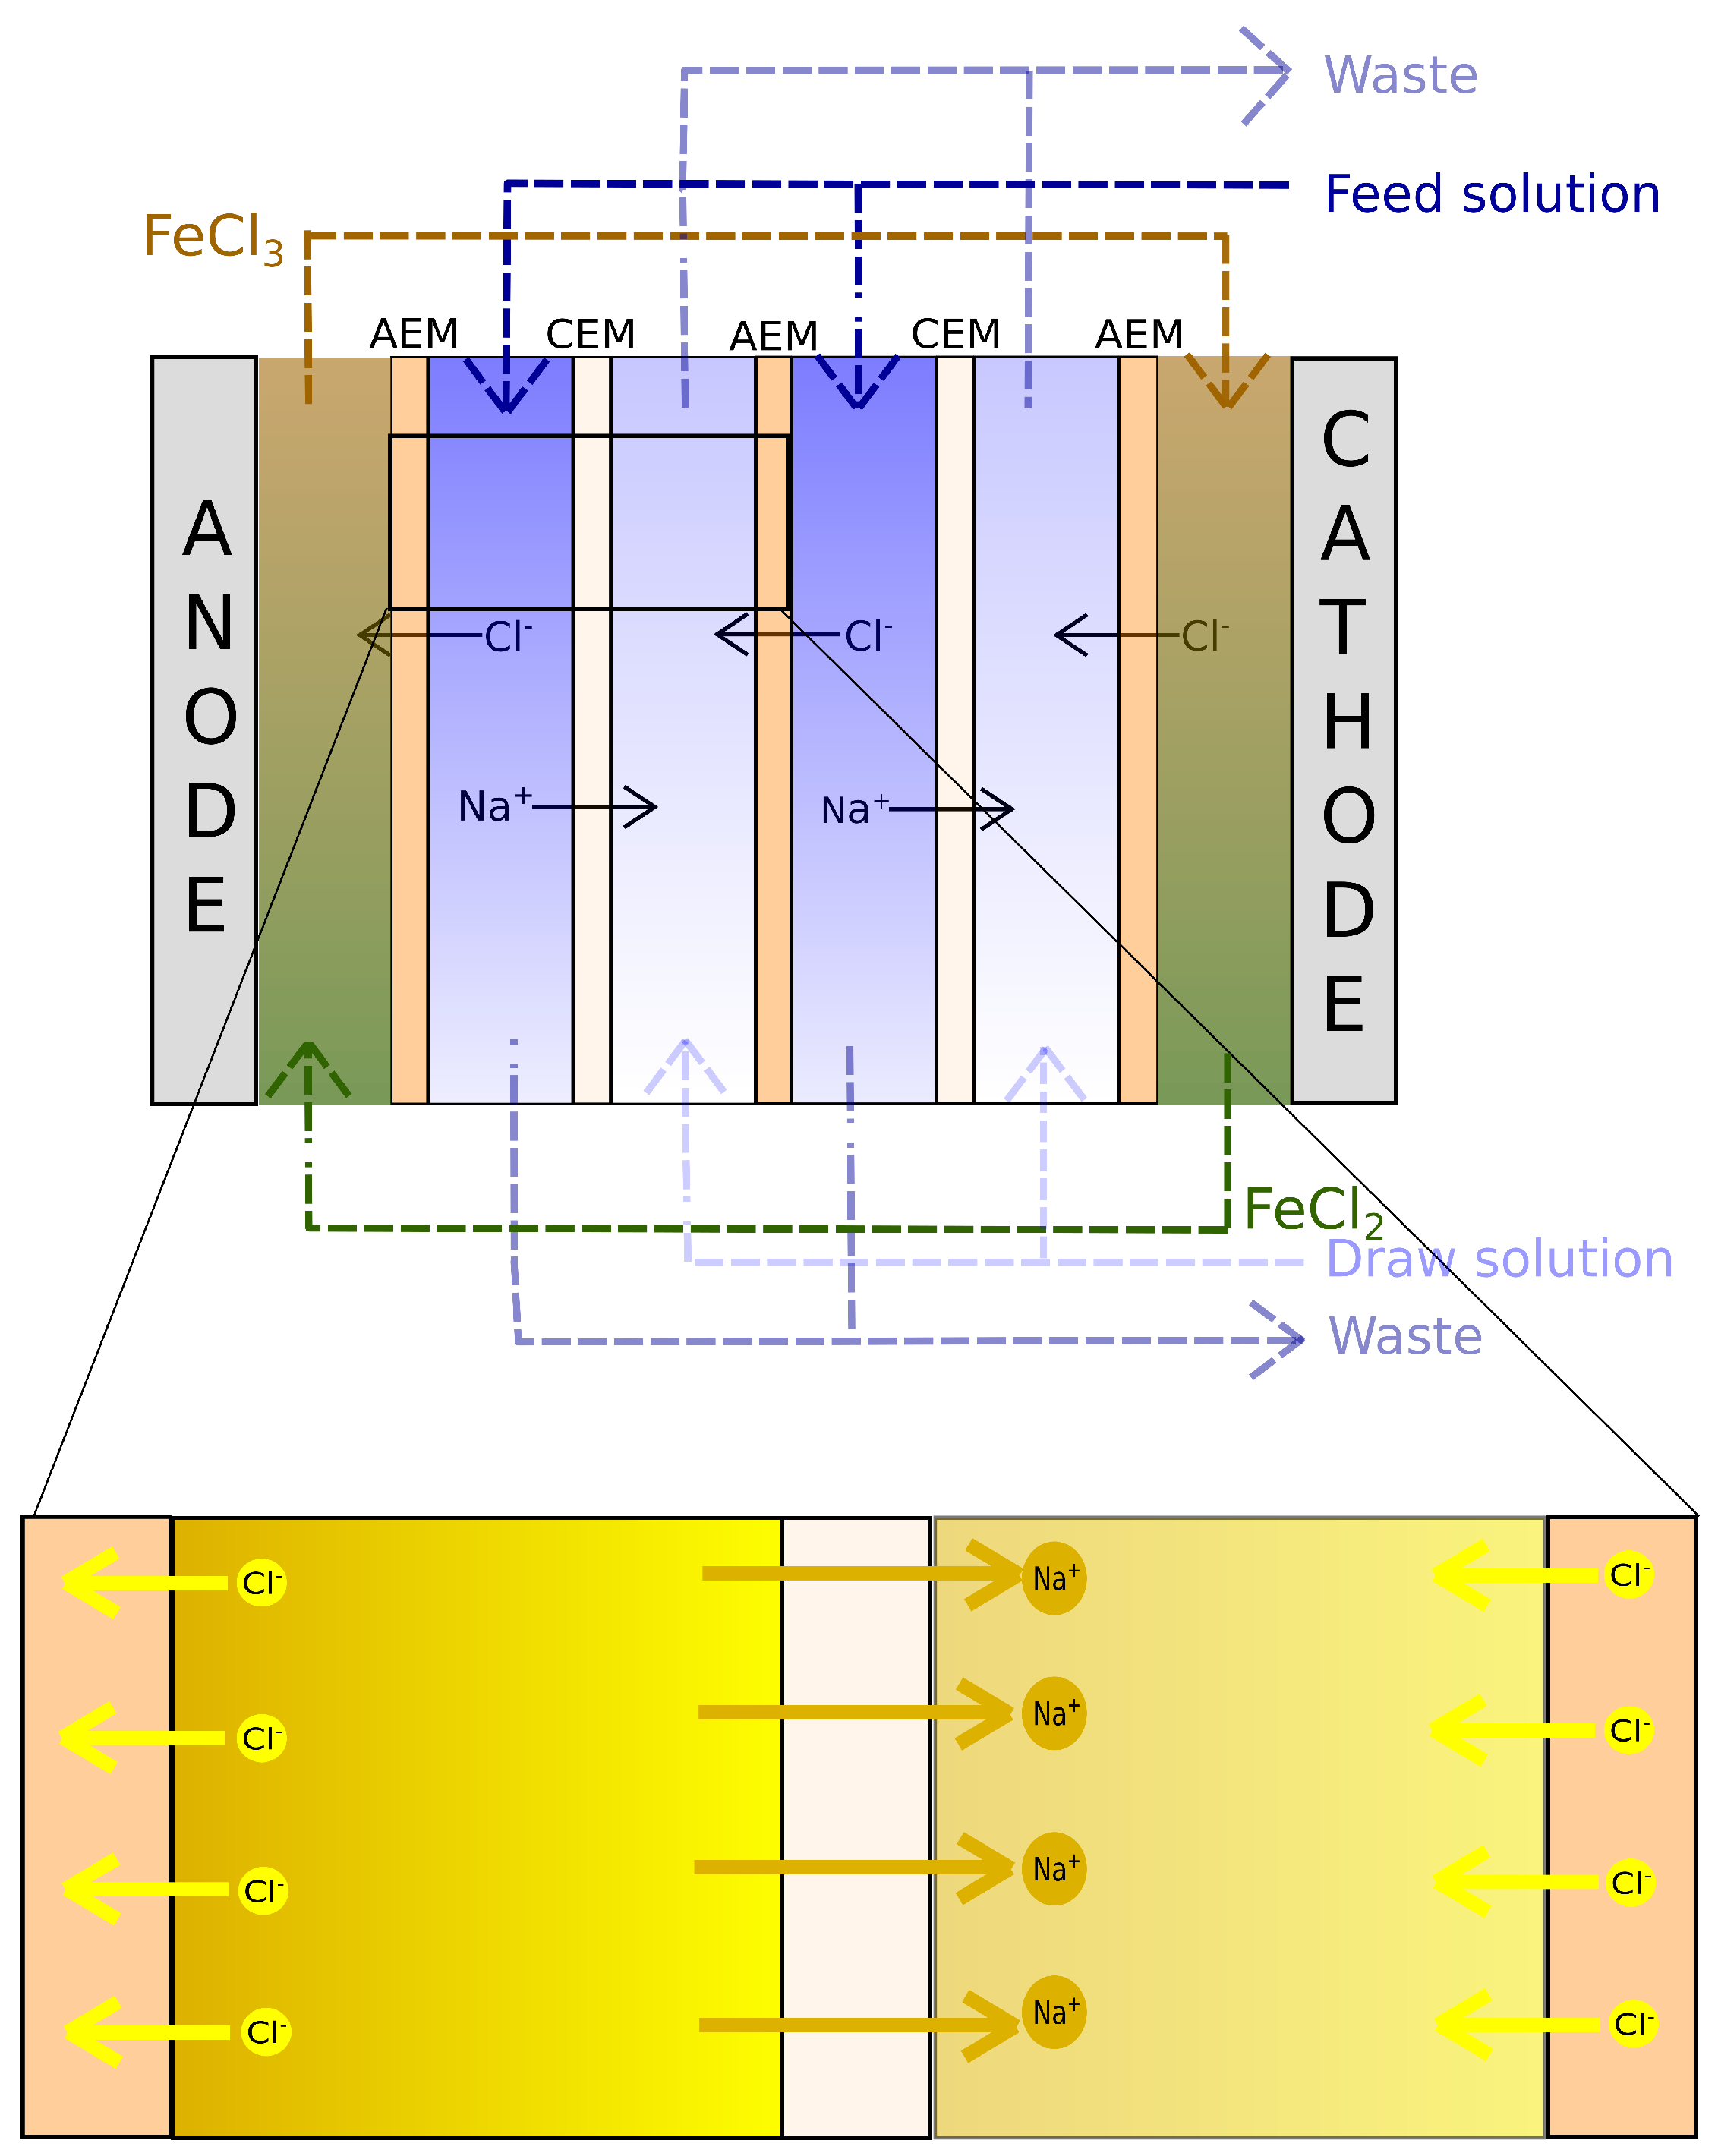
13], can be established by combining the two processes. A schematic of a RED stack is shown in Figure 1. Concentrated and dilute solutions are fed through series of channels separated by ion-selective membranes. An ionic current is produced due to the chemical potential difference between the concentrated and dilute solutions, resulting in anion migration through the anion exchange membrane (AEM) towards the anode, and cation migration through the cation exchange membrane (CEM) towards the cathode. In the compartments containing electrodes, a redox reaction occurs, converting the ionic current into an electric, allowing for the energy to be harvested [14,15,16,17]. In the electrode compartments, the rinse solutions are recirculated continuously to provide the medium for the redox reactions.
The net power density represents the energy generation performance of a RED system as defined by Equation (1) [19]:
W R E D N e t = E O C P I R E D R s t a c k I R E D 2 N m W p u m p
The net power density depends on the stack resistance, pressure loss in the channels due to the flowing solutions and the potential difference between the two solutions, described by Equation (2) [3,12]:
E O C P = N m β ¯ R T F ln C c C d .
where W p u m p represents the pump power density, E O C P is the open circuit potential, I R E D is the current density, N m is the number of membranes and R s t a c k is the stack resistance. C c and C d are concentrations of the concentrated and dilute solutions, respectively. F is Faraday’s constant, T is temperature, R is the universal gas constant and β ¯ is the average perm-selectivity, which expresses the membranes ability to transport a specific type of ion [20]. The stack resistance is equal to the load resistance when the power density is maximum and can be calculated by Equation (3) [19,21]:
R s t a c k = N m R A E M 1 σ + R C E M 1 σ + h c ϵ 2 · k c + h d ϵ 2 · k d + R electrode ,
where R A E M and R C E M are the resistances of the AEM and CEM, respectively. σ is the mask fraction or shadow factor of the spacer [12] and ϵ is the spacer porosity. h d and h c are the channel heights of dilute and concentrated solutions compartments, respectively, and k c and k d are the corresponding conductivities of the concentrated and dilute solutions.
Ramon et al. [5] and Post et al. [1] documented that the RED power density can be maximized by increasing the difference in salinity between the streams, while at the same time reducing the stack resistivity. Tedesco et al. [22] suggested that this is realized by a reduction of the channel height, as shown in Equation (3). The reduction in channel height is however limited by the size of the spacers, which keep the CEM and AEM separated.
Spacers are typically composed of non-conductive polymeric filaments which reduce the available membrane area by hindering of ionic transport from the membrane to the solution. This is called the spacer shadow effect and increases the Ohmic resistance [23,24,25,26,27]. These types of spacers will be named as inactive spacers in this article. Dlugolecki et al. [24] reported that applying commercial available conductive spacer can increase the power density of RED around 30–40% compared to a system adopting inactive spacers.
Recent developments in membrane design provides an opportunity to omit inactive spacers by utilizing profiled (corrugated) membranes, also termed as membranes with integrated spacers. In this paper, the profiled (corrugated) membranes are named as active spacers for simplicity. Active spacers have number of advantages compared to inactive spacers. Active spacers increase the available membrane area for ionic transport by eliminating the inactive spacer shadow effect, thus enhancing the net power output [24]. Moreover, simpler membrane module manufacture can be realized as the spacer already is present on the membrane surface [28]. Larchet et al. [29] investigated experimentally the performance of stacks with both active and inactive spacers for a wide range of concentrations and compared the results to a flat channel. They documented that active spacers may enhance mass transfer rate up to four times than that for a flat channel [29]. 
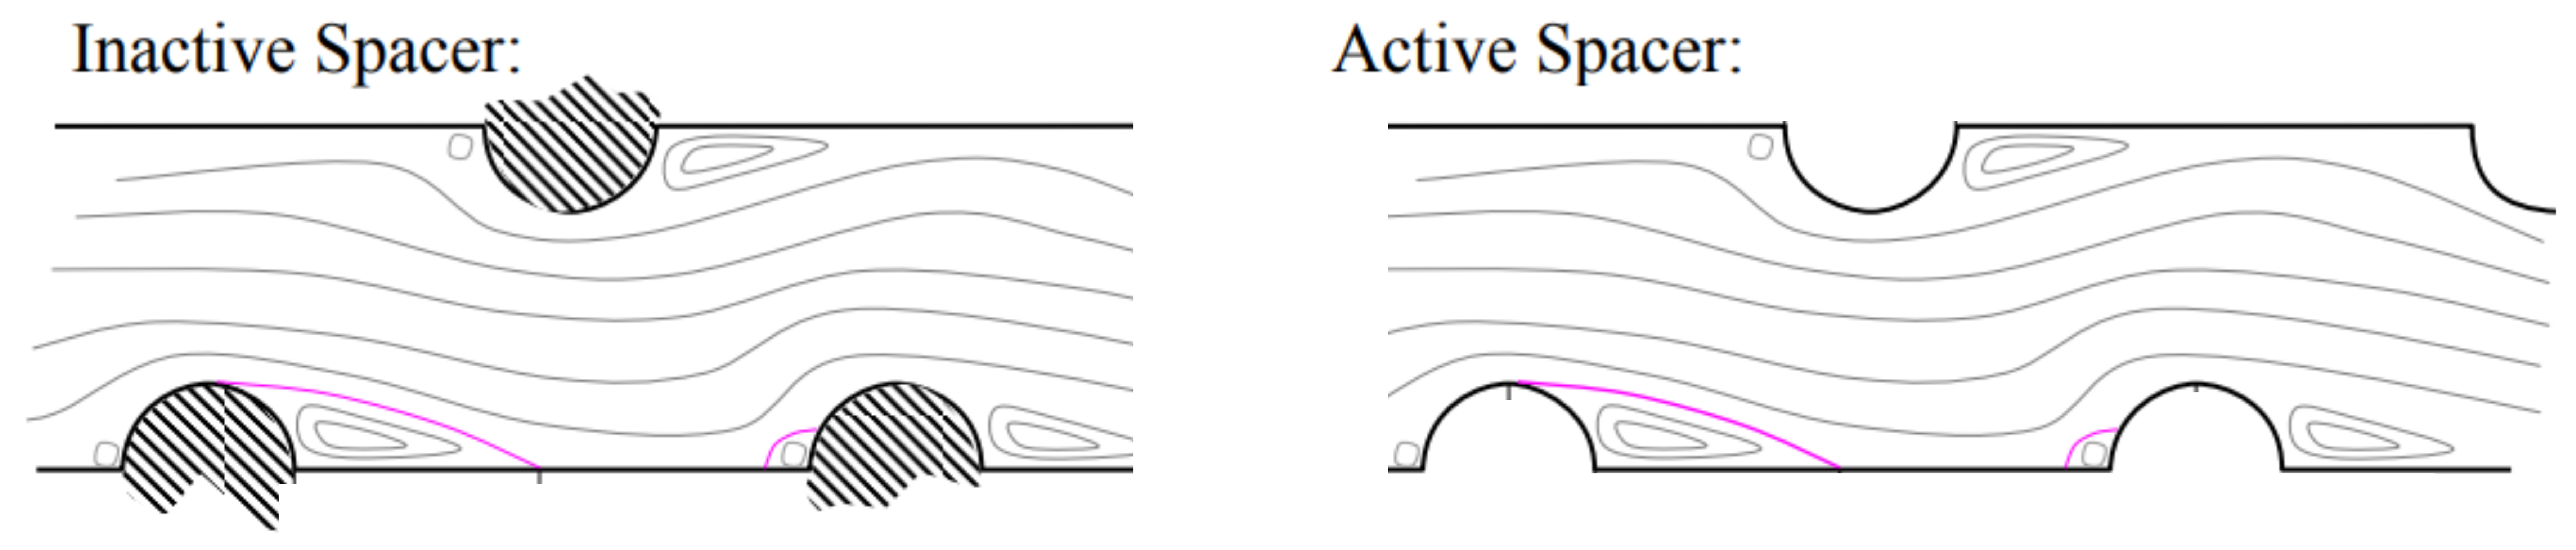
Figure 2 illustrates the active and inactive spacer-filled channels.
Another phenomenon which reduces the power density is known as concentration polarization, discussed by several researchers [24,26,30,31,32,33]. Considering this phenomenon, the generated power density becomes lower than the theoretical value, since the concentration gradient at the solution-membrane interface is smaller than the bulk concentration difference between two streams [26,30,34]. In other words, concentration polarization diminishes the available theoretical power density by creating a thin diffusion boundary layer along ion exchange membranes, thus reducing the performance. Pawlowski et al. [23] and Vermaas et al. [35] reported that the concentration polarization can be reduced, thus increasing the power density, by enhanced mass transfer. Enhanced mass transfer could be possible by increasing the flow velocity (i.e., the Re number) [22,36], using eddy promoters such as spacers [37] and increasing the active area of the membranes [24]. Increasing the flow velocity and introducing the eddy promoters (corrugations) can mitigate the concentration polarization by disturbing the diffusive boundary layer. In fact, both active and inactive spacers create eddies and wakes downstream of corrugations, thus increasing the mixing [36,38].
Pressure loss is inevitable during fluid flow and depends on several factors such as channel height, spacer geometry and size, Reynolds number and fluid viscosity. The pressure drop is related to the pumping power density required for transport of the solutions through their compartments. Higher pressure drops lead to higher pumping power densities, consequently lowering the net power density [36,39,40]. Accordingly, parameters such as channel height, available membrane area, mass transfer coefficients as well as corrugations have to be optimized to keep the pressure loss as low as possible with reasonably high mass transfer.
The solution temperature affects mass and momentum transport due to its influence on fluid viscosity and diffusivities. Benneker et al. [41] investigated the utilization of waste heat for increased power density in RED systems, reporting an increase of over 25% for RED power densities when the temperature was increased from 20 C to 40 C. Another important observation in their work was related to the ion selective transport at elevated temperatures, which remained unchanged over the range considered. In the study by Luo et al. [42], utilization of waste heat was proposed in combination with ammonium bicarbonate in RED, documenting that the concentration of the dilute solution and flow rate of feed solutions have to be optimized to achieve maximum power output of RED stack.
Systematic experimental screening to determine appropriate corrugation geometry and flow velocity for designing RED cell requires considerable man-hours work and cost. Robust and sophisticated computational fluid dynamics (CFD) models with appropriate local mesh refinement is a good alternative and has been adopted as a design strategy by several researchers.
Leitz and Marinčić [43] reported a study on different corrugation geometries (or flow promoters) and addressed empirically relating the Sherwood number for each geometry as a function of the Reynolds number, testing different spacer shapes and comparing to the performance of open channel. Schwinge et al. [32,44] used computational fluid dynamics (CFD) to investigate the effect of different spacer geometries on the fluid flow (momentum transfer) for different Reynolds numbers, highlighting the role of CFD modeling in membrane design. The spacer filament is found to increase the re-circulation zone, which in turn increases the local mass-transfer rate. The size and shape of established wakes depend on the type, geometry and configuration of spacer as well as Reynolds number [32].
Ahmad et al. [45] utilized ANSYS Fluent® to investigate concentration polarization in a flat channel under different flow velocities and transmembrane pressures, verifying their results with literature data. Increasing Re numbers and reducing transmembrane pressures would result in reduced concentration polarization and thus increased mass transport [45]. Gurreri et al. [30] reported that varying flow rates with velocity components perpendicular to the membranes with integrated spacers significantly affects on the mass transfer, concentration polarization and pressure drop. Pawlowski et al. [46] performed simulation studies to estimate the net power density of RED stacks with different channel arrangements by introducing profiled membranes with corrugations perpendicular to the flow under laminar conditions. Reducing the channel height, increasing the flow velocity and introducing eddy promoters all result in higher pressure loss due to more significant hydraulic friction through the channel [22,23]. Li and Tung [47] performed CFD simulations of fluid flow through a spacer-filled channel, applying suitable cell types for periodic boundary conditions. They compared the simulated pressure drop with the experimental data and reported that it depends on geometry, angle and diameter of spacer filament as well as height, width, length and channel void fraction.
CFD modeling was also successfully utilized to estimate mass transfer, pressure drop and design the profiled membrane in the studies done by Pawlowski et al. [3,40], suggesting a membrane with a chevron structure to reduce the concentration polarization. They reported that this type of membrane assures effective mass transfer at relatively low pressure loss. Ranade et al. [
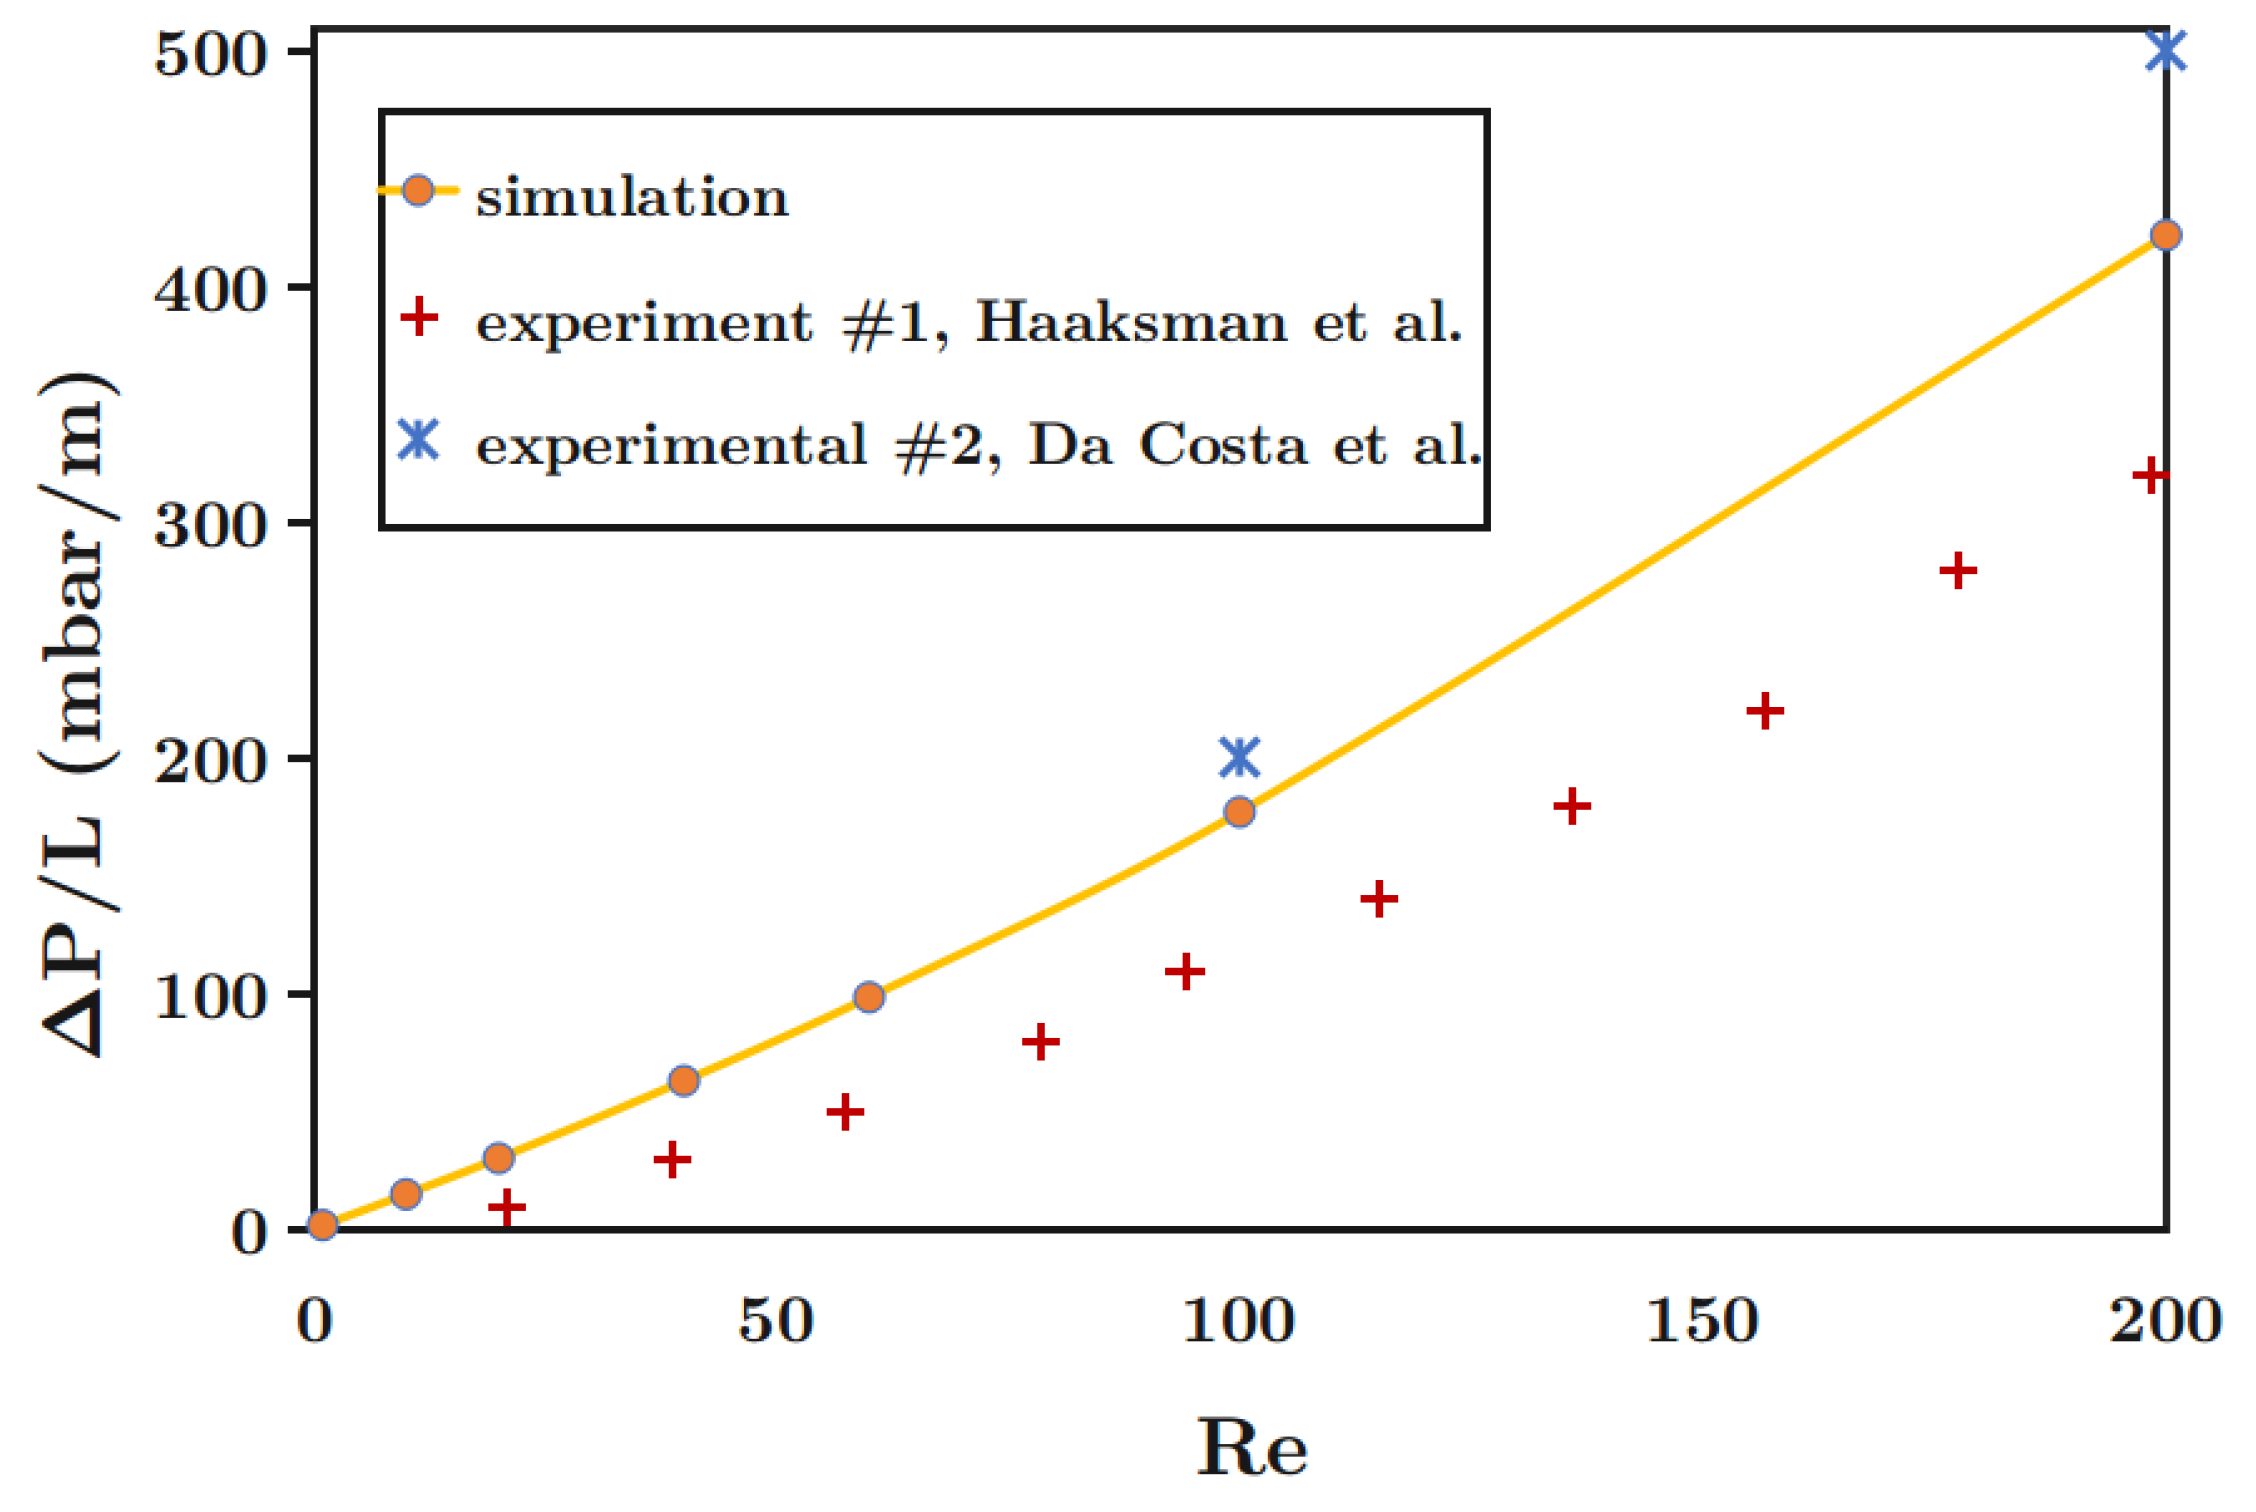
48] performed a three-dimensional simulation to predict pressure drop and flow behavior in membrane modules containing rectangular and curved spacers based on unit cell approach. They validated their results with the experimental data reported by Da Costa et al. [49], reporting flow visualization and pressure drop measurements. CFD simulations performed by Li et al. [50] revealed that mass transfer increases for spacer-filled channels compared to that for an empty channel, due to established transversal and longitudinal vortices. Haaksman et al. [51] developed a pre-processing method to obtain three-dimensional geometry of a given spacer configuration measured by X-ray Computed Tomography (CT) for CFD simulations.
Coupled Navier–Stokes and Nernst–Planck simulations were presented for an ED cell by Tadimeti et al. [52] using COMSOL Multiphysics® [53], performing a sensitivity analysis on channel geometry for desalination with respect to the corrugation shape, density and size. Coupled simulations for RED were performed by Jalili et al. [54] using OpenFOAM [55] to investigate the influence of flow velocity on the resistivity and electrical potential across flow compartments, reporting that the electrical potential obtained in RED unit cell is enhanced by decreasing the Re number and introducing flow promoters in a dilute solution channel.
Evidently, several studies have been performed to investigate the effects of flow velocities and different spacer geometries to find a trade-off between the pressure loss and mass transfer in a channel. However, to the best of our knowledge, there is limited scientific literature that compares the role of active and inactive spacers, as well as the influence of temperature on pressure drop and mass transfer. In this study, CFD modeling was performed to study the momentum and mass transfer in a dilute channel of a RED system with varying topology, velocity and solution temperature, aiming to demonstrate possible improvements for the technology, utilizing the active membranes and waste heat.

2. System Description

The RED stack consists of alternating anion and cation exchange membranes, as mentioned in the Section 1. Dilute and concentrated solutions are pumped through the compartments (channels). Jalili et al. [54] reported that corrugations in the concentrated solution channel has an adverse impact on the system performance, while employing corrugated spacers is profitable in dilute concentration channels. Accordingly, in the current work, only a single dilute solution channel was considered. Four different geometries were considered, namely a flat channel (without corrugations) and three channels with different corrugations: cylindrical, triangular and square. Details regarding the geometries of the different channels, governing equations for CFD modeling and boundary conditions are discussed in the following three subsections.

2.1. Geometries

Figure 3 shows a schematic of a channel with characteristic dimensions. The channel includes a small inactive upstream section with the length of L i n l e t in the beginning to remove any entrance effect on flow and allow the flow to become fully developed before entering the active membrane section with the length of L M . An inactive downstream section with the length of L o u t l e t in the end of the channel is introduced to ensure that the created wakes in the downstream of the last corrugation at high Re numbers is far enough from the outlet boundary to prevent any instability due to back flow at the outlet. The height of the channel is denoted h.
Figure 4 shows the different elements used to create the various corrugated channels. The corresponding values of the parameters for each geometry is given in Table 1. The total length and height of all channels are 7.2 mm and 0.2 mm, respectively. The height of the corrugations is set to 0.05 mm for all the geometries, meaning the characteristic length to create three types of corrugations is equal. The origin is located on the left-bottom corner of the channels (i.e., the bottom corner of the inlet).

2.2. Governing Equations

The flow in the channel is assumed to be two-dimensional ( u ( x , y ) ), steady and laminar and physical properties such as density and viscosity are assumed to be constant for a given simulation. The flow is governed by the continuity equation,
· u = 0 ,
and the incompressible Navier–Stokes equations:
ρ u · u = p + μ 2 u .
The solution is assumed to be governed by dilute solution theory with activity coefficients of order unity and the solution is thus fully described by its concentration.
The transport of ions is governed by the Nernst–Planck equation (see, e.g., Chapter 11 in [56]), under the current assumptions given as:
C i t = · D i C i u C i + C i μ E P ϕ ,
for species i where C i is the concentration ([mol/m 3 ]), D i is the diffusivity ([m 2 /s]), u is the fluid velocity ([m/s]),
μ E P i = D i z i F R T
is the electrophoretic mobility ([m 2 /Vs]) where z i is the valency, F = 96,485.3 C/mol is Faradays constant, R = 8.314 J/K·mol is the universal gas constant and T is temperature in Kelvin, ϕ is the electrostatic potential ([V]).
Assuming two ionic species, denoted + and −, we thus have two transport equations:
( u · ) C + = · ( D + C + ) + · ( C + D + z + F R T ϕ )
and
( u · ) C = · ( D C ) + · ( C D z F R T ϕ ) .
Introducing the non-dimensional potential:
ϕ ˜ = F ϕ R T ,
assuming charge neutrality ( C + = C = C ) and monovalent ions ( z + = 1 , z = 1 ), Equations (8) and (9) simplify to
( u · ) C = · ( D + C ) + · ( C D + ϕ ˜ )
and
( u · ) C = · ( D C ) · ( C D ϕ ˜ ) .
Multiplication of Equation (11) with D , Equation (12) with D + and adding them together, assuming constant diffusivities, yields
D · ( u · ) C + D + · ( u · ) C = 2 · D + · D · 2 C
( u · ) C = 2 · D + · D D + + D 2 C D 2 C ,
where D is an effective diffusivity for the salt. Evidently, the governing equation for the concentration is decoupled from the electrical potential under the given conditions, thus simplifying the system of equations to be solved.
Owing to the assumptions of constant physical parameters (e.g., density and viscosity), the flow equations are decoupled from those governing the concentration, allowing for the former to be solved independently of the latter.

2.3. Boundary Conditions

The inlet of the domain (far left of the Figure 5) is specified with uniform velocity and concentration as well as a zero gradient condition for pressure. The velocity at the inlet depends upon the sought Reynolds number. The concentration of dilute stream is fixed at 16 mol / m 3 while the concentration of concentrated stream is 484 mol / m 3 , which is comparable to the average concentration of seawater. It is also assumed that the solutions only contain monovalent ions of Na + and Cl . The outlet (far right of Figure 5) is specified with a zero gradient for velocity and concentration and a uniform value of 1 atm for pressure. The membranes and spacers are no-slip walls with zero gradient in pressure.
The concentration on the membrane surface is assumed to be constant and equal to 250 mol / m 3 , corresponding to the average bulk concentration of dilute and concentrated streams assumed in this study. As demonstrated in Section 4.4, this choice of boundary condition is equivalent to the more commonly adopted fixed flux condition. The concentration flux is assumed to be zero on up- and downstream sections (on the top and bottom walls) of the active surfaces. The spacers are assumed to be either active, with boundary condition corresponding to the membrane, or inactive, with a corresponding zero flux boundary condition, depending upon the specific case considered.

3. Methodology

All simulations were performed using OpenFOAM version 4.1 [55]. OpenFOAM is an open source CFD platform with extensive range of applications for solving the complex fluid flows involving chemical reactions, heat transfer, to solid mechanics and electromagnetics based on finite volume method. The simulation studies were performed on a small cluster running CentOS 7.4 with 4 Xeon E5-2650 CPUs running at 2.2 GHz equipped with 128 Gb RAM. The computational time of simulations varied depending on the mesh density, geometry and Reynolds numbers. Geometries construction and grid refinement were carried out by the blockMesh utility for a single corrugation, while the whole channel was constructed using tranformPoints, rotateMesh, mergeMeshes and stitchMesh utilities. Tamburini et al. performed a sensitivity analysis to study the influence of grid size and topology for different channels (empty and commercialized spacer-filled channels) in RED. They reported that utilizing the hexahedral grids provides more reliable results with less computational time compared to the results by using tetrahedral grids [57]. In this study, hexahedral elements were utilized to discretize the computational domain for all configurations.
Navier–Stokes, continuity, and Nernst–Planck equations were solved at steady-state condition using an in-house newly developed solver in OpenFOAM, based on the PIMPLE (merged PISO-SIMPLE) algorithm. Transport equations are discretized using Gaussian and linear upwind schemes for gradient and divergence terms, respectively, while the Gauss scheme with linear interpolation was used for Laplacian terms. The Generalized geometric-algebraic multi-grid (GAMG) solver was used for all fields with relative and absolute tolerances equal to 10 5 and 10 6 , respectively. Details regarding the schemes and solvers present in OpenFOAM can be found in OpenFOAM documentation [55].

4. Results and Discussion

This section is divided into five parts. First, we address verification of our solver by comparing numerical results with an analytical model for a flat channel. Secondl a grid independence study was performed to select appropriate resolution. Third, the typical flow behavior is described by reviewing different case studies, analyzing pressure loss and mass transfer enhancement for each case. A comparison to measured pressure losses are also given in this section. Fourth, the effect of temperature on mass transfer and pressure loss is discussed. Finally, a brief discussion on the influence of chosen boundary conditions is given.

4.1. Verification

The objective of this section is to verify the velocity and pressure drop as Δ P = P inlet P outlet obtained from simulations with Poiseuille flow for an incompressible fluid, steady-state and laminar flow through a flat channel [58]. Figure 6 shows the comparison of velocity profile and pressure drop as a function of channel height and Reynolds number, respectively, showing excellent agreement.

4.2. Grid Independence Study

The objective of this section is to investigate the possible effect of the number of cells on pressure, velocity and concentration profiles for an active cylindrical spacer-filled channel, at the highest studied Re number (i.e., Re = 200). The Reynolds number defined by Equation (15) is used in this study.
R e = ρ u h μ ,
where ρ is the density of the solution, u is the inlet velocity and h is the height of the channel. The boundary layer thickness for the maximum studied Reynolds number is smaller than the boundary layer thickness for other lower Reynolds numbers and gives the possibility to find the optimum finest cell size which will be required to capture transport phenomena for all range of studied Reynolds numbers. Figure 7 shows the structure of the mesh around the cylindrical corrugation and the blocks configuration in a single cylindrical corrugation.
To find the optimum number of cells, grid refinement was done for eight scenarios, as summarized in Table 2, and the results were compared. In this table, Δ A m i n is an area of the smallest cell and Δ y m i n is the height of cells adjacent to the wall of corrugation, for each scenario.
Figure 8 shows the concentration and velocity profiles along the height of the channel at a specific distance from the origin. This figure demonstrates that velocity profile is negligibly changing as the number of cells increases, whereas concentration profile is more sensible, as expected.
The error due to grid refinement for mass transfer and pressure loss can be expressed as the following:
E r r o r Δ C = Δ C i Δ C i 1 Δ C i 1 ,
E r r o r Δ P = Δ P i Δ P i 1 Δ P i 1 ,
where mass transfer is defined as Δ C = C outlet C inlet based on the mass average on the inlet and outlet surfaces. Δ C i 1 and Δ C i are concentration differences between the inlet and outlet of the channels at successive stages of grid refinement. Similar to concentration, Δ P i 1 and Δ P i are pressure losses between the inlet and outlet of the channels at successive stages of grid refinement. As grid becomes finer (i.e., i is increasing), the error decreases. The numerical simulation errors for concentration difference and pressure loss are shown in Figure 9 as a function of the number of cells.
The figure illustrates that the error for the concentration difference is reduced as the number of cells increases, while the change in the pressure loss is insignificant. All further simulations were performed corresponding to scenario f 7 , when the simulation results are converging with the numerical error in mass flux of less than 0.3% . Further grid refinement will impose computational limitations with the numerical error of mass flux equal to 0.12%. It is important to highlight that local mesh refinement was implemented in this study for all studied geometries. This means that, near the walls of the channel and corrugations, where mass and momentum are changing significantly, the cells are finer compared to the center of the channel, as shown in Figure 7b.

4.3. Case Studies

Different case studies were done to study transport phenomena in spacer-filled channels, as shown in Figure 4. A parametric study was carried out for each geometry both for active and inactive spacers at different Reynolds numbers, increasing from 1 to 200 by varying velocity with material properties corresponding to a constant temperature of T = 20 C. The influence of temperature on mass and momentum transfer in flat channel and triangular active spacer-filled channel is investigated by varying Reynolds number from 40 to 60 and 100 due to increasing the temperature from T = 20 C to T = 40 C and T = 67 C, respectively, and changing relevant material properties accordingly. Elevating the temperature of the solutions causes an increase in diffusivity of ions in the solutions which leads to an increment of obtainable power density in RED systems [59]. In addition, the viscosity of the solutions will be decreased in higher temperature, which will reduce the power consumption of the pump and consequently will decrease the pressure loss in the channel [58,60]. The viscosities and diffusivities in different temperatures are given in Table A3.

4.3.1. Validation of Flow Behaviour

Experimental investigations of mass and momentum transport for spacer-filled channels are complex and there are limited reports in the literature. Da Costa et al. [49] reported pressure drop data for commercially available spacers made from Conwed Plastics. Haaksman et al. [51] also reported pressure drop data and friction factors for five types of commercial spacers. The spacers had a quasi-elliptical cross section with respect to the main flow direction and are comparable to cylindrical geometry among our studied geometries.
Figure 10 compares simulated pressure drop gradient for cylindrical spacer-filled channel over one corrugation with the experimental data reported by Da Costa et al. [49] and Haaksman et al. [51]. The figure shows that the simulated results are within measured data from the literature. The pressure drop for Conwed-1 commercial spacer measured by Da Costa et al. [49] is higher than the simulated pressure drop for cylindrical corrugation, believed to be due to the irregular cross section of the Conwed-1 spacer compared to the cylindrical corrugation. The pressure drop for the Conwed-2 spacer measured by Haaksman et al. [51] is lower than the simulated pressure drop for cylindrical corrugation, assumed to be due to experiments being performed at higher temperatures ( T = 30 C) compared to the temperature for the simulation case ( T = 20 C).

4.3.2. Typical Flow Behaviour

The velocity streamlines are presented for a cylindrical spacer-filled channel in Figure 11, when the Re number is equal to 1, 60 and 200.
The figure demonstrates that, for a higher Reynolds number, streamlines downstream of the corrugations are changing and wakes are developing. This observation is important during scaling of laboratory experimental data. The Re number is typically in the order of 1–5 for lab experiments [35,37] or up to 7–10 for the setup designed by Post et al. for a 20 W RED stack [4]. Scaling RED up to a MW plant, the Re numbers might become larger, up to 100 or higher. The flow pattern around the spacers changes fundamentally as the Re number increases. At higher Re number, the distance between detachment and re-attachment points of boundary layer increases, thereby bigger wakes will be created in the down stream of the corrugation which in turn improves the mixing process.

4.3.3. Effect of Velocity Change on Pressure Loss and Mass Transfer

Introducing corrugations affects both the concentration difference ( Δ C ) and pressure drop ( Δ P ), between inlet and outlet of the channel. Comparisons of concentration difference and pressure loss for different geometries at different Reynolds numbers can provide criteria to select optimum geometries with minimum pressure drop and maximum mass transfer efficiency. As discussed in the Section 1, the membrane area is a key parameter for the mass transfer. Figure 12 compares the concentration difference and normalized concentration difference with respect to residence time as a function of Re for both active and inactive spacers with different geometries, while Figure 13 shows the corresponding pressure loss. Table A1 in Appendix A summarizes Δ C , Δ P and mass transfer rate for flat channel and for all types of active spacer-filled channels at different Re numbers and residence times. The residence time of the feed solution in the channel is defined as the ratio of the linear length of the channel divided by the average velocity given by Equation (18).
t r e s = L u .
The residence time demonstrates the time that the dilute solution needs to pass through the whole length of the channel and mixes with the concentrated solution. Three observations can be extracted from the results in Figure 12. First, mass transfer (concentration difference) is decreasing as Re number is increasing by varying velocity for all studied geometries, both for active and inactive spacers. In fact, the mixing process during reverse electrodialysis is controlled both by diffusion and advection mechanisms; however, the diffusion mechanism is more dominant and important for all corrugations presented in this paper, where the height of the corrugations is relatively small compared to the height of the channel. As the Re number increases, t r e s decreases for channels with similar total length, the diffusion mechanism becomes less significant compared to advection mechanism and the solution has less time for mixing. An analysis of normalized concentration differences with respect to residence time allows estimating the size of the mass transfer rate. Figure 12 shows that the normalized concentration difference with respect to residence time (mass transfer rate) increases as Re number increases. Second, the mass transfer (both concentration difference and normalized concentration difference with respect to residence time) is higher for an active spacer compared to inactive spacer as it is shown in Figure 12 for all types of corrugations. Since the mass can be transported through the active corrugations and inactive spacers can not transport mass (i.e., inactive spacers have no flux boundary condition), it is logical to expect that active spacers have higher mass transfer ability compared to the flat channel or channels with inactive spacers. It is important to note that the pressure gradient will not change from switching between active and inactive spacers.
Third, the triangular corrugated channel has the highest mass transfer capability compared to other geometries. This effect is more pronounced at higher velocities. Cylindrical and square corrugated channels have approximately similar performance in terms of mass flux for all studied Re numbers. While the model predicts approximately similar mass transfer enhancement for a flat channel compared to cylindrical and square corrugated channels at lower Re numbers (i.e., Re number less than 60), a flat channel has the lowest mass transfer capability among all geometries at highest Re numbers (i.e., Re = 200).
Figure 13 shows that the simple channel has the lowest pressure drop (minimum energy loss) among different geometries followed by the cylindrical, channel and triangular channel. However, this trend is not similar for low and high Reynolds numbers. The pressure loss difference between a specific corrugated channel and a simple channel increases drastically as Re number increases. In addition, triangular corrugated channel has similar or slightly higher pressure loss compared to other corrugated channels at low Re (i.e., Re number less than 100). The flow through triangular corrugated channel at high Re (i.e., Re number more than 100) leads to a larger pressure drop compared to square and cylindrical channels, which make this type of corrugations less attractive.
Another approach for mass and momentum transfer analysis is to normalize mass transfer and pressure drop of the spacer-filled channel with respect to corresponding values for the flat channel. Table A2 in Appendix A summarizes the normalized mass transfer ( ϵ c = Δ C C o r r u g a t i o n Δ C f l a t ) and normalized pressure drop ( ϵ p = Δ p C o r r u g a t i o n Δ p f l a t ) for spacer-filled channels with different geometries at different Re numbers at temperature T = 20 C. The values of ϵ c are within good agreement with the relative solute concentration drop (RSD) which was defined and reported previously by Tadimeti et al. [52].
Considering both the mass transfer improvement and pressure drop for different geometries, one may conclude that triangular corrugated channels (with highest mixing capacity) is an optimum geometry for RED channels in particular for low Re numbers. For high Re, cylindrical corrugated channels are a better geometry among all studied channel types due to lower pressure loss and reasonable fluid mixing. Similar observation was published by Tadimeti et al. [52] where they concluded selected right-angle triangle corrugations performed better at lower velocities and became less ineffective at higher velocities applying CFD models which matched very well with the literature reported experimental data. Ahmad et al. [31] investigated the influence of different types of corrugation geometries in controlling mass transfer, concentration polarization and pressure drop utilizing commercial CFD tool for simulating flow conditions. They showed the dependency of corrugated geometries performance on the Reynolds number [31]. They recommended usage of circular spacers for high flow velocities due to lower pressure drop and energy consumption, while, for low flow velocities, triangular and square spacers can be implemented due to more efficient concentration polarization mitigation with moderate and reasonable pressure drop and energy loss [31].

4.3.4. Effect of Temperature on Mass and Momentum Transfer

The Reynolds number changes as temperature varies as increasing the temperature reduces the viscosity of fluid; hence Reynolds number increases and vice versa. Increasing temperature also increases the diffusivity of salts in water. The following equations have been used to relate the variation of viscosity and diffusivity of salts in water with temperature [60].
μ = 1.234 × 10 6 e 2.12 × 10 3 c + 1965 T + 273.15
where T is temperature in Celsius, c is salt concentration of solution in kg / m 3 and D is diffusivity.
D = 6.725 × 10 6 e 0.1546 × 10 3 c + 2513 T + 273.15
Figure 14 shows the effect of changing the Reynolds number from 40 to 60 and 100 by increasing the temperature from T = 20 C to T = 40 C and T = 67 C at uniform inlet velocity (u = 0.2064 m/s) on mass transfer and momentum transport for flat and triangular active spacers compared to the influence of varying Reynolds number from 40 to 60 and 100 due to increasing velocity at T = 20 C.
Δ C , Δ P and mass transfer rate at different temperatures for flat and triangular active spacer-filled channels are summarized in Table A3 in the Appendix A. Table A4 also summarizes normalized mass transfer and pressure drop for triangular spacer-filled channel at different temperatures with respect to the corresponding values for flat channel.
Two observations can be made from these two figures. First, as the Re number increases at elevated temperatures, the concentration difference increases and fluid mixing improves due to enhanced diffusivity. In other words, mass flux varies differently by increasing the Re number depending upon if it is realized by increasing the flow velocity or increasing the solution temperature. Second, as the Re number increases due to increased temperatures, the pressure drop reduces since the viscosity of fluid is lower at higher temperatures. The pressure drop is a linear function of velocity or Re number and quadratic function of viscosity for a flat channel with laminar flow and fully developed velocity regime according to Equation (21), known as the Darcy–Weisbach Equation [58]. Evidently, the pressure drop is very sensitive to viscosity.
Δ P = 12 μ 2 L R e ρ h 3
Lower pressure drop and enhanced mass flux at elevated temperatures demonstrate the potential of utilization of waste heat for improving performance of RED power generation.

4.4. Influence of Boundary Conditions

The default boundary condition used on the (active spacers) membrane surface is in the current work a Dirichlet condition corresponding to the mean concentration of the dilute channel and a corresponding (hypothetical) concentrated channel. Alternatively (and typically), the boundary condition in question is a Neumann condition—i.e., a specified flux of the form:
j w = D C n w ,
where n is the wall normal direction and D is the effective diffusivity, representative of the ionic flux through the membrane.
To determine the influence of the choice of boundary conditions, simulations with a Neumann boundary condition were performed using the mean concentration gradient at the wall obtained from simulations where the default Dirichlet condition was used. A comparison of the concentration turnover, Δ C , for flat and triangular membrane profiles is shown in Figure 15. Evidently, the choice of boundary conditions does not change the global turnover—as expected from a converged simulation.
Locally, the choice of boundary condition (necessarily) has a considerable influence, as shown in Figure 16. The blue line in Figure 16 shows the wall concentration C w obtained from the fixed gradient case (normalized to the corresponding constant value used in the fixed concentration case), while the red line in Figure 16 shows the concentration gradient at the wall obtained from the fixed concentration case, normalized to the corresponding constant value used in the fixed gradient case.
The local wall concentration is increasing (compared to the average) for the fixed gradient case, while the local gradient is decreasing (compared to the average) for the fixed concentration case—both consistently indicating a smaller mass transfer towards the end of the channel as the dilute compartment gradually becomes more concentrated.

5. Conclusions

Based on CFD modeling of mass and momentum transfer in spacer-filled channels, the influence of active and inactive spacers with different geometries is addressed. The effect of different temperatures and flow velocities on mass transfer and pressure loss are considered.
The results shows that mass transfer is higher for active spacers compared to inactive spacers with a similar pressure loss for a given geometry, due to increased active membrane area.
Considering both the influence of mass transfer enhancement and pressure drop for different geometries, simulations indicate that triangular corrugations are an optimum geometry for spacer-filled channels at low flow velocities. Cylindrical corrugations are a better option at high flow velocities among the corrugations considered, due to lower pressure drop while retaining a reasonable mass transfer enhancement.
An analysis of the streamlines demonstrated better fluid mixing down stream of corrugations, due to the creation of wakes and recirculation regions.
For a given Reynolds number, mass transfer and pressure loss are different whether the flow velocity or the temperature is changing. In fact, mass transfer decreases and pressure loss increases as flow velocity increases for all investigated geometries, as long as the ratio of the height of corrugation to the height of the channel is relatively small (0.25). At elevated temperatures, mass transfer is enhanced and pressure loss decreased due to the dependency of the fluid viscosity and diffusivity on temperature. These result indicate a potential use of waste heat to increase power generation by RED.

Author Contributions

Z.J. built the models, ran the simulations, post-processed and analyzed the results, and wrote the manuscript including literature review, results and discussions. J.G.P. contributed in supervising and reviewing of the results, particularly discussing the mass conservation. O.S.B. contributed in supervising and reviewing of the work, especially suggesting modeling of the active and inactive spacers, looking into the effect of temperature as well as performing pre-modeling. K.E.E. contributed in developing of the model and meshing as well as supervising and revising manuscript including writing the sections on governing equations and the influence of boundary conditions. All authors participated in discussing the results.

Acknowledgments

Financial support from ENERSENSE (Energy and Sensor Systems) group at Norwegian University of Science and Technology (NTNU) and Norwegian Research Council is greatly acknowledged. Zohreh Jalili would like to thank Vahid Alipour Tabrizy for all support and help throughout this work.

Conflicts of Interest

The authors declare no conflict of interest.

Nomenclature

Abbreviation
AEMAnion exchange membrane
CapMixCapacitive mixing
CFDComputational fluid dynamics
GAMGGeometric algebraic multigrid
PROPressure retarded osmosis
REDReverse electrodialysis
TDEGThermal driven electrochemical generator
Symbols
hHeight of the channel
h d Heights of the dilute solutions compartments
LLength of the channel
Δ P Pressure difference between inlet and outlet
ϵ Spacer porosity
ϵ c Normalized concentration difference with respect to flat concentration difference
ϵ p Normalized pressure difference with respect to flat pressure difference
D i Diffusivity
ν Kinematic viscosity
β ¯ Average perm-selectivity
ϕ Electrostatic potential
σ Mask fraction or spacer shadow factor
cSalt concentration of solution
C c Concentration of the concentrated solution
C d Concentrations of the dilute solution
DCorrugation diameter or length
dDistance between the centre of two successive corrugations
E O C P Open circuit potential
h c Heights of the concentrated solutions compartments
I R E D Current density
k c Concentrated solution conductivity
k d Dilute solution conductivity
L i n l e t Length of inlet section
L M Length of channel without inlet and outlet sections
L o u t l e t Length of outlet section
NNumber of corrugations
N m Number of membranes
O C P Open circuit potential
rHeight of the corrugation
R A E M Resistances of the AEM
R C E M Resistances of the CEM
R e l e c t r o d e Electrode resistance
R l o a d Load resistance
t r e s Residence time
u i n l e t Velocity at inlet
W p u m p Power density of the pump
z i Valency
FFaraday’s constant
RUniversal gas constant
TTemperature

Appendix A

Table A1. Δ C , Δ P and mass transfer rate for flat channel and all types of active spacer-filled channels at T = 20 C.
Flat ChannelSquare Corrugation
Re u inlet t res Δ C Δ P Δ C / t res Δ C Δ P Δ C / t res
m/ssmol/m 3 Pamol/m 3 s mol/m 3 Pamol/m 3 s
10.00521.39583.7711.6760.0491.1419.6265.31
100.05160.14018.69117.413420.5199.2146.9
200.10320.07011.83236.8169.613.09408.8187.7
400.20640.0357.483481.4214.58.480859.7243.1
600.30960.0235.721733.72466.6681347286.7
1000.5160.0144.0811261292.55.0562427362.3
2001.0320.0072.5862711370.73.6455817522.5
Cylindrical corrugationTriangular corrugation
10.00521.39588.9916.3763.7889.0317.463.81
100.05160.14019.69166.8141.120.69181148.3
200.10320.07012.38342.9177.413.74380.7197
400.20640.0357.791721.4223.410.05830.4288.1
600.30960.0236.0041130258.29.0121337387.5
1000.5160.0144.4712036320.47.6172513545.9
2001.0320.0073.5194857504.35.7396612822.6
Table A2. Normalized mass transfer and normalized pressure drop for all active spacer-filled channels with respect to the corresponding values for flat channel at T = 20 C.
SquareCylinderTriangle
Re ϵ c ϵ p ϵ c ϵ p ϵ c ϵ p
11.0881.6811.0621.4031.0631.491
101.0971.6971.0541.4211.1081.542
201.1071.7261.0461.4481.1621.607
401.1331.7861.0411.4981.3431.725
601.1651.8361.0491.5411.5751.823
1001.2391.9251.0951.6151.8661.993
2001.4092.1461.3601.7912.2192.439
Table A3. Δ C , Δ P and mass transfer rate at different temperatures for flat and triangular spacer-filled channels.
Flat ChannelTriangular Corrugation
Re u inlet T ν × 10 06 D i × 10 09 Δ C Δ P Δ C / t res Δ C Δ P Δ C / t res
m/s C m 2 / s m 2 /smol/m 3 Pamol/m 3 s mol/m 3 Pamol/m 3 s
400.2064201.031.57.483481.4214.510.05830.4288.1
600.2064400.6582.29.656326.1276.813.45594.4385.4
1000.2064670.44.214.81201.7424.620.19402.1578.9
Table A4. Normalized mass transfer and normalized pressure drop for triangular spacer-filled channels at different temperatures with respect to the corresponding values for flat channel.
Triangle
Re ϵ c ϵ p
401.3431.725
601.3921.823
1001.3631.993

References

  1. Post, J.W.; Veerman, J.; Hamelers, H.V.; Euverink, G.J.; Metz, S.J.; Nymeijer, K.; Buisman, C.J. Salinity-gradient power: Evaluation of pressure-retarded osmosis and reverse electrodialysis. J. Membr. Sci. 2007, 288, 218–230. [Google Scholar] [CrossRef] [Green Version]
  2. Yip, N.Y.; Elimelech, M. Performance limiting effects in power generation from salinity gradients by pressure retarded osmosis. Environ. Sci. Technol. 2011, 45, 10273–10282. [Google Scholar] [CrossRef] [PubMed]
  3. Pawlowski, S.; Rijnaarts, T.; Saakes, M.; Nijmeijer, K.; Crespo, J.G.; Velizarov, S. Improved fluid mixing and power density in reverse electrodialysis stacks with chevron-profiled membranes. J. Membr. Sci. 2017, 531, 111–121. [Google Scholar] [CrossRef]
  4. Post, J.W.; Goeting, C.H.; Valk, J.; Goinga, S.; Veerman, J.; Hamelers, H.V.M.; Hack, P.J.F.M. Towards implementation of reverse electrodialysis for power generation from salinity gradients. Desalin. Water Treat. 2010, 16, 182–193. [Google Scholar] [CrossRef] [Green Version]
  5. Ramon, G.Z.; Feinberg, B.J.; Hoek, E.M. Membrane-based production of salinity-gradient power. Energy Environ. Sci. 2011, 4, 4423–4434. [Google Scholar] [CrossRef]
  6. Pattle, R.E. Electricity from fresh and salt water-without fuel. Chem. Proc. Eng. 1955, 35, 351–354. [Google Scholar]
  7. Boon, N.; Van Roij, R. Blue energy from ion adsorption and electrode charging in sea and river water. Mol. Phys. 2011, 109, 1229–1241. [Google Scholar] [CrossRef]
  8. Maisonneuve, J.; Pillay, P.; Laflamme, C.B. Pressure-retarded osmotic power system model considering non-ideal effects. Renew. Energy 2015, 75, 416–424. [Google Scholar] [CrossRef]
  9. Senthil, S.; Senthilmurugan, S. Reverse Osmosis-Pressure Retarded Osmosis hybrid system: Modelling, simulation and optimization. Desalination 2016, 389, 78–97. [Google Scholar]
  10. Bijmans, M.F.M.; Burheim, O.S.; Bryjak, M.; Delgado, A.; Hack, P.; Mantegazza, F.; Hamelers, H.V.M. Capmix-deploying capacitors for salt gradient power extraction. Energy Procedia 2012, 20, 108–115. [Google Scholar] [CrossRef]
  11. Fernández, M.M.; Wagterveld, R.M.; Ahualli, S.; Liu, F.; Delgado, A.V.; Hamelers, H.V.M. Polyelectrolyte-versus membrane-coated electrodes for energy production by capmix salinity exchange methods. J. Power J. Power Sources 2016, 302, 387–393. [Google Scholar] [CrossRef]
  12. Kingsbury, R.S.; Chu, K.; Coronell, O. Energy storage by reversible electrodialysis: The concentration battery. J. Membr. Sci. 2015, 495, 502–516. [Google Scholar] [CrossRef]
  13. Li, L.; Liu, P.; Li, Z.; Wang, X. A multi-objective optimization approach for selection of energy storage systems. Comput. Chem. Eng. 2018, 115, 213–225. [Google Scholar] [CrossRef]
  14. Pattle, R.E. Production of electric power by mixing fresh and salt water in the hydroelectric pile. Nature 1954, 174, 660. [Google Scholar] [CrossRef]
  15. Lacey, R.E. Energy by reverse electrodialysis. Ocean Eng. 1980, 7, 1–47. [Google Scholar] [CrossRef]
  16. Tedesco, M.; Cipollina, A.; Tamburini, A.; van Baak, W.; Micale, G. Modelling the Reverse ElectroDialysis process with seawater and concentrated brines. Desalin. Water Treat. 2012, 49, 404–424. [Google Scholar] [CrossRef] [Green Version]
  17. Veerman, J. Reverse Electrodialysis. Design and Optimization by Modeling and Experimentation; University of Groningen: Groningen, The Netherlands, 2010. [Google Scholar]
  18. Burheim, O.S.; Seland, F.; Pharoah, J.G.; Kjelstrup, S. Improved electrode systems for reverse electro-dialysis and electro-dialysis. Desalination 2012, 285, 147–152. [Google Scholar] [CrossRef]
  19. Vermaas, D.A.; Guler, E.; Saakes, M.; Nijmeijer, K. Theoretical power density from salinity gradients using reverse electrodialysis. Energy Procedia 2012, 20, 170–184. [Google Scholar] [CrossRef]
  20. Zlotorowicz, A.; Strand, R.V.; Burheim, O.S.; Wilhelmsen, Ø.; Kjelstrup, S. The permselectivity and water transference number of ion exchange membranes in reverse electrodialysis. J. Membr. Sci. 2017, 523, 402–408. [Google Scholar] [CrossRef]
  21. Burheim, O.S. Engineering Energy Storage; Academic Press: Cambridge, MA, USA; Elsevier: New York, NY, USA, 2017; ISBN 9780128141007. [Google Scholar]
  22. Tedesco, M.; Cipollina, A.; Tamburini, A.; Bogle, I.D.L.; Micale, G. A simulation tool for analysis and design of reverse electrodialysis using concentrated brines. Chem. Eng. Res. Des. 2015, 93, 441–456. [Google Scholar] [CrossRef] [Green Version]
  23. Pawlowski, S.; Sistat, P.; Crespo, J.G.; Velizarov, S. Mass transfer in reverse electrodialysis: Flow entrance effects and diffusion boundary layer thickness. J. Membr. Sci. 2014, 471, 72–83. [Google Scholar] [CrossRef]
  24. Długołęcki, P.; Dąbrowska, J.; Nijmeijer, K.; Wessling, M. Ion conductive spacers for increased power generation in reverse electrodialysis. J. Membr. Sci. 2010, 347, 101–107. [Google Scholar] [CrossRef]
  25. Vermaas, D.A.; Veerman, J.; Yip, N.Y.; Elimelech, M.; Saakes, M.; Nijmeijer, K. High efficiency in energy generation from salinity gradients with reverse electrodialysis. ACS Sustain. Chem. Eng. 2013, 1, 1295–1302. [Google Scholar] [CrossRef]
  26. Gurreri, L.; Tamburini, A.; Cipollina, A.; Micale, G.; Ciofalo, M. Flow and mass transfer in spacer-filled channels for reverse electrodialysis: A CFD parametrical study. J. Membr. Sci. 2016, 497, 300–317. [Google Scholar] [CrossRef] [Green Version]
  27. Kim, H.K.; Lee, M.S.; Lee, S.Y.; Choi, Y.W.; Jeong, N.J.; Kim, C.S. High power density of reverse electrodialysis with pore-filling ion exchange membranes and a high-open-area spacer. J. Mater. Chem. 2015, 3, 16302–16306. [Google Scholar] [CrossRef] [Green Version]
  28. Balster, J.; Stamatialis, D.F.; Wessling, M. Membrane with integrated spacer. J. Membr. Sci. 2010, 360, 185–189. [Google Scholar] [CrossRef]
  29. Larchet, C.; Zabolotsky, V.I.; Pismenskaya, N.; Nikonenko, V.V.; Tskhay, A.; Tastanov, K.; Pourcelly, G. Comparison of different ED stack conceptions when applied for drinking water production from brackish waters. Desalination 2008, 222, 489–496. [Google Scholar] [CrossRef]
  30. Gurreri, L.; Tamburini, A.; Cipollina, A.; Micale, G.; Ciofalo, M. CFD prediction of concentration polarization phenomena in spacer-filled channels for reverse electrodialysis. J. Membr. Sci. 2014, 468, 133–148. [Google Scholar] [CrossRef] [Green Version]
  31. Ahmad, A.L.; Lau, K.K.; Bakar, M.A. Impact of different spacer filament geometries on concentration polarization control in narrow membrane channel. J. Membr. Sci. 2005, 262, 138–152. [Google Scholar] [CrossRef]
  32. Schwinge, J.; Wiley, D.E.; Fletcher, D.F. Simulation of the flow around spacer filaments between channel walls. 2. Mass-transfer enhancement. Ind. Eng. Chem. Res. 2002, 41, 4879–4888. [Google Scholar] [CrossRef]
  33. Song, L.; Shengwei, M. Numerical studies of the impact of spacer geometry on concentration polarization in spiral wound membrane modules. Ind. Eng. Chem. Res. 2005, 44, 7638–7645. [Google Scholar] [CrossRef]
  34. Gurreri, L.; Ciofalo, M.; Cipollina, A.; Tamburini, A.; Van Baak, W.; Micale, G. CFD modelling of profiled-membrane channels for reverse electrodialysis. Desalin. Water Treat. 2015, 55, 3404–3423. [Google Scholar] [CrossRef] [Green Version]
  35. Vermaas, D.A.; Saakes, M.; Nijmeijer, K. Enhanced mixing in the diffusive boundary layer for energy generation in reverse electrodialysis. J. Membr. Sci. 2014, 453, 312–319. [Google Scholar] [CrossRef]
  36. Vermaas, D.A.; Saakes, M.; Nijmeijer, K. Doubled power density from salinity gradients at reduced intermembrane distance. Environ. Sci. Technol. 2011, 45, 7089–7095. [Google Scholar] [CrossRef] [PubMed]
  37. Długołęcki, P.; Anet, B.; Metz, S.J.; Nijmeijer, K.; Wessling, M. Transport limitations in ion exchange membranes at low salt concentrations. J. Membr. Sci. 2010, 346, 163–171. [Google Scholar] [CrossRef]
  38. Güler, E.; Elizen, R.; Saakes, M.; Nijmeijer, K. Micro-structured membranes for electricity generation by reverse electrodialysis. J. Membr. Sci. 2014, 458, 136–148. [Google Scholar] [CrossRef]
  39. Vermaas, D.A.; Saakes, M.; Nijmeijer, K. Power generation using profiled membranes in reverse electrodialysis. J. Membr. Sci. 2011, 385, 234–242. [Google Scholar] [CrossRef]
  40. Pawlowski, S.; Geraldes, V.; Crespo, J.G.; Velizarov, S. Computational fluid dynamics (CFD) assisted analysis of profiled membranes performance in reverse electrodialysis. J. Membr. Sci. 2016, 502, 179–190. [Google Scholar] [CrossRef] [Green Version]
  41. Benneker, A.M.; Rijnaarts, T.; Lammertink, R.G.; Wood, J.A. Effect of temperature gradients in (reverse) electrodialysis in the Ohmic regime. J. Membr. Sci. 2018, 548, 421–428. [Google Scholar] [CrossRef]
  42. Luo, X.; Cao, X.; Mo, Y.; Xiao, K.; Zhang, X.; Liang, P.; Huang, X. Power generation by coupling reverse electrodialysis and ammonium bicarbonate: Implication for recovery of waste heat. Electrochem. Commun. 2012, 19, 25–28. [Google Scholar] [CrossRef]
  43. Leitz, F.B.; Marinčić, L. Enhanced mass transfer in electrochemical cells using turbulence promoters. J. Appl. Electrochem. 1977, 7, 473–484. [Google Scholar] [CrossRef]
  44. Schwinge, J.; Wiley, D.E.; Fletcher, D.F. A CFD study of unsteady flow in narrow spacer-filled channels for spiral-wound membrane modules. Desalination 2002, 146, 195–201. [Google Scholar] [CrossRef]
  45. Ahmad, A.L.; Lau, K.K.; Bakar, M.A.; Shukor, S.A. Integrated CFD simulation of concentration polarization in narrow membrane channel. Comput. Chem. Eng. 2005, 29, 2087–2095. [Google Scholar] [CrossRef]
  46. Pawlowski, S. Experimental and Modeling Studies on Reverse Electrodialysis for Sustainable Power Generation. Doctoral Dissertation, Universidade NOVA de Lisboa, Caparica, Portugal, 2015. [Google Scholar]
  47. Li, Y.L.; Tung, K.L. CFD simulation of fluid flow through spacer-filled membrane module: Selecting suitable cell types for periodic boundary conditions. Desalination 2008, 233, 351–358. [Google Scholar] [CrossRef]
  48. Ranade, V.V.; Kumar, A. Fluid dynamics of spacer filled rectangular and curvilinear channels. J. Membr. Sci. 2006, 271, 1–15. [Google Scholar] [CrossRef] [Green Version]
  49. Da Costa, A.R.; Fane, A.G.; Wiley, D.E. Spacer characterization and pressure drop modelling in spacer-filled channels for ultrafiltration. J. Membr. Sci. 1994, 87, 79–98. [Google Scholar] [CrossRef]
  50. Li, F.; Meindersma, W.; De Haan, A.B.; Reith, T. Optimization of commercial net spacers in spiral wound membrane modules. J. Membr. Sci. 2002, 208, 289–302. [Google Scholar] [CrossRef] [Green Version]
  51. Haaksman, V.A.; Siddiqui, A.; Schellenberg, C.; Kidwell, J.; Vrouwenvelder, J.S.; Picioreanu, C. Characterization of feed channel spacer performance using geometries obtained by X-ray computed tomography. J. Membr. Sci. 2017, 522, 124–139. [Google Scholar] [CrossRef]
  52. Tadimeti, J.G.D.; Kurian, V.; Chandra, A.; Chattopadhyay, S. Corrugated membrane surfaces for effective ion transport in electrodialysis. J. Membr. Sci. 2016, 499, 418–428. [Google Scholar] [CrossRef]
  53. COMSOL. COMSOL Multiphysics. Available online: https://www.comsol.com/ (accessed on 25 June 2018).
  54. Jalili, Z.; Burheim, O.S.; Einarsrud, K.E. New insights into computational fluid dynamic modeling of the resistivity and overpotential in reverse electrodialysis. ECS Trans. 2018, 85, 129–144. [Google Scholar] [CrossRef]
  55. OpenFOAM. The OpenFOAM Foundation. Available online: http://www.openfoam.org (accessed on 25 June 2018).
  56. Kirby, B.J. Micro and Nanoscale Fluid Mechanics: Transport in Microfluidic Devices; Cambridge University Press: Cambridge, UK, 2010. [Google Scholar]
  57. Tamburini, A.; La Barbera, G.; Cipollina, A.; Ciofalo, M.; Micale, G. CFD simulation of channels for direct and reverse electrodialysis. Desalin. Water Treat. 2012, 48, 370–389. [Google Scholar] [CrossRef] [Green Version]
  58. Batchelor, G.K. An Introduction to Fluid Dynamics; Cambridge University Press: Cambridge, UK, 2000. [Google Scholar]
  59. Tseng, S.; Li, Y.M.; Lin, C.Y.; Hsu, J.P. Salinity gradient power: Influences of temperature and nanopore size. Nanoscale 2016, 8, 2350–2357. [Google Scholar] [CrossRef] [PubMed]
  60. Kim, J.; Wilf, M.; Park, J.S.; Brown, J. Boron Rejection by Reverse Osmosis Membranes: National Reconnaissance and Mechanism Study-Phase 1; Georgia Institute of Technology: Atlanta, GA, USA, 2006. [Google Scholar]
Figure 1. Illustration of ion distribution in the concentrated and dilute streams of a RED stack consisting of AEMs, CEMs, and concentrated and dilute solution channels. FeCl 2 and FeCl 3 are the electrode rinse solutions [18].
Energies 11 02028 g001
Figure 2. Illustration of active and inactive spacer-filled channels with developed wakes in reattachment region. Inactive spacers (left side) suppress local ion migration through the membrane, while active spacers (right side) are permeable.
Energies 11 02028 g002
Figure 3. Schematic of a flat channel with the characteristic lengths.
Energies 11 02028 g003
Figure 4. Schematic of the different corrugations (cylindrical, triangular and square) with characteristic parameters.
Energies 11 02028 g004
Figure 5. Illustration of boundary conditions in a flat channel. Zero flux conditions are applied for sections up- and downstream of the active membrane (blue horizontal line) to mitigate the influence of the in- and outlet. Active membrane regions have either a constant concentration equal to 250 mol / m 3 or an equivalent flux.
Energies 11 02028 g005
Figure 6. Verification of the numerical simulation with Poiseuille equation for pressure loss and velocity profile: (a) velocity profiles for analytical solution and simulation at Re = 200; and (b) pressure drop profiles across the inlet and outlet of the flat channel from analytical solution and simulation.
Energies 11 02028 g006
Figure 7. (a) Configurations of 14 blocks of a single cylindrical corrugation; and (b) local mesh refinement around the cylindrical corrugated wall (coarse mesh).
Energies 11 02028 g007
Figure 8. Concentration and velocity profiles along the height of the channel: (a) concentration profile with respect to the height of the channel at Re = 200, X = 6.35 mm for four different levels of mesh refinement; (b) X-component of velocity profile with respect to the height of the channel at Re =200 and X = 6.35 mm for four different levels of mesh refinement; and (c) position of investigated location (X = 6.35 mm) in cylindrical corrugated channel.
Energies 11 02028 g008
Figure 9. Numerical errors for the concentration difference and pressure drop between inlet and outlet of cylindrical active spacer-filled channel.
Energies 11 02028 g009
Figure 10. Comparison of simulated pressure drop gradient for cylindrical spacer-filled channel over one currugation with the experimental data for Conwed-1 commercial spacer measured by Da Costa et al. [49] and the experimental data for Conwed-2 commercial spacer measured by Haaksman et al. [51].
Energies 11 02028 g010
Figure 11. Comparison of the velocity streamlines along the length of the cylindrical corrugated channel for Re = 1, 60 and 200. At higher velocities (Re number), larger eddies will be created in the down stream of the corrugations.
Energies 11 02028 g011
Figure 12. Concentration difference between inlet and outlet of active and inactive spacer-filled channels and normalized concentration with respect to residence time for different geometries at T = 20 C: (a) a flat channe;l (b) cylindrical spacer-filled channel; (c) square spacer-filled channel; and (d) triangular spacer-filled channel.
Energies 11 02028 g012
Figure 13. Comparison of pressure difference between inlet and outlet of the channel as a function of Re number for all studied geometries at T = 20 C.
Energies 11 02028 g013
Figure 14. (a) Comparison of concentration difference between inlet and outlet of the channel as a function of temperature or inlet velocity for the flat and triangular spacer-filled channel. (b) Comparison of pressure difference between inlet and outlet of the channel as a function of temperature or inlet velocity for the flat and triangular active spacer-filled channel.
Energies 11 02028 g014
Figure 15. Concentration turnover Δ C for flat channel and membrane with triangular corrugations with constant concentration and -flux boundary conditions.
Energies 11 02028 g015
Figure 16. Wall concentration C w obtained from the fixed gradient case normalized to the corresponding constant value used in the fixed concentration case (blue curve, left axis) and concentration gradient at the wall obtained from the fixed concentration case normalized to the corresponding constant value used in the fixed gradient case (red curve, right axis).
Energies 11 02028 g016
Table 1. Characteristic parameters of corrugated channels.
ParameterSymbolValue (mm)
Corrugation diameter or lengthD0.1
Length of the channelL7.2
Height of the channelh0.2
Number of corrugationsN16 (-)
Height of the corrugationr0.05
Length of inlet or outlet section L i n l e t , L o u t l e t 0.55
Length of channel without inlet and outlet sections L M 6.1
Distance between the centre of two successive corrugationsd0.4
Table 2. Mesh refinement specifications for grid independence study.
ScenarioNumber of Cells Δ A min ( × 10 13 m 2 ) Δ y min ( × 10 7 m )
f 1 77,60013.74817.29
f 2 159,2003.4288.66
f 3 266,4001.5225.77
f 4 399,2000.8514.33
f 5 557,6000.5423.46
f 6 741,6000.3802.89
f 7 951,2000.2792.48
f 8 1,186,4000.2082.17

