Abstract
Hydrothermal carbonization (HTC) is a useful method to convert wet biomass to value-added products. Fruit waste generated in juice industries is a huge source of moist feedstock for such conversion to produce hydrochar. This paper deals with four types of fruit wastes as feedstocks for HTC; namely, rotten apple (RA), apple chip pomace (ACP), apple juice pomace (AJP), and grape pomace (GP). The operating conditions for HTC processing were 190 °C, 225 °C, and 260 °C for 15 min. For all samples, higher heating value and fixed carbon increased, while volatile matter and oxygen content decreased after HTC. Except for ACP, the ash content of all samples increased after 225 °C. For RA, AJP, and GP, the possible explanation for increased ash content above 225 °C is that the hydrochar increases in porosity after 230 °C. It was observed that an increase in HTC temperature resulted in an increase in the mass yield for RA and GP, which is in contrast with increasing HTC temperature for lignocellulose biomass. Other characterization tests like thermogravimetric analysis (TGA) and scanning electron microscopy (SEM) also showed that the HTC process can be successfully used to convert fruit wastes into valuable products.
1. Introduction
One of the major concerns for energy policymakers is the uneven distribution of energy resources around the globe. In addition, the increasing rate of energy consumption and environmental consequences of using conventional fossil fuels are other major concerns. One of the most promising options to tackle these problems is using biomass as an energy source. Different kinds of biomasses are readily available globally and are considered as zero net CO2 emission resources, which can be used to diversify energy systems worldwide [1]. Depending on the type of biomass, appropriate methods for converting it to energy and value-added products can be utilized. Fruit waste is known as a huge biomass resource. In Canada, 2.42 billion kilograms of fruit and vegetables are discarded each year, which accounts for 40% of Canada’s whole food waste. The significance of this issue is more clarified knowing that the estimated value for food loss and waste in Canada was 31 billion dollars in 2014 [2]. Fruits and vegetables often contain high amounts of moisture, making their conversion through thermochemical processes such as torrefaction, gasification, and pyrolysis unjustified due to the high energy requirement for drying the biomass at the beginning of these processes [3]. By contrast, another type of thermochemical process named hydrothermal carbonization (HTC), which is a recent development, can overcome this problem since the moisture (water) is not an impediment and is even used as the reaction medium for hydrothermal reactions [4]. HTC is performed at the temperature range of 180 °C–260 °C, during which biomass is submerged in water and heated in a closed system under pressure (2–6 MPa) for 5–240 min [5]. This process is favorable in lowering the ash content as well. As a considerable part of inorganics in biomass is dissolved in hot compressed water, the final hydrochar/biocarbon product will have lower amounts of ash [6]. The main product of HTC is a solid named hydrochar, which can be used as biofuel or for other purposes, for example as a soil amendment, as a biocatalyst, in materials, and in water treatment [7]. A liquid stream (aqueous soluble) and a gas stream (mainly CO2) would also be obtained after HTC [8].
Finding the optimal process parameters and product characterization of lignocellulosic biomass has been the subject of most investigations of HTC. Some of the common results from these studies are as follows: after HTC, the ratio of oxygen to carbon (O/C) and the ratio of hydrogen to carbon (H/C) of the hydrochar in comparison to the raw biomass would decrease while the higher heating value (HHV) would increase. Increasing the temperature of the process will lead to a lower mass yield; however, HHV will increase. A longer residence time will also have a positive effect on HHV. Regarding the pressure of the process, after making sure that it is above the saturation pressure, no significant effect is witnessed by increasing it. Likewise, the variation of the water to biomass ratio will not affect the products considerably after submerging the whole sample in water [9,10,11,12,13].
In contrast to lignocellulosic biomass, fruit waste, which usually contains more moisture and glucose content and is a promising feedstock for HTC, has only been investigated in a few research studies. Pala et al. [14] compared the HTC and torrefaction of grape pomace (GP) and found that in comparison to torrefaction, HTC results in products with higher energy density, energy yield, fragility, and combustion reactivity. Their results also indicated that the mass yield for HTC experiments was almost equal for 175 °C, 200 °C, and 225 °C. Watermelon peels and orange peels were hydrothermally carbonized in studies by Chen et al. [15] and Fernandez et al. [16], respectively. Likewise, the HTC of tomato peels was investigated by Sabio et al. [17] who showed that while the time and the temperature of the process have significant effects on the mass yield and energy densification ratio, the water to biomass ratio has a minor effect. Another study performed by Erdogan et al. [18] revealed that the hydrochar yields of HTC on orange pomace follow a decreasing trend with increasing temperature, while reaction time has negligible impact on the yield. Berge et al. [19] compared the treatment of food waste with HTC, anaerobic digestion, and composting, and concluded that considering economical and practical aspects, HTC is more promising due to the requirement of a lower residence time and pre-treatment as well as a better market for selling the hydrochar. In another investigation, Berge et al. [20] used life cycle analysis to evaluate the environmental impacts of HTC on food waste. The results showed the importance of using the hydrochar for electricity generation and finding better methods to manage the process water of the HTC.
The decomposition of biomass in the HTC process occurs by a series of reactions including hydrolysis, dehydration, decarboxylation, aromatization, and recondensation [21]. It is known that HTC is a process in which the hydrogen and oxygen contents of the feed are decreased by dehydration and decarboxylation [22]. The main reaction of HTC is hydrolysis, an endothermic reaction, which makes the overall reaction endothermic as well. However, at high temperatures such as 260 °C, the reaction of sugars such as monosaccharides, which is an exothermic reaction, will gradually dominate the process [23]. Hence, it can be found out that if enough reaction time is given to the formation of sugars from the biomass by endothermic reactions, then the decomposition of sugars, which is an exothermic reaction, can dominate the overall reaction. Knowing that fruit waste biomass usually contains a higher sugar content, it can help the process to consume less energy. Sevilla and Fuertes [24] stated that the hydrochar yield not only depends on the residence time and temperature but also is related to the glucose concentration. Although the chemistry of hydrochar formation is not yet comprehensively understood, it is known that the molecular structure of saccharides (sucrose, fructose, glucose, and starch) governs the chemical mechanisms [25].
In this study, four different types of fruit wastes; namely, rotten apple (RA), apple chip pomace (ACP), apple juice pomace (AJP), and grape pomace (GP), were used as feedstock for HTC in a lab \-scale batch reactor for 15 min at three different temperatures: 190 °C, 225 °C, and 260 °C. RA has a high moisture content; ACP contains seeds and stems together with a high moisture content, and AJP has a low moisture content, no seeds or stems, and less sugar such as glucose and fructose due to the removal of sugar during the juice compress processing. These differences will result in different properties of the products. Hence, the products were characterized and compared by heating value, ultimate, approximate, SEM, and TGA analyses. The main objective of this study was to evaluate the feasibility of using fruit waste as a fuel. The results of this study can be applicable to the search for an economical and practical solution for fruit waste valorization.
2. Materials and Methods
2.1. Feedstock
The fruit wastes used in this study as feedstocks were RA, ACP, AJP, and GP. The Ontario Ministry of Agriculture and Farming (OMAFRA) provided the RA; a local apple farm in Guelph provided the apple juice and chip pomace; the GP was obtained from Terra supermarket. The ACP had the highest moisture content (88.1%), while the GP had the lowest moisture content (72.03%). Moreover, Miscanthus was obtained from a local farm in Ontario.
2.2. Experimental Procedure
HTC experiments were conducted in a reactor with 600mL capacity, Series 4560 Mini from Parr Instrumental Company (Parr Instrument Company, Moline, IL, USA) which was equipped with a stirrer. A 780 W heater was used as the heat source and a process logic controller was equipped for temperature control. About 100 g of wet fruit waste was ground to make it homogeneous, after which it was placed in the reactor. Deionized water was then added to the reactor to achieve a feedstock-to-water ratio of 1:12. The moisture content in the fruit waste was considered when calculating the requirement of deionized water. The reactor was closed and sealed after submerging the biomass in water. After that, the reactor was pressurized above the corresponding saturation pressure of the desired temperatures of the experiment to prevent phase change in the water. The set temperatures were 190 °C, 225 °C, and 260 °C for the first, second, and third experiments, respectively, while the residence time after reaching these temperatures was 15 min for all experiments. In addition, an HTC experiment with a traditional feedstock was carried out at 260 °C and 15 min as a reference for comparing fruit waste’s hydrochar. The temperature inside the reactor was monitored with a thermocouple, which was placed in the center of the reactor.
After the desired temperature (190 °C, 225 °C, and 260 °C) was maintained for 15 min, the reactor was immediately quenched with cold tap water. When the temperature of the water and fruit waste mixture inside the reactor dropped to below 30 °C, the pressure release valve was opened, and the gaseous product was released into a fume hood. Then, the solid and liquid mixture was removed from the reactor and separated using filter paper (20 μm). The solid product (hydrochar) was then dried in a muffle oven at 105 °C for 24 h for further analysis.
2.3. Product Characterization
2.3.1. Proximate Analysis
The obtained hydrochars were dried overnight and then uniformly mixed prior to characterization to ensure that the results were representative of the whole product after each experiment. The proximate analysis was conducted in a Thermo Scientific Thermolyne Muffle Furnace Model F48055-60, USA, as per the ASTM standard for measuring moisture, ash, volatile matter (VM), and fixed carbon (FC) of the sample. Following ASTM-E871, the hydrochar sample with a known weight in a crucible was placed in the furnace for 16 h at 103 °C ± 2 °C. Afterwards, it was dried and cooled in a desiccator using silica gel as the drying agent. The difference of the weight before and after drying indicates the moisture content. ASTM-E1755 was applied to find the ash percentage. The dried sample was ignited at 575 °C for 5 h and, similar to the moisture content test, the weight difference before and after showed the ash content. ASTM-E857 was used to measure the volatile matter by firing the hydrochar at 950 °C for 7 min and finding the weight difference prior to and after this firing. Finally, by subtracting the values obtained for moisture, volatile matter, and ash content from 100%, the fixed carbon content of the hydrochar was determined [26].
2.3.2. Ultimate Analysis
The ultimate analysis (CHNSO) test was conducted using a Flash 2000 Elemental Analyzer (Thermo Fisher Scientific, Waltham, MA, USA). About 2 mg of dried and ground sample was needed for each test. The analyzer gave the results for carbon (C), hydrogen (H), nitrogen (N), and sulfur(S) contents, and the oxygen content was calculated using Equation (1) [27].
2.3.3. Heating Value Analysis
The higher heating value (HHV) tests were conducted using an IKA-C200 bomb calorimeter (IKA Works, Wilmington, NC, USA), and the results were compared with the calculated HHV based on the ultimate analysis. Before the test, all samples were dried for 24 h. About 0.5 g of each sample was placed in a crucible, and then the crucible was placed in the vessel. In order to supply enough oxygen for combustion in the vessel, the vessel was pressurized with pure oxygen to 3000 kPa. The vessel was then placed in water to form a coating and ignited by the cotton thread. The sample underwent combustion and the heat generated by the combustion was transferred to the surrounding water and heated the water. By recording the difference in the water temperature during the process, the system calculated the HHV using Equation (2).
In the preceding equation, M is the mass of the sample, C stands for heat capacity of the bomb calorimeter, ΔT is the temperature changes of the water, and QE is the amount of heat generated by the cotton thread.
2.3.4. Thermogravimetric Analysis
Thermogravimetric analysis (TGA) and derivative thermogravimetric (DTG) tests were conducted with DSC-TGA SDT Q600 (TA Instruments, New Castle, DE, USA) to study the decomposition behavior of the hydrochars and raw samples during combustion. About 10 mg of dried sample was needed during each test. The temperature inside the furnace increased from room temperature (about 25 °C) to 1000 °C, and the heating rate supplied was 20 °C/min. Air was supplied at a rate of 50 mL/min, which was above the stoichiometric requirement for each sample [25]. The weight loss as a function of temperature is an indicator of the combustion behavior.
2.3.5. Scanning Electron Microscopy (SEM)
Scanning electron microscopy (SEM) using FEI Inspect S50 (Field Electron and Ion Company (FEI), Hillsboro, OR, USA) was carried out to study the surface morphology of raw and carbonized samples. Both raw and pre-treated samples were placed on a standard aluminum SEM mount using carbon conductive adhesive tape. The samples were placed in a Cressington 108 Auto sputter coater, where they were coated with gold. Afterwards, they were placed in an FEI Inspect S50 scanning electron microscope. An Everhart-Thornley Detector was used to collect the images at an accelerating voltage of 20 kV.
2.4. Mass and Energy Yield
As stated before, the liquid-hydrochar mixture can be removed and separated by an appropriate filter paper after cooling the reactor. Then, the wet hydrochar was dried in an oven and the weights were measured. Knowing the mass of the raw biomass and higher heating value of the samples, the following equations were used to find the mass yield, energy densification ratio, and energy yield.
3. Results and Discussion
Table 1 displays the ultimate and proximate analyses of the fruit waste samples; the table also compares the values with those of a traditional biomass, Miscanthus. The results show that the carbon content of all samples increased with an increase in temperature, while oxygen content decreased. About a 20% increase in the carbon content and a 20% decrease in oxygen content were observed for all fruit waste samples after the HTC process at 260 °C for 15 min. It should be noted that the experiments were conducted three times to ensure reproducibility, and as the values were close to each other, the averages were considered.

Table 1.
Results of proximate and ultimate analyses.
One of the advantages of the HTC process is the reduction in the ash content of biomass by reducing the amount of inorganic content. Ash content can cause fouling, slagging, and corrosion problems [4]. These problems increase maintenance costs and affect the combustion efficiency of the fuel. From the results in the present work, it is evident that the ash content for all of the four fruit samples significantly reduced after the HTC operation. This is one of the advantages of HTC over torrefaction, as the ash content increases in the case of a torrefied biomass. For RA, AJP, and GP, the lowest ash content was observed at 225 °C with values of 0.17%, 0.02%, and 1.69%, respectively. However, the ash contents of the three samples increased while the HTC temperature was increased to 260 °C. On the other hand, ACP exhibited a different trend, with its ash content reducing with the increase of the HTC temperature; it had its lowest ash content of 0.55% after HTC at 260 °C. For RA, AJP, and GP, the possible explanation for increased ash content above 225 °C is that the hydrochar begins to be more porous after 230 °C [29]. The porosity may absorb some amounts of inorganic elements and increases the ash content. It may also be due to the reduction in the solubility of the inorganics and precipitation. A similar trend was reported for GP in the investigation by Pala et al. [14].
VM content obtained by proximate analysis is another important characteristic in the combustion and gasification of the hydrochar. Most of the biomass feedstocks contain a high amount of VM content, which is unfavorable for direct combustion because a higher VM content leads to low combustion efficiency and emission problems [30]. The analysis in the present work shows that the VM content decreases and the FC content increases with an increase in the HTC temperature. Except for ACP HTC samples, all of the other three fruit waste samples exhibited about a 20% increase in FC and a 20% decrease in VM at the most severe treatment condition (temperature at 260 °C for 15 min). For example, the VM content for GP decreased from 76.22% to 60.63% and the fixed carbon content increased from 17.28% to 35.06%. The hydrochars derived from GP and RA waste were found to be better than Miscanthus hydrochar in terms of fixed carbon content. If the obtained hydrochars are intended to be used as fuel, an important indicator is the sulfur content. As presented in Table 1, except for ACP where the sulfur content is slightly more than zero, there is no sulfur content in the other feeds and their hydrochars. This makes the use of the obtained hydrochars as fuel more attractive.
Figure 1 depicts the H/C and O/C atomic ratio changes in terms of temperature change. It should be mentioned that using a CHNSO machine (Thermo Fisher Scientific, Waltham, MA, USA), the values for C, H, N, and S are taken directly and the remaining content would be oxygen and ash together. By finding the ash content from the proximate analysis, the O content is determined. Hence the values of H/C and O/C in Figure 2 are obtained on an ash-free basis. With increasing temperature, the H/C and O/C atomic ratios decreased, and this causes the hydrochar to exhibit similar characteristics to peat or lignite. The increasing carbon content and decreasing oxygen can be attributed to dehydration and decarboxylation reactions that take place at high temperatures. The lower H/C and O/C atomic ratios are expected to lead to lower emissions, lower moisture contents and lower energy losses in the combustion process [31].
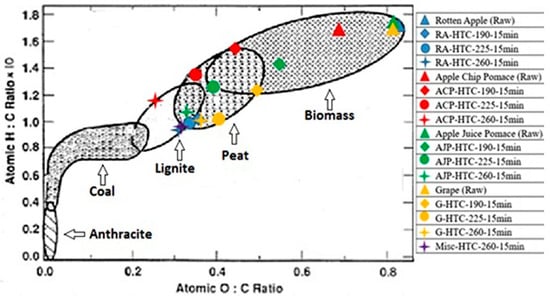
Figure 1.
Atomic H/C-O/C ratios of rotten apple (RA), apple chip pomace (ACP), apple juice pomace (AJP), and grape pomace (GP), both raw and subjected to hydrothermal carbonization (HTC), compared with a traditional biomass, Miscanthus.
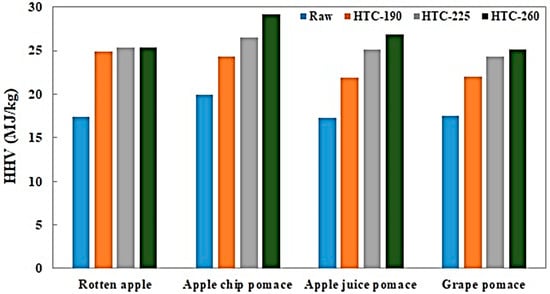
Figure 2.
Higher heating value of raw and treated samples.
Among the four raw materials, ACP with HTC at 260 °C exhibited the highest carbon enrichment. Its carbon content is even higher than that of Miscanthus. It also has the lowest oxygen content after thermochemical conversion.
The heating values of the raw and treated samples are shown in Figure 2. As hypothesized and in line with the results from previous studies, the HHV for all four samples increased when HTC was performed; the treated RA and ACP each increased by 46% after treatment at 260 °C, GP increased by 44%, and AJP displayed the highest rise in HHV with an increment of 55%. By increasing the intensity of the process, the rate of reactions such as decarboxylation increases, resulting in a higher carbon content and a lower oxygen content [32]. The elemental composition affects the heating value of fuel as it is well known that the HHV of the hydrochars are positively related to the carbon content and negatively related to the oxygen content [33].
Figure 2 also shows that the HHV increases for all of the samples by increasing the temperature of the process. This is due to improved carbonization with increasing temperature. This trend is in agreement with results in the literature [34,35]. Unlike other feeds, the HHV values of RA appear to be similar for the three temperatures considered. This is in accordance with the elemental analysis of the treated RA, as shown in Table 1. The HHV values for the treated waste GP in the present work is similar to the values reported by Pala et al. [14]. As it exhibits the highest carbon enrichment, it is not surprising that among all of the feedstocks, ACP exhibited the highest HHV of 29.11 MJ/kg at 260 °C.
The subjection of biomass to thermal pre-treatment can significantly alter its morphology by reducing its fibrous nature [36]. The structure of the cell walls degrades as a result of hemicellulose decomposition, the depolymerization of cellulose, and the softening of lignin [29]. This weakened structure makes thermally pre-treated biomass more grindable, thus reducing energy costs for grinding. The structure of both raw and pre-treated apple and grape pomace, as observed using SEM, is shown in Figure 3.
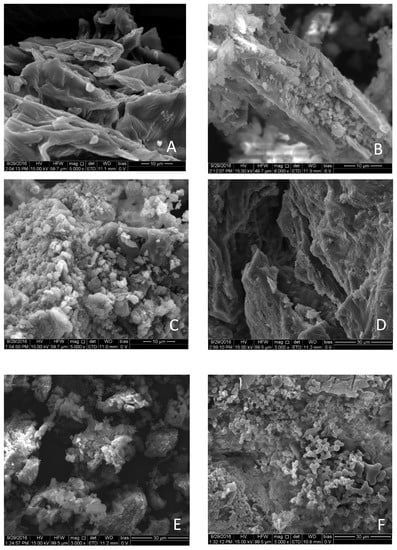
Figure 3.
Scanning electron microscopy (SEM) images of (A) raw ACP; (B) ACP-HTC-225 °C; (C) ACP-HTC-260 °C; (D) raw GP; (E) GP-HTC-190 °C; (F) GP-HTC-225 °C.
The SEM images show that the structure of the samples change with an increase in the pre-treatment temperature. Initially, the raw samples have a well-defined structure due to the presence of intact texture. However, that rigid structure of the apple pomace sample that was pre-treated at 225 °C had broken down considerably, although it was not completely amorphous. The smooth surfaces of raw AP became rough after hydrothermal treatment due to the decomposition of the cell walls [14]. The sample that was subjected to HTC at 260 °C degraded entirely and large polysaccharide molecules degraded into disaccharides and monosaccharides, followed by atomization to carbonaceous particles [37]. These carbon-rich particles had a diameter of less than 10 µm. The HTC treatment of GP at 190 °C resulted in a significant degradation like that of apple pomace, which shows that thermal decomposition can start at temperatures even lower than 200 °C. Hydrochar produced from hydrothermally treated GP at 225 °C consisted of spherical particles with a uniform size distribution.
Mass yield, energy yield, and energy densification for all experiments are reported in Table 2. As compared to results in the literature, contradictory results were observed for the mass and energy yield of the samples in the present work. According to previous studies, the mass yield and energy yield reduce with an increase in temperature [13,38]. However, in this study, almost all samples showed an increase in both energy and mass yields after HTC. The mass yield of HTC ACP kept steady with variation in temperature; for AJP, the mass yield decreased at 225 °C and increased a little at 260 °C. The possible explanation for this is that these four samples contain a significant amount of soluble sugar content.
Table 2.
Mass yield, energy yield, and energy densification ratio.
Data from the literature revealed that raw apple can contain up to 80% sugar content, apple residues up to 40% [41], and grape pomace up to 30% [39], which means that a great deal of sugar is dissolved in the water and discarded during HTC at low temperatures. Due to the fact that the HTC reaction of glucose starts at 160 °C and its mass yield increases with increasing temperature (160–260 °C) [6], the hydrothermal carbonization of glucose should be taken into consideration for the fruit waste HTC process. According to a previous investigation [6], the highest mass yield of hydrochar from glucose is obtained at 240–260 °C. Herein, the highest mass yield is also observed at 260 °C for RA and GP, and that can be attributed to the relatively high sugar content in them. Accordingly, the HTC of the sugar contents dominated the reaction during the process. The behavior of ACP and AJP during the HTC process could be explained by further sugar content and fiber analysis. However, the results and literature information reported in Table 2 indicate that Miscanthus has the highest lignocellulose or fibrous content and the lowest total sugar content on a dry basis. Total sugar refers to monosaccharides, disaccharides, and starch. It is assumed that the total sugar content in Miscanthus is the difference between the total dry weight and the sum of lignocellulose and ash content. Non-fibrous carbohydrates degrade to form glucose more easily than fibrous carbohydrates; thus, fruit wastes which contain higher total sugar contents will have a higher glucose content at the end of the HTC process at a given temperature. Miscanthus, which has a low sugar lignocellulose ratio, follows this trend. After subjection to HTC process at 225 °C, 73% of the original lignocellulose content in Miscanthus still remains unconverted [28]. After the HTC process at 260 °C, the lignocellulose content reduces to 52% and the mass yield decreases [28]. This means that most of the fibers are converted to volatile matter and other non-sugar compounds, while only a small fraction is hydrolyzed to glucose. Therefore, the rate of conversion of glucose to hydrochar was low and mass yield decreased as a result. On the other hand, fruit wastes have a higher sugar:fiber ratio and, as a result, their HTC process produces more glucose, increasing their mass yield with increasing temperature. GP, AJP, and RA have higher percentages of sugars than fibers and thus their mass yield increases after 225 °C.
TGA and DTG graphs of the raw samples and the most severe experiments are shown in Figure 4. The DTG profiles show that the initial weight loss occurred between 25 °C to 125 °C because of the moisture loss in both samples. About 10% of the weight is lost in this stage for the raw feedstock and less than 5% for the hydrochars. It should be mentioned that, prior to the TGA tests, the samples were dried in an oven overnight at 105 °C. However, as the TGA was not performed right after the drying, the samples absorbed some moisture from the environment. For the raw RA sample, the first main weight loss stage occurred from 180 °C to 430 °C with about 60% of weight loss, which corresponds to the release of VM and combustion. However, for the HTC-260 RA sample, the first main weight loss stages due to VM content release and combustion started from 250 °C to 430 °C with about 55% of weight loss, which started much later than that for the raw feedstock. This may be because the HTC process was conducted under 260 °C and this reduced the VM content sharply. The last stage during the TGA analysis was the FC content combustion. In both cases, the combustion of the FC content occurred at around 430 °C and ended at around 580 °C. About 30% of mass was lost in this stage for the raw feedstock sample and about 40% for the HTC sample.
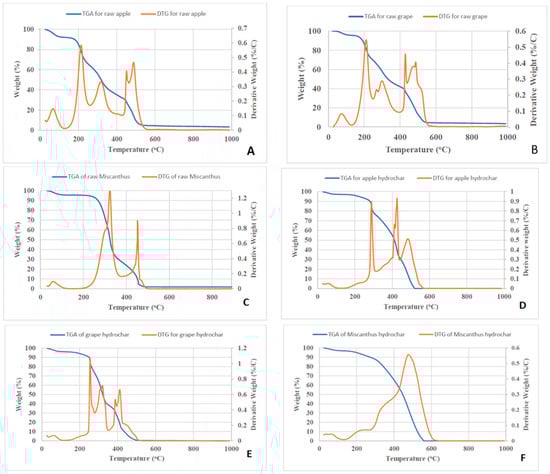
Figure 4.
Thermogravimetric analysis/derivative thermogravimetric (TGA/DTG) graphs for (A) raw RA, (B) raw GP, (C) raw Miscanthus, and samples hydrothermally treated at 260 °C of: (D) RA, (E) GP, and (F) Miscanthus.
For GP, a similar behavior to RA samples was witnessed. In the first weight loss stage, less than 5% of weight loss for both samples was observed between 25 °C to 125 °C. In the second stage (VM content release and combustion stage), about 55% of weight loss for the raw feedstock sample and about 53% of weight loss for the HTC sample were observed. In the last stage, 37% of weight loss for the raw feedstock sample and 42% of weight loss for the HTC sample were observed.
According to the TGA plot, the HTC sample has a higher ignition temperature but a shorter combustion time compared with the raw feedstock. A graphing method was used to measure the ignition temperature [43]. This is because the raw feedstock contains a high amount of VM content and a low amount of FC content. Fuels that contain a high VM content tend to have a low ignition temperature, but the ignition temperature increases after HTC. The ignition temperature of raw RA is around 200 °C, while the HTC sample was ignited at around 300 °C. The ignition temperature of raw GP is at 220 °C, while the HTC sample was ignited at 250 °C. The combustion time was calculated by using (t = ΔT/heating rate). The combustion time for raw RA is about 15 min, while for the HTC sample it is 10 min. The raw and HTC GP samples have a 14 min and 12.5 min combustion time, respectively.
4. Conclusions
A comprehensive characterization of the hydrochars obtained from HTC on different types of fruit waste was performed. The results were compared with those in the literature and the contradictions were explained. The following conclusions can be drawn from the obtained results:
- In accordance with the literature, compared to the raw fruit wastes, the ultimate and proximate analysis showed that the FC of the hydrochars increased, while the oxygen and VM content decreased. Also, increasing the temperature of the HTC process resulted in an increase in the FC content, HHV, and energy yield, in addition to a decrease in the VM content.
- In contrary to the results on the HTC of other feedstocks in the literature, the mass yield of the hydrochars from RA and GP increased with increasing process temperature. This contradictory trend was attributed to the high sugar (glucose or fructose) content of these two fruit residues, as the same trend was observed for the HTC of glucose.
- The mass yield remained almost constant with increasing temperature for ACP and decreased for the AJP sample. These two feedstocks also contain some amount of sugar but not as high as that in RA or GP; hence, the results were only slightly affected by their sugar content.
- TGA-DTG analysis showed that in comparison to the raw fruit wastes, the hydrochars have higher ignition temperatures but shorter combustion times or faster combustion rates. Moreover, their ash contents are considerably lower.
- This study also found the optimum process temperature that is sufficient to minimize ash content, which is an important fuel property. The optimum temperature to achieve the minimum ash content was 225 °C for all fruit samples except ACP, whose ash content still reduced when the process temperature was increased from 225 °C to 260 °C.
- The possible explanation for the increase in ash content above 225 °C is that the hydrochar increases in porosity after 230 °C. The SEM images of AP and GP also indicate an improvement in the porosity with higher temperatures.
Author Contributions
Conceptualization, A.D.; Methodology, B.Z., and B.R.; Software, B.Z., and M.H.; Validation, M.H., S.S., and P.A.; Formal Analysis, B.Z., and B.R.; Investigation, B.Z., M.H., P.A., and S.S.; Resources, A.D., and M.T.; Data Curation, B.Z., and B.R.; Writing-Original Draft Preparation, M.H., S.S., and P.A.; Writing-Review and Editing, M.H., S.S., and P.A.; Visualization, M.H., S.S., and P.A.; Supervision, A.D.; Project Administration, A.D. and M.T.; Funding Acquisition, A.D.
Funding
This research was funded by Natural Sciences and Engineering Research Council of Canada grant number 400495.
Acknowledgments
The authors would like to acknowledge the financial support received from the Natural Sciences and Engineering Research Council of Canada (NSERC, Grant No. 400495).
Conflicts of Interest
The authors declare no conflict of interest.
References
- Cherubini, F.; Peters, G.P.; Berntsen, T.; Strømman, A.H.; Hertwich, E. CO2 emissions from biomass combustion for bioenergy: Atmospheric decay and contribution to global warming. GCB Bioenergy 2011, 3, 413–426. [Google Scholar] [CrossRef]
- Rich, T.; Felfel, A. An Overview of Canadian Food Loss and Waste Estimates. Presented at Webinars and Speaker Series, Rural Development Institute, Brandon University, Brandon, MB, Canada, 4 June 2015. [Google Scholar]
- Minaret, J.; Dutta, A. Comparison of liquid and vapor hydrothermal carbonization of corn husk for the use as a solid fuel. Bioresour. Technol. 2016, 200, 804–811. [Google Scholar] [CrossRef] [PubMed]
- Libra, J.A.; Ro, K.S.; Kammann, C.; Funke, A.; Berge, N.D.; Neubauer, Y.; Titirici, M.-M.; Fühner, C.; Bens, O.; Kern, J.; et al. Hydrothermal carbonization of biomass residuals: A comparative review of the chemistry, processes and applications of wet and dry pyrolysis. Biofuels 2011, 2, 71–106. [Google Scholar] [CrossRef]
- Arellano, O.; Flores, M.; Guerra, J.; Hidalgo, A.; Rojas, D.; Strubinger, A. Hydrothermal carbonization of corncob and characterization of the obtained hydrochar. Chem. Eng. Trans. 2016, 50, 235–240. [Google Scholar]
- Sevilla, M.; Fuertes, A.B. Chemical and structural properties of carbonaceous products obtained by hydrothermal carbonization of saccharides. Chemistry 2009, 15, 4195–4203. [Google Scholar] [CrossRef] [PubMed]
- Bargmann, I.; Rillig, M.C.; Kruse, A.; Greef, J.M.; Kücke, M. Effects of hydrochar application on the dynamics of soluble nitrogen in soils and on plant availability. J. Plant. Nutr. Soil Sci. 2014, 177, 48–58. [Google Scholar] [CrossRef]
- Yan, W.; Hastings, J.T.; Acharjee, T.C.; Coronella, C.J.; Vásquez, V.R. Mass and energy balances of wet torrefaction of lignocellulosic biomass. Energy Fuels 2010, 24, 4738–4742. [Google Scholar] [CrossRef]
- Zhang, L.; Liu, S.; Wang, B.; Wang, Q.; Yang, G.; Chen, J. Effect of Residence Time on Hydrothermal Carbonization of Corn Cob Residual. Bioresources 2015, 10, 3979–3986. [Google Scholar] [CrossRef]
- Reza, M.T.; Rottler, E.; Herklotz, L.; Wirth, B. Hydrothermal carbonization (HTC) of wheat straw: Influence of feedwater pH prepared by acetic acid and potassium hydroxide. Bioresour. Technol. 2015, 182, 336–344. [Google Scholar] [CrossRef] [PubMed]
- Wilk, M.; Magdziarz, A. Hydrothermal carbonization, torrefaction and slow pyrolysis of miscanthus giganteus. Energy 2017, 140, 1–13. [Google Scholar] [CrossRef]
- Oktaviananda, C.; Rahmawati, R.F.; Prasetya, A.; Purnomo, C.W.; Yuliansyah, A.T.; Cahyono, R.B. Effect of temperature and biomass-water ratio to yield and product characteristics of hydrothermal treatment of biomass. In Proceedings of the AIP Conference on Chemistry, Chemical Process. and Engineering (IC3PE), Yogyakarta, Indonesia, 15–16 November 2016. [Google Scholar]
- Hoekman, S.K.; Broch, A.; Robbins, C.; Zielinska, B.; Felix, L. Hydrothermal carbonization (HTC) of selected woody and herbaceous biomass feedstocks. Biomass Convers. Biorefin. 2013, 3, 113–126. [Google Scholar] [CrossRef]
- Pala, M.; Kantarli, I.C.; Buyukisik, H.B.; Yanik, J. Hydrothermal carbonization and torrefaction of grape pomace: A comparative evaluation. Bioresour. Technol. 2014, 161, 255–262. [Google Scholar] [CrossRef] [PubMed]
- Chen, X.; Lin, Q.; He, R.; Zhao, X.; Li, G. Hydrochar production from watermelon peel by hydrothermal carbonization. Bioresour. Technol. 2017, 241, 236–243. [Google Scholar] [CrossRef] [PubMed]
- Fernandez, M.E.; Ledesma, B.; Román, S.; Bonelli, P.R.; Cukierman, A.L. Development and characterization of activated hydrochars from orange peels as potential adsorbents for emerging organic contaminants. Bioresour. Technol. 2015, 183, 221–228. [Google Scholar] [CrossRef] [PubMed]
- Sabio, E.; Álvarez-Murillo, A.; Román, S.; Ledesma, B. Conversion of tomato-peel waste into solid fuel by hydrothermal carbonization: Influence of the processing variables. Waste Manag. 2016, 47, 122–132. [Google Scholar] [CrossRef] [PubMed]
- Erdogan, E.; Atila, B.; Mumme, J.; Reza, M.T.; Toptas, A.; Elibol, M.; Yanik, J. Characterization of products from hydrothermal carbonization of orange pomace including anaerobic digestibility of process liquor. Bioresour. Technol. 2015, 196, 35–42. [Google Scholar] [CrossRef] [PubMed]
- Berge, N.D.; Flora, J.R.V.; Drive, B.; Carolina, N. Energy Source Creation from Diverted Food Wastes via Hydrothermal Carbonization; Technical Report; Environmental Research and Education Foundation: Raleigh, NC, USA, 2015. [Google Scholar]
- Berge, N.D.; Li, L.; Flora, J.R.V.; Ro, K.S. Assessing the environmental impact of energy production from hydrochar generated via hydrothermal carbonization of food wastes. Waste Manag. 2015, 43, 203–217. [Google Scholar] [CrossRef] [PubMed]
- Lu, X.; Jordan, B.; Berge, N.D. Thermal conversion of municipal solid waste via hydrothermal carbonization: Comparison of carbonization products to products from current waste management techniques. Waste Manag. 2012, 32, 1353–1365. [Google Scholar] [CrossRef] [PubMed]
- Tassini, C.; Romero, R.; Escobar, M.; Gordon, A.; Flores, M. Development of an analytical method for the main organic compounds derived from thermochemical conversion of biomass. J. Chil. Chem. Soc. 2016, 61, 2837–2842. [Google Scholar] [CrossRef]
- Knezevic, D.; Van Swaaij, W.P.M.; Kersten, S.R.A. Hydrothermal Conversion of Biomass: I, Glucose Conversion in Hot Compressed Water. Ind. Eng. Chem. Res. 2009, 48, 4731–4743. [Google Scholar] [CrossRef]
- Sevilla, M.; Fuertes, A.B. The production of carbon materials by hydrothermal carbonization of cellulose. Carbon 2009, 47, 2281–2289. [Google Scholar] [CrossRef]
- Singh, K.; Sivanandan, L. Hydrothermal carbonization of spent osmotic solution (sos) generated from osmotic dehydration of blueberries. Agriculture 2014, 4, 239–259. [Google Scholar] [CrossRef]
- ASTM D5142-09, Standard Test Methods for Proximate Analysis of the Analysis Sample of Coal and Coke by Instrumental ProcASTM D5142-09; ASTM International: West Conshohocken, PA, USA, 2009; Available online: www.astm.org (accessed on 12 January 2017).
- Gamgoum, R.; Dutta, A.; Santos, R.; Chiang, Y. Hydrothermal conversion of neutral sulfite semi-chemical red liquor into hydrochar. Energies 2016, 9, 435. [Google Scholar] [CrossRef]
- Kambo, H.S. Energy Densification of Lignocellulosic Biomass via Hydrothermal Carbonization and Torrefaction. Ph.D. Thesis, University of Guelph, Guelph, ON, Canada, 2014. [Google Scholar]
- Funke, A.; Ziegler, F. Hydrothermal carbonization of biomass: A summary and discussion of chemical mechanisms for process engineering. Biofuels Bioprod. Biorefin. 2010, 4, 160–177. [Google Scholar] [CrossRef]
- Khan, A.A.; de Jong, W.; Jansens, P.J.; Spliethoff, H. Biomass combustion in fluidized bed boilers: Potential problems and remedies. Fuel Process. Technol. 2009, 90, 21–50. [Google Scholar] [CrossRef]
- Liu, Z.; Quek, A.; Kent Hoekman, S.; Balasubramanian, R. Production of solid biochar fuel from waste biomass by hydrothermal carbonization. Fuel 2013, 103, 943–949. [Google Scholar] [CrossRef]
- Basso, D.; Weiss-Hortala, E.; Patuzzi, F.; Castello, D.; Baratieri, M.; Fiori, L. Hydrothermal carbonization of off-specification compost: A byproduct of the organic municipal solid waste treatment. Bioresour. Technol. 2015, 182, 217–224. [Google Scholar] [CrossRef] [PubMed]
- Demirbas, A. Relationships proximate analysis results and higher heating values of lignites. Energy Sources Part A Recover. Util. Environ. Eff. 2008, 30, 1876–1883. [Google Scholar] [CrossRef]
- Mumme, J.; Eckervogt, L.; Pielert, J.; Diakité, M.; Rupp, F.; Kern, J. Hydrothermal carbonization of anaerobically digested maize silage. Bioresour. Technol. 2011, 102, 9255–9260. [Google Scholar] [CrossRef] [PubMed]
- Dinjus, E.; Kruse, A.; Tröger, N. Hydrothermal carbonization-1. Influence of lignin in lignocelluloses. Chem. Eng. Technol. 2011, 34, 2037–2043. [Google Scholar] [CrossRef]
- Kambo, H.S.; Dutta, A. Comparative evaluation of torrefaction and hydrothermal carbonization of lignocellulosic biomass for the production of solid biofuel. Energy Convers. Manag. 2015, 105, 746–755. [Google Scholar] [CrossRef]
- Yao, C.; Shin, Y.S.; Wang, L.-Q.; Windisch, C.F.; Samuels, W.D.; Arey, B.W.; Wang, C.M.; Risen, W.M.; Exarhos, G.J. Hydrothermal Dehydration of Aqueous Fructose Solutions in a Closed System. J. Phys. Chem. C. 2007, 111, 15141–15145. [Google Scholar] [CrossRef]
- Pruksakit, W.; Patumsawad, S. Hydrothermal carbonization (htc) of sugarcane stranded: Effect of operation condition to hydrochar production. Energy Procedia 2016, 100, 223–226. [Google Scholar] [CrossRef]
- Sousa, E.C.; Uchôa-Thomaz, A.M.A.; Carioca, J.O.B.; de Morais, S.M.; de Lima, A.; Martins, C.G.; Alexandrino, C.D.; Ferreira, P.A.T.; Rodrigues, A.L.M.; Rodrigues, S.P.; et al. Chemical composition and bioactive compounds of grape pomace (Vitis vinifera L.), Benitaka variety, grown in the semiarid region of Northeast Brazil. Food Sci. Technol. 2014, 34, 135–142. [Google Scholar] [CrossRef]
- Salgado, J.M.; Curte, F.; Mansi, D.N. Effect of gala apples (malus domestica borkh) on lipidemia of hyperlipidemic rats. Ciênc. Tecnol. Alimens 2008, 28, 477–484. [Google Scholar] [CrossRef]
- Sato, M.F.; Vieira, R.G.; Zardo, D.M.; Falcao, L.D.; Nogueira, A.; Wosiacki, G. Apple pomace from eleven cultivars: An approach to identify sources of bioactive compounds. Acta Sci. Agron. 2010, 32, 29–35. [Google Scholar]
- Wosiacki, G.; Sato, M.D.F.; Rigoni, D.C.; Canteri, M.H.G.; de Oliveira Petkowicz, C.L.; Nogueira, A. Chemical and instrumental characterization of pectin from dried pomace of eleven apple cultivars. Acta Sci. Agron. 2011, 33, 383–389. [Google Scholar] [CrossRef]
- Li, X.; Ma, B.; Xu, L.; Hu, Z.; Wang, X. Thermogravimetric analysis of the co-combustion of the blends with high ash coal and waste tyres. Thermochim. Acta 2006, 441, 79–83. [Google Scholar] [CrossRef]
© 2018 by the authors. Licensee MDPI, Basel, Switzerland. This article is an open access article distributed under the terms and conditions of the Creative Commons Attribution (CC BY) license (http://creativecommons.org/licenses/by/4.0/).