Article

Estimation of Load Pattern for Optimal Planning of Stand-Alone Microgrid Networks

1
Energy Technology Demonstration Division, Korea Institute of Energy Technology Evaluation and Planning, 114 Gil, 14 Teheran, Gangnam, Seoul 06175, Korea
2
Department of Electrical Engineering, Konkuk University, 120 Neungdong, Gwangjin, Seoul 05029, Korea
*
Author to whom correspondence should be addressed.
Energies 2018, 11(8), 2012; https://doi.org/10.3390/en11082012
Submission received: 17 July 2018 / Revised: 30 July 2018 / Accepted: 1 August 2018 / Published: 2 August 2018
(This article belongs to the Section A: Sustainable Energy)

Abstract

:
This paper proposes a method for estimating the load pattern for optimal planning of stand-alone renewable microgrids and verifies when the basic data for microgrid design are limited. To estimate a proper load pattern for optimal microgrid design when the data obtained in advance are insufficient, the least squares method is used to compare the similarity of annual power consumption between the subject area and eight islands in Korea whose actual load patterns were previously obtained. Similarity is compared in terms of annual (every month), seasonal, bi-monthly, and monthly averages. To verify the validity of the proposed estimation method, the applied proposed estimation method is used for two islands that have already installed a microgrid consisting of photovoltaic, wind power, energy storage systems, and diesel generators. In comparing the actual data from the two islands, the costs of electricity in terms of microgrid operations show improvements of 37.2% and 29.8%, respectively.

1. Introduction

With recent concerns regarding large-scale centralized power supply systems using fossil fuels, such as non-sustainability, safety, environmental pollution, and accelerating climate change, new technologies are being developed to replace existing fossil fuels [1]. In addition, the massive power outages in September 2011 in Korea have forced us to revise the large-scale, centralized power production and supply plans that have been typical. Without a plan to control peak power consumption through demand management, there is widespread recognition that there are limits to stabilizing the power network through supply expansion and that there is a need for a shift in policy direction.
The most effective form of policy shift from this expansion of centralized power supply toward distributed power, focusing on improvement in efficiency and demand management, is a microgrid, which connects renewable energy sources such as solar power, wind power, and energy storage systems (ESSs). As solar and wind power generation are complementary to each other in this microgrid, effective power production and load response are possible [2,3].
Although wind and solar power generation take the form of complementary power sources, the introduction of an ESS is essential in the construction and operation of a microgrid. Usually, the larger the energy storage capacity, the higher the price, so it is important to determine the installation capacity of the new renewable energy generation system and ESSs considering local climate and load conditions in the installation area [4]. The imbalance between energy production and demand caused by a faulty design of energy systems, such as a microgrid, makes it difficult to install optimized system capacity, thus increasing the energy production costs [5,6]. A microgrid design based on incorrect or limited information could result in excess design or even several newly constructed (and somewhat useless) facilities, which can result in significant losses in the form of cost and duration of facility construction [7]. In this study, methodologies were developed to enhance the reliability of the overall system design by supplementing the low accuracy of basic information with assistance of big data treatment in the design of a stand-alone microgrid comprising renewable energy sources and ESS. To reflect the difficulty of obtaining the necessary information in the design of a microgrid, a system with an interdisciplinary integration convergence system was designed using limited information involving load patterns of eight Korean islands for the first time. In the literature, there is only one study on a method for estimating load patterns using an existing load pattern [8]. In this previous study, it was possible to design microgrid only if the detailed and diverse load pattern data of various components in the microgrid (home, school, commercial facility, public facility, etc.) were sufficiently detailed. This paper, however, proposes a method of designing a microgrid using limited data based only on the monthly power generation of the island. The load estimation method in this study is expected to reduce power generation costs by optimizing the design of a microgrid on an island area through a simple process based only on the monthly power generation of the island. In addition, several case applications are used to validate the newly proposed method.

2. Estimation of Load Pattern of Stand-Alone Microgrid

When building a microgrid with new and renewable energy sources, diesel generators, and ESS in an island area, the only design data related to electrical load available in advance is the power consumption listed on the monthly bill. Regarding power generation of renewable energy, insolation and wind data provided by the Korea Meteorological Administration (KMA) are used. Although it is natural to ensure that the basic data are precise for the stable design of a microgrid system, in reality, it could not be infinitely enhanced. However, at least one hour of data must be available. The solar generator, wind generator, and ESS capacity are designed considering the operation schedule of the configuration-operated plant using the limited information [9].

2.1. Review of Existing Stand-Alone Microgrid Design Cases

Through the content of the business plan used to carry out government-supported projects that supersedes some parts of power standards of domestic islands by using renewable sources and ESS, we analyzed the existing modeling methods. The target island is A, which is located in the South Sea. The basic data obtained for the design include geographical data (such as longitude and latitude), weather data (such as average daily solar radiation and average monthly wind speed), power consumption data (such as maximum and average power), number of power-bearing households, and population. Based on these limited data, when building an existing stand-alone microgrid without considering the load pattern, it is assumed that only about 50% of the total power generation is covered by renewable energy, the power deficit is covered using a previously installed diesel generator, and the ESS capacity provides power for 0.7 days in the event of bad weather.
However, the time and cost incurred by preliminary investigation and analysis, including the load pattern of the island, solar radiation, and wind speed, are relatively large compared to the project size. The existing microgrid design in domestic islands, where detailed data are not available, appears to have been designed in the above manner, which negatively affects the stability and economic feasibility of their power systems.

2.2. New Method for Estimating the Load Pattern of the Microgrid

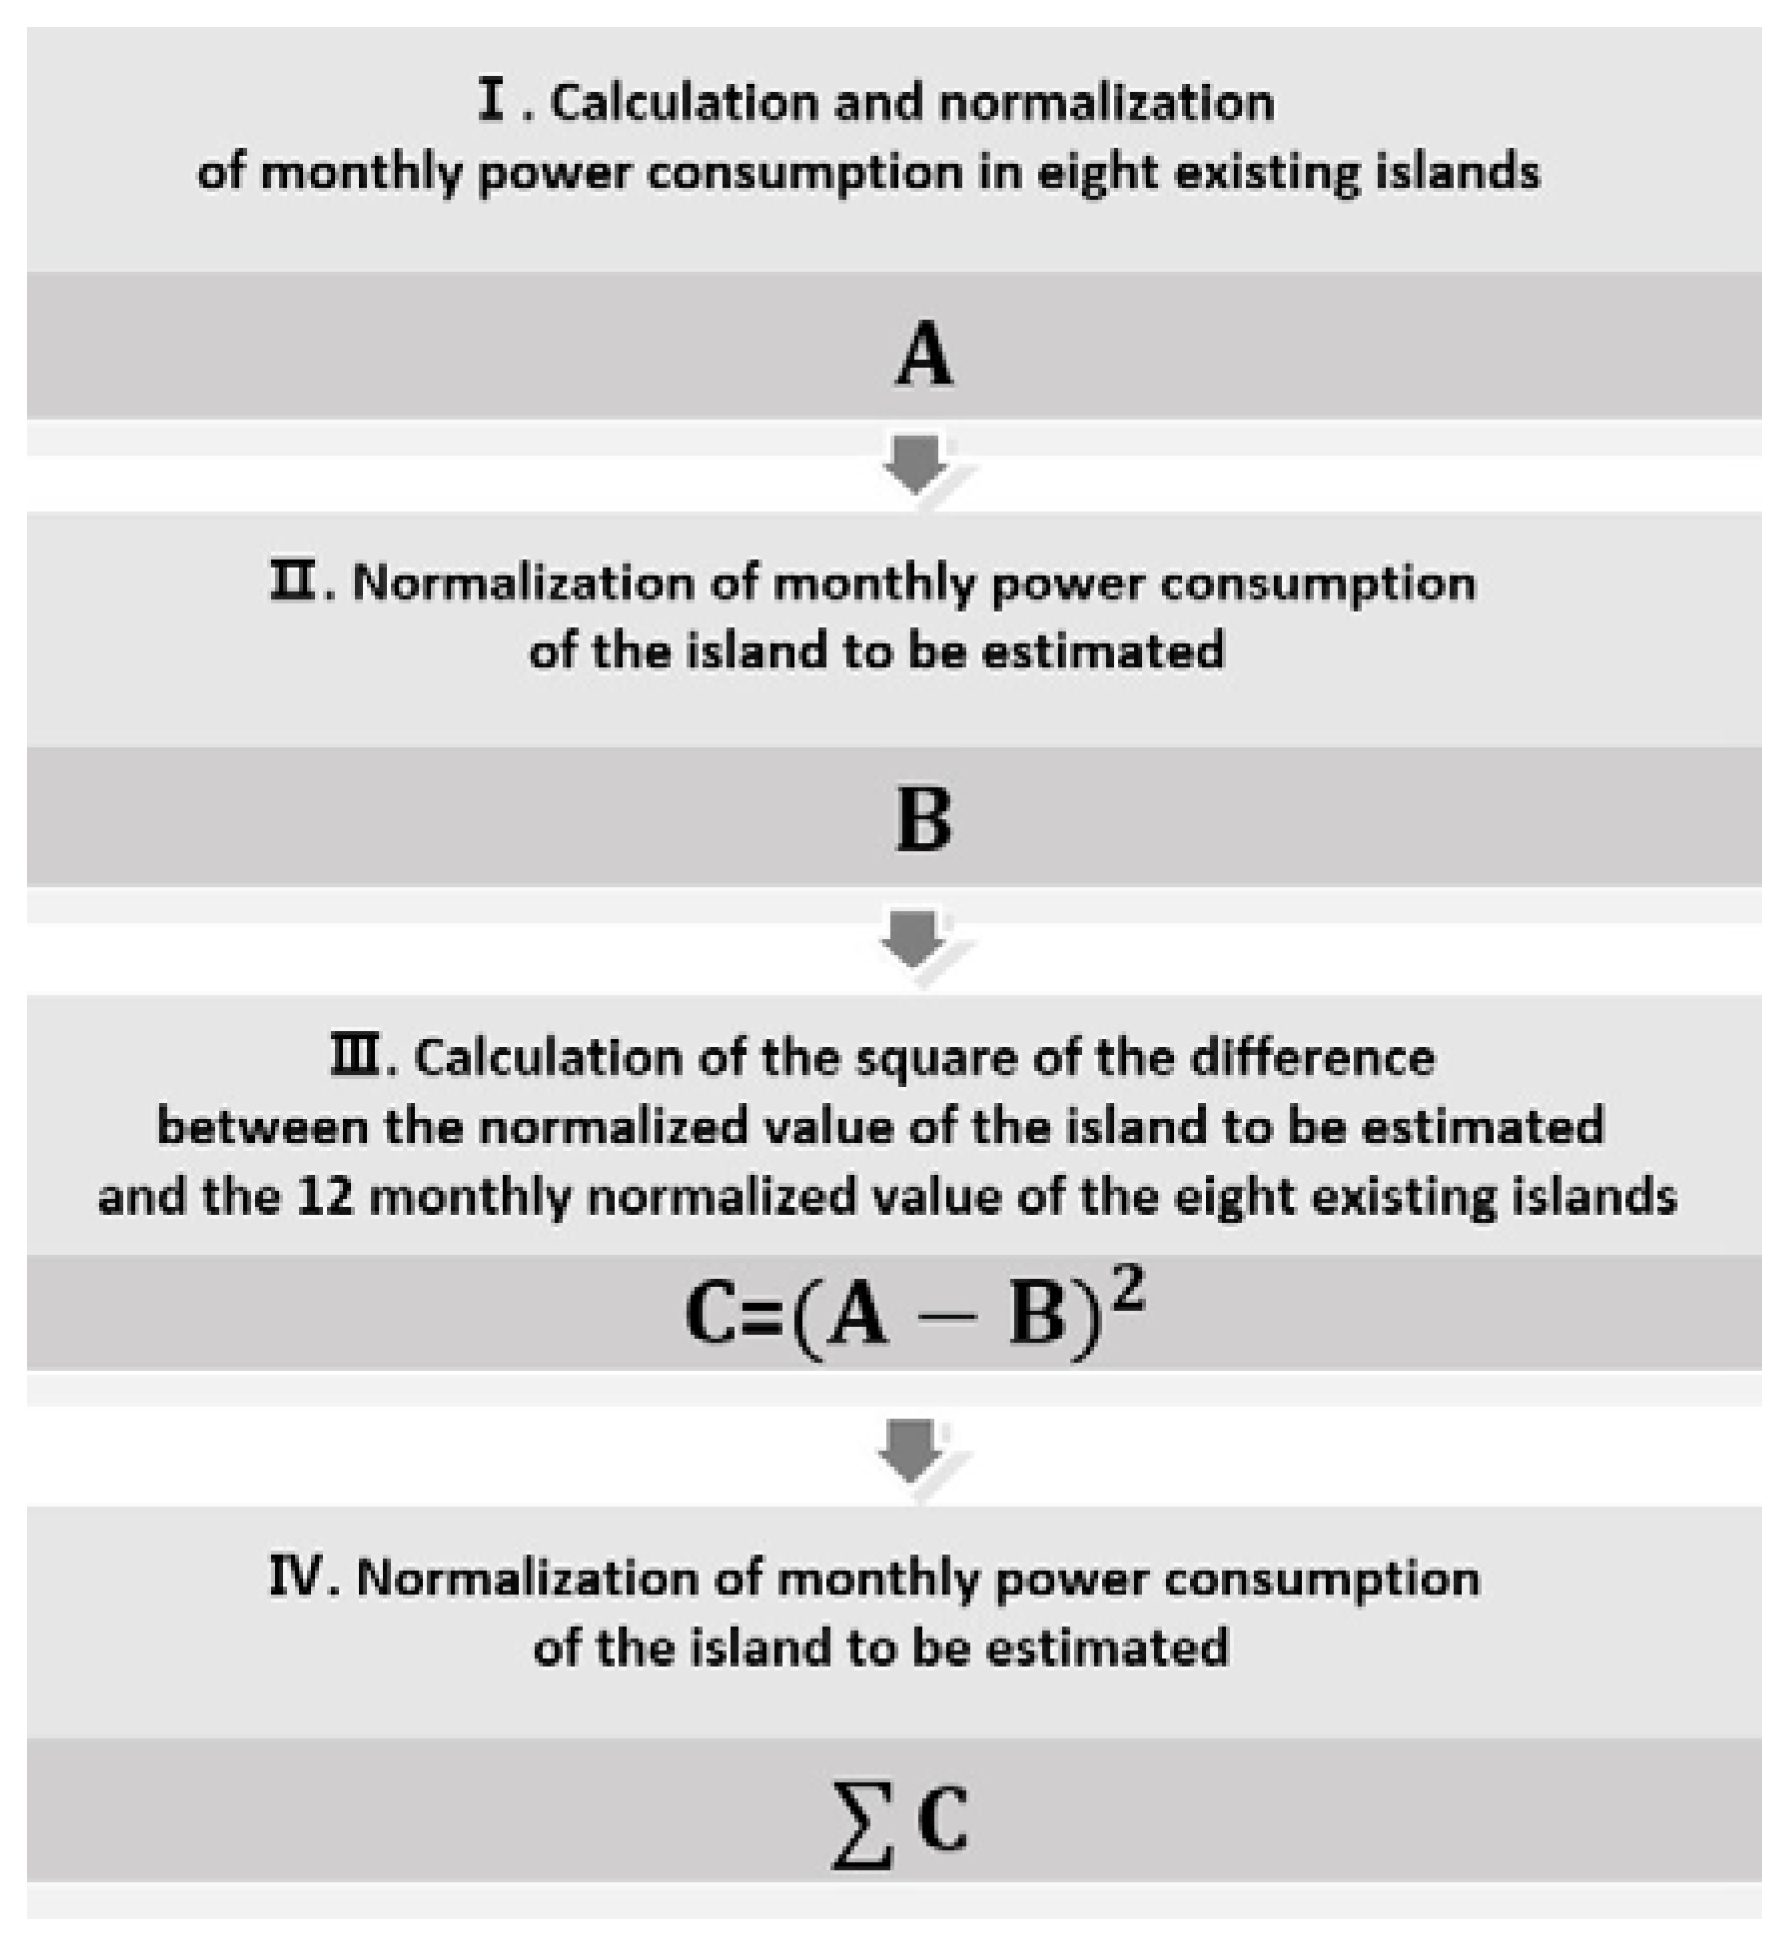
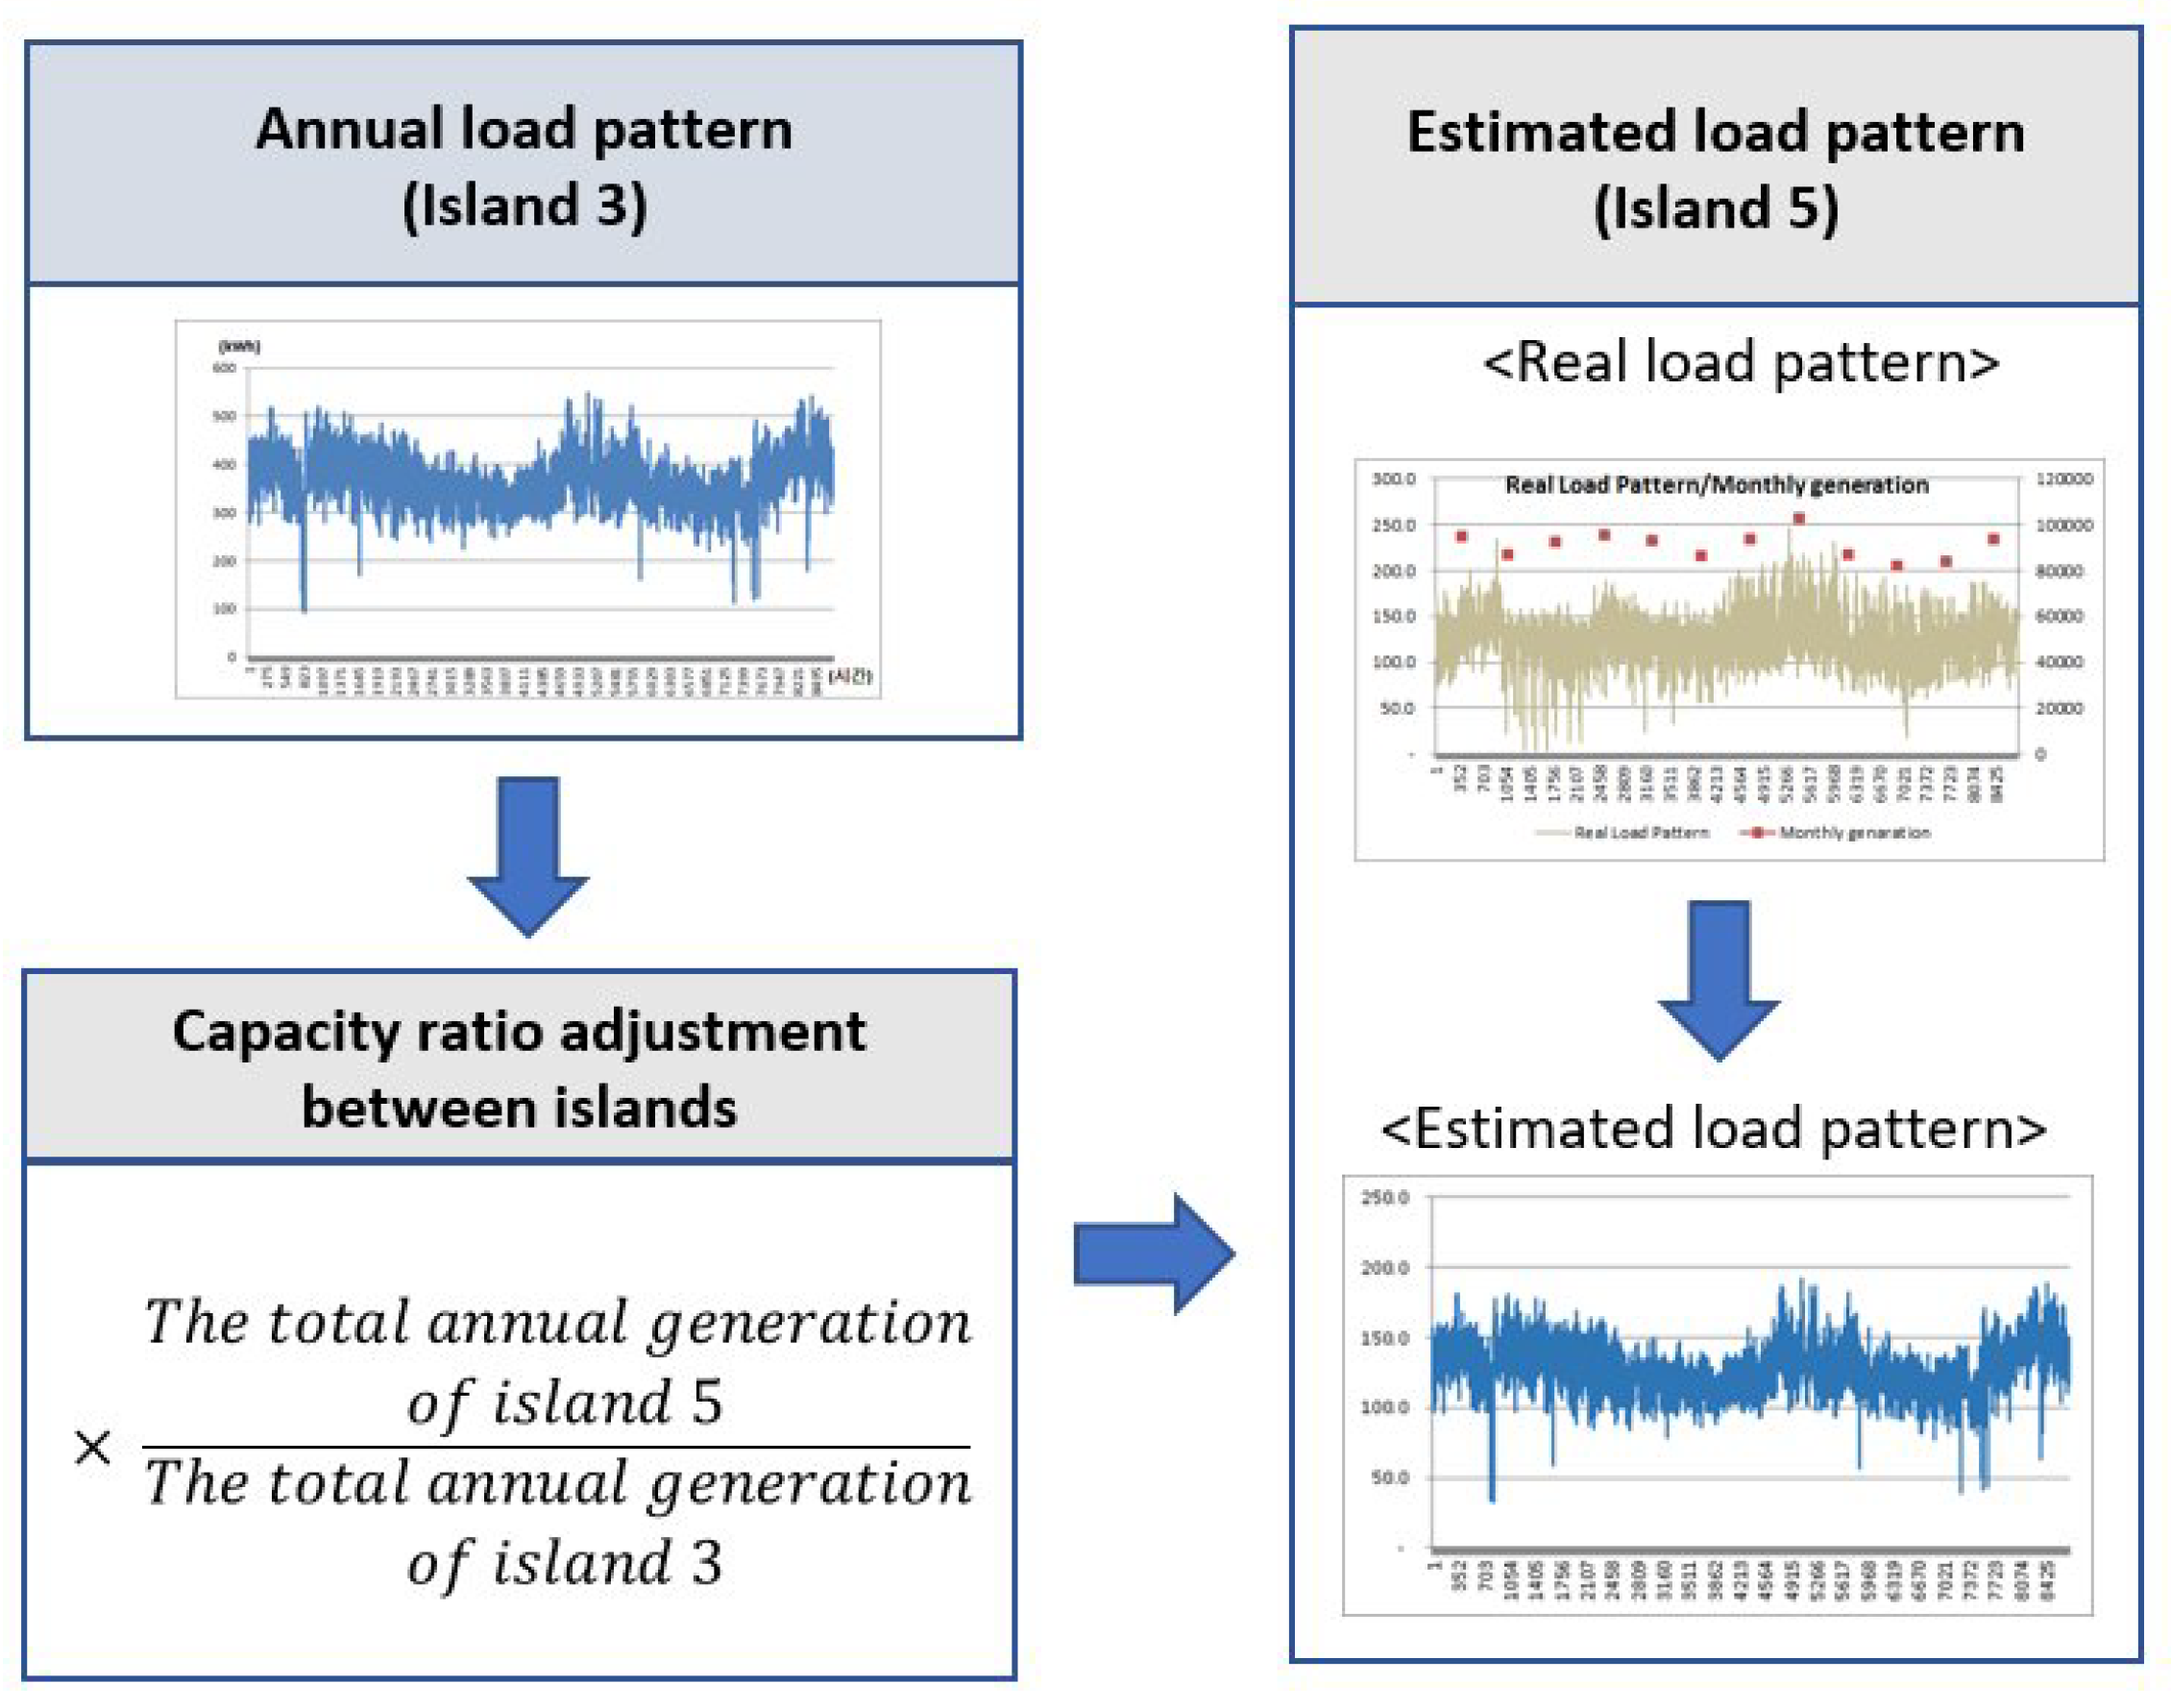
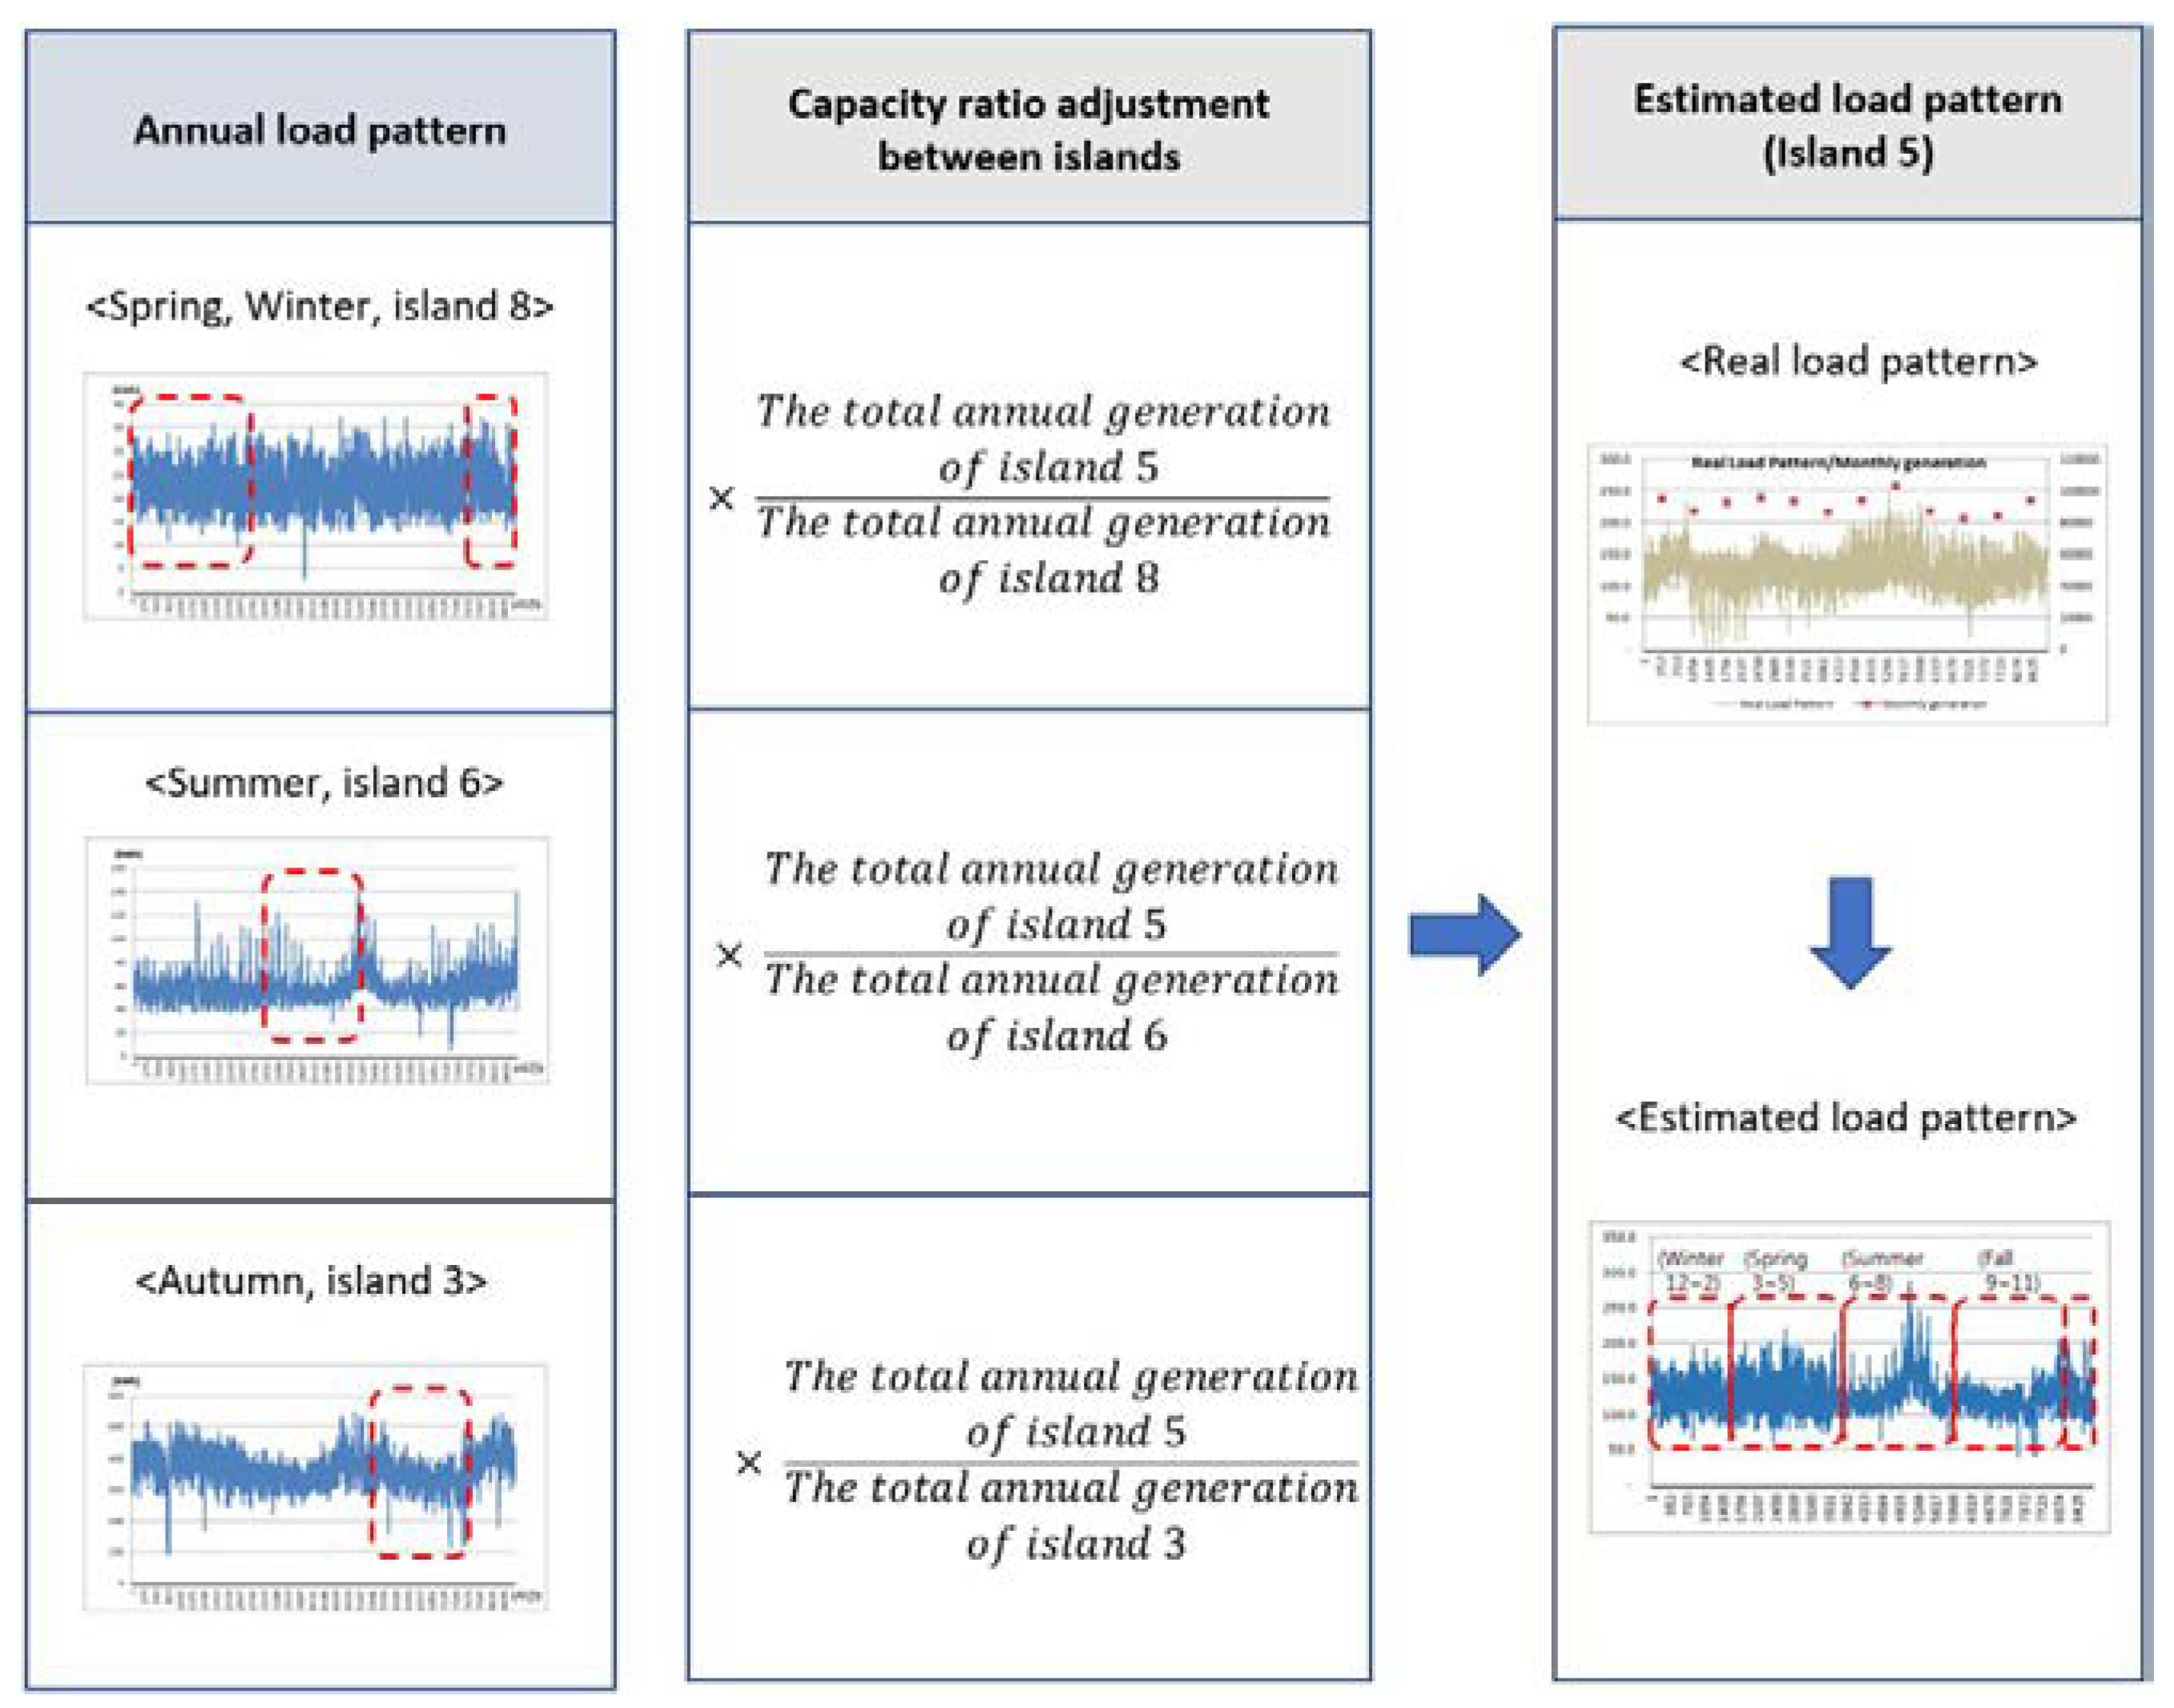
As stated above, to design a microgrid based on the limited data of power load, this paper proposes a new method to estimate the load pattern using existing load pattern data to improve reliability. The basic assumption of the estimation method of the load pattern is that if the generation pattern is similar, such as monthly or seasonal, then the hourly load pattern will also be similar. The background for this assumption is that most islands in Korea, except in special cases such as Jeju Island (tourism) and Geoje Island (shipbuilding), are highly likely to have similar patterns of lifestyle, such as fishing or a combination of agriculture and fishing, so there will be similarities in monthly or seasonal power usage patterns depending on the crops or fishing species, and there should be similarity in hourly load patterns. In this study, the most realistic estimation method is found by comparing the homogeneity of the pattern of annual (every month), seasonal, bi-monthly, and average monthly generation.
Based on the steps for estimating power load, the estimated load pattern is created assuming that only the amount of power used per island (eight existing islands) is known. By comparing the estimated load pattern with the actual load pattern on an island, the similarity in load patterns is verified statistically according to the estimation method. In addition, the optimal design method is confirmed by comparing the design results of a microgrid system reflecting the estimated load patterns produced by the new estimation method, with the similarities between the design results reflecting the actual load patterns. Finally, from an economic standpoint, by comparing the results obtained from estimating the new load pattern for the microgrids on islands, which have already been designed and deployed with the degree of optimization, the improvement performance of the optimal design through the new load pattern estimation is identified.
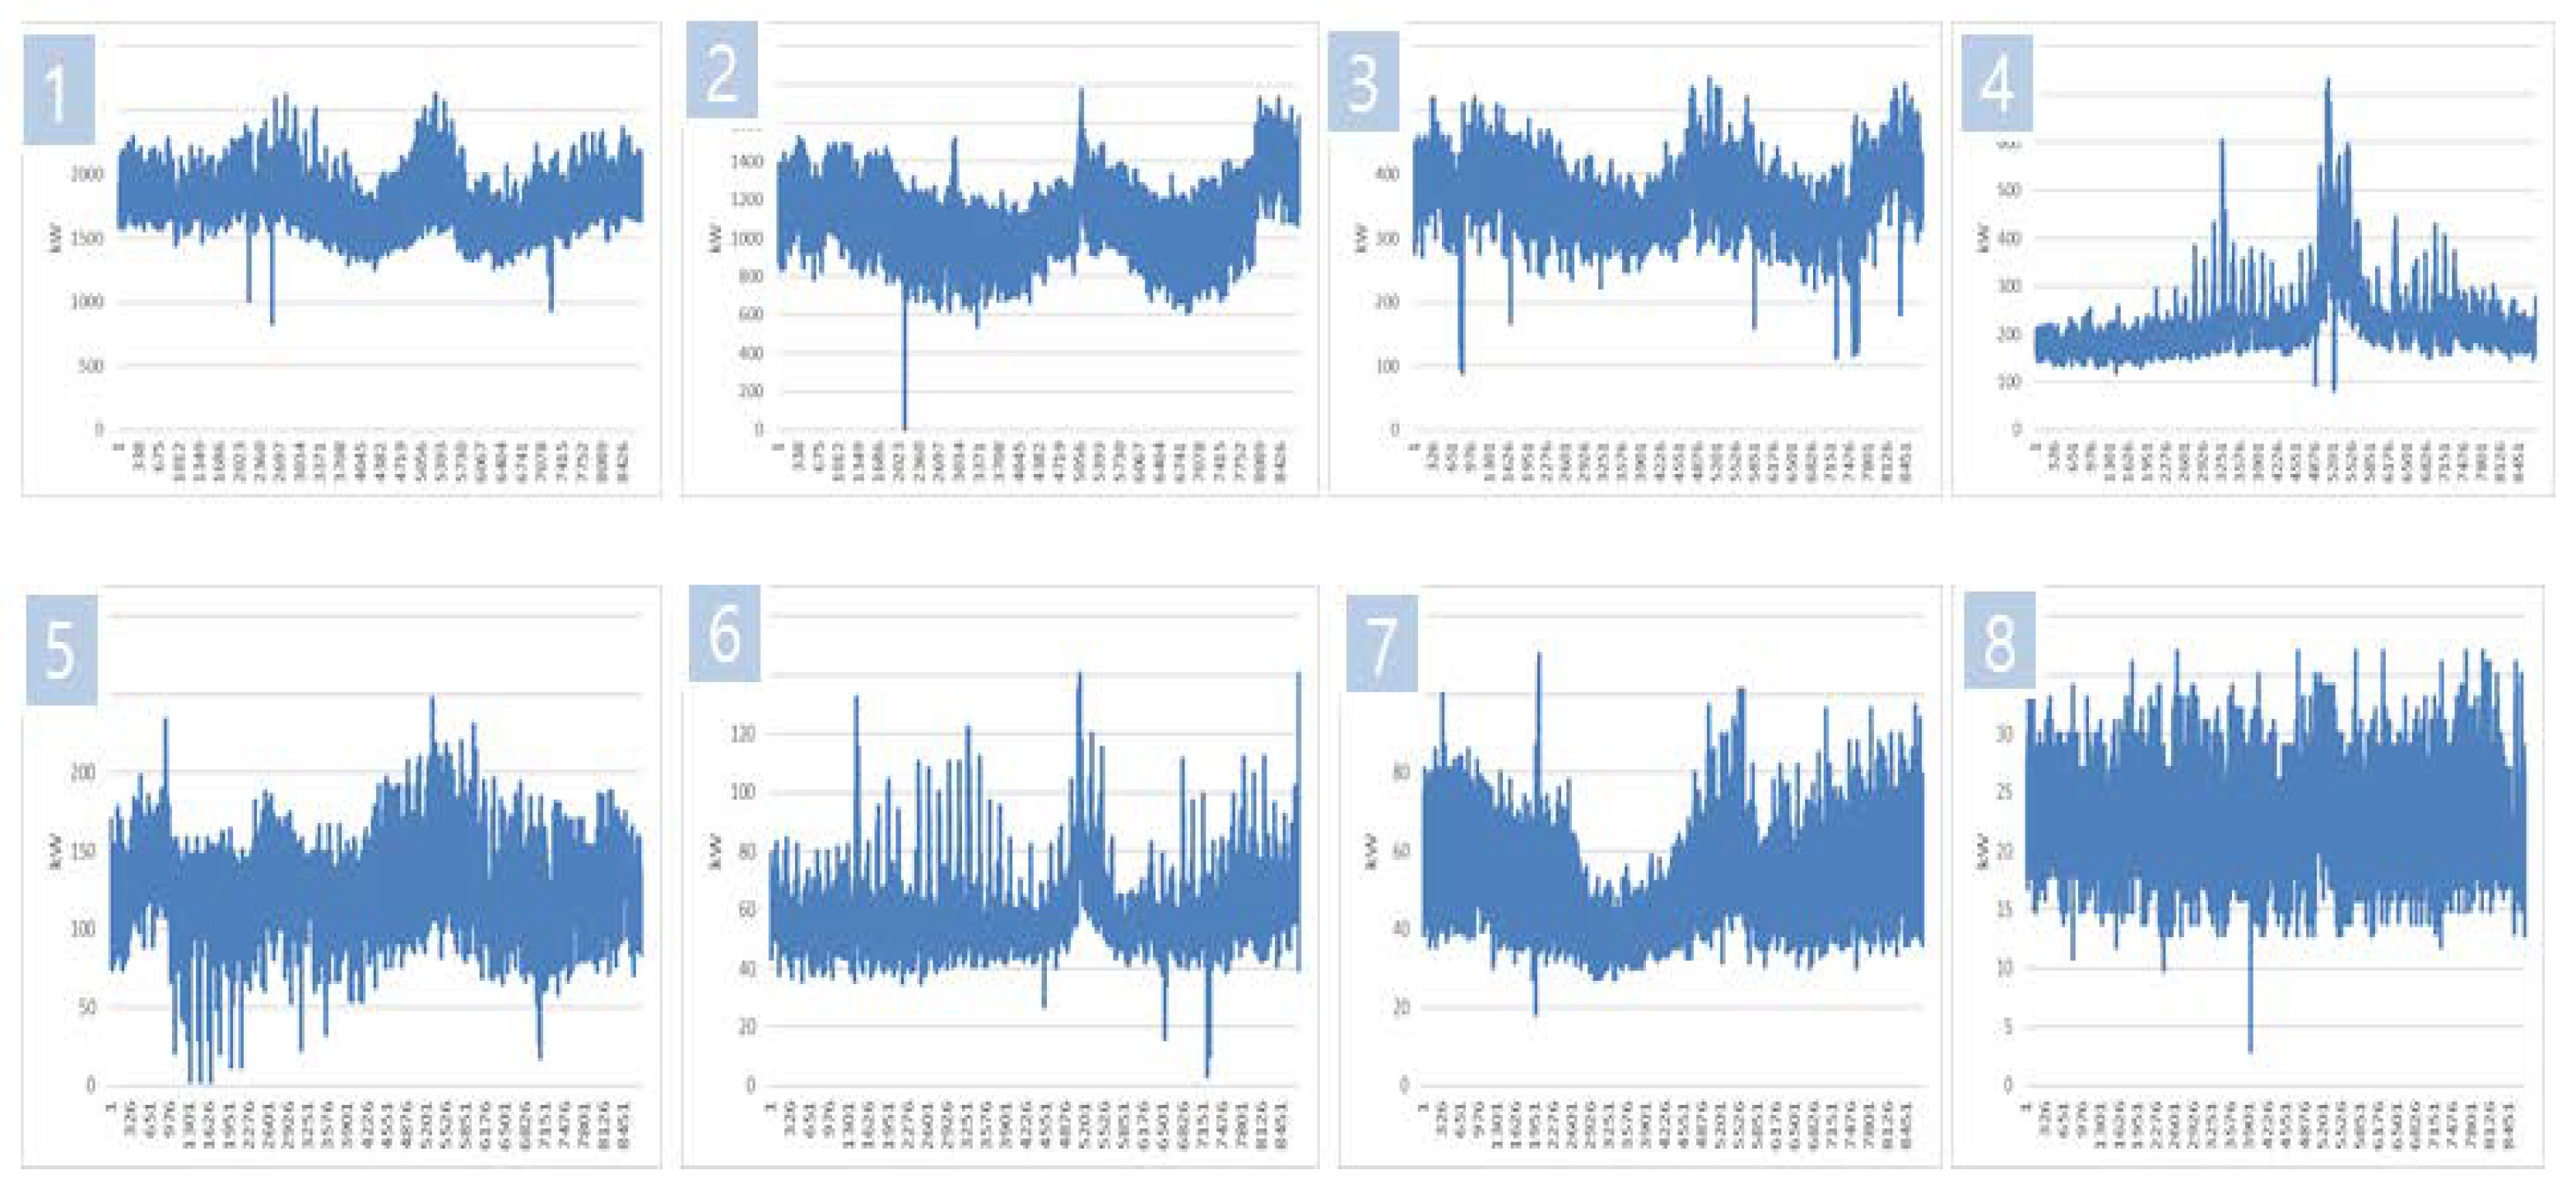
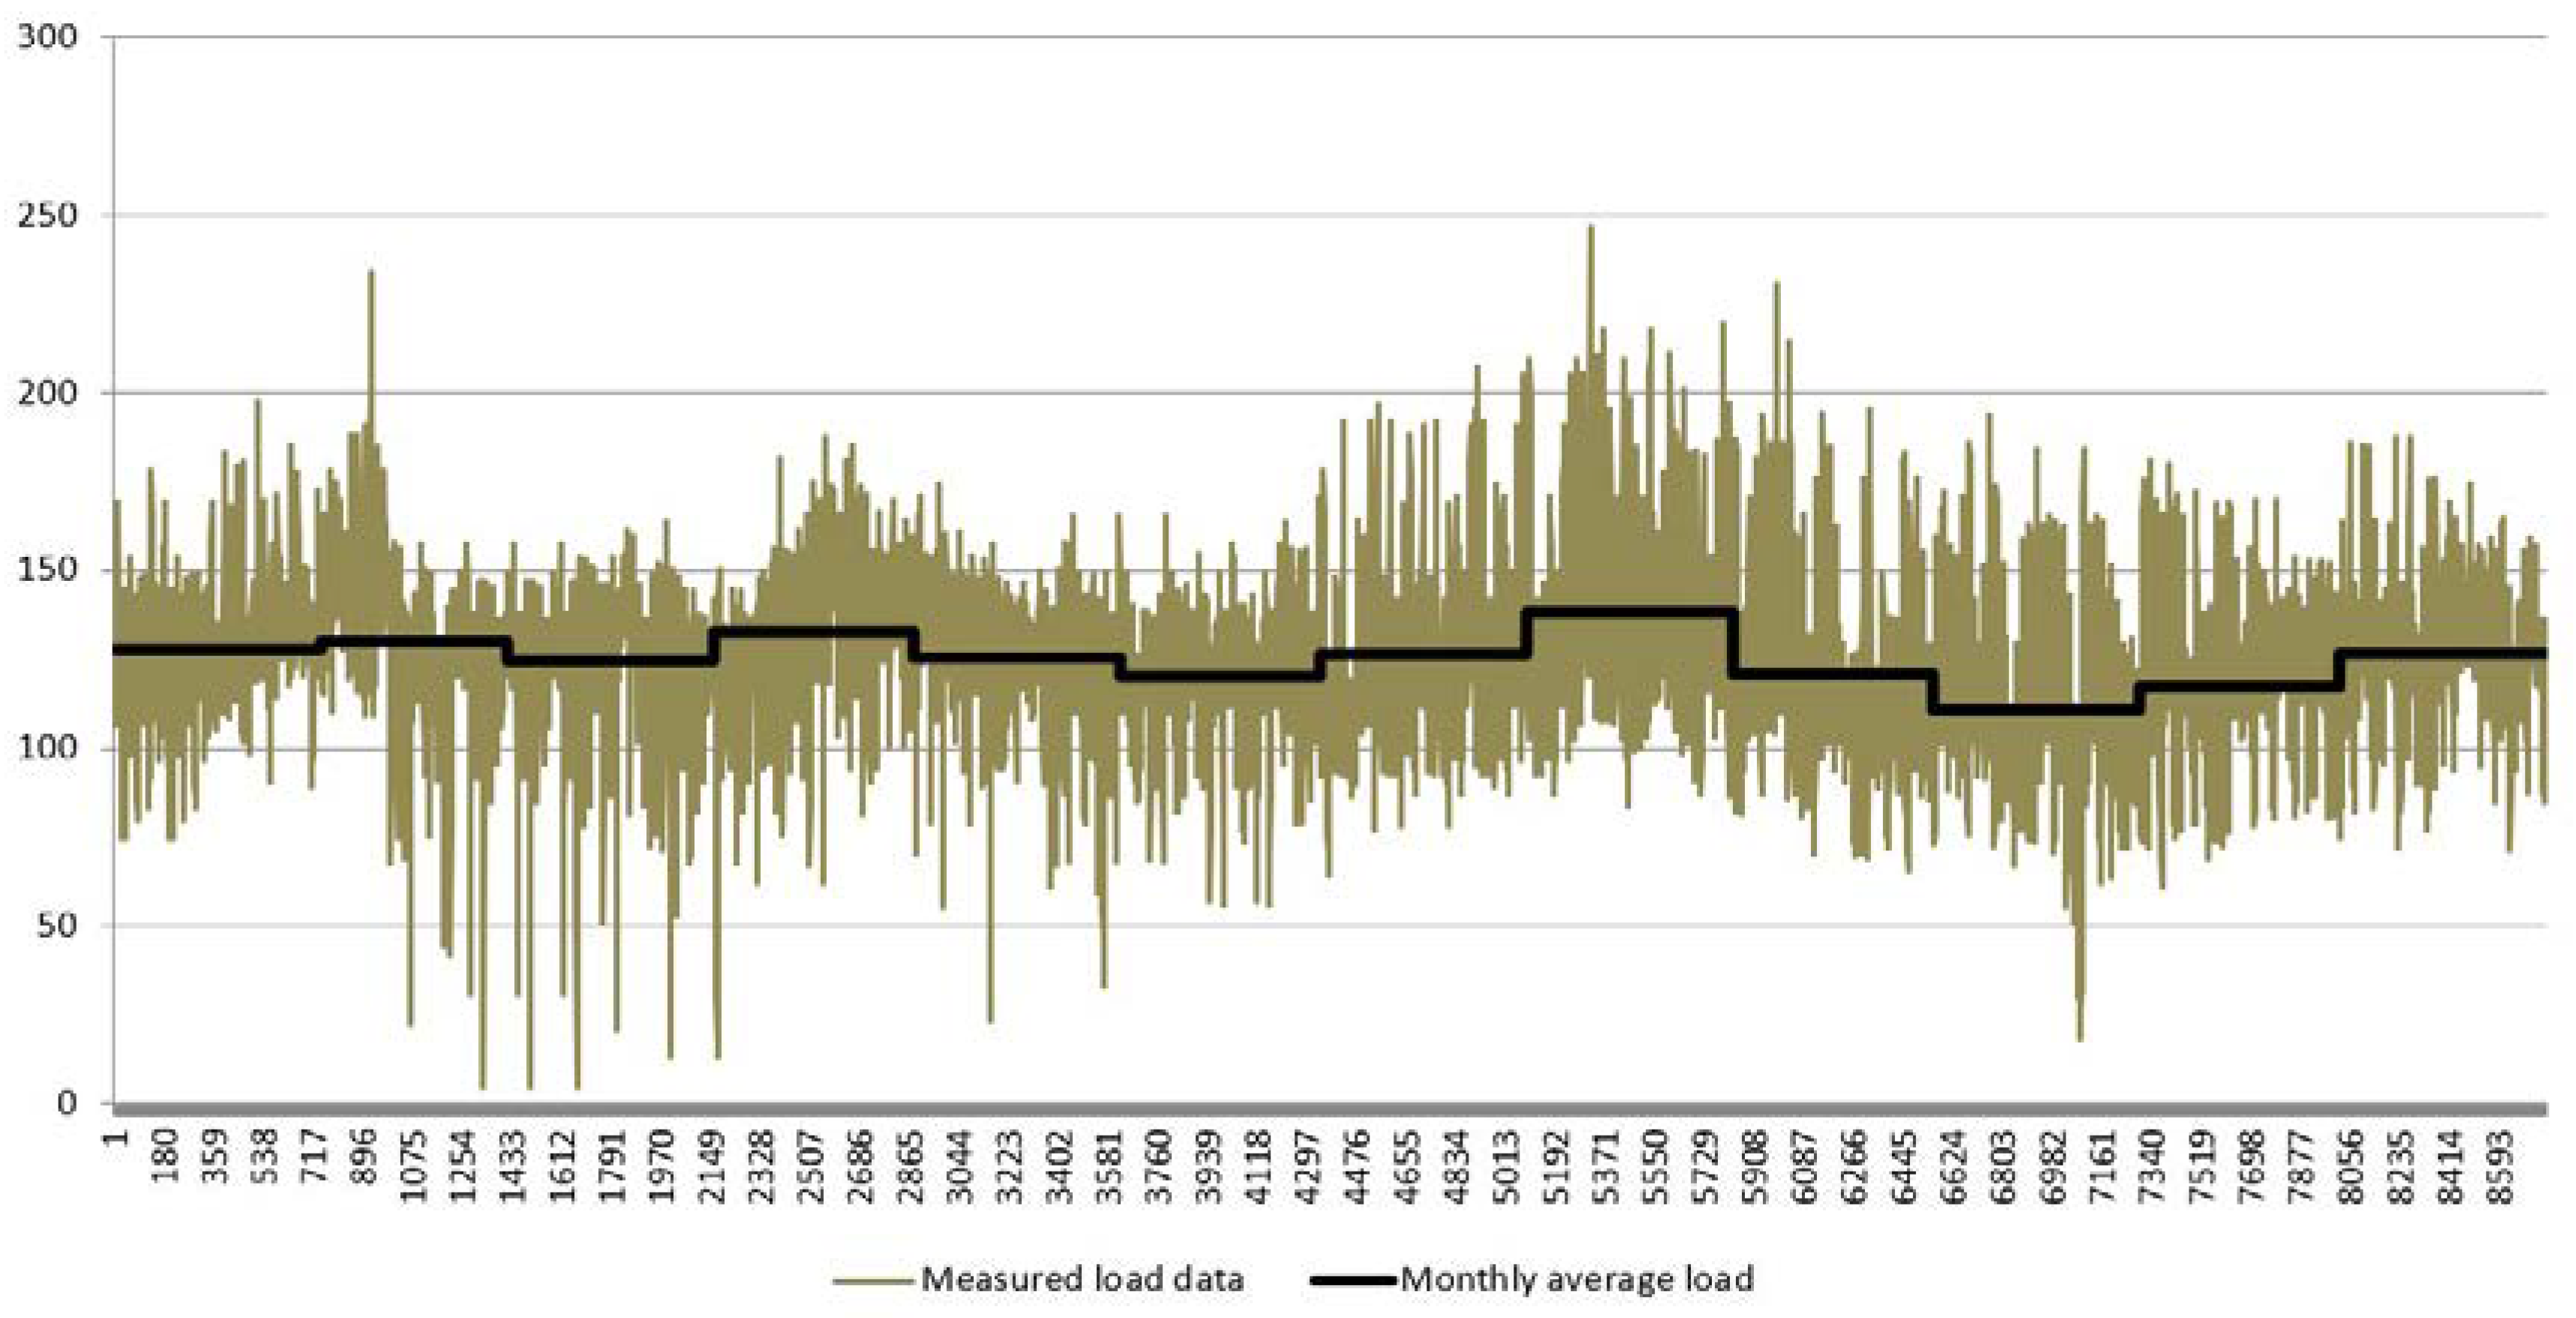
The annual (8760 h) power generation of the eight islands is summarized in Table 1, representing a small island with power generation of 20 kW per hour to a large island with power generation of 2 MW per hour, as shown in Figure 1. As each island has an independent power source involving only diesel generators, it is assumed that the power generated per hour is the power consumed each hour. In the eight islands, except for Islands 4 and 6, the annual power usage is relatively stable, and the power peak is not remarkable. On the other hand, power consumption for Islands 4 and 6 is concentrated at a specific time or a power peak is much larger than the average power consumption. Unevenness of power consumption and power peak in the period is the main cause limiting the expansion of renewable energy resources.

2.3. Load Pattern Estimation Steps and Method

The steps for estimating the annual hourly power pattern for any island for which only the monthly power consumption is known are given in Figure 2. However, in Step 3, of the eight existing islands, the island having the most significant difference in power generation is to be excluded from the comparison based on the empirical judgement that the load pattern is very different.

2.3.1. Calculation and Normalization of Monthly Power Consumption in Eight Existing Islands

The monthly power consumption, which is added up from hourly power generation (power consumption), is shown in Figure 3. To compare each island, regardless of the amount of power consumption, the normalized monthly power consumption, which is equal to the monthly power consumption divided by the total annual power consumption on each island, is considered, as shown in Figure 4.

2.3.2. Normalization of Monthly Power Consumption of the Island to Be Estimated

Monthly normalized values can be obtained from the process described in Section 2.3.1 above, using the power consumption indicated on the monthly bill for estimating the load patterns of any island. To verify the reliability of the estimation method of the load pattern proposed in this paper, assuming that each of the eight existing islands is a random one, the remaining seven islands will be used to estimate the load pattern of one unknown island and check the similarity. First, it is assumed that Island 5 is a random island and its load pattern is to be determined.

2.3.3. Calculation of the Square of the Difference between the Normalized Value of the Island to Be Estimated and the Monthly Normalized Value of the Eight Existing Islands

To estimate the load pattern for any island, the most similar load patterns are selected using the method of least squares, based on the previous electrical loads of all islands. The method of least squares is a statistical method based on the measured values, where a suitable sum of squares is created and the values that minimize it are taken for processing [10]. To select the most similar pattern using the method of least squares, the squares of the difference between the normalized value of the monthly power consumption of the eight islands, obtained in Section 2.3.1, and the normalized value of the monthly power consumption of Island 5, estimated in Section 2.3.2, are shown in Figure 5. Then, Island 1, which has the largest gap in the total annual power generation and is expected to have quite different load pattern from the target island, and Island 5 (oneself), which is assumed to be random, are excluded.

2.3.4. Calculation of the Total Value for a Given Period

(1) Estimation of annual comparison
Based on the least squares method, Island 5’s value is normalized to zero for analysis purposes. The annual comparison estimation indicates that Island 3, which is the island with the lowest total value in Figure 5, is the most similar to Island 5, whose load pattern is to be estimated. Accordingly, the annual load pattern of Island 5 is estimated using that of Island 3. By multiplying the annual load pattern of Island 3 with the ratio of the total annual power generation size of Island 3 and Island 5, the annual load pattern of Island 5 can be obtained. This process is described in Figure 6.
(2) Estimation of seasonal (3-month) comparison
The values shown in Table 1 are summed in Table 2 for each season (Spring: March to May, Summer: June to August, Autumn: September to November, Winter: December to February). The corresponding period load pattern for the islands with the lowest values for each unit period is used to estimate the corresponding period load pattern for Island 5 (to be estimated). The absolute size is adjusted by multiplying the ratio of the total annual generation of the selected and estimated island by unit period. The steps and method of estimating are described in Figure 7. While the estimation method for the annual (every month) period selects the island with the lowest sum of the squares for 12 months, that for three months (seasonal) selects the corresponding islands with the lowest sum of the squares for each unit period.
(3) Estimation of monthly comparison
Similar to the above seasonal (every three months) load estimation steps and methods, the values shown in Table 1 are summed in Table 3 for two month periods (January–February, March–April, May–June, July–August, September–October, and November–December). The corresponding period load pattern for the islands with the lowest values for each unit period is used to estimate the corresponding period load pattern for Island 5 (to be estimated). The absolute size is adjusted by multiplying the ratio of the total annual generation of the selected and estimated islands by unit.
(4) Estimation of monthly average load consumption
The monthly average load consumption estimation, which is similar to the manner in which the monthly bills are issued, is the process of dividing the monthly generation into hours and converting it into the average generation per hour without any comparison. This is described in Figure 8.

2.3.5. Comparison between Load Pattern Estimation Results Using Estimation Method and Actual Load Pattern

A total of 32 load patterns are estimated using four methods on the annual load patterns of the eight existing islands. A comparison of similarities with the actual load pattern using the method of least squares, which is obtained by adding the sum of differences between load unit times, is shown in Table 4.
Because the method to add up the squares of the difference between the actual loads is used, the monthly average load consumption estimation is found to be the most similar in six islands. In the remaining two islands, the bi-monthly and annual (every month) estimation methods are the most similar. This results by examining the similarity in the form of the estimated load pattern, so that the results of the microgrid design using the respective estimated load pattern can be analyzed and finally be presented in this paper.

2.4. Microgrid Design Using Estimated Load Pattern

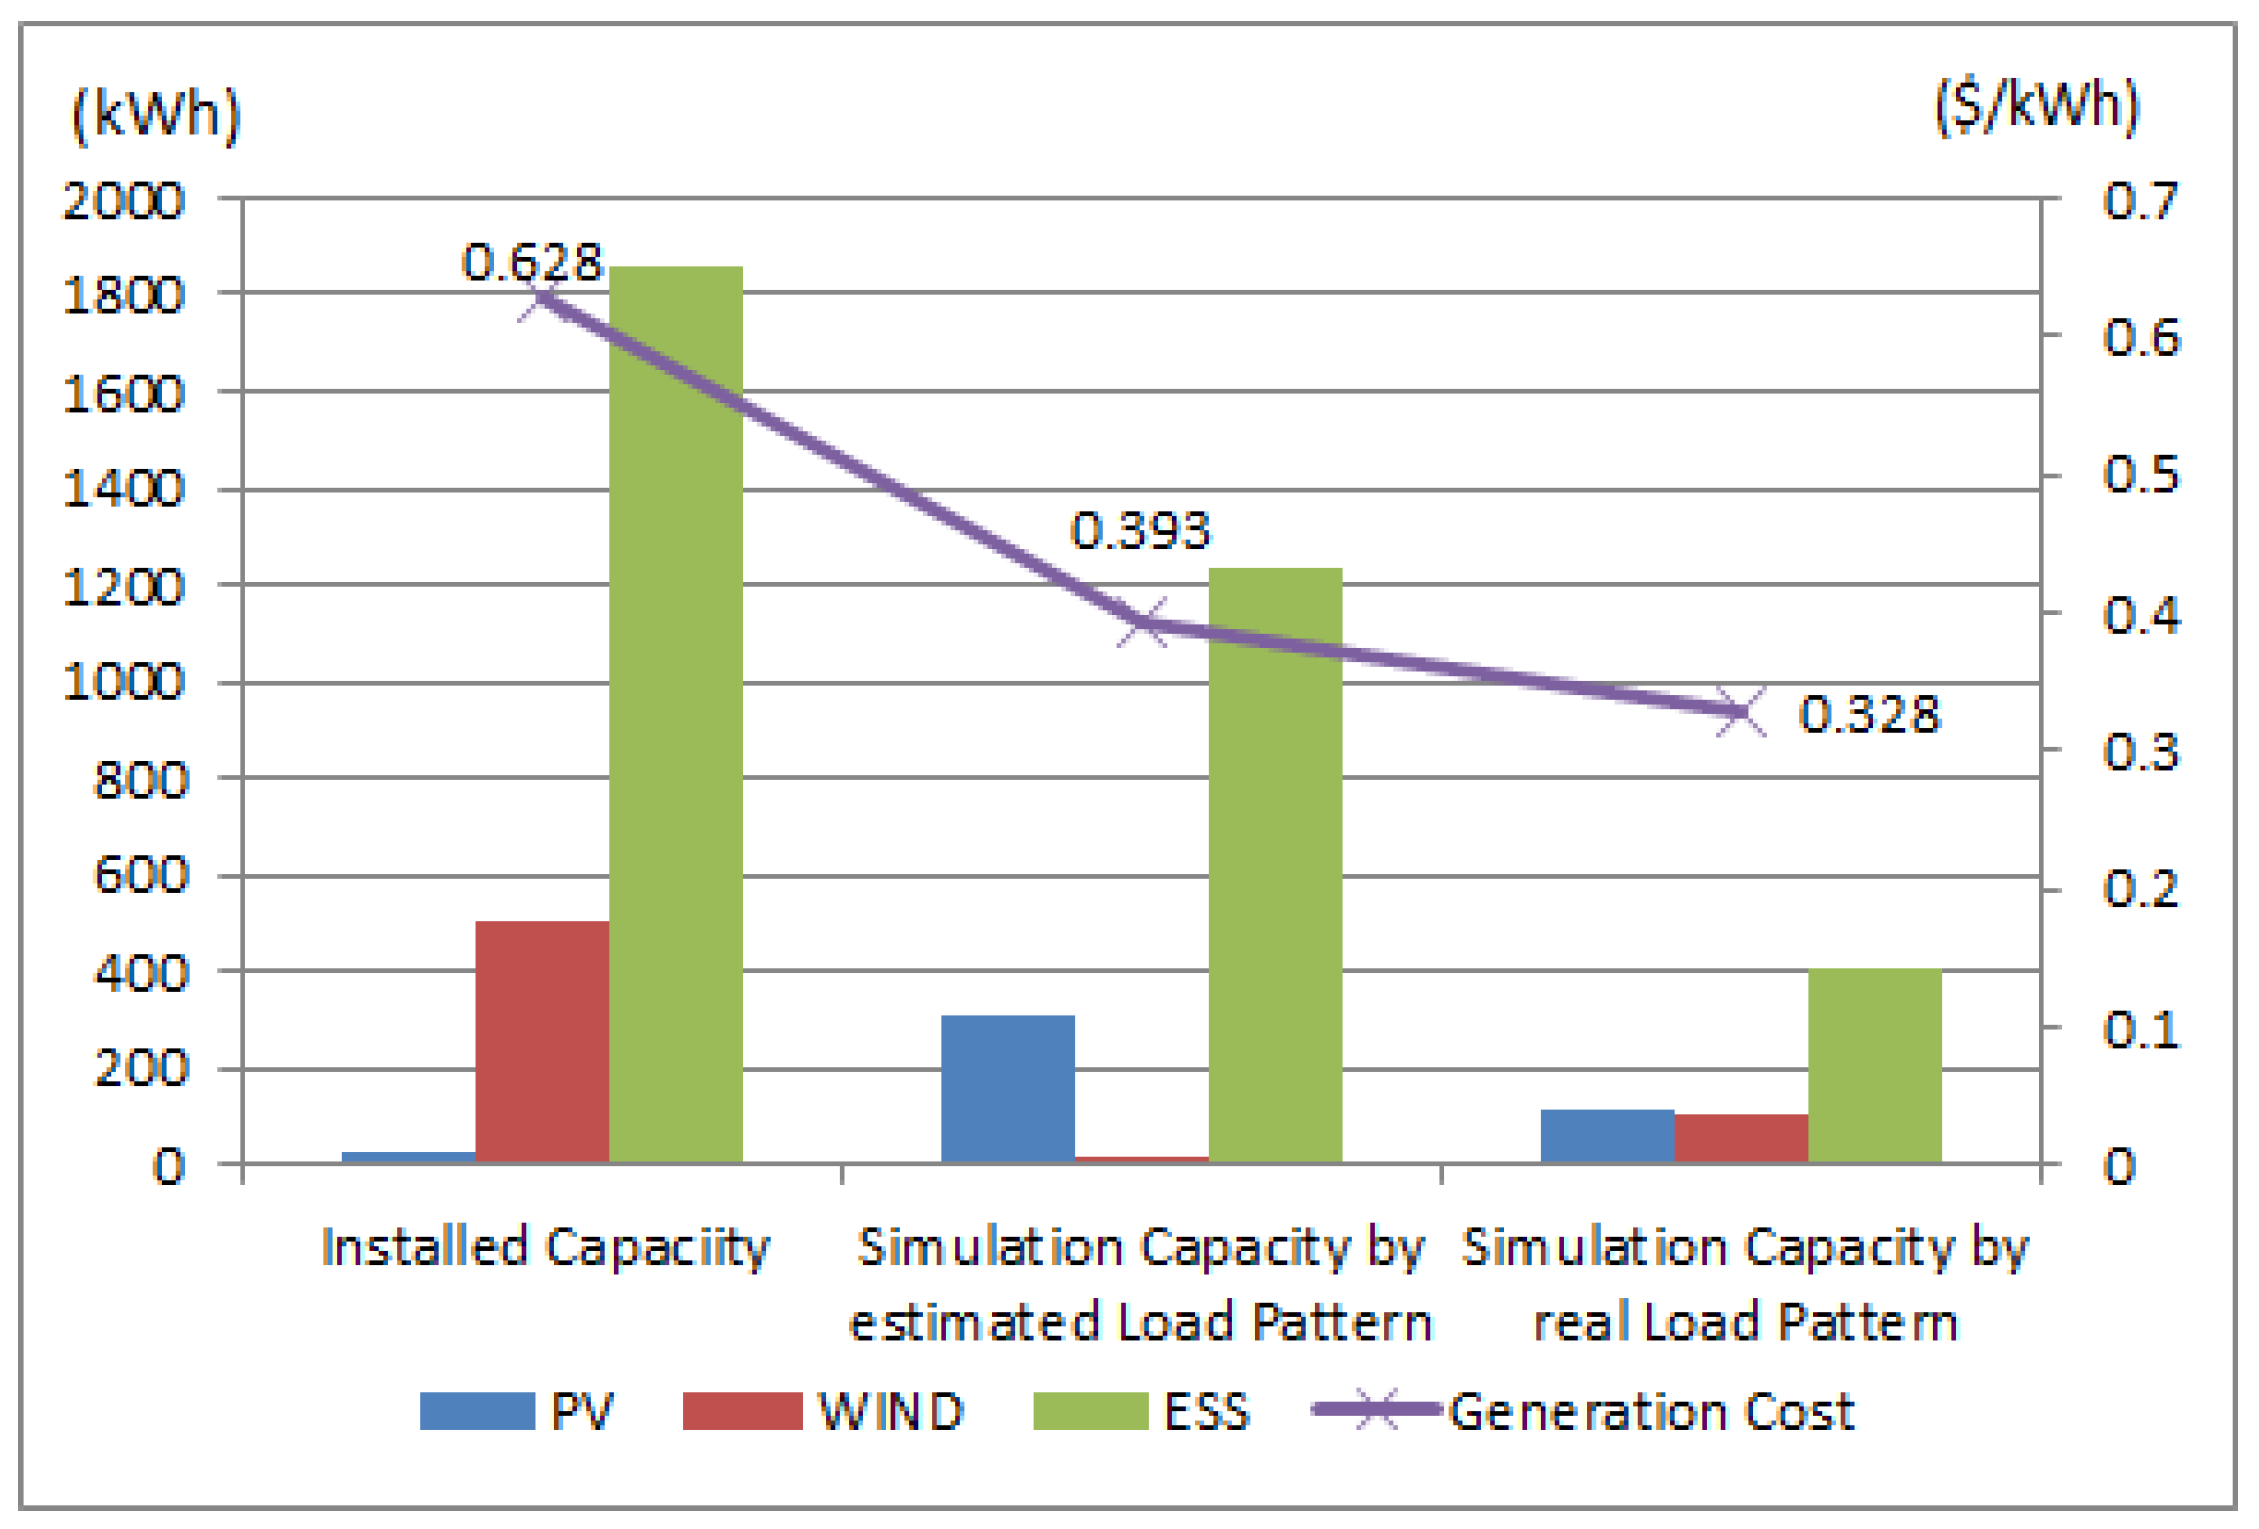
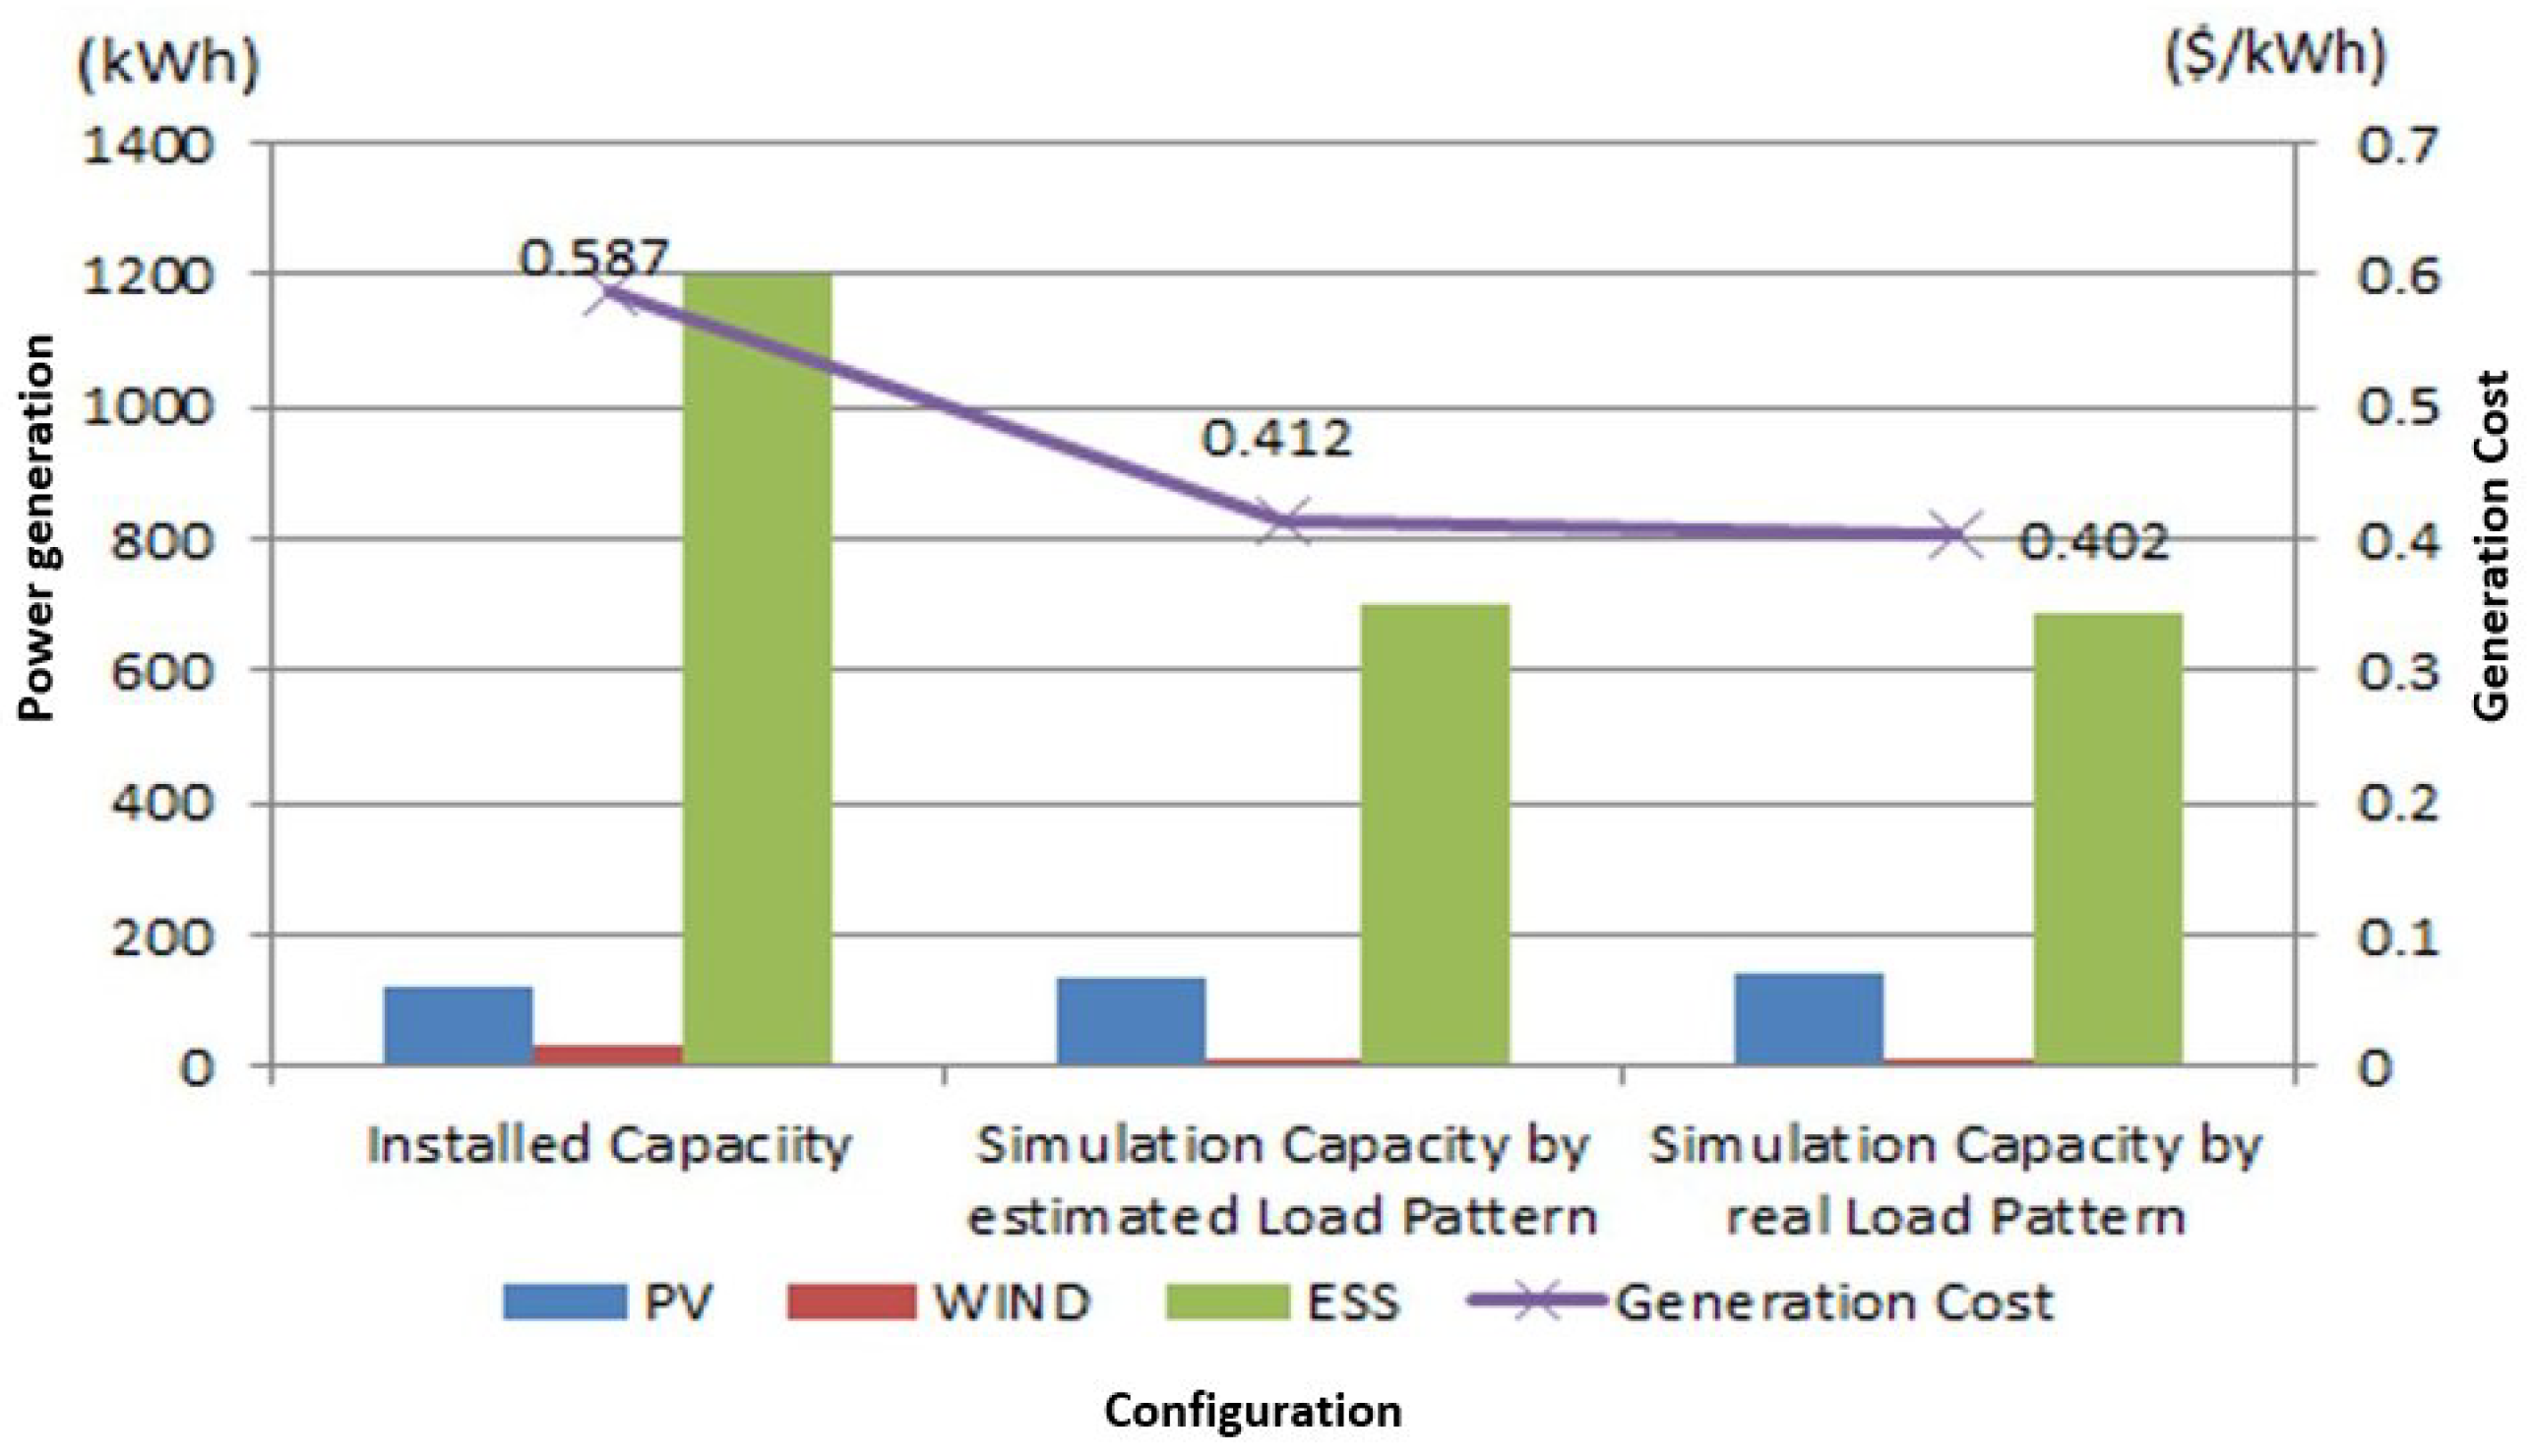
To verify the reliability of the power load modeling methods proposed above, the results of an optimal new and renewable energy combination, which is calculated by applying the load patterns estimated from the four proposed methods for the existing eight islands, and those of the microgrid design obtained by applying the actual load pattern, are compared. Comparing the optimal capacities of the solar generator, wind generator, and ESS based on the load pattern estimated by the four load estimations for the eight islands and the optimum capacity based on the actual load pattern, the method of load estimation derived from the most similar results is determined. Weather data from Amazon Web Services (AWS) and Modern-Era Retrospective analysis for Research and Applications (MERRA) are used.
The microgrid design includes consideration of diesel generators, wind turbines, solar generators, and ESS installations. The objective function of the design is to optimize the total cost, considering both installation and maintenance costs, reducing these to a minimum. When analyzing the economic feasibility of the ESS installed at grid-connected commercial and industry buildings, the basic electric charge reductions through discharge in power peak time are a major factor. However, the stand-alone microgrids covered in this study are subject to analysis at the expense of installation and maintenance, ignoring the effect of the basic electric charges. In addition, it is necessary to account for the Renewable Energy Certificate (REC), the costs of the carbon-trading rights transactions, etc., to reflect the reality in the market being driven by government policies. However, these are not considered for modeling stand-alone microgrids as there are no obvious applications and the cost-varying factors associated with policy changes are very large. The list of cost-varying factors is shown in Table 5.
The facility’s capacity is constructed to minimize the costs of annual generation, the design is performed using the optimization derivation program developed to calculate the operation strategy, and detailed application function forms and a limiting condition are applied, as shown below.
The mathematical model for a stand-alone microgrid design is modeled to minimize the objective function of the total cost, as shown in Equation (1):
min ( C P V x P V + C w t x w t + C b a t t x b a t t + t = 1 8760 C d i e s e l P d i e s e l )
  • C P V : Installation operating costs of PV ($/kW)
  • x P V : Capacity of PV (kW)
  • C w t : Installation operating costs of wind power ($/kW)
  • x w t : Capacity of wind (kW)
  • C b a t t : Operating costs of battery ($/kWh)
  • x b a t t : Capacity of battery (kWh)
  • C d i e s e l : Unit price of diesel ($/kWh)
  • P d i e s e l : Diesel power generation (kWh)
As a physical constraint on the objective function shown in Equation (1), the application of the demand–supply balance is expressed as in Equation (2):
P l o a d ( t ) / η p c s = P P V ( t ) + P w t ( t ) + P d i s c h ( t ) P c h ( t ) + P d i e s e l ( t ) / η p c s
  • P l o a d ( t ) : Electrical energy demand by hour
  • η p c s ( t ) : Efficiency of the power conversion system (PCS)
  • P P V ( t ) : PV power generation per hour
  • P w t ( t ) : Wind power generation per hour
  • P d i s c h ( t ) : Battery discharge per hour
  • P c h ( t ) : Battery charge per hour
As a diesel generator is an AC generator, it supplies electricity directly to the AC loads. However, renewable power sources and batteries are DC sources, so electricity generated from them is converted into AC power through the PCS and then supplied to loads. Therefore, the efficiency of the PCS should be considered.
The conditions for battery storage energy are expressed by Equation (3):
E b a t t ( t + 1 ) = E b a t t ( t ) + η b a t t P c h ( t ) P d i s c h ( t ) / η b a t t
where E b a t t ( t ) is electrical energy stored in battery per hour and η b a t t is efficiency of battery.
Equation (4) reflects the condition that it is not possible to charge and discharge the battery simultaneously:
P d i s c h ( t ) P c h ( t ) = 0
In practice, the above nonlinear conditions cannot be directly considered in a linear plan. However, it is possible to add a very small number ε ( 10 4 ) to the objective function, multiplied by the charge and discharge term ( ε t = 1 8760 ( P c h ( t ) + P d i s c h ( t ) ) ), to derive a valid result considering the above conditions. The battery storage energy limit is expressed as in Equation (5):
β 1 x b a t t E b a t t ( t ) β 2 x b a t t
In the above equation, β 1 and β 2 are constants representing the minimum and maximum electrical energy stored in the battery that must be maintained for the battery condition, expressed in terms of the percentage of battery capacity. In Equation (5), typical operating conditions, where depth of discharge (DOD) is 15% (minimum) and 85% (maximum), are applied.
In addition, as the constraint to deploy a system in which more than a certain percentage of total electrical energy demand is covered by renewable generation based on the given meteorological and load data, the conditions in Equation (6) are reflected, where α is the target rate of renewable power generation:
t = 1 8760 P d i e s e l ( 1 α ) t = 1 8760 P l o a d  
A technique is applied to perform the renewable energy optimization process using the objective function, with the code written on MATLAB (2017a, MathWorks, Natick, MA, USA) using the Gurobi optimizer under a high-speed workstation. It also helps to find the lowest cost sources of power generation and battery configurations that meet a given percentage of total annual power demand with renewable energy. The optimization simulation was performed by changing the share of renewable energy generation from 10% to 90% in increments of 10%. The calculation time for each step took approximately 15 min. Linear planning, the most popular technique for solving optimization problems, is performed under the assumption that the PCS performance curves are linear and there are no losses during battery filling operations.
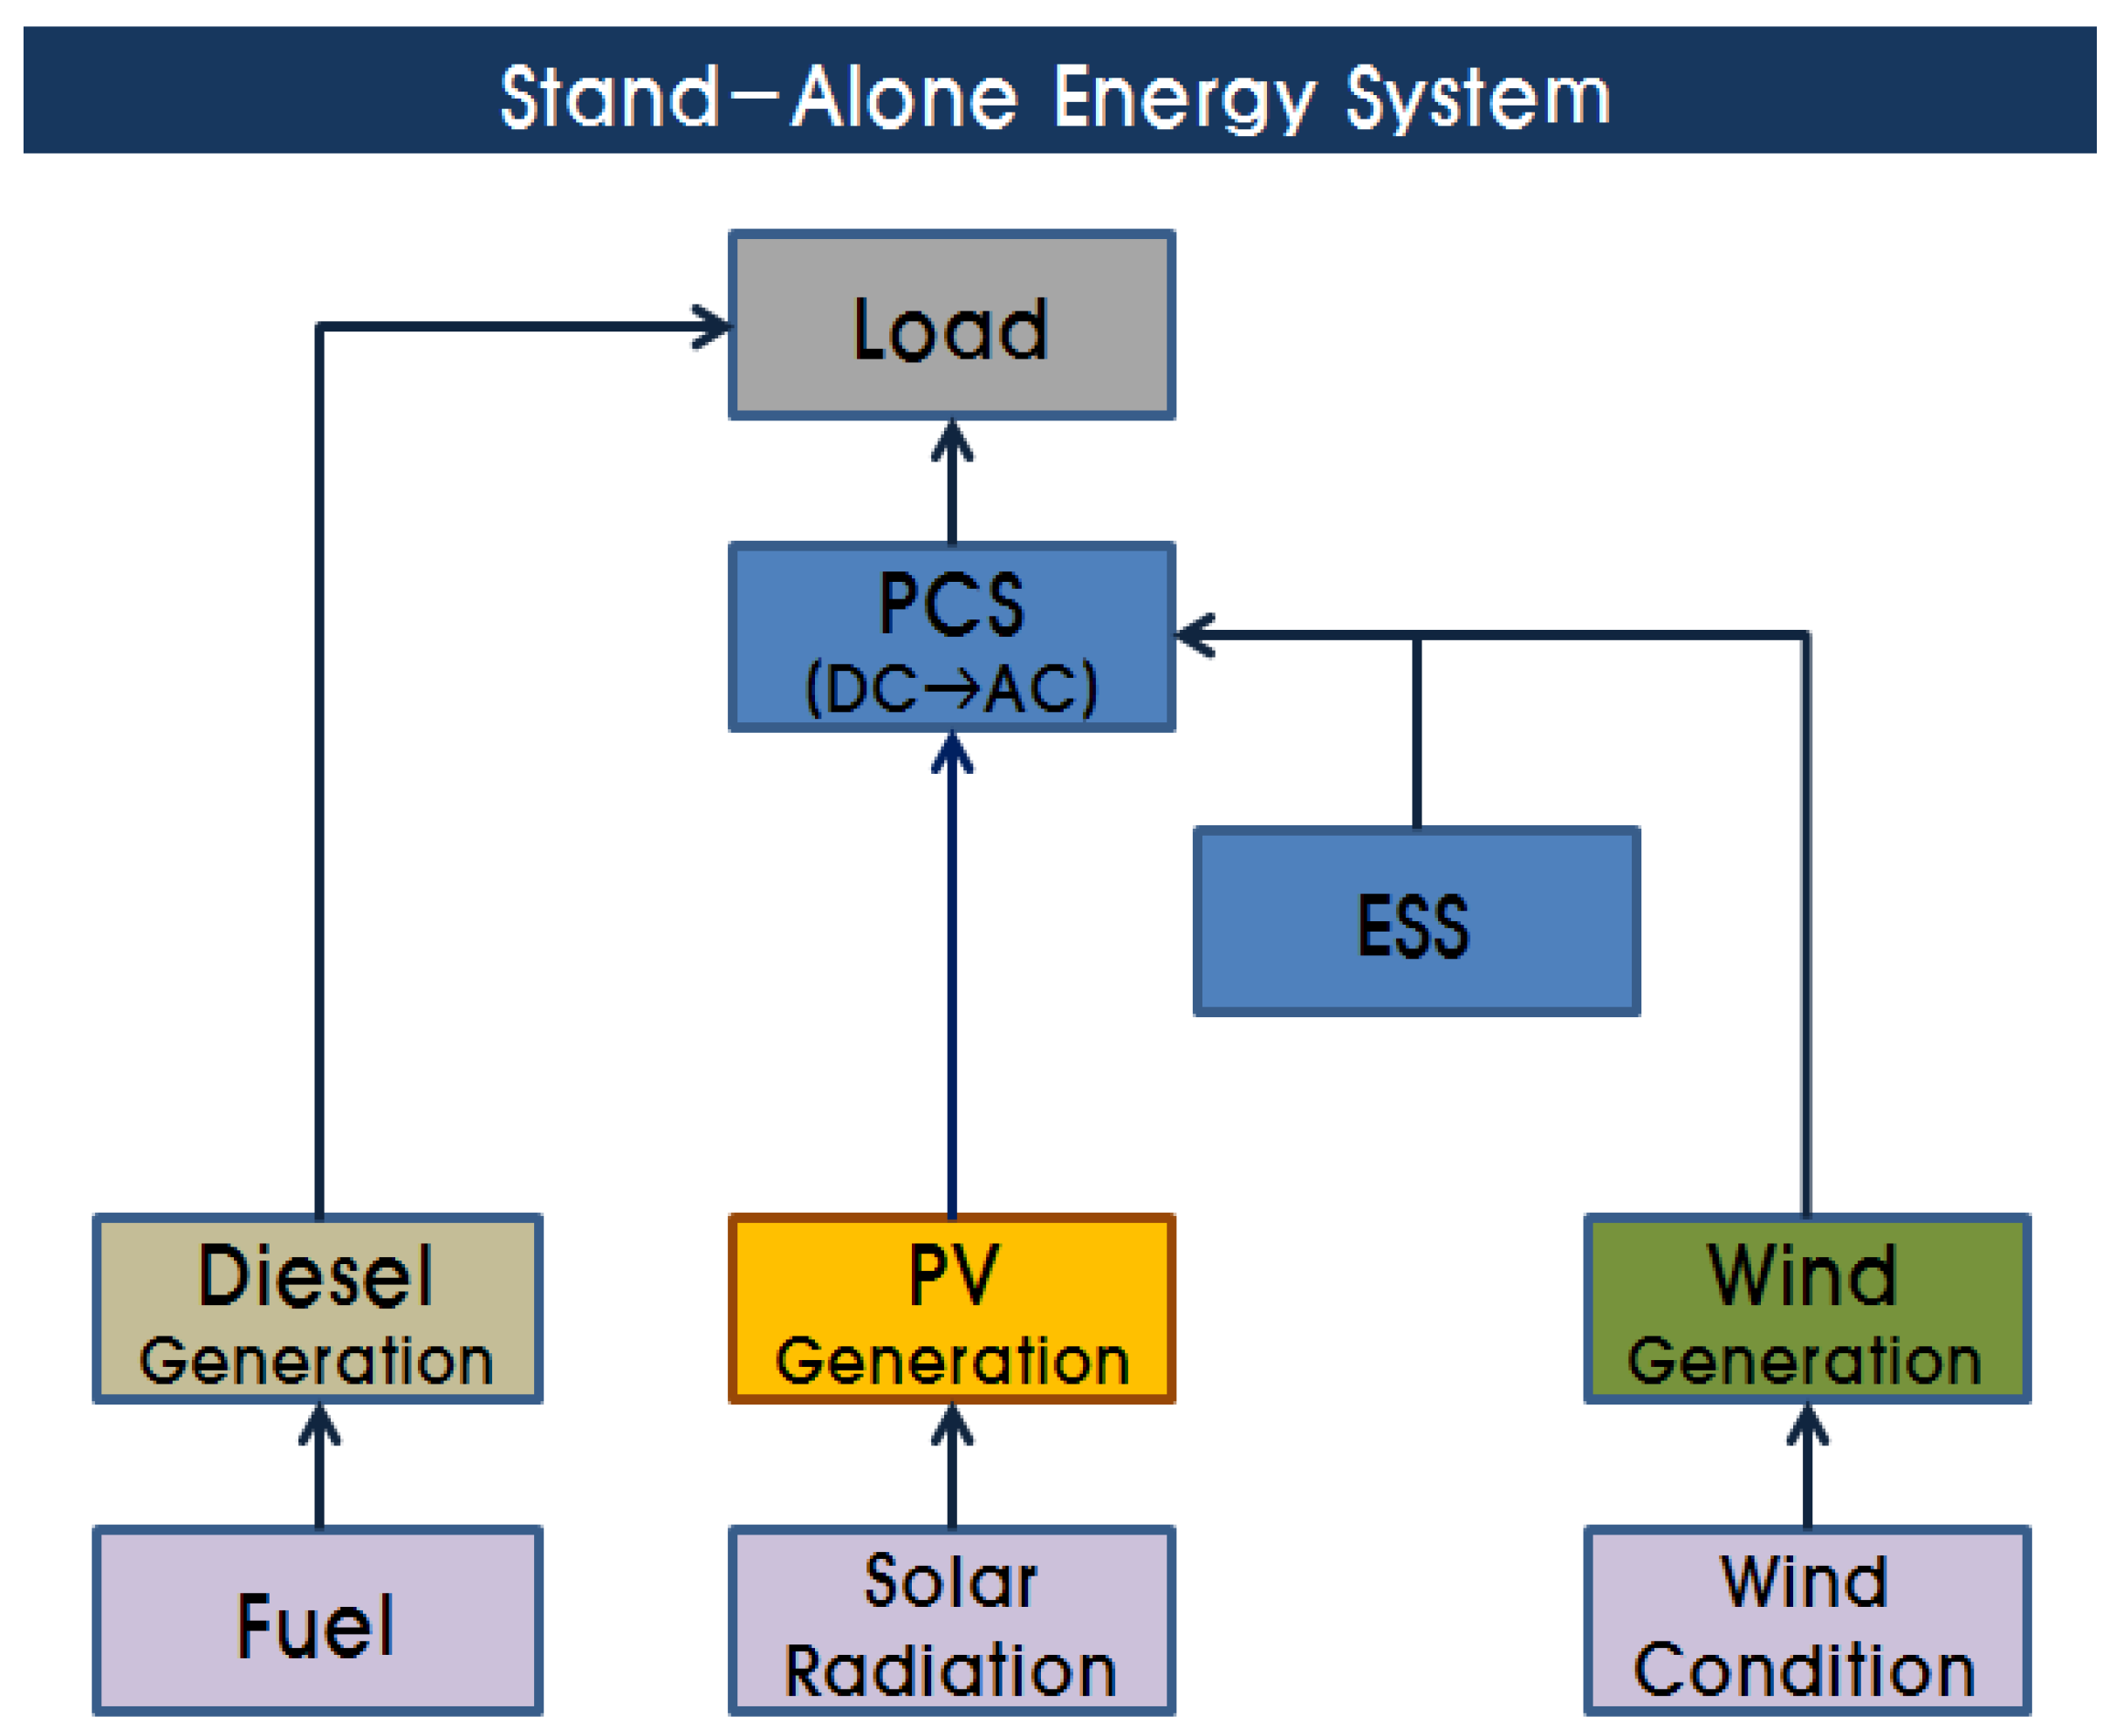
The configuration of the energy system for the reliability improvement analysis of the microgrid design is shown in Figure 9. PV power is supplied to consumers (loads) rather than to the battery. For wind generators, in response to their intermittency, the produced electricity is supplied directly to the demand source if there is demand, but stored in the battery if there is no demand [11,12,13].
The installation costs for the system configuration are applied as shown in Table 6.
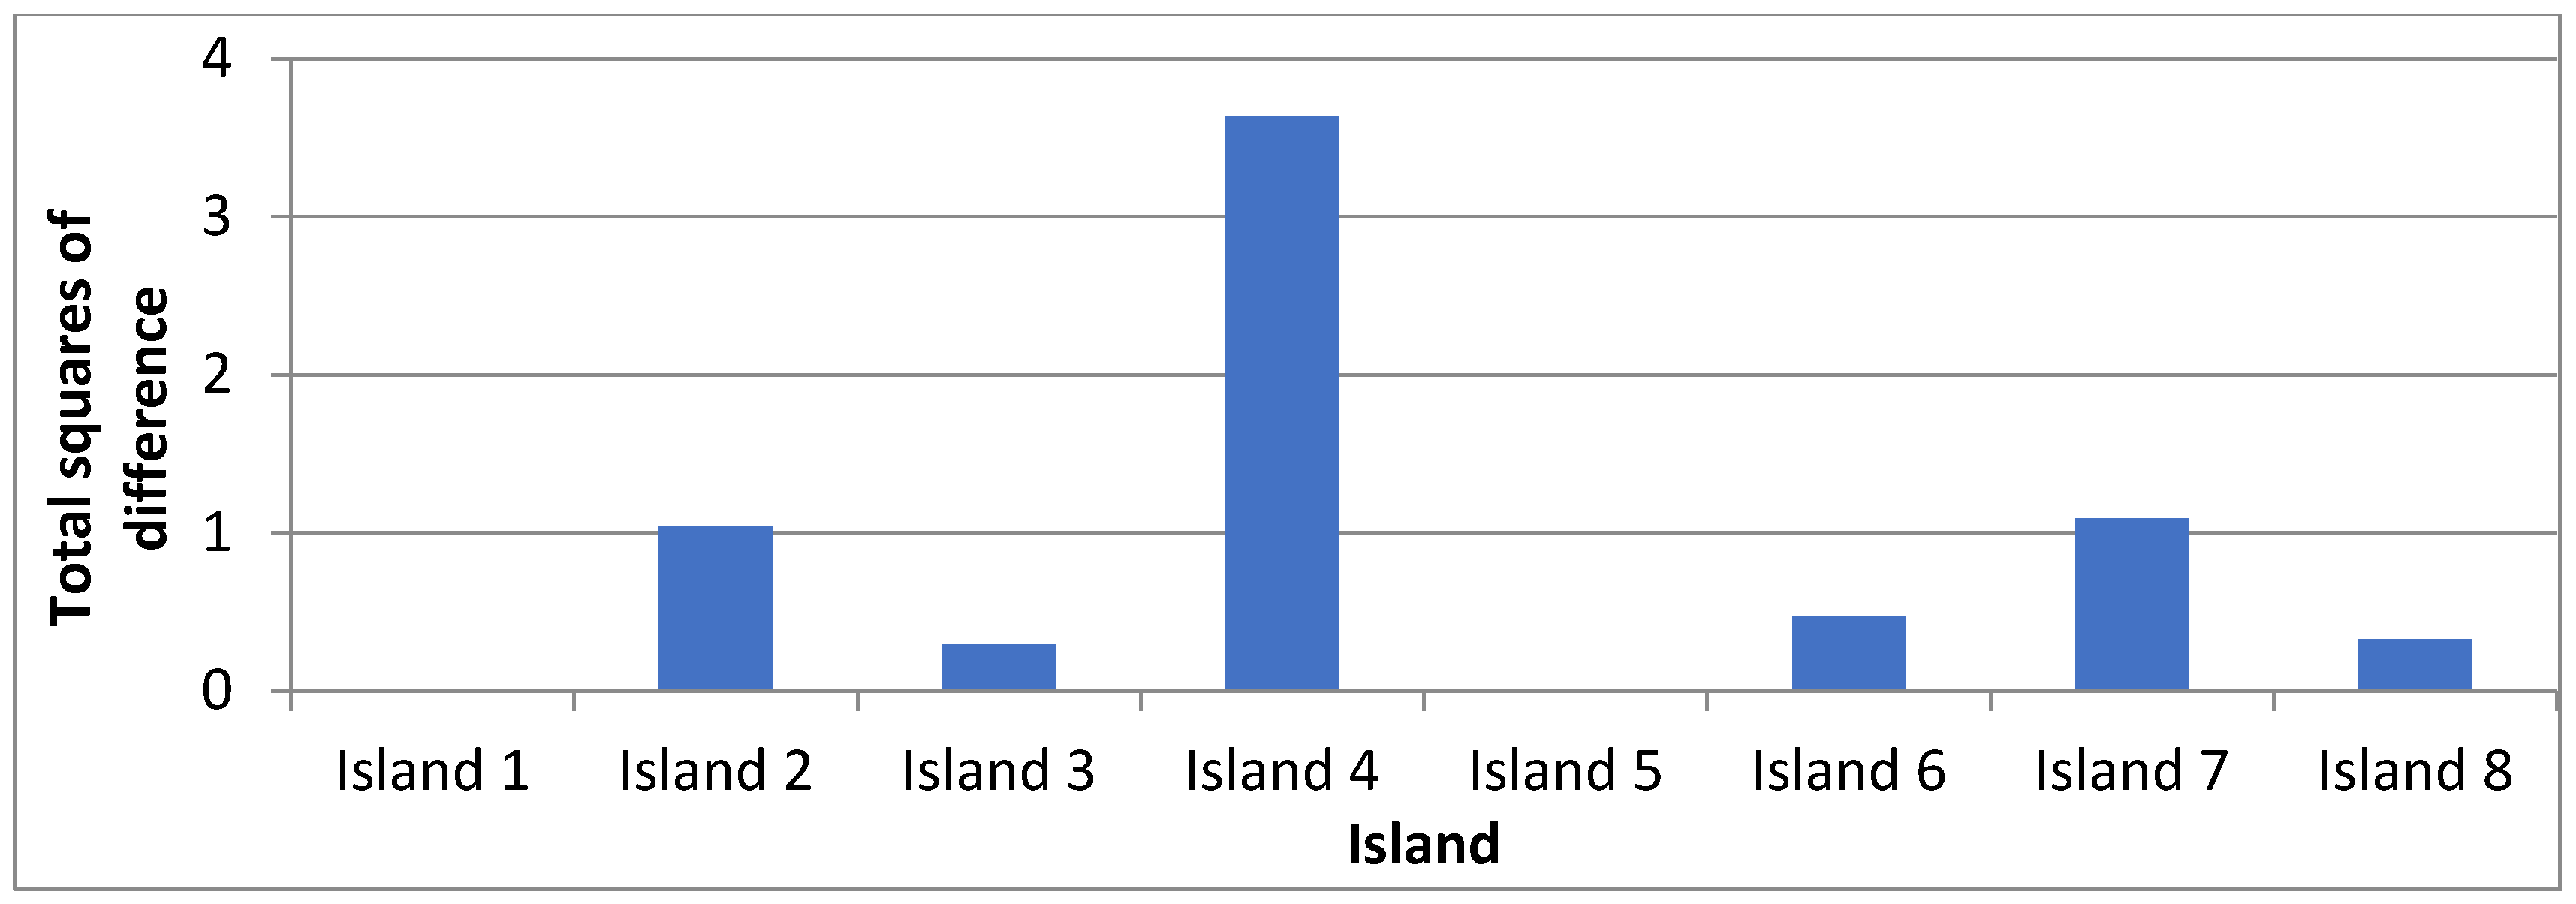
With the application of the load pattern calculated using the four load pattern estimation methods for the eight islands, a microgrid power system that achieves the lowest generation unit price while satisfying the renewable energy ratio ranging from 10% to 90% (changing by policy) with 10% gaps has been designed. The estimation method of the load pattern with the most similar facility configurations using the method of least squares through the differences in capacity of each facility according to the actual load patterns is shown in Table 7.
Unlike the formative similarity in the load pattern identified in Section 2.3.5 above, the least squares method in Table 7 clearly shows that most of the annual results (six out of eight islands) are at the minimum, meaning that the annual (every month) estimation would follow typical loads more closely.

3. Verification of Effectiveness of the Proposed Load Pattern Estimation Method

Based on the results so far, annual (every month) estimation is selected as the most realistic measure to estimate the load pattern in this paper. To improve the economic efficiency by considering the effects of actual application, the annual load patterns are estimated for the microgrid design of Islands 5 and 7 depending on the proposed load pattern estimation method. It is based on actual microgrid facilities of existing eight islands, whose load patterns are known. Next, a microgrid facility configuration is designed using the optimization program. Finally, the economy of the microgrid design is compared with that of the actual facility.

3.1. Comparison of Actual Facilities in Island 5 and Those Designed Using the Proposed Load Pattern Estimation Method

Island 5, which has a total annual power generation of 1,096,024 kWh, consists of diesel generators, a PV generator of 30 kW, a wind generator of 500 kW (250 kW × 2), and an ESS with 1860 kWh capacity. The simulation of power operation using the actual load pattern in Island 5 and the above capacity of the power source show that battery overcharging occurs due to imbalances between the installation capacities. In practice, in the case of Island 5, the capacity of the wind generator is larger than the overall island’s load. For stability of the power system, the wind power generator is connected to the battery in series to supply stabilized battery power to the power grid. If the battery is fully charged, the operating strategy is that the wind power generator (that has a large capacity) is temporarily stopped. By reflecting this operating strategy in the simulation, about 30% of the total power load would be covered by the renewable energy sources and ESS. In this case, approximately $687,061 is analyzed to be incurred annually. In comparison, under the load pattern estimation method proposed in this study, if the proportion of renewable energy supply is assumed at 30%, a microgrid facility including PV of 306 kW, wind power of 20 kW, and ESS of 1231 kWh would be constructed, as shown in Table 8. In this case, the total annual generation cost is estimated to be $431,996, as shown in Table 9.
The results of the load pattern estimation method proposed in this paper show that designing a microgrid facility saves $255,065 per year in generation costs compared to that of the existing facility. Analysis indicates that the unit price per kWh is 0.393 $/kWh, which results in an approximate cost reduction of 37.2%, as shown in Figure 10.
To analyze the reliability improvements of modeling using the estimation method of the load pattern, the installation capacity is calculated through the optimization program using the actual load pattern. When comparing this result with that of the modeling method used in this study, the generation unit price drop can be as low as 0.065 $/kWh compared to the 0.393 $/kWh predicted in this study.

3.2. Comparison of Actual Facilities in Island 7 and Those Designed Using the Proposed Load Pattern Estimation Method

Island 7, which has a total annual power generation of 425,034 kWh, consists of diesel generators, a PV generator of 120 kW, a wind generator of 30 kW (3 kW × 10), and an ESS of 1200 kWh. Island 7 was originally designed with the purpose of supplying 50% electricity from renewable energy sources. As a result of simulation of the power operation using known load patterns and the installed capacity, about 48% of all power loads are found to be supplied through renewable energy, which is consistent with the originally intended design capacity. The total annual cost of power generation is estimated at approximately $249,543.
The optimization using load pattern estimation is constructed from a PV of 136 kW, wind of 10 kW, and ESS of 698 kWh, as shown in Table 10. In this case, the total annual generation costs are analyzed as shown in Table 11.
In addition, the configuration of the optimized design facilities using actual loads is shown in Table 12. In this case, the generation unit price is 0.402 $/kWh, as shown in Table 13, which is about 0.01 $/kWh lower than the optimized generation unit price applied with the load pattern estimation results proposed in this paper, as shown in Figure 11.

4. Conclusions

In this paper, to improve the reliability of the microgrid design in the island region using PV and wind power generators, ESS, and diesel generators, which are currently being actively distributed under government policies for energy-independent islands, a reliable load pattern estimation method was proposed and its feasibility was verified. To reflect the difficulty of obtaining the necessary information in the design of microgrids, a system with interdisciplinary integration convergence was designed with limited information such as the load patterns of eight islands, for the first time, with assistance based on big data treatment. The load pattern was estimated using the actual loads of eight islands, comparing their load patterns under design with those of annual (every month), seasonal, bi-monthly, and monthly averages. The optimal configuration of renewable energy sources was simulated using the estimated load pattern, and the actual load was then used to compare with the calculation results.
Based on monthly power consumption information, the load pattern was estimated using four methods, and the optimized facility capacity in the microgrid resulting from the optimization program was then analyzed for its similarity with the results obtained using the actual load pattern. As a result, the estimation method compared with the monthly power generation for 12 months was found to be the most similar.
Accordingly, the estimation method of the load pattern based on the annual (every month) estimation method was considered to be optimal for six of the eight islands.
Finally, the results of load pattern estimation method proposed in this study were compared with those of calculation for the optimal facility capacity in the operating microgrids for two islands. From the analysis, the proposed method provided economic improvements, reducing the unit price of power generation by 37.2% and 29.8% for two islands.
In addition, if related agencies were to publish considerable data related to power consumption, it is expected to be of great help in enhancing the reliability of design and operation of renewable energy resources and stand-alone microgrid networks. Furthermore, solutions implementing DR (demand response) and/or DLC (direct load control) strategies using this approach without considering marginal design in the capacity of a system should be beneficial and of interest for future research.

Author Contributions

Chang Koo Lee developed his own primary load pattern model for the microgrid network based on the analysis of power consumption in the eight islands, and confirmed the model with the simulation process to suggest the optimal combination of PVs, wind power, and ESS which would be critical in designing future energy network. Byeong Gwan Bhang, Sang Hun Lee, Hae lim Cha, and David Kwangsoon Kim added experimental data analysis for different periods in different areas. Hyung Keun Ahn integrated the microgrid model with respect to load patterns to provide reliable power resources, such as PVs, wind power, and ESS capacities, which is one of the hottest subjects related to microgrid networks in near future.

Acknowledgments

We offer our sincere thanks to BESICO for help with the big data simulation procedures.

Conflicts of Interest

The authors declare no conflict of interest.

References

  1. Luu, N.A.; Tran, Q.; Bacha, S. Optimal energy management for an island microgrid by using dynamic programming method. In Proceedings of the 2015 IEEE PowerTech Eindhoven, Eindhoven, The Netherlands, 29 June–2 July 2015; pp. 1–6. [Google Scholar] [CrossRef]
  2. Liu, C.; Chau, K.; Diao, C.; Zhong, J.; Zhang, X.; Gao, S.; Wu, D. A new DC micro-grid system using renewable energy and electric vehicles for smart energy delivery. In Proceedings of the Vehicle Power and Propulsion Conference (VPPC), 2010 IEEE, Lille, France, 1–3 September 2010; pp. 1–6. [Google Scholar] [CrossRef]
  3. Biczel, P.; Koniak, M. Design of power plant capacity in dc hybrid system and microgrid. COMPEL-Int. J. Comput. Math. Electr. Electron. Eng. 2011, 30, 336–350. [Google Scholar] [CrossRef]
  4. Kurnik, C.; Butt, R.; Metzger, I.; Lavrova, O.; Patibandla, S.; Wagner, V.; Frankosky, M.; Wiegand, G. Design, Operation, and Controlled-Island Operation of the US Department of Energy Solar Decathlon 2013 Microgrid. Available online: https://www.nrel.gov/docs/fy15osti/62997.pdf (accessed on 21 May 2018).
  5. Arangarajan, V.; Oo, A.M.T.; Shafiullah, G.; Seyedmahmoudian, M.; Stojcevski, A. Optimum design and analysis study of Stand-alone residential solar PV Microgrid. In Proceedings of the Power Engineering Conference (AUPEC), 2014 Australasian Universities, Perth, WA, Australia, 28 September–1 October 2014; pp. 1–7. [Google Scholar] [CrossRef]
  6. Arefifar, S.A.; Yasser, A.M.; El-Fouly, T.H. Optimum microgrid design for enhancing reliability and supply-security. IEEE Trans. Smart Grid 2013, 4, 1567–1575. [Google Scholar] [CrossRef]
  7. Mumtaz, F.; Bayram, I.S. Planning, Operation, and Protection of Microgrids: An Overview. Energy Procedia 2017, 107, 94–100. [Google Scholar] [CrossRef]
  8. Lianos, J.; Morales, R.; Núñez, A.; Sáez, D.; Lacalle, M.; Marín, L.G.; Hernández, R.; Lanas, F. Load estimation for microgrid planning based on a self-organizing map methodology. Appl. Soft Comput. 2017, 53, 323–335. [Google Scholar] [CrossRef]
  9. Zhang, J.; Huang, L.; Shu, J.; Wang, H.; Ding, J. Energy management of PV-diesel-battery hybrid power system for island stand-alone micro-grid. Energy Procedia 2017, 105, 2201–2206. [Google Scholar] [CrossRef]
  10. Al-Wakeel, A.; Wu, J.; Verga, M.; Jenkins, N. State estimation of low voltage microgrid using an iteratively reweighted least squares method. In Proceedings of the CIRED Workshop, Rome, Italy, 11–12 June 2014; pp. 1–5. [Google Scholar]
  11. Shi, W.; Xie, X.; Chu, C.; Gadh, R. A distributed optimal energy management strategy for microgrids. In Proceedings of the 2014 IEEE International Conference on Smart Grid Communications, Venice, Italy, 3–6 November 2014; pp. 1–6. [Google Scholar] [CrossRef]
  12. Chae, W.K.; Lee, H.J.; Won, J.N.; Park, J.S.; Kim, J.E. Design and field tests of an inverted based remote microgrid on a Korean Island. Energies 2015, 8, 8193–8210. [Google Scholar] [CrossRef]
  13. Kojima, T.; Fukuya, Y. Microgrid system for isolated islands. Fuji Electr. Rev. 2011, 57, 125–130. [Google Scholar]
Figure 1. Annual hourly load patterns for eight islands.
Energies 11 02012 g001
Figure 2. Estimation process for load pattern.
Energies 11 02012 g002
Figure 3. Power consumption with months for 1 year.
Energies 11 02012 g003
Figure 4. Normalized monthly power consumption with months for 1 year.
Energies 11 02012 g004
Figure 5. Total squares of difference for normalized monthly power consumption with islands.
Energies 11 02012 g005
Figure 6. Load pattern estimating process by month.
Energies 11 02012 g006
Figure 7. Estimation process for load pattern by season.
Energies 11 02012 g007
Figure 8. Estimation of load pattern by monthly average power consumption with hours(x axis) for 1 year.
Energies 11 02012 g008
Figure 9. Configuration of microgrid network.
Energies 11 02012 g009
Figure 10. Economic effect (y axis) of new estimation method for load pattern compared with installed and simulated ones (x axis: different design methods) by real load pattern for for Island 5.
Energies 11 02012 g010
Figure 11. Economic effect (y axis) of new estimation method for load pattern compared with installed and simulated ones (x axis: different design methods) by real load pattern for Island 7.
Energies 11 02012 g011
Table 1. Annual and average hourly generation of electricity.
Islands (Year)Annual (kWh)Hour Average (kWh)
Island 1 (2013)15,523,0261772.03
Island 2 (2014)9,457,0021079.57
Island 3 (2014)3,142,132358.69
Island 4 (2013)1,940,766221.55
Island 5 (2015)1,096,024125.12
Island 6 (2013)513,40958.61
Island 7 (2013)425,03448.52
Island 8 (2013)197,21122.51
Table 2. Total squares of difference of normalized sum of power consumption by season between Island 5 (to be estimated) and remaining islands.
MonthIsland 1Island 2Island 3Island 4Island 5Island 6Island 7Island 8
3–5-0.297040.114120.51333-0.102780.525870.03708
6–8-0.101030.054472.13486-0.034040.149930.08541
9–11-0.04650.007020.15398-0.168520.22980.17995
12–2-0.59220.114890.8287-0.164510.18450.02427
Table 3. Total squares of difference of normalized sum of power consumption by two month periods between Island 5 (to be estimated) and the rest of islands.
MonthIsland 1Island 2Island 3Island 4Island 5Island 6Island 7Island 8
1–2-0.060670.023650.74076-0.05310.076770.02156
3–4-0.177160.081790.51021-0.102430.102530.03201
5–6-0.200620.046080.00844-0.009980.567980.01516
7–8-0.020290.040722.12954-0.024410.005290.07532
9–10-0.015640.004870.1392-0.051160.068040.08475
11–12-0.562390.093390.10272-0.228770.269490.09791
Table 4. Analysis of similarity for load pattern estimation methods with different periods
PeriodsIsland 1Island 2Island 3Island 4Island 5Island 6Island 7Island 8
Annual939.3236.855.634.26.81.380.540.26
Seasonal676.8199.150.716.97.41.530.620.23
Bi-monthly753.1273.644.72181.210.780.16
Monthly average253.6171.218.424.64.61.130.730.13
Table 5. List of the cost-varying factors.
The Cost-Varying FactorsDesign Condition
PVCapacity design in kW unit
Application of the base unit price for supporting the supply of Korea Energy Agency
WindDesign Capacity: 3 kW, 10 kW, 100 kW, 250 kW
Application of manufacturer’s sale price
ESSCapacity design in kW unit
Application of the base unit price for supporting the supply of Korea Energy Agency
Diesel0.328 $/kWh
Land costs30 $/kWh
Annual maintenance costs are 2% of the reference unit price.
Lifespan25 years (PV), 20 years (Wind), 10 years (ESS)
Discount rate: 2.42%
Repair costs2% per year for PV and wind
Table 6. Installation costs used in the evaluation.
Energy SystemInstall Cost ($/ea)Land Rental Cost ($/ea/yr)Total Cost ($)
PV3165.6303195.6
ESS904.6-904.6
Wind10 (kW)80,00030080,300
100 (kW)700,0003000703,000
250 (kW)900,00022,500922,500
750 (kW)1,500,00022,5001,522,500
1500 (kW)4,200,00045,0004,245,000
Table 7. Similarity analysis of microgrid facility configuration designed between real and estimated load patterns.
IslandsAnnual (Every Month)SeasonalTwo MonthsMonthly Average
Island 1101,705.5113,811.5126,945.9124,234.2
Island 276,072.5133,509.1131,126.7123,154.6
Island 3105,868.0121,741.2121,731.3116,241.0
Island 4119,494.0126,163.4119,608.3128,938.3
Island 592,107.7105,226.0120,248.2117,979.0
Island 6108,109.099,054.6107,807.2104,546.3
Island 7111,699.2114,846.4134,467.0120,511.3
Island 8124,495.5119,025.1101,442.6133,344.4
Table 8. Installed capacity and modeled one by estimated load pattern for Island 5.
Design MethodPV (kW)Wind (kW)ESS (kWh)
Installed Capacity305001860
Modeling Capacity306201231
Table 9. Economic comparison of operation costs by estimated load pattern for Island 5.
Design MethodAnnual Generation (kWh)Annual Cost ($)Generation Cost ($/kWh)
Installed Capacity1,097,937687,0610.626
Modeling Capacity1,098,738431,9960.393
Table 10. Installed capacity and modeled one by estimated load pattern for Island 7.
Design MethodPV (kW)Wind (kW)ESS (kWh)
Installed Capacity120301200
Modeling Capacity13610698
Table 11. Economic comparison of operation costs by estimated load pattern for Island 7.
Design MethodAnnual Generation (kWh)Annual Cost ($)Generation Cost ($/kWh)
Installed Capacity452,034249,5400.587
Modeling Capacity425,041174,9940.412
Table 12. Comparison of optimized capacity by real load pattern with modeling one using estimated load pattern for Island 7.
Design MethodPV (kW)Wind (kW)ESS (kWh)
Optimized Capacity14210688
Modeling Capacity13610698
Table 13. Economic comparison of operation cost between optimized capacity by real load pattern and modeling one using estimated load pattern for Island 7.
Design MethodAnnual Generation (kWh)Annual Cost ($)Generation Cost ($/kWh)
Optimized Capacity434,992174,7080.402
Modeling Capacity425,041174,9940.412

