Article

A Maintenance Cost Study of Transformers Based on Markov Model Utilizing Frequency of Transition Approach

by
Muhammad Sharil Yahaya
1,2,
Norhafiz Azis
1,3,*,
Amran Mohd Selva
1,
Mohd Zainal Abidin Ab Kadir
1,4,
Jasronita Jasni
1,
Emran Jawad Kadim
1,
Mohd Hendra Hairi
5 and
Young Zaidey Yang Ghazali
6
1
Centre for Electromagnetic and Lightning Protection, Universiti Putra Malaysia, Serdang 43400, Selangor, Malaysia
2
Faculty of Engineering Technology, Universiti Teknikal Malaysia Melaka, Durian Tunggal, Melaka 76100, Malaysia
3
Institute of Advanced Technology (ITMA), Universiti Putra Malaysia, Serdang 43400, Selangor, Malaysia
4
Institute of Power Engineering (IPE), Universiti Tenaga Nasional, Kajang 43000, Selangor, Malaysia
5
Faculty of Electrical Engineering, Universiti Teknikal Malaysia Melaka, Durian Tunggal, Melaka 76100, Malaysia
6
Distribution Division, Tenaga Nasional Berhad, Wisma TNB, Jalan Timur, Petaling Jaya 46200, Selangor, Malaysia
*
Author to whom correspondence should be addressed.
Energies 2018, 11(8), 2006; https://doi.org/10.3390/en11082006
Submission received: 11 June 2018 / Revised: 22 June 2018 / Accepted: 25 June 2018 / Published: 2 August 2018
(This article belongs to the Section F: Electrical Engineering)

Abstract

:
In this paper, a maintenance cost study of transformers based on the Markov Model (MM) utilizing the Health Index (HI) is presented. In total, 120 distribution transformers of oil type (33/11 kV and 30 MVA) are examined. The HI is computed based on condition assessment data. Based on the HI, the transformers are arranged according to its corresponding states, and the transition probabilities are determined based on frequency of a transition approach utilizing the transformer transition states for the year 2013/2014 and 2012/2013. The future states of transformers are determined based on the MM chain algorithm. Finally, the maintenance costs are estimated based on future-state distribution probabilities according to the proposed maintenance policy model. The study shows that the deterioration states of the transformer population for the year 2015 can be predicted by MM based on the transformer transition states for the year 2013/2014 and 2012/2013. Analysis on the relationship between the predicted and actual computed numbers of transformers reveals that all transformer states are still within the 95% prediction interval. There is a 90% probability that the transformer population will reach State 1 after 76 years and 69 years based on the transformer transition states for the year 2013/2014 and 2012/2013. Based on the probability-state distributions, it is found that the total maintenance cost increases gradually from Ringgit Malaysia (RM) 5.94 million to RM 39.09 million based on transformer transition states for the year 2013/2014 and RM 37.56 million for the year 2012/2013 within the 20 years prediction interval, respectively.

1. Introduction

One of the vital elements in power system planning is management of transformer asset. Condition Based Monitoring (CBM) has been introduced by utilities as part of an asset management scheme to monitor the characteristics of operational parameters and provide a comprehensive diagnosis on transformers. Condition trends that indicate abnormality can be detected early and can be used to determine health conditions of transformers [1].
Multiple condition data are normally considered to diagnose the condition of transformers, such as oil quality, dissolved gases, furanic compounds, power factors, winding resistances, winding ratios, temperature, partial discharges, physical conditions and load tap changer conditions [2,3]. This information is embedded in a single quantitative value known as Health Index (HI), which can give overall condition status of transformers [4,5,6,7,8]. The HI can be utilized to evaluate transformer deteriorations that require diagnosis, maintenance and approaching end of life [9,10].
The HI of transformers has been identified for its potential in predicting the future states of transformer population. Presently, there are fewer studies on modelling the deterioration of transformers using the HI [11,12]. A few techniques based on extrapolation, regression, trend forecasting and curve fitting analysis have been implemented to achieve this purpose [13,14]. However, due to the scattering nature of HI, a reliable prediction is quite difficult to be achieved based on these techniques [7,14,15].
One of the possible approaches that can be used to evaluate the future condition of transformers is the Markov Model (MM). It is a stochastic approach, where the transition probabilities can be identified based on existing condition data. The MM has been widely applied to forecast the conditions of bridges, bridge elements, pavements, storm water piping components and steel hydraulic structures in civil engineering [16,17,18,19,20]. The MM has also been used to predict the deterioration states of switchgear populations, spare units and fault occurrence of transformers [21,22,23,24]. Based on the MM, the maintenance cost can be estimated to assist asset managers in planning their future budgetary [25,26,27]. The financial aspect of the CBM needs to be planned appropriately whereby it can be achieved by maintenance cost analysis.
In this paper, the MM is applied to predict the deterioration states of the transformer population based on the HI. In total, 120 distribution transformers of oil type (33/11 kV and 30 MVA) are used for the case study. The first part is the modelling of deterioration states of the transformer population based on the MM and the HI. The second part is the sensitivity analysis on the transformer deterioration model based on a pre-determined maintenance policy model. The final part is the assessment of cost impact based on the pre-determined maintenance policy model.

2. Health Index of Transformer

The HI is defined as a method to measure the overall health of an asset by quantifying the condition monitoring information [28]. It is based on scoring, rating and ranking techniques, which considers theoretical knowledge, standards, guidelines and expert judgments. Most of the electrical power utilities adopt HI for management of transformers, such as Kinectrics Incorporate, DNV KEMA, Hydro Quebec, EDF Energy, TERNA, Electricity Generating Authority of Thailand and Tenaga Nasional Berhad [6,7,8,29]. 
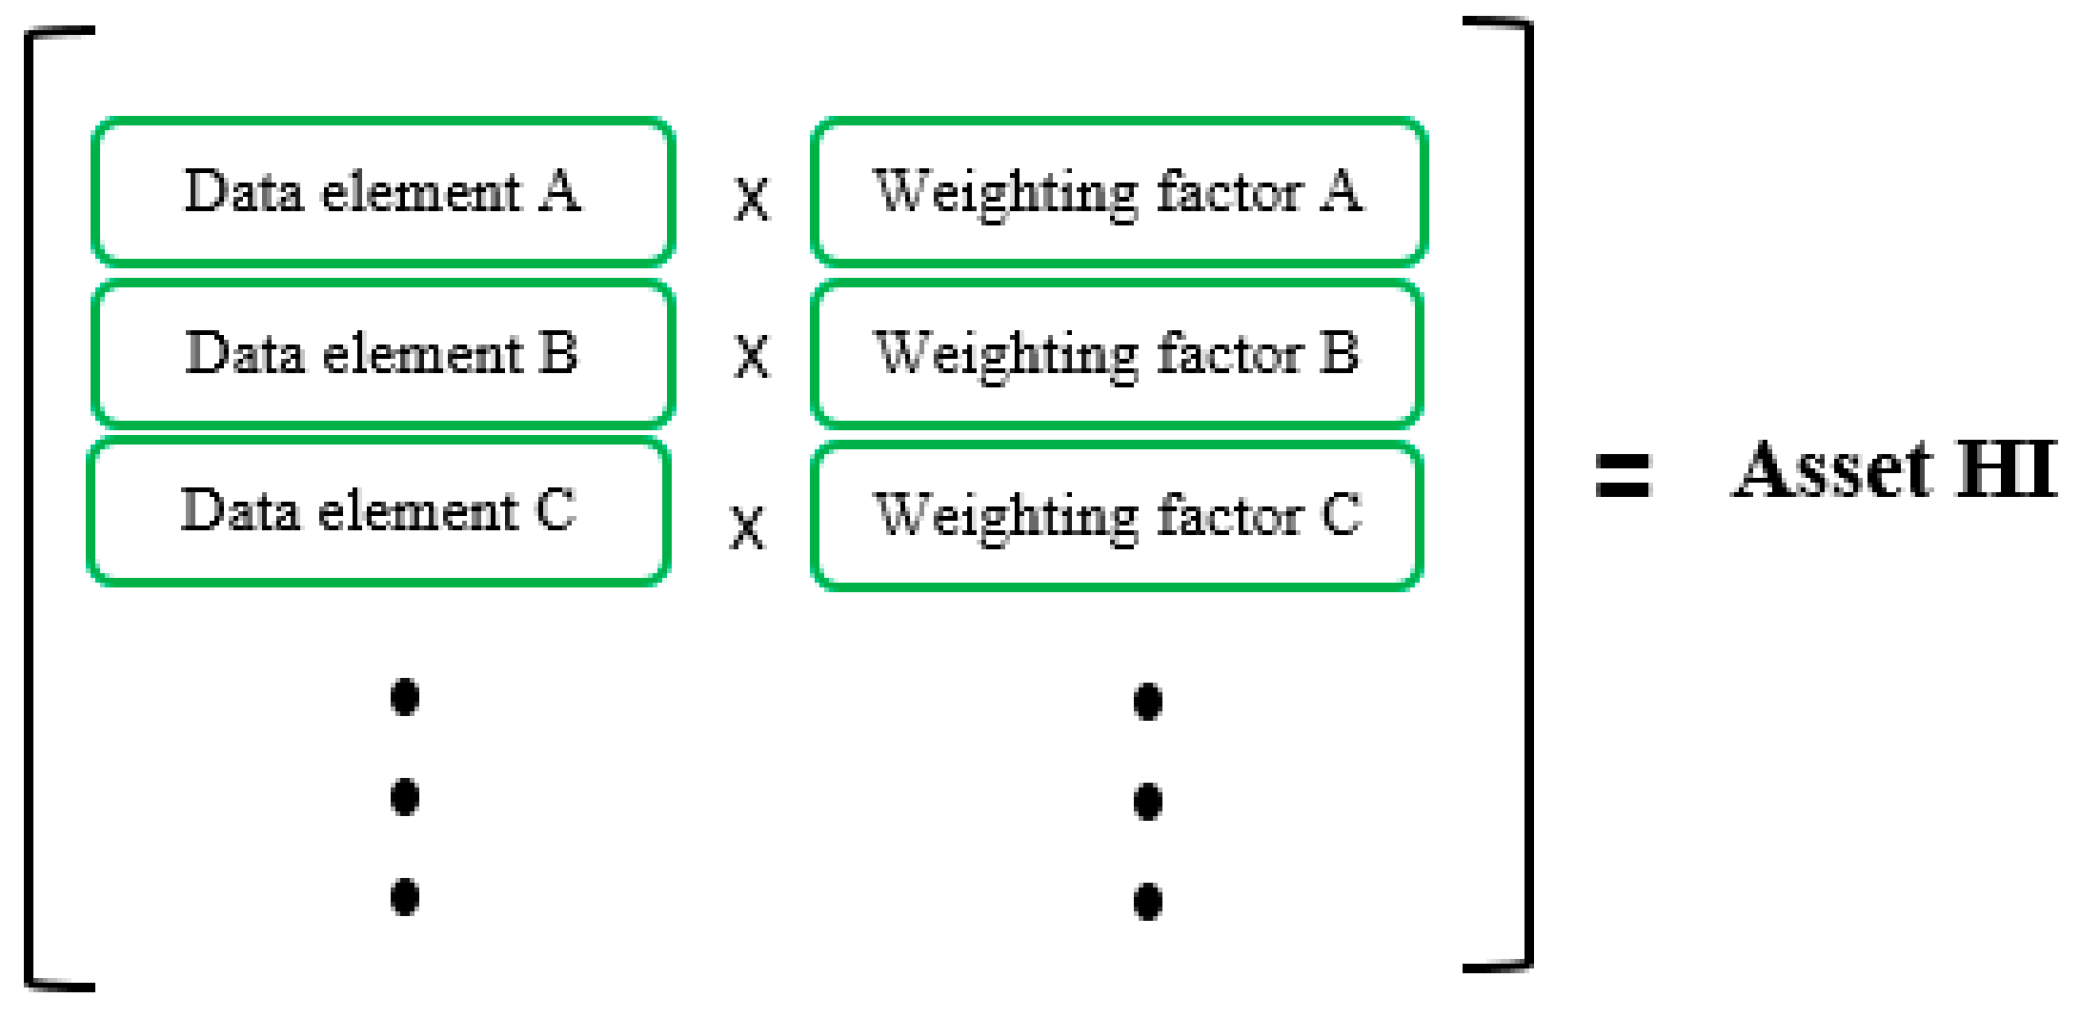
Figure 1 shows an example of a basic framework of HI formulation, which is dependent upon the weighting factors in order to determine the final HI [28].
Equation (1) shows the common HI formulation introduced in [9,10], which was adopted in this study:
H I = A % j = 1 21 K j H I F j j = 1 21 4 K j + B % i 24 K j H I F j j = 22 24 4 K j
where Kj is the assigned rating given for each factor, HIFj is the assigned score for each factor and j is the number of condition data. According to [9,10], the constant values of A and B are 60% and 40%, respectively, which correspond to parameters of transformers and tap changers. In this study, the constants, A and B, were not considered since only transformer condition data are available for analysis. Furthermore, due to the limitation of data in the database, only oil quality, dissolved gases and furanic compounds were considered and the updated formulation of HI can be seen in Equation (2):
H I a d j u s t e d = K D G A H I F D G A 4 K D G A + K O Q A H I F O Q A 4 K O Q A + K F A H I F F A 4 K F A
Based on the HI score, several indicator scales can be determined, which can be seen in Table 1 [9,10,30].

3. Markov Model Structure with Health Index

3.1. Markov Chain Concepts

The MM is known as a probabilistic approach based on the Markov chain decision process that can be used to predict the future condition of equipment. It can be evaluated through state transition in a specific interval [15]. Since the MM does not rely heavily on historical conditions of equipment which are normally limited, the uncertainty effect due to constraints of a long-term data record could be minimized. Thus, the decision process is considered as a memoryless process [31]. Figure 2 illustrates the representation of the Markov chain for this study, which considers 5 states as stated in Table 1.
Generally, the Markov chain is determined by transition probabilities given as Pij [32,33]. Transition matrix, P, represents the transition probabilities. The corresponding transition matrix, P, for 5 states of MM used in this study is shown in Equation (3) as following:
P = [ P 55 1 P 55 0 0 0 0 P 44 1 P 44 0 0 0 0 P 33 1 P 33 0 0 0 0 P 22 1 P 22 0 0 0 0 1 ]
In order to analyze the MM based on the HI of transformers, several assumptions were made. First, a monotonic process was assumed where the states of transformers either remained at its current state or moved to the next state. The assumption was made based on the fact that ageing of transformers was irreversible, of which data screening was carried out to filter transformers that have been refurbished either through rewinding or oil regeneration. In order to further simplify the Markov chain process, the transition probabilities were assumed to be stationary and maintain over time. Thus, the same value of probability Pij (t) was considered in a particular year. In addition, each state probabilities should be equal to one, for example, P55 + P54 = 1, P44 + P43 = 1, P33 + P32 = 1 and P22 + P21 = 1. The final state was set as 1, assuming that all transformers would end up in the poorest condition and remained at the last state. This concept of the MM is known as an absorbing model. Once the transition matrix has been developed, the future states of the HI of transformers can be determined based on the current state shown in Equation (4):
  H n + 1 = H n · P
where Hn+1 is the next state in a particular interval and Hn is the current state. The future state of the HI can also be determined by the MM based on the following equation:
  H t = H 0 · P t
where t is the number of intervals,H0 is the initial state and Ht is the future deterioration state in t.

3.2. Transition Probability Derivation

Transition probabilities are the core element of the MM process, which can be determined by heuristic or statistical approaches. A heuristic approach utilizes knowledge from the degradation characteristic of a component. The statistical approach uses statistical techniques, such as frequency of transition, Maximum Likelihood Estimator (MLE), Least Square (LS), time spent and regression. In this study, the transition probabilities were computed based on the frequency of the transition approach, which was implemented according to the HI and the state classification. The transition probabilities for each state in the transition matrix can be seen in Equations (6) and (7) as following:
  P i j = P r o b [ H ( t + 1 ) = j | H ( t ) = j ]
  1 P i j = P r o b [ H ( t + 1 ) = j 1 | H ( t ) = j ]
where Pij is the transition probability for equipment remaining at the existing state and 1 − Pij is the probability for equipment moving to the next state. Both probabilities depend on the present state j. In order to determine the future state for the next interval, t + 1, the transition probabilities were calculated, where each iteration fulfilled the Chapman-Kolmogorov rules and can be seen in Equations (8)–(12):
  P 5 ( t + 1 ) = P 5 ( t ) ( 1 P 54 )
  P 4 ( t + 1 ) = P 5 ( t ) ( 1 P 54 ) +   P 4 ( t ) ( 1 P 43 )
  P 3 ( t + 1 ) = P 4 ( t ) ( 1 P 43 ) +   P 3 ( t ) ( 1 P 32 )
  P 2 ( t + 1 ) = P 3 ( t ) ( 1 P 32 ) +   P 2 ( t ) ( 1 P 21 )
  P 1 ( t + 1 ) = P 2 ( t ) ( 1 P 21 ) +   P 1 ( t )

Frequency of Transition

Frequency of transition is among the common approaches to determining the transition probabilities [16,34]. This method takes into consideration the number of equipment residing in each state between time intervals. In this study, 2 consecutive snapshots of HI were used to determine the frequency of transition. A set of transformer data from the year 2012 to 2015 was utilized. Two transition probabilities were computed using the frequency of the transition approach utilizing transformer transition states for the year 2013/2014 and 2012/2013. The transition probabilities can be obtained by Equation (13):
  P i j = n i j n i
where nij is the number of transformers transit from a state i to j in one year period and n i = j n i j is the number of transformers in state i before the transition.
Once the transition probabilities were established, the transition matrix was determined based on Equation (3), and the deterioration probability rate was calculated according to Equation (5) based on the assumption that the initial condition state vector, H0 equal to [1 0 0 0 0].

4. Maintenance Policy and Cost

The maintenance cost is associated with the cost spent for the maintenance actions by utilities to ensure transformers to operate at the optimum level [
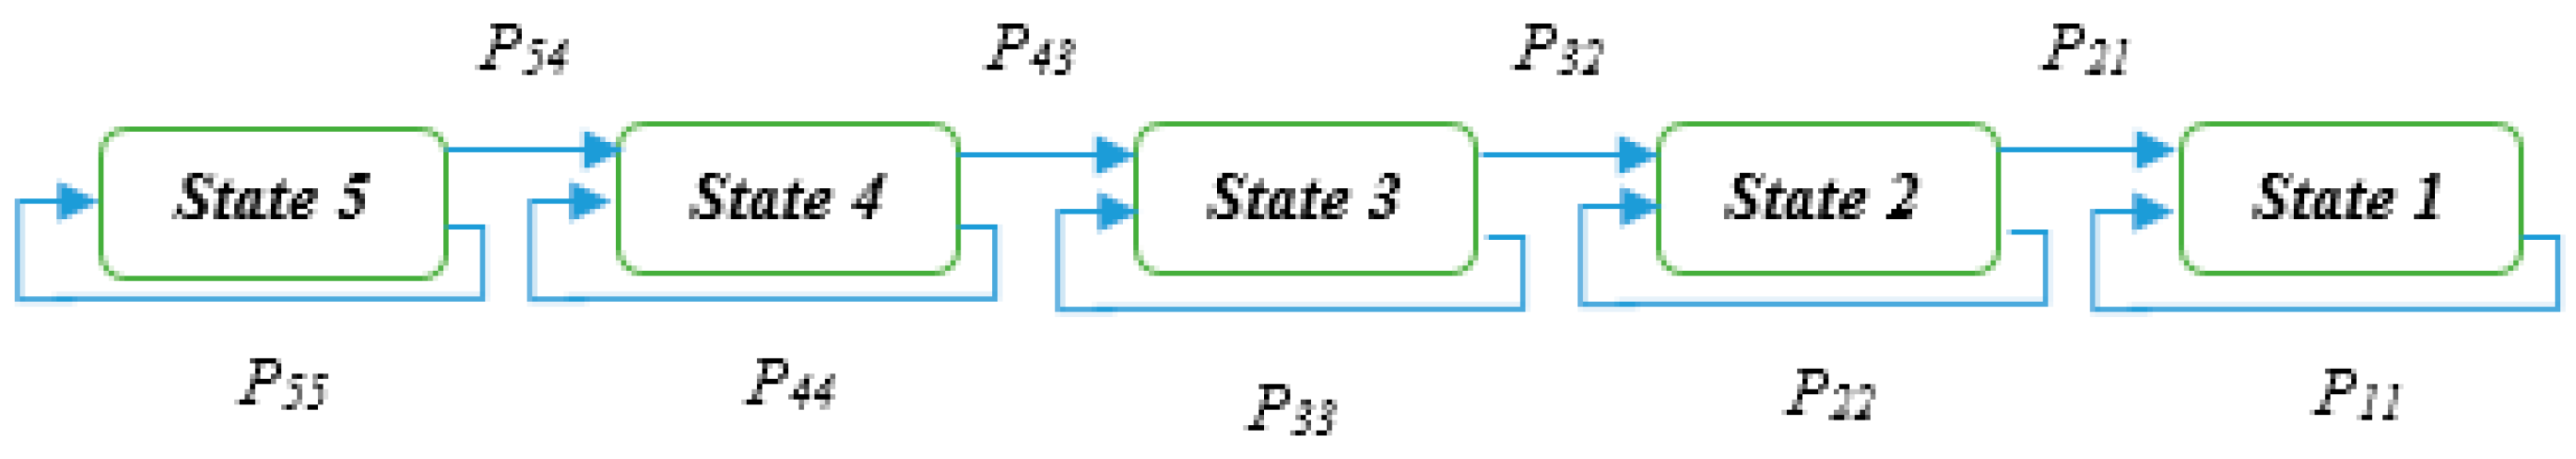
35]. Based on the future state probabilities of the transformer model obtained by the MM, the maintenance policy can be determined. The rehabilitation can be modelled by allowing the current state of transformers to return to its preceding state [25,26,27]. A new transition matrix to represent the effect of rehabilitation actions has been introduced in this study, whereby appropriate maintenance approaches were considered, since it was quite difficult to obtain detailed information on the generic maintenance policy model. Based on [36], there are 3 main maintenance approaches that can be used for transformer operation and maintenance actions known as Condition Assessment (CA), minor work that involves Corrective Maintenance (CM) and major work which consists of refurbishment and replacement. In this study, several assumptions were made for the maintenance policy model. The CA was conducted for transformers in all states. It was performed annually to monitor the transformer condition without improving the condition state. For any transformer at State 2 (poor), CM was carried out to improve the condition to State 5 (very good), while for any transformers in State 1 (very poor), major work was carried out to improve the condition to State 5 (very good). The maintenance actions, intervention states, maintenance activities and estimated cost breakdowns can be seen in Table 2. The average cost for each maintenance activity from 3 different Original Engineering Manufacturers (OEMs) was used in this study.
Based on the given transition-state probability matrices for the year 2013/2014 and 2012/2013, the future-state probability distribution of the transformer was simulated based on 10% pre-determined maintenance policy model. The matrix of the corresponding maintenance policy model for each of the states, R, is given by:
R = [ 1 0 0 0 0 0 1 0 0 0 0 0 1 0 0 0.1 0 0 0.9 0 0.1 0 0 0 0.9 ]
The combined effect of the normal deterioration and the maintenance policy model is expressed as PR [27]. These Markov chain models were solved to find future-state probabilities at a certain year, n, by iterating the initial-state distribution matrix with the combined effect of deterioration and maintenance policy matrices, as shown in Equation (15):
  H n = H 0 ( P R ) n
Next, the model was evaluated to assess the relative cost impact throughout the life cycle term based on the information in Table 2. Since each of the state j is associated with the maintenance cost known as C, and hence, the expected maintenance cost of each future state for each year, n, can be determined based on Equation (16):
  E x p e c t e d   C o s t = H 0 ( P R ) n C n
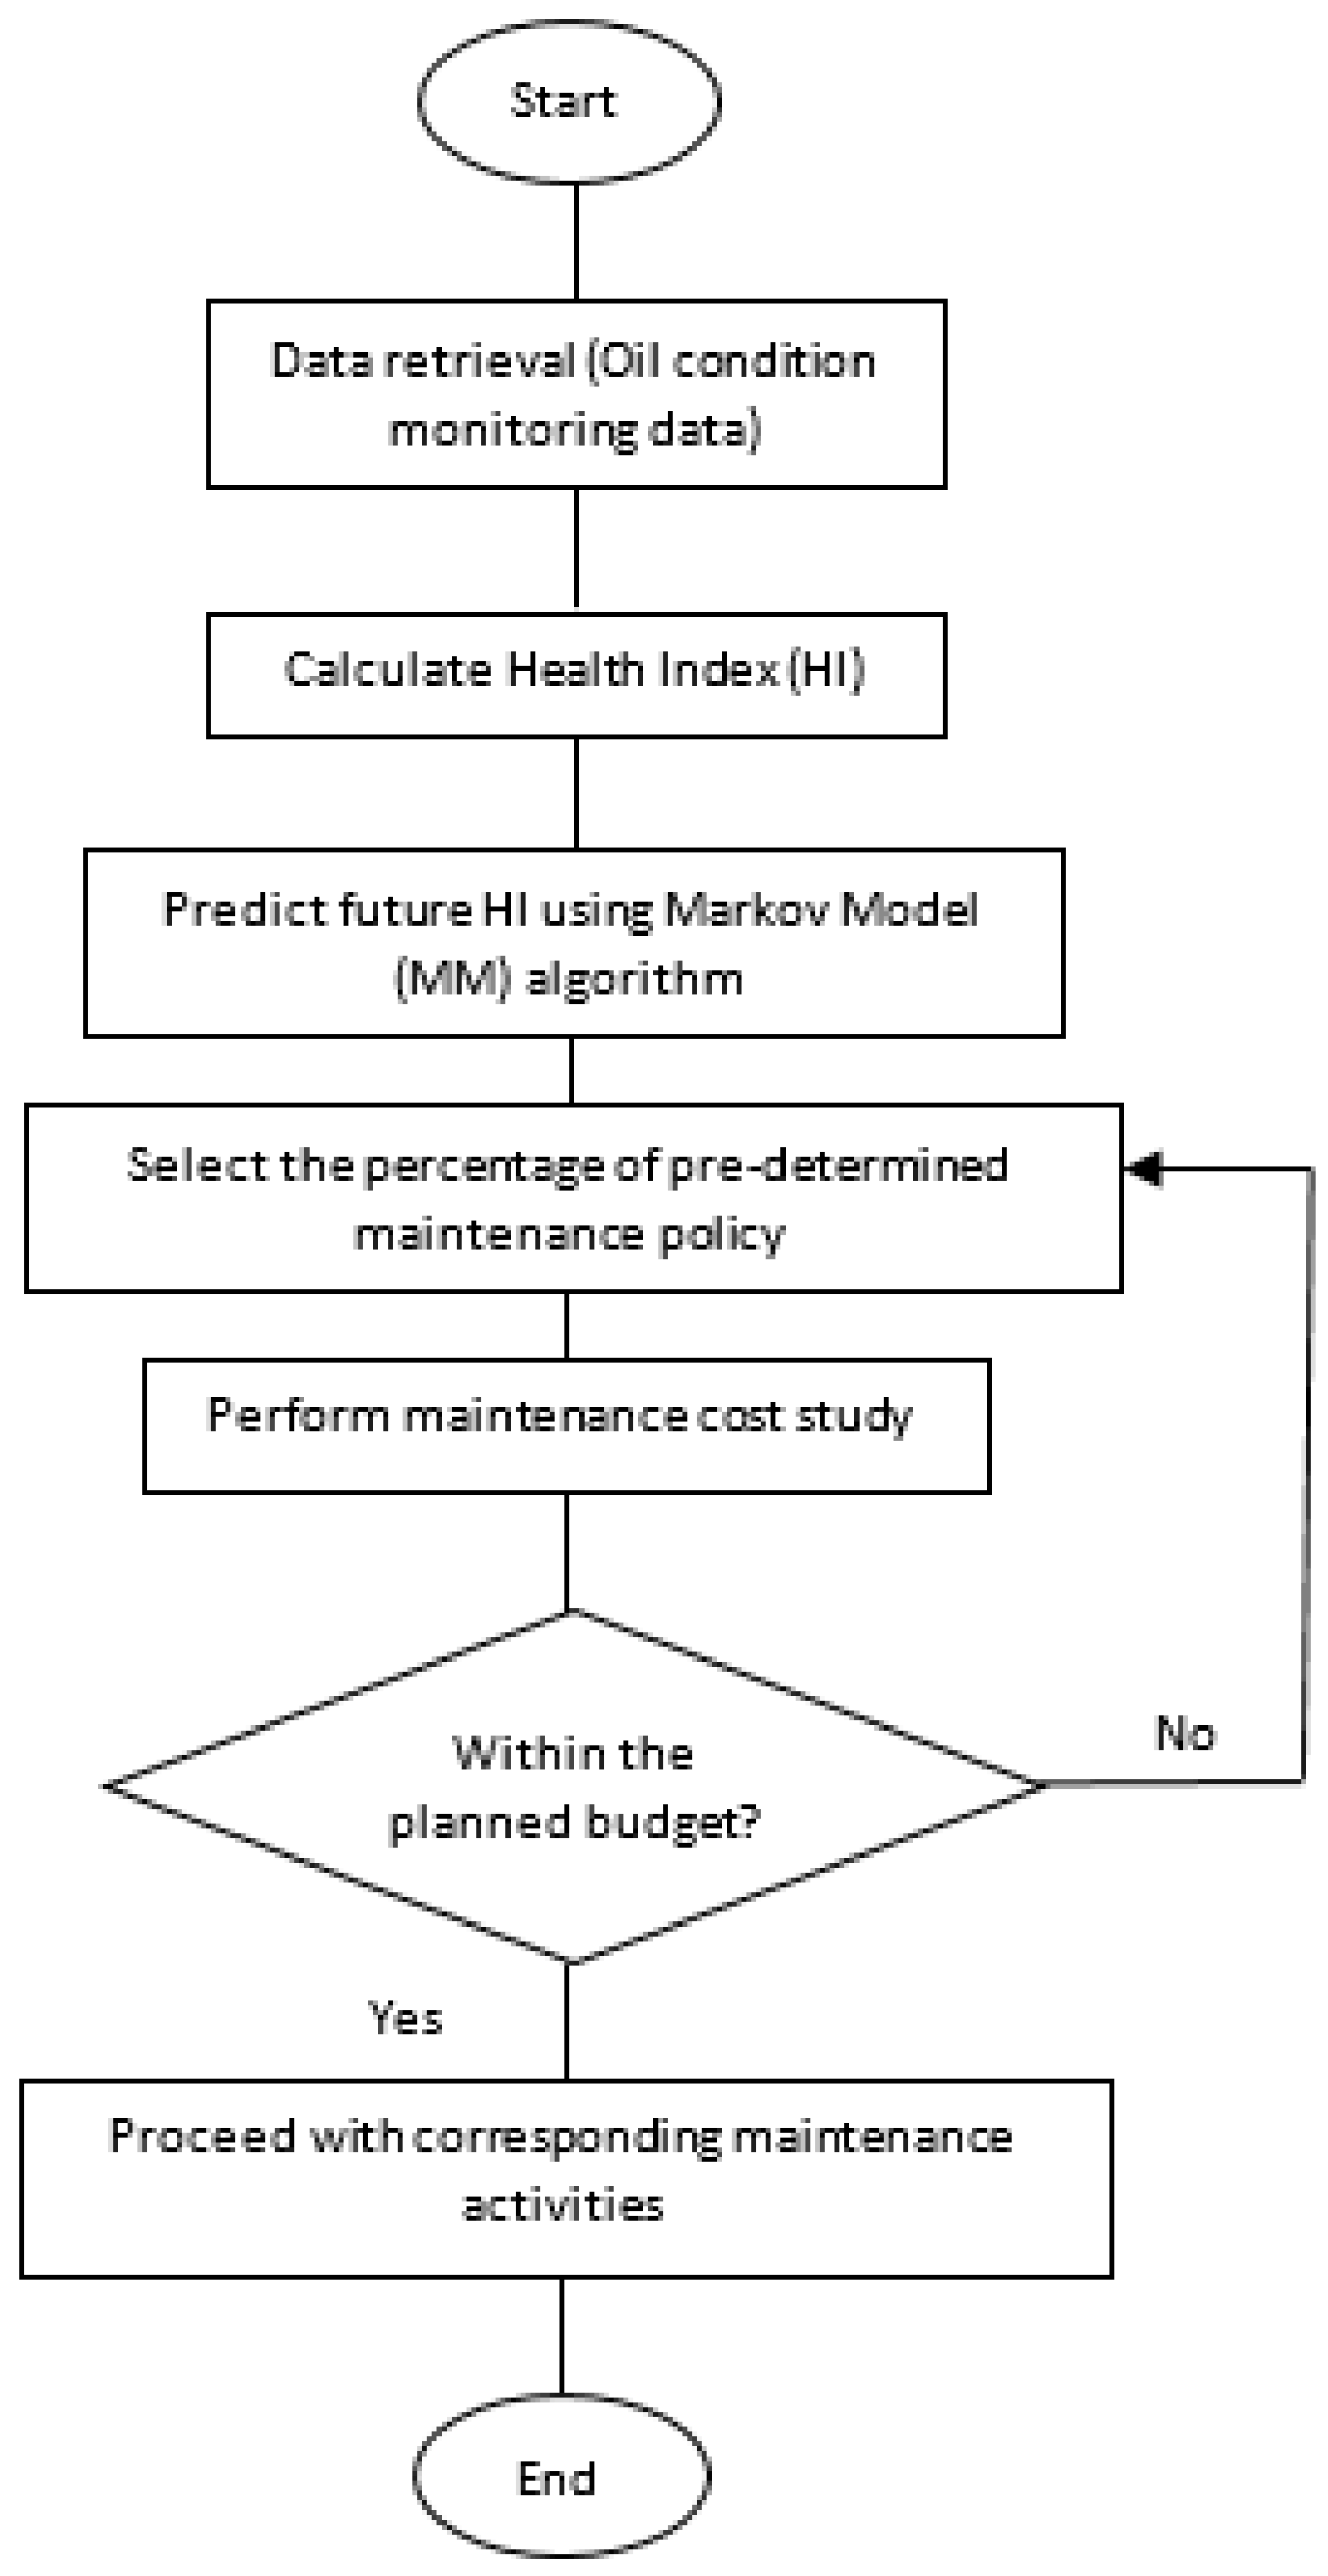
The overall workflow on the maintenance cost study can be seen in Figure 3. The model can be updated based on yearly historical data of the transformer population. In this study, the percentage of pre-determined maintenance policy has been determined based on assumptions in order to simulate the cost sensitivity for the maintenance policy. Dependent upon the budgetary, utilities can plan the percentage of the pre-determined maintenance policy in order to optimize the asset management of the transformer population.

5. Application of Markov Model for 33/11 kV Distribution Transformers

In this study, 120 transformers (33/11 kV and 30 MVA) were analyzed for MM. First, the states of all transformers obtained by the MM were defined based on the HI indicator scale in Table 1. The classification of transformers is tabulated in Table 3.
Next, the numbers of transformers in its consecutive states were clustered according to its corresponding years, which can be seen in Table 4.
Since the condition monitoring of transformers was conducted annually, a yearly time period was used as the transition interval. The transformer transition states for the year 2013/2014 and 2012/2013 can be seen on Table 5 and Table 6. The transition probability matrices were determined based on the frequency of a transition technique that utilized the transformer transition states for the year 2013/2014 and 2012/2013 and can be seen in Equations (17) and (18) respectively:
P = [ 0.8947 0.1053 0 0 0 0 0.5652 0.4348 0 0 0 0 0.7391 0.2609 0 0 0 0 0.9615 0.0385 0 0 0 0 1 ]
P = [ 0.8261 0.1739 0 0 0 0 0.7600 0.2400 0 0 0 0 0.8696 0.1304 0 0 0 0 0.9524 0.0476 0 0 0 0 1 ]
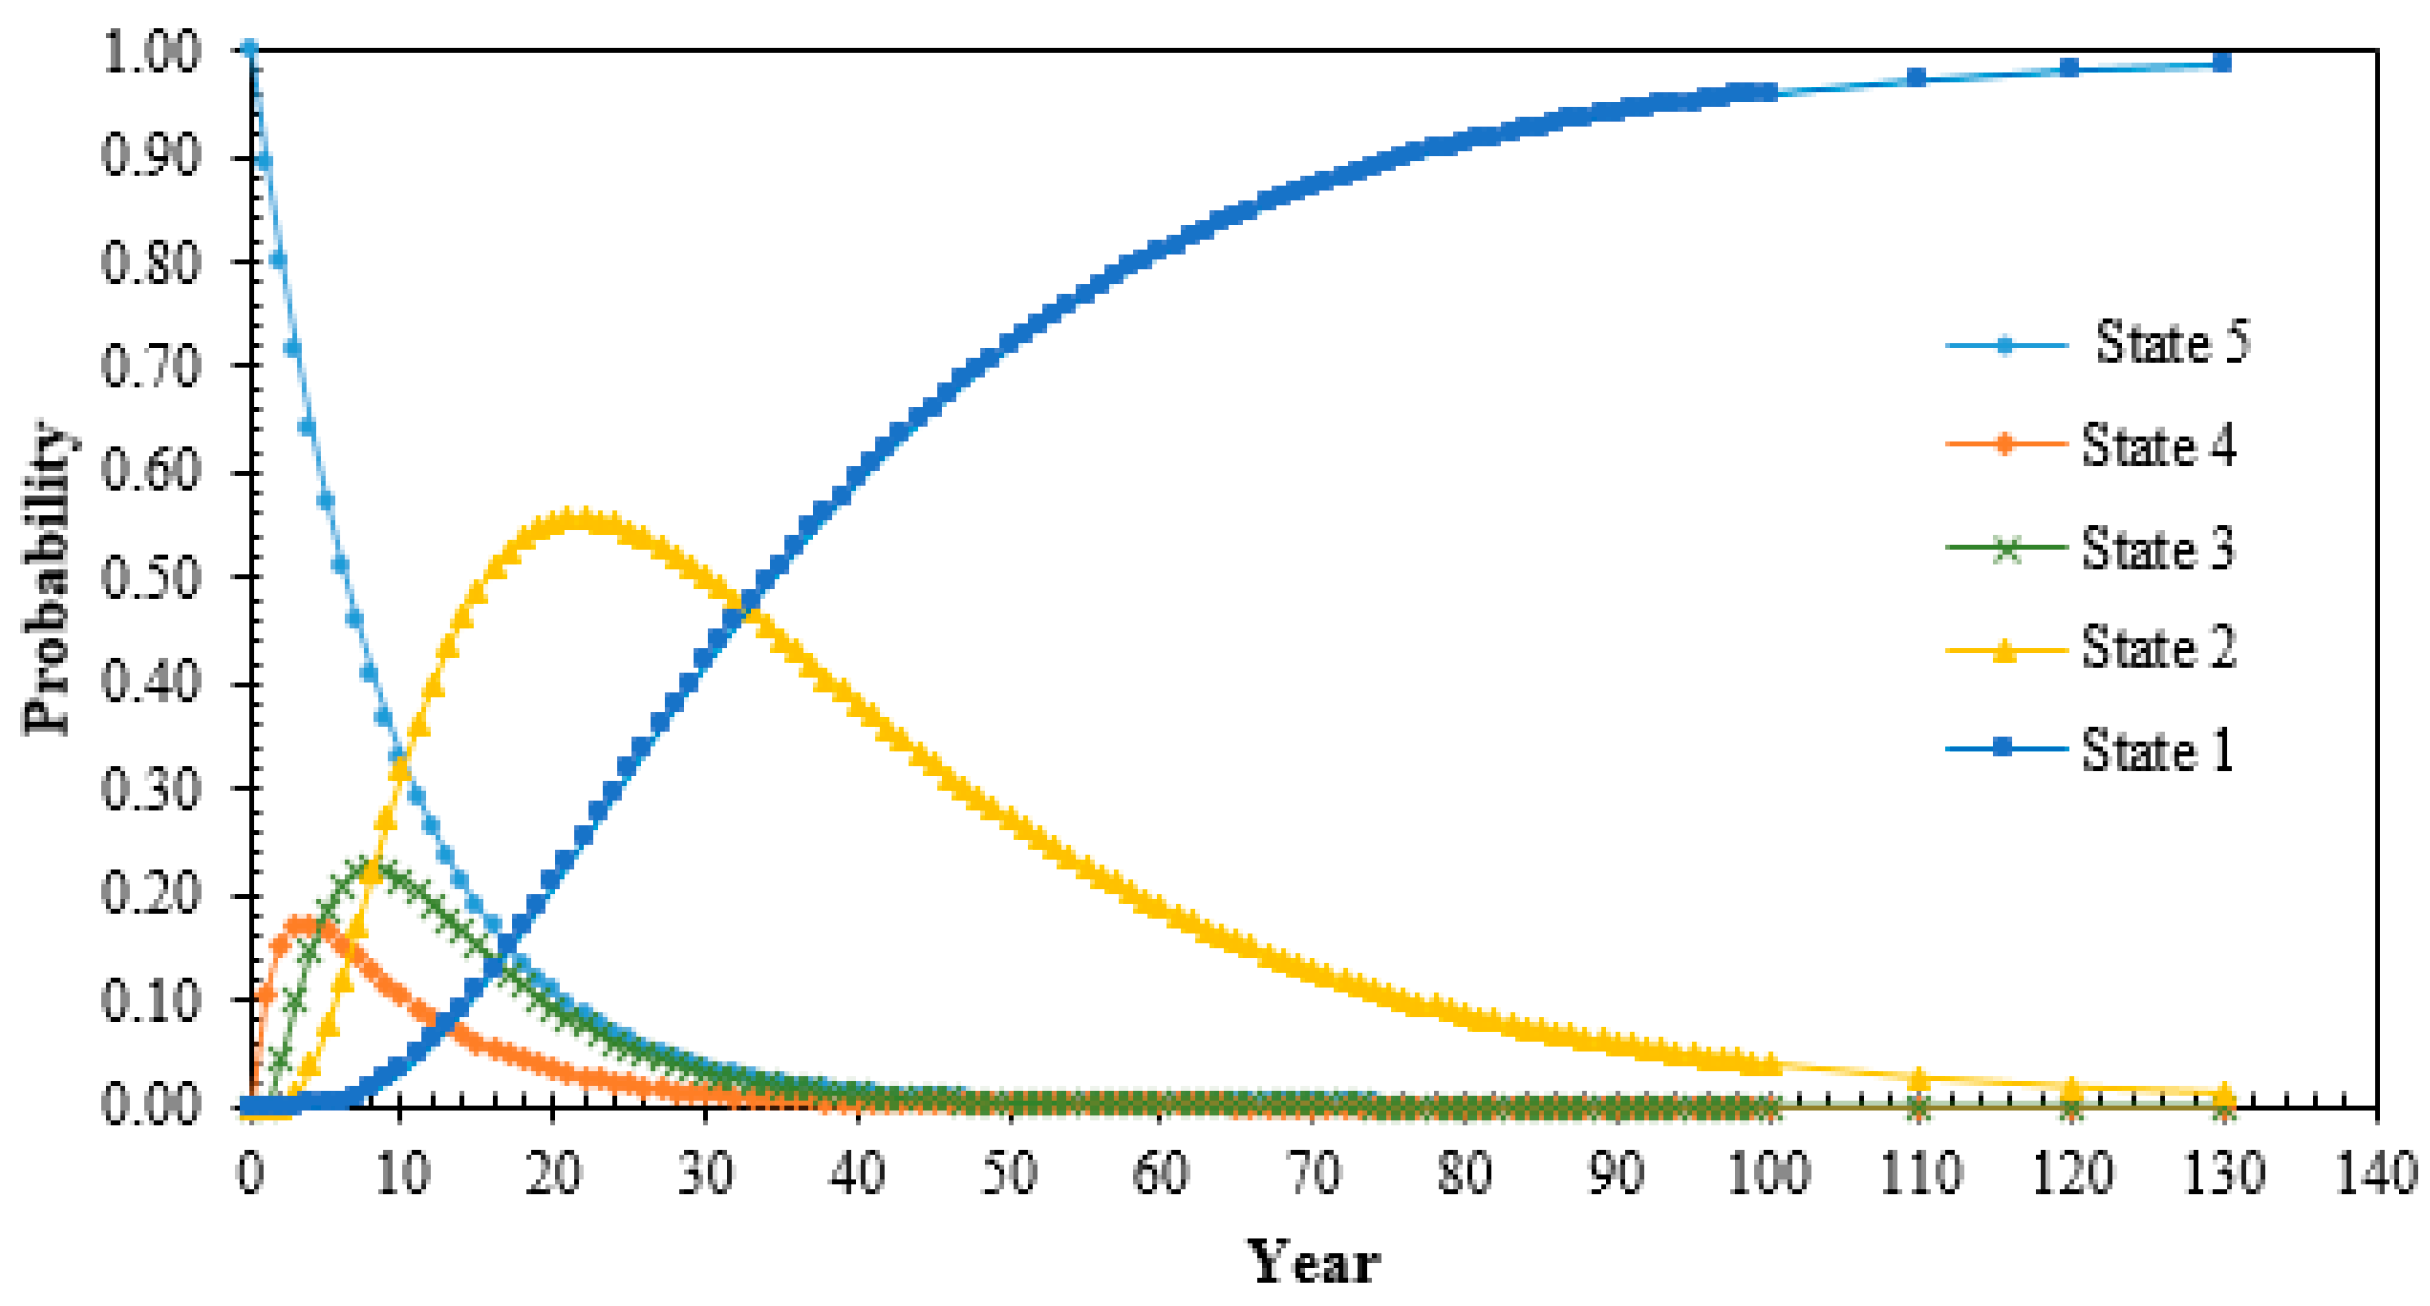
Next, the future states of transformers were calculated according to Equation (4). Figure 4 shows the state probabilities of transformers over the years predicted based on transformer transition states for the year 2013/2014. The number of transformers in its consecutives states can be determined through multiplication with its corresponding probabilities. The probability of State 1 is regarded as a critical state for transformers since the risk of failure is high. Based on this study, it is found that there is a 90% probability that the population of transformer will reach State 1 after 76 years based on the transformer transition states for the year 2013/2014.
The maintenance cost analysis was carried out based on the transition matrices computed from the MM. The future-state distributions were adjusted based on the maintenance policy model that utilized transition states for the year 2013/2014 and Equation (15). Table 7 shows the distribution of 120 transformers residing in each state for the period of 20 years. The maintenance cost for each of the state distributions was plotted based on Equation (16) and estimated cost defined in Table 2.
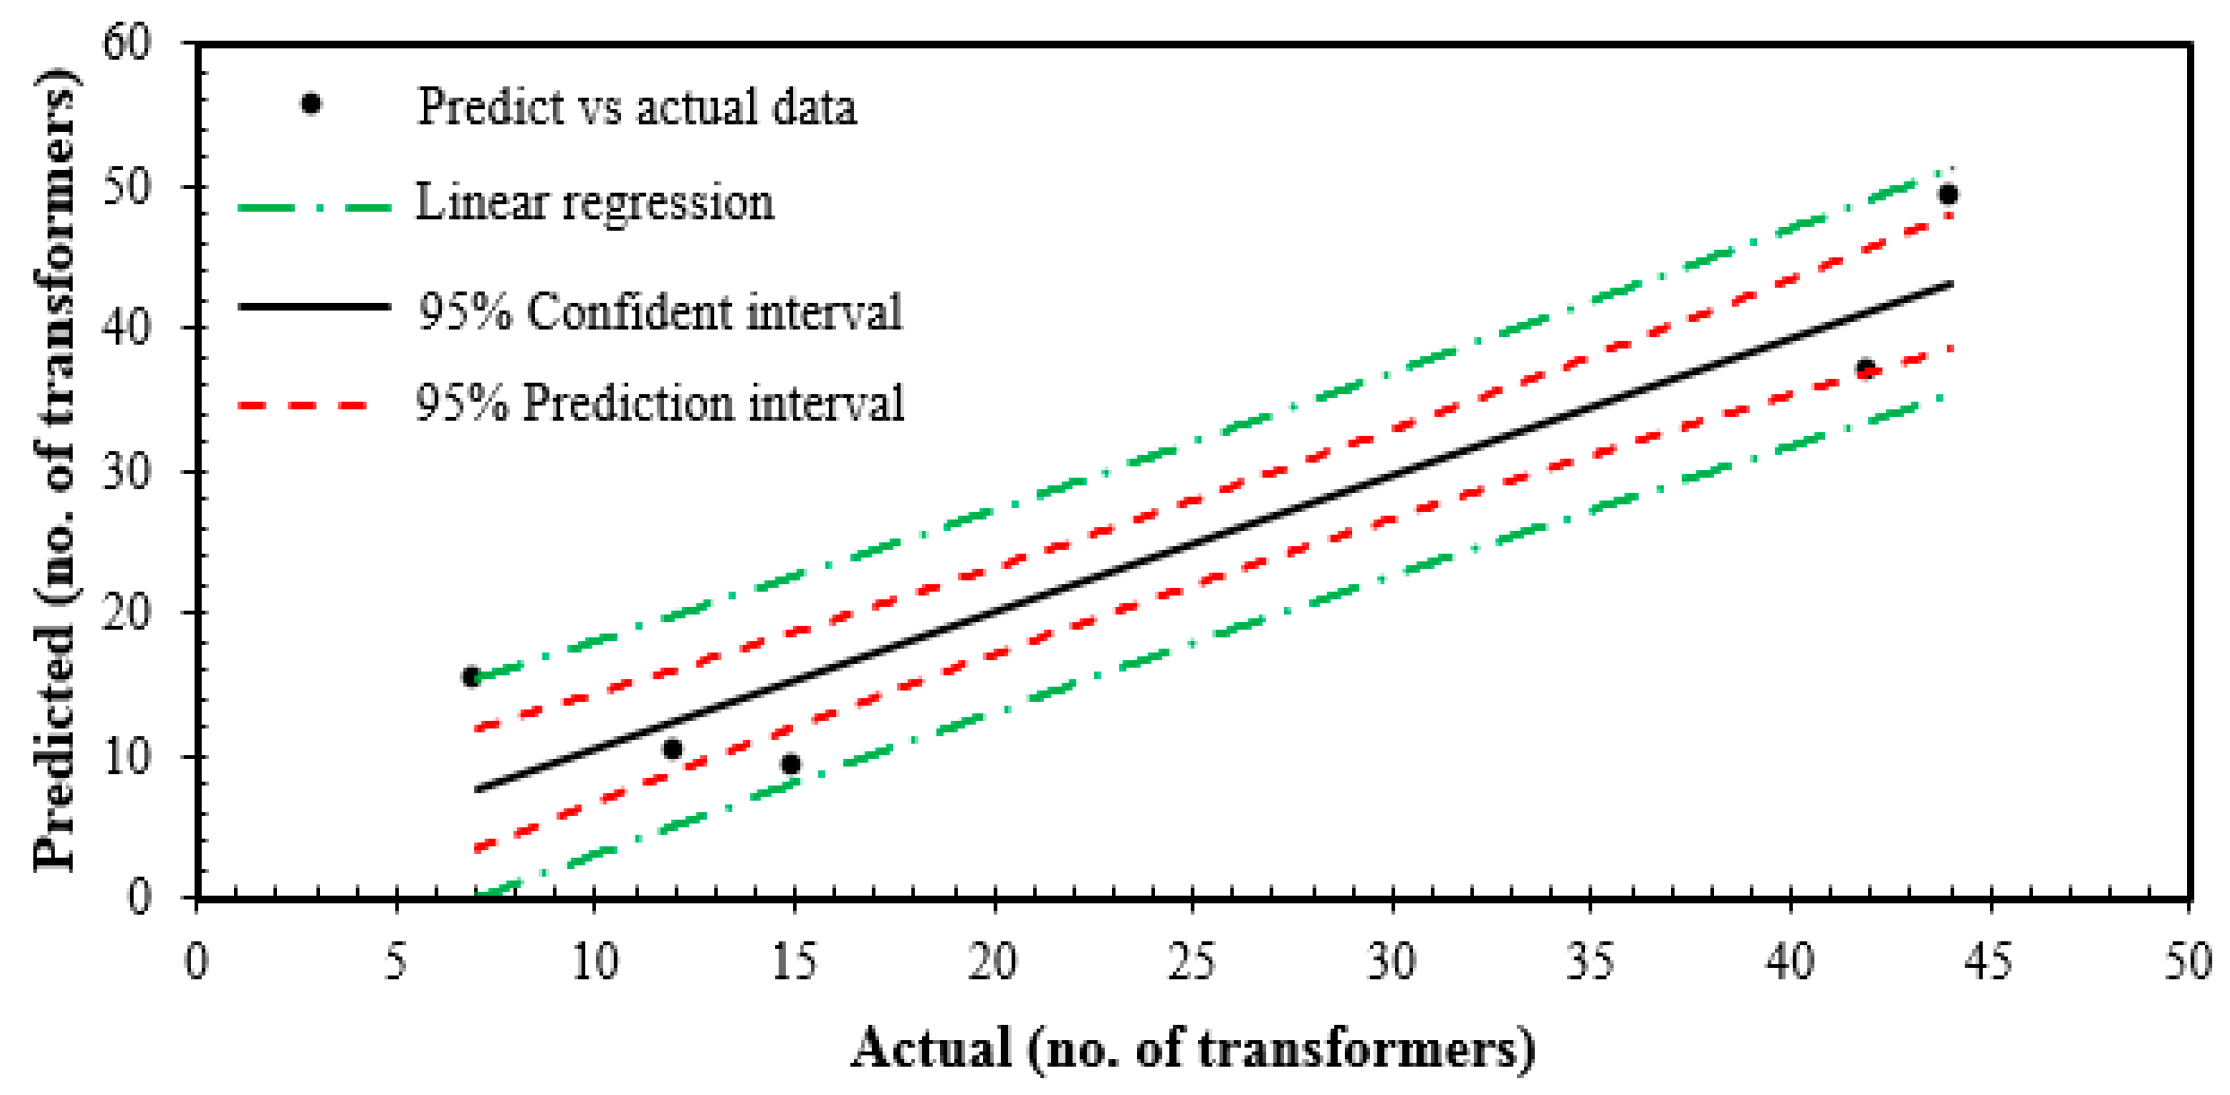
The relationship between the predicted and actual computed numbers of transformers was further analyzed based on a linear regression technique, which can be seen in Figure 5. The r2 value of the line fitting was 0.8826. It is found that the data exceeded the confidence interval, but were still within the prediction interval.
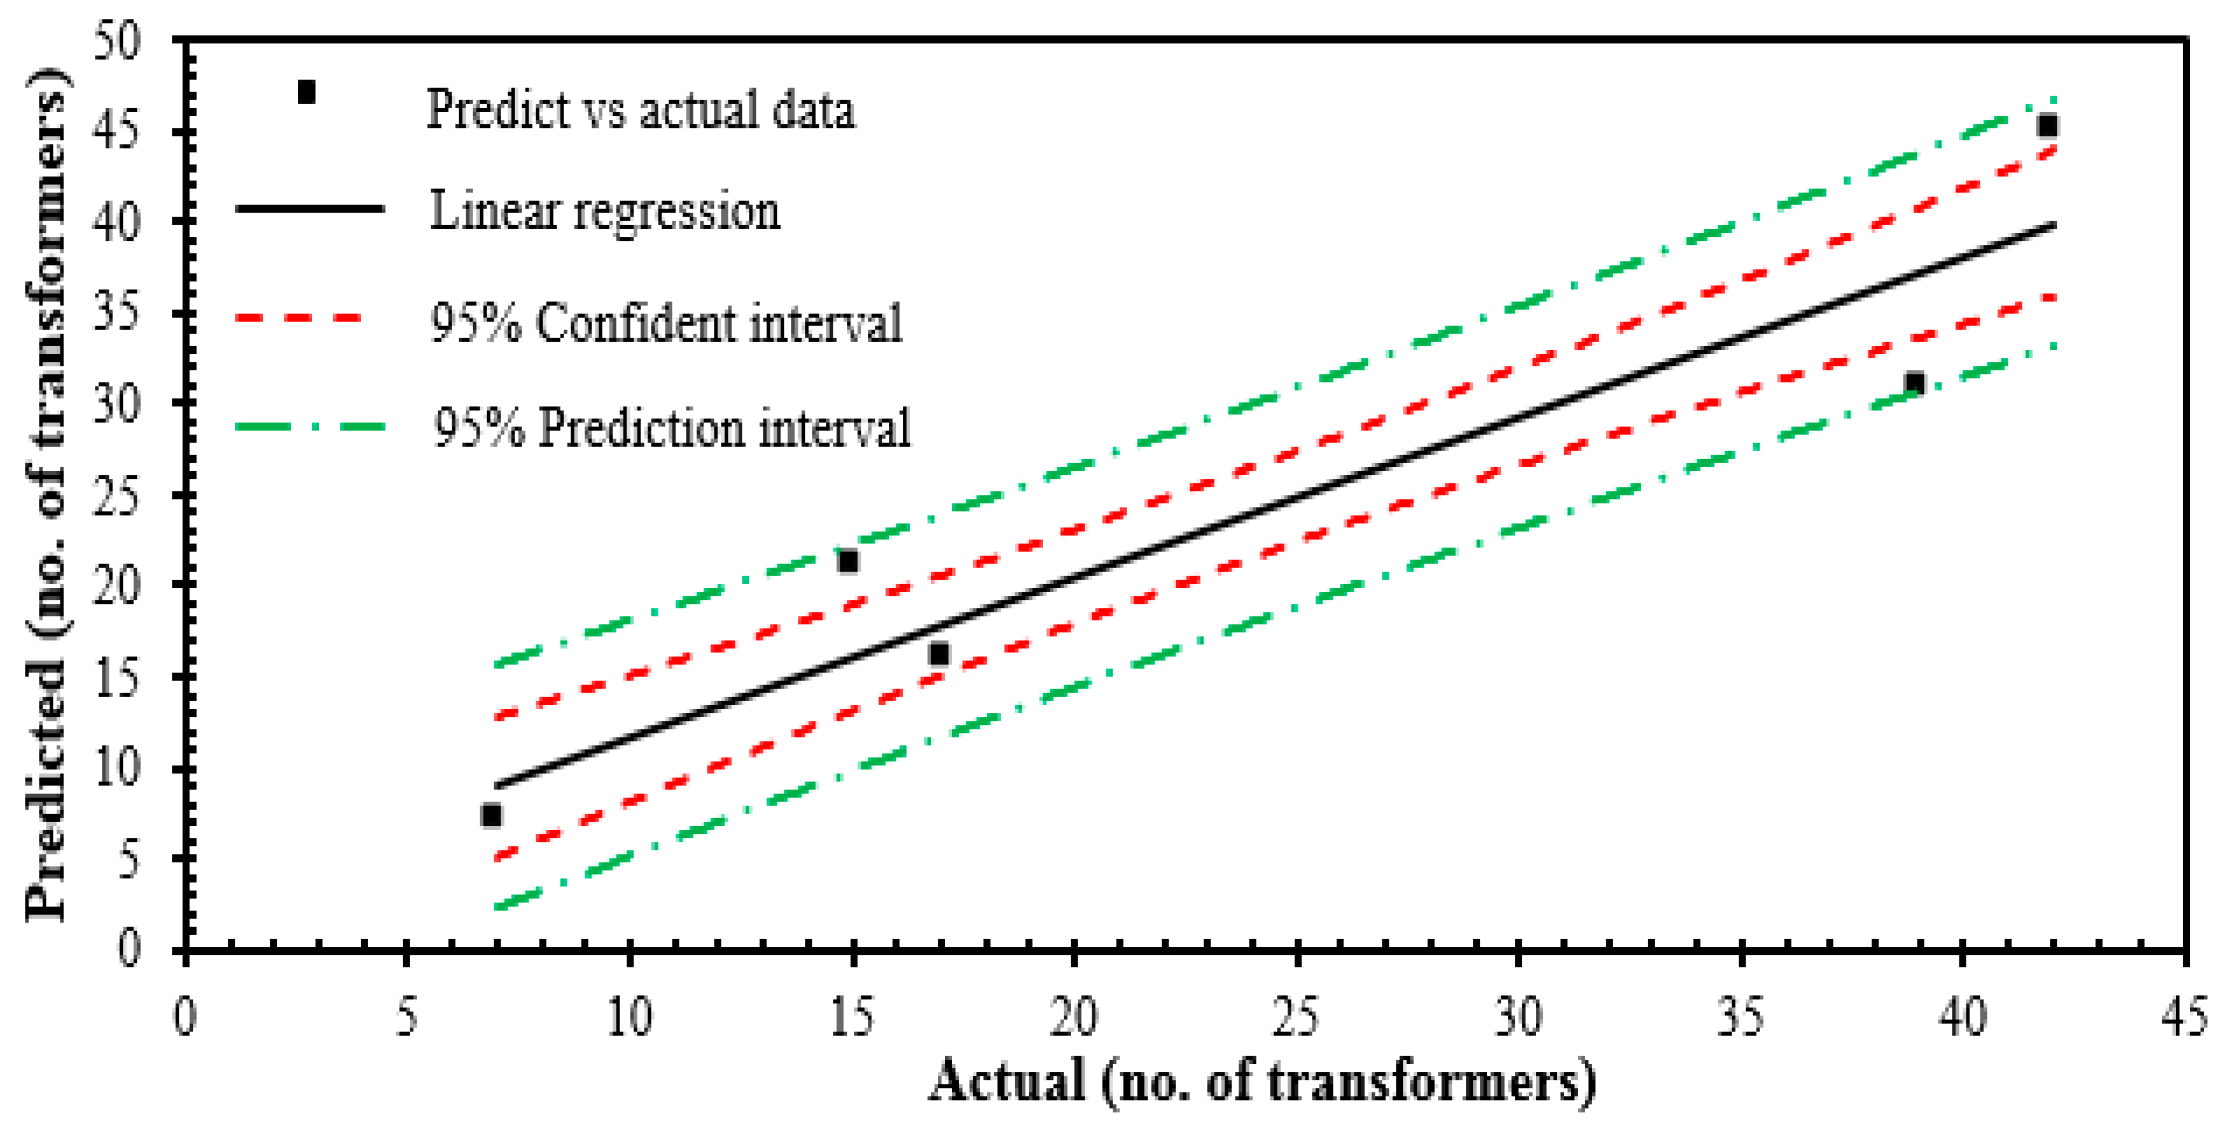
An analysis was also carried out based on transformer transition states for the year 2012/2013. A comparison was carried out between the predicted and actual computed numbers of transformers for the year 2014 and 2015, as shown in Figure 6 and Figure 7. A similar finding was observed in Figure 5, where the data exceeded the confidence interval but were still within the prediction interval. For both fittings, the r2 values were 0.8864 and 0.8619 for the year 2014 and 2015, respectively.
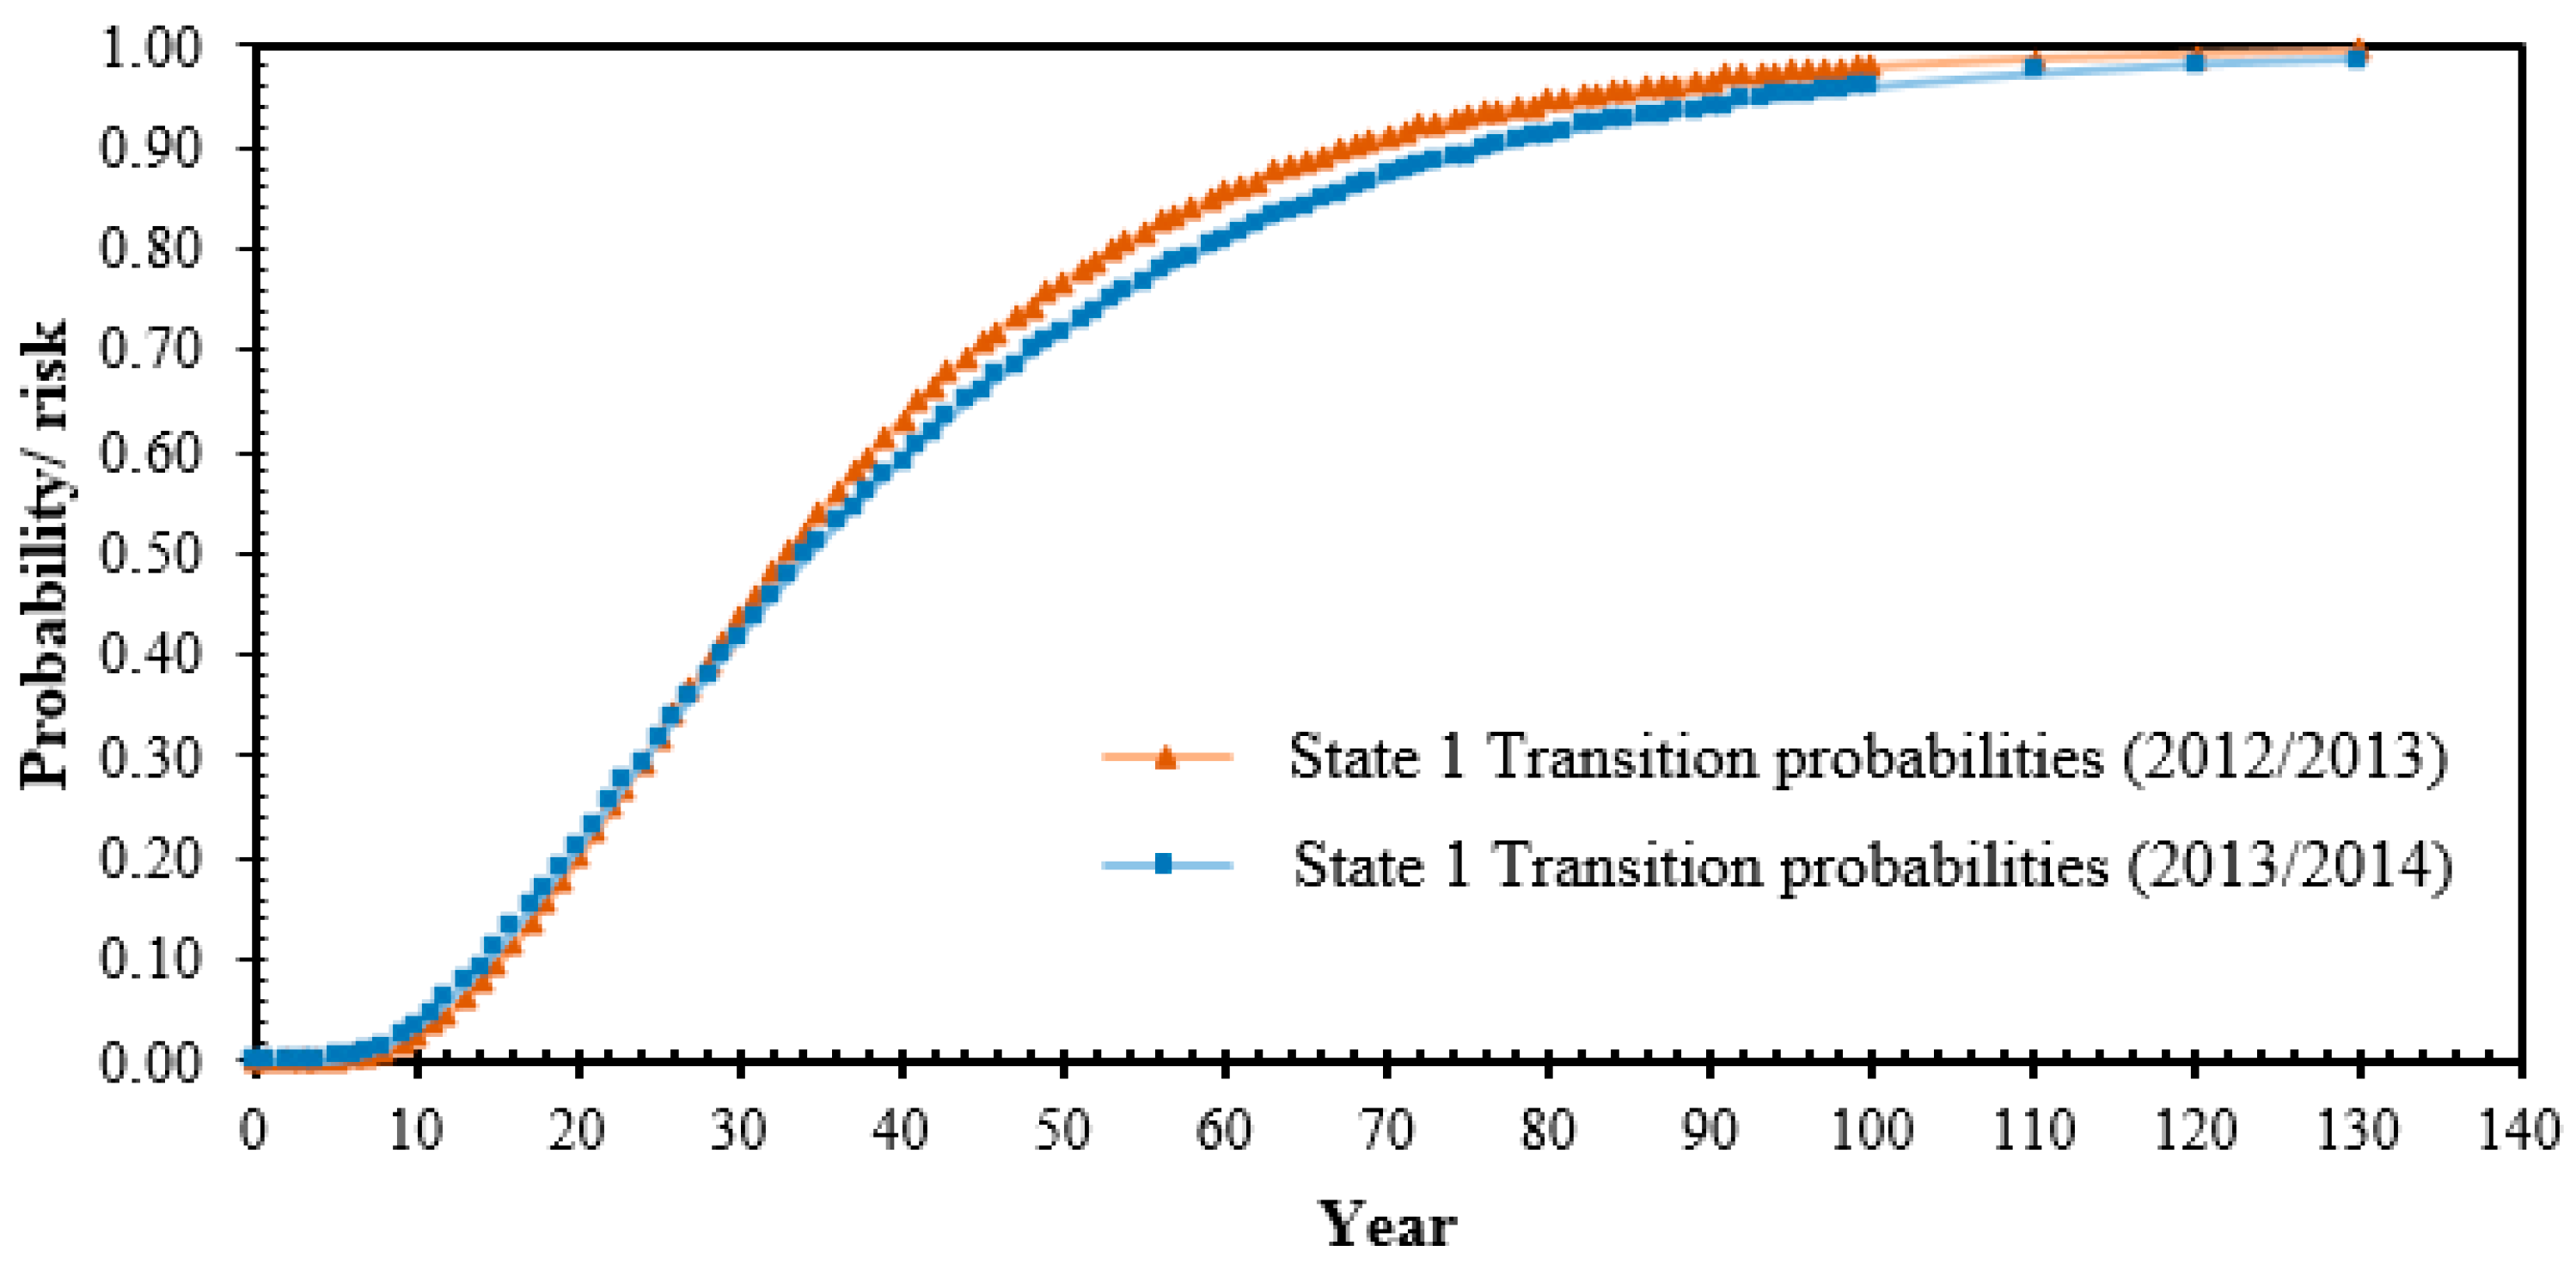
The predicted state probabilities over the years for State 1 in the year 2015 based on transformer transition states for the year 2013/2014 and 2012/2013 are shown in Figure 8. The percentage of differences for states probabilities for different years were in the range from 0% to 4.87%. Based on the transformer transition states for the year 2012/2013, there is a 90% probability that the population of transformer will reach State 1 after 69 years, which are lower than the prediction based on transformer transition states for the year 2013/2014.
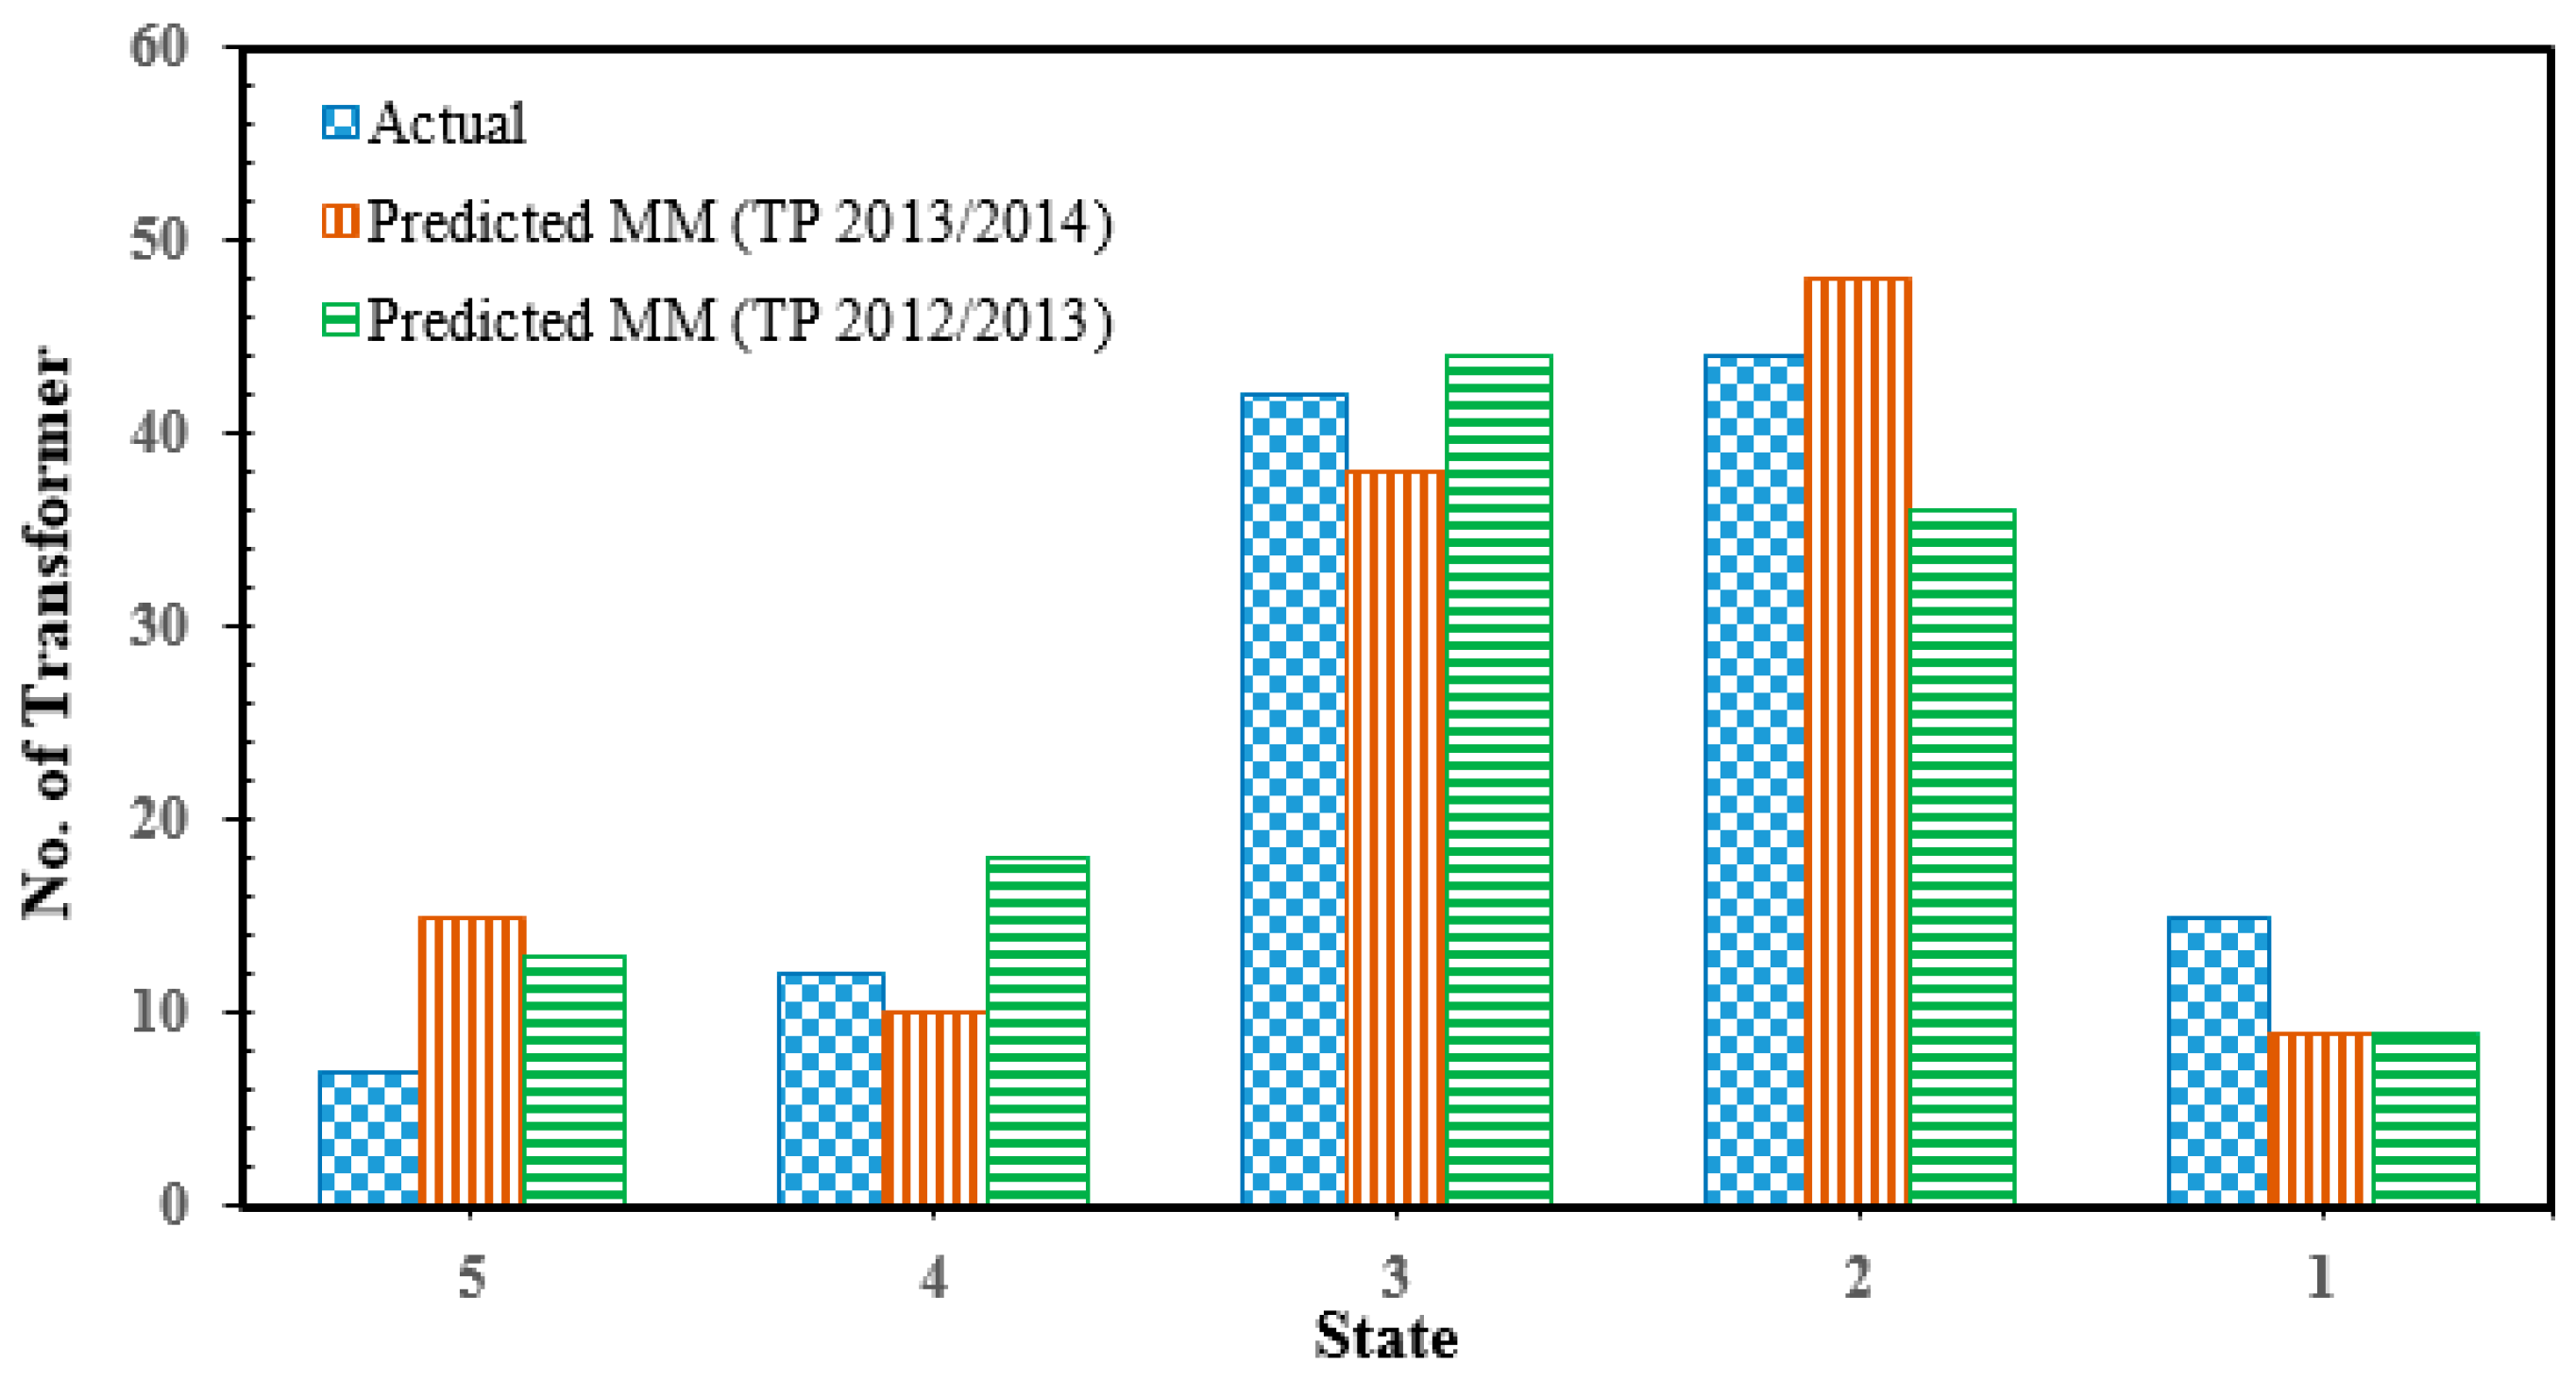
It is apparent that there was a slight deviation between the actual and predicted numbers of transformers for each state, as shown in Figure 9. Based on transformer transition states for the year 2013/2014, State 5 showed the highest deviation followed by State 1, State 4, State 3 and State 2. On the other hand, State 2 showed the highest deviation followed by State 5, State 4 and State 1 and State 3 based on transformer transition states for the year 2012/2013. For State 2 and State 4, the number of transformers predicted by transformer transition states for the year 2013/2014 is much closer to the actual computed number of transformers than that for the year 2012/2013. It was found that for State 3 and State 5, the number of transformers predicted based on transformer transition states for the year 2012/2013 is closer to the actual computed number of transformers than that for the year 2013/2014. For State 1, the number of transformers predicted based on transformer transition states for the year 2013/2014 is the same as that for the year 2012/2013.
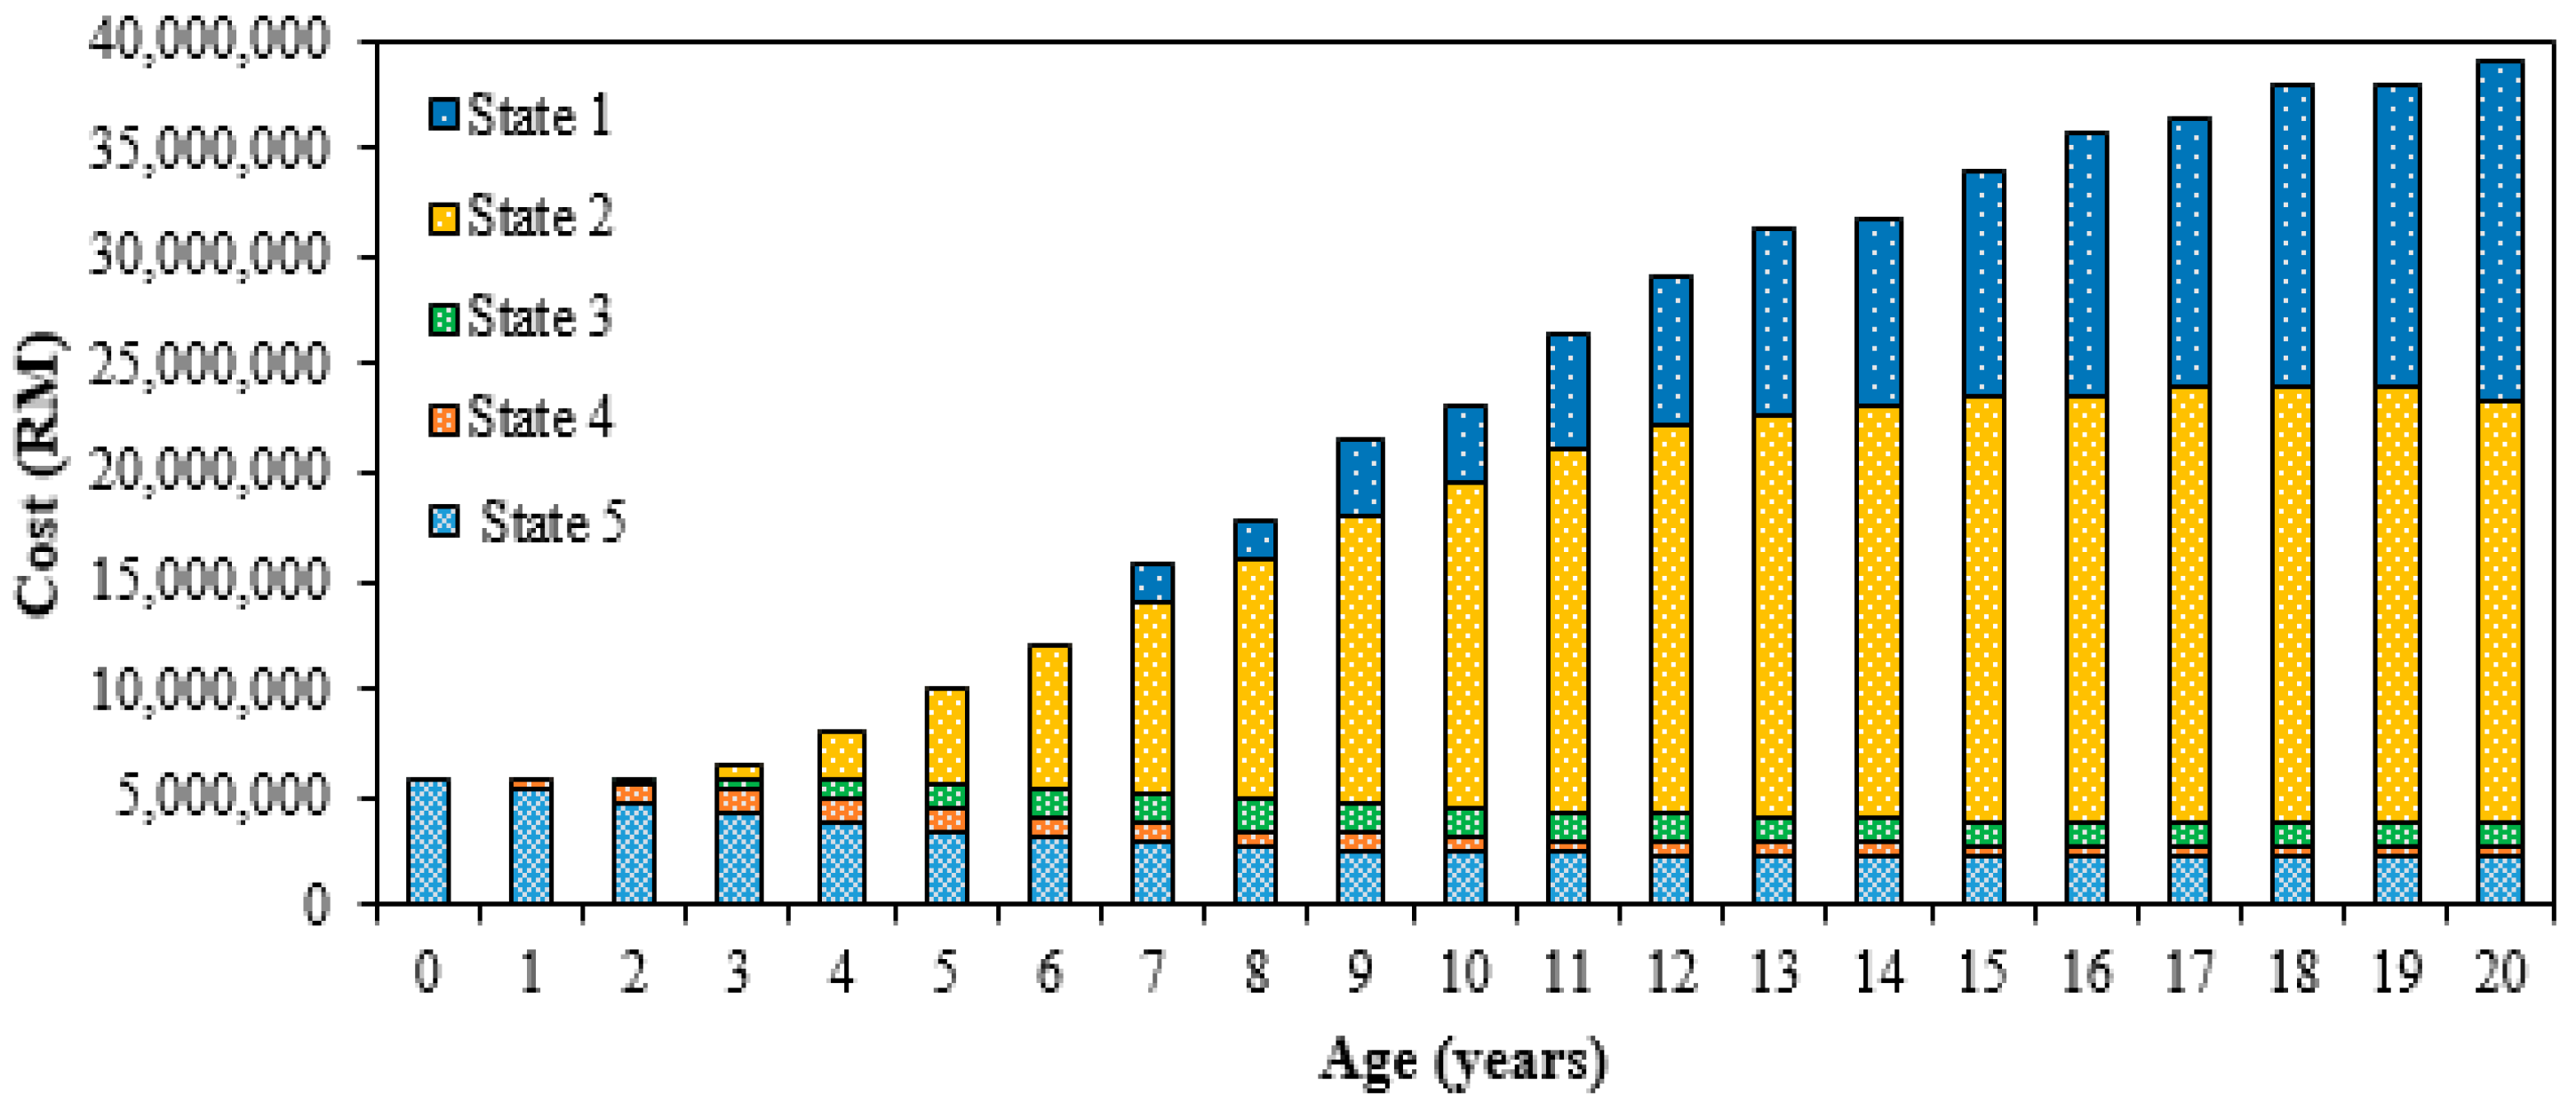
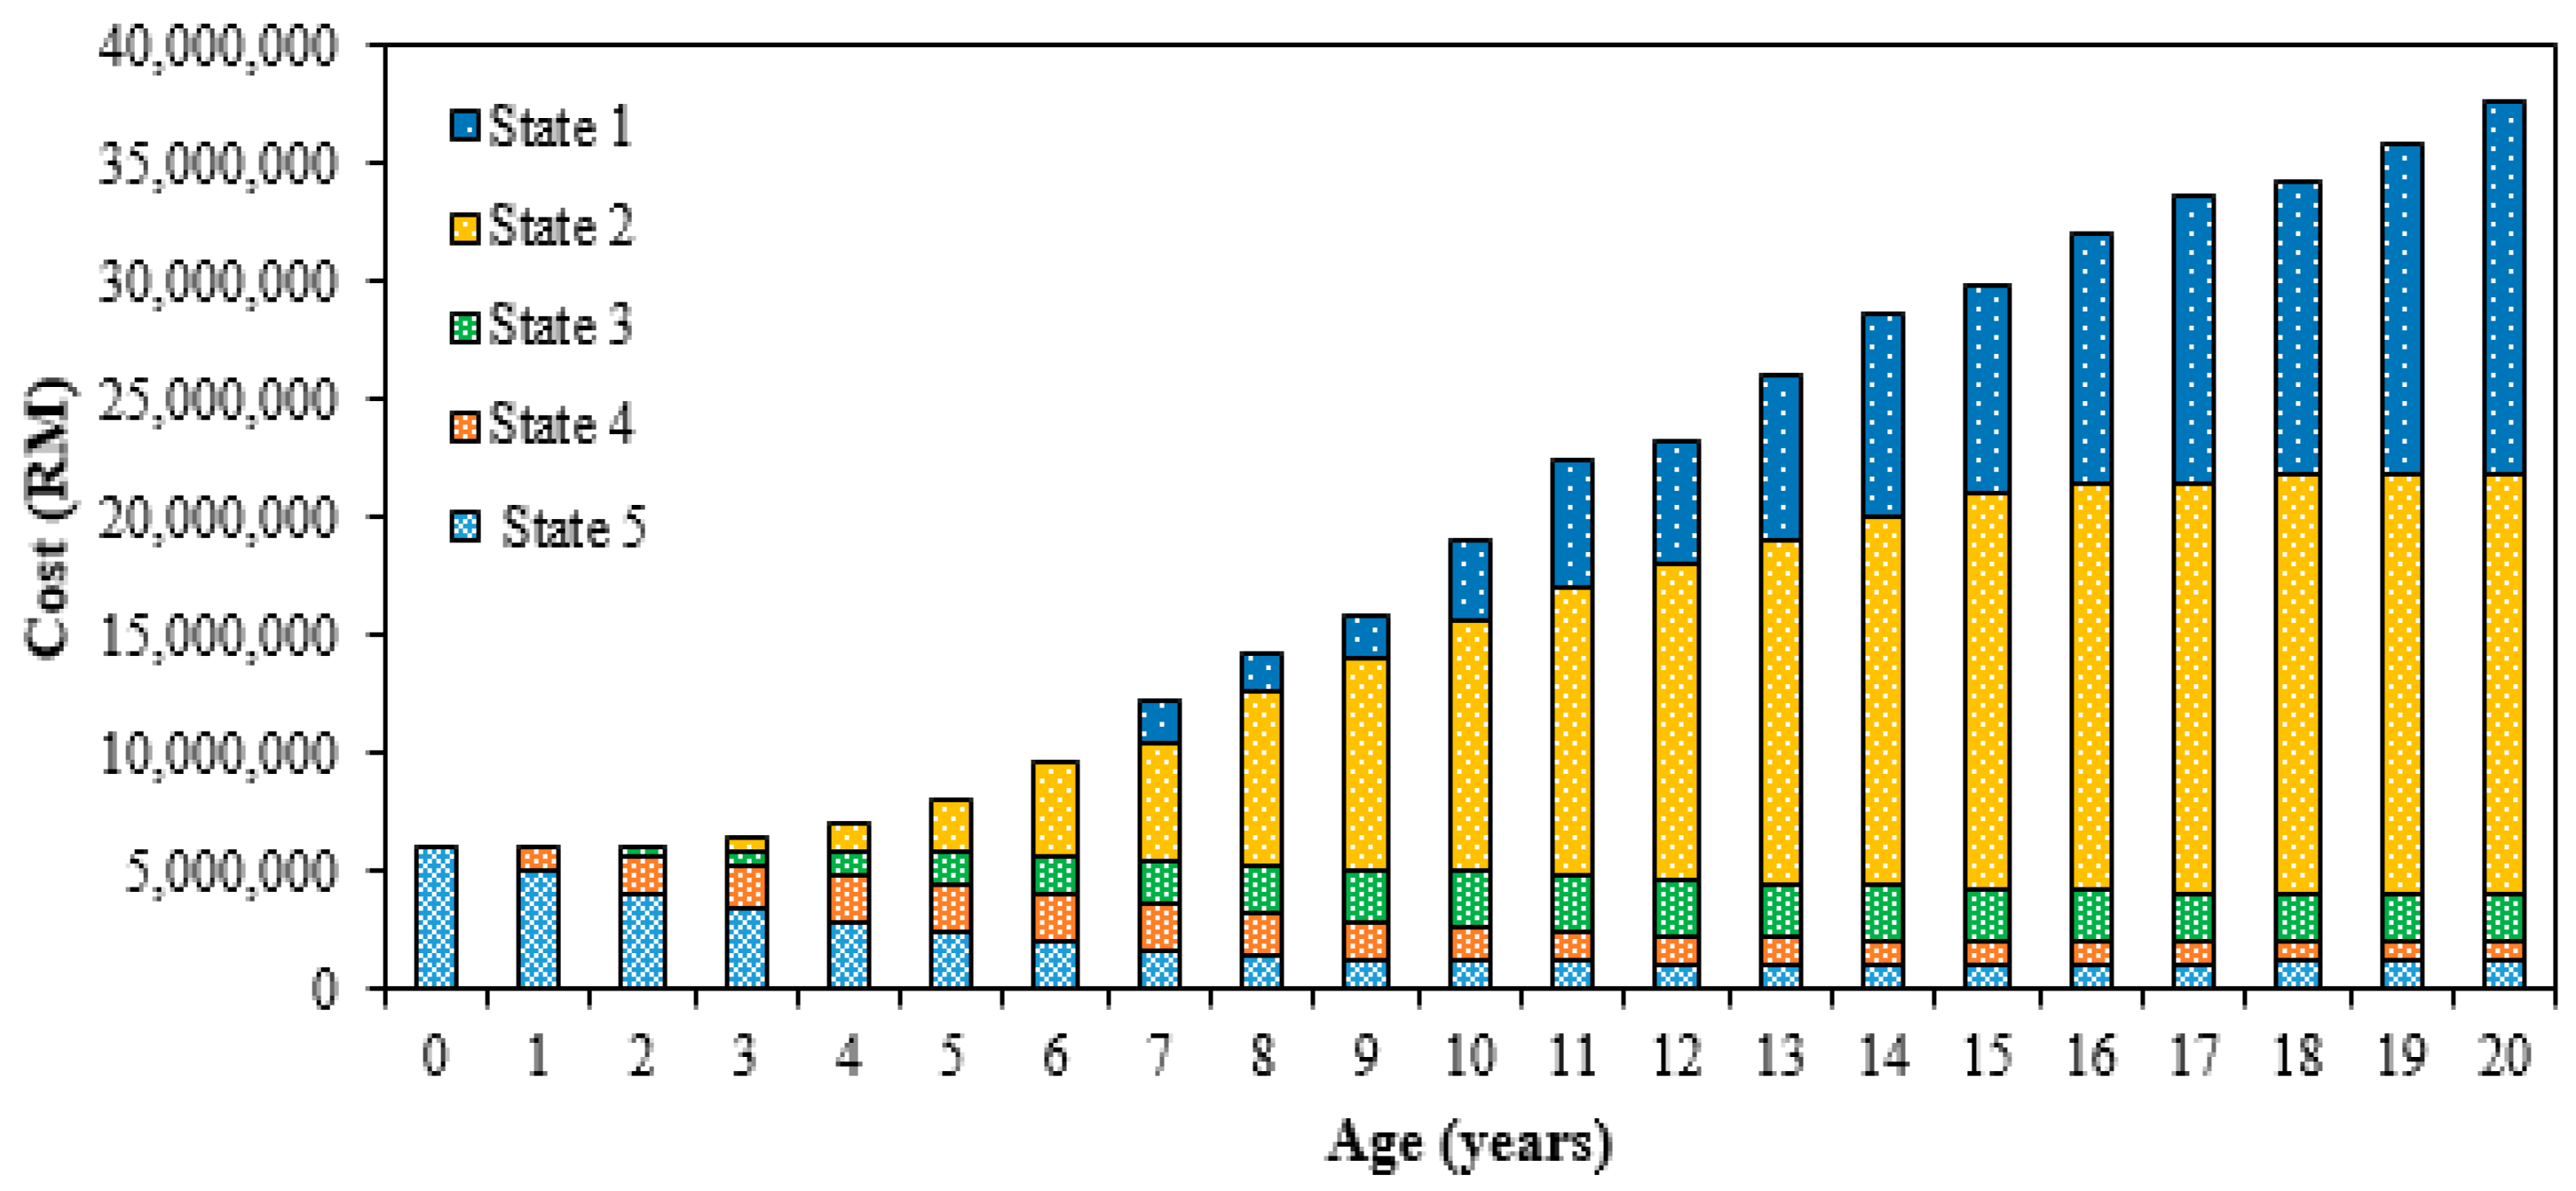
The maintenance cost distribution for transformers in each of the states for transformer transition states for the year 2013/2014 and 2012/2013 can be seen in Figure 10 and Figure 11, respectively. The costs in State 2 and State 1 contributed to the highest portion of the maintenance cost. There was no significant increment of the maintenance cost for State 5, State 4 and State 3 over the past 20 years of prediction. The estimated total costs for transformer transition states for the year 2013/2014 and 2012/2013 will gradually increase, as shown in Figure 12. The estimated total cost for transformer transition states for the year 2013/2014 will increase from RM 5.94 million to RM 39.09. On the other hand, based on the transformer transition states for the year 2012/2013, the maintenance cost will increase up to RM 37.56 million.

6. Conclusions

The application of the MM based on frequency of a transition method derived using HI was carried out in this study to predict the transformer state distribution and the maintenance cost. It was implemented by determine the deterioration states of the transformer population and their future states based on transformer transition states for the year 2013/2014 and 2012/2013. Analyses on the relationship between the predicted and actual numbers of transformers revealed that the data exceeded the 95% confidence interval plots, but were still within the 95% prediction interval plots. Based on the probability state plots, there is a 90% probability that population of transformers will reach State 1 after 76 years and 69 years based on transformer transition states for the year 2013/2014 and 2012/2013, respectively. Over the 20 years of the prediction interval, the total estimated maintenance costs would increase from RM 5.94 million up to RM 37.56 and RM 39.09 million for transformer transition states for the year 2012/2013 and 2013/2014, respectively.

Author Contributions

The research study was carried out successfully with contributions from all authors. The main research idea, simulation works and manuscript preparation were contributed by M.S.Y. N.A. contributed on the manuscript preparation and research idea. A.M.S., M.Z.A.A.K., J.J., E.J.K. and M.H.H. assisted in finalizing the research work and manuscript. Y.Z.Y.G. gave several suggestions from the industrial perspectives. All authors revised and approved the publication of the paper.

Funding

The research was funded by Ministry of Education under FRGS scheme (03-01-16-1787FR) and Universiti Putra Malaysia under PUTRA Berimpak (GPB/2017/9570300).

Acknowledgments

The authors would like to express their sincere gratitude to the Ministry of Education Malaysia, UPM, CELP UPM andUTeM for the technical and financial support of this research.

Conflicts of Interest

The authors declare no conflicts of interest.

Nomenclature

CACondition Assessment
CBMCondition Based Monitoring
CMCorrective Maintenance
DGADissolved Gas Analysis
FAFurfural Analysis
HIHealth Index
HIFHealth Index Factor
MMMarkov Model
OEMOriginal Engineering Manufacturer
OQAOil Quality Analysis
RMRinggit Malaysia

References

  1. Sankar, B.; Cherian, E. Condition monitoring and assessment of power transformer for reliability enhancement—A Review. Int. J. Adv. Eng. Res. 2013, 4, 1–12. [Google Scholar]
  2. Wang, M.; Vandermaar, A.J.; Srivastava, K.D. Review of condition asessment of power transformers in service. IEEE Electr. Insul. Mag. 2002, 18, 12–25. [Google Scholar] [CrossRef]
  3. A2.18 W.G. Life Management Techniques for Power Transformer; CIGRE: Paris, France, 2003. [Google Scholar]
  4. Taengko, K.; Damrongkulkamjorn, P. Risk assessment for power transformers in PEA substations using Health Index. In Proceedings of the International Conference of Electrical Engineering/Electronics, Computer, Telecommunications and Information Technology (ECTI-CON), Krabi, Thailand, 15–17 May 2013; pp. 1–6. [Google Scholar]
  5. Tanasescu, G.; Notingher, P.V.; Dragomir, O.; Gorgan, B.; Voinescu, L. Health index calculation of electrical equipments using DiagConsole software. In Proceedings of the Advanced Topics in Electrical Engineering (ATEE), Bucharest, Romania, 23–25 May 2013; pp. 1–6. [Google Scholar]
  6. Yang Ghazali, Y.Z.; Talib, M.A.; Ahmad Rosli, H. TNB experience in condition assessment and life management of distribution power transformers. In Proceedings of the Electricity Distribution-Part 1 (CIRED 2009), Prague, Czech Republic, 8–11 June 2009; pp. 1–4. [Google Scholar]
  7. Scatiggio, F.; Pompili, M. Health index: The TERNA’s practical approach for transformers fleet management. In Proceedings of the Electrical Insulation Conference (EIC), Ottawa, ON, Canada, 2–5 June 2013; pp. 178–182. [Google Scholar]
  8. Haema, J.; Phadungthin, R. Condition assessment of the health index for power transformer. In Proceedings of the IEEE Power Engineering and Automation Conference (PEAM), Wuhan, China, 18–20 September 2012; pp. 1–4. [Google Scholar]
  9. Naderian, A.; Cress, S.; Piercy, R.; Wang, F.; Service, J. An approach to determine the health index of power transformers. In Proceedings of the IEEE International Symposium on Electrical Insulation (ISEI), Vancouver, BC, Canada, 9–12 June 2008; pp. 192–196. [Google Scholar]
  10. Jahromi, A.; Piercy, R.; Cress, S.; Service, J.; Wang, F. An approach to power transformer asset management using health index. IEEE Electr. Insul. Mag. 2009, 25, 20–34. [Google Scholar] [CrossRef]
  11. Van Schijndel, A. Power Transformer Reliability Modelling. Ph.D. Thesis, Eindhoven University of Technology, Eindhoven, The Netherlands, 2010. [Google Scholar]
  12. Sefidgaran, M.; Mirzaie, M.; Ebrahimzadeh, A. Reliability model of power transformer with ONAN cooling. Iran. J. Electr. Electron. Eng. 2010, 6, 103–109. [Google Scholar]
  13. Si, X.S.; Wang, W.; Hu, C.H.; Zhou, D.H. Remaining useful life estimation—A review on the statistical data driven approaches. Eur. J. Oper. Res. 2011, 213, 1–14. [Google Scholar] [CrossRef]
  14. Jiang, Y. Application and comparison of regression and Markov chain methods in bridge condition prediction and system benefit optimization. J. Transp. Res. Forum. 2010, 49, 91–110. [Google Scholar]
  15. Butt, A.A.; Shahin, M.Y.; Feighan, K.J.; Carpenter, S.H. Pavement performance predíction model using the Markov process. Transp. Res. Rec. 1987, 1123, 12–99. [Google Scholar]
  16. Jiang, Y.; Saito, M.; Sinha, K. Bridge performance prediction model using the Markov chain. Transp. Res. Rec. 1988, 1180, 25–32. [Google Scholar]
  17. Agrawal, A.K.; Kawaguchi, A.; Chen, Z. Deterioration rates of typical bridge elements in New York. J. Bridg. Eng. 2010, 15, 419–429. [Google Scholar] [CrossRef]
  18. Camahan, J.V.; Davis, W.J.; Shahin, M.Y.; Keane, P.L.; Wu, M.I. Optimal maintenance decisions for pavement management. J. Transp. Eng. 1987, 113, 554–572. [Google Scholar] [CrossRef]
  19. Micevski, T.; Kuczera, G.; Coombes, P. Markov model for storm water pipe deterioration. J. Infrastruct. Syst. 2002, 8, 49–56. [Google Scholar] [CrossRef]
  20. Riveros, G.A.; Arredondo, E. Guide to the Development of a Deterioration Rate Curve Using Condition State Inspection Data; Report No.: ERDC/CHL CHETN-IX-25; US Army Corps of Engineers: Davis, CA, USA, 2010; pp. 1–12. [Google Scholar]
  21. Hoskins, R.P.; Strbac, G.; Brint, A.T. Modelling the degradation of condition indices. IEEE Proc. Gener. Transm. Distrib. 1999, 146, 386–392. [Google Scholar] [CrossRef]
  22. Hamoud, G.A.; Member, S.; Yiu, C. One Markov model for spare analysis of distribution power transformers. IEEE Trans. Power Syst. 2016, 31, 1643–1648. [Google Scholar] [CrossRef]
  23. Li, Q.; Zhao, T.; Zhang, L.; Lou, J. Mechanical fault diagnostics of onload tap changer within power transformers based on hidden Markov model. IEEE Trans. Power Deliv. 2012, 27, 596–601. [Google Scholar] [CrossRef]
  24. Hamoud, G.A. Use of Markov models in assessing spare transformer requirements for distribution stations. IEEE Trans. Power Syst. 2012, 27, 1098–1105. [Google Scholar] [CrossRef]
  25. Zhang, X.; Gockenbach, E. Asset-Management of transformers based on condition monitoring and standard diagnosis. IEEE Electr. Insul. Mag. 2008, 24, 26–40. [Google Scholar] [CrossRef]
  26. Wu, D.; Yuan, C.; Kumfer, W.; Liu, H. A life-cycle optimization model using semi-Markov process for highway bridge maintenance. Appl. Math. Model. 2017, 43, 45–60. [Google Scholar] [CrossRef]
  27. Cesare, M.A.; Santamarina, C.; Turkstra, C.; Vanmarcke, E.H. Modeling bridge deterioration with Markov chains. J. Transp. Eng. 1993, 118, 820–833. [Google Scholar] [CrossRef]
  28. Deloitte Asset Management; Canadian Electricity Associate (CEA). Asset Health Indices: A Utility Industry Necessity; Whitepaper; Deloitte: London, UK, 2014. [Google Scholar]
  29. Brandtzæg, G. Health Indexing of Norwegian Power Transformers. Master’s Thesis, Norwegian University of Science and Technology, Trondheim, Norway, 2015. [Google Scholar]
  30. Martins, M.A. Condition and risk assessment of power transformers: A general approach to calculate a health index. Ciência Tecnol. Mater. 2014, 26, 9–16. [Google Scholar] [CrossRef]
  31. Yates, R.D.; Goodman, D.J. Probability and Stochastic Processes, 2nd ed.; John Wiley & Sons Inc.: Hoboken, NJ, USA, 2005; pp. 445–451. ISBN 0-471-27214-0. [Google Scholar]
  32. Ranjith, S.; Setunge, S.; Gravina, R.; Venkatesan, S. Deterioration prediction of timber bridge elements using the Markov chain. J. Perform. Constr. Facil. 2013, 27, 319–325. [Google Scholar] [CrossRef]
  33. Yahaya, M.S.; Azis, N.; Ab Kadir, M.Z.A.; Jasni, J.; Hairi, M.H.; Talib, M.A. Estimation of transformers health index based on the Markov chain. Energies 2017, 10, 1824. [Google Scholar] [CrossRef]
  34. Morcous, G. Performance prediction of bridge deck systems using Markov chains. J. Perform. Constr. Facil. 2006, 20, 146–155. [Google Scholar] [CrossRef]
  35. Dhillon, B.S. Engineering Maintenance: A Modern Approach, 1st ed.; CRC Press: Boca Raton, FL, USA, 2002; ISBN 1-58716-142-7. [Google Scholar]
  36. A2.34 W.G. Guide for Transformer Maintenance; CIGRE: Paris, France, 2011. [Google Scholar]
Figure 1. A basic framework of health index formulation.
Energies 11 02006 g001
Figure 2. Five-state Markov chain model.
Energies 11 02006 g002
Figure 3. An overall workflow on the maintenance cost study.
Energies 11 02006 g003
Figure 4. State probabilities in the year 2015 based on transformer transition states for the year 2013/2014.
Energies 11 02006 g004
Figure 5. Predicted versus actual numbers of transformer in the year 2015 based on transformer transition states for the year 2013/2014.
Energies 11 02006 g005
Figure 6. Predicted versus actual numbers of transformer in the year 2014 based on transformer transition states for the year 2012/2013.
Energies 11 02006 g006
Figure 7. Predicted versus actual numbers of transformer in the year 2015 based on transformer transition states for the year 2012/2013.
Energies 11 02006 g007
Figure 8. Predicted state probabilities for State 1 in the year 2015 based on transformer transition states for the year 2013/2014 and 2012/2013.
Energies 11 02006 g008
Figure 9. Actual and predicted transformer populations in the year 2015 based on transformer transition states for the year 2013/2014 and 2012/2013.
Energies 11 02006 g009
Figure 10. Maintenance cost for transformers in each state for transition states for the year 2013/2014.
Energies 11 02006 g010
Figure 11. Maintenance cost for transformers in each state for transition states for the year 2012/2013.
Energies 11 02006 g011
Figure 12. Total estimated maintenance cost for transformers in each year based on transformer transition states for the year 2012/2013 and 2013/2014.
Energies 11 02006 g012
Table 1. Health Index indicator scales.
ConditionHealth IndexDescription
Very Good85–100%Some aging or minor deterioration of a limited number of components.
Good70–84%Significant deterioration of some components.
Fair50–69%Widespread significant or serious deterioration of specific components.
Poor30–49%Widespread serious deterioration.
Very Poor0–29%Extensive serious deterioration.
Table 2. Maintenance action, intervention state, maintenance activity and cost estimation breakdown.
Maintenance ActionIntervention State ActivityEstimated Cost (RM)
Condition assessment5, 4, 3, 2, 1Annual routine monitoring 149,500.00
Minor work2Oil regeneration + major parts restoration 230% from new unit
Major work1Replacement1,700,000.00
1 Annual routine monitoring by OEM will consider physical inspection, dissolved gases, oil quality and furanic compounds. 2 It may include the tap changers, bushing, labor, oil drying, tank and sealing, wiring and control systems. Rewinding and core replacement are not included [36].
Table 3. Classification of transformer states based on health index.
Markov Model StateCorresponding HI Range
State 585–100%
State 470–84%
State 350–69%
State 230–49%
State 10–29%
Table 4. Numbers of transformers in its consecutive states from 2012 to 2015.
StateYear 2012Year 2013Year 2014Year 2015
State 52319177
State 425231512
State 346464242
State 221263944
State 156715
Table 5. Transition of transformer states for the year 2013/2014.
To FromState 5State 4State 3State 2State 1
State 5172000
State 40131000
State 30034120
State 2000251
State 100001
Table 6. Transition of transformer states for the year 2012/2013.
To FromState 5State 4State 3State 2State 1
State 5194000
State 4019600
State 3004060
State 2000201
State 100001
Table 7. Numbers of transformers in each of the states based on transition states for the year 2013/2014 with the maintenance policy model.
AgeState 5State 4State 3State 2State 1
01200000
110713000
29618600
386211210
477211840
570202280
6641925120
7591727161
8551627211
9521527242
10501426282
11491326293
12471325314
13471224325
14461223345
15461122356
16461121357
17461121357
18461120358
19461120358
20461119359

