Data Envelopment Analysis in Energy and Environmental Economics: An Overview of the State-of-the-Art and Recent Development Trends


 ,
,  ,
,  and
and
Abstract
1. Introduction
2. Literature Review
- .
- .
- .
- .
- .
- shows the number of outputs.
Cross-Efficiency Calculation
3. Review Method
4. Results
4.1. Distribution of Articles Based on DEA Models and Application Scheme
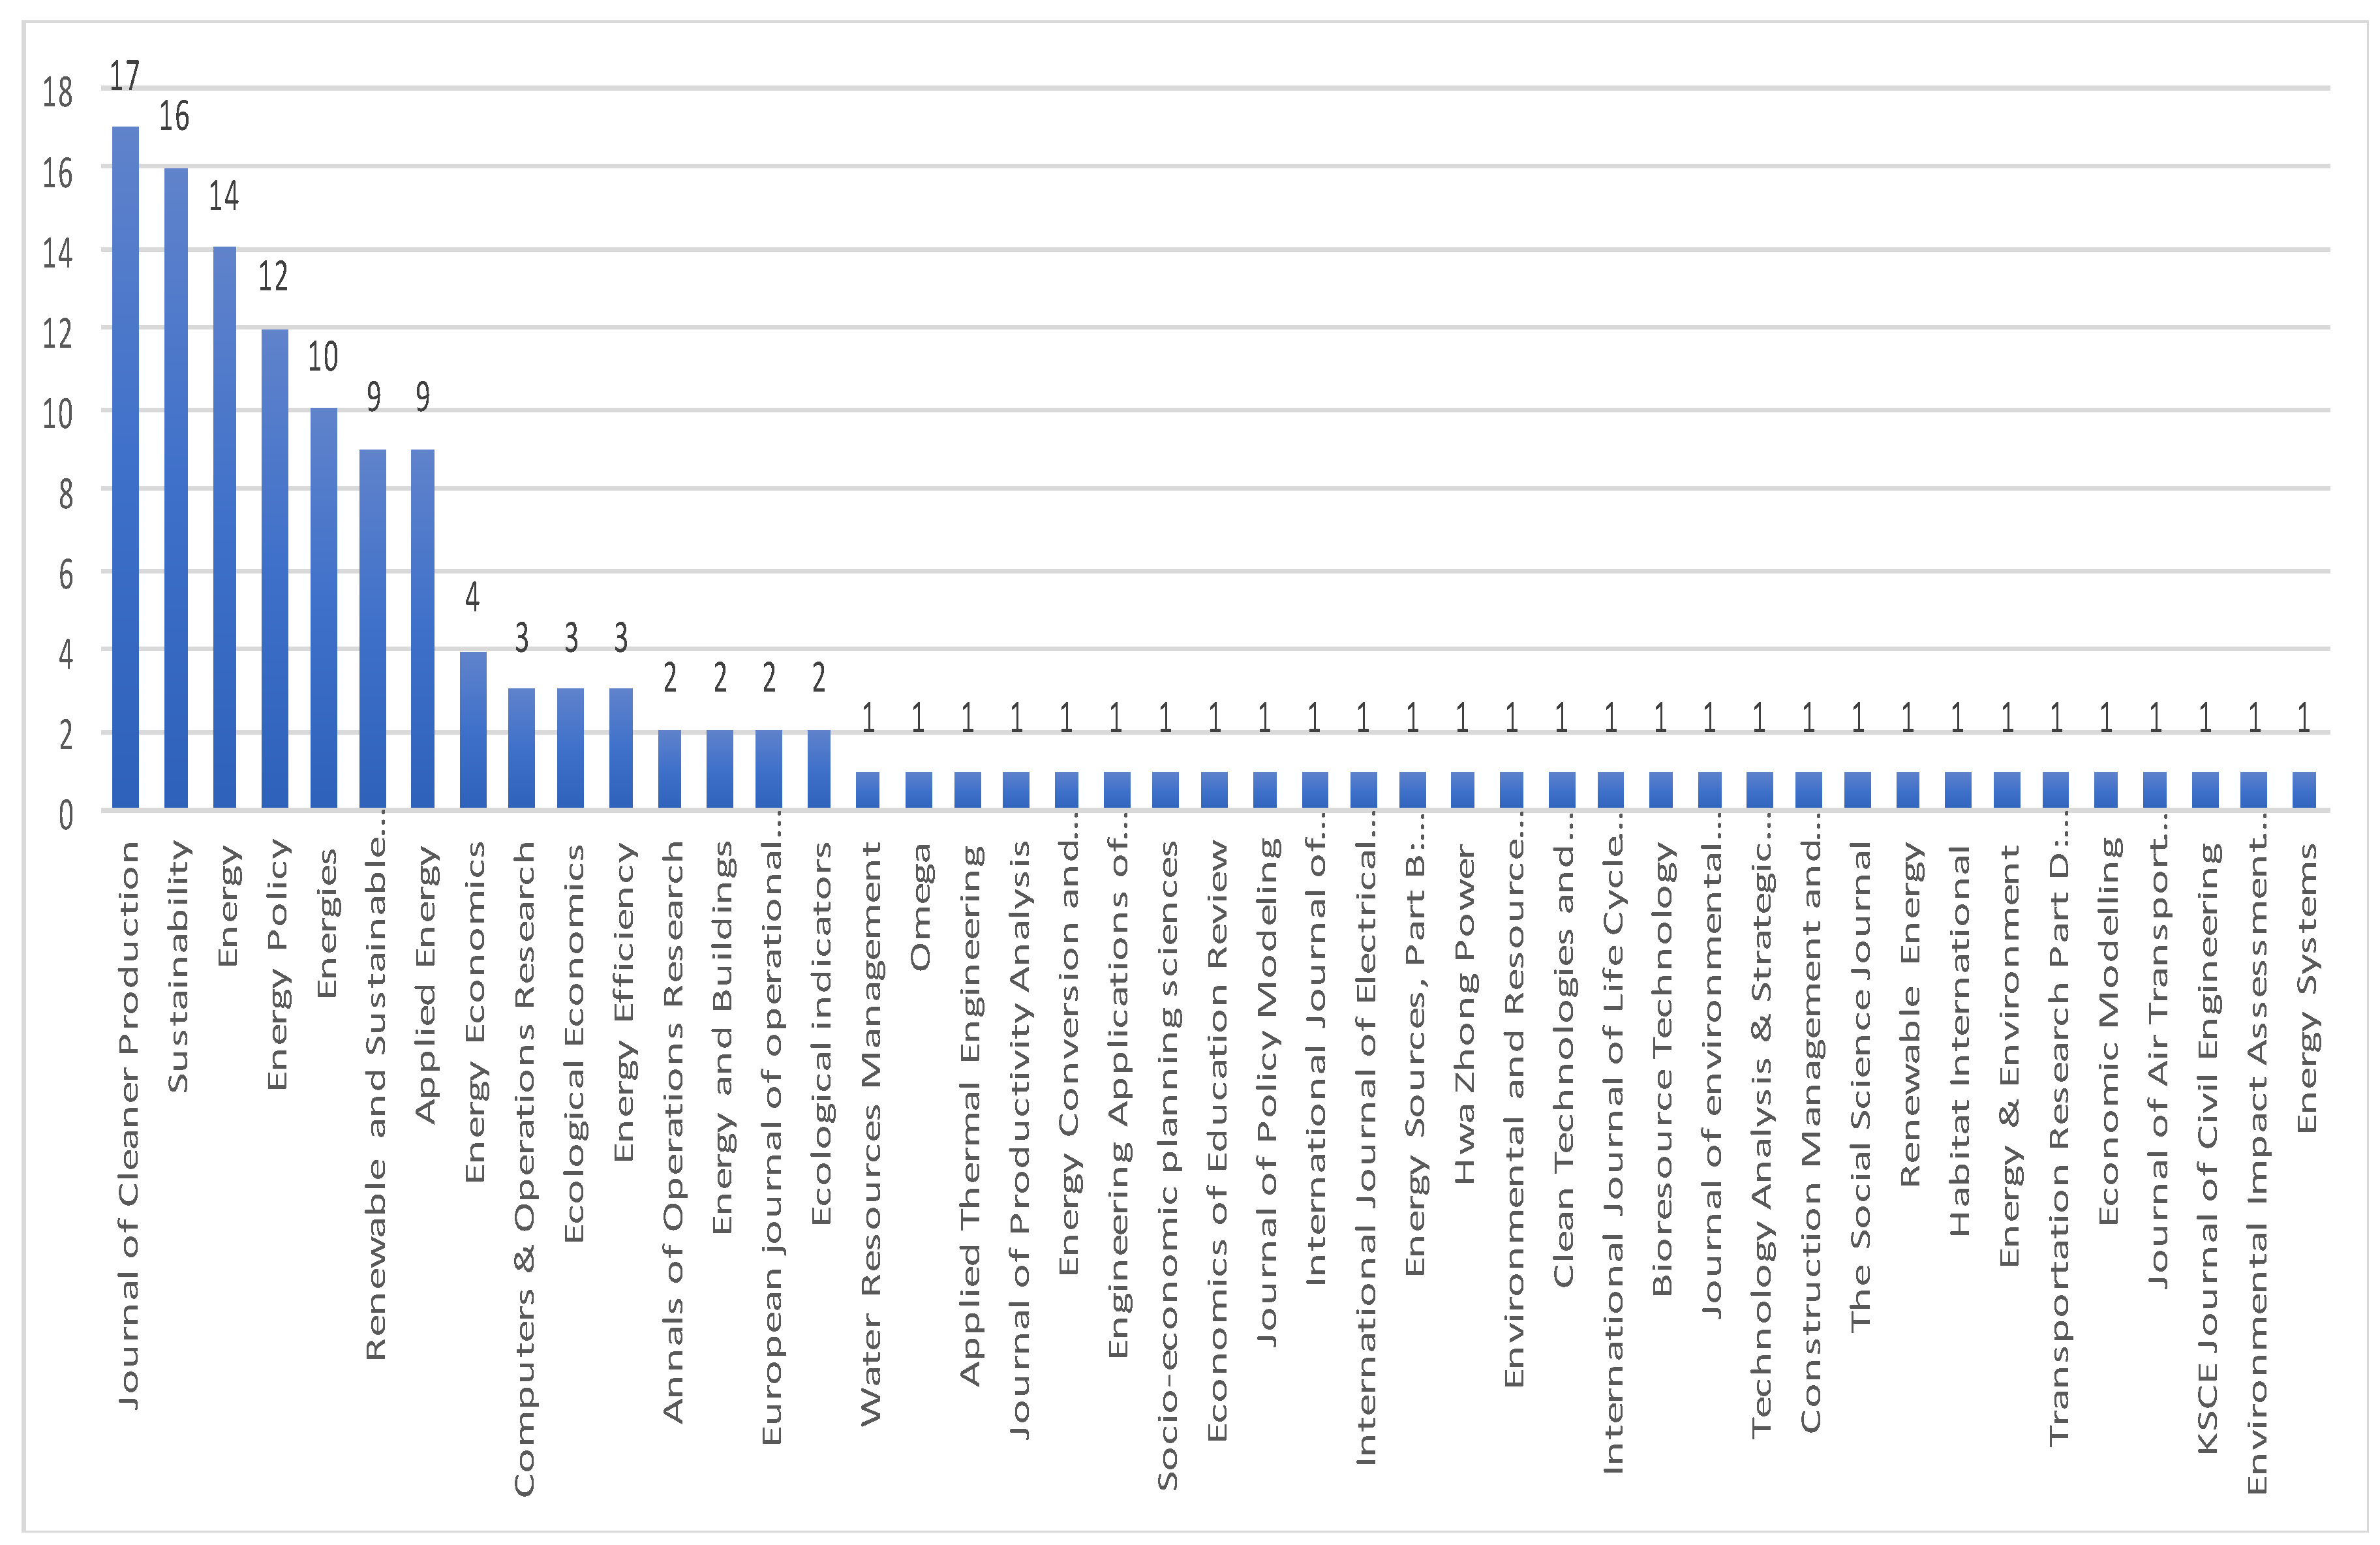
4.2. Distribution of Paper Based on Journal Selection
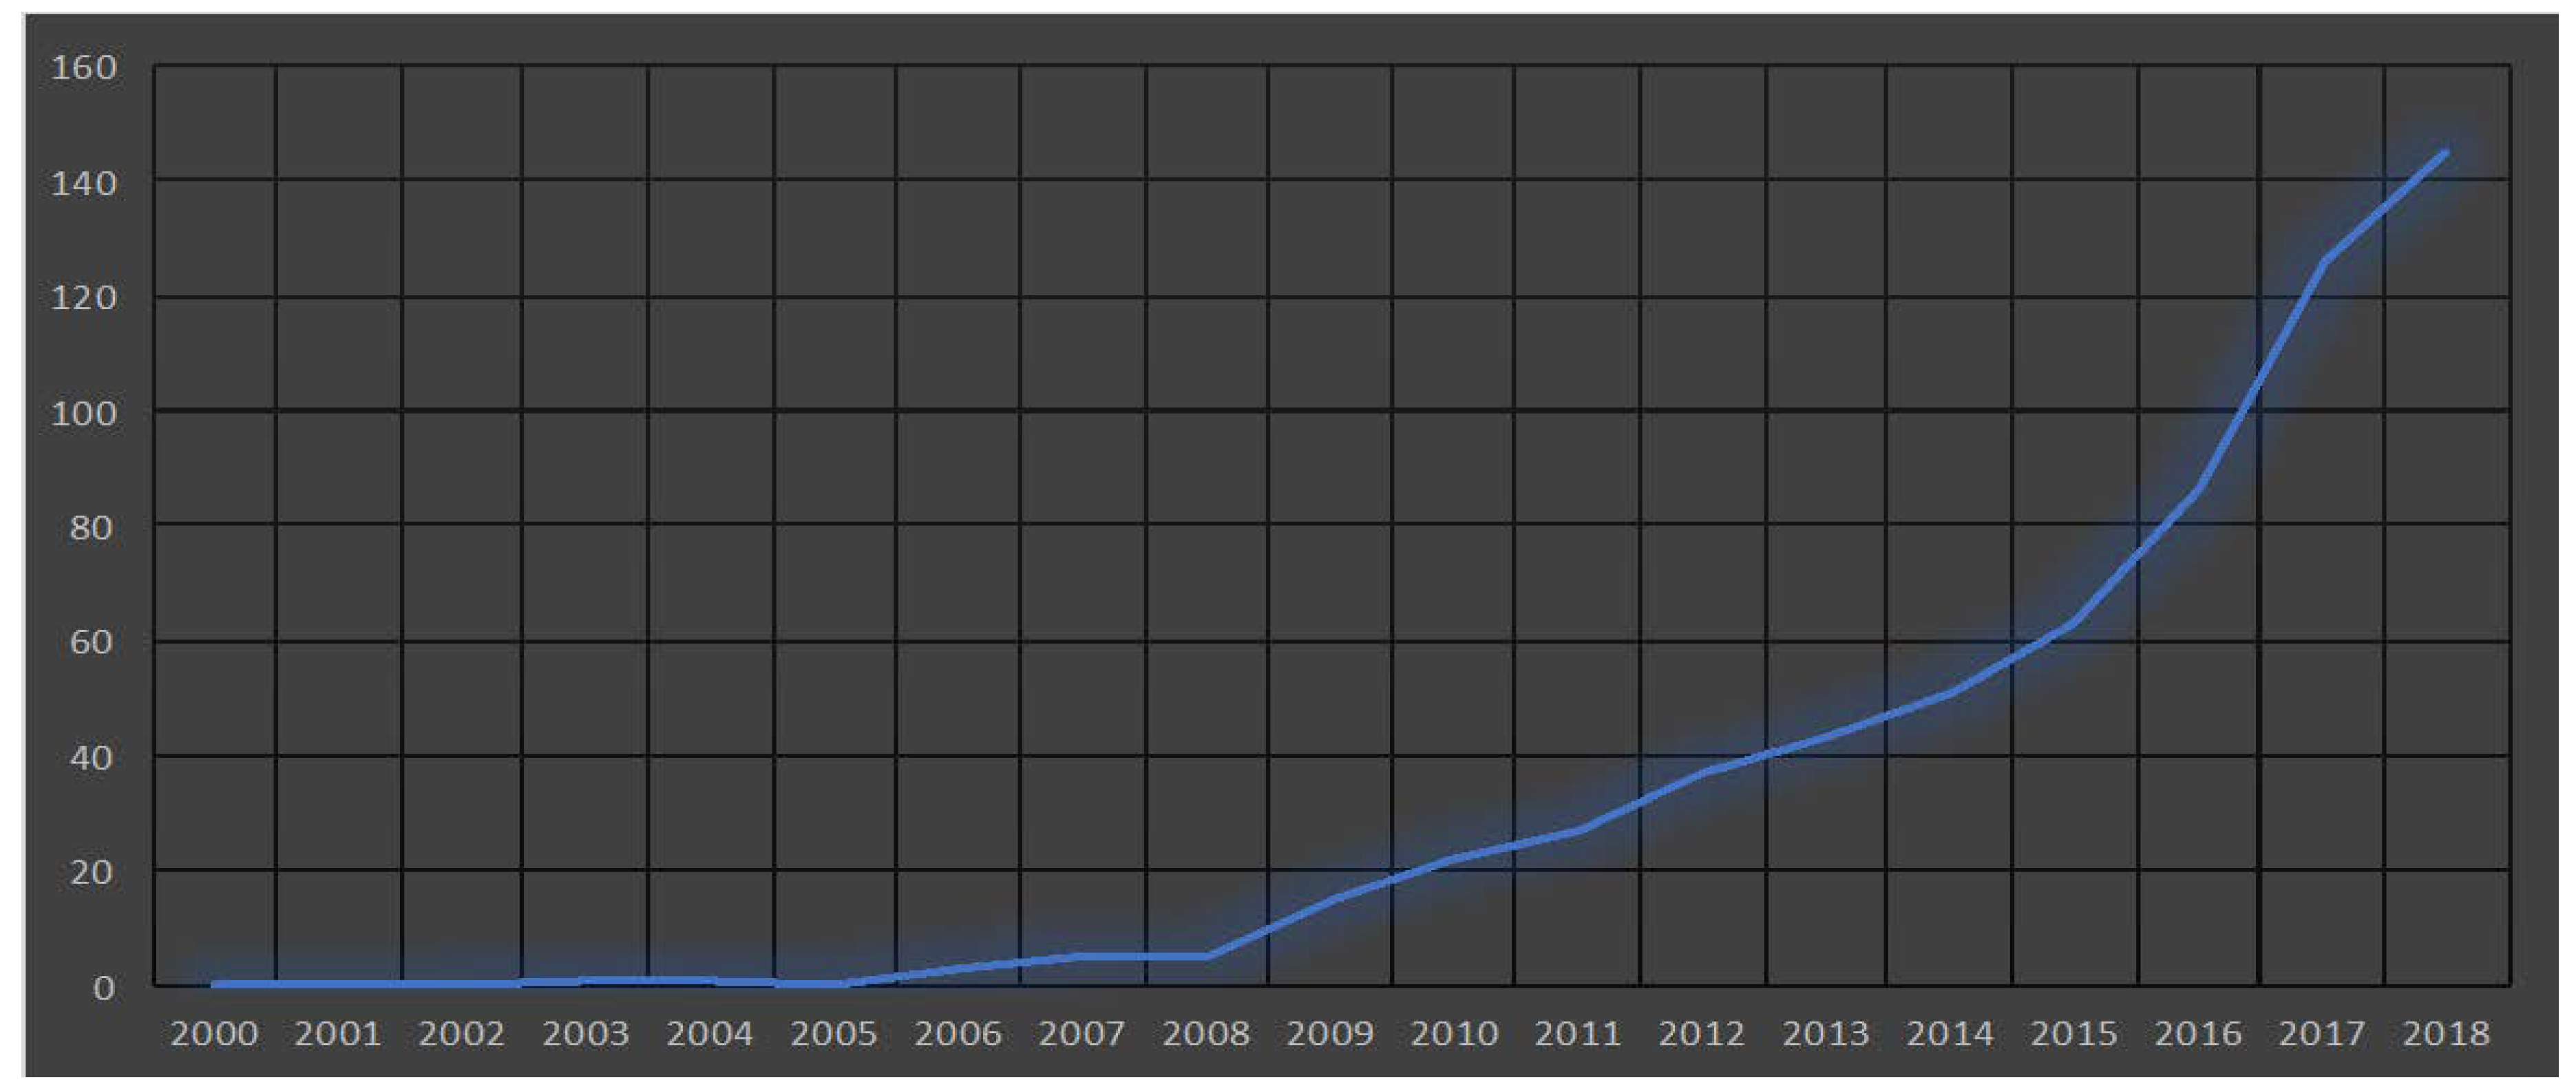
4.3. Distribution of Papers Based on Year of Publication
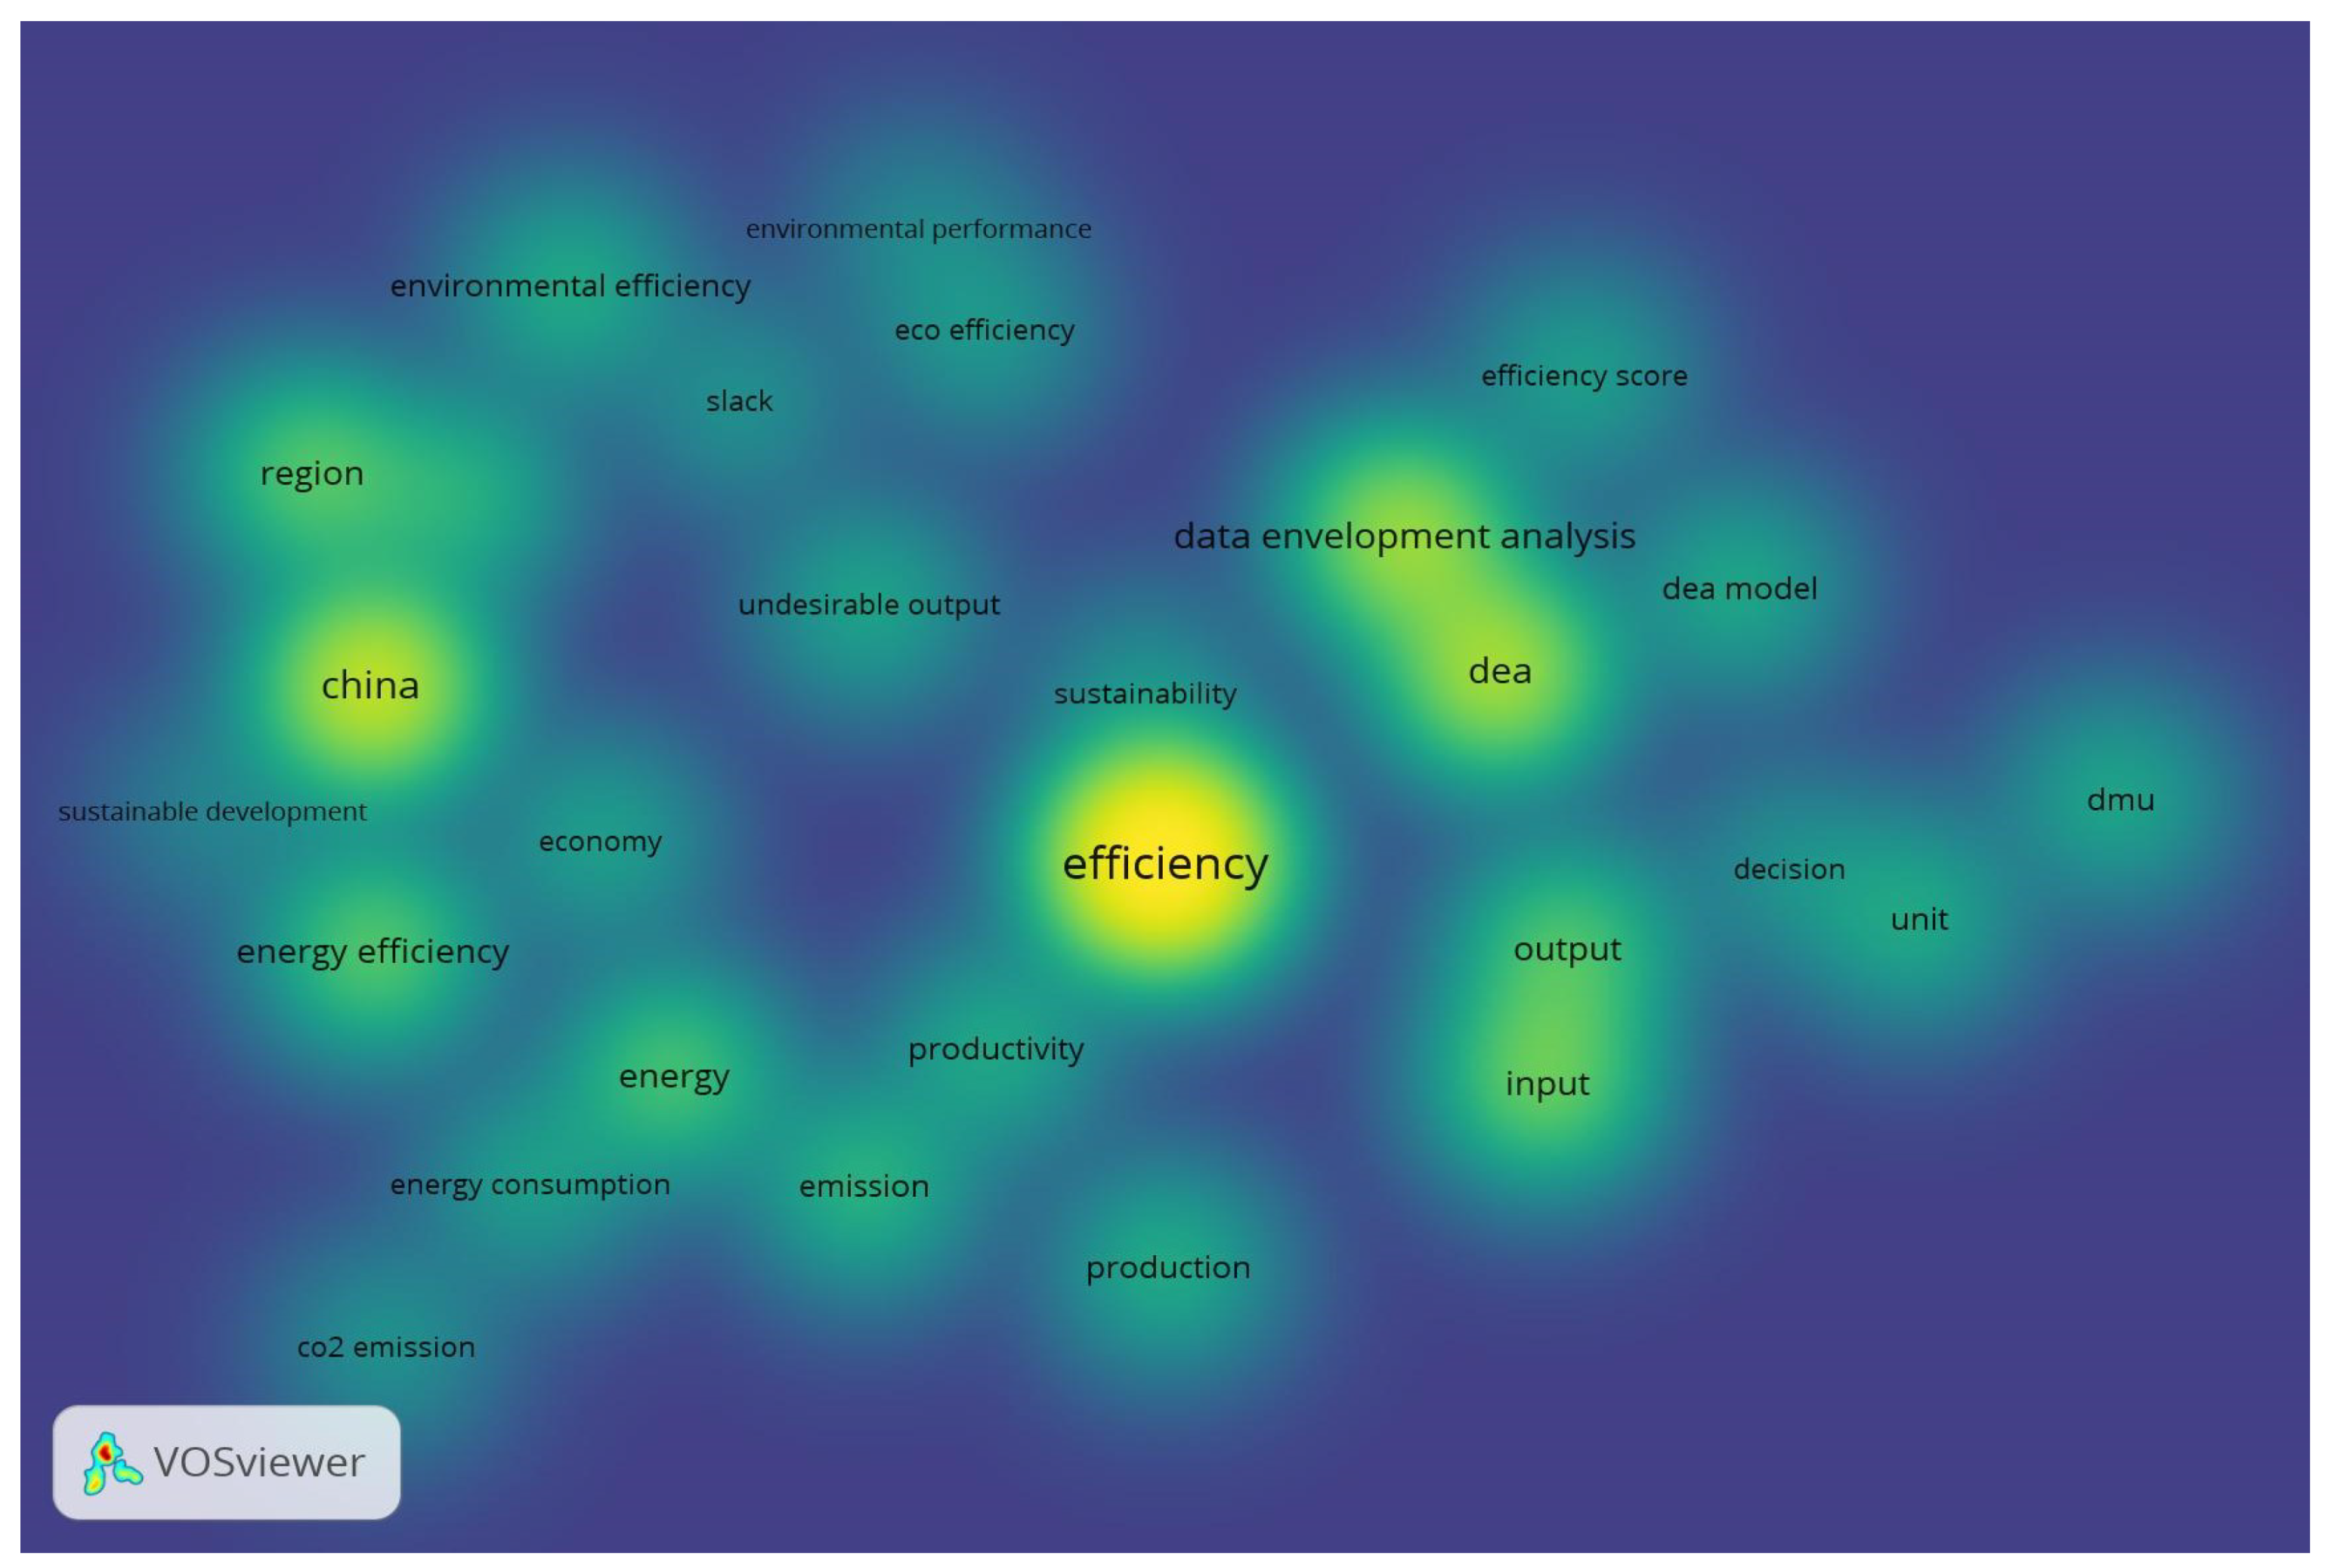
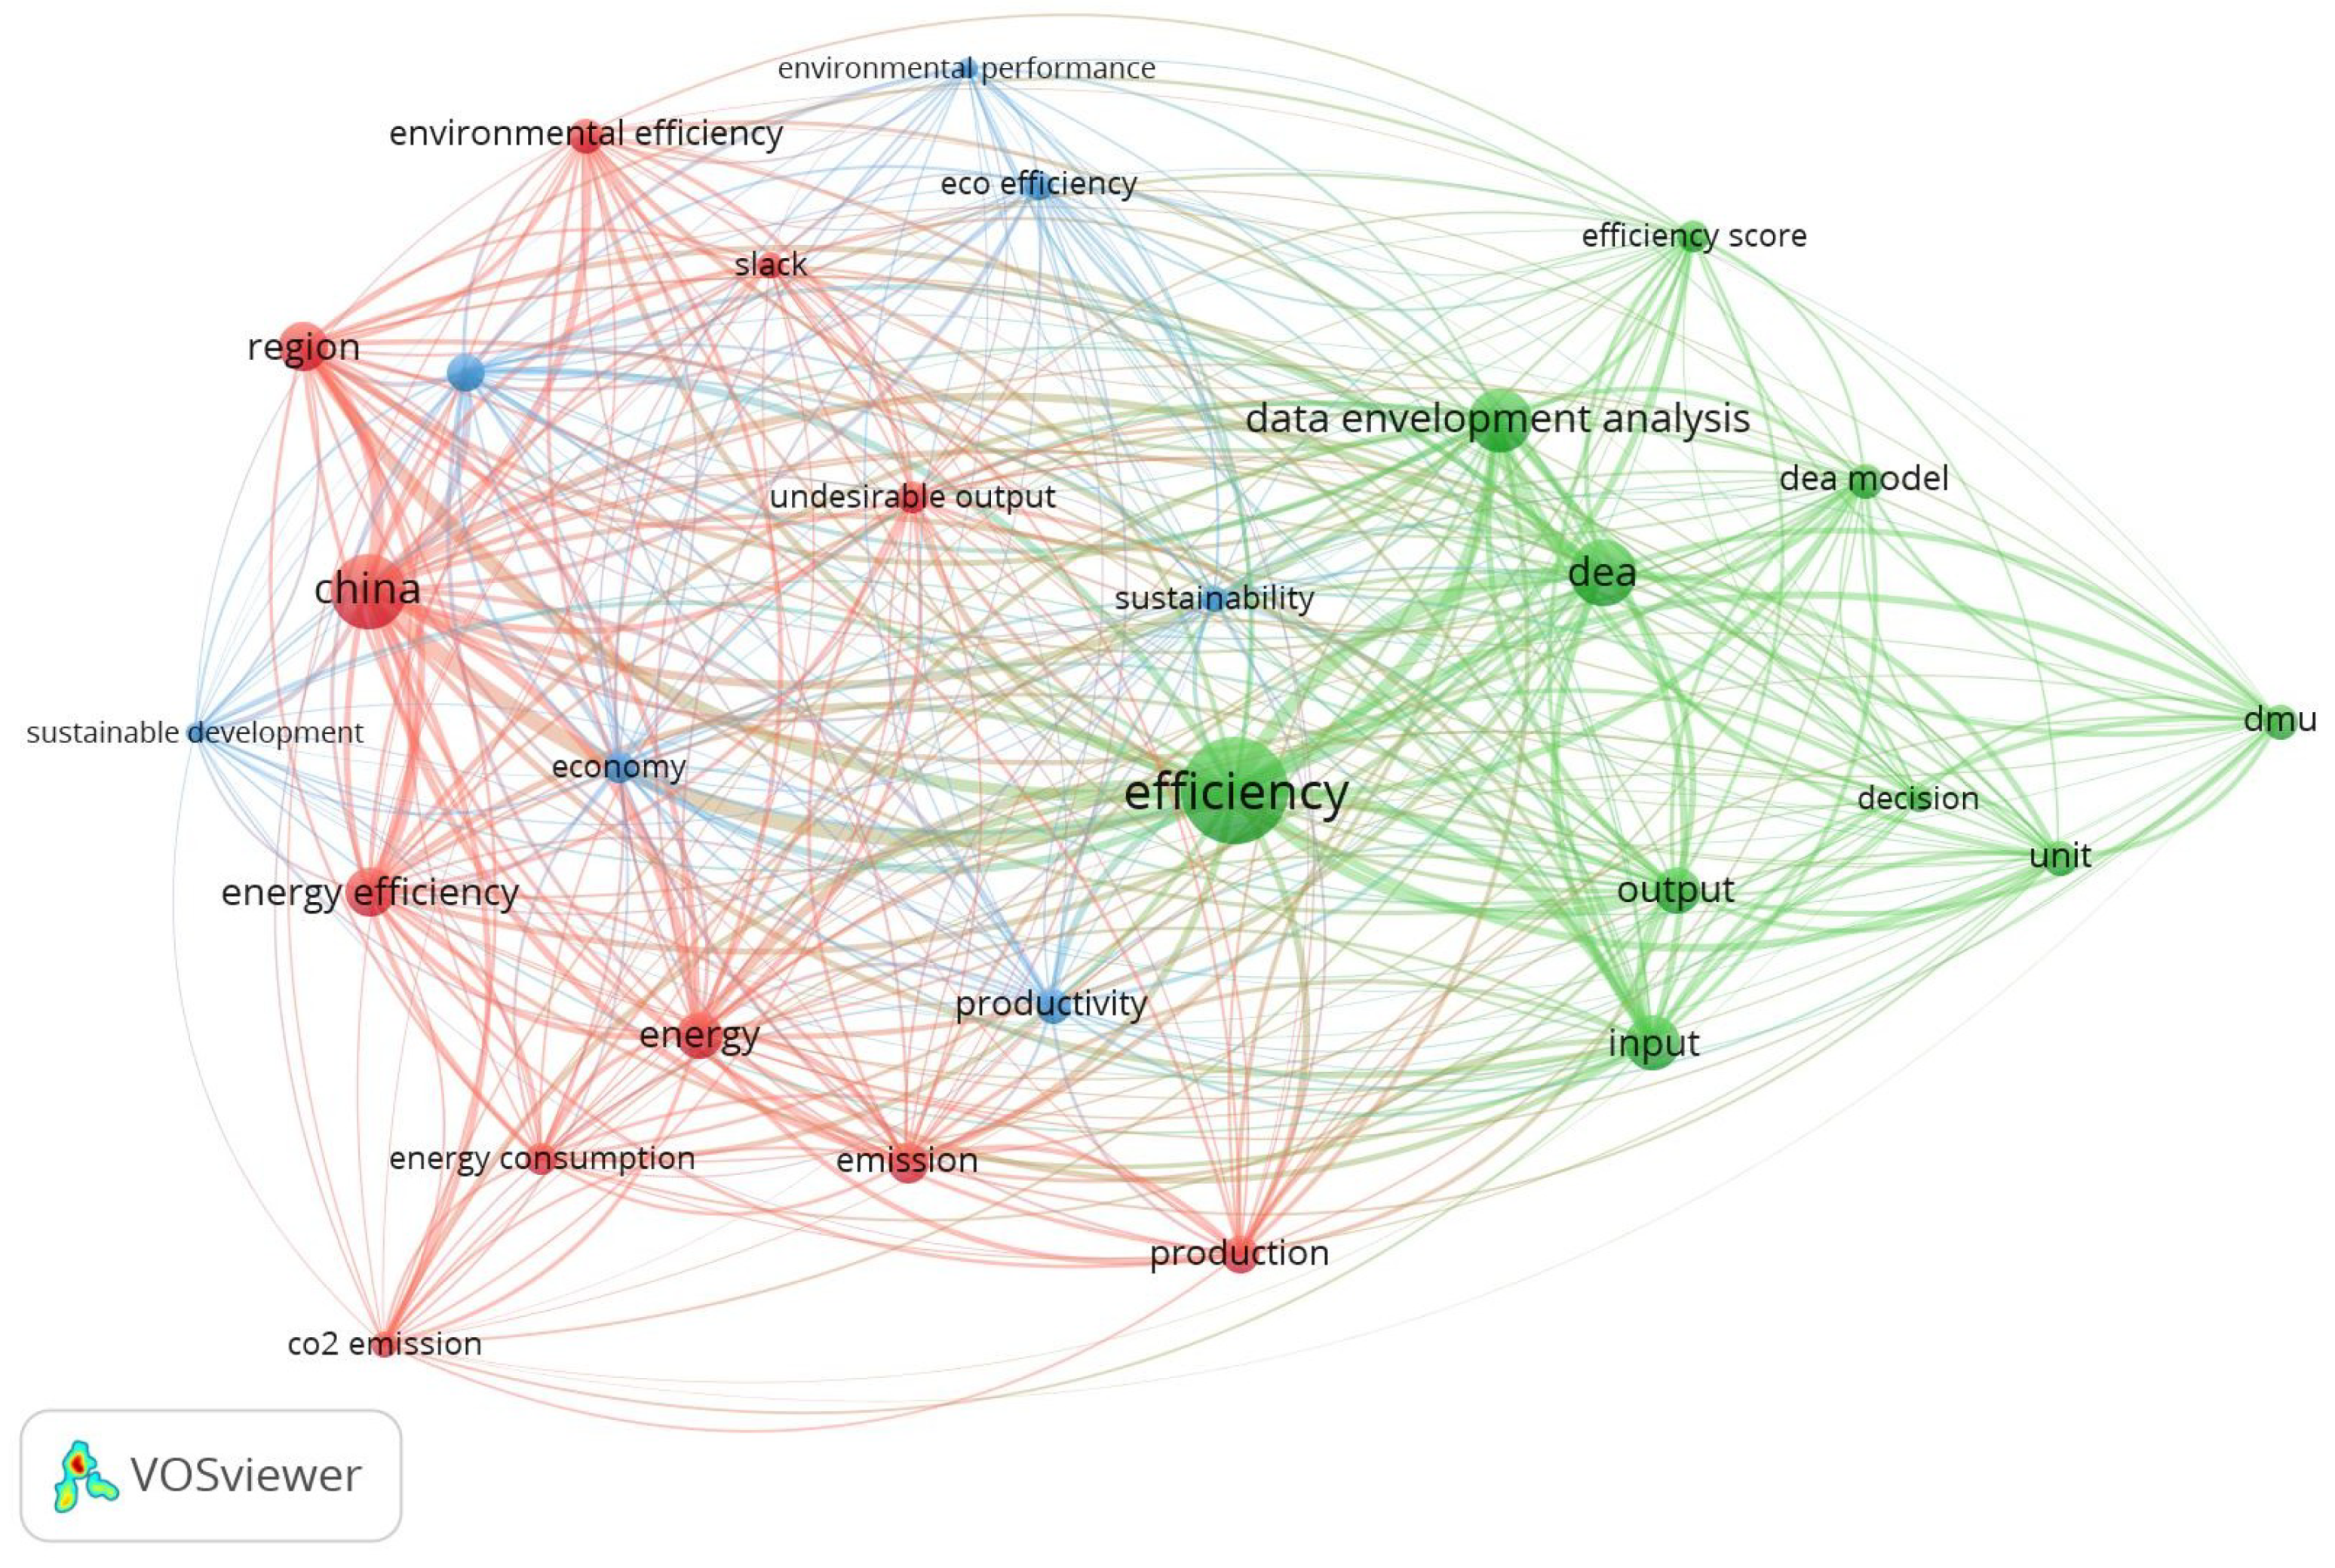
4.4. Distribution of Paper Based on Keywords Networks by VOS-Viewer
5. Conclusions
Author Contributions
Acknowledgments
Conflicts of Interest
References
- Mardani, A.; Zavadskas, E.K.; Streimikiene, D.; Jusoh, A.; Khoshnoudi, M. A comprehensive review of data envelopment analysis (DEA) approach in energy efficiency. Renew. Sustain. Energy Rev. 2017, 70, 1298–1322. [Google Scholar] [CrossRef]
- Farrell, M.J. The measurement of productive efficiency. J. R. Stat. Soc. Ser. A 1957, 120, 253–290. [Google Scholar] [CrossRef]
- Shabanpour, H.; Yousefi, S.; Saen, R.F. Forecasting efficiency of green suppliers by dynamic data envelopment analysis and artificial neural networks. J. Clean. Prod. 2017, 142, 1098–1107. [Google Scholar] [CrossRef]
- Ji, X.; Wu, J.; Zhu, Q.; Sun, J. Using a hybrid heterogeneous DEA method to benchmark China’s sustainable urbanization: An empirical study. Ann. Oper. Res. 2018, 1–55. [Google Scholar] [CrossRef]
- Toloo, M.; Allahyar, M.; Hančlová, J. A non-radial directional distance method on classifying inputs and outputs in DEA: Application to banking industry. Expert Syst. Appl. 2018, 92, 495–506. [Google Scholar] [CrossRef]
- Han, Y.; Geng, Z.; Zhu, Q.; Qu, Y. Energy efficiency analysis method based on fuzzy DEA cross-model for ethylene production systems in chemical industry. Energy 2015, 83, 685–695. [Google Scholar] [CrossRef]
- Li, W.H.; Liang, L.; Cook, W.D. Measuring efficiency with products, by-products and parent-offspring relations: A conditional two-stage DEA model. Omega 2017, 68, 95–104. [Google Scholar] [CrossRef]
- Azadi, M.; Jafarian, M.; Saen, R.F.; Mirhedayatian, S.M. A new fuzzy DEA model for evaluation of efficiency and effectiveness of suppliers in sustainable supply chain management context. Comput. Oper. Res. 2015, 54, 274–285. [Google Scholar] [CrossRef]
- An, Q.; Chen, H.; Wu, J.; Liang, L. Measuring slacks-based efficiency for commercial banks in China by using a two-stage DEA model with undesirable output. Ann. Oper. Res. 2015, 235, 13–35. [Google Scholar] [CrossRef]
- Tone, K.; Tsutsui, M. Dynamic DEA with network structure: A slacks-based measure approach. Omega 2014, 42, 124–131. [Google Scholar] [CrossRef]
- Niu, D.; Song, Z.; Xiao, X.; Wang, Y. Analysis of wind turbine micrositing efficiency: An application of two-subprocess data envelopment analysis method. J. Clean. Prod. 2018, 170, 193–204. [Google Scholar] [CrossRef]
- Pérez-López, G.; Prior, D.; Zafra-Gómez, J.L. Temporal scale efficiency in DEA panel data estimations. An application to the solid waste disposal service in Spain. Omega 2018, 76, 18–27. [Google Scholar] [CrossRef]
- Önüt, S.; Soner, S. Energy efficiency assessment for the Antalya Region hotels in Turkey. Energy Build. 2006, 38, 964–971. [Google Scholar] [CrossRef]
- Lee, W.-S. Benchmarking the energy efficiency of government buildings with data envelopment analysis. Energy Build. 2008, 40, 891–895. [Google Scholar] [CrossRef]
- Lee, W.-S.; Lee, K.-P. Benchmarking the performance of building energy management using data envelopment analysis. Appl. Therm. Eng. 2009, 29, 3269–3273. [Google Scholar] [CrossRef]
- Grösche, P. Measuring residential energy efficiency improvements with DEA. J. Product. Anal. 2009, 31, 87–94. [Google Scholar] [CrossRef]
- Hui, S.; Wan, M. Study of hotel energy performance using data envelopment analysis. In Proceedings of the 12th International Conference on Sustainable Energy Technologies, Hong Kong, China, 26–29 August 2013. [Google Scholar]
- Wang, E.; Shen, Z.; Alp, N.; Barry, N. Benchmarking energy performance of residential buildings using two-stage multifactor data envelopment analysis with degree-day based simple-normalization approach. Energy Convers. Manag. 2015, 106, 530–542. [Google Scholar] [CrossRef]
- Bian, Y.; Yang, F. Resource and environment efficiency analysis of provinces in China: A DEA approach based on Shannon’s entropy. Energy Policy 2010, 38, 1909–1917. [Google Scholar] [CrossRef]
- Olanrewaju, O.; Jimoh, A.; Kholopane, P. Integrated IDA–ANN–DEA for assessment and optimization of energy consumption in industrial sectors. Energy 2012, 46, 629–635. [Google Scholar] [CrossRef]
- Lee, S.K.; Mogi, G.; Hui, K.S. A fuzzy analytic hierarchy process (AHP)/data envelopment analysis (DEA) hybrid model for efficiently allocating energy R&D resources: In the case of energy technologies against high oil prices. Renew. Sustain. Energy Rev. 2013, 21, 347–355. [Google Scholar]
- Han, Y.; Geng, Z.; Gu, X.; Zhu, Q. Energy efficiency analysis based on DEA integrated ISM: A case study for Chinese ethylene industries. Eng. Appl. Artif. Intell. 2015, 45, 80–89. [Google Scholar] [CrossRef]
- Kuo, R.J.; Wang, Y.C.; Tien, F.C. Integration of artificial neural network and MADA methods for green supplier selection. J. Clean. Prod. 2010, 18, 1161–1170. [Google Scholar] [CrossRef]
- Babazadeh, R.; Razmi, J.; Rabbani, M.; Pishvaee, M.S. An integrated data envelopment analysis–mathematical programming approach to strategic biodiesel supply chain network design problem. J. Clean. Prod. 2017, 147, 694–707. [Google Scholar] [CrossRef]
- Zografidou, E.; Petridis, K.; Arabatzis, G.; Dey, P.K. Optimal design of the renewable energy map of Greece using weighted goal-programming and data envelopment analysis. Comput. Oper. Res. 2016, 66, 313–326. [Google Scholar] [CrossRef]
- Kazemilari, M.; Mardani, A.; Streimikiene, D.; Zavadskas, E.K. An overview of renewable energy companies in stock exchange: Evidence from minimal spanning tree approach. Renew. Energ. 2017, 102, 107–117. [Google Scholar] [CrossRef]
- Mardani, A.; Jusoh, A.; Nor, K.M.D.; Khalifah, Z.; Zakwan, N.; Valipour, A. Multiple criteria decision-making techniques and their applications—A review of the literature from 2000 to 2014. Econ. Res. Ekon. Istraz. 2015, 28, 516–571. [Google Scholar]
- Mardani, A.; Zavadskas, E.K.; Streimikiene, D.; Jusoh, A.; Nor, K.M.D.; Khoshnoudi, M. Using fuzzy multiple criteria decision making approaches for evaluating energy saving technologies and solutions in five star hotels: A new hierarchical framework. Energy 2016, 117, 131–148. [Google Scholar] [CrossRef]
- Mardani, A.; Jusoh, A.; Zavadskas, E.K. Fuzzy multiple criteria decision-making techniques and applications—Two decades review from 1994 to 2014. Expert Syst. Appl. 2015, 42, 4126–4148. [Google Scholar] [CrossRef]
- Mardani, A.; Jusoh, A.; Zavadskas, E.K.; Cavallaro, F.; Khalifah, Z. Sustainable and Renewable Energy: An Overview of the Application of Multiple Criteria Decision Making Techniques and Approaches. Sustainability 2015, 7, 13947–13984. [Google Scholar] [CrossRef]
- Mardani, A.; Jusoh, A.; Zavadskas, E.K.; Kazemilari, M.; Ahmad, U.N.U.; Khalifah, Z. Application of multiple criteria decision making techniques in tourism and hospitality industry: A systematic review. Transform. Bus. Econ. 2016, 15, 192–213. [Google Scholar]
- Mardani, A.; Nilashi, M.; Zakuan, N.; Loganathan, N.; Soheilirad, S.; Saman, M.Z.M.; Ibrahim, O. A systematic review and meta-Analysis of SWARA and WASPAS methods: Theory and applications with recent fuzzy developments. Appl. Soft Comput. 2017, 57, 265–292. [Google Scholar] [CrossRef]
- Mardani, A.; Streimikiene, D.; Zavadskas, E.K.; Cavalaro, F.; Nilashi, M.; Jusoh, A.; Zare, H. Application of Structural Equation Modeling (SEM) to Solve Environmental Sustainability Problems: A Comprehensive Review and Meta-Analysis. Sustainability 2017, 9, 1814. [Google Scholar] [CrossRef]
- Mardani, A.; Zavadskas, E.; Govindan, K.; Amat Senin, A.; Jusoh, A. VIKOR Technique: A Systematic Review of the State of the Art Literature on Methodologies and Applications. Sustainability 2016, 8, 37. [Google Scholar] [CrossRef]
- Mardani, A.; Zavadskas, E.K.; Khalifah, Z.; Zakuan, N.; Jusoh, A.; Nor, K.M.; Khoshnoudi, M. A review of multi-criteria decision-making applications to solve energy management problems: Two decades from 1995 to 2015. Renew. Sustain. Energy Rev. 2017, 71, 216–256. [Google Scholar] [CrossRef]
- Widya-Hasuti, A.; Mardani, A.; Streimikiene, D.; Sharifara, A.; Cavallaro, F. The Role of Process Innovation between Firm-Specific Capabilities and Sustainable Innovation in SMEs: Empirical Evidence from Indonesia. Sustainability 2018, 10, 2244. [Google Scholar] [CrossRef]
- Soheilirad, S.; Govindan, K.; Mardani, A.; Zavadskas, E.K.; Nilashi, M.; Zakuan, N. Application of data envelopment analysis models in supply chain management: A systematic review and meta-analysis. Ann. Oper. Res. 2017, 1–55. [Google Scholar] [CrossRef]
- Zare, M.; Pahl, C.; Rahnama, H.; Nilashi, M.; Mardani, A.; Ibrahim, O.; Ahmadi, H. Multi-criteria decision making approach in E-learning: A systematic review and classification. Appl. Soft Comput. 2016, 45, 108–128. [Google Scholar] [CrossRef]
- Zavadskas, E.K.; Mardani, A.; Turskis, Z.; Jusoh, A.; Nor, K.M. Development of TOPSIS method to solve complicated decision-making problems: An overview on developments from 2000 to 2015. Int. J. Inf. Technol. Decis. Mak. 2016, 645–682, 645–682. [Google Scholar] [CrossRef]
- Adler, N.; Friedman, L.; Sinuany-Stern, Z. Review of ranking methods in the data envelopment analysis context. Eur. J. Oper. Res. 2002, 140, 249–265. [Google Scholar] [CrossRef]
- Emrouznejad, A.; Parker, B.R.; Tavares, G. Evaluation of research in efficiency and productivity: A survey and analysis of the first 30 years of scholarly literature in DEA. Socioecon. Plan. Sci. 2008, 42, 151–157. [Google Scholar] [CrossRef]
- Emrouznejad, A.; Yang, G.-L. A survey and analysis of the first 40 years of scholarly literature in DEA: 1978–2016. Socioecon. Plan. Sci. 2018, 61, 4–8. [Google Scholar] [CrossRef]
- Hatami-Marbini, A.; Emrouznejad, A.; Tavana, M. A taxonomy and review of the fuzzy data envelopment analysis literature: Two decades in the making. Eur. J. Oper. Res. 2011, 214, 457–472. [Google Scholar] [CrossRef]
- Zhou, P.; Ang, B.W.; Poh, K.-L. A survey of data envelopment analysis in energy and environmental studies. Eur. J. Oper. Res. 2008, 189, 1–18. [Google Scholar] [CrossRef]
- Liu, J.S.; Lu, L.Y.; Lu, W.-M.; Lin, B.J. Data envelopment analysis 1978–2010: A citation-based literature survey. Omega 2013, 41, 3–15. [Google Scholar] [CrossRef]
- Cook, W.D.; Seiford, L.M. Data envelopment analysis (DEA)–Thirty years on. Eur. J. Oper. Res. 2009, 192, 1–17. [Google Scholar] [CrossRef]
- Kuah, C.T.; Wong, K.Y.; Behrouzi, F. A Review on Data Envelopment Analysis (DEA). In Proceedings of the 2010 Fourth Asia International Conference on Mathematical/Analytical Modelling and Computer Simulation, Kota Kinabalu, Borneo, Malaysia, 26–28 May 2010; pp. 168–173. [Google Scholar]
- Johnes, J. Data envelopment analysis and its application to the measurement of efficiency in higher education. Econ. Educ. Rev. 2006, 25, 273–288. [Google Scholar] [CrossRef]
- Cooper, W.W.; Seiford, L.M.; Zhu, J. Data Envelopment Analysis: History, Models, and Interpretations. In Handbook on Data Envelopment Analysis; Cooper, W.W., Seiford, L.M., Zhu, J., Eds.; Springer: Boston, MA, USA, 2011; pp. 1–39. [Google Scholar]
- Song, M.; An, Q.; Zhang, W.; Wang, Z.; Wu, J. Environmental efficiency evaluation based on data envelopment analysis: A review. Renew. Sustain. Energy Rev. 2012, 16, 4465–4469. [Google Scholar] [CrossRef]
- Kao, C. Network data envelopment analysis: A review. Eur. J. Oper. Res. 2014, 239, 1–16. [Google Scholar] [CrossRef]
- Charnes, A.; Cooper, W.W.; Rhodes, E. Measuring the efficiency of decision making units. Eur. J. Oper. Res. 1978, 2, 429–444. [Google Scholar] [CrossRef]
- Banker, R.D.; Charnes, A.; Cooper, W.W. Some models for estimating technical and scale inefficiencies in data envelopment analysis. Manag. Sci. 1984, 30, 1078–1092. [Google Scholar] [CrossRef]
- Doyle, J.; Green, R. Efficiency and cross-efficiency in DEA: Derivations, meanings and uses. Eur. J. Oper. Res. 1994, 45, 567–578. [Google Scholar]
- Denyer, D.; Tranfield, D. Producing a systematic review. In The Sage Handbook of Organizational Research Methods; SAGE Publications Ltd.: Thousand Oaks, CA, USA, 2009; pp. 671–689. [Google Scholar]
- Fang, H.; Wu, J.; Zeng, C. Comparative study on efficiency performance of listed coal mining companies in China and the US. Energy Policy 2009, 37, 5140–5148. [Google Scholar] [CrossRef]
- Lin, B.; Du, K. Energy and CO2 emissions performance in China’s regional economies: Do market-oriented reforms matter? Energy Policy 2015, 78, 113–124. [Google Scholar] [CrossRef]
- Wang, K.; Wei, Y.-M.; Zhang, X. A comparative analysis of China’s regional energy and emission performance: Which is the better way to deal with undesirable outputs? Energy Policy 2012, 46, 574–584. [Google Scholar] [CrossRef]
- Iribarren, D.; Vázquez-Rowe, I.; Rugani, B.; Benetto, E. On the feasibility of using emergy analysis as a source of benchmarking criteria through data envelopment analysis: A case study for wind energy. Energy 2014, 67, 527–537. [Google Scholar] [CrossRef]
- Madlener, R.; Antunes, C.H.; Dias, L.C. Assessing the performance of biogas plants with multi-criteria and data envelopment analysis. Eur. J. Oper. Res. 2009, 197, 1084–1094. [Google Scholar] [CrossRef]
- Lins, M.E.; Oliveira, L.B.; da Silva, A.C.M.; Rosa, L.P.; Pereira, A.O., Jr. Performance assessment of Alternative Energy Resources in Brazilian power sector using Data Envelopment Analysis. Renew. Sustain. Energy Rev. 2012, 16, 898–903. [Google Scholar] [CrossRef]
- Liu, Y.; Ren, L.; Li, Y.; Zhao, X.G. The industrial performance of wind power industry in China. Renew. Sust. Energ. Rev. 2015, 43, 644–655. [Google Scholar] [CrossRef]
- Hu, J.-L.; Kao, C.-H. Efficient energy-saving targets for APEC economies. Energy Policy 2007, 35, 373–382. [Google Scholar] [CrossRef]
- Lee, Y.-C.; Hu, J.-L.; Kao, C.-H. Efficient saving targets of electricity and energy for regions in China. Int. J. Electr. Power Energy Syst. 2011, 33, 1211–1219. [Google Scholar] [CrossRef]
- Song, M.; Yang, L.; Wu, J.; Lv, W. Energy saving in China: Analysis on the energy efficiency via bootstrap-DEA approach. Energy Policy 2013, 57, 1–6. [Google Scholar] [CrossRef]
- Bian, Y.; He, P.; Xu, H. Estimation of potential energy saving and carbon dioxide emission reduction in China based on an extended non-radial DEA approach. Energy Policy 2013, 63, 962–971. [Google Scholar] [CrossRef]
- Wu, J.; Lv, L.; Sun, J.; Ji, X. A comprehensive analysis of China’s regional energy saving and emission reduction efficiency: From production and treatment perspectives. Energy Policy 2015, 84, 166–176. [Google Scholar] [CrossRef]
- Hu, J.-L.; Lio, M.-C.; Kao, C.-H.; Lin, Y.-L. Total-factor energy efficiency for regions in Taiwan. Energy Source Part B 2012, 7, 292–300. [Google Scholar] [CrossRef]
- Mandal, S.K.; Madheswaran, S. Energy use efficiency of Indian cement companies: A data envelopment analysis. Energy Effic. 2011, 4, 57–73. [Google Scholar] [CrossRef]
- Rezaee, M.J.; Moini, A.; Makui, A. Operational and non-operational performance evaluation of thermal power plants in Iran: A game theory approach. Energy 2012, 38, 96–103. [Google Scholar] [CrossRef]
- Tan, Z.; Yu, C. An empirical study of China energy consumption structure efficiency: DEA analysis. Hwa Zhong Power 2008, 36, 1023–1026. [Google Scholar]
- Welch, E.; Barnum, D. Joint environmental and cost efficiency analysis of electricity generation. Ecol. Econ. 2009, 68, 2336–2343. [Google Scholar] [CrossRef]
- Sözen, A.; Alp, İ.; Özdemir, A. Assessment of operational and environmental performance of the thermal power plants in Turkey by using data envelopment analysis. Energy Policy 2010, 38, 6194–6203. [Google Scholar] [CrossRef]
- Hoang, V.-N.; Alauddin, M. Input-orientated data envelopment analysis framework for measuring and decomposing economic, environmental and ecological efficiency: An application to OECD agriculture. Environ. Resour. Econ. 2012, 51, 431–452. [Google Scholar] [CrossRef]
- Chang, D.-S.; Yeh, L.-T.; Liu, W. Incorporating the carbon footprint to measure industry context and energy consumption effect on environmental performance of business operations. Clean. Technol. Environ. 2014, 17, 359–371. [Google Scholar] [CrossRef]
- Wang, Z.; Feng, C. A performance evaluation of the energy, environmental, and economic efficiency and productivity in China: An application of global data envelopment analysis. Appl. Energy 2015, 147, 617–626. [Google Scholar] [CrossRef]
- Mohammadi, A.; Rafiee, S.; Jafari, A.; Keyhani, A.; Dalgaard, T.; Knudsen, M.T.; Nguyen, T.L.T.; Borek, R.; Hermansen, J.E. Joint Life Cycle Assessment and Data Envelopment Analysis for the benchmarking of environmental impacts in rice paddy production. J. Clean. Prod. 2015, 106, 521–532. [Google Scholar] [CrossRef]
- Jan, P.; Dux, D.; Lips, M.; Alig, M.; Dumondel, M. On the link between economic and environmental performance of Swiss dairy farms of the alpine area. Int. J. Life Cycle Assess. 2012, 17, 706–719. [Google Scholar] [CrossRef]
- Yeh, T.L.; Chen, T.Y.; Lai, P.Y. A comparative study of energy utilization efficiency between Taiwan and China. Energy Policy 2010, 38, 2386–2394. [Google Scholar] [CrossRef]
- Shi, G.-M.; Bi, J.; Wang, J.-N. Chinese regional industrial energy efficiency evaluation based on a DEA model of fixing non-energy inputs. Energy Policy 2010, 38, 6172–6179. [Google Scholar] [CrossRef]
- Wang, K.; Wei, Y.-M. China’s regional industrial energy efficiency and carbon emissions abatement costs. Appl. Energy 2014, 130, 617–631. [Google Scholar] [CrossRef]
- Mousavi-Avval, S.H.; Rafiee, S.; Jafari, A.; Mohammadi, A. Improving energy use efficiency of canola production using data envelopment analysis (DEA) approach. Energy 2011, 36, 2765–2772. [Google Scholar] [CrossRef]
- Khoshnevisan, B.; Rafiee, S.; Omid, M.; Mousazadeh, H. Reduction of CO2 emission by improving energy use efficiency of greenhouse cucumber production using DEA approach. Energy 2013, 55, 676–682. [Google Scholar] [CrossRef]
- Nabavi-Pelesaraei, A.; Abdi, R.; Rafiee, S.; Mobtaker, H.G. Optimization of energy required and greenhouse gas emissions analysis for orange producers using data envelopment analysis approach. J. Clean. Prod. 2014, 65, 311–317. [Google Scholar] [CrossRef]
- Ebrahimi, R.; Salehi, M. Investigation of CO2 emission reduction and improving energy use efficiency of button mushroom production using Data Envelopment Analysis. J. Clean. Prod. 2015, 103, 112–119. [Google Scholar] [CrossRef]
- Pang, R.Z.; Deng, Z.Q.; Hu, J.l. Clean energy use and total-factor efficiencies: An international comparison. Renew. Sust. Energy Rev. 2015, 52, 1158–1171. [Google Scholar] [CrossRef]
- Banaeian, N.; Omid, M.; Ahmadi, H. Greenhouse strawberry production in Iran, efficient or inefficient in energy. Energy Effic. 2012, 5, 201–209. [Google Scholar] [CrossRef]
- Ren, J.; Tan, S.; Dong, L.; Mazzi, A.; Scipioni, A.; Sovacool, B.K. Determining the life cycle energy efficiency of six biofuel systems in China: A Data Envelopment Analysis. Bioresour. Technol. 2014, 162, 1–7. [Google Scholar] [CrossRef] [PubMed]
- Pardo Martínez, C.I.; Silveira, S. Analysis of energy use and CO2 emission in service industries: Evidence from Sweden. Renew. Sustain. Energy Rev. 2012, 16, 5285–5294. [Google Scholar] [CrossRef]
- Wang, J.; Zhao, T. Regional energy-environmental performance and investment strategy for China’s non-ferrous metals industry: A non-radial DEA based analysis. J. Clean. Prod. 2017, 163, 187–201. [Google Scholar] [CrossRef]
- Han, Y.; Long, C.; Geng, Z.; Zhang, K. Carbon emission analysis and evaluation of industrial departments in China: An improved environmental DEA cross model based on information entropy. J. Environ. Manag. 2018, 205, 298–307. [Google Scholar] [CrossRef] [PubMed]
- Geng, Z.; Dong, J.; Han, Y.; Zhu, Q. Energy and environment efficiency analysis based on an improved environment DEA cross-model: Case study of complex chemical processes. Appl. Energy 2017, 205, 465–476. [Google Scholar] [CrossRef]
- Nabavi-Pelesaraei, A.; Rafiee, S.; Mohtasebi, S.S.; Hosseinzadeh-Bandbafha, H.; Chau, K.W. Energy consumption enhancement and environmental life cycle assessment in paddy production using optimization techniques. J. Clean. Prod. 2017, 162, 571–586. [Google Scholar] [CrossRef]
- Chen, Y.; Han, Y.; Zhu, Q. Energy and environmental efficiency evaluation based on a novel data envelopment analysis: An application in petrochemical industries. Appl. Therm. Eng. 2017, 119, 156–164. [Google Scholar] [CrossRef]
- Nazarko, J.; Chodakowska, E. Labour efficiency in construction industry in Europe based on frontier methods: Data envelopment analysis and stochastic frontier analysis. J. Civ. Eng. Manag. 2017, 23, 787–795. [Google Scholar] [CrossRef]
- Nazarko, J.; Chodakowska, E. Measuring productivity of construction industry in Europe with Data Envelopment Analysis. Procedia Eng. 2015, 122, 204–212. [Google Scholar] [CrossRef]
- Zhou, D.; Meng, F.; Bai, Y.; Cai, S. Energy efficiency and congestion assessment with energy mix effect: The case of APEC countries. J. Clean. Prod. 2017, 142, 819–828. [Google Scholar] [CrossRef]
- Toma, P.; Miglietta, P.P.; Zurlini, G.; Valente, D.; Petrosillo, I. A non-parametric bootstrap-data envelopment analysis approach for environmental policy planning and management of agricultural efficiency in EU countries. Ecol. Indic. 2017, 83, 132–143. [Google Scholar] [CrossRef]
- Moutinho, V.; Madaleno, M.; Robaina, M. The economic and environmental efficiency assessment in EU cross-country: Evidence from DEA and quantile regression approach. Ecol. Indic. 2017, 78, 85–97. [Google Scholar] [CrossRef]
- Kim, J.-R.; Jeon, E.-C.; Cho, S.; Kim, H. The Promotion of Environmental Management in the South Korean Health Sector—Case Study. Sustainability 2018, 10, 2081. [Google Scholar] [CrossRef]
- Yu, S.-H.; Gao, Y.; Shiue, Y.-C. A Comprehensive Evaluation of Sustainable Development Ability and Pathway for Major Cities in China. Sustainability 2017, 9, 1483. [Google Scholar] [CrossRef]
- Vlontzos, G.; Pardalos, P. Assess and prognosticate green house gas emissions from agricultural production of EU countries, by implementing, DEA Window analysis and artificial neural networks. Renew. Sustain. Energy Rev. 2017, 76, 155–162. [Google Scholar] [CrossRef]
- Chen, X.; Gao, Y.; An, Q.; Wang, Z.; Neralić, L. Energy efficiency measurement of Chinese Yangtze River Delta’s cities transportation: A DEA window analysis approach. Energ. Effic. 2018. [Google Scholar] [CrossRef]
- Lin, S.; Sun, J.; Marinova, D.; Zhao, D. Evaluation of the green technology innovation efficiency of China’s manufacturing industries: DEA window analysis with ideal window width. Technol. Anal. Strateg. 2018, 1–16, 1–16. [Google Scholar] [CrossRef]
- Chen, L.; Jia, G. Environmental efficiency analysis of China’s regional industry: A data envelopment analysis (DEA) based approach. J. Clean. Prod. 2017, 142, 846–853. [Google Scholar] [CrossRef]
- Hu, X.; Liu, C. Slacks-based data envelopment analysis for eco-efficiency assessment in the Australian construction industry. Constr. Manag. Econ. 2017, 35, 693–706. [Google Scholar] [CrossRef]
- Song, M.; Zheng, W. Computational analysis of thermoelectric enterprises’ environmental efficiency and Bayesian estimation of influence factors. Soc. Sci. J. 2016, 53, 88–99. [Google Scholar] [CrossRef]
- Guo, X.; Zhu, Q.; Lv, L.; Chu, J.; Wu, J. Efficiency evaluation of regional energy saving and emission reduction in China: A modified slacks-based measure approach. J. Clean. Prod. 2017, 140, 1313–1321. [Google Scholar] [CrossRef]
- Chu, J.-F.; Wu, J.; Song, M.-L. An SBM-DEA model with parallel computing design for environmental efficiency evaluation in the big data context: A transportation system application. Ann. Oper. Res. 2016. [Google Scholar] [CrossRef]
- Li, N.; Liu, C.; Zha, D. Performance evaluation of Chinese photovoltaic companies with the input-oriented dynamic SBM model. Renew. Energ. 2016, 89, 489–497. [Google Scholar] [CrossRef]
- Shin, J.; Kim, C.; Yang, H. The Effect of Sustainability as Innovation Objectives on Innovation Efficiency. Sustainability 2018, 10, 1966. [Google Scholar] [CrossRef]
- Masuda, K. Energy Efficiency of Intensive Rice Production in Japan: An Application of Data Envelopment Analysis. Sustainability 2018, 10, 120. [Google Scholar] [CrossRef]
- Wang, X.; Han, L.; Yin, L. Environmental Efficiency and Its Determinants for Manufacturing in China. Sustainability 2017, 9, 47. [Google Scholar] [CrossRef]
- Gan, L.; Xu, D.; Hu, L.; Wang, L. Economic Feasibility Analysis for Renewable Energy Project Using an Integrated TFN–AHP–DEA Approach on the Basis of Consumer Utility. Energies 2017, 10, 2089. [Google Scholar] [CrossRef]
- He, Y.; Liao, N.; Zhou, Y. Analysis on provincial industrial energy efficiency and its influencing factors in China based on DEA-RS-FANN. Energy 2018, 142, 79–89. [Google Scholar] [CrossRef]
- Wang, X.; Li, Z.; Meng, H.; Wu, J. Identification of key energy efficiency drivers through global city benchmarking: A data driven approach. Appl. Energy 2017, 190, 18–28. [Google Scholar] [CrossRef]
- Li, K.; Lin, B. An application of a double bootstrap to investigate the effects of technological progress on total-factor energy consumption performance in China. Energy 2017, 128, 575–585. [Google Scholar] [CrossRef]
- Li, K.; Lin, B. Impact of energy conservation policies on the green productivity in China’s manufacturing sector: Evidence from a three-stage DEA model. Appl. Energy 2016, 168, 351–363. [Google Scholar] [CrossRef]
- Zhou, D.; Wang, Q.; Su, B.; Zhou, P.; Yao, L. Industrial energy conservation and emission reduction performance in China: A city-level nonparametric analysis. Appl. Energy 2016, 166, 201–209. [Google Scholar] [CrossRef]
- Duan, N.; Guo, J.-P.; Xie, B.-C. Is there a difference between the energy and CO2 emission performance for China’s thermal power industry? A bootstrapped directional distance function approach. Appl. Energy 2016, 162, 1552–1563. [Google Scholar] [CrossRef]
- Yan, Q.; Wan, Y.; Yuan, J.; Yin, J.; Baležentis, T.; Streimikiene, D. Economic and Technical Efficiency of the Biomass Industry in China: A Network Data Envelopment Analysis Model Involving Externalities. Energies 2017, 10, 1418. [Google Scholar] [CrossRef]
- Ramanathan, R.; Ramanathan, U.; Bentley, Y. The debate on flexibility of environmental regulations, innovation capabilities and financial performance—A novel use of DEA. Omega 2018, 75, 131–138. [Google Scholar] [CrossRef]
- Sueyoshi, T.; Wang, D. Measuring scale efficiency and returns to scale on large commercial rooftop photovoltaic systems in California. Energy Econ. 2017, 65, 389–398. [Google Scholar] [CrossRef]
- Kourtit, K.; Suzuki, S.; Nijkamp, P. Tracing high-sustainability performers among world cities-design and application of a multi-temporal data envelopment analysis. Habitat. Int. 2017, 68, 43–54. [Google Scholar] [CrossRef]
- Meng, S.; Zhou, W.; Chen, J.; Zhang, C. A synthesized data envelopment analysis model and its application in resource efficiency evaluation and dynamic trend analysis. Energy Environ. 2018, 29, 260–280. [Google Scholar] [CrossRef]
- Vaninsky, A. Energy-environmental efficiency and optimal restructuring of the global economy. Energy 2018, 153, 338–348. [Google Scholar] [CrossRef]
- Chen, Z.; Wanke, P.; Antunes, J.J.M.; Zhang, N. Chinese airline efficiency under CO2 emissions and flight delays: A stochastic network DEA model. Energy Econ. 2017, 68, 89–108. [Google Scholar] [CrossRef]
- Moon, H.; Min, D. Assessing energy efficiency and the related policy implications for energy-intensive firms in Korea: DEA approach. Energy 2017, 133, 23–34. [Google Scholar] [CrossRef]
- Guo, X.; Lu, C.-C.; Lee, J.-H.; Chiu, Y.-H. Applying the dynamic DEA model to evaluate the energy efficiency of OECD countries and China. Energy 2017, 134, 392–399. [Google Scholar] [CrossRef]
- Cui, Q.; Wei, Y.-M.; Li, Y. Exploring the impacts of the EU ETS emission limits on airline performance via the Dynamic Environmental DEA approach. Appl. Energy 2016, 183, 984–994. [Google Scholar] [CrossRef]
- Cui, Q.; Li, Y.; Yu, C.-l.; Wei, Y.-M. Evaluating energy efficiency for airlines: An application of virtual frontier dynamic slacks based measure. Energy 2016, 113, 1231–1240. [Google Scholar] [CrossRef]
- Zha, Y.; Zhao, L.; Bian, Y. Measuring regional efficiency of energy and carbon dioxide emissions in China: A chance constrained DEA approach. Comput. Oper. Res. 2016, 66, 351–361. [Google Scholar] [CrossRef]
- Wu, J.; Xiong, B.; An, Q.; Sun, J.; Wu, H. Total-factor energy efficiency evaluation of Chinese industry by using two-stage DEA model with shared inputs. Ann. Oper. Res. 2017, 255, 257–276. [Google Scholar] [CrossRef]
- Cui, Q.; Li, Y. Airline energy efficiency measures considering carbon abatement: A new strategic framework. Transp. Res. D Transp. Environ. 2016, 49, 246–258. [Google Scholar] [CrossRef]
- Iftikhar, Y.; He, W.; Wang, Z. Energy and CO2 emissions efficiency of major economies: A non-parametric analysis. J. Clean. Prod. 2016, 139, 779–787. [Google Scholar] [CrossRef]
- Wu, J.; Yin, P.; Sun, J.; Chu, J.; Liang, L. Evaluating the environmental efficiency of a two-stage system with undesired outputs by a DEA approach: An interest preference perspective. Eur. J. Oper. Res. 2016, 254, 1047–1062. [Google Scholar] [CrossRef]
- Huang, J.; Du, D.; Hao, Y. The driving forces of the change in China’s energy intensity: An empirical research using DEA-Malmquist and spatial panel estimations. Econ. Model. 2017, 65, 41–50. [Google Scholar] [CrossRef]
- Olfat, L.; Amiri, M.; Soufi, J.B.; Pishdar, M. A dynamic network efficiency measurement of airports performance considering sustainable development concept: A fuzzy dynamic network-DEA approach. J. Air Transp. Manag. 2016, 57, 272–290. [Google Scholar] [CrossRef]
- Sueyoshi, T.; Yuan, Y. Social sustainability measured by intermediate approach for DEA environmental assessment: Chinese regional planning for economic development and pollution prevention. Energy Econ. 2017, 66, 154–166. [Google Scholar] [CrossRef]
- Kang, D.; Lee, D.H. Energy and environment efficiency of industry and its productivity effect. J. Clean. Prod. 2016, 135, 184–193. [Google Scholar] [CrossRef]
- Chen, Y.; Liu, B.; Shen, Y.; Wang, X. The energy efficiency of China’s regional construction industry based on the three-stage DEA model and the DEA-DA model. KSCE J. Civ. Eng. 2016, 20, 34–47. [Google Scholar] [CrossRef]
- Wang, J.; Zhao, T.; Zhang, X. Environmental assessment and investment strategies of provincial industrial sector in China—Analysis based on DEA model. Environ. Impact Assess. Rev. 2016, 60, 156–168. [Google Scholar] [CrossRef]
- Chen, W.; Geng, W. Fossil energy saving and CO2 emissions reduction performance, and dynamic change in performance considering renewable energy input. Energy 2017, 120, 283–292. [Google Scholar] [CrossRef]
- Liu, X.; Wu, J. Energy and environmental efficiency analysis of China’s regional transportation sectors: A slack-based DEA approach. Energy Syst. 2017, 8, 747–759. [Google Scholar] [CrossRef]
- Martínez, C.I.P.; Piña, W.H.A. Regional analysis across Colombian departments: A non-parametric study of energy use. J. Clean. Prod. 2016, 115, 130–138. [Google Scholar] [CrossRef]
- Bostian, M.; Färe, R.; Grosskopf, S.; Lundgren, T. Environmental investment and firm performance: A network approach. Energy Econ. 2016, 57, 243–255. [Google Scholar] [CrossRef]
- Shermeh, H.E.; Najafi, S.; Alavidoost, M. A novel fuzzy network SBM model for data envelopment analysis: A case study in Iran regional power companies. Energy 2016, 112, 686–697. [Google Scholar] [CrossRef]
- Kwon, D.S.; Cho, J.H.; Sohn, S.Y. Comparison of technology efficiency for CO2 emissions reduction among European countries based on DEA with decomposed factors. J. Clean. Prod. 2017, 151, 109–120. [Google Scholar] [CrossRef]
- Song, T.; Yang, Z.; Chahine, T. Efficiency evaluation of material and energy flows, a case study of Chinese cities. J. Clean. Prod. 2016, 112, 3667–3675. [Google Scholar] [CrossRef]
- Song, X.; Jiang, X.; Zhang, X.; Liu, J. Analysis, Evaluation and Optimization Strategy of China Thermal Power Enterprises’ Business Performance Considering Environmental Costs under the Background of Carbon Trading. Sustainability 2018, 10, 2006. [Google Scholar] [CrossRef]
- Cheng, S.; Liu, W.; Lu, K. Economic Growth Effect and Optimal Carbon Emissions under China’s Carbon Emissions Reduction Policy: A Time Substitution DEA Approach. Sustainability 2018, 10, 1543. [Google Scholar] [CrossRef]
- Wang, L.; Xue, X.; Shi, Y.; Wang, Z.; Ji, A. A Dynamic Analysis to Evaluate the Environmental Performance of Cities in China. Sustainability 2018, 10, 862. [Google Scholar] [CrossRef]
- Zhang, A.; Li, A.; Gao, Y. Social Sustainability Assessment across Provinces in China: An Analysis of Combining Intermediate Approach with Data Envelopment Analysis (DEA) Window Analysis. Sustainability 2018, 10, 732. [Google Scholar] [CrossRef]
- Vlontzos, G.; Niavis, S.; Pardalos, P. Testing for Environmental Kuznets Curve in the EU Agricultural Sector through an Eco-(in)Efficiency Index. Energies 2017, 10, 1992. [Google Scholar] [CrossRef]
- Gong, Z.; Chen, X. Analysis of Interval Data Envelopment Efficiency Model Considering Different Distribution Characteristics—Based on Environmental Performance Evaluation of the Manufacturing Industry. Sustainability 2017, 9, 2080. [Google Scholar] [CrossRef]
- Xiong, S.; Tian, Y.; Ji, J.; Ma, X. Allocation of Energy Consumption among Provinces in China: A Weighted ZSG-DEA Model. Sustainability 2017, 9, 2115. [Google Scholar] [CrossRef]
- Liu, J.-P.; Yang, Q.-R.; He, L. Total-Factor Energy Efficiency (TFEE) Evaluation on Thermal Power Industry with DEA, Malmquist and Multiple Regression Techniques. Energies 2017, 10, 1039. [Google Scholar] [CrossRef]
- Guerrini, A.; Romano, G.; Indipendenza, A. Energy Efficiency Drivers in Wastewater Treatment Plants: A Double Bootstrap DEA Analysis. Sustainability 2017, 9, 1126. [Google Scholar] [CrossRef]
- Liu, J.; Long, Y.; Song, X. A Study on the Conduction Mechanism and Evaluation of the Comprehensive Efficiency of Photovoltaic Power Generation in China. Energies 2017, 10, 723. [Google Scholar]
- Li, H.; Dong, K.; Sun, R.; Yu, J.; Xu, J. Sustainability Assessment of Refining Enterprises Using a DEA-Based Model. Sustainability 2017, 9, 620. [Google Scholar] [CrossRef]
- Chen, X.; Gong, Z. DEA Efficiency of Energy Consumption in China’s Manufacturing Sectors with Environmental Regulation Policy Constraints. Sustainability 2017, 9, 210. [Google Scholar] [CrossRef]
- Tsai, W.-H.; Lee, H.-L.; Yang, C.-H.; Huang, C.-C. Input-Output Analysis for Sustainability by Using DEA Method: A Comparison Study between European and Asian Countries. Sustainability 2016, 8, 1230. [Google Scholar] [CrossRef]
- Li, G.; Huang, D.; Li, Y. China’s Input-Output Efficiency of Water-Energy-Food Nexus Based on the Data Envelopment Analysis (DEA) Model. Sustainability 2016, 8, 927. [Google Scholar] [CrossRef]
- Zhang, Y.-J.; Chen, M.-Y. Evaluating the dynamic performance of energy portfolios: Empirical evidence from the DEA directional distance function. Eur. J. Oper. Res. 2018, 269, 64–78. [Google Scholar] [CrossRef]
- Angulo-Meza, L.; González-Araya, M.; Iriarte, A.; Rebolledo-Leiva, R.; de Mello, J.C.S. A multiobjective DEA model to assess the eco-efficiency of agricultural practices within the CF+ DEA method. Comput. Electron. Agric. 2018. [Google Scholar] [CrossRef]
- Meng, D.; Shao, C.; Zhu, L. Ethylene cracking furnace TOPSIS energy efficiency evaluation method based on dynamic energy efficiency baselines. Energy 2018, 156, 620–634. [Google Scholar] [CrossRef]


| Authors | Application Scheme | DEA Models | Application Fields |
|---|---|---|---|
| Wang and Zhao [90] | Non-ferrous metals industry | Non-radial DEA | Investment strategy and Energy-environmental performance |
| Zhou et al. [119] | Industrial sectors | Non-radial Malmquist | emission reduction performance and industrial energy conservation and |
| Duan et al. [120] | Thermal power industry | Bootstrap DEA | Energy and CO2 emission performance |
| Fang, Wu and Zeng [56] | Coal mining companies | CCR and BCC models | Efficiency performance |
| Wang, Wei and Zhang [58] | Labor and capital stock | DEA window analysis | Energy and emission performance |
| Lin and Du [57] | Panel data set of 30 provinces | Non-radial DEA | Energy and CO2 emissions performance |
| Iribarren, Vázquez-Rowe, Rugani and Benetto [59] | Wind energy | Non-radial and constant returns to scale (CRS) | Benchmark multiple resembling entities |
| Madlener, Antunes and Dias [60] | Agricultural biogas plants | CCR model | Measures of radial efficiency performance |
| Lins, Oliveira, da Silva, Rosa and Pereira Jr [61] | Power sector | DEA frontier | Performance assessment |
| Liu, Ren, Li and Zhao [62] | Wind power industry | CRS and VRS DEA | Industrial performance |
| Jan, Dux, Lips, Alig and Dumondel [78] | Dairy farms | DEA frontier | economic and environmental performance |
| Pardo Martínez and Silveira [89] | Service industries | CCR DEA | Energy use and CO2 emission |
| Ren, Tan, Dong, Mazzi, Scipioni and Sovacool [88] | Biofuel systems | CCR DEA | Life cycle energy efficiency |
| Banaeian, Omid and Ahmadi [87] | Strawberry yield | CRS and VRS DEA | Effective energy utilization |
| Pang, Deng and Hu [86] | Total energy use of 86 countries | Directional distance function (DDF) and SBM (slack-based measure) | Clean energy use |
| Ebrahimi and Salehi [85] | Button mushroom production | CCR and BCC models | Energy use efficiency and CO2 emission reduction |
| Nabavi-Pelesaraei, Abdi, Rafiee and Mobtaker [84] | Orange production | CCR and BCC models | energy efficiency and GHG emissions |
| Khoshnevisan, Rafiee, Omid and Mousazadeh [83] | Cucumber production | CCR and BCC models | Energy use efficiency |
| Mousavi-Avval, Rafiee, Jafari and Mohammadi [82] | Canola production | CCR and BCC models | Energy use efficiency |
| Lee, Hu and Kao [64] | Types of efficient electricity, gasoline oil savings and coal | CRS and VRS DEA | Energy-saving targets |
| Hu and Kao [63] | 17 APEC economies | Slack and radial DEA | Energy-saving targets |
| Wang and Wei [81] | 30 Chinese major cities | VRS model | Industrial energy and emissions efficiency |
| Shi, Bi and Wang [80] | 28 administrative regions | CCR and BCC models | Industrial energy efficiency |
| Yeh, Chen and Lai [79] | 31 DMUs of China and Taiwan | CCR–DEA model | Energy utilization efficiency |
| Mohammadi, Rafiee, Jafari, Keyhani, Dalgaard, Knudsen, Nguyen, Borek and Hermansen [77] | Rice paddy production | CRS-DEA | Benchmarking of environmental impacts |
| Wang and Feng [76] | E3 productivity | DEA-Malmquist | Energy economic and environmental efficiency |
| Chang, Yeh and Liu [75] | Top Fortune 500 companies | DEA-SBM model | Environmental performance |
| Hoang and Alauddin [74] | Agricultural production | CRS and VRS DEA | Environmental, economic, and ecological efficiency |
| Song, Yang, Wu and Lv [65] | Nearly 20 years of data | CCR-DEA | Energy saving |
| Welch and Barnum [72] | Electricity generation | DEA–MBP model | Environmental and cost efficiency |
| Rezaee, Moini and Makui [70] | Thermal power plants | DEA-bargaining game | Operational and non-operational performance |
| Mandal and Madheswaran [69] | Cement companies | BCC DEA | Energy use efficiency |
| Hu, Lio, Kao and Lin [68] | 23 administrative regions | CRS DEA | Energy efficiency |
| Bian, He and Xu [66] | Provinces, municipalities and autonomous region | Non-radial DEA | energy saving and CO2 emission |
| Wu, Lv, Sun and Ji [67] | 30 municipalities, provinces, and autonomous | Two-stage network DEA | Emission reduction efficiency and energy saving |
| Sözen, Alp and Özdemir [73] | Thermal power plants | CRS, CCR, VRS and BCC DEA | Environmental and operational and performance |
| Chen and Jia [105] | 31 regions’ industry | SBM DEA | Environmental efficiency analysis |
| Yan et al. [121] | Biomass Industry | Network DEA | Economic and Technical Efficiency |
| Ramanathan et al. [122] | Manufacturing firms | DEA-FA- regression | Environmental regulations |
| Gan, Xu, Hu and Wang [114] | Renewable Energy Project | TFN–AHP–DEA | Economic Feasibility Analysis |
| Sueyoshi and Wang [123] | Rooftop photovoltaic systems | RTS DEA | Operational efficiency, performance and inefficiency |
| He, Liao and Zhou [115] | Provincial industry sectors | DEA-RS-FANN | Industrial energy efficiency |
| Vlontzos and Pardalos [102] | Agricultural production | DEA Window analysis | GHG emissions |
| Chen, Gao, An, Wang and Neralić [103] | Cities transportation | DEA window analysis | Energy efficiency measurement |
| Kourtit et al. [124] | World cities | Multi-temporal DEA | Sustainability performers |
| Zhou, Meng, Bai and Cai [97] | 19 APEC countries | VRS DEA | Congestion assessment and energy efficiency |
| Wang, Li, Meng and Wu [116] | Twenty-five global cities | DEA, decision tree and K-means clustering | Energy efficiency |
| Meng et al. [125] | Resource efficiency of 31 provinces | Synthesized DEA | Resource efficiency evaluation |
| Han, Long, Geng and Zhang [91] | Industrial departments | CRS DEA | Environment efficiency analysis |
| Geng, Dong, Han and Zhu [92] | Complex chemical processes | CCR DEA | Energy and environment efficiency |
| Nabavi-Pelesaraei, Rafiee, Mohtasebi, Hosseinzadeh-Bandbafha and Chau [93] | Paddy production | CCR and BCC DEA | Energy use and environmental evaluation |
| Chen, Han and Zhu [94] | Petrochemical industries | CCR DEA | Environmental and Energy efficiency evaluation |
| Toma, Miglietta, Zurlini, Valente and Petrosillo [98] | Agricultural efficiency | CRS and VRS DEA | Environmental policy management and planning |
| Vaninsky [126] | Global economic data | Stochastic DEA | Energy-environmental efficiency |
| Chen et al. [127] | Airline industry | Stochastic network DEA | Efficiency assessment |
| Lin, Sun, Marinova and Zhao [104] | Manufacturing industries | DEA window analysis | Green technology innovation efficiency |
| Li and Lin [117] | Across 30 provinces | Non-radial and double-bootstrap | Energy consumption performance |
| Moon and Min [128] | Energy-intensive firms | Network DEA | Energy efficiency |
| Hu and Liu [106] | Construction industry | Slacks-based DEA | Eco-efficiency assessment |
| Guo et al. [129] | Energy stock | Dynamic DEA | Energy efficiency |
| Cui et al. [130] | Airline performance | Dynamic Environmental DEA | GHG emissions |
| Cui et al. [131] | Airlines’ energy efficiencies | Slacks Based DEA | Energy efficiency |
| Li and Lin [118] | Manufacturing sector | Stochastic frontier analysis (SFA) and DDF DEA | Energy conservation |
| Zha et al. [132] | Regional efficiencies 30 provinces | Radial stochastic DEA | Energy efficiency and CO2 emissions |
| Wu et al. [133] | Data of 30 provinces | Two-stage DEA approach | Energy efficiency |
| Cui and Li [134] | Airline efficiency | Slacks-Based Measure (SBM) | Energy efficiency |
| Hu and Liu [106] | 29 international airlines | Network Range Adjusted Environmental DEA | Carbon neutral growth |
| Iftikhar et al. [135] | Major economies | SBM DEA model | CO2 emissions and Energy efficiency |
| Song and Zheng [107] | Thermoelectric enterprises | SBM DEA model | Environmental efficiency |
| Guo, Zhu, Lv, Chu and Wu [108] | 26 provincial regions | SBM-DEA model | Natural resource allocation |
| Wu et al. [136] | Data of 30 provinces | CCR and CRS DEA | Environmental efficiency |
| Chu, Wu and Song [109] | Transportation system | SBM-DEA model | Environmental efficiency |
| Huang et al. [137] | Three sectors and industry | DEA Malmquist | Energy intensity |
| Moutinho, Madaleno and Robaina [99] | EU cross-country | VRS and CRS-DEA | Environmental and economic efficiency |
| Olfat et al. [138] | Airports performance | Fuzzy dynamic network-DEA | Efficiency measurement |
| Sueyoshi and Yuan [139] | 30 provinces | Constant Returns to Scale (CRTS) and Variable Returns to Scale (VRTS) | Social sustainability |
| Kang and Lee [140] | 154 industries | CRS and VRS DEA | Environmental and energy efficiency |
| Chen et al. [141] | Construction industry | DEA Discriminant Analysis (DEA-DA) | Energy efficiency |
| Wang et al. [142] | Provincial industrial sector | Non-radial DEA model | Environmental assessment |
| Li, Liu and Zha [110] | Photovoltaic companies | SBM model | Operational efficiency |
| Chen and Geng [143] | 26 Organization | Non-radial Malmquist index (NMI) | CO2 emissions reduction and fossil energy saving |
| Liu and Wu [144] | Transportation sectors | Slack-based DEA | Environmental and energy efficiency |
| Martínez and Piña [145] | Manufacturing industries | Malmquist-DEA | Energy use |
| Bostian et al. [146] | Pulp and paperindustry | Network DEA | Environmental investment |
| Shermeh et al. [147] | Power companies | Fuzzy network SBM model | Company efficiency |
| Kwon et al. [148] | 12 EU countries | CRS and VRS DEA | Technology efficiency |
| Song et al. [149] | 31 cities | VRS DEA | Efficiency evaluation |
| Kim, Jeon, Cho and Kim [100] | Health Sector | CRS and VRS | Environmental Management |
| Song et al. [150] | Thermal power companies | CCR model | Environmental costs and business performance |
| Shin, Kim and Yang [111] | Manufacturing companies | SBM DEA | Innovation Efficiency |
| Cheng et al. [151] | Panel data for 29 provinces | DEA-CCR | Economic Growth |
| Wang et al. [152] | Panel data for 285 cities | DDF-DEA | Environmental Performance |
| Zhang et al. [153] | 30 provinces for expression convenience | DEA Window | Social Sustainability Assessment |
| Masuda [112] | Rice Production | SBM model | Energy Efficiency |
| Vlontzos et al. [154] | Agricultural Sector | DDF-DEA | Eco-Efficiency |
| Gong and Chen [155] | Manufacturing Industry | Interval DEA-CCR | Environmental Performance |
| Xiong et al. [156] | 30 provinces | CCR-DEA | Energy Consumption |
| Yu, Gao and Shiue [101] | 34 major cities | CRS and VRS DEA | Sustainable Development |
| Liu et al. [157] | Thermal power industry | CCR and CRS DEA | Energy Efficiency |
| Guerrini et al. [158] | 127 selected plants | Double Bootstrap DEA | Energy Efficiency |
| Liu et al. [159] | Photovoltaic Power | Super-efficient DEA (SE-DEA) | Comprehensive Efficiency |
| Li et al. [160] | Refining Enterprises | DEA-based model | Sustainability Assessment |
| Chen and Gong [161] | Manufacturing Sectors | CCR-DEA | Efficiency of Energy Consumption |
| Wang, Han and Yin [113] | Manufacturing Sectors | SBM model | Environmental Efficiency |
| Tsai et al. [162] | 37 European countries and 36 Asian countries | SBM model | Sustainability Assessment |
| Li et al. [163] | 30 provinces | CRR and BCC DEA | Efficiency of Water-Energy |
| Name of Journal | Number of Papers | Percentage |
|---|---|---|
| Journal of Cleaner Production | 17 | 12.32% |
| Sustainability | 16 | 11.59% |
| Energy | 14 | 10.14% |
| Energy Policy | 12 | 8.70% |
| Energies | 10 | 7.25% |
| Renewable and Sustainable Energy Reviews | 9 | 6.52% |
| Applied Energy | 9 | 6.52% |
| Energy Economics | 4 | 2.90% |
| Computers & Operations Research | 3 | 2.17% |
| Ecological Economics | 3 | 2.17% |
| Energy Efficiency | 3 | 2.17% |
| Annals of Operations Research | 2 | 1.45% |
| Energy and Buildings | 2 | 1.45% |
| European journal of operational research | 2 | 1.45% |
| Ecological indicators | 2 | 1.45% |
| Water Resources Management | 1 | 0.72% |
| Omega | 1 | 0.72% |
| Applied Thermal Engineering | 1 | 0.72% |
| Journal of Productivity Analysis | 1 | 0.72% |
| Energy Conversion and Management | 1 | 0.72% |
| Engineering Applications of Artificial Intelligence | 1 | 0.72% |
| Socio-economic planning sciences | 1 | 0.72% |
| Economics of Education Review | 1 | 0.72% |
| Journal of Policy Modeling | 1 | 0.72% |
| International Journal of Environment and Pollution | 1 | 0.72% |
| International Journal of Electrical Power & Energy Systems | 1 | 0.72% |
| Energy Sources, Part B: Economics, Planning, and Policy | 1 | 0.72% |
| Hwa Zhong Power | 1 | 0.72% |
| Environmental and Resource Economics | 1 | 0.72% |
| Clean Technologies and Environmental Policy | 1 | 0.72% |
| International Journal of Life Cycle Assessment | 1 | 0.72% |
| Bioresource Technology | 1 | 0.72% |
| Journal of environmental management | 1 | 0.72% |
| Technology Analysis & Strategic Management | 1 | 0.72% |
| Construction Management and Economics | 1 | 0.72% |
| The Social Science Journal | 1 | 0.72% |
| Renewable Energy | 1 | 0.72% |
| Habitat International | 1 | 0.72% |
| Energy & Environment | 1 | 0.72% |
| Transportation Research Part D: Transport and Environment | 1 | 0.72% |
| Economic Modelling | 1 | 0.72% |
| Journal of Air Transport Management | 1 | 0.72% |
| KSCE Journal of Civil Engineering | 1 | 0.72% |
| Environmental Impact Assessment Review | 1 | 0.72% |
| Energy Systems | 1 | 0.72% |
| Total | 138 | 100.00% |
© 2018 by the authors. Licensee MDPI, Basel, Switzerland. This article is an open access article distributed under the terms and conditions of the Creative Commons Attribution (CC BY) license (http://creativecommons.org/licenses/by/4.0/).
Share and Cite
Mardani, A.; Streimikiene, D.; Balezentis, T.; Saman, M.Z.M.; Nor, K.M.; Khoshnava, S.M. Data Envelopment Analysis in Energy and Environmental Economics: An Overview of the State-of-the-Art and Recent Development Trends. Energies 2018, 11, 2002. https://doi.org/10.3390/en11082002
Mardani A, Streimikiene D, Balezentis T, Saman MZM, Nor KM, Khoshnava SM. Data Envelopment Analysis in Energy and Environmental Economics: An Overview of the State-of-the-Art and Recent Development Trends. Energies. 2018; 11(8):2002. https://doi.org/10.3390/en11082002
Chicago/Turabian StyleMardani, Abbas, Dalia Streimikiene, Tomas Balezentis, Muhamad Zameri Mat Saman, Khalil Md Nor, and Seyed Meysam Khoshnava. 2018. "Data Envelopment Analysis in Energy and Environmental Economics: An Overview of the State-of-the-Art and Recent Development Trends" Energies 11, no. 8: 2002. https://doi.org/10.3390/en11082002
APA StyleMardani, A., Streimikiene, D., Balezentis, T., Saman, M. Z. M., Nor, K. M., & Khoshnava, S. M. (2018). Data Envelopment Analysis in Energy and Environmental Economics: An Overview of the State-of-the-Art and Recent Development Trends. Energies, 11(8), 2002. https://doi.org/10.3390/en11082002