Article

Voltage Support Experimental Analysis of a Low-Voltage Ride-Through Strategy Applied to Grid-Connected Distributed Inverters

1
Department of Electronic Engineering, Technical University of Catalonia, 08800 Vilanova i la Geltrú, Spain
2
Department of Automatic Control, Technical University of Catalonia, 08800 Vilanova i la Geltrú, Spain
*
Author to whom correspondence should be addressed.
Energies 2018, 11(8), 1949; https://doi.org/10.3390/en11081949
Submission received: 3 April 2018 / Revised: 29 June 2018 / Accepted: 24 July 2018 / Published: 27 July 2018

Abstract

:
In recent decades, different control strategies have been designed for the increasing integration of distributed generation systems. These systems, most of them based on renewable energies, use electronic converters to exchange power with the grid. Capabilities such as low-voltage ride-through and reactive current injection have been experimentally explored and reported in many research papers with a single inverter; however, these capabilities have not been examined in depth in a scenario with multiple inverters connected to the grid. Only few simulation works that include certain methods of reactive power control to solve overvoltage issues in low voltage grids can be found in the literature. Therefore, the overall objective of the work presented in this paper is to provide an experimental analysis of a low-voltage ride-through strategy applied to distributed power generation systems to help support the grid during voltage sags. The amount of reactive power will depend on the capability of each inverter and the amount of generated active power. The obtained experimental results demonstrate that, depending on the configuration of distributed generation, diverse inverters could have different control strategies. In the same way, the discussion of these results shows that the present object of study is of great interest for future research.

1. Introduction

It is well known that electric power is fundamental for sustainable development because it is necessary for economic growth and because this same necessity stimulates new alternatives concerning renewable and clean energies [1]. The world’s leading countries in the development of less polluting energy solutions are favoring the growth and expansion of distributed power generation systems (DPGSs) based on renewable sources [2]. Therefore, considering the wide-scale penetration of these systems in the distributed grid, power system operators have focused their attention on the challenge of maintaining reliability and stability of the electrical network by implementing and updating rigorous grid codes (GCs). These GCs are intended to limit the disconnection of these DPGSs under grid faults as much as possible and avoid loss of power generation that could yield to power outages [3,4,5,6].
Grid fault conditions can generate short-duration voltage variations—a decrease in rms voltages, typically between 0.1 p.u. and 0.9 p.u., for a period of 0.5 cycles to 1 min—one of the primary power quality concern for process industries [7,8]. Consequently, during grid faults, GCs demand that the distributed generation (DG) systems remain connected to the grid, support the voltage recovery, and resume the active power feed-in after the fault clearance [9,10,11]. As a result of the increasing renewable power penetration level and the considerations mentioned above, latest GCs and power grid operators require low-voltage ride-through (LVRT) capability. This requirement means that DPGSs above a specific power range should stay connected during grid faults according to the corresponding time–voltage curve. This function shows the voltage disturbance area at the grid connection point that must be withstood by the facility. A capability that must not only be verified, but also certificated [12,13].
During the last years, numerous studies and investigations on different fault ride-through (FRT) control strategies for grid-connected inverters have been published in the literature, all intended to improve the behavior of the inverter during grid faults [14,15,16,17,18,19,20,21,22,23,24,25,26,27]. However, most of these strategies were presented for a single inverter connected to the grid. Nevertheless, some works address the issue of the operation of multiple inverter-based renewable distributed generators [28,29,30,31,32,33,34]. In the literature [28], the coordinated operation between a wind farm and a static synchronous compensator (STATCOM) in a power network is studied. This work also refers to an improved system that could use the inverter capability of a solar farm as a STATCOM device at night. However, despite making a good approximation and presenting an interesting proposal, the solution is not widely developed and no experimental results are presented. A control scheme of allocation of reactive power to maximize resource sharing of grid-connected inverters is proposed in the literature [29]. The studied power network considers several grid-connected inverters, but its topology includes both a point of common coupling (PCC) connected to the utility grid or a co-gen plant generator and a communication scheme that makes this control scheme appropriate for smart grids and microgrids. This work also presents only simulation results.
The contributions made in the works of [30,31,32] are based on the study of a real photovoltaic (PV) low-voltage (LV) grid located in Brædstrup, a village in the region of Østjylland, Denmark [35]. These papers formulate the application of reactive power control as an optimization problem to mitigate the overvoltage problem existing in LV grids with high penetration of PV technologies. In [31] a comparative analysis of five reactive power compensation techniques in these networks has also been presented. These works consider communication schemes and present simulation results.
In the literature [33], a control strategy of automatic mode transition for multiple inverters is proposed. When the grid is available, the inverters operate in current-control mode by injecting power into the network. When a grid failure occurs, all inverters automatically switch to the drop-control mode to achieve proportional power sharing and return to the current-control mode when network availability is restored. Nevertheless, the system under consideration—with a typical microgrid configuration—consists of two single-phase inverters, local loads, a bidirectional static transfer switch, and a synchronization switch. A hardware and software description of a real laboratory setup composed of four nodes is done in the literature [34]. This experimental network can emulate the two main scenarios of a dispersed generation network: (1) distributed generation sources connected to the grid and (2) microgrids in islanded mode. However, only in the first of the three tests, the four nodes work as network-feeding converters without additional comparisons with other profiles of generated power. Finally, a complete work of comparing sophisticated but complex control schemes is carried out in the literature [36]; nonetheless, the study for a grid-connected industrial microgrid with two PV generators is only validated with MATLAB simulations.
Considering this topic not only attractive but also absent in the literature, as far as authors’ knowledge refers, this paper intends to make a first experimental approach to the injection of power by several DG systems connected to the grid (multiple inverters) when voltage sags occur. Consequently, a specific experimental platform with different combinations of impedance is used to analyze how a conventional current generator acts. This analysis will highlight the advantages and disadvantages of these injection procedures. Unlike the work of [37], the inverters do not make up a microgrid in this study.
The research objectives of this study, which are different from the control objectives of the strategies that can be implemented in the controllers, are grouped or summarized basically into two primary goals:
  • To extend, in a scenario of multiple grid-connected inverters, the use or application of LVRT control strategy [25], whose voltage support capability has not been tested when voltage sags occur.
  • To carry out an analysis of the experimental results of the power injection profiles (PIPs) as a function of the generated power (PG) and the equivalent impedance seen from the output side of each converter.
This paper has been structured as follows. Section 2 describes the operation of multiple grid-connected inverters under voltage sags. The problem statement is presented in Section 3. The experimental results and a concise discussion on the behavior of the studied parameters are shown in Section 4. Finally, Section 5 presents the conclusions of the paper and briefly describes the research guidelines for future works.

2. Multiple Grid-Connected Inverters under Voltage Sags

This section deals with the description and characterization of the experimental distributed generation network connected to the grid under voltage sags. Also, the primary GC requirements during these disturbances are described.

2.1. Experimental Network Configuration

Figure 1 shows the implemented experimental network. A three-phase distributed generation network composed of four voltage-sourced inverters (VSIs) and one programmable AC power source, which emulates the utility grid, has been implemented in the power network laboratory (PNL). Details on the design and implementation of the experimental test bench can be found in the literature [34]. Each generation node (DPGS) is composed of a three-phase inverter with an output LC filter connected to the network through a wye-delta transformer. A DC power source feeds each inverter. The value of PG is one of the inputs of each controller that will help determine the amount of injected power. The control block is responsible for driving the inverter switches to deliver power into the grid, giving priority to the active power according to the control algorithm of the strategy under test, but also to inject reactive power when necessary. The local voltages (v1 to v4) and the inverter currents (i1 to i4) are measured instantaneously to accomplish this task.
The blocks Z1–2, Z2–3, and Z3–4 model the impedances of the lines connecting the distributed/dispersed nodes and the grid. The wye-delta transformer introduces the equivalent LCL output inductance LT, as well as some parasitic resistance (see Table 1). The equivalent impedance of the transformer is used in the testbed to emulate lines with non-negligible resistive components.
As the equivalent impedance seen by each VSI is of particular interest, these data are shown in Table 2.
The equivalent impedance seen from the output side of each generator has been calculated by appropriately adding the impedance of lines, transformers, and loads.

2.2. Voltage Sag Characterization

The interaction between the power inverter and the network under balanced and unbalanced faults is a critical issue. However, the normal operation of the grid-connected inverters can be severely affected when unbalanced grid failures occur, because these faults generate negative-sequence voltages in the network [38,39]. The study of these voltage disturbances shows that the occurrence percentage of balanced faults (symmetrical three-phase faults) is very low, close to 3–2% [40].
The method of symmetrical components permits to extend the per phase analysis to systems with unbalanced loads or faults and provides a practical tool for understanding the operation of a three-phase system during unbalanced conditions [41,42,43,44,45,46,47]. However, as stated in the work of [39], “the interaction of the symmetrical components produces active and reactive power oscillations ( and ) at the output of the converter, which should be carefully controlled”.
During voltage sags, the instantaneous phase voltages (v1 to v4) at the output of each node (DPGS) can be described as the sum of their positive- and negative-symmetric sequences [38]. Applying Clarke’s transformation, these local voltages are expressed in the stationary reference frame (SRF) as
v α = v α + + v α = V + cos ( ω   t + ϕ + ) + V cos ( ω   t + ϕ )  
v β = v β + + v β = V + sin ( ω   t + ϕ + ) V sin ( ω   t + ϕ )  
where vα and vβ are the instantaneous voltages expressed in the SRF, vα+ and vβ+ are the positive-sequence voltages, vα and vβ are the negative ones, and ω is the grid angular frequency. V+ and V are the amplitudes of the positive- and negative-sequence voltages, respectively,
V + = ( v α + ) 2 + ( v β + ) 2  
V = ( v α ) 2 + ( v β ) 2  
and ϕ is the angle between the positive and negative sequences.
ϕ = ϕ + ϕ = cos 1 ( ( v α + v α ) ( v β +   v β ) V +   V )  
Therefore, any voltage sag can be characterized by Equations (3)–(5).
Similarly, with the values of the voltage sequence amplitudes (V+ and V), the effective voltage (Ve) can be calculated as indicated in the IEEE Std 1459™-2010 [48]:
V e = ( V + ) 2 + ( V ) 2  
This collective value concept, introduced by Buchholz to represent the voltages and currents collectively in a multiphase system [49], will be used to compare the voltage support responses obtained in the experimental results.

2.3. Requirements under Voltage Sags

In the absence of grid failures, each DPGS delivers its PG into the grid while maintaining amplitude control of the injected currents. During voltage disturbances, GCs require additional services to maintain the integrity of the grid and increase its reliability. As a rule, under grid disturbances, wind GCs primarily require LVRT and RCI capabilities. Other GCs also require both active and reactive power injection to simultaneously feed and support the grid [10,11]. GCs for PV systems only require active power injection, although reactive power injection is a mandatory capability in some countries [50].

3. Problem Statement

This section presents the description of the problem that includes the concept of voltage support, a comparative analysis of different control strategies for generating reference currents in grid-connected converters, the formulation of the problem, and a brief explanation of the chosen control scheme.

3.1. Voltage Support Concept

The experiments carried out in this study take into account the complex impedance [51] of the lines. This fact allows addressing the voltage support concept, whose primary objective is to regulate the phase voltages within the limits established in GCs for continuous operation [18]. In this work, these voltages are not regulated, but experimental data are obtained to analyze the changes in local voltages due to the injected currents. As a result of the voltage support capability of each DPGS, the amplitudes of the positive- and negative-sequence voltages for each node, Vi+ and Vi (for i = 1 to 4), can be expressed as a function of the equivalent grid voltage, the equivalent grid impedance (Zeqi), and the injected current amplitudes as [52]
V i + = R e q i I p i + + ω L e q i I q i + + ( V g i + ) 2 ( ω L e q i I p i + R e q i I q i + ) 2  
V i = R e q i I p i ω L e q i I q i + ( V g i ) 2 ( ω L e q i I p i + R e q i I q i ) 2  
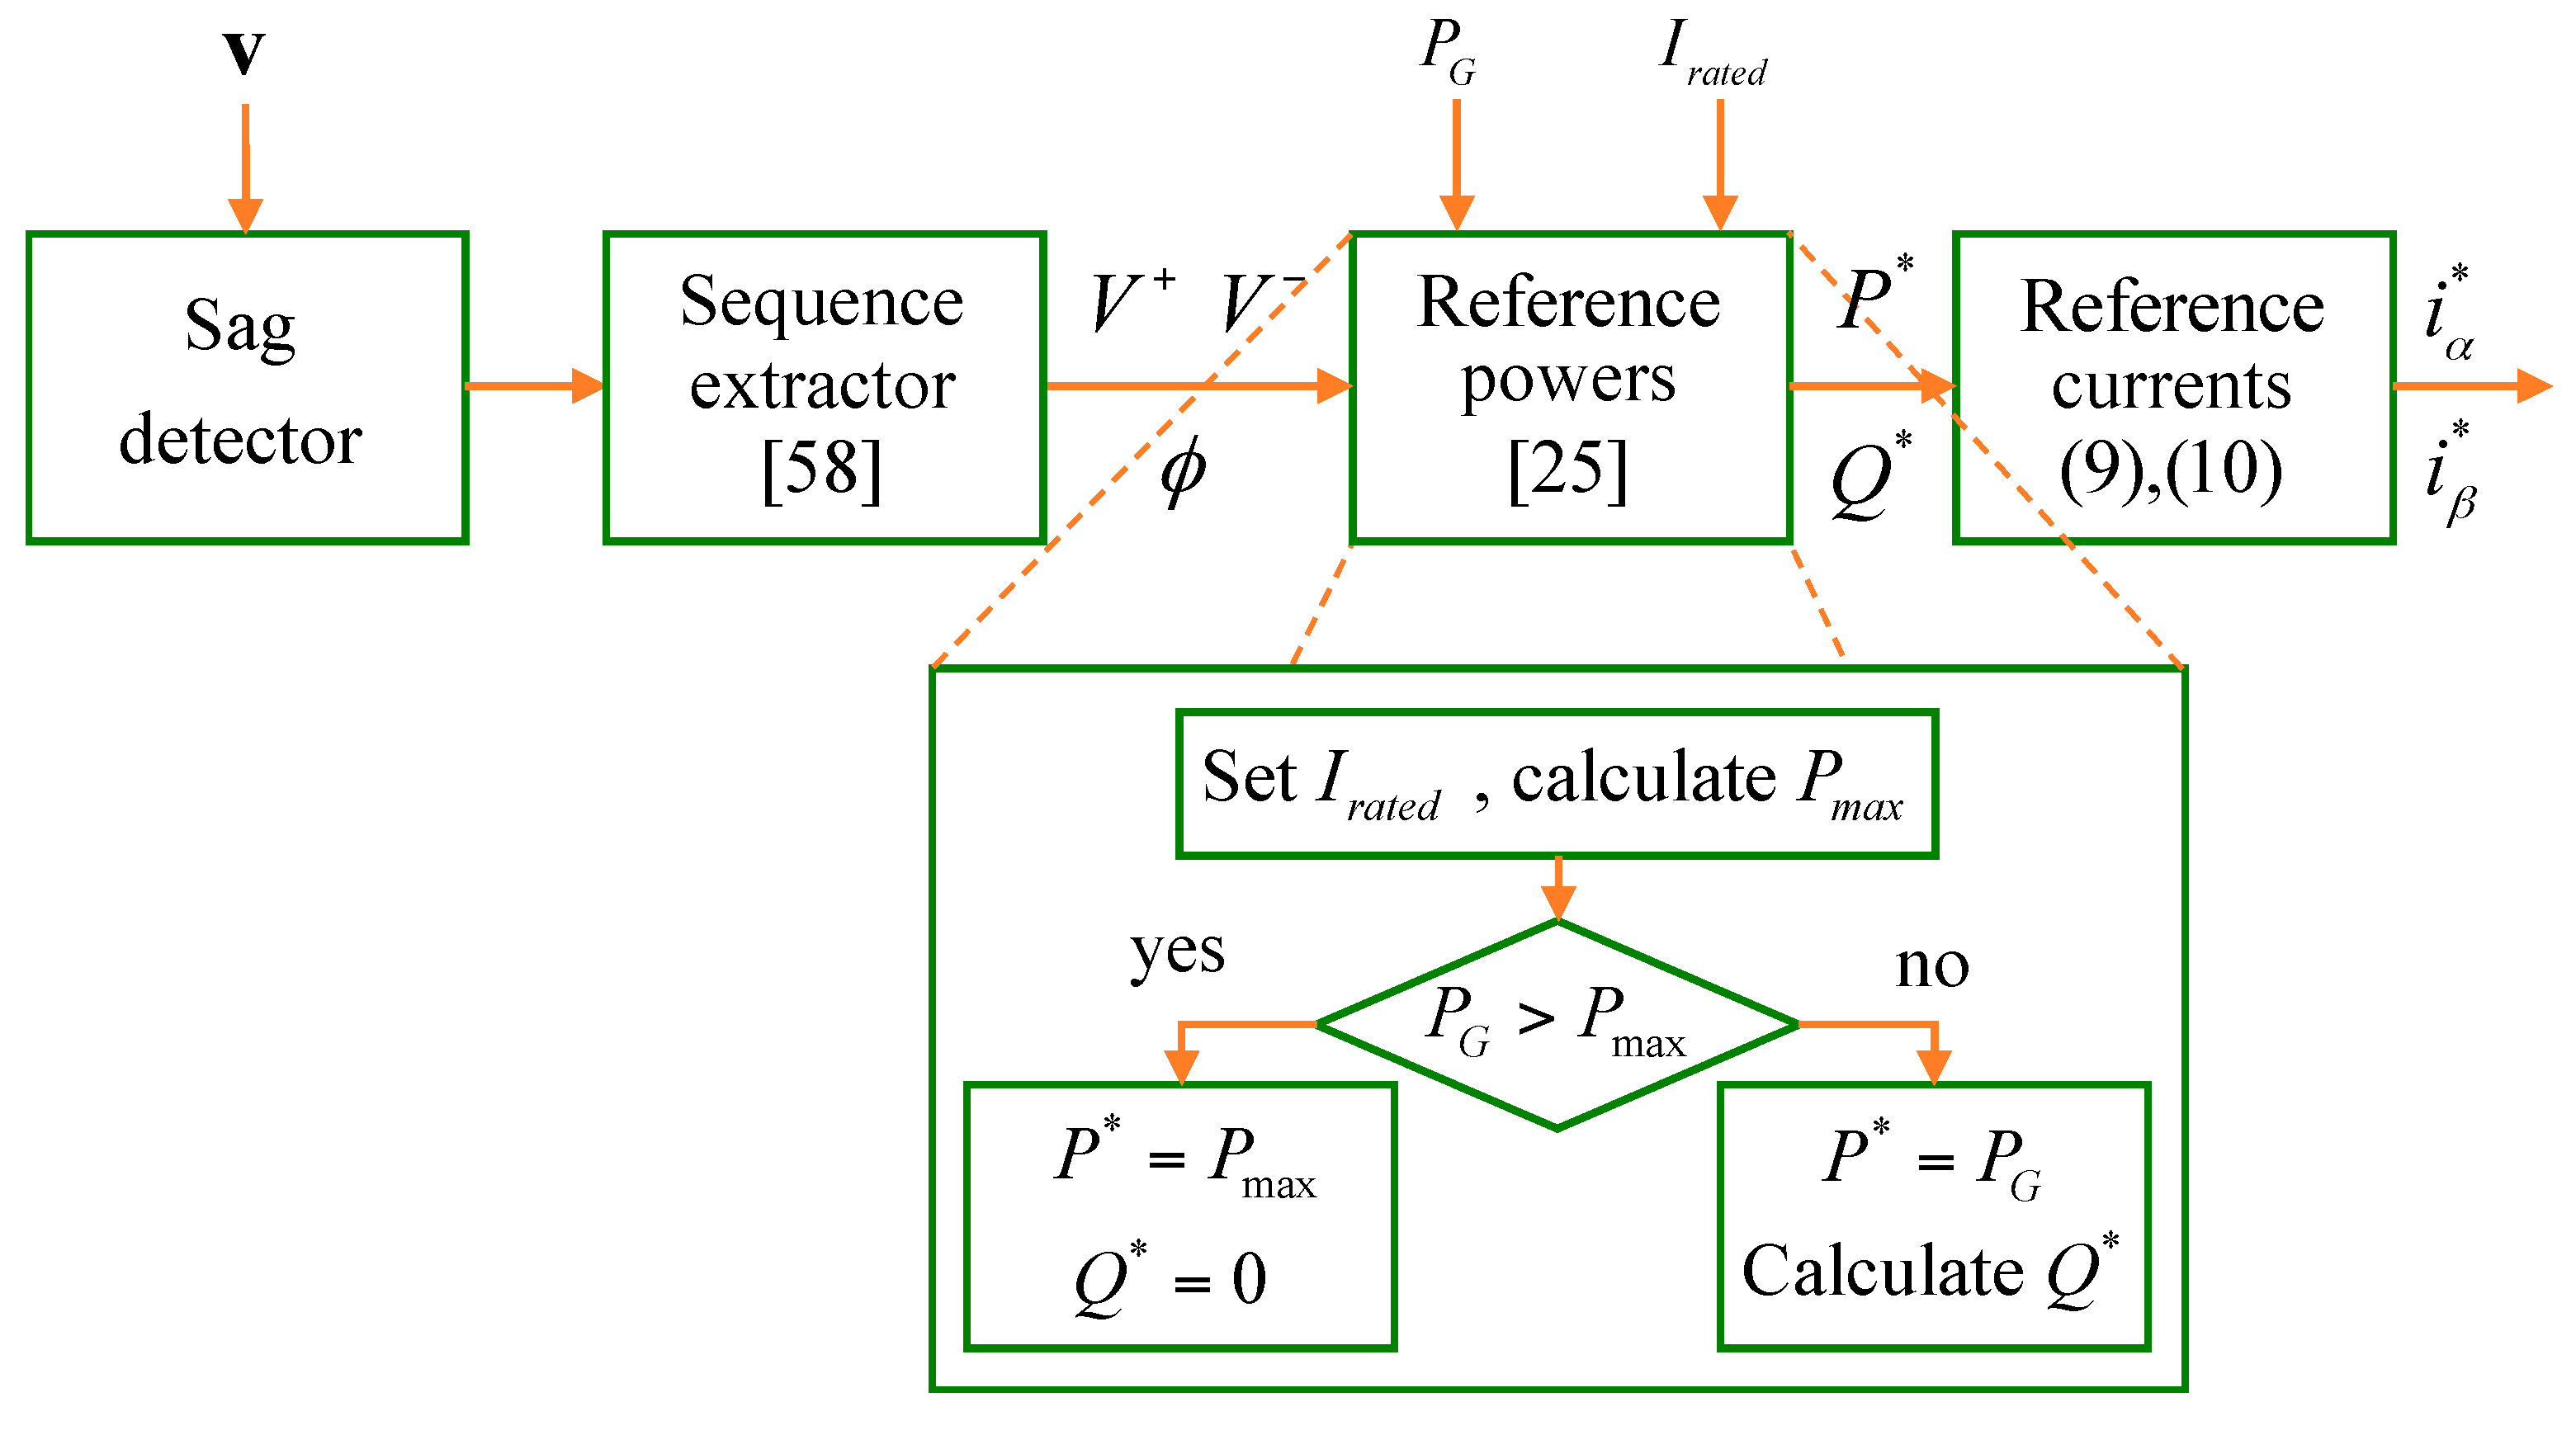
where Ipi+, Ipi, Iqi+, and Iqi are the current amplitudes associated with the active and reactive powers and Vgi+ and Vgi are the amplitudes of the positive- and negative-sequence voltages at the grid side, respectively. Notice that Vg is not available in a practical application. Indeed, Vg is never used in the control algorithm (see Figure 2). Each local voltage vector vi is sensed at the output of its corresponding inverter and, therefore, these are the voltages used in the control algorithm.
In both Equations (7) and (8), the second term inside the radical is negligible; therefore, each square root becomes Vgi+ and Vgi, respectively. As shown in Equation (7), the amplitudes of the positive-sequence currents (Ipi+ and Iqi+) increase the amplitude of the positive-sequence voltage (Vi+). Now, it can be seen from Equation (8) that the product Reqi Ipi must be negative to reduce the amplitude of the negative-sequence voltage (Vi). From these two equations, it can be said that the voltage support solution is related to the different amplitudes of injected currents, but it is closely linked to the equivalent grid impedance.
When analyzing the voltage support effects, thanks to the use of symmetric sequences, the inverters can be viewed as current sources [53] that inject active and reactive currents into the grid via positive and negative sequences.

3.2. Comparison of the Principal Strategies for Generating Reference Currents in Grid-Connected Inverters

Different strategies and methods for generating the controller reference currents of a DG system—to deliver into the network active and reactive powers (P and Q), under unbalanced grid voltage conditions—can be found in the literature [19,39,54].
In this section, an injection method to implement a multi-inverter system with voltage support performances is chosen. The analysis that is carried out in this section compares different control strategies to identify their advantages and disadvantages. Active power oscillations, which can cause system malfunction; total harmonic distortion (THD), which can affect the energy quality generated by the inverter; and maximum current (Imax), which could be higher than the inverter rated current (Irated) [19], are fundamental aspects to consider.
Based on the works of [54], the fundamental control strategies used to generate reference currents and their characteristics are summarized in Table 3, in which it is possible to see which have a better performance.
It can be seen from the data in Table 3 that only few control strategies, IARC [39], ZSCC [56], and FBSS [16,25,57], avoid active power oscillations during voltage sags, which is especially important in PV applications. The set of reference currents used by the authors of [25] is based on the work of [16], a voltage support strategy that introduces the so-called “flexible balance of symmetric sequences (FBSS)”. Therefore, different control objectives will be achieved by tuning the control parameters to balance the positive- and negative-sequence voltages. One of those objectives is the cancellation of active power oscillations (), as these oscillations negatively affect the dc-link voltage and can provoke an inverter malfunction.
Regarding the reduction of the maximum current, BPSC [39,55], AARC [39], FPNSC [39], FBSS [16,25,57], and VSS [52,53] have the best performances, while ZSCC [56] is the least favorable. As for the harmonic distortion, the worst case is found in IARC [39], followed by ICPS [55]. The other strategies have low THD. In terms of the control complexity, it is also important to note that BPSC [39,55] and FBSS [16,25,57] are less complex than the others.

3.3. Problem Formulation

A certain impedance must be considered between the inverter connection point and the utility grid to test the voltage support capability. When providing voltage support to the grid during voltage sags, changes in the local voltage (vi) due to the injected current (ii) must be estimated. All the currents (i1 to i4) injected into the network will produce effects on the inverter output voltages (v1 to v4) due to the equivalent grid impedance Zeqi [52].
Mainly, the control strategy [25] has been chosen to evaluate its effect on voltage support and because it has the following characteristics:
  • Capability to deliver both P and Q into the grid.
  • Current injection by positive and negative sequences (Ip+, Iq+, Ip and Iq).
  • Low THD.
  • Maximum current limitation.
  • Mitigation of active power oscillations.
  • Reduced complexity (control algorithm with a set of reduced instructions).
This control strategy has not been studied for voltage support and it was validated only for current injection considering a single inverter. As a contribution, the voltage support effects in the case of multi-inverter systems are analyzed in this work.

3.4. Control Scheme

The general procedure of this control strategy is depicted in Figure 2. Firstly, the voltage sag is detected. Secondly, the positive- and negative-voltage sequences (vα+, vβ+ and vα, vβ) are obtained from the sequence extractor [58], and then the amplitudes (V+, V) are calculated by Equations (3) and (4). Afterwards, the power references (P*, Q*) are calculated based on the sag characteristics (V+, V and ϕ), the generated power (PG), and the rated current (Irated).
Note that the block of reference powers comprises the control algorithm. The maximum allowable active power (Pmax) is always calculated and compared with PG to protect the inverter. If PG is higher than Pmax, the controller applies an active power curtailment (APC) and sets P* = Pmax. During voltage sags, the control algorithm works in the same way and gives priority to the delivery of active power, but now each inverter is forced to inject Irated because of the fault conditions. If PG is less than Pmax, then Irated is not exceeded and, therefore, a determined amount of reactive power must be injected to reach Imax. Finally, the current references (iα*, iβ*) are computed.
The objective of this strategy is to inject the rated current of the inverter and avoid oscillations of the active power when a voltage sag occurs. For this purpose, the control algorithm meets five conditions:
  • To prioritize injection of active power.
  • To inject the rated current.
  • To apply APC when PG > Pmax.
  • To inject reactive power into the grid when PG < Pmax to reach Irated.
  • To avoid active power oscillations ( = 0).
Therefore, the reference currents can be written as
i α = 2 3 ( v α + v α ( V + ) 2 ( V ) 2 P + v β + + v β ( V + ) 2 + ( V ) 2 Q )  
i β = 2 3 ( v β + v β ( V + ) 2 ( V ) 2 P v α + + v α ( V + ) 2 + ( V ) 2 Q )  
and can be expressed as [59]
i α = I p + ( v α + V + ) I p ( v α V ) + I q + ( v β + V + ) + I q ( v β V )  
i β = I p + ( v β + V + ) I p ( v β V ) I q + ( v α + V + ) I q ( v α V )  
where the current amplitudes (Ip+, Ip, Iq+ and Iq) are formulated based on the following relations:
I p + = 2 3 V + ( V + ) 2 ( V ) 2 P , I p = 2 3 V ( V + ) 2 ( V ) 2 P  
I q + = 2 3 V + ( V + ) 2 + ( V ) 2 Q , I q = 2 3 V ( V + ) 2 + ( V ) 2 Q  
Details on the derivation of the reference powers (P* and Q*) can be found in the literature [25].

4. Experimental Results

Only the injection of P and Q into the grid was evaluated in the literature [25], but the effect that its control algorithm has on the voltage support was not considered. Hence, this effect on local voltages during a voltage sag will be the major focus of the present study, but in a more complex scenario of multiple grid-connected inverters. To this end, five experiments were performed using an experimental prototype (at the PNL) that emulates the operation of multiple renewable distributed generators based on inverters. Table 4 shows the values of the system parameter.
Different profiles of power injection have been tested—according to the power generated by each DPGS—using the concept of the network topology presented in Figure 1. All values of generated power (PG), reference active power (P*), and reference reactive power (Q*), are consolidated in Table 5.

4.1. Operation of Multiple Grid-Connected Inverters

A balanced profile of power injection has been chosen to explain the experimental results obtained regarding the operation of multiple grid-connected inverters. In this profile, all the DPGSs have the same generated power (PGi = 325.0 W), and almost identical values of Q* are obtained. Under these circumstances, it is possible to see the effect of the equivalent impedance on the voltage support capability at each node. Later it will be verified for this case that P* = PG.
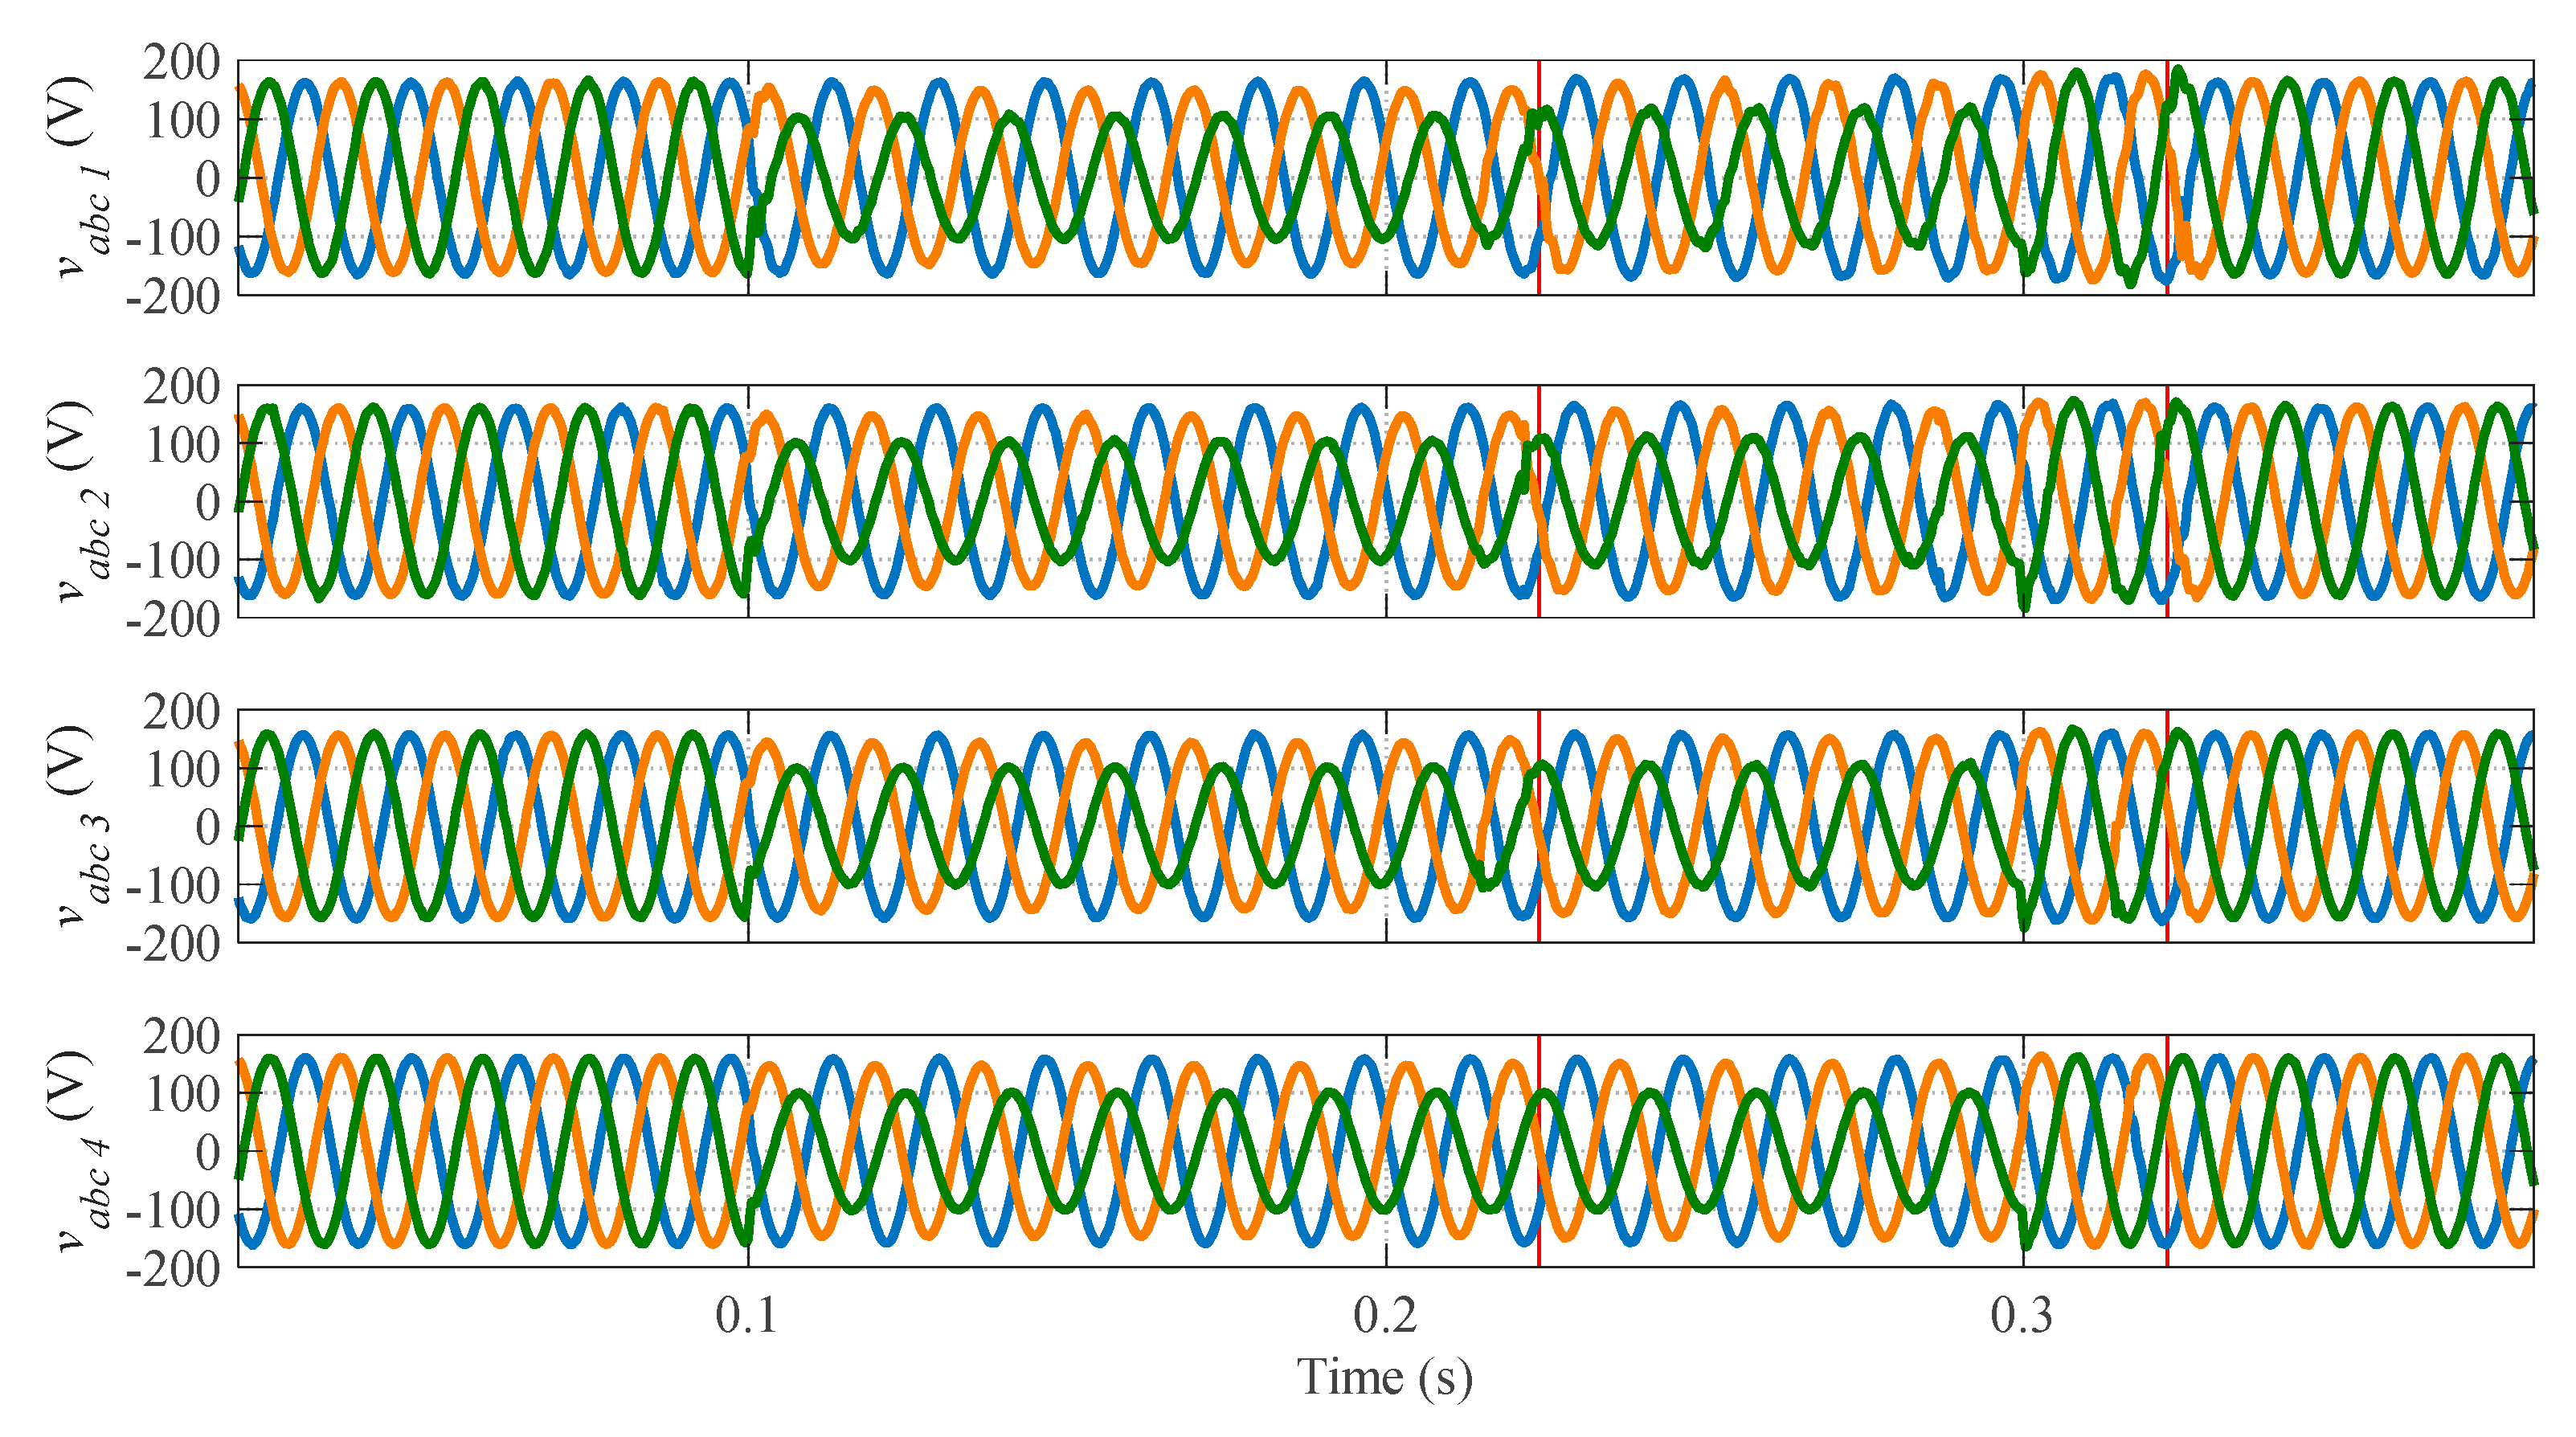
Figure 3 shows the phase voltages of each DPGS, in which a 0.19-s voltage sag can be observed. A voltage sag threshold of 90% of the declared voltage [60] has been specified to detect the start and end of the sag. At t = 0.10 s, the fault occurs but the control algorithm, together with the current limitation algorithm, is not yet enabled. At this time, the set of positive- and negative-sequence reference active currents focuses on maintaining the pre-fault power delivery. At t = 0.22 s, the control, together with the current limitation algorithm, is activated to appreciate its control action. The voltage recovers the pre-fault conditions from the instant t = 0.32 s, once the fault is cleared. The continuous red vertical lines enclose the region where the control is activated.
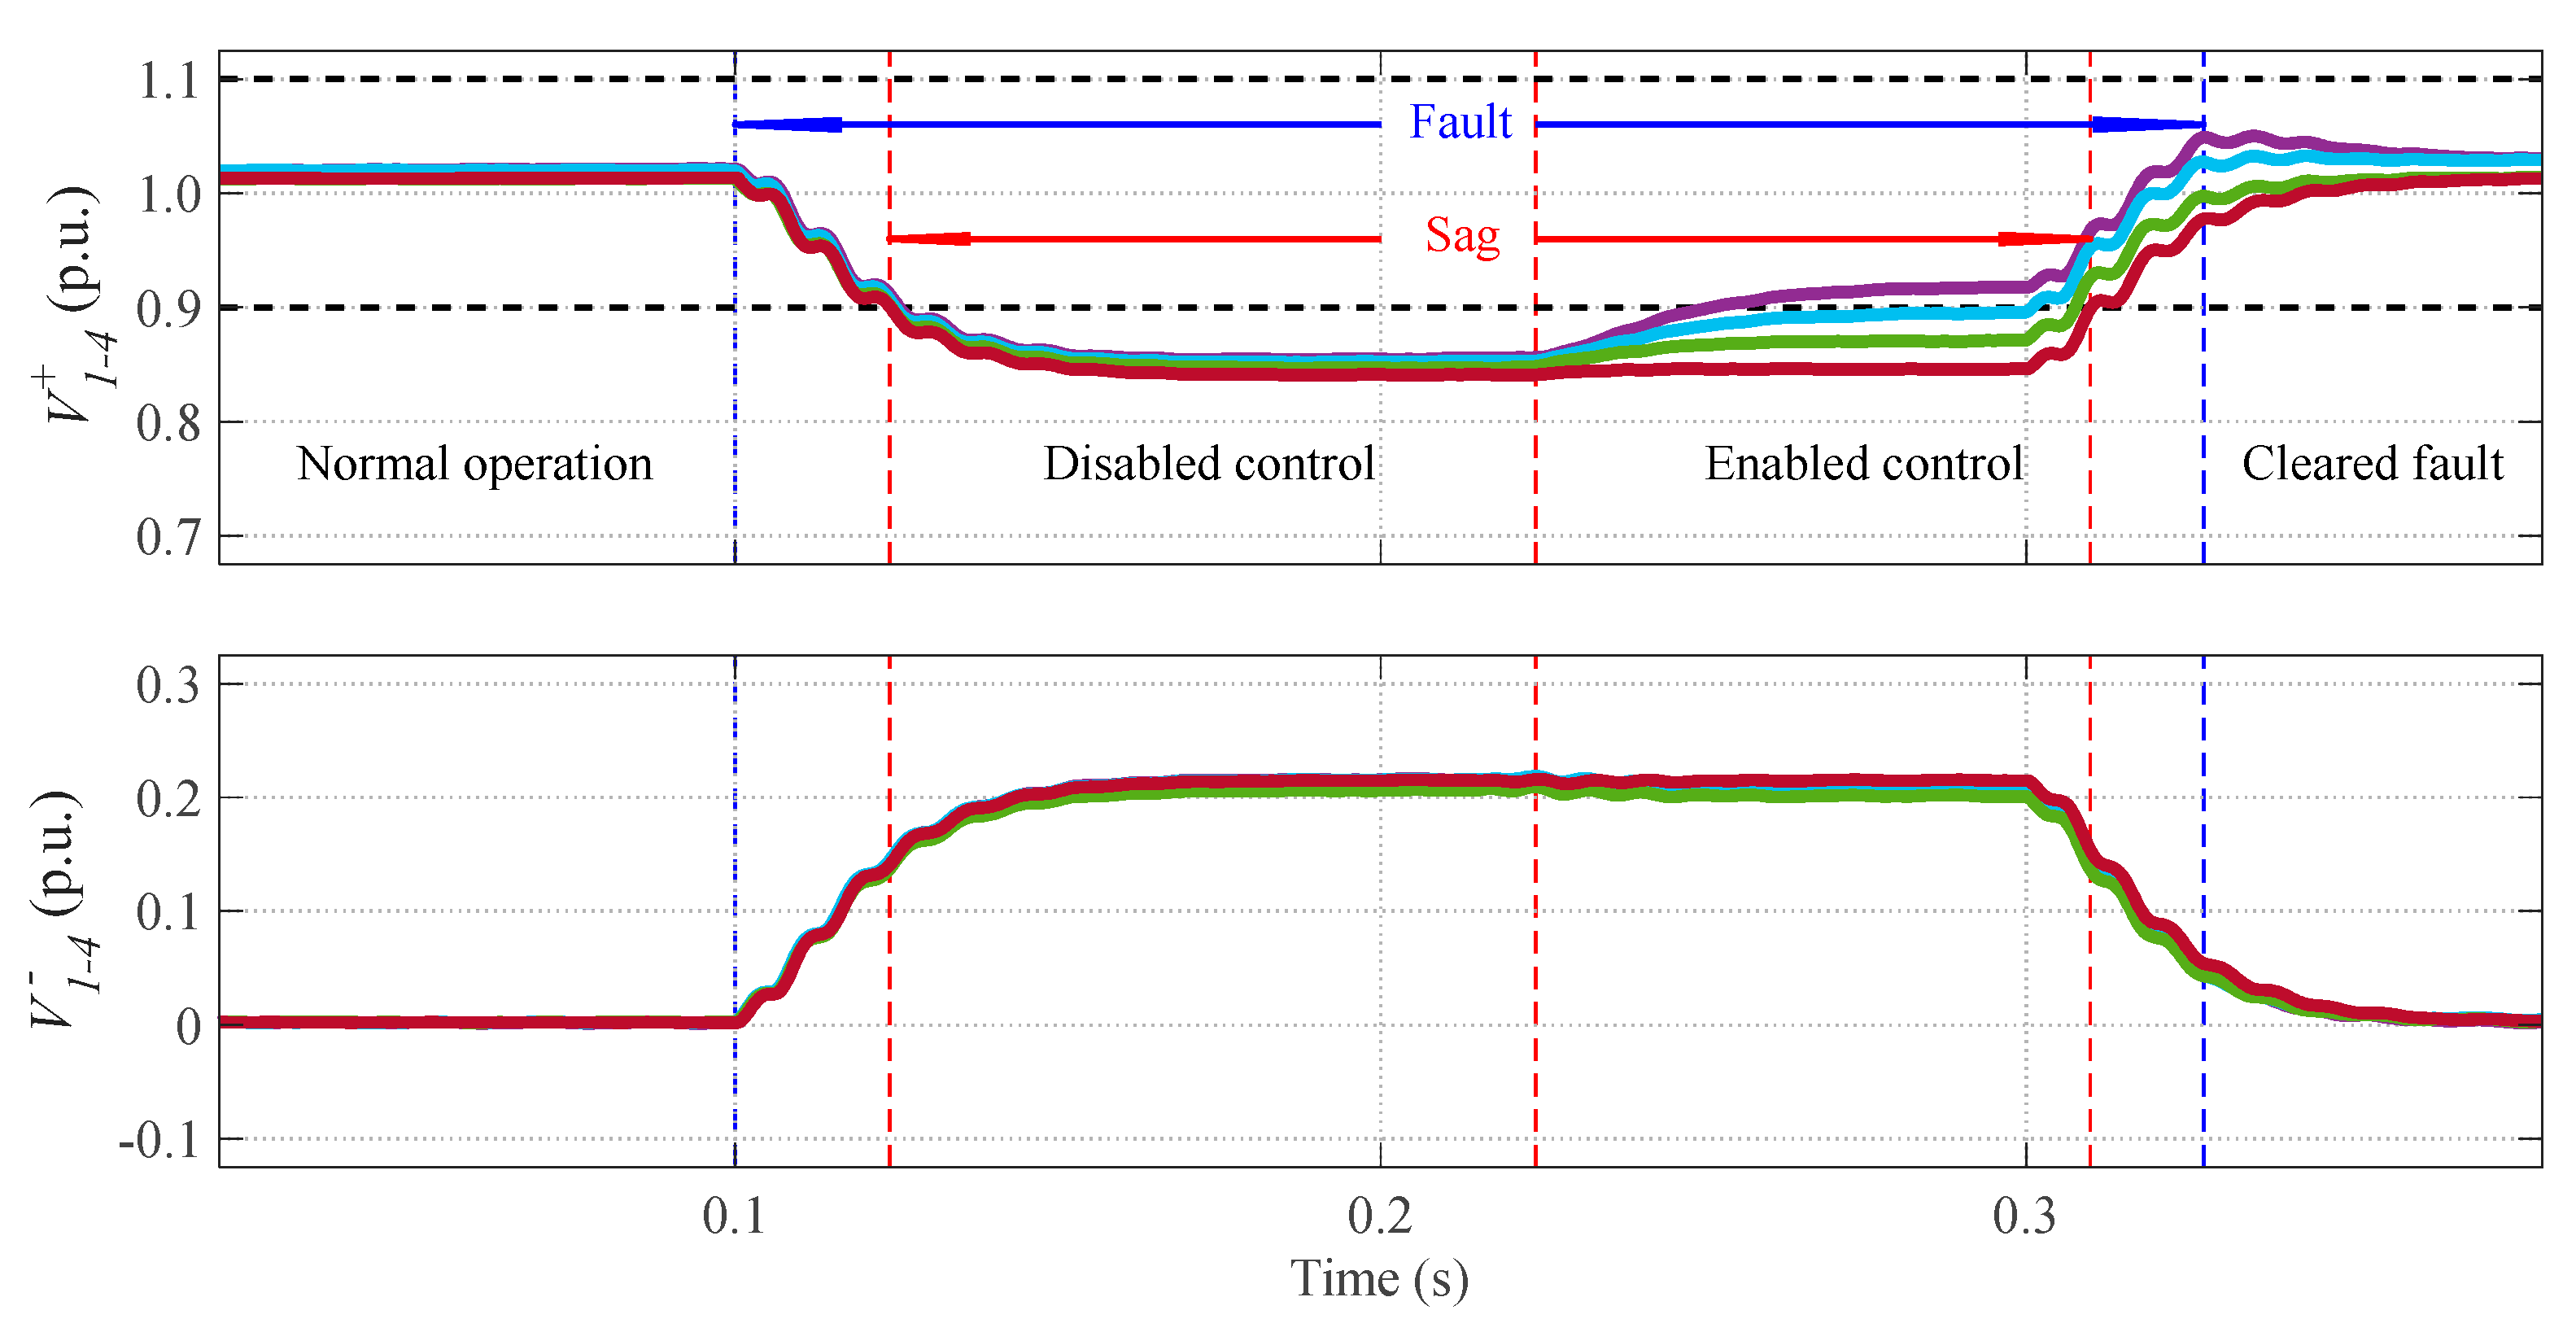
Although the voltage sag and the phase voltage unbalance can be seen in Figure 3, the control action is easier to observe in Figure 4, in which the voltage sequence amplitudes are presented. The upper subfigure reveals that there has been a marked increase in the positive-sequence voltage amplitudes. However, the lower subfigure shows that the negative-sequence voltage amplitudes have hardly changed as a result of the amounts of Iqi that are injected.
The characteristics of the fault are also clearly indicated. The dashed blue vertical lines show the duration of the failure (0.10 < t < 0.32 s), while the red lines delimit only the voltage sag below the specified threshold and denote the sector where the control algorithm is enabled. The dashed black horizontal lines indicate the upper and lower voltage thresholds.
Figure 5 shows the behavior of the current amplitudes (Ip+, Ip, Iq+ and Iq). In normal operation, and after the fault is cleared, each DPGS only injects active power via positive sequence (Ip+). During the first half of the voltage sag, only active power is injected through both sequences (Ip+ and Ip). The reactive current injection (RCI) is enabled from the instant t = 0.22 s. Note that the four components (Ip+, Ip, Iq+ and Iq) are only injected when the control is enabled.
Figure 6 shows how the experimental phase currents increase thanks to the control action, but without exceeding the nominal value. The black dashed lines represent the maximum current that can be injected by each DPGS. When the control is enabled during the voltage sag, ic = Irated (5 A). Note that Imax is reached in the most dropped phase (see vc in Figure 3).
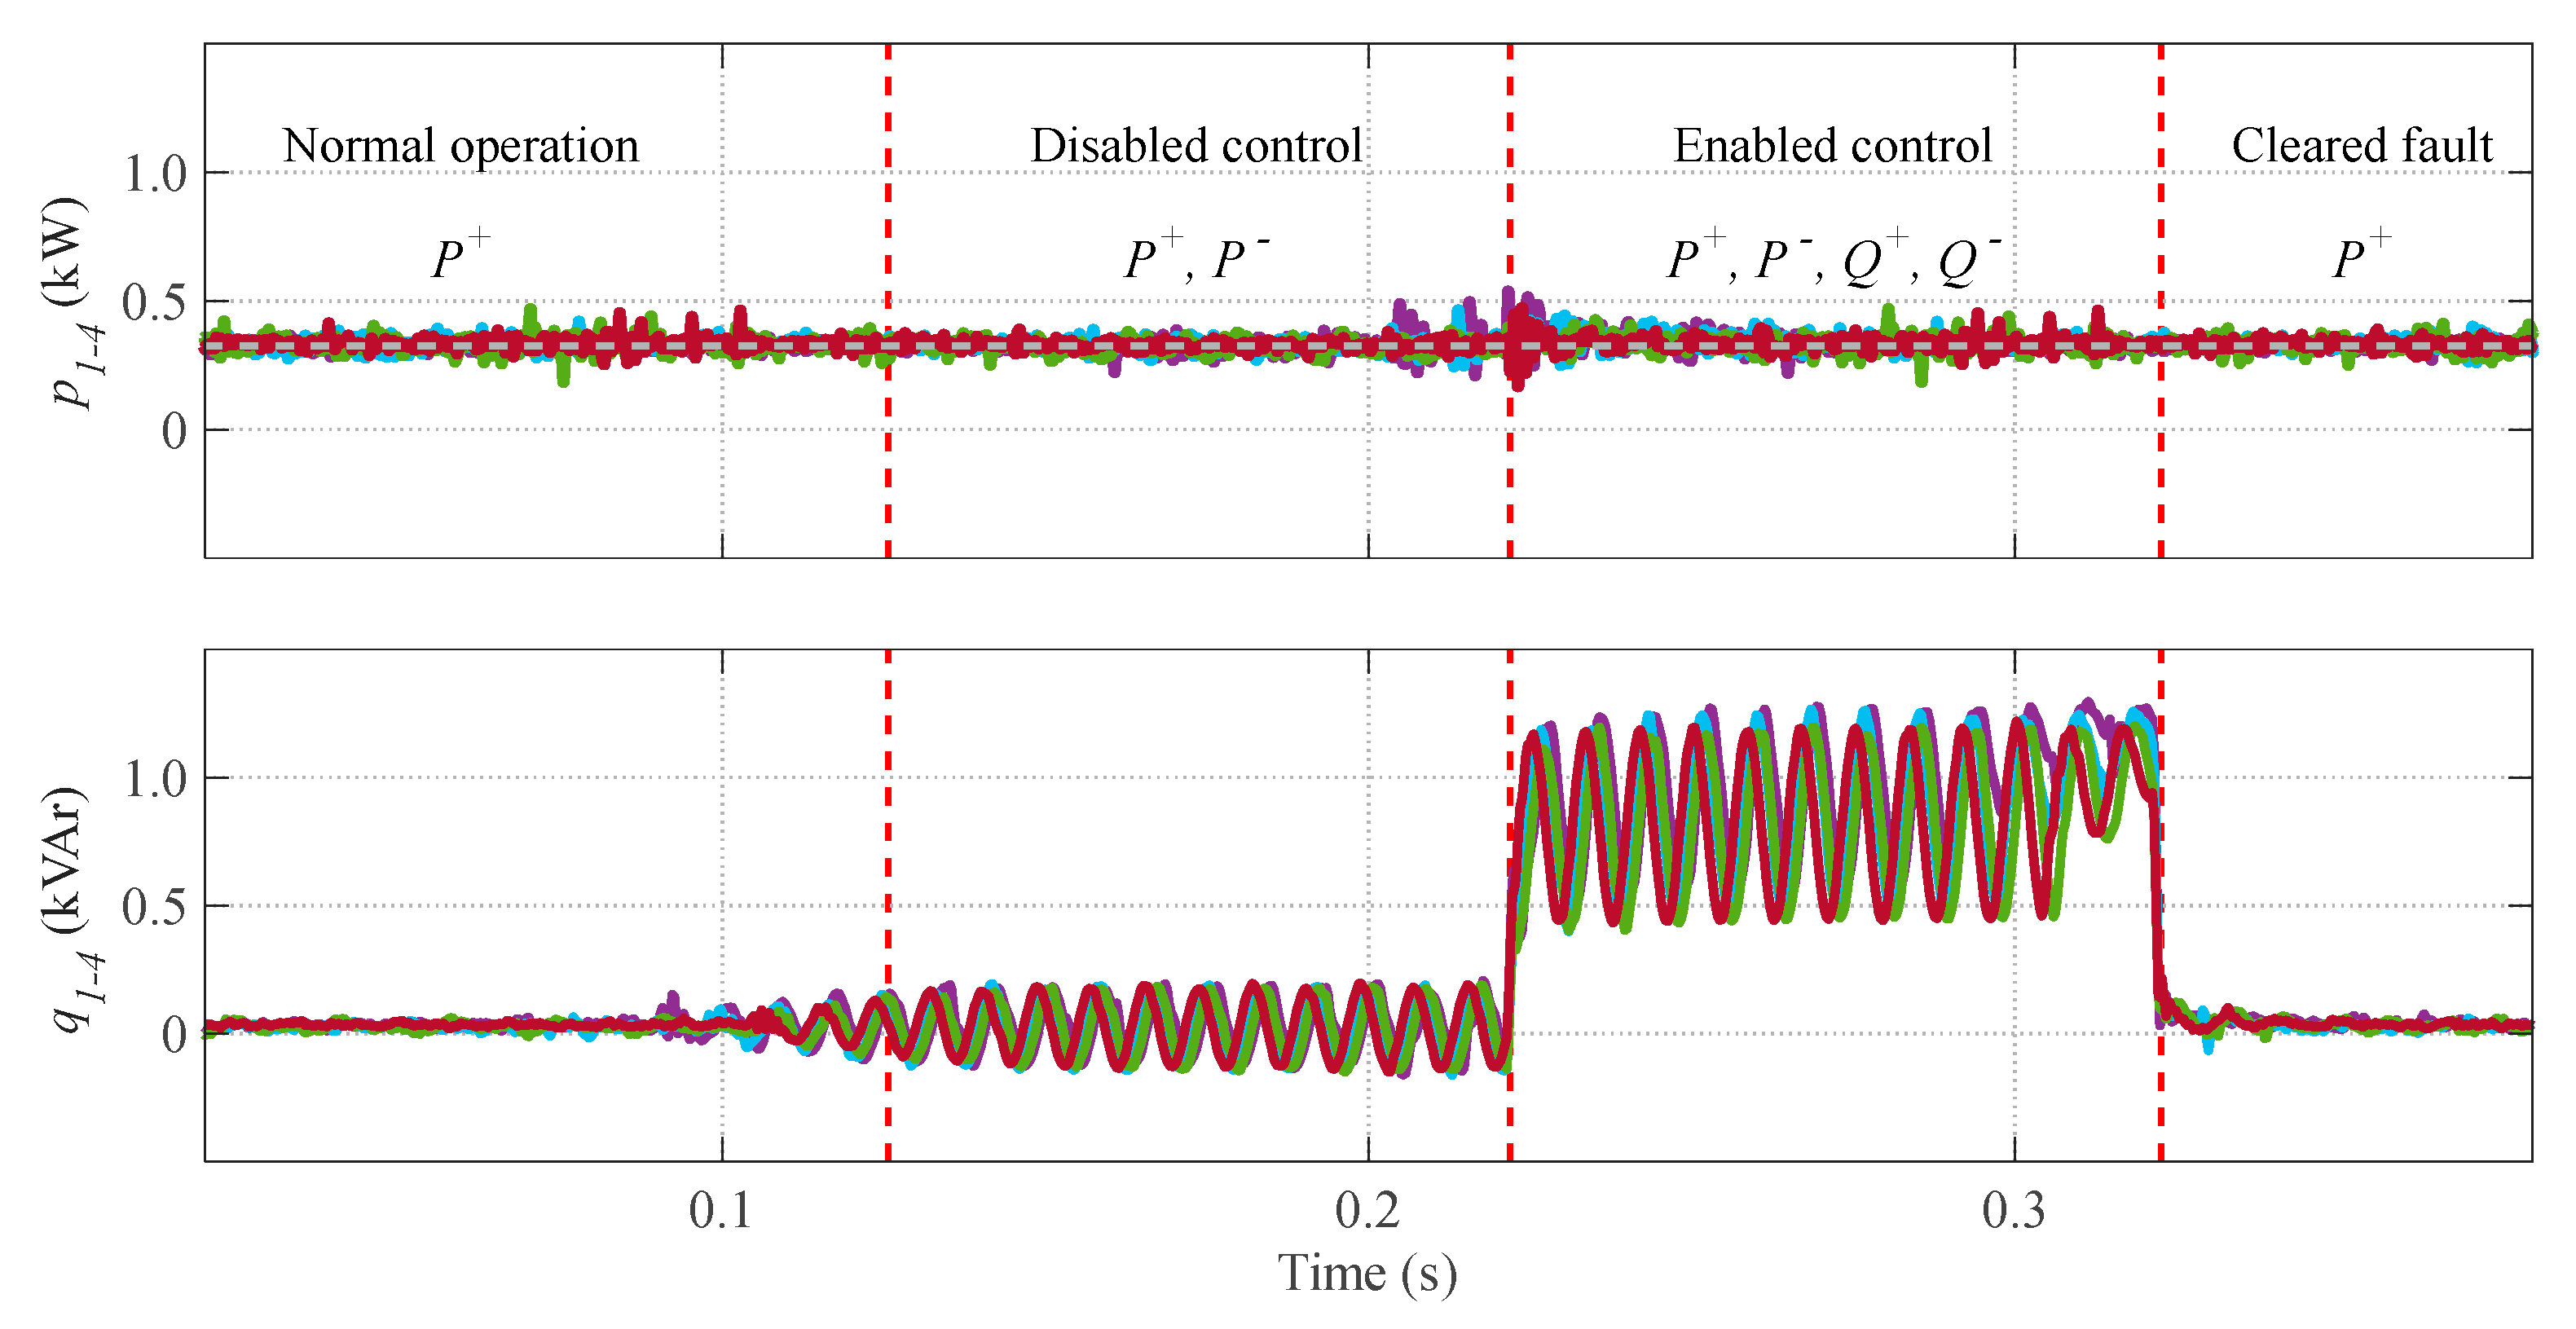
Figure 7 displays the power delivered to the network by each DPGS. In the top subfigure, it can be seen that the instantaneous active power (p) is free of oscillations. The opposite occurs with the instantaneous reactive power (q) that exhibits oscillations at twice the network frequency, as seen in the lower subfigure.
This profile corresponds to a low-power production scenario in which P* = PG. The DPGSs inject the same amount of active power, but there are small differences between the amounts of reactive power they inject into the network. Although the voltage sag programmed as the fault in the three-phase Pacific AMX-360 AC source has a constant profile, each node sees a slightly different voltage sag as a result of its propagation. Consequently, the calculation of Q* at each node varies according to the measurement of the voltage sag characteristics (V+, V and ϕ).

4.2. Experimental Analysis of the Voltage Support Capability

The five power injection profiles listed in Table 5 are analyzed concerning the variations of the collective rms value of the grid voltage at each DPGS. The equivalent impedance plays an essential role in this evaluation because its effect is amplified when the control algorithm is activated during the grid failure.
The experimental results of each test are presented in two subfigures. The effective voltages are shown in the left subfigure. The dashed red vertical lines delimit the zone where the control is enabled, and the dashed black horizontal line indicates the voltage sag threshold of 90% of the declared voltage. The bar graph gives information on the voltage variation at each node during the voltage sag; the light-colored left bar represents Vei when the control is disabled, and the dark-colored right bar depicts Vei when the control is enabled. Besides, the four equivalent impedance values listed in Table 2 are indicated at the top of each figure. They are expressed in polar form to quickly identify the network behavior according to the impedance angle (θeqi).

4.2.1. Power Injection Profile 1

Figure 8 displays the operation of the network according to the first power injection profile, considering PGi = 325.0 W (low-production scenario). The P injection is not suspended during the voltage sag; the controller gives priority to this injection. Therefore, the voltage increase is due to the Q injection in the interval 0.22 < t < 0.32 s. As PGi < Pmaxi, then P*i = PGi = 325.0 W, and a considerable injection of reactive power Q* is produced. This injection maximizes the voltage support in all the network nodes, but mainly in those that see a high equivalent inductance. This explanation agrees with the results presented in Figure 4, in which an increase in the positive-sequence voltage amplitudes is observed. The node corresponding to the DPGS 4 has the smallest equivalent inductance (Leq4 = 0.6 mH) of the testbed and, therefore, its voltage support is lower.

4.2.2. Power Injection Profile 2

Figure 9 shows the operation of the network according to the second power injection profile. Since PGi < Pmaxi, then P*i = PGi. This change of profile did not affect the performance of the DPGSs. Although P*2 and P*3 present the same power reduction (from 325.0 W to 300.0 W), the DPGSs 2 and 3 have values of Q* very similar to those of the previous profile. However, the DPGS 1, which increased its value of Q*, and the DPGS 4, which doubled its amount of PG, did improve their voltage support capability. Note also that, although Req3 = Req4 = 1.13 Ω, the DPGS 3 performs better voltage support than the DPGS 4, because Leq3 = 7 3 Leq4.

4.2.3. Power Injection Profile 3

The operation of the network according to the power injection profile 3 is shown in Figure 10. As in the previous profiles, PGi < Pmaxi and, therefore, P*i = PGi. The DPGSs 2 and 3 maintain the same values of P* (300.0 W) and, therefore, the values of Q* are similar to those of the previous profile. Now, the DPGS 1 injects 600.0 W of active power into the network, which is why the effective voltage (Ve1) at this node is the least affected during the voltage sag. However, in this profile, the voltage variation ∆Ve1 is lower than in the previous one ( Δ V e 1 PIP   3 < Δ V e 1 PIP   2 ) . If Q* decreases because of a higher P*, the voltage support capability also decreases. In this test, the effective voltage Ve4 is the most affected when the fault occurs. The equivalent impedance seen by the DPGS 4 is dominantly resistive, and its generated power is the lowest (P*4 = PG4 = 100.0 W). The value of Q*4 is high, but its effect on the voltage support is reduced.
It should be noted that active power references depend on the amount of generated power, as opposed to the reactive power references. Therefore, in a low-power production scenario, the possibilities of adjusting active power references are reduced.

4.2.4. Power Injection Profile 4

Figure 11 shows the operation of the network according to the fourth power injection profile. A low-power production scenario has been configured for the DPGSs 1 to 3 (PG = 100.0 W), which causes a high injection of reactive power Q* that mainly benefits the nodes 1 and 2. The opposite occurs with the DPGS 4, which has a high active power production (PG4 = 1000.0 W) that makes the reactive power reference zero (Q*4 = 0.0 VAr).
The equivalent impedance Zeq 4 seen by the DPGS 4 allows appreciating the significant effect that the P injection has on the voltage support in resistive grids. Since the amplitude of the grid voltage decreases during the grid fault, the generated reference currents, which focus on maintaining the pre-fault power delivery, overpasses the limit value in the interval 0.10 < t < 0.22 s. At t = 0.22 s, the control, together with the current limitation algorithm, is activated, which makes the currents remain below the maximum admissible value, while the maximum active power is injected into the grid (P*4 = Pmax4 = 780.9 W). As soon as the control is enabled, the APC is performed, that is, the components of the active currents (Ip4+ and Ip4) are reduced. This control action can be seen reflected in the behavior of the effective voltage Ve4.

4.2.5. Power Injection Profile 5

The results of the voltage support effect of the last power injection profile are presented in Figure 12. In this case, the low-power production scenario was configured for the DPGSs 2 to 4 (PG = 100.0 W). Now, the DPGS 1 has a high active power production (PG1 = 1000.0 W) that reduces the reactive power reference at this node to zero (Q*1 = 0.0 VAr).
This profile of power injection is the least efficient regarding voltage support, except at the node 2, which undergoes the most notable voltage change (∆Ve2) of the profile. The equivalent impedance Zeq2 seen by the DPGS 2, together with its reference of reactive power (Q*2) when the control is enabled, maximizes the effective voltage variation. Now, the DPGS 1 performs the APC (from 1000.0 W to 817.8 W) when the voltage sag occurs. Observe that P*1 < PG1 because PG1 > Pmax1 during the failure. Therefore, the current amplitudes Ip1+ and Ip1 are reduced, but the effective voltage Ve1 improves when the control is activated because of ∆Ve2. Considering the characteristics of Zeq1, the reduction of P*1 is important to control Imax1, but its effect on the voltage support is negligible.

4.3. Discussion on Voltage Support Capabilities

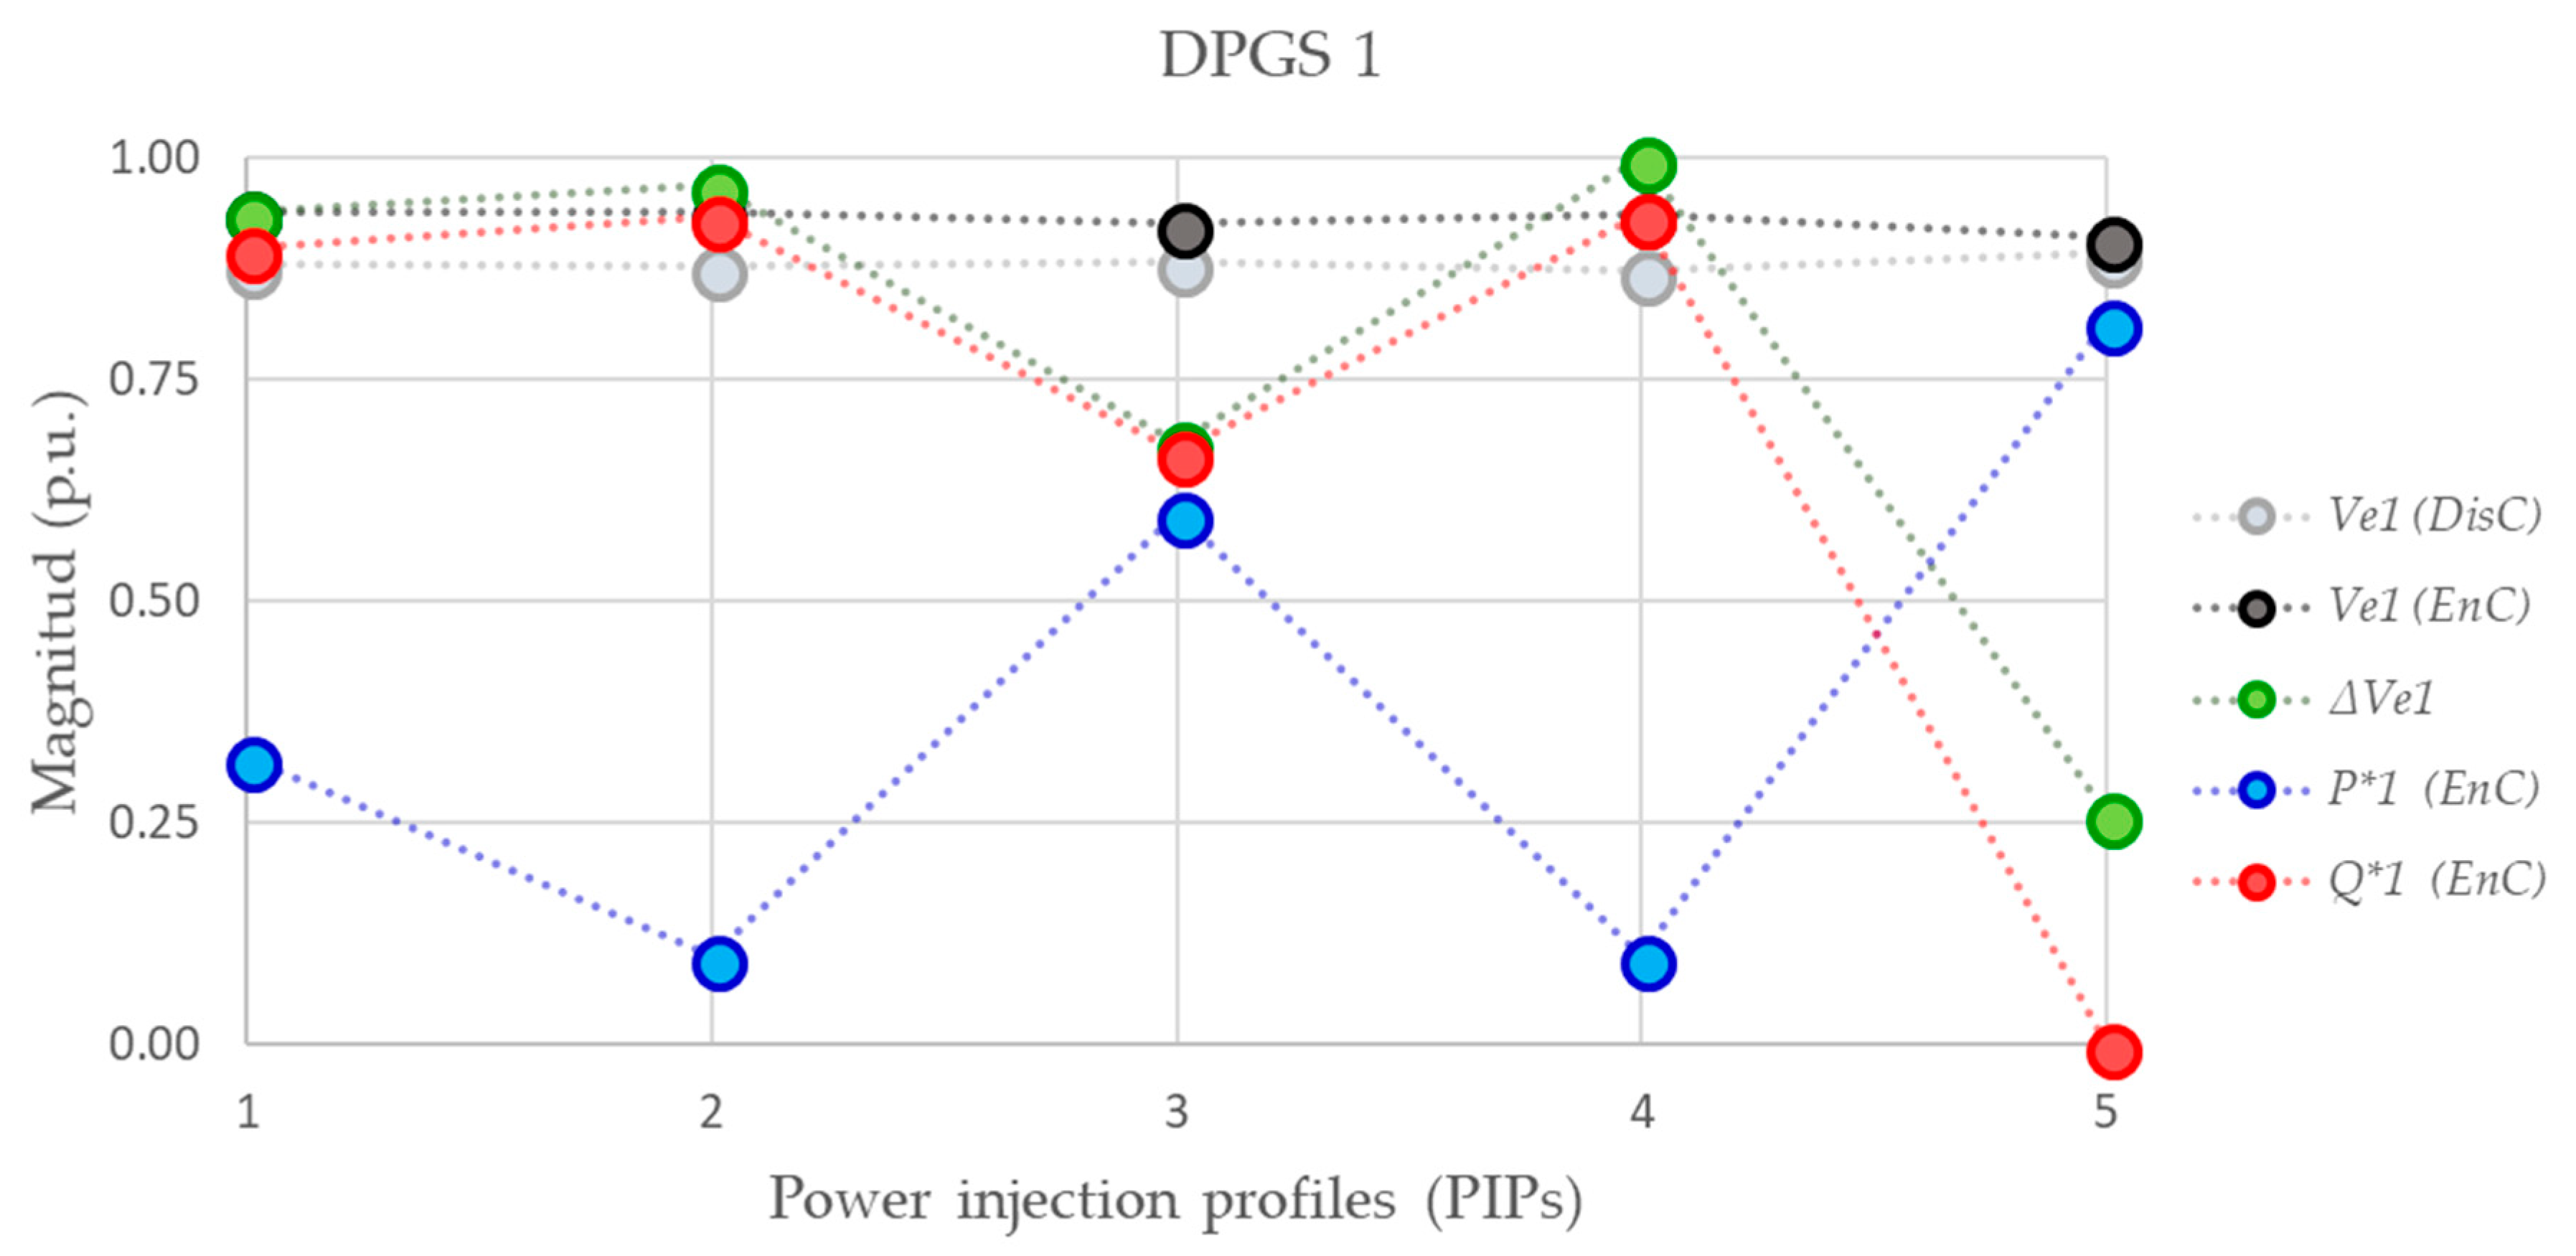
Figure 13 shows the results of the voltage support capability of the DPGS 1 during the five tests that were carried out. At this point, it is not necessary to analyze each DPGS, thus a single one has been chosen to discuss its behavior. The primary variables have been normalized and are presented in a single plane in per unit (p.u.). The maximum values obtained during each test are displayed using circular markers. The gray markers indicate the effective voltage (Ve1) when the control is disabled (DisC), the black ones indicate the value of this voltage when the control is enabled (EnC), and the green ones represent its variation (∆Ve1). Finally, the blue and red markers indicate the active and reactive power references, respectively, when the control is enabled (EnC).
Considering the equivalent impedance Zeq1 seen by the DPGS 1, in this case, the injection of reactive power (Q) has a very noticeable effect on the voltage support; the profiles 1, 2, and 4 confirm this fact. On the contrary, the voltage support is minimized when the injection of active power (P) is predominant; the profile 5 is a clear example. Thus, for the profiles 3 and 5 that have sufficient generated power ( P G 1 PIP   3 = 600.0 W and P G 1 PIP   5 = 1000.0 W), it would have been better not only to inject Q, but also to inject a certain amount of P to achieve more appropriate voltage support considering the equivalent impedance Zeq1. The impedance angle θeq1 directly marks the criteria to establish the relationship between P and Q.
In general, the grid impedance is considered mainly inductive (θ ≈ 90°), but in low-voltage networks, the grid impedance is mainly resistive (θ ≈ 0°) [57]. In this work, a mixed case has been considered in which the equivalent impedance seen by each inverter has inductive and resistive characteristics.
Given that the equivalent impedance seen by the DPGSs 1 and 2 is mainly inductive, based on the experiments carried out in this work, it would be appropriate for these two inverters only to inject Iq+. The injection of Iq could be discarded as its effect on the negative-sequence voltage amplitude V is almost imperceptible (see Figure 4). In the same way, the equivalent impedance seen by the DPGSs 3 and 4 is mainly resistive, which is why the maximum injection of active power during the voltage sag will help to support the grid better; however, when the generated power PG is deficient, reactive power must necessarily be injected. In the fourth power injection profile, the DPGS 4 has a high active power production and need not inject reactive power during the fault, as explained in Section 4.2.4.
It should be noted that if only the injection of Iq+ is considered, then the voltage in each phase rises equally [18], balanced phase currents are achieved, and the instantaneous active power exhibits oscillations at twice the network frequency.
If only reactive power (Q) is injected into a mainly resistive network when a voltage sag occurs, the injection has no effect on the voltage support, but it produces power losses due to core losses and copper losses ( P = I r m s 2 R ) [61]. Similarly, when active power (P) is injected into a mainly inductive network, the injection also has no effect on the local voltages and, besides, limits the injection capability of the inverter.
This analysis allows asserting that if Ip+ is injected into an inductive network when a voltage sag occurs, the voltage support is inefficient; likewise, that if Iq+ is injected when a voltage sag occurs in a resistive network, the reactive current injection does not mitigate the sag, but there are power losses.

4.4. Future Works

In future works, not only experimental tests will be carried out with multiple converters simultaneously injecting active and reactive power into the grid, but different injection strategies will also be tested. In the same way, different indexes of performance will be measured, compared, and analyzed, among which it is essential to highlight the following: injected current, positive-sequence voltage, negative-sequence voltage, voltage imbalance, injected active power, and injected reactive power. Moreover, both voltage support and grid feeding have to be further evaluated.

5. Conclusions

Many solutions have been adopted to control a single inverter with different control strategies; however, new analysis factors appear—which have not been observed in previous works—when several grid-connected inverters coincide.
In this work, a specific control algorithm has been chosen for all inverters, and two main parameters have been considered to perform the analysis presented in the previous section: (1) the equivalent impedances (Zeqi) and (2) the generated power (PGi). The different profiles of active power production provide a grid environment of variable conditions. The changes in these profiles have a direct impact on the power delivery settings for each DPGS.
The principle used with a single inverter to regulate the grid voltages through the injection of reactive current has been verified experimentally in several inverters connected to a network with complex impedance. In addition, each controller can simultaneously deliver active and reactive power to the network through positive- and negative-sequence components.
Although the literature has documented the use of reactive power control methods to deal with overvoltage problems taking advantage of the power capabilities of distributed inverters, this study demonstrates experimentally that these capabilities can also be used to support the grid under voltage sags in a more complex scenario.
It is essential to include the grid impedance effect when designing or selecting a control strategy for DG systems. The impedance angle will delimit the injection method, and the impedance module will determine the effect/impact of such injection.
If the local voltages are within the stipulated limits, no action will be necessary. Otherwise, each DPGS will execute its control strategy according to the interests of the owners and transmission system operators (TSOs) and, ideally, as a function of the equivalent impedance seen by each converter, an exciting topic of research that is open for a new generation of GCs. The obtained experimental results invite to continue with the investigation of the dynamics that arise in the grid when multiple converters simultaneously inject power and help support this grid in the presence of faults such as voltage sags.

Author Contributions

This paper has been jointly developed by all authors. The authors participated in the comparative analysis, and in the obtaining and discussion of the experimental results, as well as in the writing of the article.

Funding

This work has been supported by ELAC2014/ESE0034 from the European Union and its linked Spanish national project PCIN-2015-001. We also appreciate the support from the Ministry of Economy and Competitiveness of Spain and European Regional Development Fund (FEDER) under projects ENE2015-64087-C2-1-R.

Conflicts of Interest

The authors declare no conflict of interest.

References

  1. Katti, P.K.; Khedkar, M.K. Integrated operation of decentralised resources for rural area power supply applications. In Proceedings of the 2005 IEEE/PES Transmission & Distribution Conference & Exposition: Asia and Pacific, Dalian, China, 18 August 2005. [Google Scholar]
  2. Blaabjerg, F.; Teodorescu, R.; Liserre, M.; Timbus, A.V. Overview of Control and Grid Synchronization for Distributed Power Generation Systems. IEEE Trans. Ind. Electron. 2006, 53, 1398–1409. [Google Scholar] [CrossRef] [Green Version]
  3. Troester, E. New German Grid Codes for Connecting PV Systems to the Medium Voltage Power Grid. Available online: https://scholar.google.es/scholar?cluster=5874071522966012685&hl=es&as_sdt=0,5&as_vis=1 (accessed on 25 July 2018).
  4. Tsili, M.; Papathanassiou, S. A review of grid code technical requirements for wind farms. IET Renew. Power Gener. 2009, 3, 308–332. [Google Scholar] [CrossRef]
  5. Altin, M.; Goksu, O.; Teodorescu, R.; Rodriguez, P.; Jensen, B.-B.; Helle, L. Overview of recent grid codes for wind power integration. In Proceedings of the 2010 12th International Conference on Optimization of Electrical and Electronic Equipment, Basov, Romania, 20–22 May 2010; pp. 1152–1160. [Google Scholar]
  6. Yang, Y.; Enjeti, P.; Blaabjerg, F.; Wang, H. Wide-Scale Adoption of Photovoltaic Energy: Grid Code Modifications Are Explored in the Distribution Grid. IEEE Ind. Appl. Mag. 2015, 21, 21–31. [Google Scholar] [CrossRef] [Green Version]
  7. Waveform Characteristics of Voltage Sags: Statistical Analysis; TR-112692; EPRI: Palo Alto, CA, USA, 1999.
  8. Smith, J.C.; Hensley, G.; Ray, L. IEEE Recommended Practice for Monitoring Electric Power Quality; IEEE Standards Association: Piscataway, NJ, USA, 1995. [Google Scholar]
  9. Teodorescu, R.; Liserre, M.; Rodríguez, P. Grid Requirements for PV. In Grid Converters for Photovoltaic and Wind Power Systems; John Wiley & Sons, Ltd.: Chichester, UK, 2010; pp. 31–42. [Google Scholar]
  10. Teodorescu, R.; Liserre, M.; Rodríguez, P. Grid Requirements for WT Systems. In Grid Converters for Photovoltaic and Wind Power Systems; John Wiley & Sons, Ltd.: Chichester, UK, 2010; pp. 145–167. [Google Scholar]
  11. Sourkounis, C.; Tourou, P. Grid Code Requirements for Wind Power Integration in Europe. Conf. Pap. Energy 2013, 2013, 437674. [Google Scholar] [CrossRef]
  12. Uphues, A.; Notzold, K.; Griessel, R.; Wegener, R.; Soter, S. Overview of LVRT-capability pre-evaluation with an inverter based test bench. In Proceedings of the 2015 IEEE 24th International Symposium on Industrial Electronics (ISIE), Buzios, Brazil, 3–5 June 2015. [Google Scholar]
  13. Teodorescu, R.; Liserre, M.; Rodríguez, P. Islanding Detection. In Grid Converters for Photovoltaic and Wind Power Systems; John Wiley & Sons, Ltd.: Chichester, UK, 2010; pp. 93–122. [Google Scholar]
  14. Alepuz, S.; Busquets-Monge, S.; Bordonau, J.; Martinez-Velasco, J.A.; Silva, C.A.; Pontt, J.; Rodriguez, J. Control Strategies Based on Symmetrical Components for Grid-Connected Converters Under Voltage Dips. IEEE Trans. Ind. Electron. 2009, 56, 2162–2173. [Google Scholar] [CrossRef] [Green Version]
  15. Wang, F.; Duarte, J.L.; Hendrix, M.A. Pliant Active and Reactive Power Control for Grid-Interactive Converters Under Unbalanced Voltage Dips. IEEE Trans. Power Electron. 2011, 26, 1511–1521. [Google Scholar] [CrossRef] [Green Version]
  16. Camacho, A.; Castilla, M.; Miret, J.; Vasquez, J.C.; Alarcón-Gallo, E. Flexible Voltage Support Control for Three-Phase Distributed Generation Inverters Under Grid Fault. IEEE Trans. Ind. Electron. 2013, 60, 1429–1441. [Google Scholar] [CrossRef]
  17. Miret, J.; Camacho, A.; Castilla, M.; García de Vicuña, J.L.; Matas, J. Control Scheme With Voltage Support Capability for Distributed Generation Inverters Under Voltage Sags. IEEE Trans. Power Electron. 2013, 28, 5252–5262. [Google Scholar] [CrossRef]
  18. Camacho, A.; Castilla, M.; Miret, J.; Guzman, R.; Borrell, A. Reactive Power Control for Distributed Generation Power Plants to Comply With Voltage Limits During Grid Faults. IEEE Trans. Power Electron. 2014, 29, 6224–6234. [Google Scholar] [CrossRef] [Green Version]
  19. Miret, J.; Castilla, M.; Camacho, A.; García de Vicuña, J.L.; Matas, J. Control Scheme for Photovoltaic Three-Phase Inverters to Minimize Peak Currents During Unbalanced Grid-Voltage Sags. IEEE Trans. Power Electron. 2012, 27, 4262–4271. [Google Scholar] [CrossRef]
  20. Rodriguez, P.; Luna, A.; Hermoso, J.R.; Etxeberria-Otadui, I.; Teodorescu, R.; Blaabjerg, F. Current control method for distributed generation power generation plants under grid fault conditions. In Proceedings of the IECON 2011—37th Annual Conference of the IEEE Industrial Electronics Society, Melbourne, VIC, Australia, 7–10 November 2011; pp. 1262–1269. [Google Scholar]
  21. Rodriguez, P.; Medeiros, G.; Luna, A.; Cavalcanti, M.C.; Teodorescu, R. Safe current injection strategies for a STATCOM under asymmetrical grid faults. In Proceedings of the 2010 IEEE Energy Conversion Congress and Exposition, Atlanta, GA, USA, 12–16 Sepember 2010; pp. 3929–3935. [Google Scholar]
  22. Suul, J.A.; Luna, A.; Rodriguez, P.; Undeland, T. Virtual-Flux-Based Voltage-Sensor-Less Power Control for Unbalanced Grid Conditions. IEEE Trans. Power Electron. 2012, 27, 4071–4087. [Google Scholar] [CrossRef]
  23. Lee, C.-T.; Hsu, C.-W.; Cheng, P.-T. A Low-Voltage Ride-Through Technique for Grid-Connected Converters of Distributed Energy Resources. IEEE Trans. Ind. Appl. 2011, 47, 1821–1832. [Google Scholar] [CrossRef]
  24. Camacho, A.; Castilla, M.; Miret, J.; Borrell, A.; García de Vicuna, J.L. Active and Reactive Power Strategies With Peak Current Limitation for Distributed Generation Inverters During Unbalanced Grid Faults. IEEE Trans. Ind. Electron. 2015, 62, 1515–1525. [Google Scholar] [CrossRef] [Green Version]
  25. Sosa, J.L.; Castilla, M.; Miret, J.; Matas, J.; Al-Turki, Y.A. Control Strategy to Maximize the Power Capability of PV Three-Phase Inverters During Voltage Sags. IEEE Trans. Power Electron. 2016, 31, 3314–3323. [Google Scholar] [CrossRef] [Green Version]
  26. Tang, C.; Chen, Y.-T.; Chen, Y. PV Power System With Multi-Mode Operation and Low-Voltage Ride-Through Capability. IEEE Trans. Ind. Electron. 2015, 62, 7524–7533. [Google Scholar] [CrossRef]
  27. Chen, H.-C.; Lee, C.-T.; Cheng, P.-T.; Teodorescu, R.; Blaabjerg, F. A Low-Voltage Ride-Through Technique for Grid-connected Converters with Reduced Power Transistors Stress. IEEE Trans. Power Electron. 2016, 31, 8562–8571. [Google Scholar] [CrossRef]
  28. Mozumder, S.; Dhar, A.; Rangarajan, S.S.; Karthikeyan, S.P. Coordinated operation of multiple inverter based renewable distributed generators as an active power injector and reactive power compensator. In Proceedings of the 2014 International Conference on Computation of Power, Energy, Information and Communication (ICCPEIC), Chennai, India, 16–17 April 2014; pp. 298–303. [Google Scholar]
  29. Lee, Y.-D.; Park, S.-Y. Reactive power allocation control scheme for multiple grid connected inverters. In Proceedings of the 2015 9th International Conference on Power Electronics and ECCE Asia (ICPE-ECCE Asia), Seoul, Korea, 1–5 June 2015; pp. 2481–2488. [Google Scholar]
  30. Velasco, M.; Martí, P.; Torres-Martínez, J.; Miret, J.; Castilla, M. On the optimal reactive power control for grid-connected photovoltaic distributed generation systems. In Proceedings of the IECON 2015—41st Annual Conference of the IEEE Industrial Electronics Society, Yokohama, Japan, 9–12 November 2015. [Google Scholar]
  31. Momeneh, A.; Castilla, M.; Miret, J.; Martí, P.; Velasco, M. Comparative study of reactive power control methods for photovoltaic inverters in low-voltage grids. IET Renew. Power Gener. 2016, 10, 310–318. [Google Scholar] [CrossRef] [Green Version]
  32. Martí, P.; Velasco, M.; Torres-Martínez, J.; Miret, J.; Castilla, M. Reactive power control for loss minimization in low-voltage distributed generation systems. In Proceedings of the 2016 12th IEEE International Conference on Control and Automation (ICCA), Kathmandu, Nepal, 1–3 June 2016; pp. 371–376. [Google Scholar]
  33. Kulkarni, O.V.; Doolla, S.; Fernandes, B.G. Mode Transition Control Strategy for Multiple Inverter-Based Distributed Generators Operating in Grid-Connected and Standalone Mode. IEEE Trans. Ind. Appl. 2017, 53, 5927–5939. [Google Scholar] [CrossRef]
  34. Miret, J.; García de Vicuña, J.L.; Guzmán, R.; Camacho, A.; Ghahderijani, M.M. A Flexible Experimental Laboratory for Distributed Generation Networks Based on Power Inverters. Energies 2017, 10, 1589. [Google Scholar] [CrossRef]
  35. Demirok, E.; González, P.C.; Frederiksen, K.H.B.; Sera, D.; Rodriguez, P.; Teodorescu, R. Local Reactive Power Control Methods for Overvoltage Prevention of Distributed Solar Inverters in Low-Voltage Grids. IEEE J. Photovolt. 2011, 1, 174–182. [Google Scholar] [CrossRef]
  36. Camacho, A.; Castilla, M.; Canziani, F.; Moreira, C.; Coelho, P.; Gomes, M.; Mercado, P. Performance Comparison of Grid-Faulty Control Schemes for Inverter-Based Industrial Microgrids. Energies 2017, 10, 2096. [Google Scholar] [CrossRef]
  37. Zhao, X.; Guerrero, J.M.; Savaghebi, M.; Vasquez, J.C.; Wu, X.; Sun, K. Low-Voltage Ride-Through Operation of Power Converters in Grid-Interactive Microgrids by Using Negative-Sequence Droop Control. IEEE Trans. Power Electron. 2017, 32, 3128–3142. [Google Scholar] [CrossRef]
  38. Teodorescu, R.; Liserre, M.; Rodríguez, P. Grid synchronization in three-phase power converters. In Grid Converters for Photovoltaic and Wind Power Systems; John Wiley & Sons, Ltd.: Chichester, UK, 2010; pp. 169–204. [Google Scholar]
  39. Teodorescu, R.; Liserre, M.; Rodríguez, P. Control of grid converters under grid faults. In Grid Converters for Photovoltaic and Wind Power Systems; John Wiley & Sons, Ltd.: Chichester, UK, 2010; pp. 237–287. [Google Scholar]
  40. Blackburn, J.L.; Domin, T.J. Introduction and General Philosophies. In Protective Relaying: Principles and Applications, 3rd ed.; CRC Press: Boca Raton, FL, USA, 2006. [Google Scholar]
  41. Anderson, P.M. Symmetrical Components. In Analysis of Faulted Power Systems, 1st ed.; Wiley-IEEE Press: New York, NY, USA, 1995. [Google Scholar]
  42. Anderson, P.M. Analysis of unsymmetrical faults: Three-component method. In Analysis of Faulted Power Systems, 1st ed.; Wiley-IEEE Press: New York, NY, USA, 1995. [Google Scholar]
  43. Blackburn, J.L.; Domin, T.J. Symmetrical components: A review. In Protective Relaying: Principles and Applications, 3rd ed.; CRC Press: Boca Raton, FL, USA, 2006. [Google Scholar]
  44. Teodorescu, R.; Liserre, M.; Rodríguez, P. Appendix A: Space vector transformations of three-phase systems. In Grid Converters for Photovoltaic and Wind Power Systems; John Wiley & Sons, Ltd.: Chichester, UK, 2010; pp. 355–362. [Google Scholar]
  45. Das, J.C. Symmetrical components using matrix methods. In Understanding Symmetrical Components for Power System Modeling; John Wiley & Sons, Inc.: Hoboken, NJ, USA, 2016; pp. 1–14. [Google Scholar]
  46. Das, J.C. Fundamental concepts of symmetrical components. In Understanding Symmetrical Components for Power System Modeling; John Wiley & Sons, Inc.: Hoboken, NJ, USA, 2016; pp. 15–37. [Google Scholar]
  47. Das, J.C. Unsymmetrical fault calculations. In Understanding Symmetrical Components for Power System Modeling; John Wiley & Sons, Inc.: Hoboken, NJ, USA, 2016; pp. 103–146. [Google Scholar]
  48. IEEE Standard Definitions for the Measurement of Electric Power Quantities Under Sinusoidal, Nonsinusoidal, Balanced, or Unbalanced Conditions; IEEE Standards Association: Piscataway, NJ, USA, 2010.
  49. Teodorescu, R.; Liserre, M.; Rodríguez, P. Appendix B: Instantaneous power theories. In Grid Converters for Photovoltaic and Wind Power Systems; John Wiley & Sons, Ltd.: Chichester, UK, 2010; pp. 363–379. [Google Scholar]
  50. Braun, M.; Stetz, T.; Bründlinger, R.; Mayr, C.; Ogimoto, K.; Hatta, H.; Kobayashi, H.; Kroposki, B.; Mather, B.; Coddington, M.; Lynn, K.; et al. Is the distribution grid ready to accept large-scale photovoltaic deployment? State of the art, progress, and future prospects. Prog. Photovolt. Res. Appl. 2012, 20, 681–697. [Google Scholar] [CrossRef]
  51. Akagi, H.; Watanabe, E.H.; Aredes, M. Electric power definitions: Background. In Instantaneous Power Theory and Applications to Power Conditioning; Akagi, H., Watanabe, E.H., Aredes, M., Eds.; John Wiley & Sons, Inc.: Hoboken, NJ, USA, 2017; pp. 17–36. [Google Scholar]
  52. Camacho, A.; Castilla, M.; Miret, J.; García de Vicuña, J.L.; Guzman, R. Positive and Negative Sequence Control Strategies to Maximize the Voltage Support in Resistive–Inductive Grids During Grid Faults. IEEE Trans. Power Electron. 2018, 33, 5362–5373. [Google Scholar] [CrossRef] [Green Version]
  53. Camacho, A.; Castilla, M.; Miret, J.; García de Vicuña, J.L.; Garnica López, M.A. Control Strategy for Distribution Generation Inverters to Maximize the Voltage Support in the Lowest Phase During Voltage Sags. IEEE Trans. Ind. Electron. 2018, 65, 2346–2355. [Google Scholar] [CrossRef] [Green Version]
  54. Shabestary, M.M. A Comparative Analytical Study on Low-Voltage Ride-Through Reference-Current-Generation (LVRT-RCG) Strategies in Converter-Interfaced DER Units. Master’s Thesis, University of Alberta, Edmonton, AB, Canada, 2015. [Google Scholar]
  55. Rodriguez, P.; Timbus, A.V.; Teodorescu, R.; Liserre, M.; Blaabjerg, F. Flexible Active Power Control of Distributed Power Generation Systems During Grid Faults. IEEE Trans. Ind. Electron. 2007, 54, 2583–2592. [Google Scholar] [CrossRef]
  56. Ma, K.; Liserre, M.; Blaabjerg, F. Power controllability of three-phase converter with unbalanced AC source. In Proceedings of the 2013 Twenty-Eighth Annual IEEE Applied Power Electronics Conference and Exposition (APEC), Long Beach, CA, USA, 17–21 March 2013. [Google Scholar]
  57. Guo, X.; Zhang, X.; Wang, B.; Wu, W.; Guerrero, J.M. Asymmetrical Grid Fault Ride-Through Strategy of Three-Phase Grid-Connected Inverter Considering Network Impedance Impact in Low-Voltage Grid. IEEE Trans. Power Electron. 2014, 29, 1064–1068. [Google Scholar] [CrossRef] [Green Version]
  58. Rodriguez, F.J.; Bueno, E.; Aredes, M.; Rolim, L.G.B.; Neves, F.A.S.; Cavalcanti, M.C. Discrete-time implementation of second order generalized integrators for grid converters. In Proceedings of the 2008 34th Annual Conference of IEEE Industrial Electronics, Orlando, FL, USA, 10–13 November 2008. [Google Scholar]
  59. Garnica López, M.A.; García de Vicuña, J.L.; Miret, J.; Castilla, M.; Guzmán, R. Control Strategy for Grid-Connected Three-Phase Inverters During Voltage Sags to Meet Grid Codes and to Maximize Power Delivery Capability. IEEE Trans. Power Electron. 2018. [Google Scholar] [CrossRef]
  60. IEEE Guide for Voltage Sag Indices; IEEE Standards Association: Piscataway, NJ, USA, 2014.
  61. Sun, D.; Abe, S.; Shoults, R.R.; Chen, M.S.; Eichenberger, P.; Farris, D. Calculation of Energy Losses in a Distribution System. IEEE Trans. Power Appar. Syst. 1980, PAS-99, 1347–1356. [Google Scholar] [CrossRef]
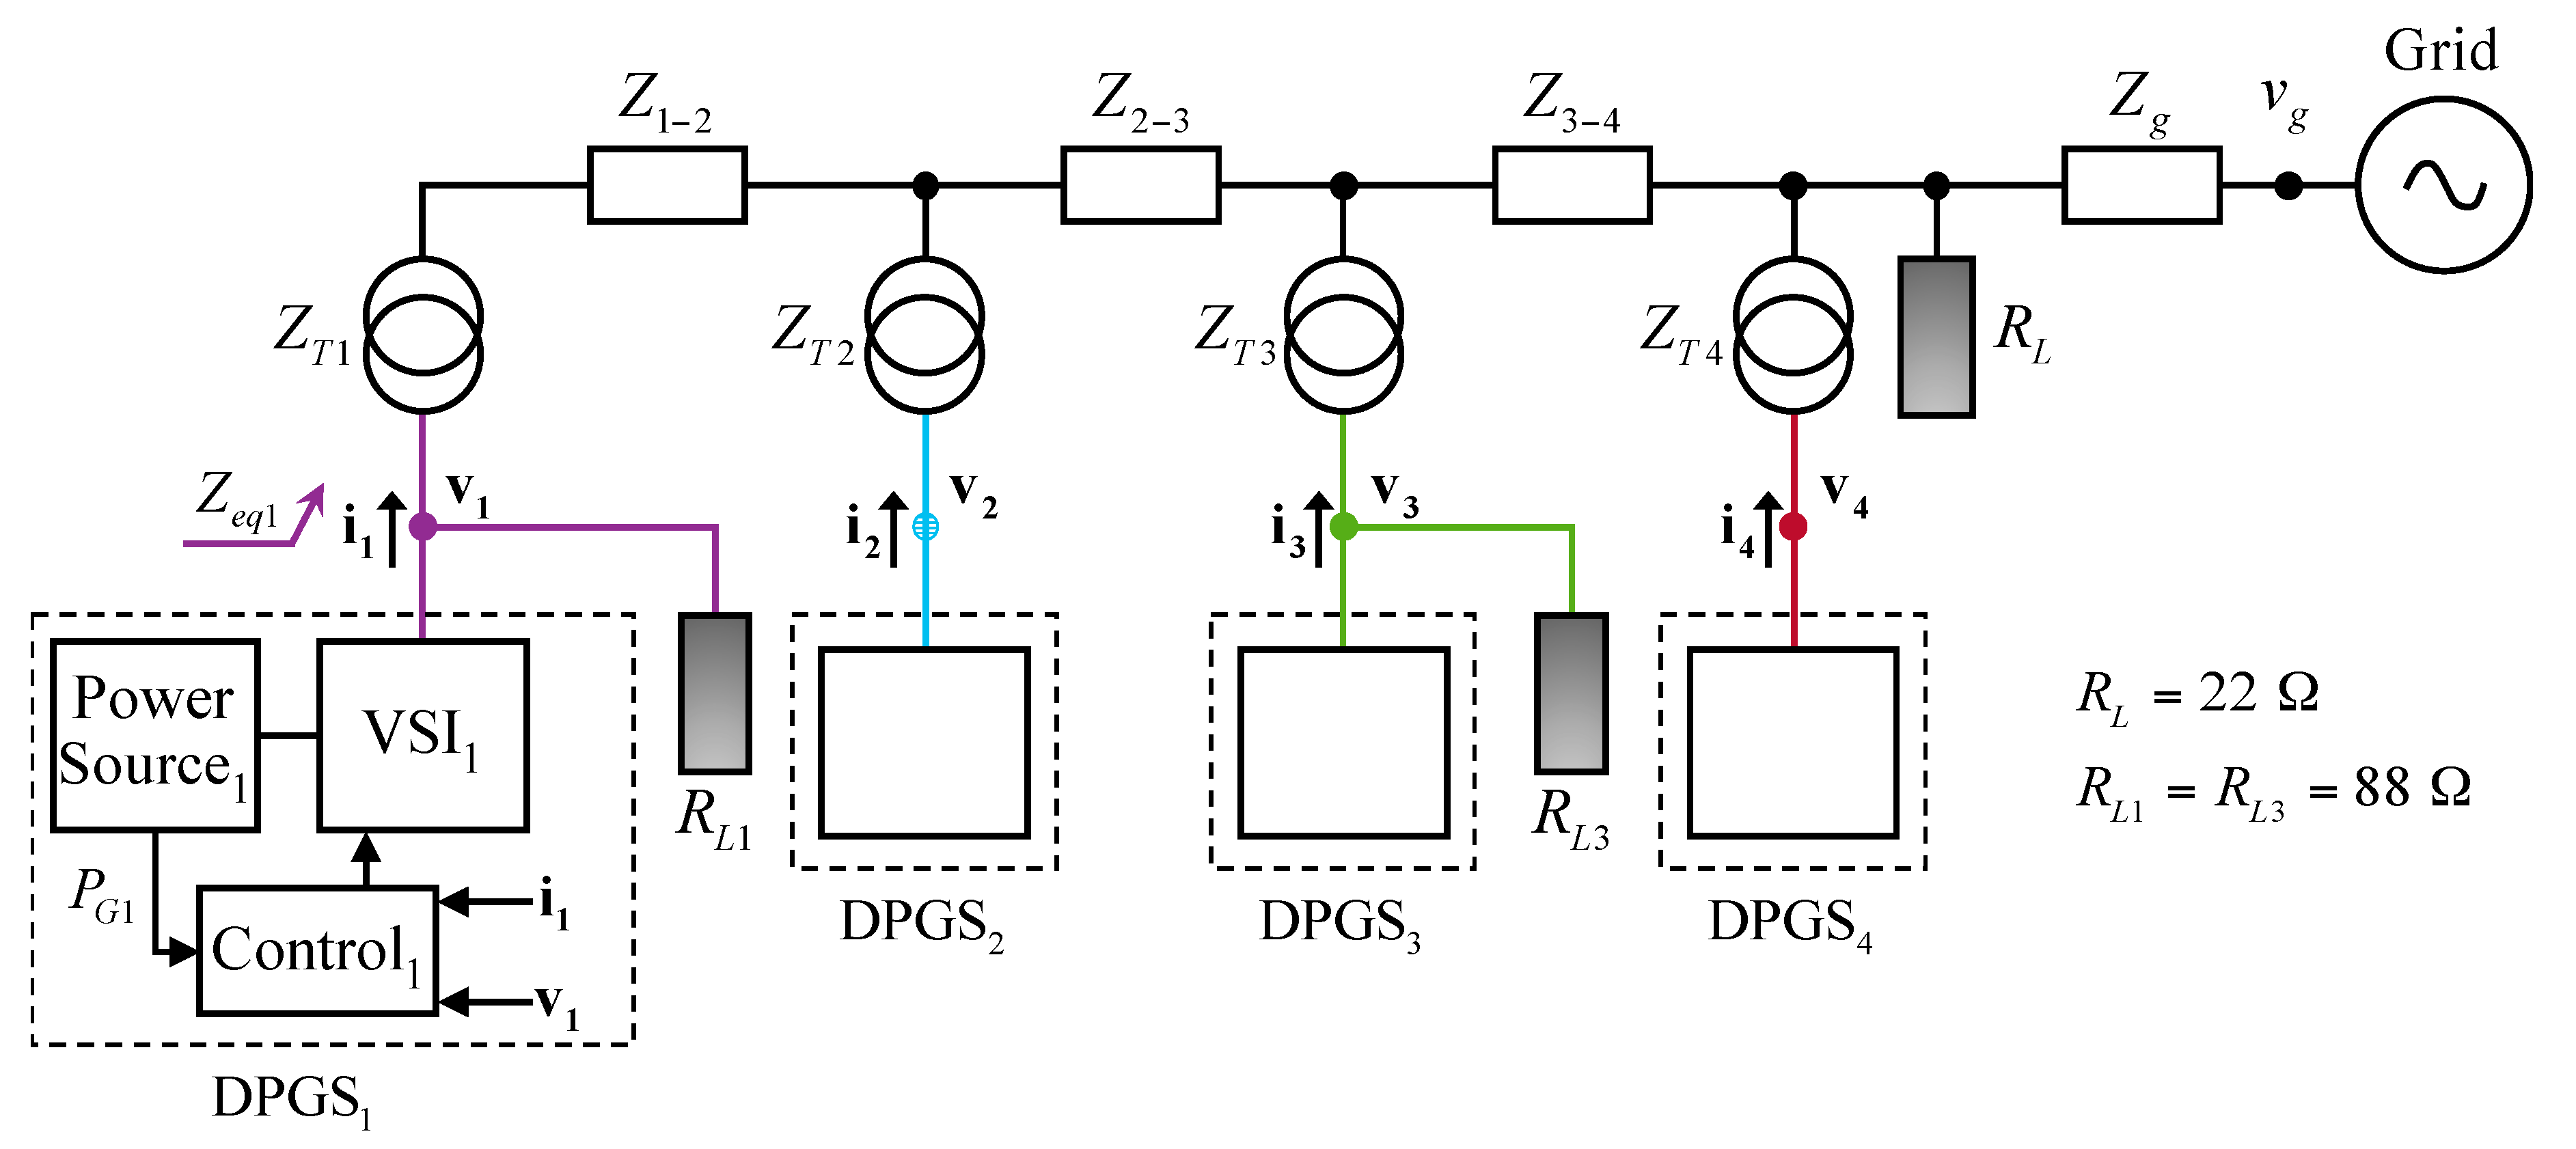
Figure 1. Scheme of the implemented experimental network. VSI—voltage-sourced inverter; DPGS—distributed power generation system; PG—generated power.
Energies 11 01949 g001
Figure 2. Block diagram of the control scheme.
Energies 11 01949 g002
Figure 3. Experimental phase voltages with profile 1. va (blue), vb (orange), and vc (green).
Energies 11 01949 g003
Figure 4. Voltage sequence amplitudes with profile 1. DPGS1 (violet), DPGS2 (sky-blue), DPGS3 (emerald), and DPGS4 (burgundy).
Energies 11 01949 g004
Figure 5. Current sequences with profile 1. Positive-sequence active current Ip+ (blue), negative-sequence active current Ip (light blue), positive-sequence reactive current Iq+ (red), and negative-sequence reactive current Iq (light red).
Energies 11 01949 g005
Figure 6. Experimental phase currents with profile 1. ia (blue), ib (orange), and ic (green).
Energies 11 01949 g006
Figure 7. Experimental measured powers with profile 1. DPGS1 (violet), DPGS2 (sky-blue), DPGS3 (emerald), and DPGS4 (burgundy).
Energies 11 01949 g007
Figure 8. Effective voltages with profile 1.
Energies 11 01949 g008
Figure 9. Effective voltages with profile 2.
Energies 11 01949 g009
Figure 10. Effective voltages with profile 3.
Energies 11 01949 g010
Figure 11. Effective voltages with profile 4.
Energies 11 01949 g011
Figure 12. Effective voltages with profile 5.
Energies 11 01949 g012
Figure 13. The DPGS 1 and its voltage support capability. DisC—control is disabled; EnC—control is enabled; ∆Ve1—variation of voltage.
Energies 11 01949 g013
Table 1. Line impedances.
QuantityAcronymValue
transformer equivalent inductances 1 and 2LT1,21.0 mH
transformer equivalent resistances 1 and 2RT1,20.5 Ω
transformer equivalent inductances 3 and 4LT3,40.6 mH
transformer equivalent resistances 3 and 4RT3,41.13 Ω
line inductance between 1 and 2L1–22.0 mH
line inductance between 2 and 3L2–30.8 mH
line inductance between 3 and 4L3–40.8 mH
Table 2. Equivalent impedance seen from the output of the voltage-sourced inverters (VSIs). DPGS—distributed power generation system.
DPGSReq (Ω)Leq (mH)Zeq (Ω)Angle θeq (deg.)|Zeq| (Ω)
10.504.600.50 + 1.73j73.92°1.80
20.502.600.50 + 0.98j62.97°1.10
31.131.401.13 + 0.53j25.04°1.25
41.130.601.13 + 0.23j11.32°1.15
Table 3. Comparison of different strategies for generating reference currents. THD—total harmonic distortion; FBSS—flexible balance of symmetric sequences.
StrategyPower BehaviorTHDImax
IARC [39] ≈ 0 and ≈ 0
negligible oscillations
highhigh
AARC [39]when Q = 0 ⇒ ≠ 0
when P = 0 ⇒ ≠ 0
lowlow
BPSC [39,55] ≠ 0 and ≠ 0
lower oscillations
lowlow
ICPS [55]if Q ≠ 0 ⇒ ≠ 0
if P ≠ 0 ⇒ ≠ 0
mediumhigh
PNSC [39,55]when P ≠ 0 and Q = 0 ⇒ ≠ 0
when P = 0 and Q ≠ 0 ⇒ ≠ 0
lowhigh
ZSCC [56] = 0 and = 0
four-wire or six-wire systems
lowvery high
FPNSC [39] ≠ 0 and ≠ 0
power oscillations
lowproperly controllable
FBSS (L grids) [16,25] = 0 and ≠ 0
= 0 if P = 0 (special case)
lowproperly controllable
FBSS (R grids) [57]P ≠ 0, Q = 0, and ≠ 0
= 0 (special configuration)
lowproperly controllable
VSS (RL grids) [52,53] ≠ 0 and ≠ 0lowproperly controllable
Table 4. System parameters.
QuantityAcronymValue
grid voltageV110.0 V rms
grid frequencyf60.0 Hz
rated powerSb1.5 kVA
rated currentIrated5.0 A
LC filter inductancesLf5.0 mH
LC filter capacitancesCf1.5 µF
LC filter damping resistorsRd68.0 Ω
Common resistive loadRL22.0 Ω
Local resistive loadsRL1, RL388.0 Ω
sampling/switching frequencyfs10.0 kHz
Table 5. Power injection profiles. PG—generated power; P*—reference active power; Q*—reference reactive power.
PowerDPGSProfile 1Profile 2Profile 3Profile 4Profile 5
PG (W)1325.0100.0600.0100.01000.0
2325.0300.0300.0100.0100.0
3325.0300.0300.0100.0100.0
4325.0600.0100.01000.0100.0
P* (W)1325.0100.0600.0100.0817.8
2325.0300.0300.0100.0100.0
3325.0300.0300.0100.0100.0
4325.0600.0100.0780.9100.0
Q* (VAr)1898.0935.3669.5937.20.0
2848.8842.7846.7903.0881.3
3800.2801.5810.2856.2846.5
4786.6541.7851.70.0841.7