Article

Aerodynamic Design Optimization of a Micro Radial Compressor of a Turbocharger

1
Department of Mechanical Design Engineering, Kangwon National University, Samcheok 25913, Korea
2
Key Yang Precision Co., R&D Center, 1012-4 Eungmyeong-dong (63 Gongdan 4-gil), Gimcheon-si 39537, Korea
*
Author to whom correspondence should be addressed.
Energies 2018, 11(7), 1827; https://doi.org/10.3390/en11071827
Submission received: 13 June 2018 / Revised: 9 July 2018 / Accepted: 10 July 2018 / Published: 12 July 2018
(This article belongs to the Section I: Energy Fundamentals and Conversion)

Abstract

:
This study presents an aerodynamic design optimization of a micro radial compressor impeller on a turbocharger used in a 0.8 L two-cylinder gasoline engine. In the conventional design optimization of the impeller, the hub and shroud curve of the main blade is commonly parameterized with a beta distribution, and splitter blades are generally considered short versions of the full blade. However, geometrical parameterizations in our study mainly focus on the beta distribution of a full blade, and it is parameterized differently from the conventional way. Eight parameters are selected as design variables for the beta distribution. To maximize the isentropic efficiency, design points that are created by Design of Experiment (DOE) are evaluated through single-objective optimization coupled with a non-parametric regression surrogate model. Furthermore, the splitter leading edge location on the meridional plane is investigated to enhance the performance of the impeller after the optimization process. The results show that total efficiency enhancement of approximately 2.2% is achieved. Furthermore, the findings show that a full blade beta distribution and the splitter leading edge location are sufficient parameters to optimize the impeller, and, with the proposed optimization, splitter blades are no longer copies of the full blade for each application.

1. Introduction

Centrifugal compressors are widely utilized in many engineering disciplines, such as turbochargers, industrial gas and steam turbines, and small gas turbines in the aviation field. Due to their higher compression ratio in a single stage with a low mass flow rate and lower installation space requirements compared with axial compressors, centrifugal compressors have become more attractive to researchers. Therefore, several optimization techniques have been suggested to improve compressor design [1,2,3,4,5,6]. In particular, metamodel coupled optimization techniques incorporating three-dimensional Reynold-average Naver-Stokes (RANS) analyses have been suggested by several authors to enhance performance parameters such as efficiency, pressure ratio, and operation range [7,8,9,10,11].
Geometry parameterization is a critical stage in the optimization process; design of compressors greatly depends on the hub and shroud profiles of the blades (main and splitter), beta distribution, and lean angle [12,13,14]. To define the centrifugal compressor, all the design variables can be taken into account. In addition to the already mentioned design parameters, the leading edge location of the splitter blade also can be considered to reduce flow blockage and to improve flow guidance [15]. However, including all the design parameters in an optimization process could lead to an unexpected result. Therefore, selecting the most influential design parameters could lead to better optimization performance [16].
In the conventional design optimization process of the impeller, the hub and shroud profiles of the main blade, which are defined by the Bezier curve method [17], are commonly examined, and splitter blades are considered as short versions of the main blade to provide equal flow passage in the impeller. In this study, however, we mainly focused on the full (main) blade itself by considering the beta distribution and splitter blades as being fixed as given in the reference design. Eight parameters (four for the hub, four for the shroud) were therefore selected to define the beta distribution of the main blade. Furthermore, the leading edge location on the meridional plane of the splitter blade was also added as an additional parameter. The hub and shroud locations (two parameters) of the leading edge were selected to further find an optimal compressor [15].
In the current study, RANS analyses were first carried out for the design of the centrifugal compressor, which was selected through one of the DOE [18] methods (optimal space filling (OSF)) based on the design parameters (for beta distribution) to acquire numerical results. Afterward, single-objective (isentropic efficiency) optimization using a screening method coupled with a non-parametric regression metamodel [19,20,21] was applied to find an optimal design. Following this, optimization of the splitter location at the leading edge was investigated. To do so, the hub and shroud locations of the splitter blade on the meridional contour were parameterized. The central composite design (CCD) of the DOE method was generated accordingly. Similarly, for the main blade, RANS was conducted and a screening optimization technique coupled with a non-parametric regression surrogate model was utilized. Finally, the objective function (isentropic efficiency) was investigated and compared with the reference design.

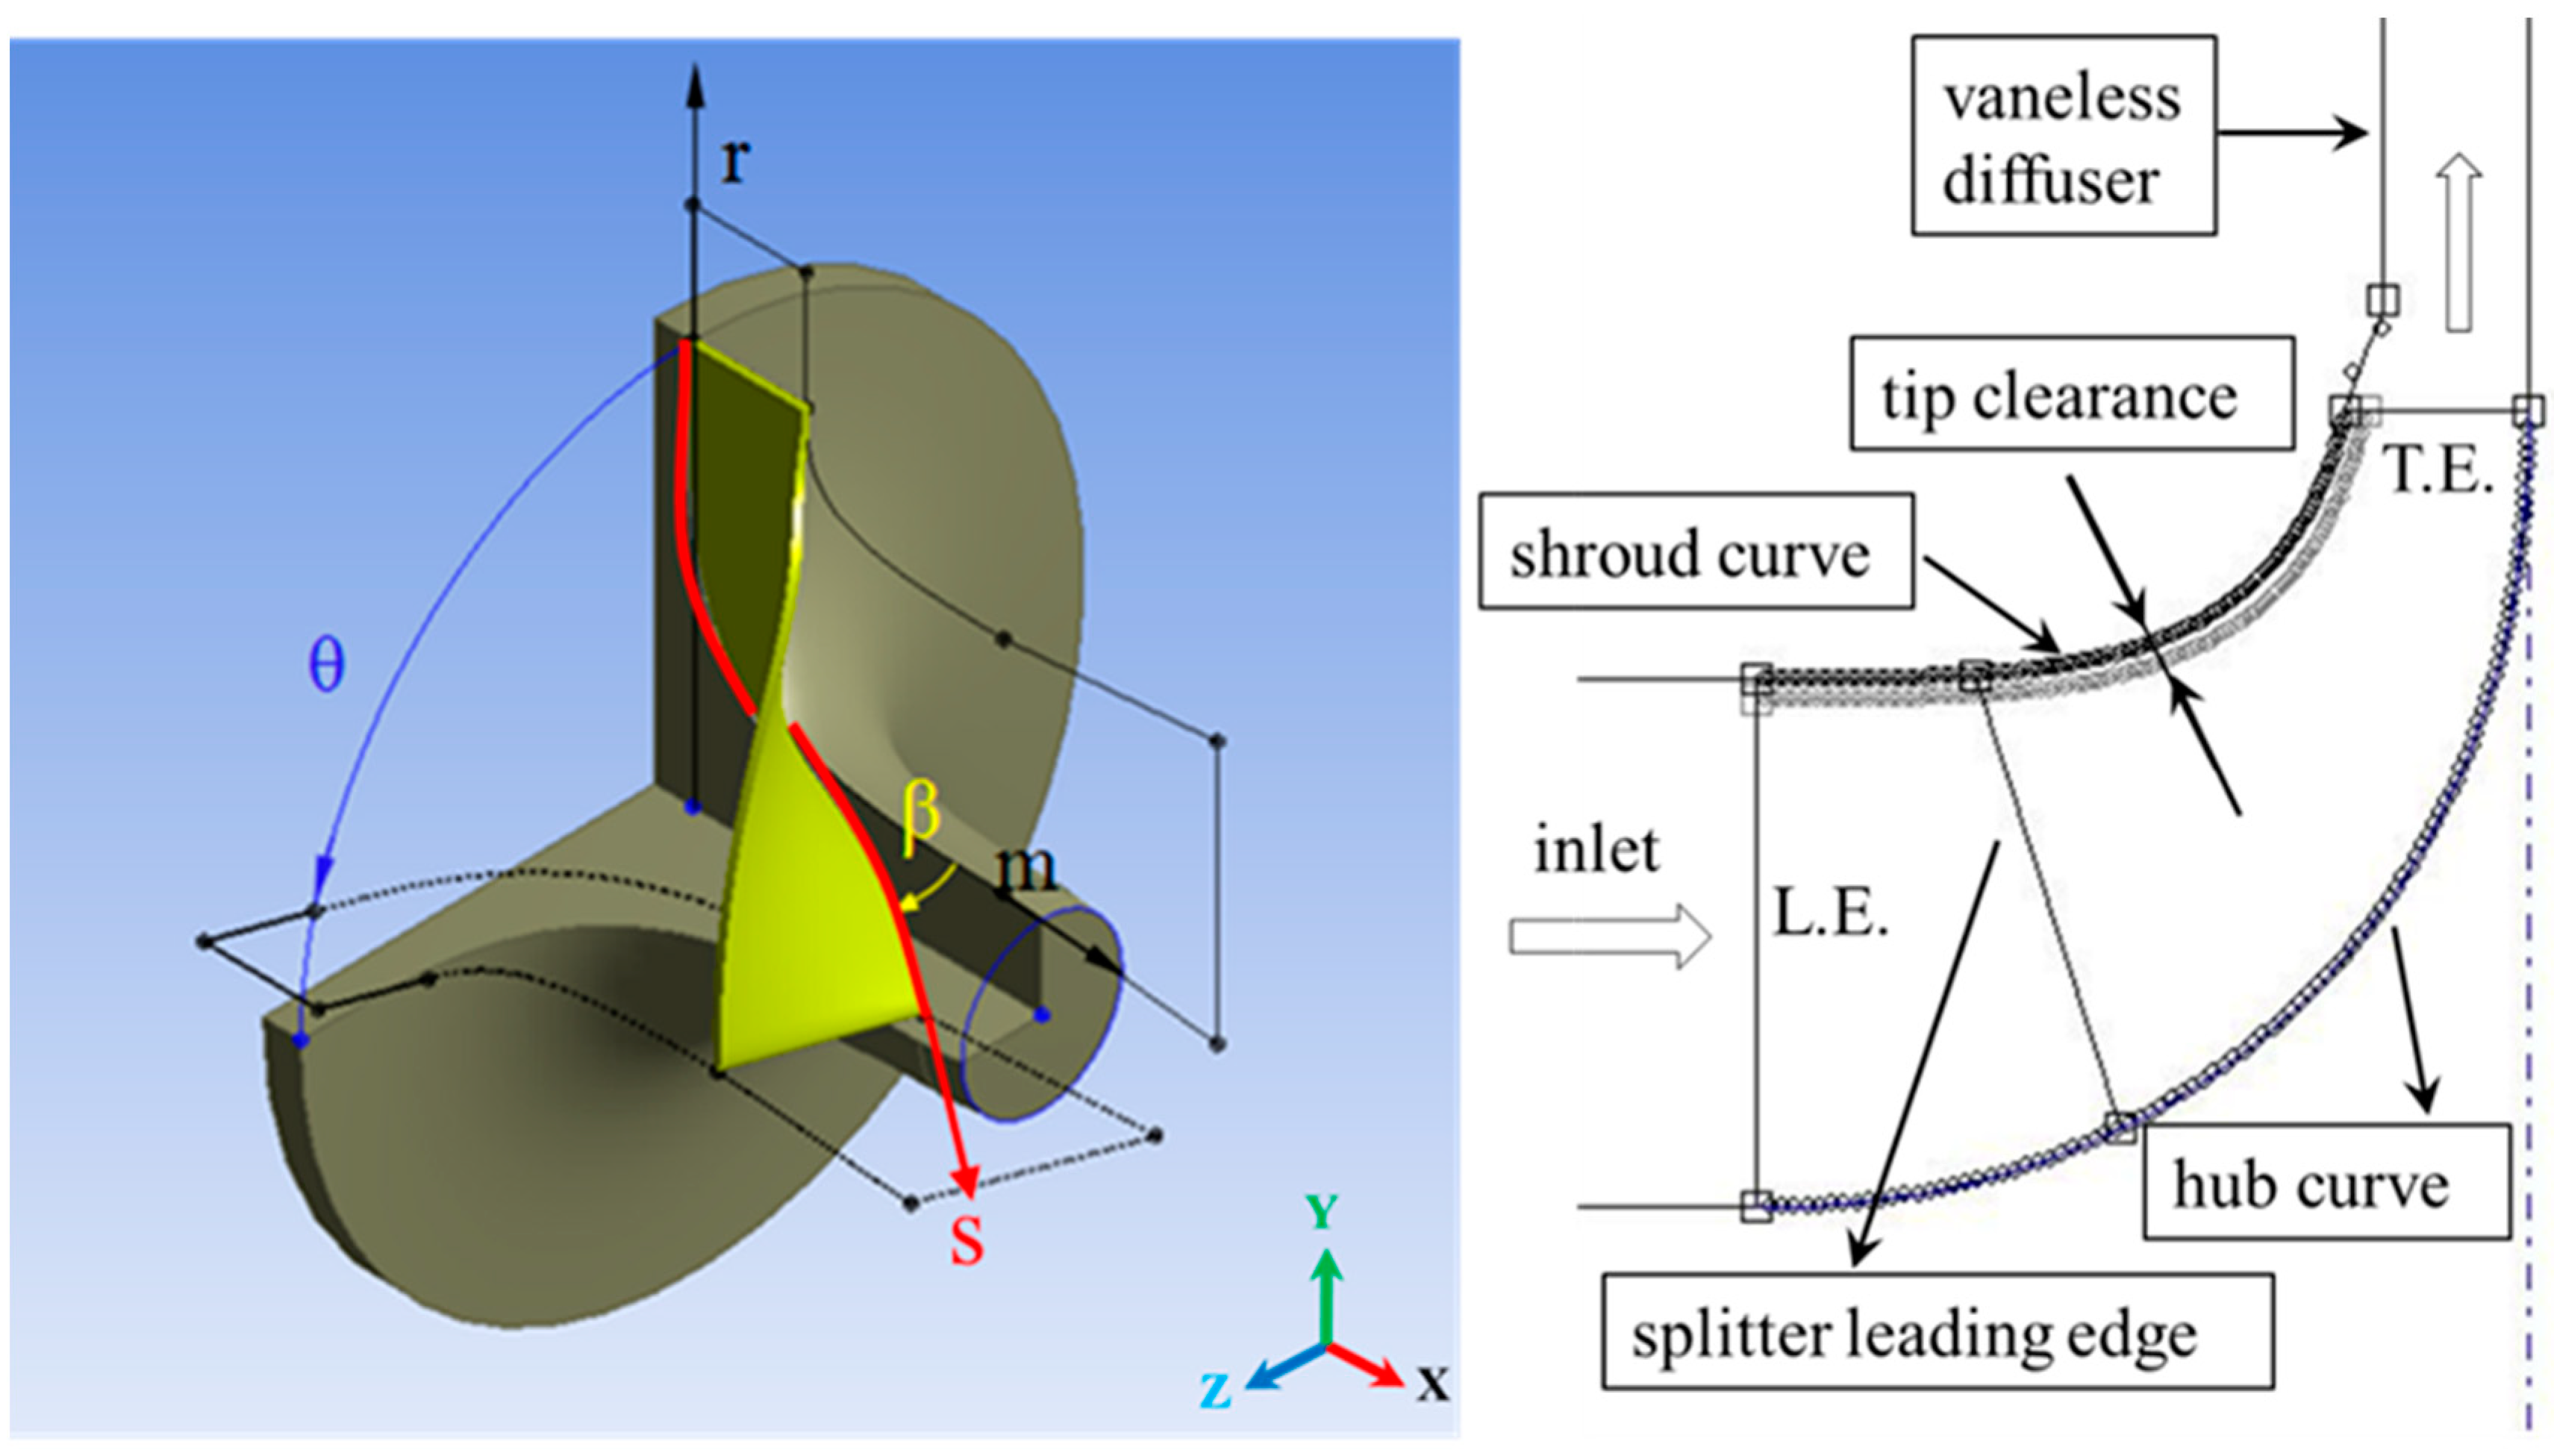
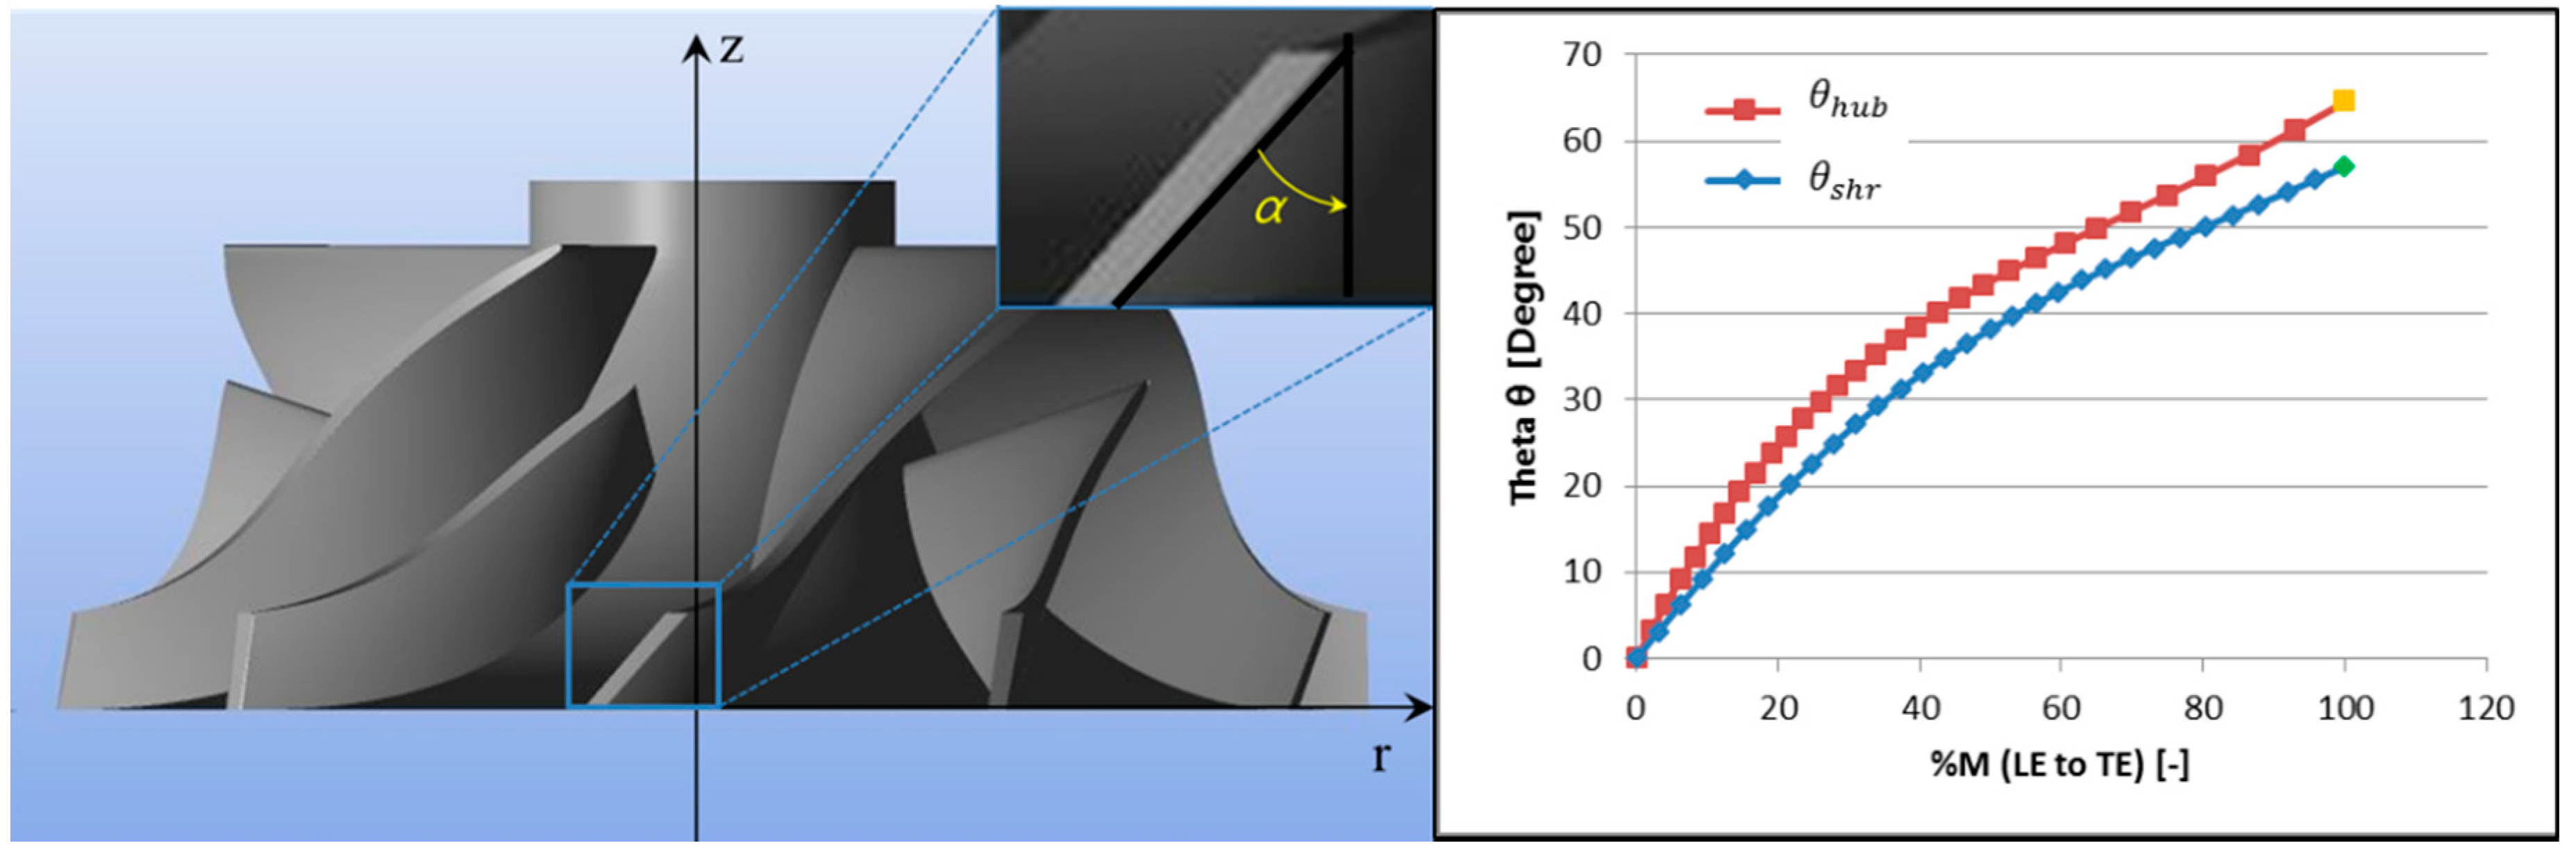
2. Geometry Parameterization

In the standard geometry definition of the radial impeller, the parameterized hub and shroud curves coupled with beta distribution, which is the angle between the meridional plane (m) and blade camber line (s) (Figure 1), are generally considered [16]. In this study, in particular, the beta distribution itself on the main blade is parameterized and investigated with additional parameters of the splitter leading edge to optimize the compressor aerodynamically.

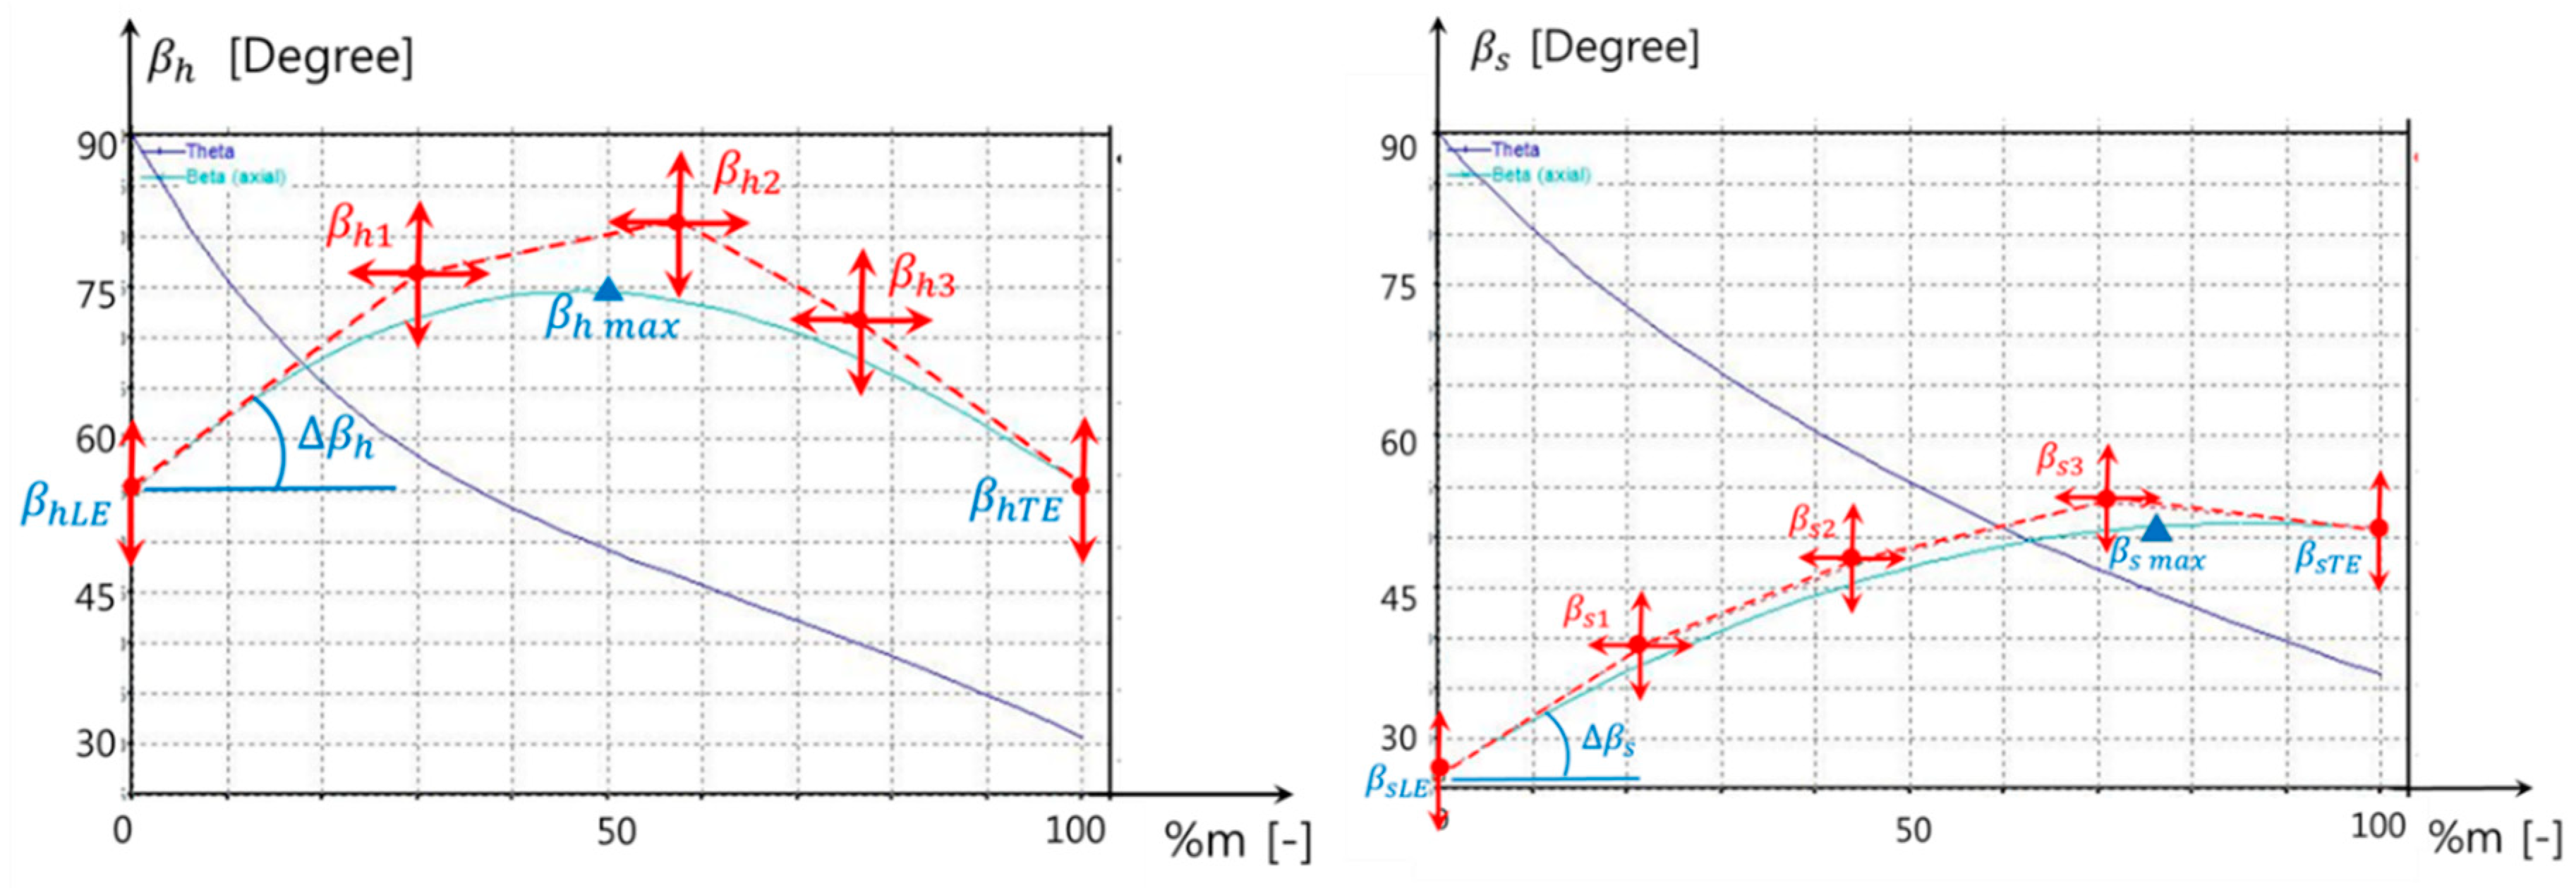
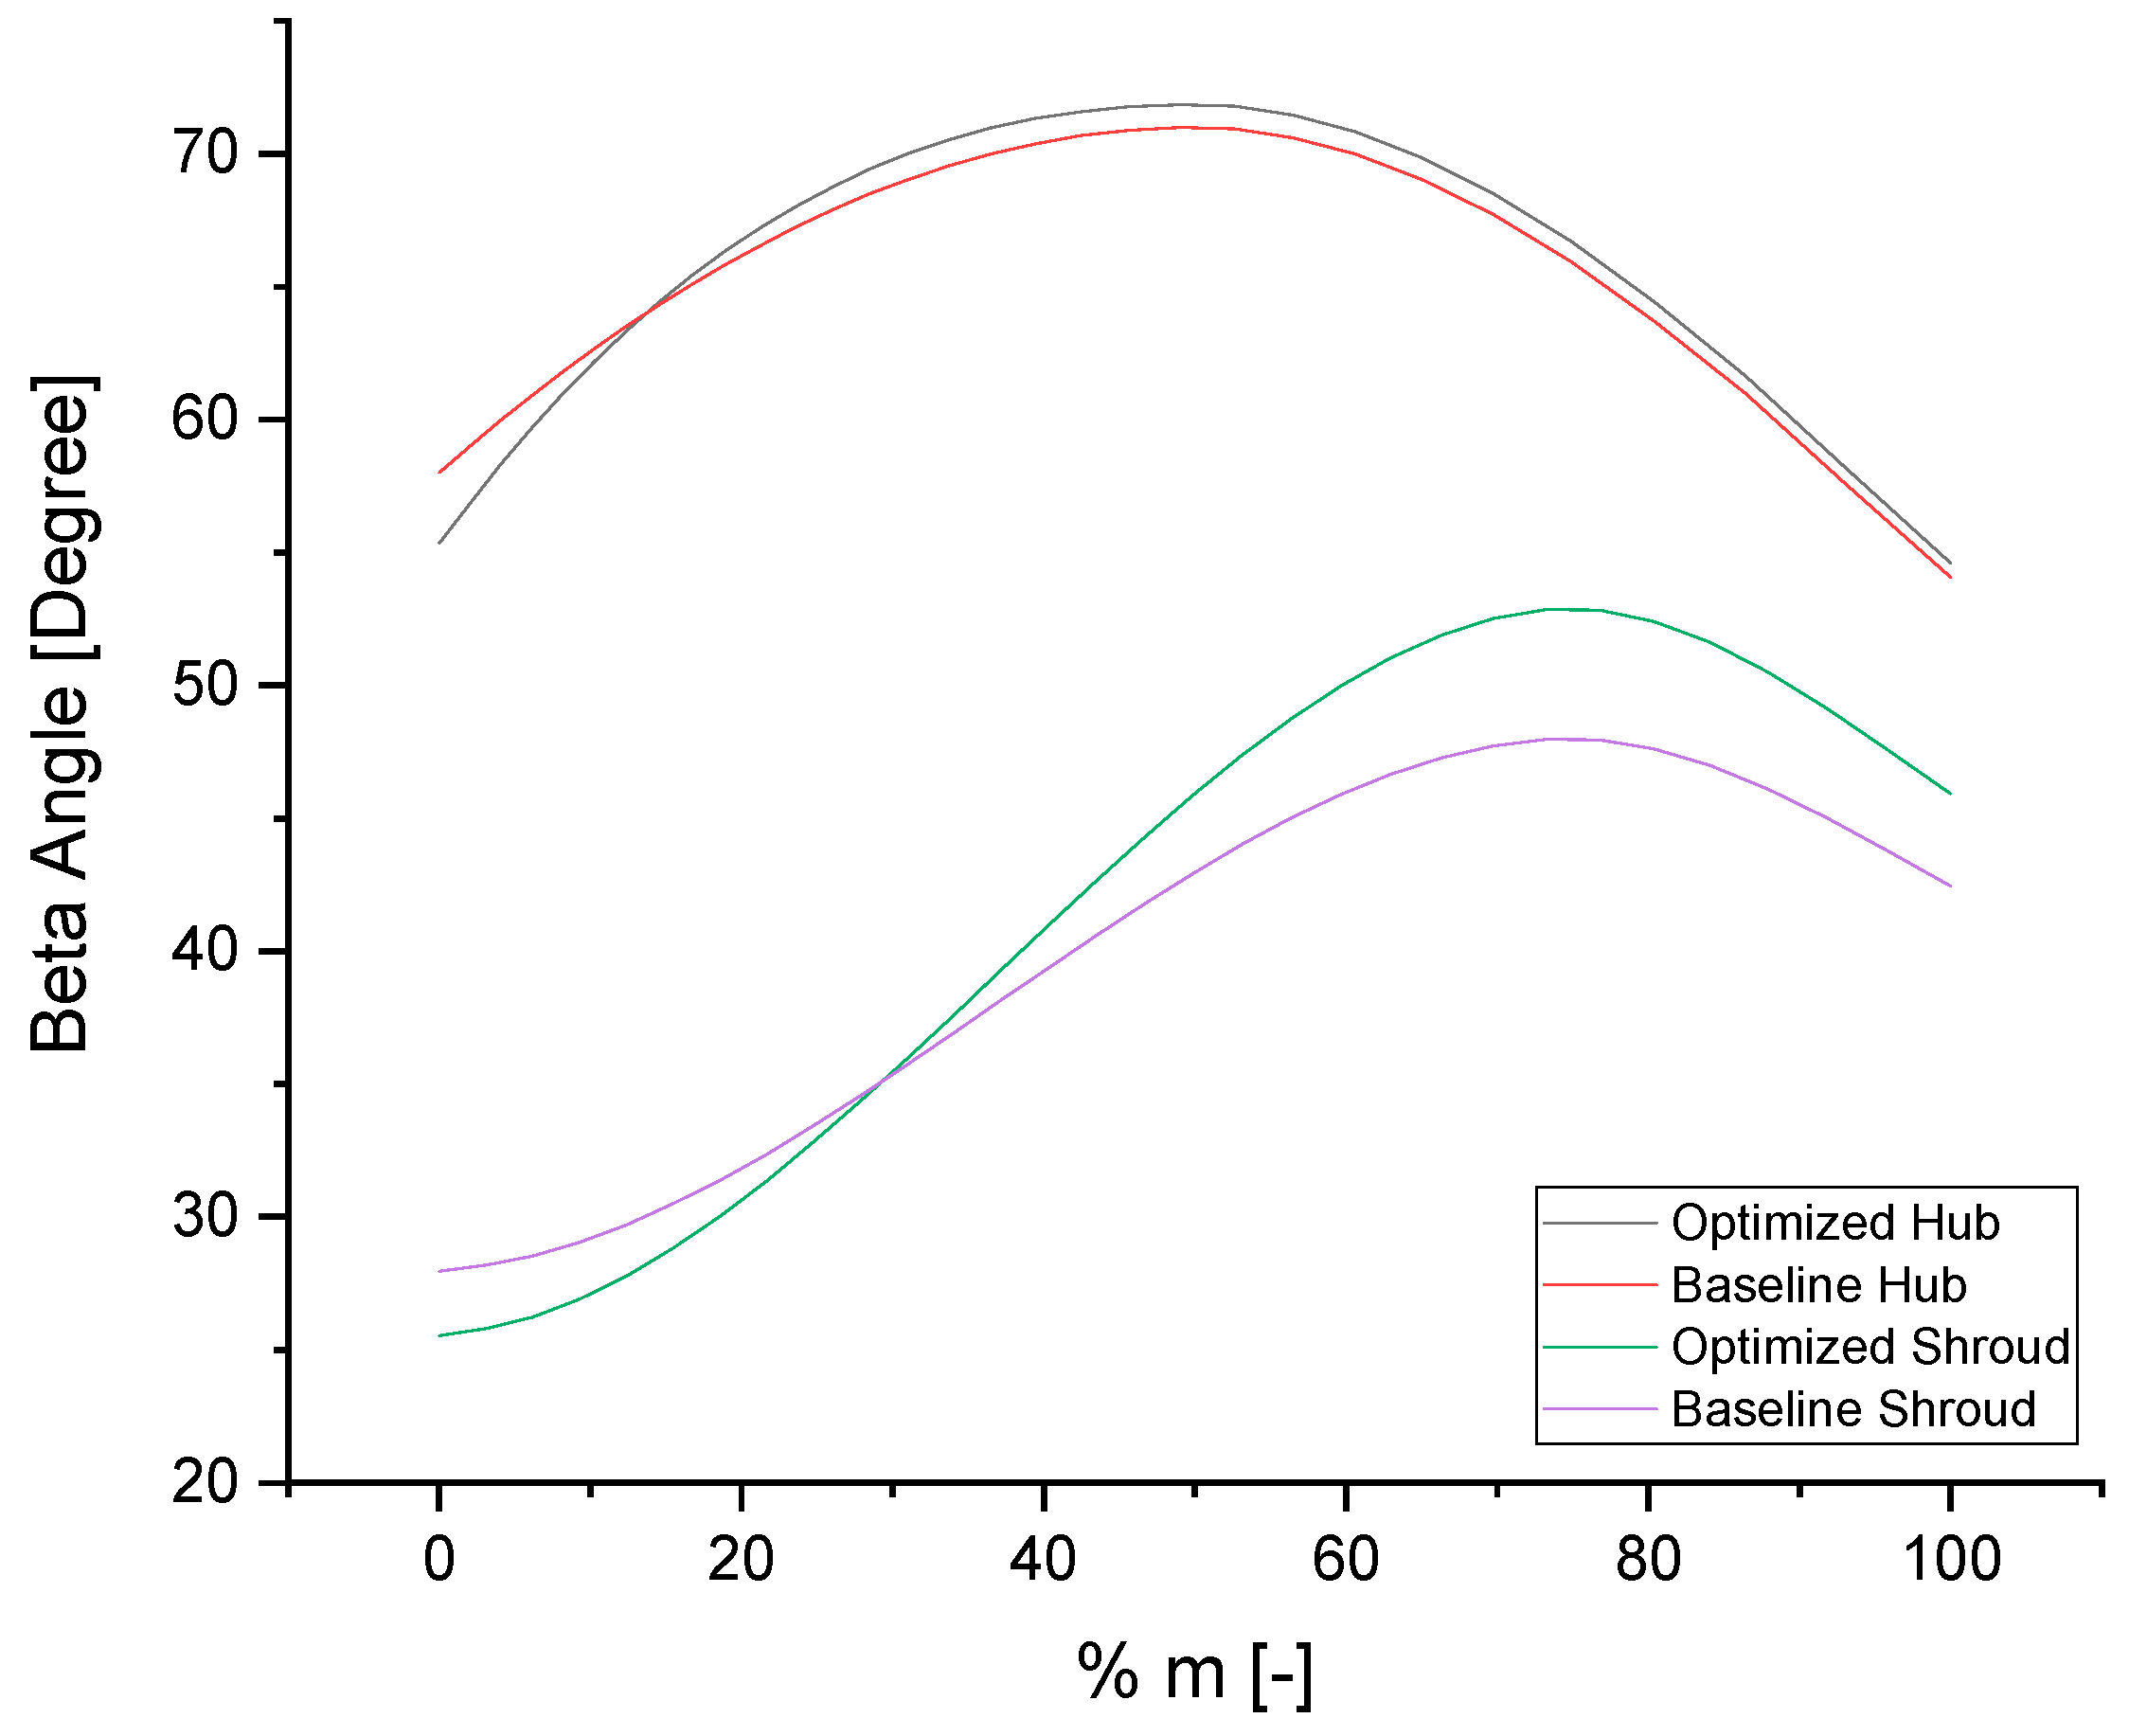
2.1. Parameterization of the Main Blade by the Beta Distribution

The beta angle distributions at the hub and shroud are defined by four-degree Bezier polynomials with three internal points (Figure 2) as follows:
β h   =   β h , L E   ( 1 m ) 4 + 4 β h 1 m ( 1 m ) 3 + 6 β h 2   m 2 ( 1 m 2 ) + 4 β h 3 m 3 ( 1 m ) + β h , T E m 4
β s   =   β s , L E   ( 1 m ) 4 + 4 β s 1 m ( 1 m ) 3 + 6 β s 2   m 2 ( 1 m 2 ) + 4 β s 3 m 3 ( 1 m ) + β s , T E m 4
whereby m is the normalized meridional distance (length), which varies from 0 to 1 along the meridional contour of the impeller from the leading edge (LE) to trailing edge (TE) [2], and β h , L E and β h , T E are the blade angles at the hub leading edge and trailing edge, respectively; similarly, β s , L E and β s , T E are the blade angles of the shroud curve. Figure 2 shows that the beta distribution are controlled by five points for both the hub and shroud curves. However, instead of selecting all five points as design parameters for the optimization process, some of them can be removed owing to creating other design parameters in Figure 2, such as β h , m a x and Δ β h . These mentioned parameters are mostly controlled by β h 1 , β h 2 , β h 3 at the hub profile; likewise, β s 1 , β s 2 , β s 3 control points direct to β s , m a x and Δ β s . Therefore we set four parameters ( β h , L E , Δ β h , β h , m a x , and β h , T E ) to define the hub profile and four parameters ( β s , L E , Δ β s , β s , m a x , β s , T E ) to define the shroud profile.
Nevertheless, controlling the maximum point of the beta angle is limited by the meridional length. On the hub curve, β h , m a x is fixed as 50% of the meridional length; correspondingly, β s , m a x is fixed as 75% of the meridional length. In addition, another limitation is considered for the lean angle (rake angle) during the designing of the compressor (Figure 3). The maximum lean angle is set as 45° [16] from axial owing to a manufacturing issue. To calculate the lean angle, first, the blade camber line circumferential angle θ needs to be obtained by Equation (3).
r d θ = d m tan β
Afterward, restriction on a lean angle is easily adapted using Equation (4):
( tan α ) b 2 = r ( θ T E ,   h u b θ T E ,   s h r )
whereby θ T E ,   h u b and θ T E ,   s h r are the circumferential angles of the trailing edge of the hub and shroud curves, respectively (determined in Figure 3 as orange and green markers), and b 2 is the blade height of trailing edge.

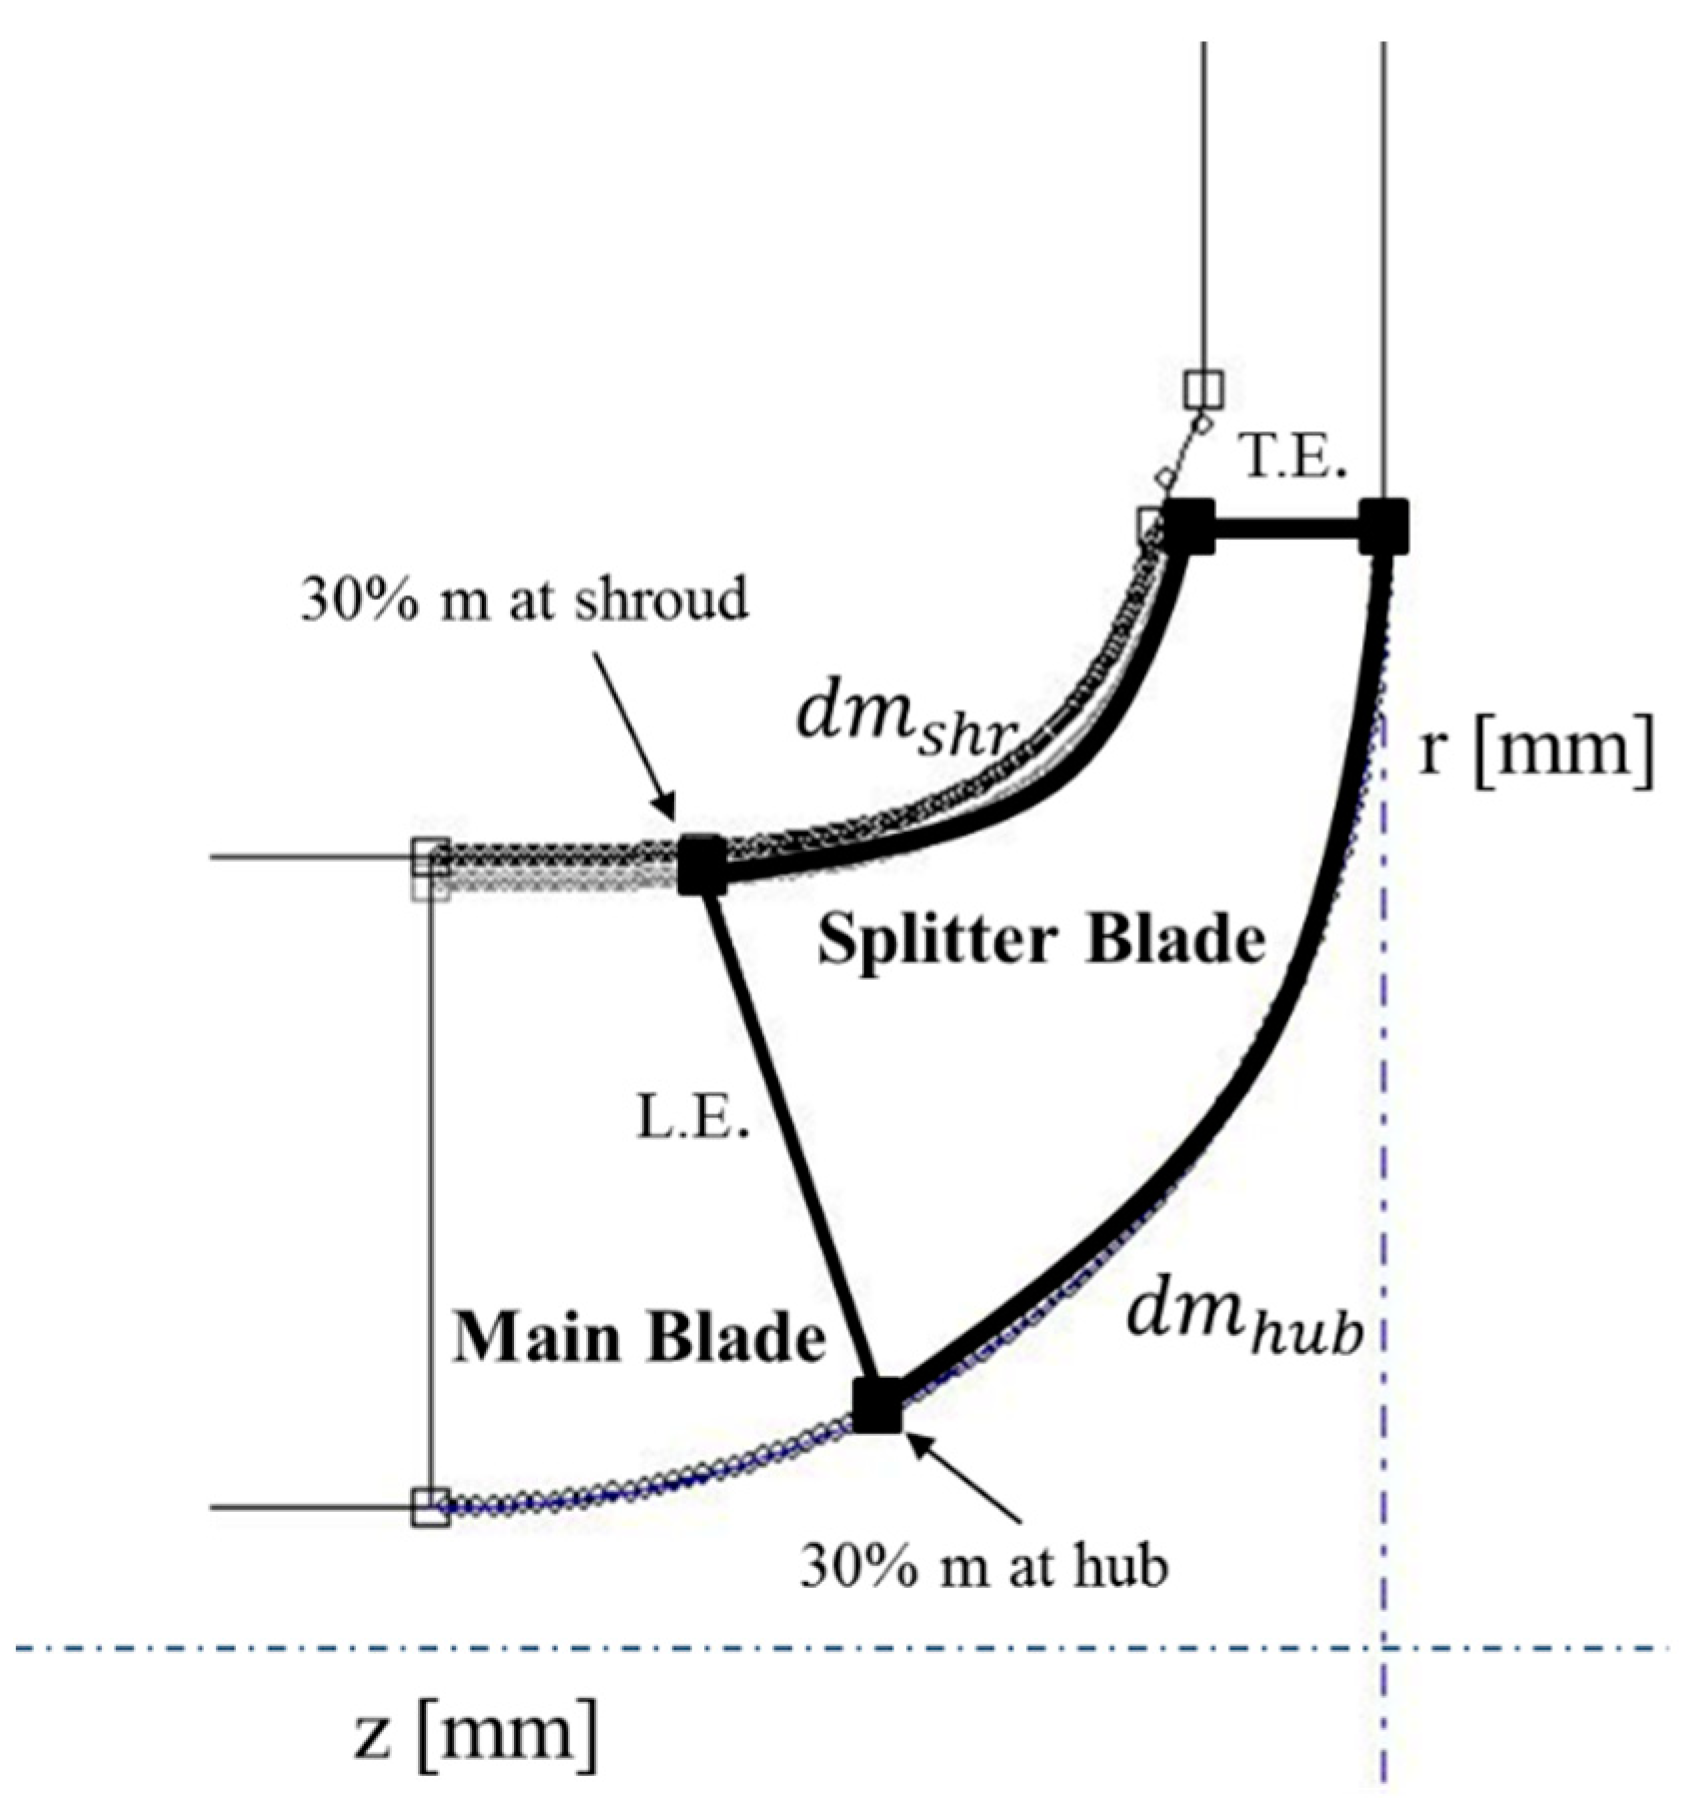
2.2. Parameterization of Splitter Blade by LE Location

As the number of the blades in the centrifugal compressor is increased, it is expected that pressure and efficiency will also increase. However, this results in increased fluid blockage and skin friction in the impeller, thereby decreasing effciency. It is mainly losses and blockages that occur inlet of the impeller [22]. To avoid this situation, instead of reducing the number of the blades, some blades are shortened, which creates the same blockage characteristic observed in impellers with fewer blades but yields a higher efficiency and pressure. Therefore, splitter blades are used as shortening blades that are generally located in the middle of the blade passage. It is essential to select the best location of the splitter leading edge to improve the impeller. Thus, in this study, we parameterized the leading edge location of the splitter blade; the hub ( d m h u b ) and shroud location ( d m s h r ) with respect to the meridional length (m%) were selected as design parameters to find the optimal leading edge position of the splitter blade (Figure 4). This was investigated after the first optimization process of a beta distribution.
A general mathematical form of the meridional length ( d m ) is as follows:
d m = d r 2 + d z 2
where r is the axial length and z is the radial length of the impeller (Figure 4).

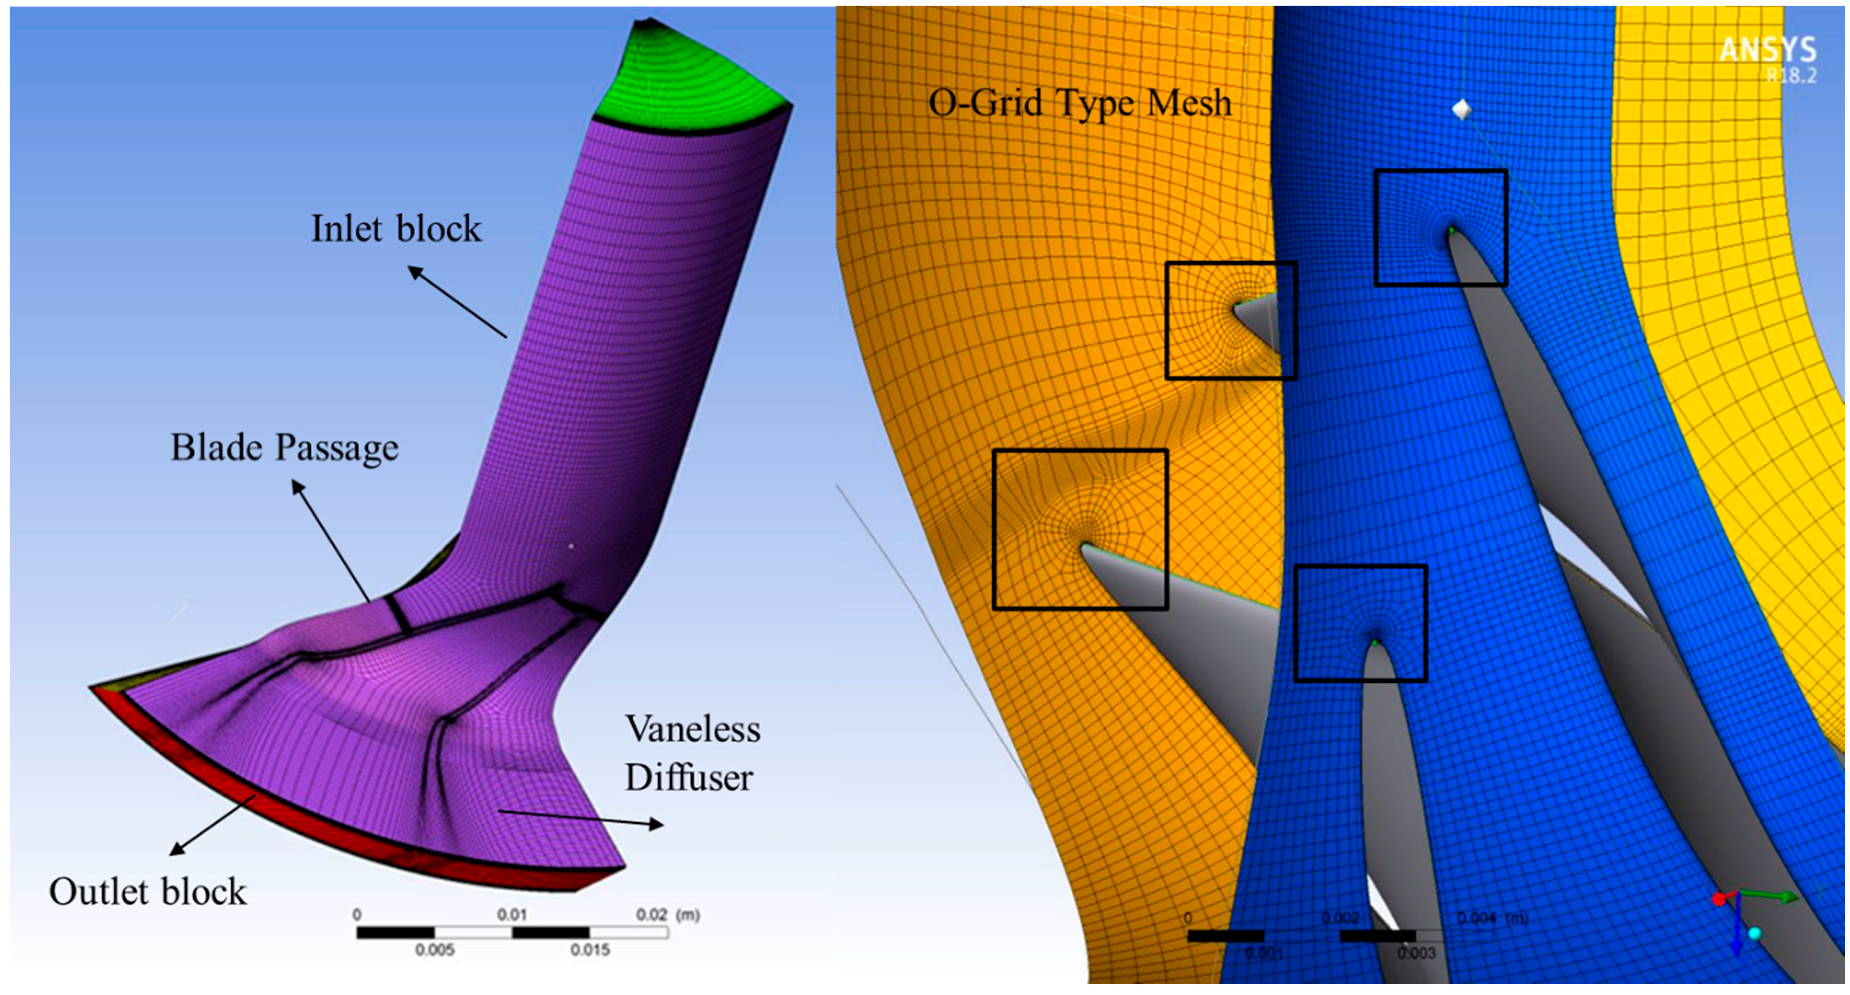
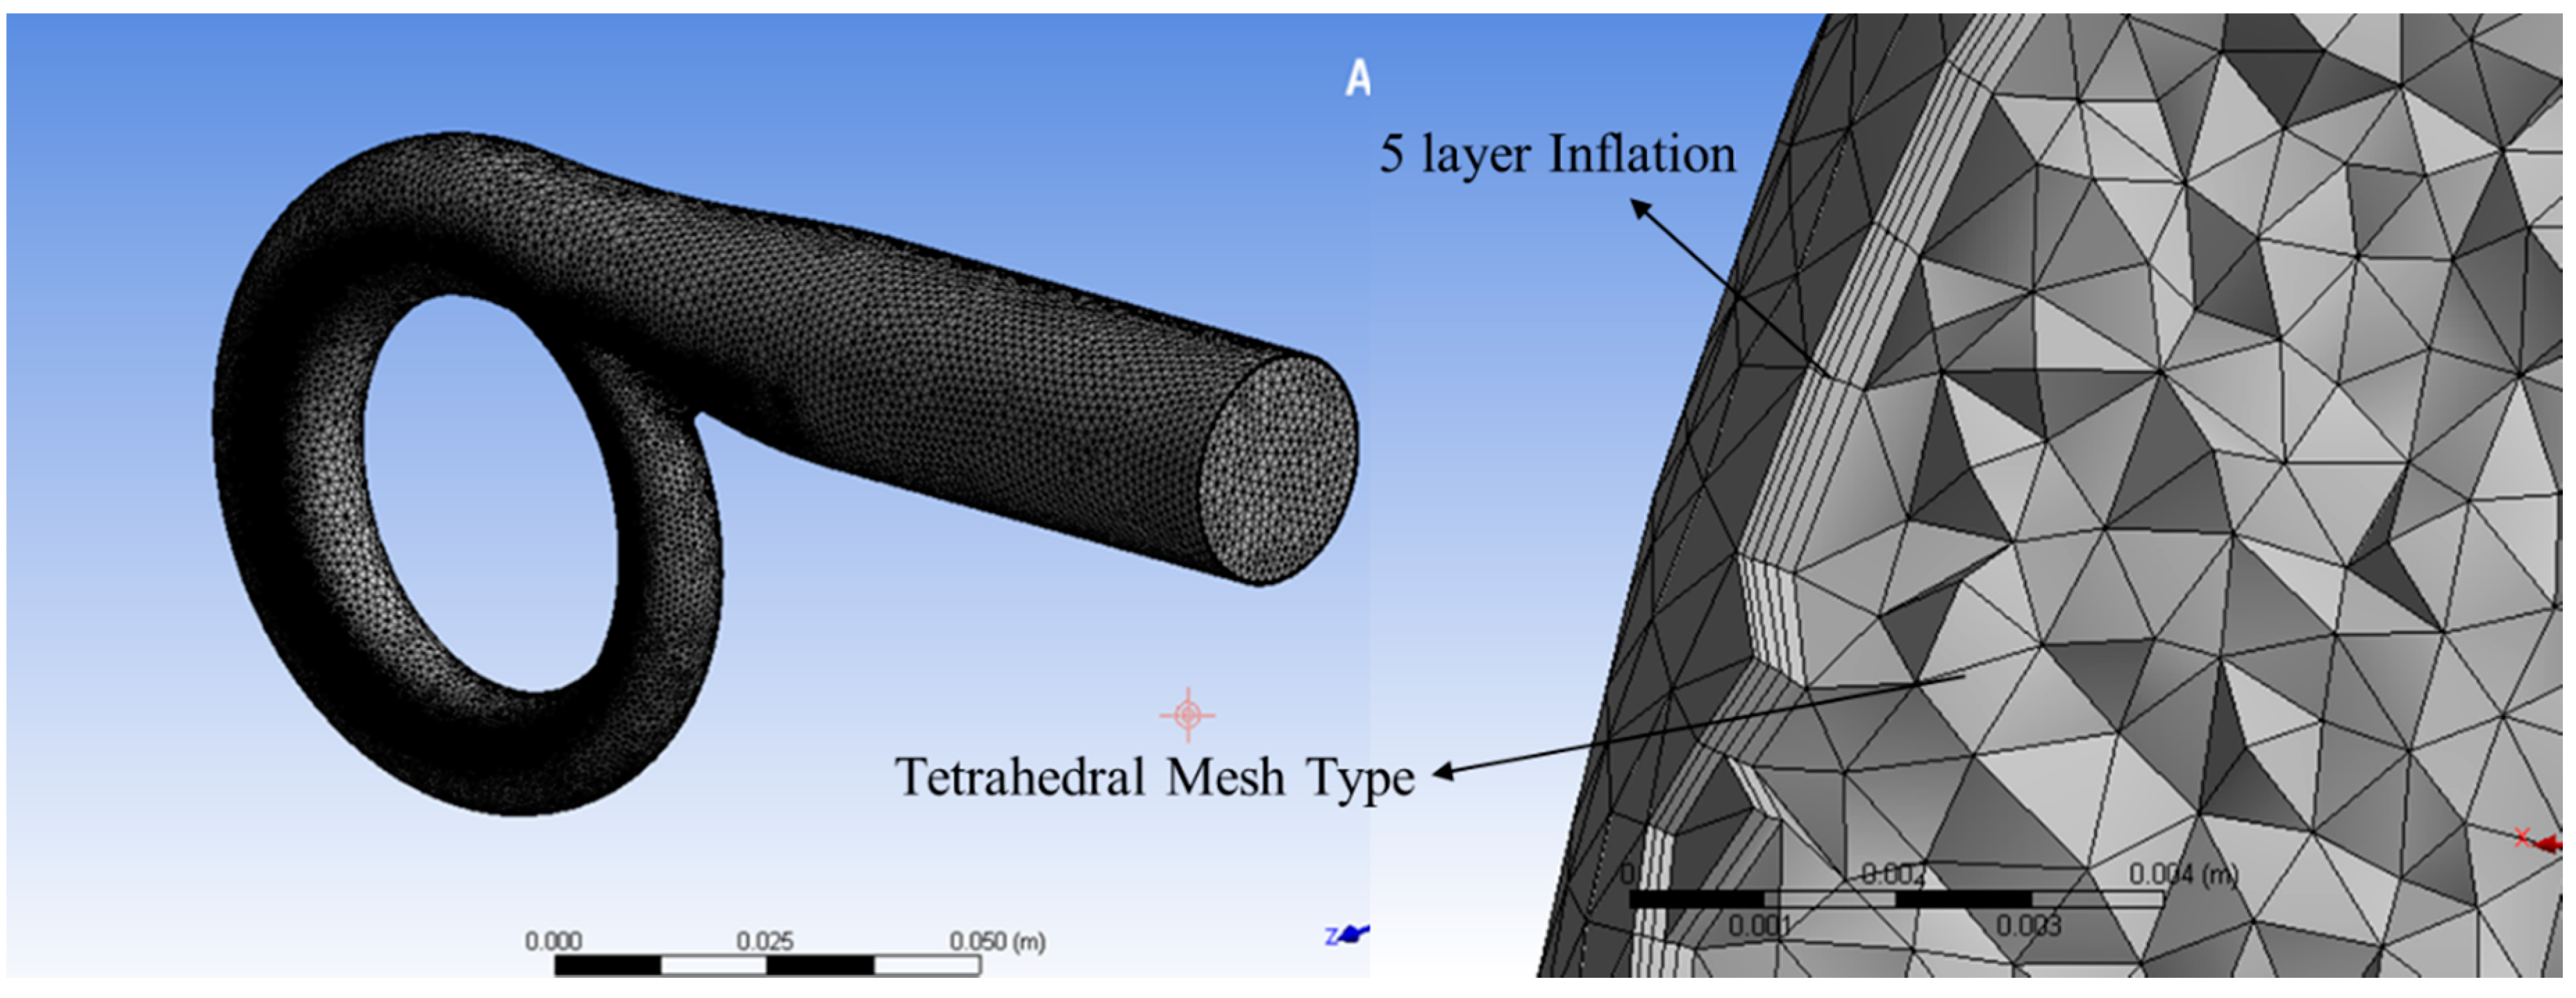
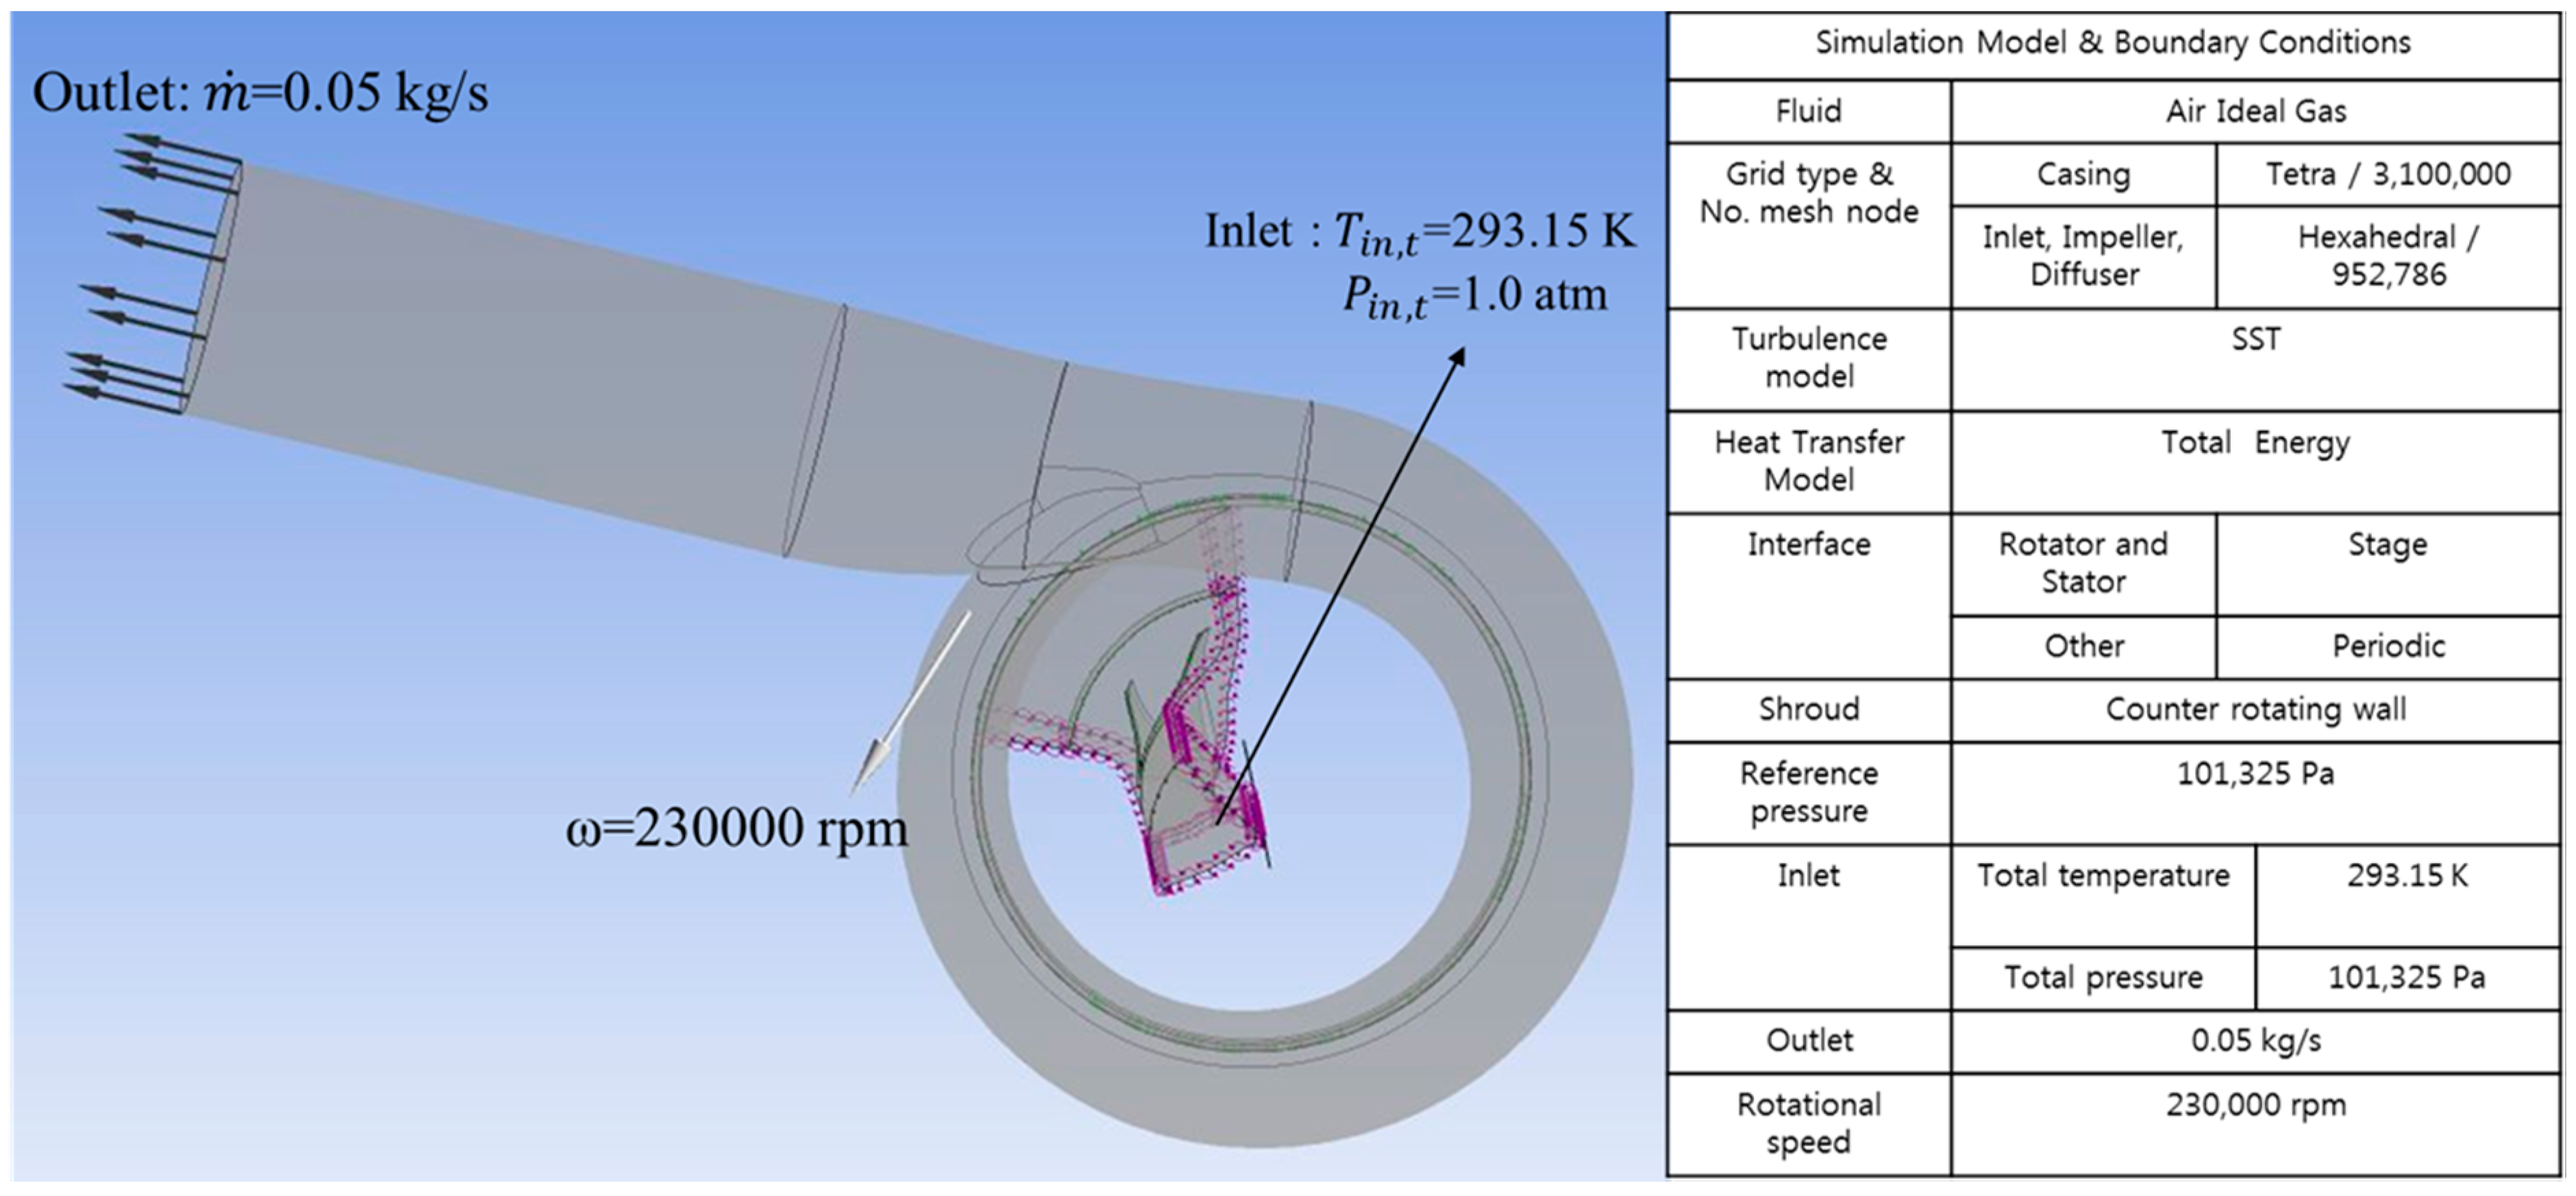
3. Numerical Analysis

3-D Modelling: Numerical analyses started with the 3-D design of the reference micro radial compressor (Table 1), which is obtained through the DOE of the assigned parameters, which are bounded as shown in Table 2. BladeGen [23] was used to design the impeller based on the selected parameters. Following this, the computational grid and flow analysis were generated through TurboGrid (for impeller)-Mesh(for volute) and ANSYS-CFX 18.2, respectively.
Computational Grid: The discretization of the computational domain is an important issue owing to its effect on the quality of the solution and also computational cost. Therefore, grid-independency analyses were evaluated to reduce the computational time with a good quality of mesh. To do so, five grid sizes with different size factors were investigated on the reference impeller, as the size factor controls the resolution of mesh in the TurboGrid [24]. Table 3 shows that reducing the size factor (from 1 to 0.7) provided a significant reduction on the computational time; however, it also resulted in reduced isentropic efficiency (appx. 2%) and pressure ratio (by 0.03 points). As is commonly known, an impeller mesh with less than 400,000 elements (Table 3—size factor 0.7) compromises the accuracy of the computational fluid dynamics (CFD) simulation, and a higher mesh number yields a better-quality solution. Therefore, higher size factor (1.1) was also investigated to achieve a more efficient result. However, even though approximately 0.5% efficiency improvement was observed in comparison with the standard size factor (1), the computational time was increased by up to 1 hour. As a result, a standard size factor “1”, which provided a mesh with 952,786 elements for both the main and splitter blades of the reference impeller that was provided by Keyyang Precision Co., was selected in the CFD simulation. (Each design based on DOE had a different element size, even though the size factor was “1”, owing to different geometries of the blade). An H/J/C/L grid hexahedral mesh type was used for the inducer (inlet), vaneless diffuser, and other regions, while the O-grid mesh type was used for the nearby LE and other blade surface regions [7,8] (Figure 5). Owing to periodicity, these meshes were applied only for one blade passage consisting of one main blade and one splitter blade to reduce computational time. Regarding volute, a tetrahedral mesh type with 3,100,000 elements was utilized, and five layers inflation was generated near the wall to confirm the value of y + was under 100 (Figure 6).
Near-wall spacing to y + for the impeller was calculated in the TurboGrid by setting the Reynolds number of the flow. Equation (6) [24] describes the y + with respect to the Reynolds number as follows:
Δ y = L Δ y + 80 R e x 1 / 14 1 R e L
where L is the chord length of each blade and is approximated as the algebraic average in the TurboGrid, Δ y + is the specified target of y + value, R e x is the Reynolds number based on the distance along the chord (LE to TE), and R e L is the Reynolds number based on the chord length. R e x is estimated as a specified value of R e L [24]. Therefore, it is enough to set R e L to the specified y + . In our study, the Reynolds number of flow was set as 4.4 × 10⁵ so that a shear-stress transport (SST) turbulence model [25] was adopted near by the wall. Turbulence modelling is an important criterion to acquire precise wall shear stresses. The SST model is a combination of and has smooth transition between the k-ω and k-ε turbulence model; k-ω provides better compromises near the wall and k-ε gives a better solution in the bulk domain [25]. When using the SST model in ANSYS-CFX, y + should be under 300, so that the wall function approach is valid [26]. In this research, automatic wall function, which automatically switches from the wall-functions to low-Re near wall formulation as the mesh is refined, is used for the SST model [26].
Boundary Conditions and CFD Solver: To solve the fluid domain computationally, setting the proper boundary conditions and solver types are critical concerns for an accurate result. At the inlet, air as an ideal gas was considered as the working fluid. Total pressure and total temperature were selected as 1.0 atm and 293.15 K, respectively. At the outlet, the designed mass flow rate was set as 0.05 kg/s, and other boundaries were selected as No-slip Wall type, except for the blade shroud, which had a counter-rotating wall. A stage interface was used between the rotor-stator, and a periodic interface was selected for other connections. Tip clearance was set as 0.3 mm, and heat transfer was chosen as total energy, which is appropriate for Mach numbers higher than 0.3 in the fluid domain (Figure 7).
In the CFD simulation, governing equations were discretized using the three-dimensional finite-volume method; a high-resolution advection scheme is used to solve the equations more accurately in this study. Furthermore, convergence criteria were determined by ensuring the root-mean-square(RMS) values of mass and momentum were under 1 × 10⁻⁵ and imbalances in mass, momentum, and energy were below 1 × 10⁻². An auto time scale was used with a scale factor of 10 to control the convergence of the solution. After approximately 600 iterations, the converged solution was obtained. Simulations were performed by a PC with a 2.00 GHz Intel Xeon CPU, and it took almost six hours to complete the simulation, depending on the geometry and convergence of the solution.

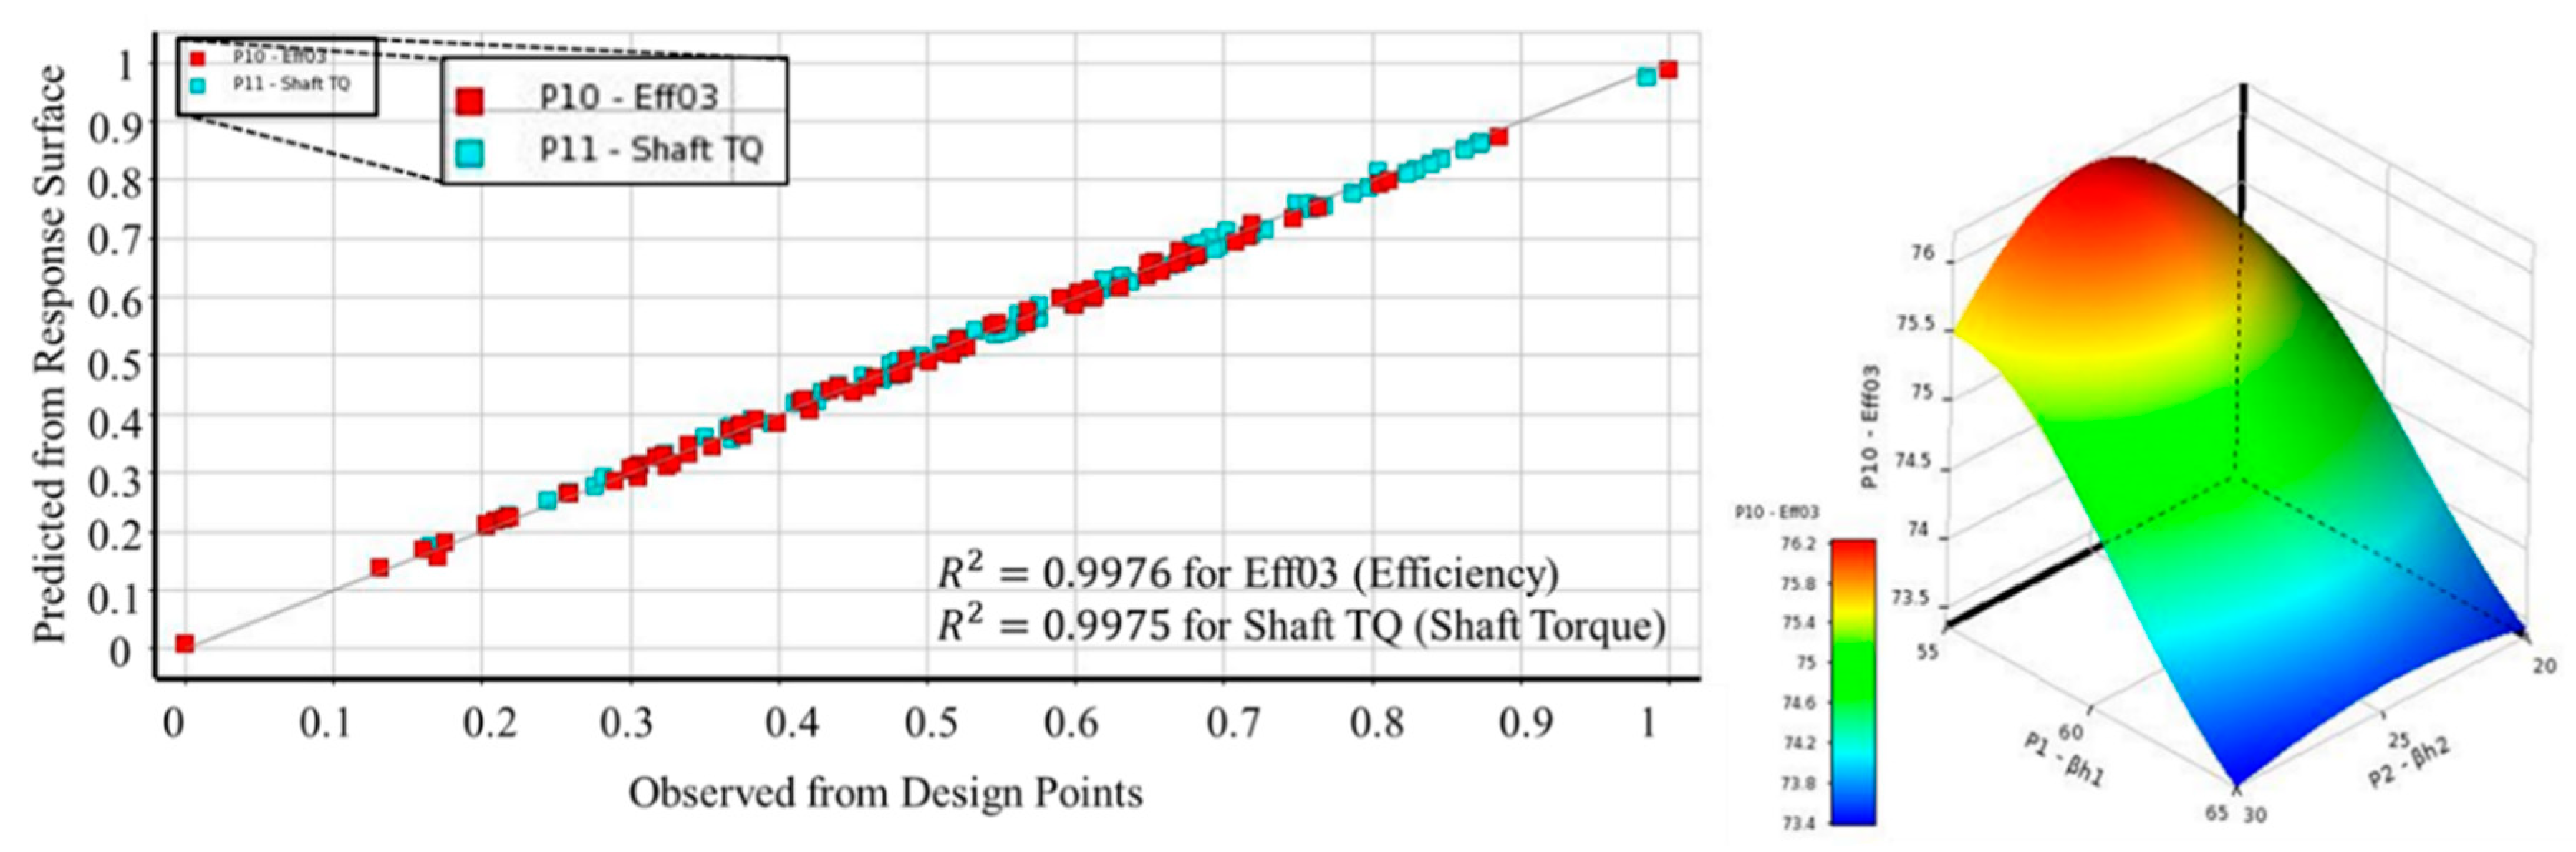
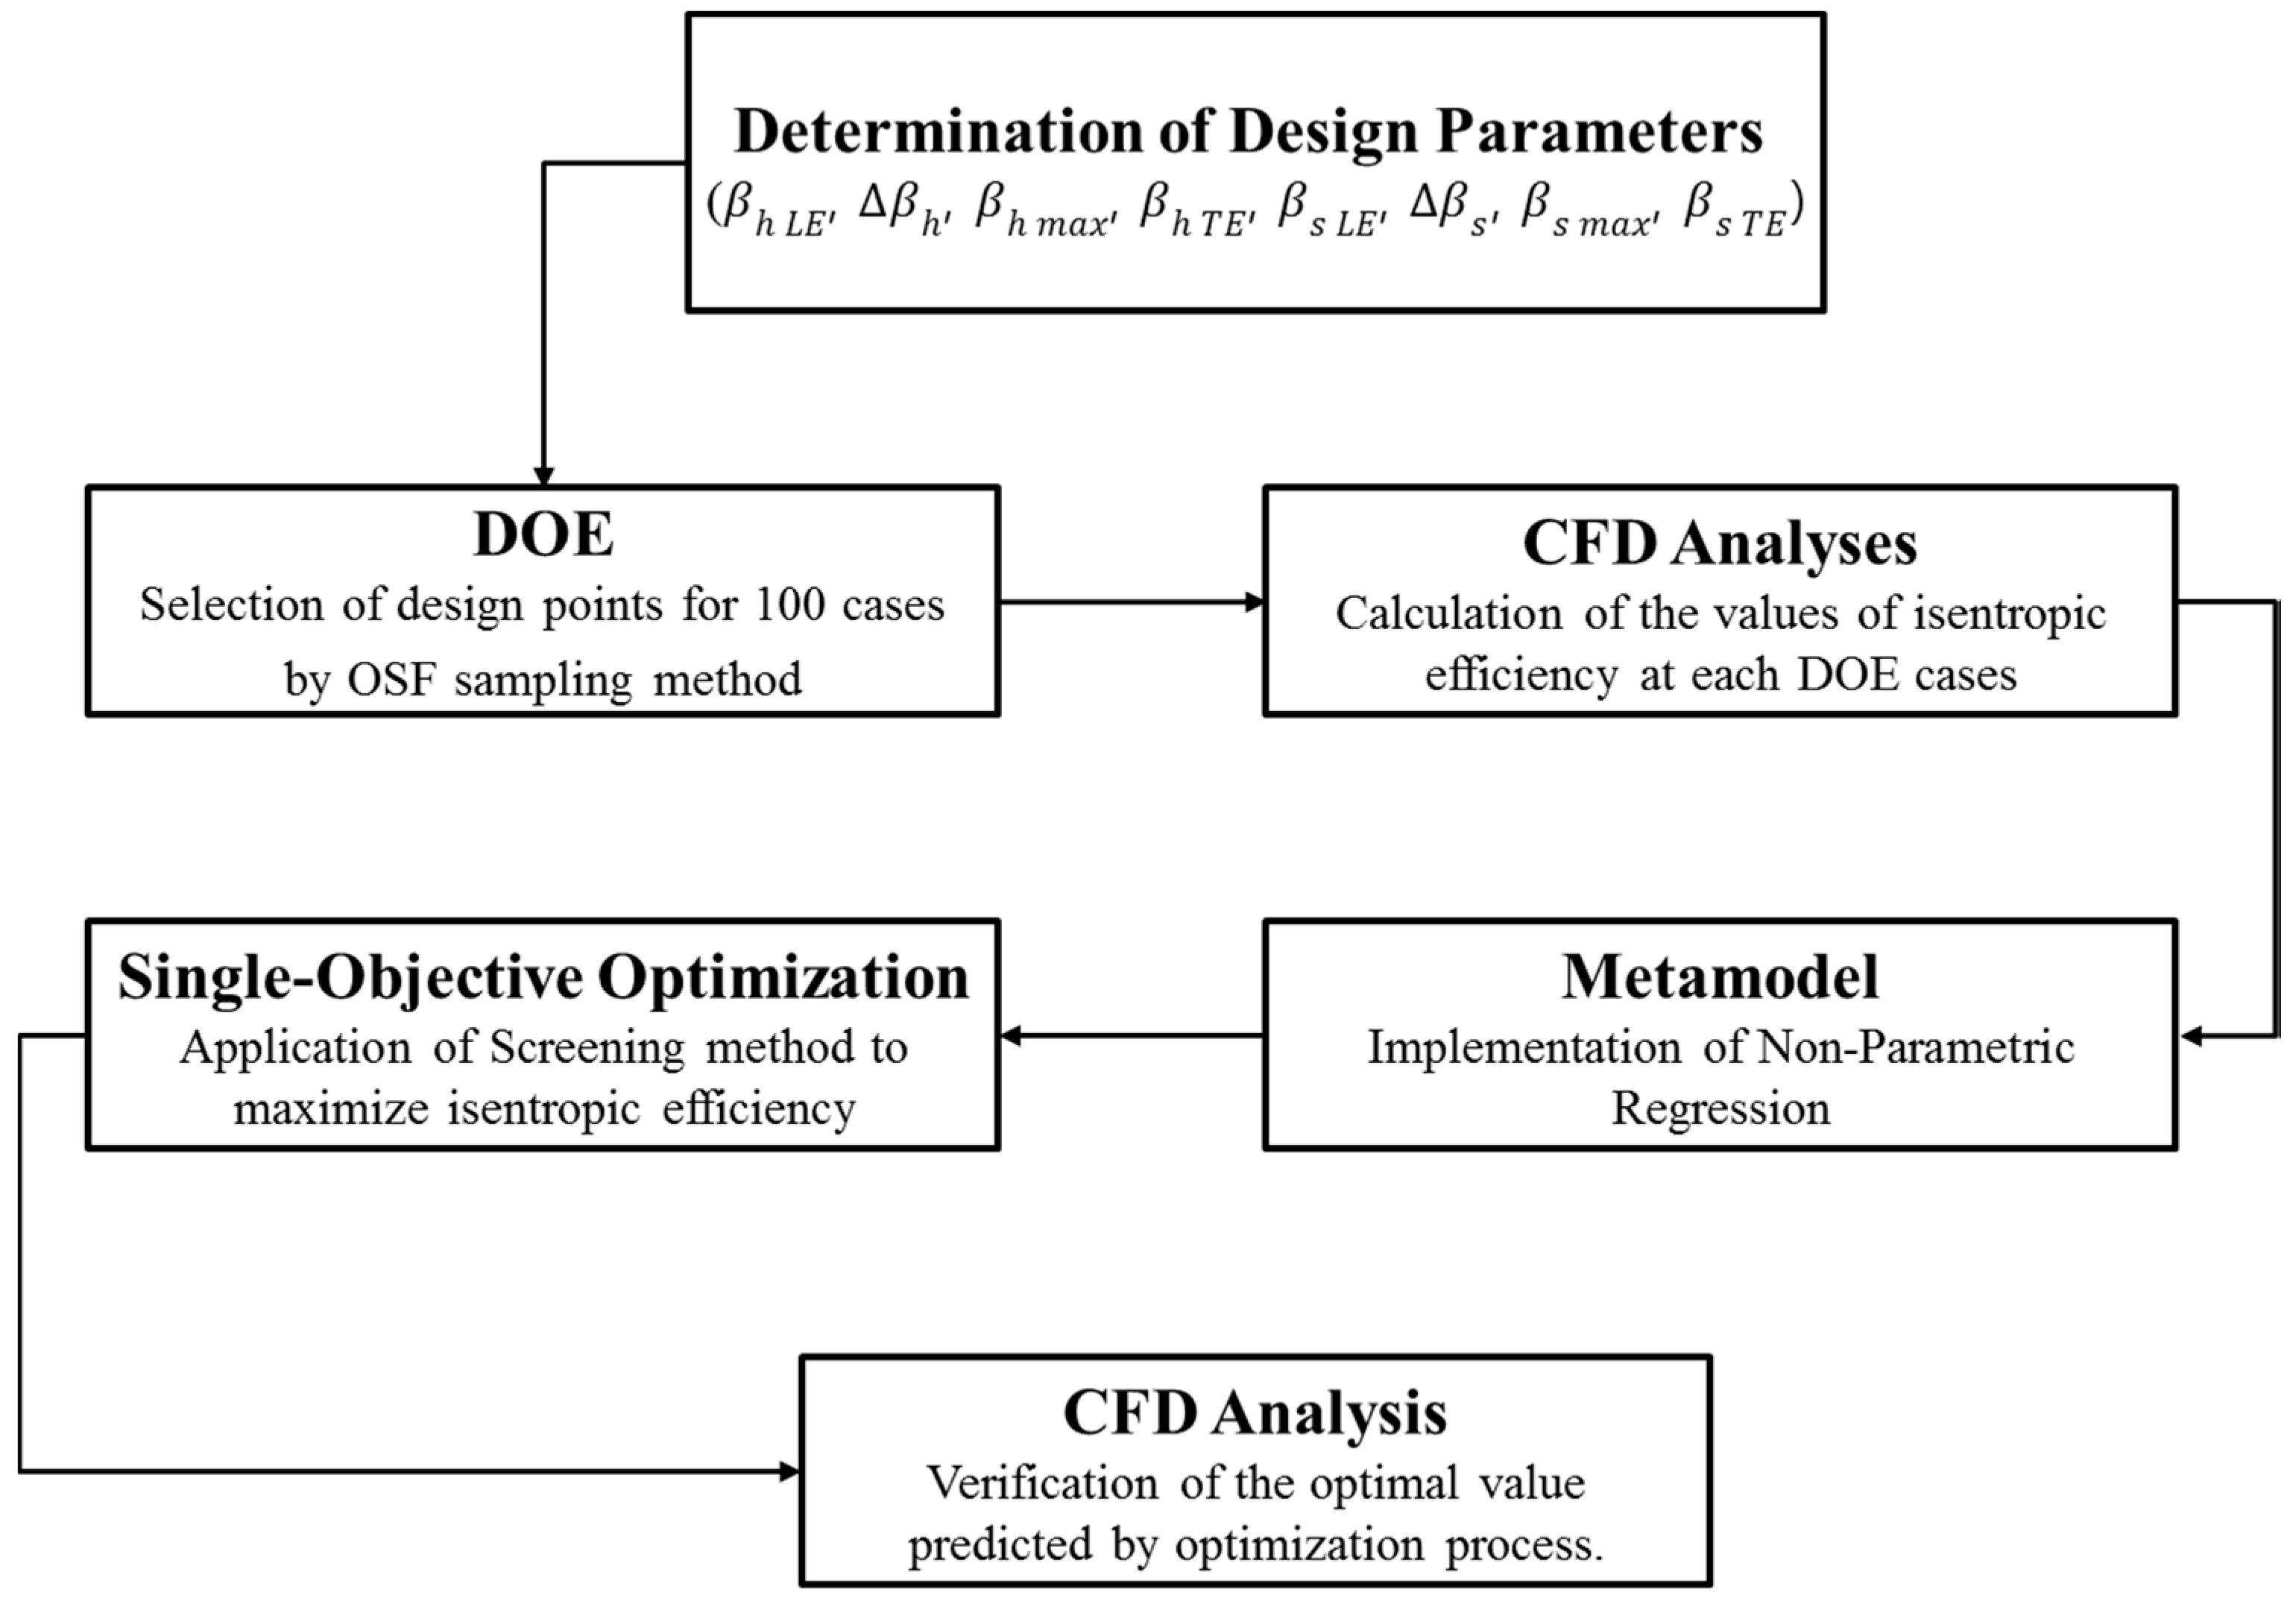
4. Surrogate Method with Single-Objective Optimization and Results

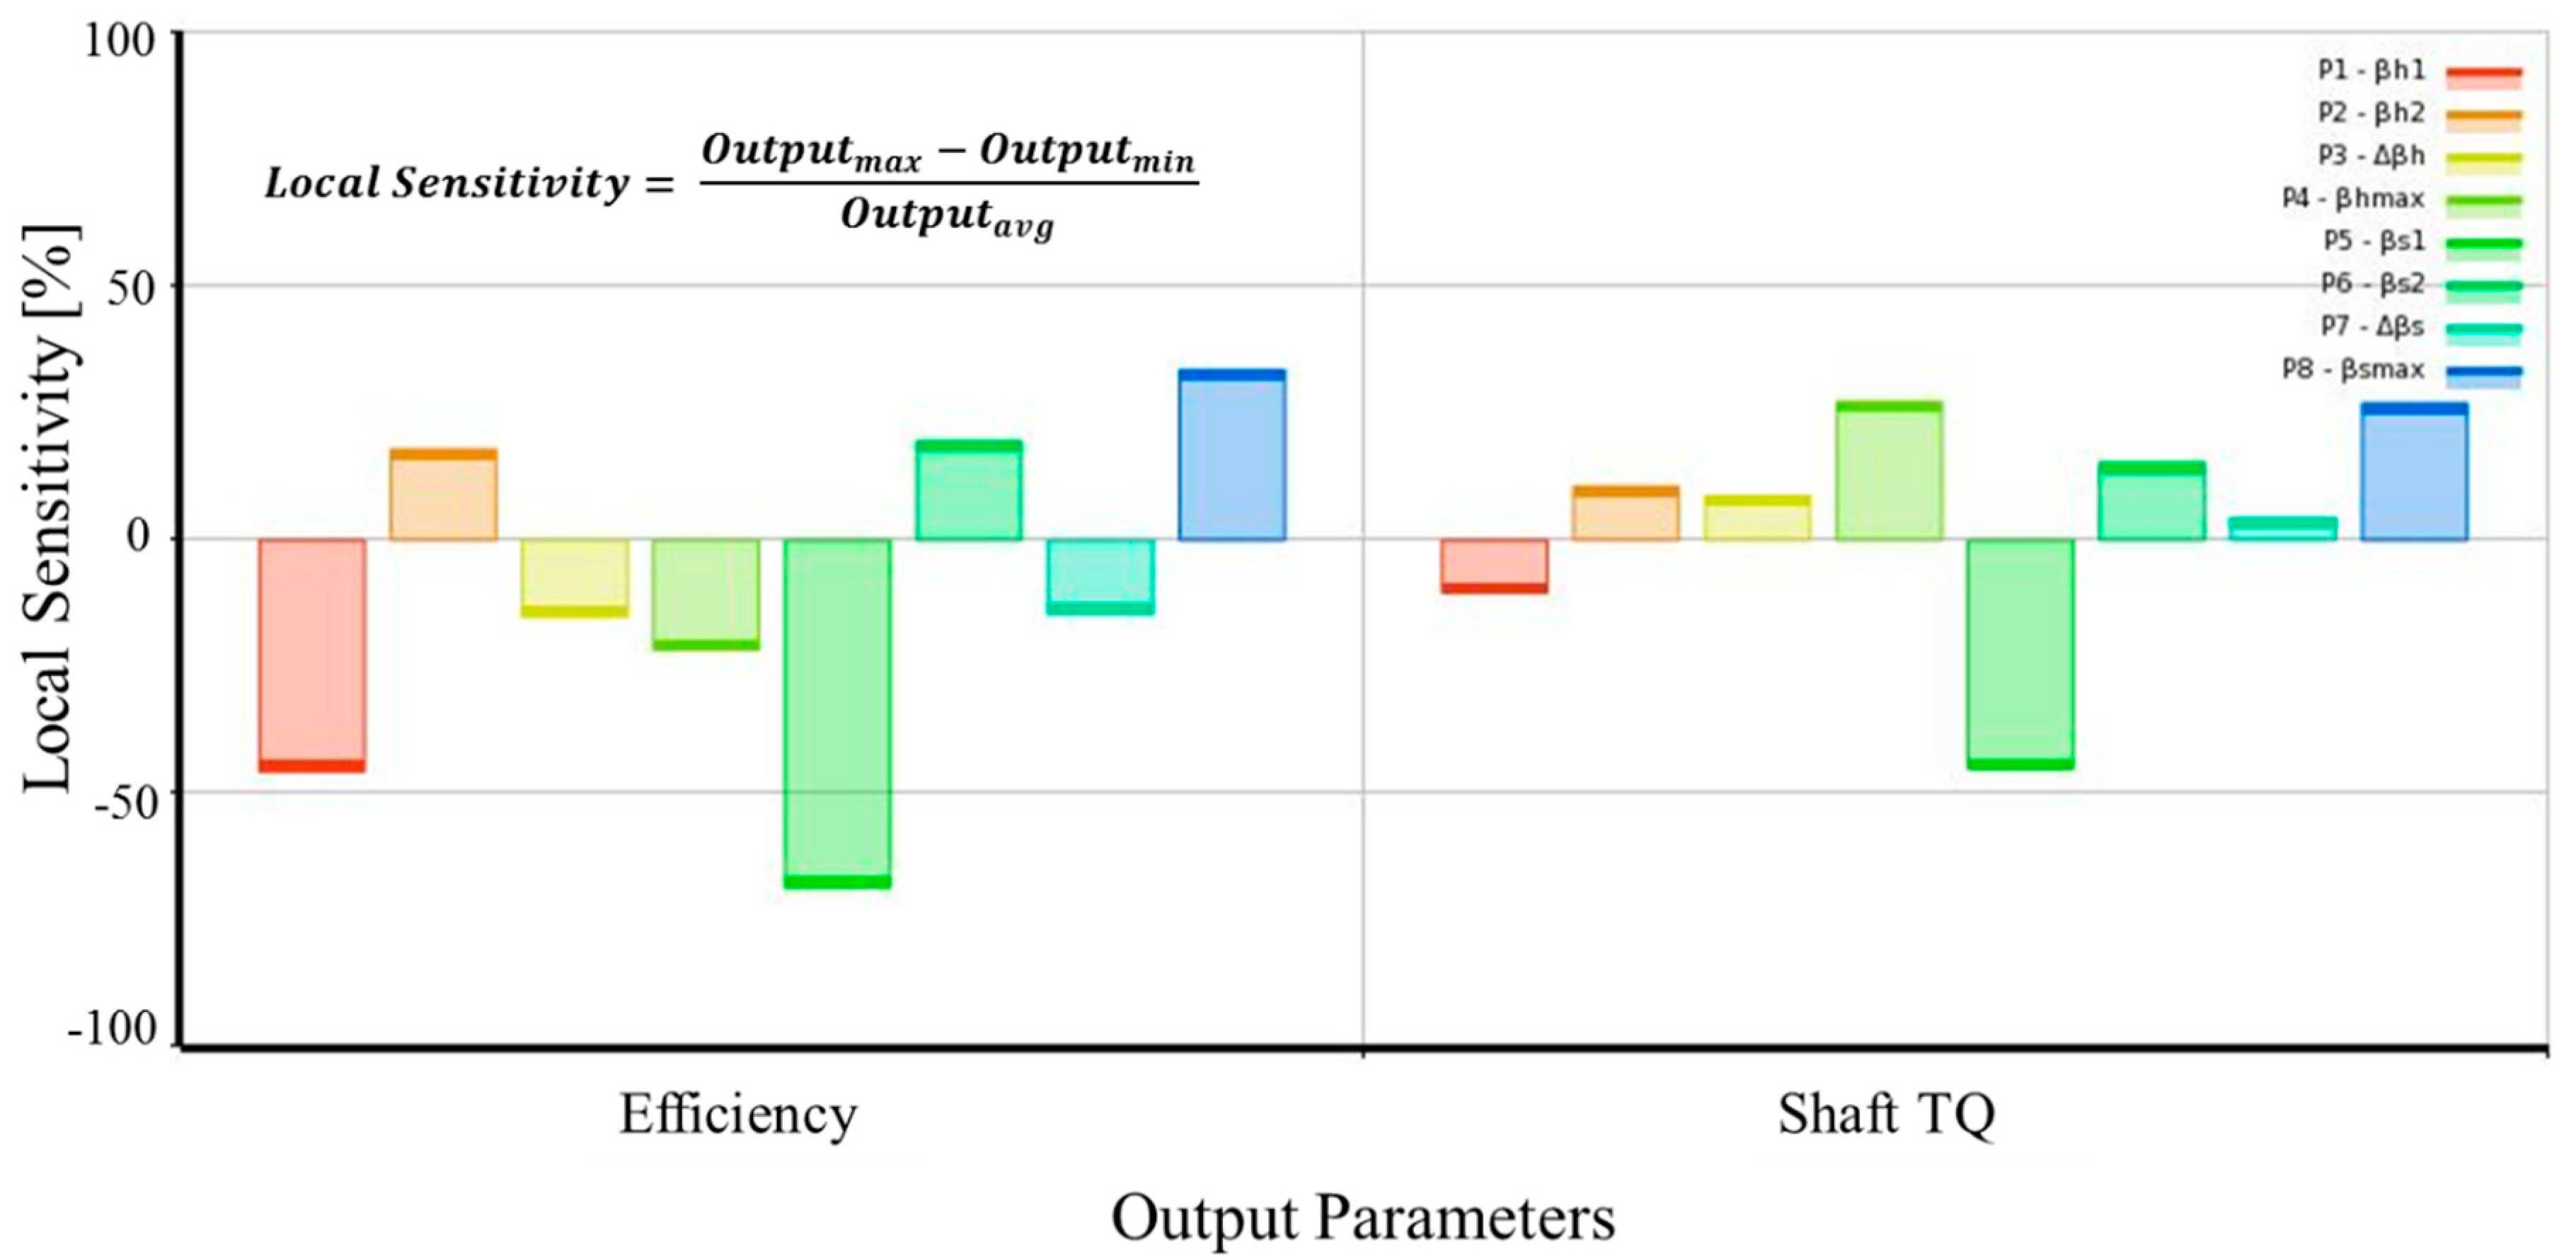
4.1. Optimization of Main Blade

Based on the assigned design parameters of the main blade, a hundred DOE points were generated by the OSF sampling method, which distributes the design parameters equally throughout space and provides better insight with a small number of points [27]. Then, CFD simulations were carried out for one hundred cases, and the results were used to start the metamodel coupled single-objective optimization. The metamodel provides a simplified algorithm to approximate the computationally expensive objective function in a computationally cheaper way [28]. In this study, a metamodel with non-parametric regression, which provides improved response quality and predictably high nonlinear behavior of the objective functions with respect to the design parameters, was selected to create the response surface [27] (Figure 8). The quality of the response surface based on simulation values was investigated through goodness-of-fit. Owing to the well-fitted design points, as shown in Figure 8, we can say that the response surface was constructed correctly. Furthermore, the effect of each design parameter on the objective functions was examined by referring to the local sensitivity chart. Figure 9 shows that even though each parameter did not equally affect the output parameters, each of them had reasonable effect on the efficiency.
The following steps were implemented in the optimization method based on the created response surface: A screening optimization method which is usually used for preliminary designs was selected to maximize the isentropic efficiency [27,29]. According to this method, three candidate points are obtained after generating 1000 samples. The candidate with the highest isentropic result was then chosen for an optimal beta distribution (Table 4). To verify the result, a CFD simulation was performed using the optimal beta angle in the next step. Figure 10 summarizes the full optimization procedure.

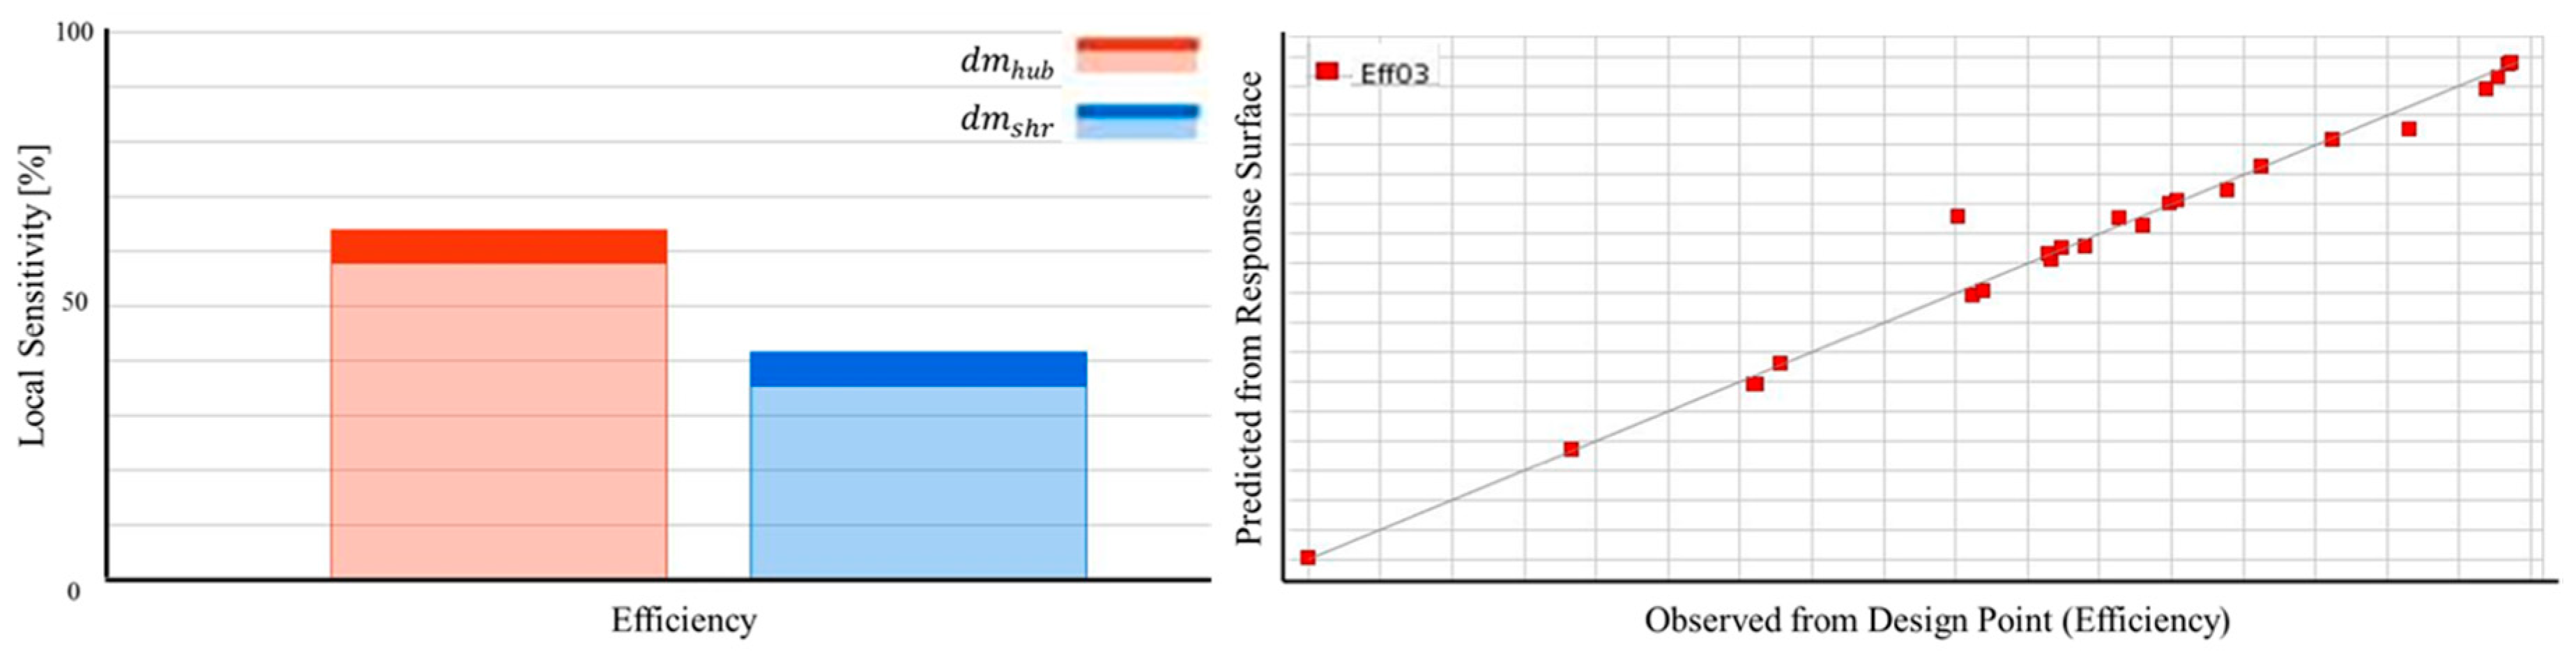
4.2. Optimization of Splitter Blade

In this optimization process, the reference impeller was considered as the previous beta distribution optimized impeller. The optimization of the leading edge location of the splitter blade was also performed as described in Figure 10. Nevertheless, the central composite design (CCD) sampling method, which is a capable alternative to the second-order response surface method [27], with a combination of some customized location points, was generated for the twenty-five design points in the DOE step of the optimization flow chart. Then, CFD simulations were conducted for twenty-five different impellers to obtain the value of the objective function. The non-parametric regression coupled single-objective screening method was then used to find the optimal location at the leading edge. The effect of each design parameter and quality of response surface was evaluated through local sensitivity and the goodness-of-fit graph, respectively, at the metamodel stage (Figure 11). Among the three candidates, the one that achieved the highest isentropic efficiency, with d m h u b = 48% and d m s h r = 50%, was evaluated through CFD analysis at the final stage. Eventually, after two consecutive optimization processes, the main blade and splitter blade were optimized on the compressor.

5. Results and Discussion

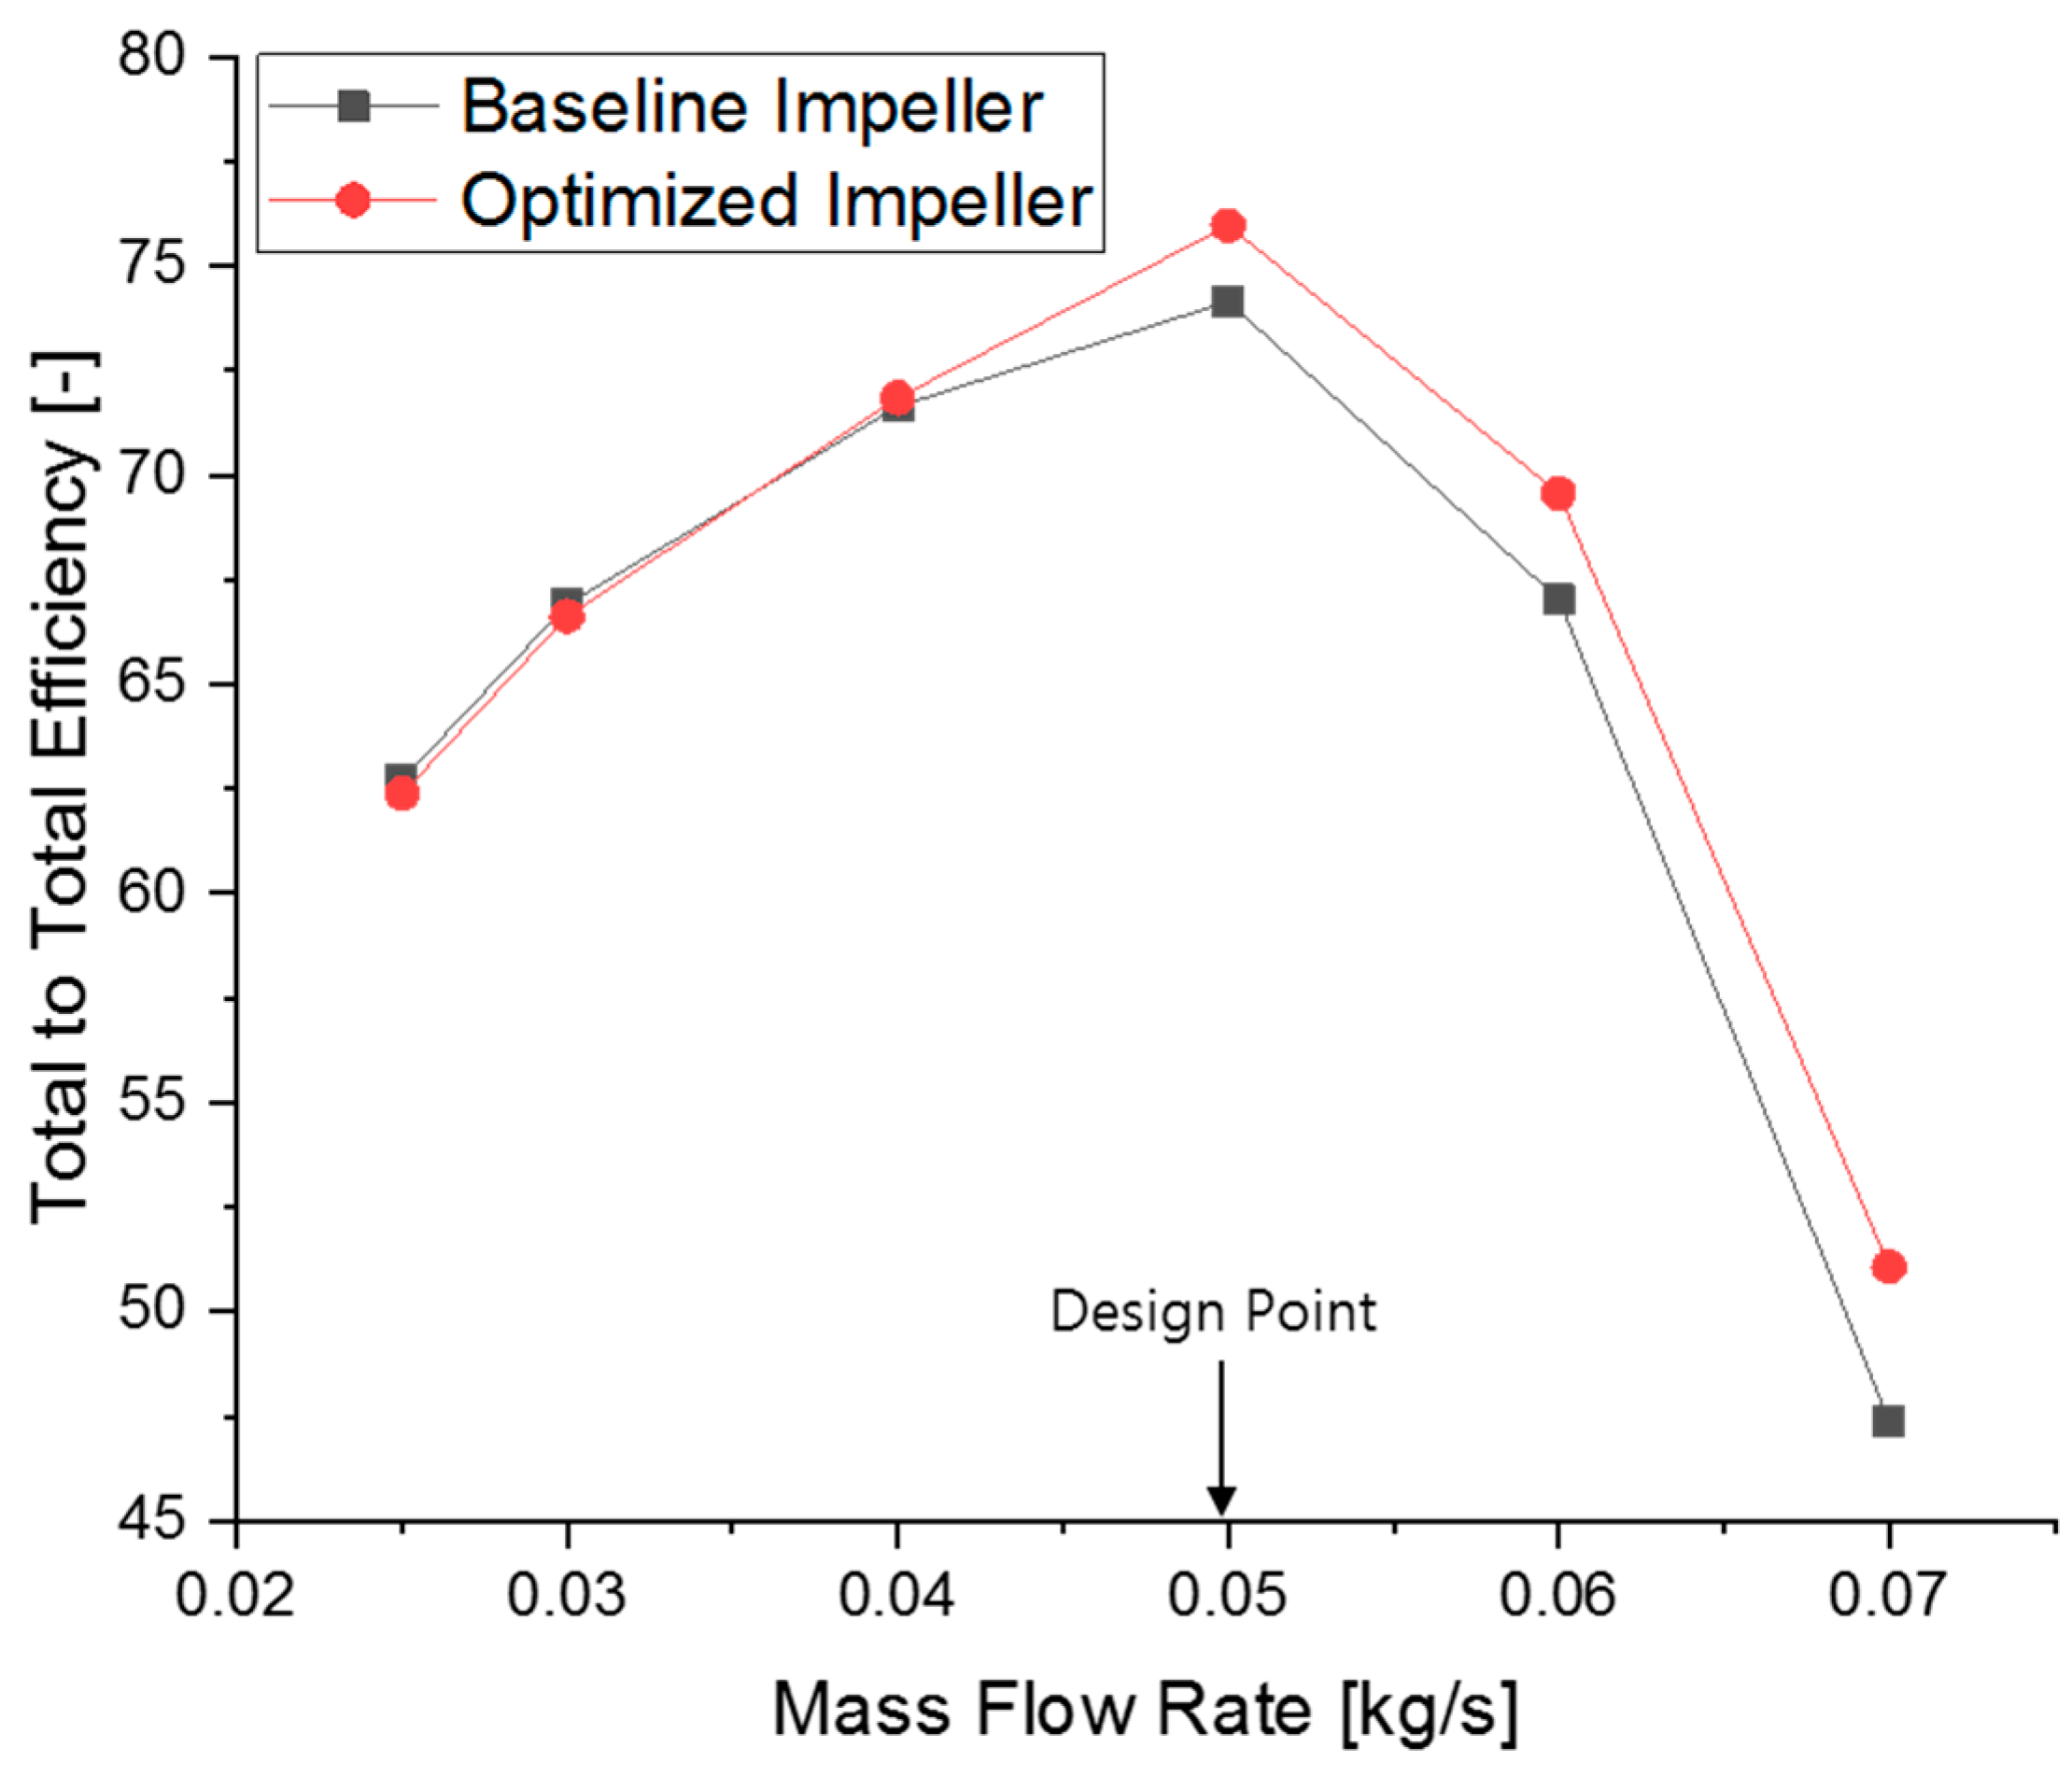
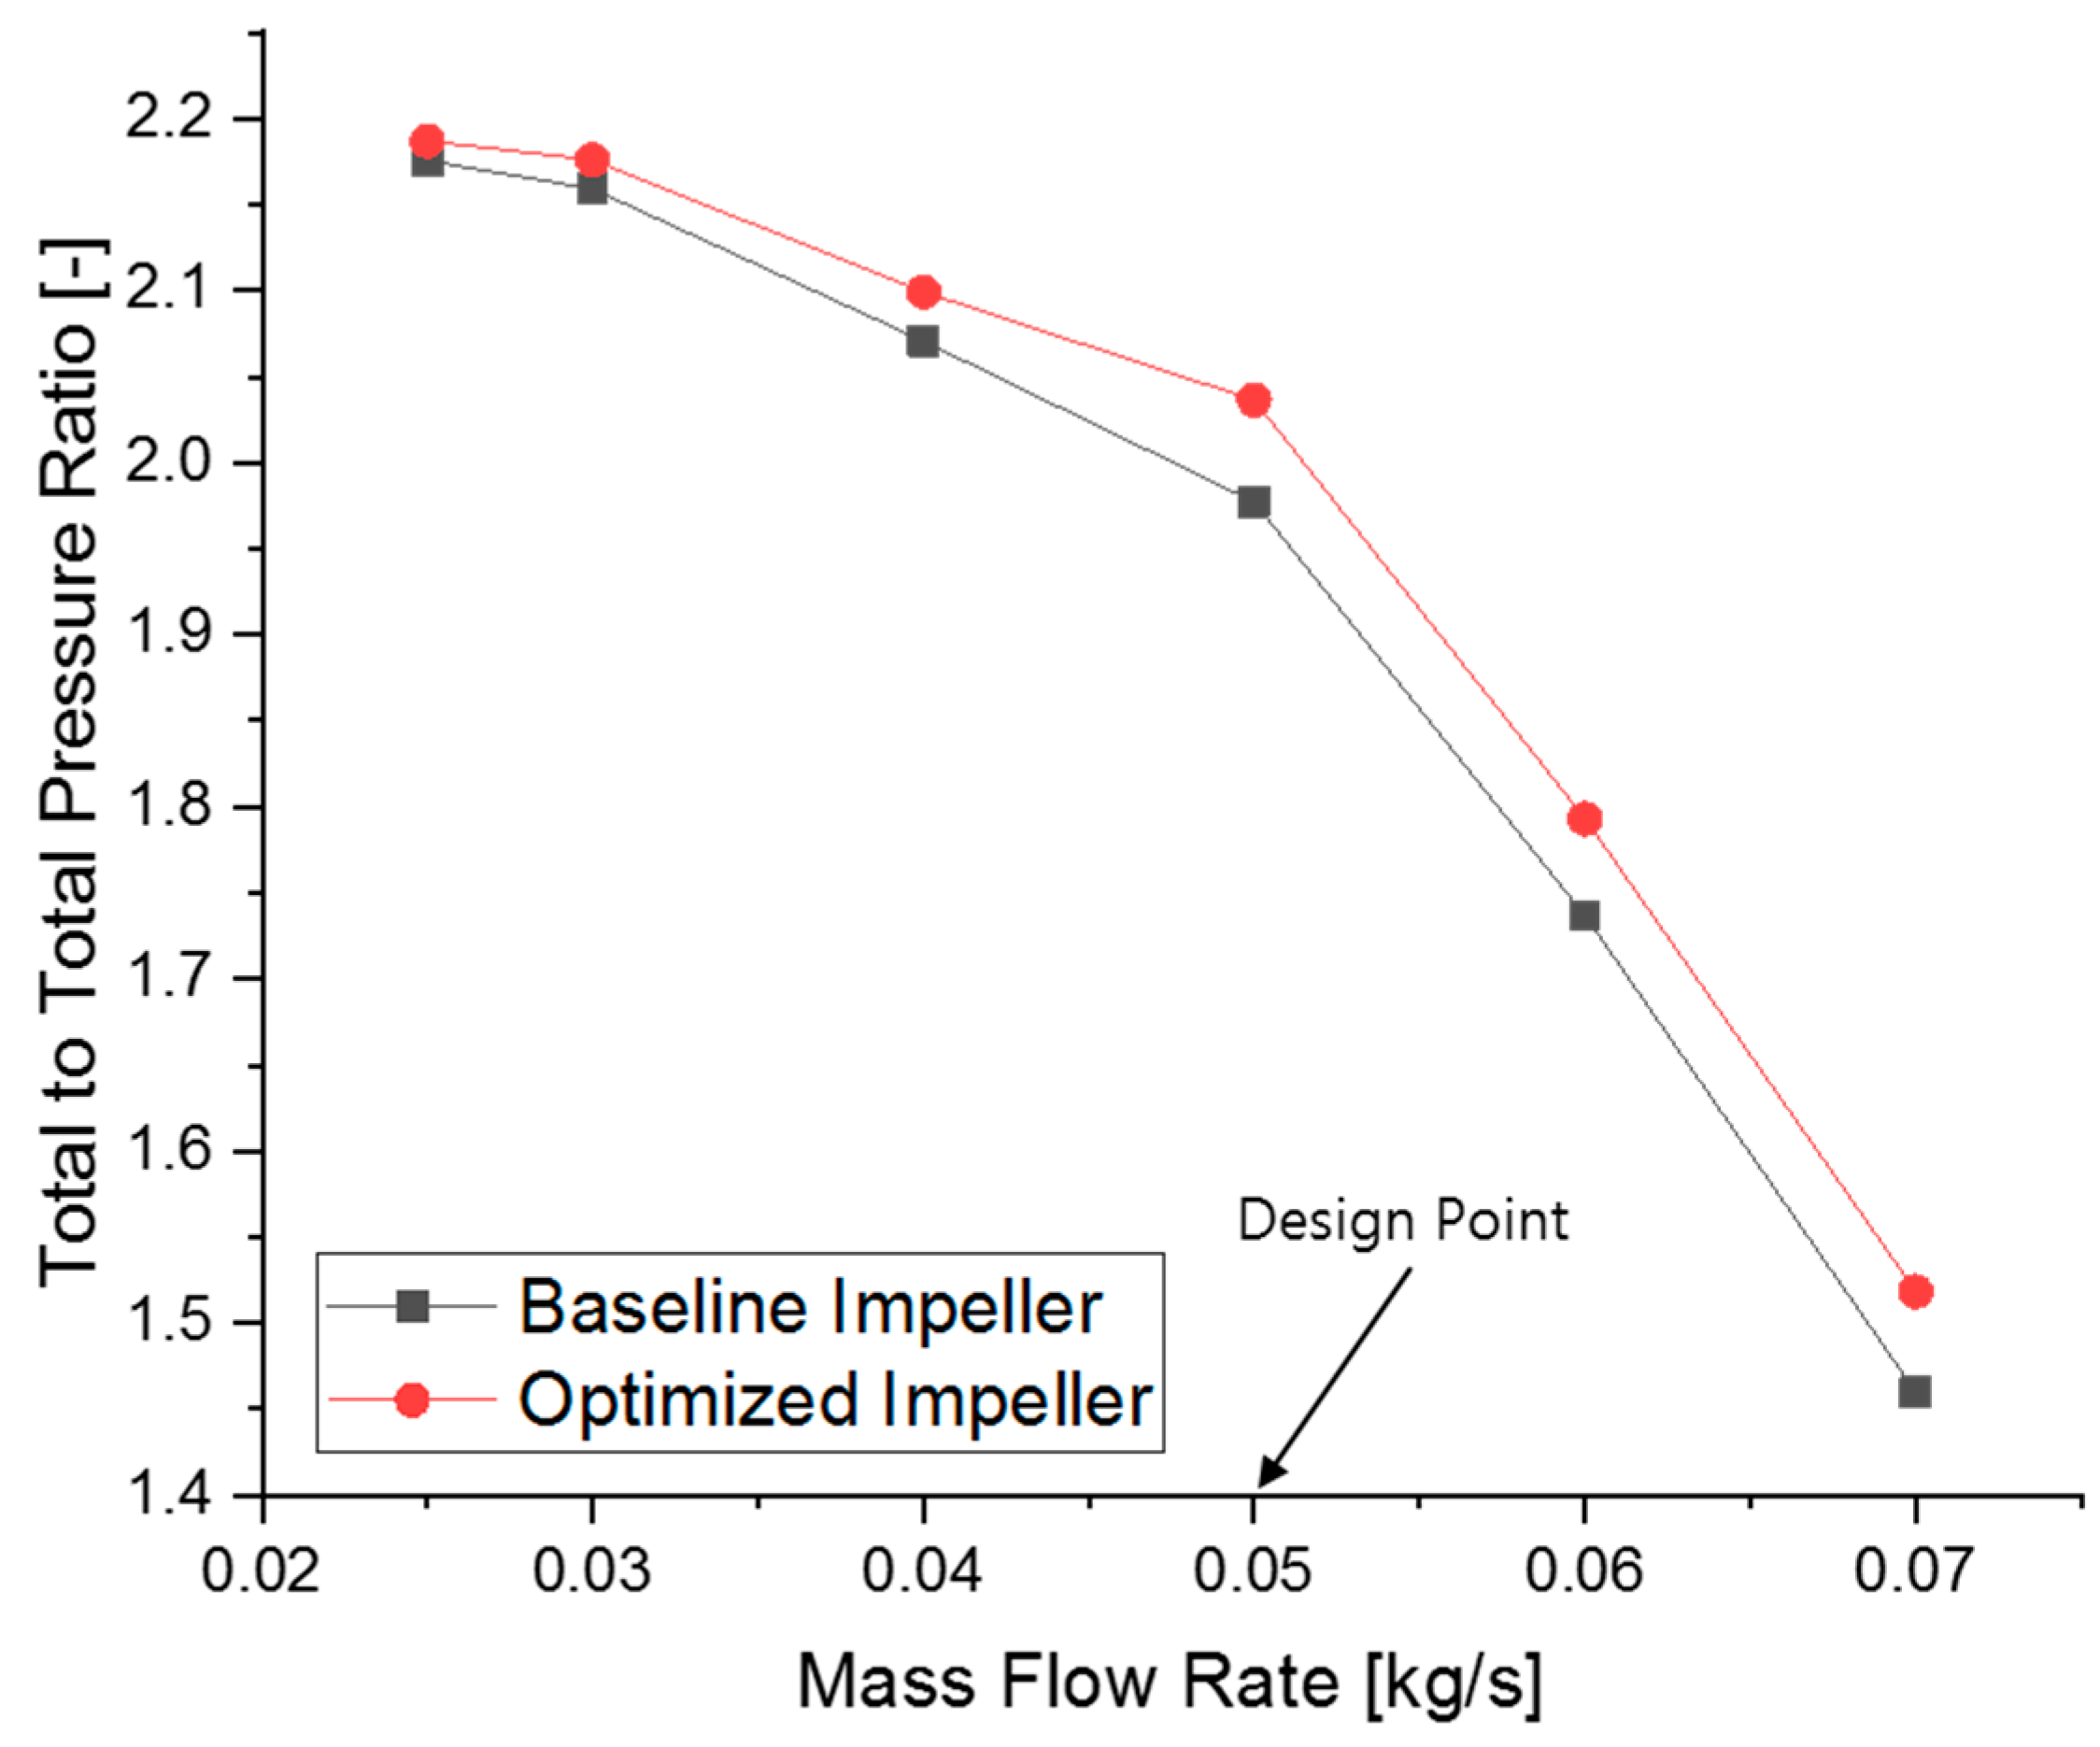
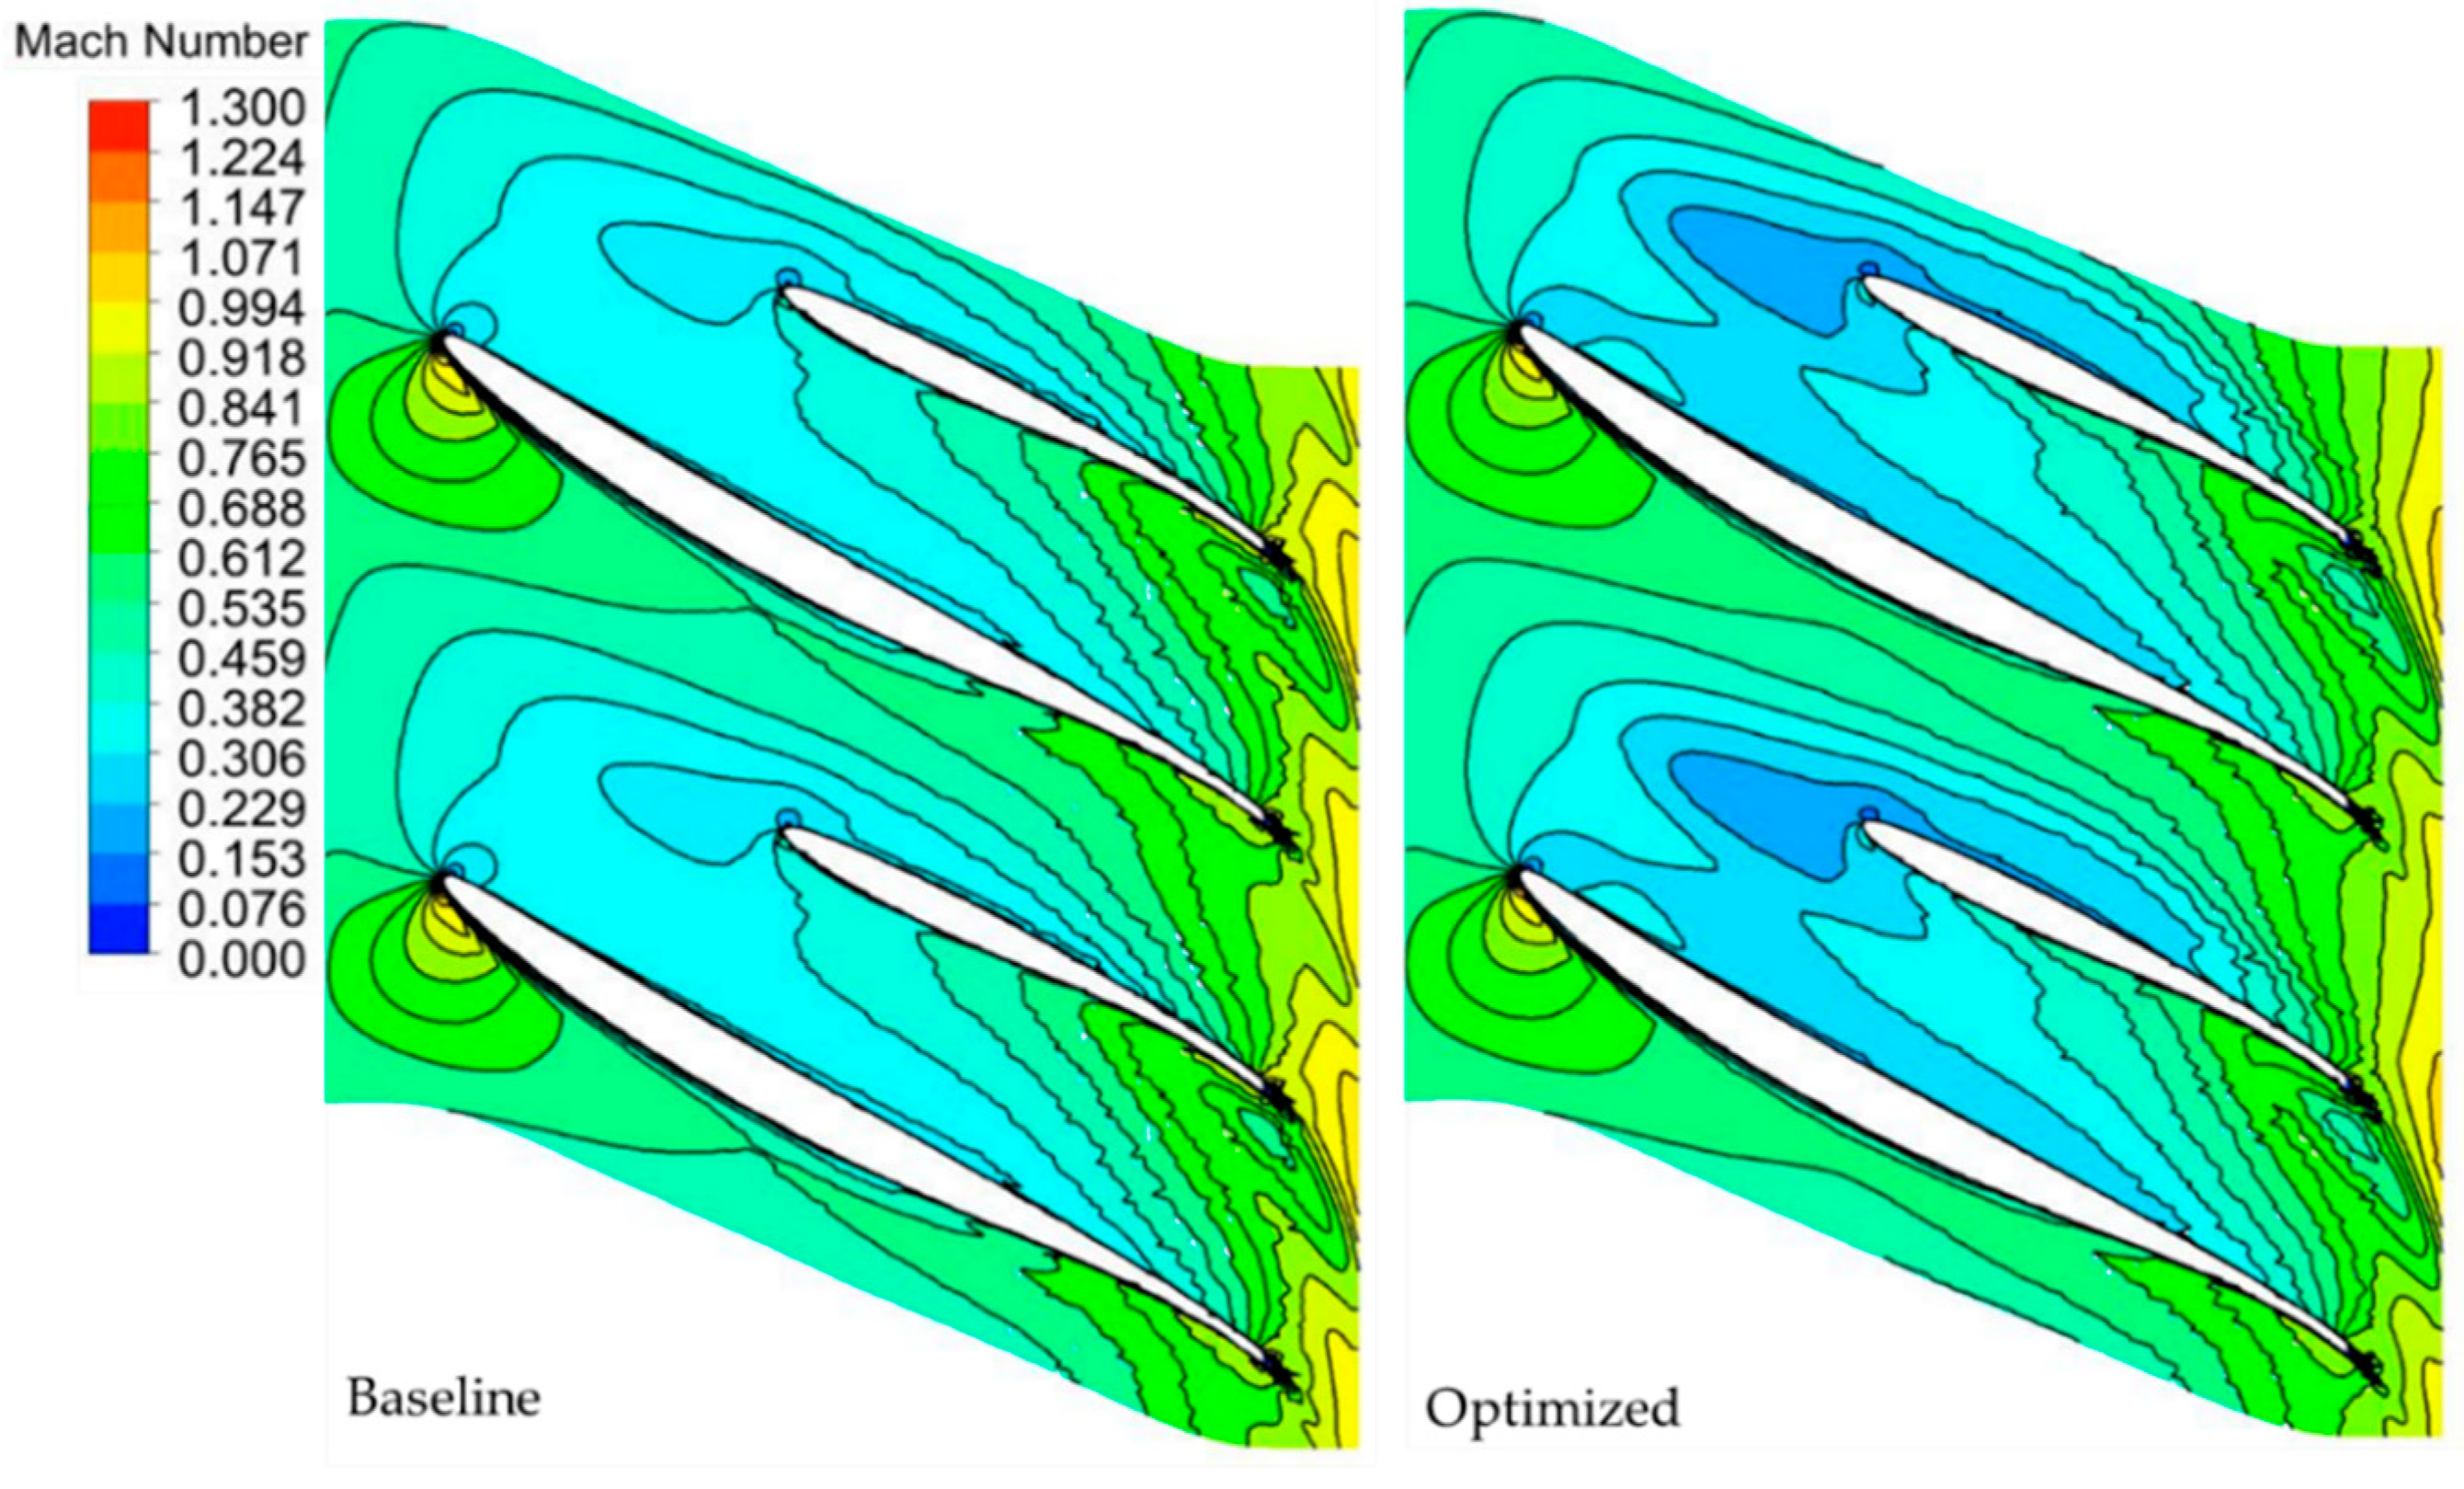
5.1. Comparison of the Baseline (Base Main-Base Splitter) and Optimized Impeller (Optimized Main-Base Splitter)

The total-to-total isentropic efficiency of the optimal impeller was predicted as 76.23% at the design point (0.05 kg/s) by the screening optimization method and was validated as 75.98% by a RANS simulation. Therefore, we can say that the screening method provided close prediction in comparison with CFD. Furthermore, the efficiency of the baseline impeller at the design point was calculated as 74.15% by RANS. Thus, isentropic efficiency was improved by 1.8% considering optimization of the beta distribution on the main blade. The baseline and optimized impeller were compared at several off-design points [7,8]. To do so, flow simulations were carried out at an additional five mass flow rates for reference, and the optimized impeller and results are shown in Figure 12. According to the result similar efficiency results were observed at 0.025 kg/s and 0.03 kg/s design points for both the reference and optimal impeller. However, a higher efficiency was detected in the optimal impeller from 0.04 kg/s to 0.07 kg/s in comparison with the baseline impeller. Therefore, we can say that efficiency was increased not only at the design point but also at the near-choke point, at which significant improvement was observed. However, there was no improvement at the near-surge point.
Total-to-total pressure ratio is another performance criterion of the compressor. The pressure ratio was obtained through RANS simulation at the design point as 1.98 and 2.04 for the baseline and optimal impellers, respectively. The pressure ratio was also compared to several off-design points for both the reference and optimal impellers. Figure 13 shows that the pressure ratio increased by 0.06 at the design point. However, the improvement occured not only at the design point, but also in the wide operation range of the compressor (from 0.025 kg/s to 0.07 kg/s). Therefore, we can say that the pressure ratio gradually increased from the near-surge point to near-choke point on the optimal impeller in comparison with the baseline (Figure 13).
The values of beta parameters on the baseline impeller were compared with those of the optimized impeller (Table 5). Figure 14 indicates that there was no significant alteration on hub side except β h , L E . However, the shroud side changed significantly in all points. We actually expected to reasonable change both hub and shroud; however, as the efficiency of the reference impeller had already been maximized by the Keyyang Precision Co., it was difficult to obtain an optimized impeller that differed greatly from the reference impeller.
The Mach number distributions on the blade surface and passage could aid in understanding how the efficiency of the compressor increased owing to optimization of the beta distribution. The lower suction side Mach number distribution at the shroud leads to a reduction in shock losses, and shock boundary layer interaction losses in the blade passage therefore improved efficiency, as expected [16]. In this study, remarkable changes were observed in the shroud rather than in the hub. Therefore, the Mach number distribution near the shroud was examined. In Figure 15, Figure 16 and Figure 17, the Mach number distribution is showed near the hub (span 0.2), mid-span (span 0.5) and near the shroud (span 0.8) for both the baseline and optimized impellers. It is evident that the Mach distributions for the base and optimized impellers are identical near the hub and mid-span owing to no noticeable changes in the hub. However, at span 0.8, even though shockwaves similarly appear at the leading edge of the main blade, a lower Mach number become visible from the middle of the suction surface of the main blade until the trailing edge. Furthermore, in the optimized blade, the flow enters more slowly into the blade passage, which is near the pressure side of the main blade, than in the baseline impeller and propagates in the passage with a lower Mach number.
The efficiency improvement may also be determined by investigating the energy losses through static entropy. Static entropy judges the energy losses quite well through vortices in the blade passage [30]. In Figure 18, Figure 19 and Figure 20, it is obvious that the static entropy distribution on the blade-to-blade contour is similar at span 0.2 and span 0.5 for both the baseline and optimized impellers. However, there is significant reduction in the static entropy at span 0.8. Specifically, in the blade passage between the suction surface of main blade and pressure surface of the splitter blade, flow vortex disappears, and lower static entropy is observed at the entrance of this blade passage. Furthermore, a reasonable reduction in static entopy is observed on the suction surface of the splitter blade. As a result, efficiency might increase.

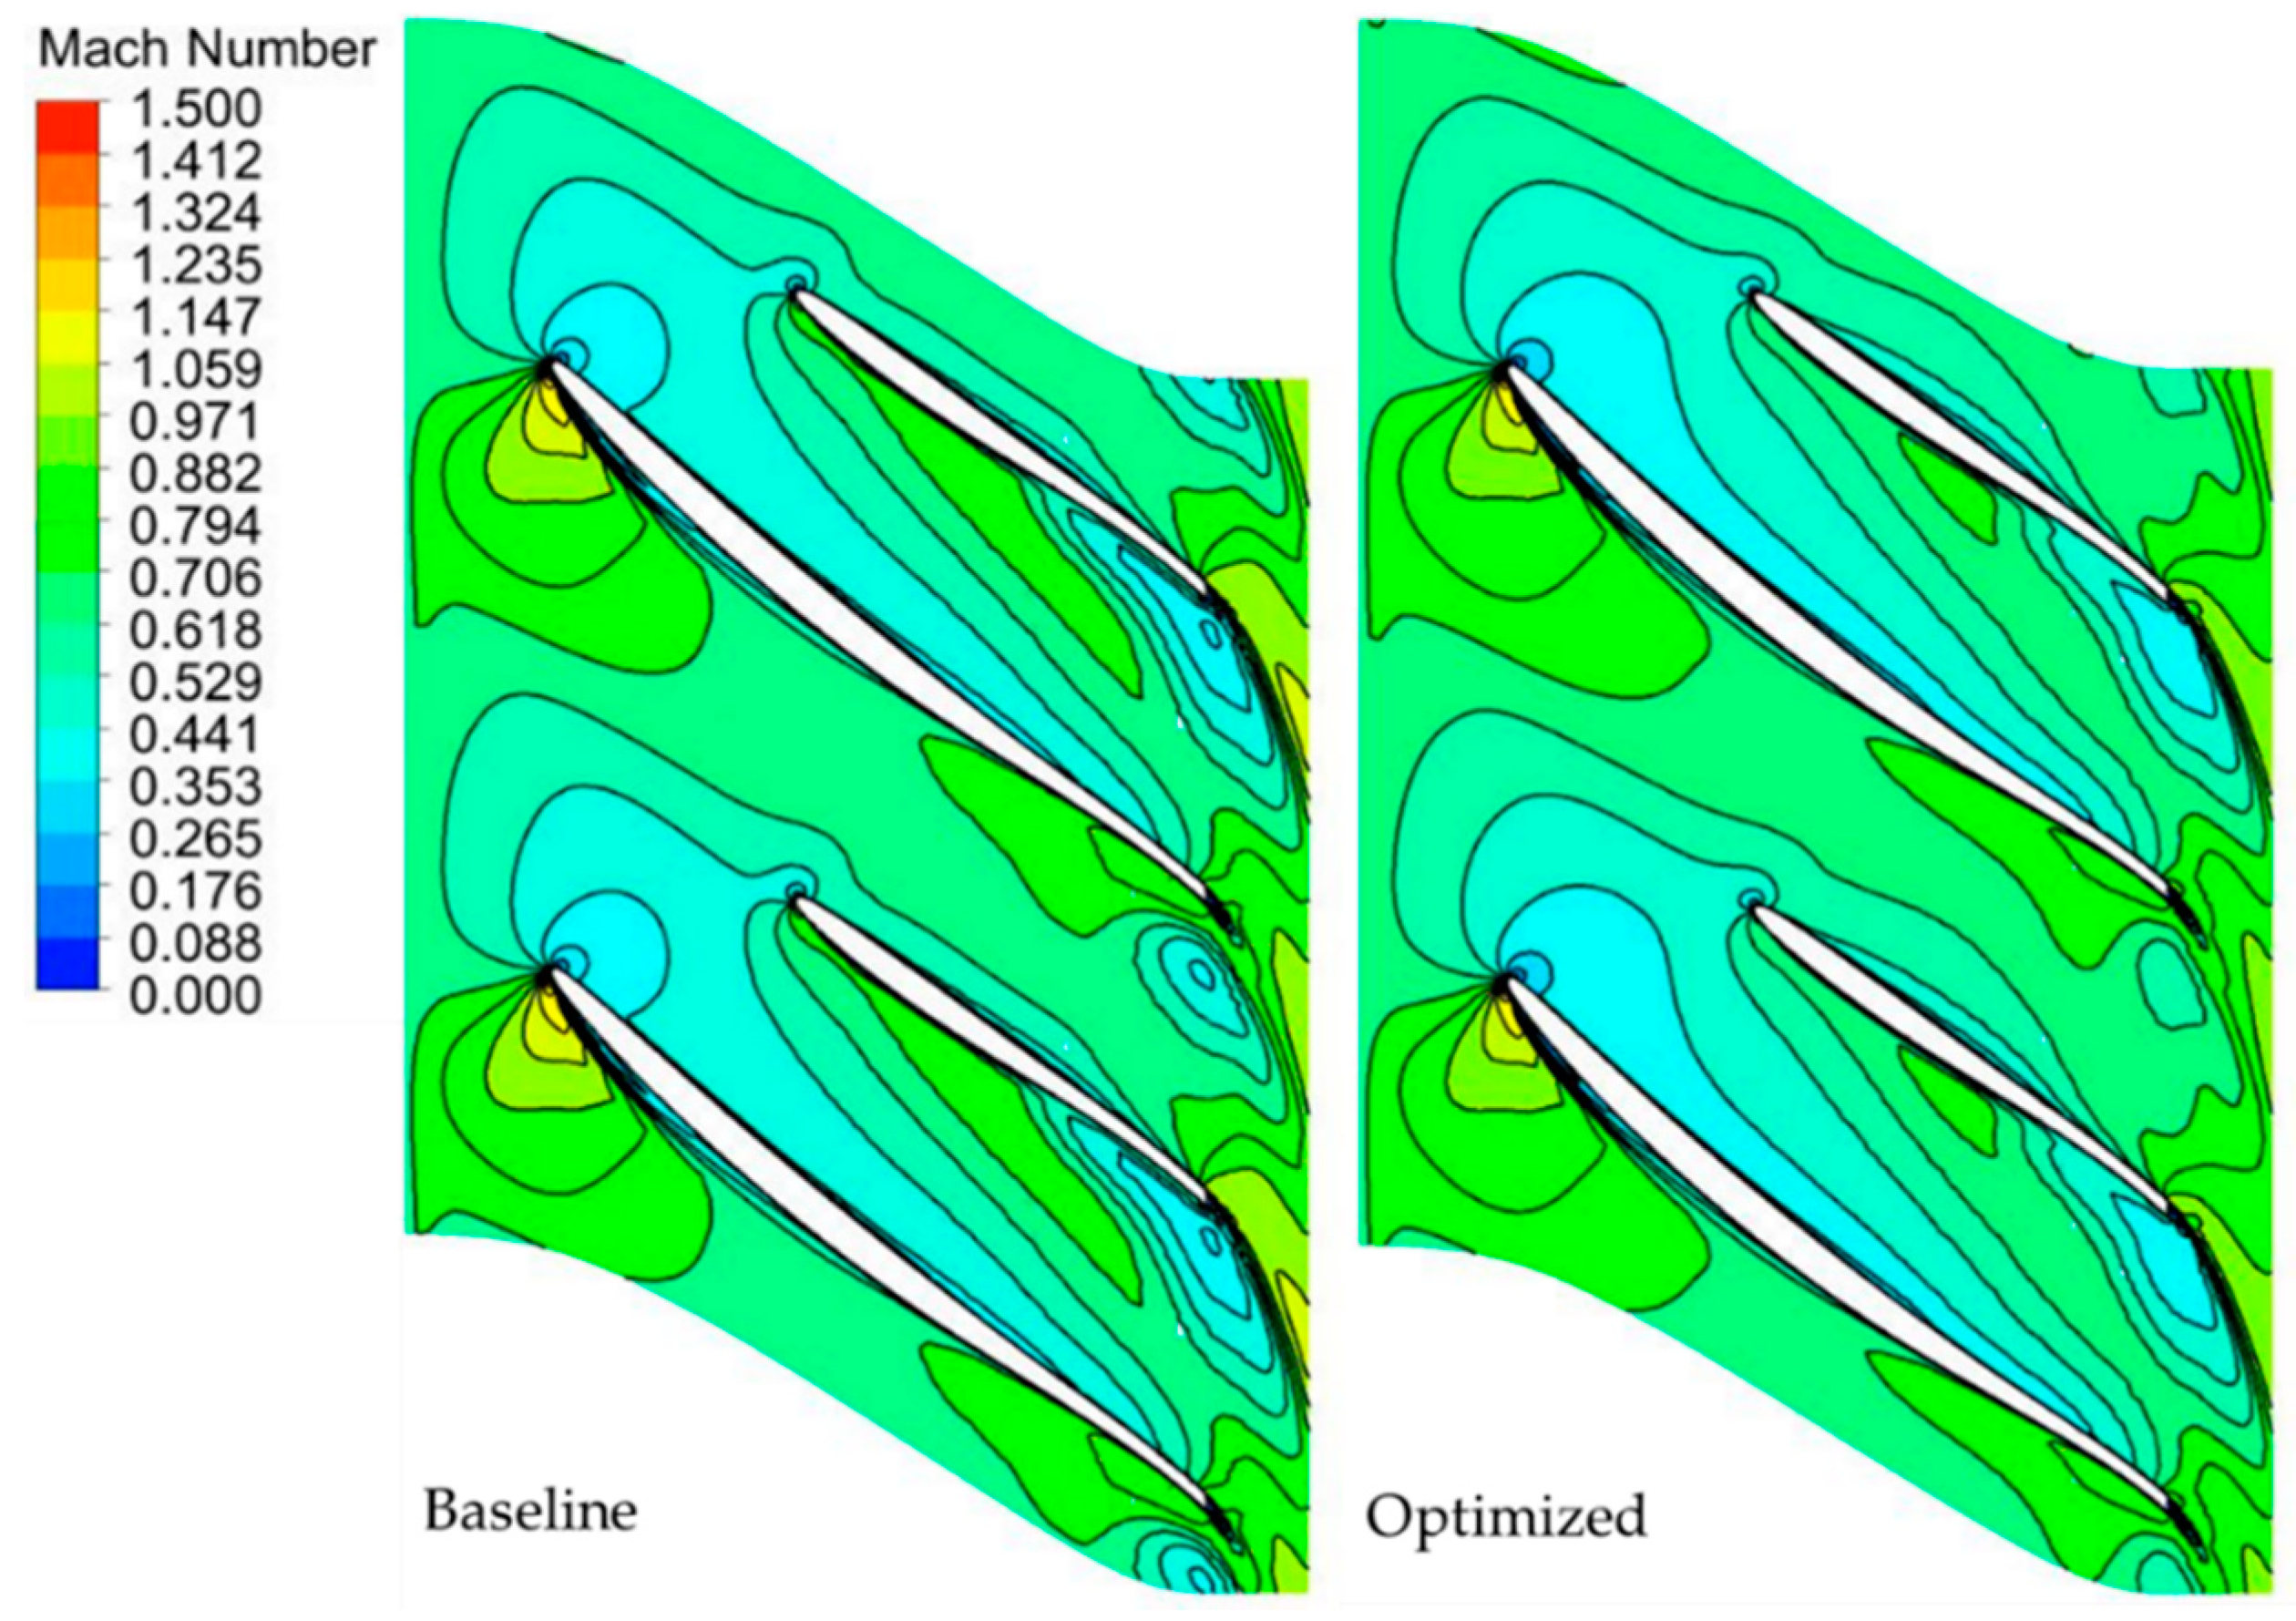
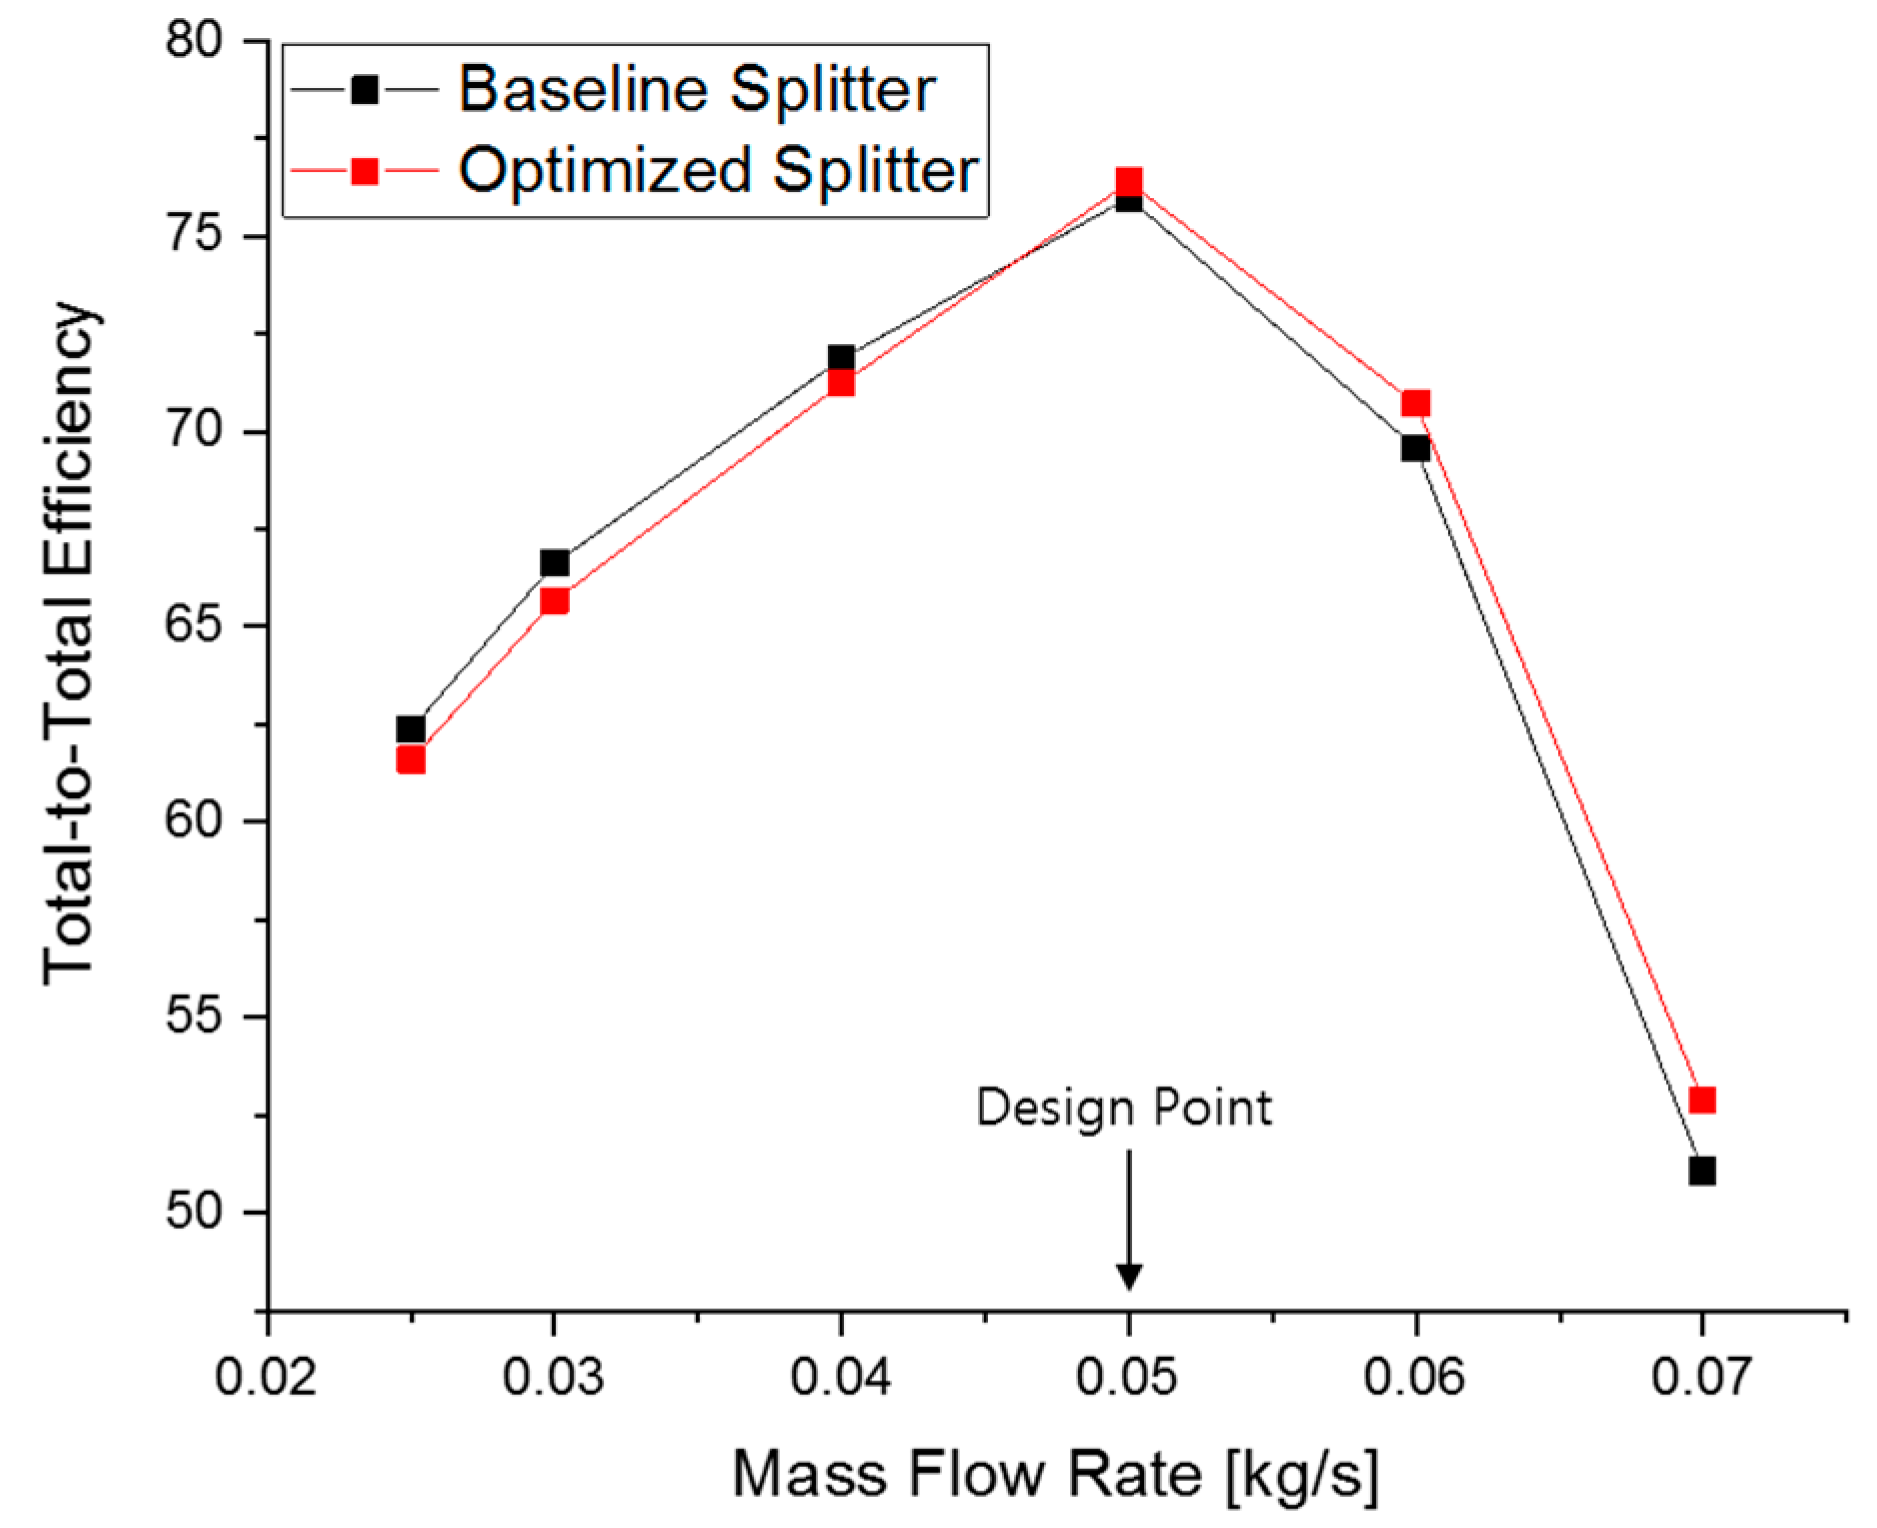
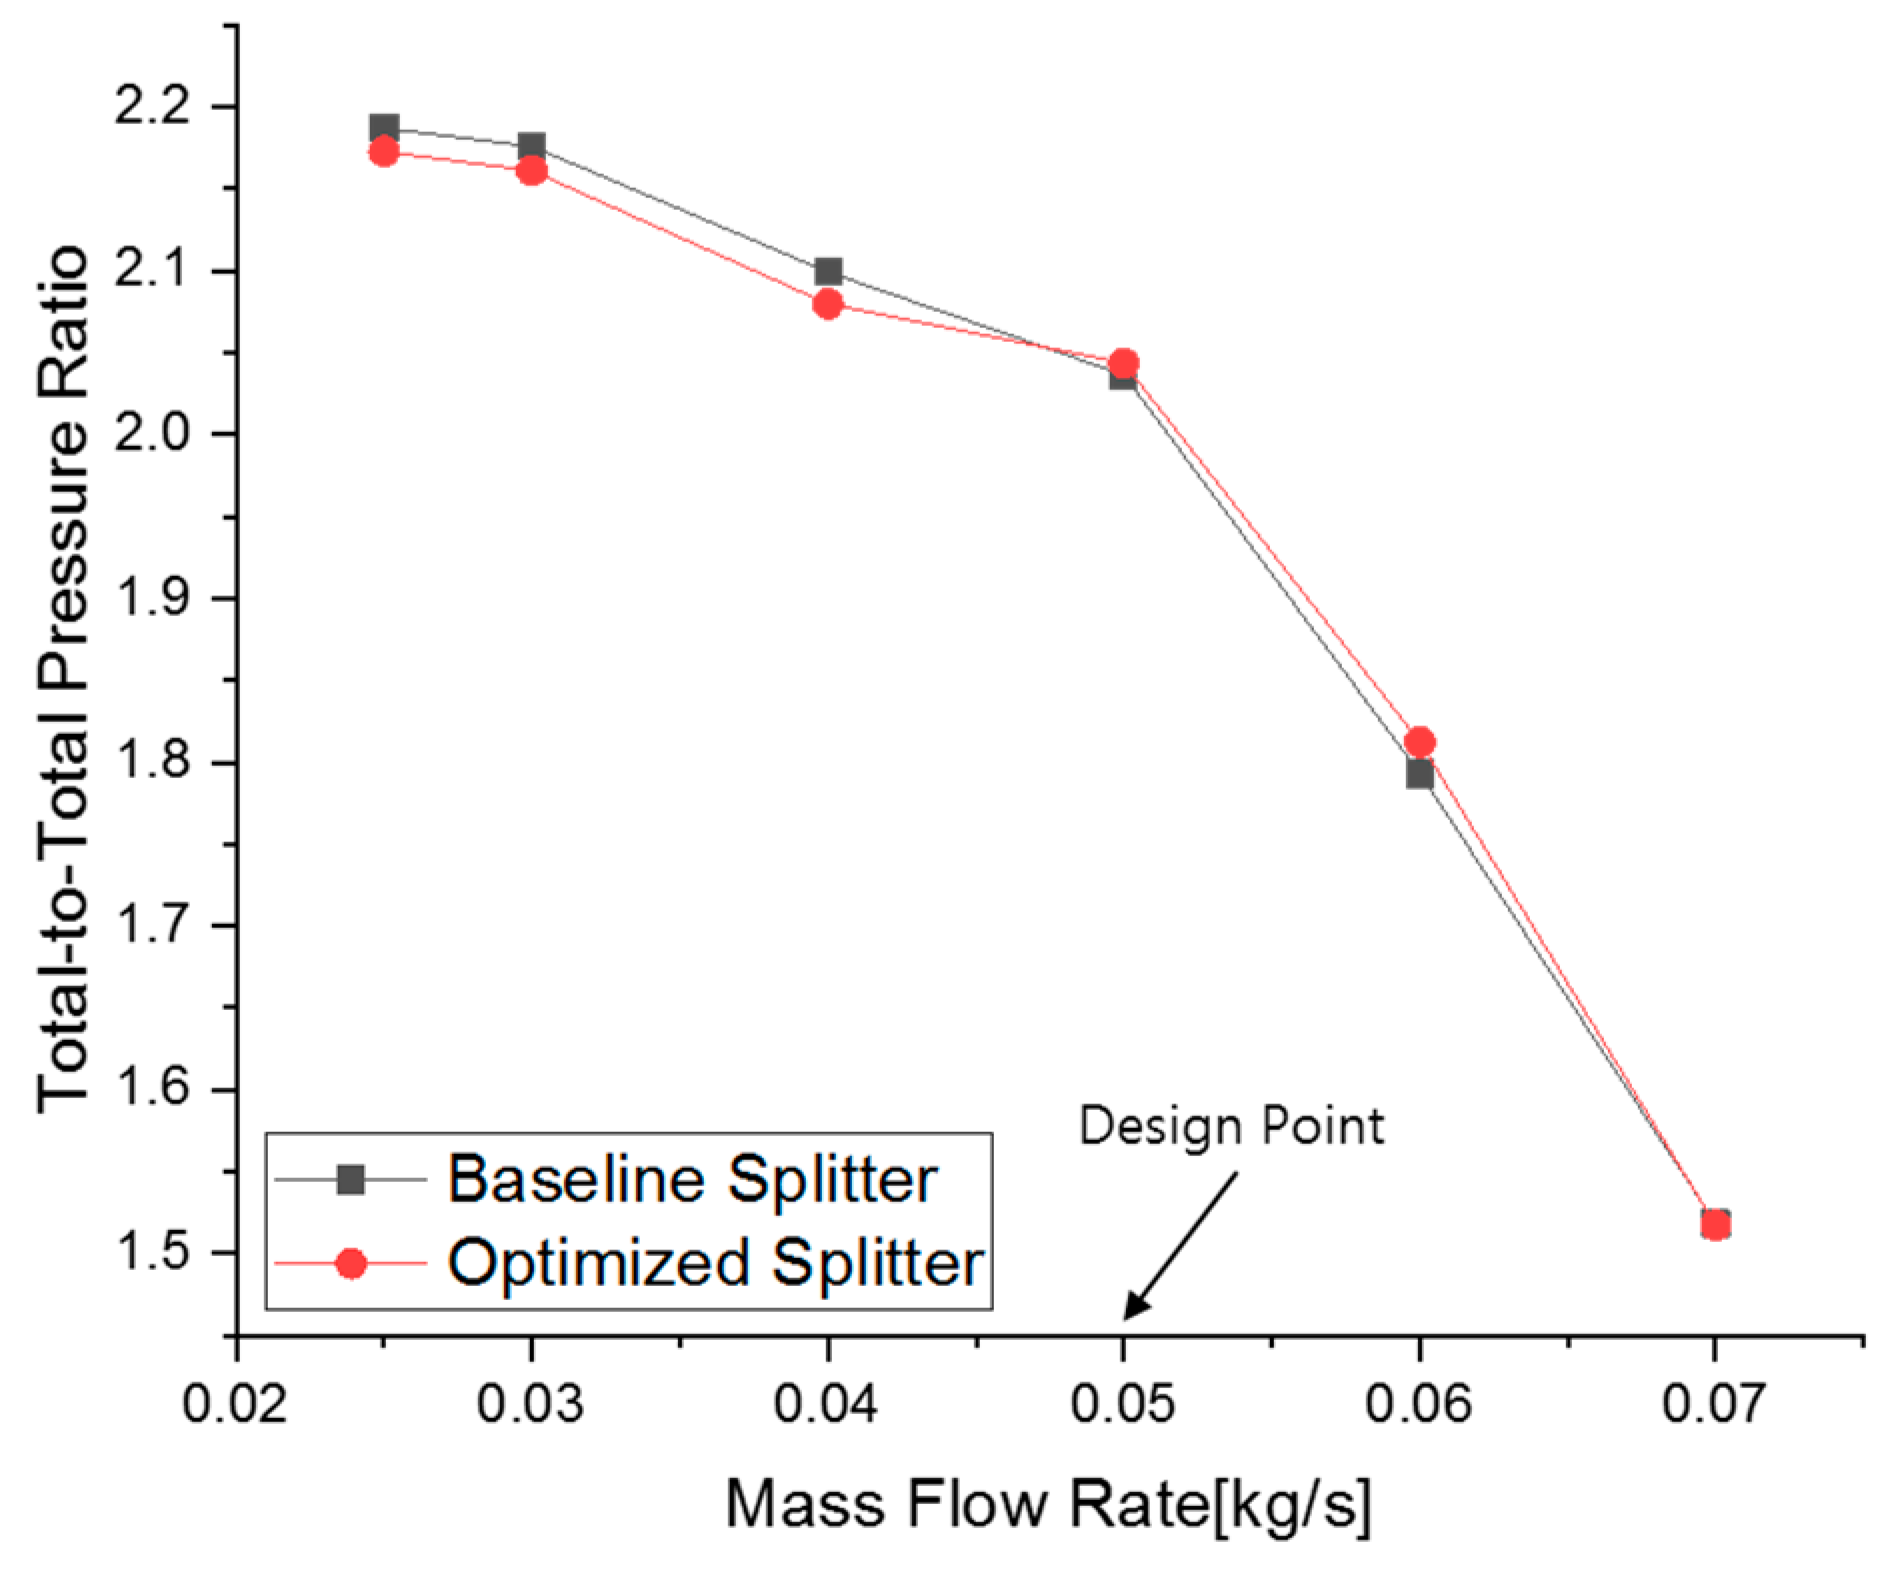
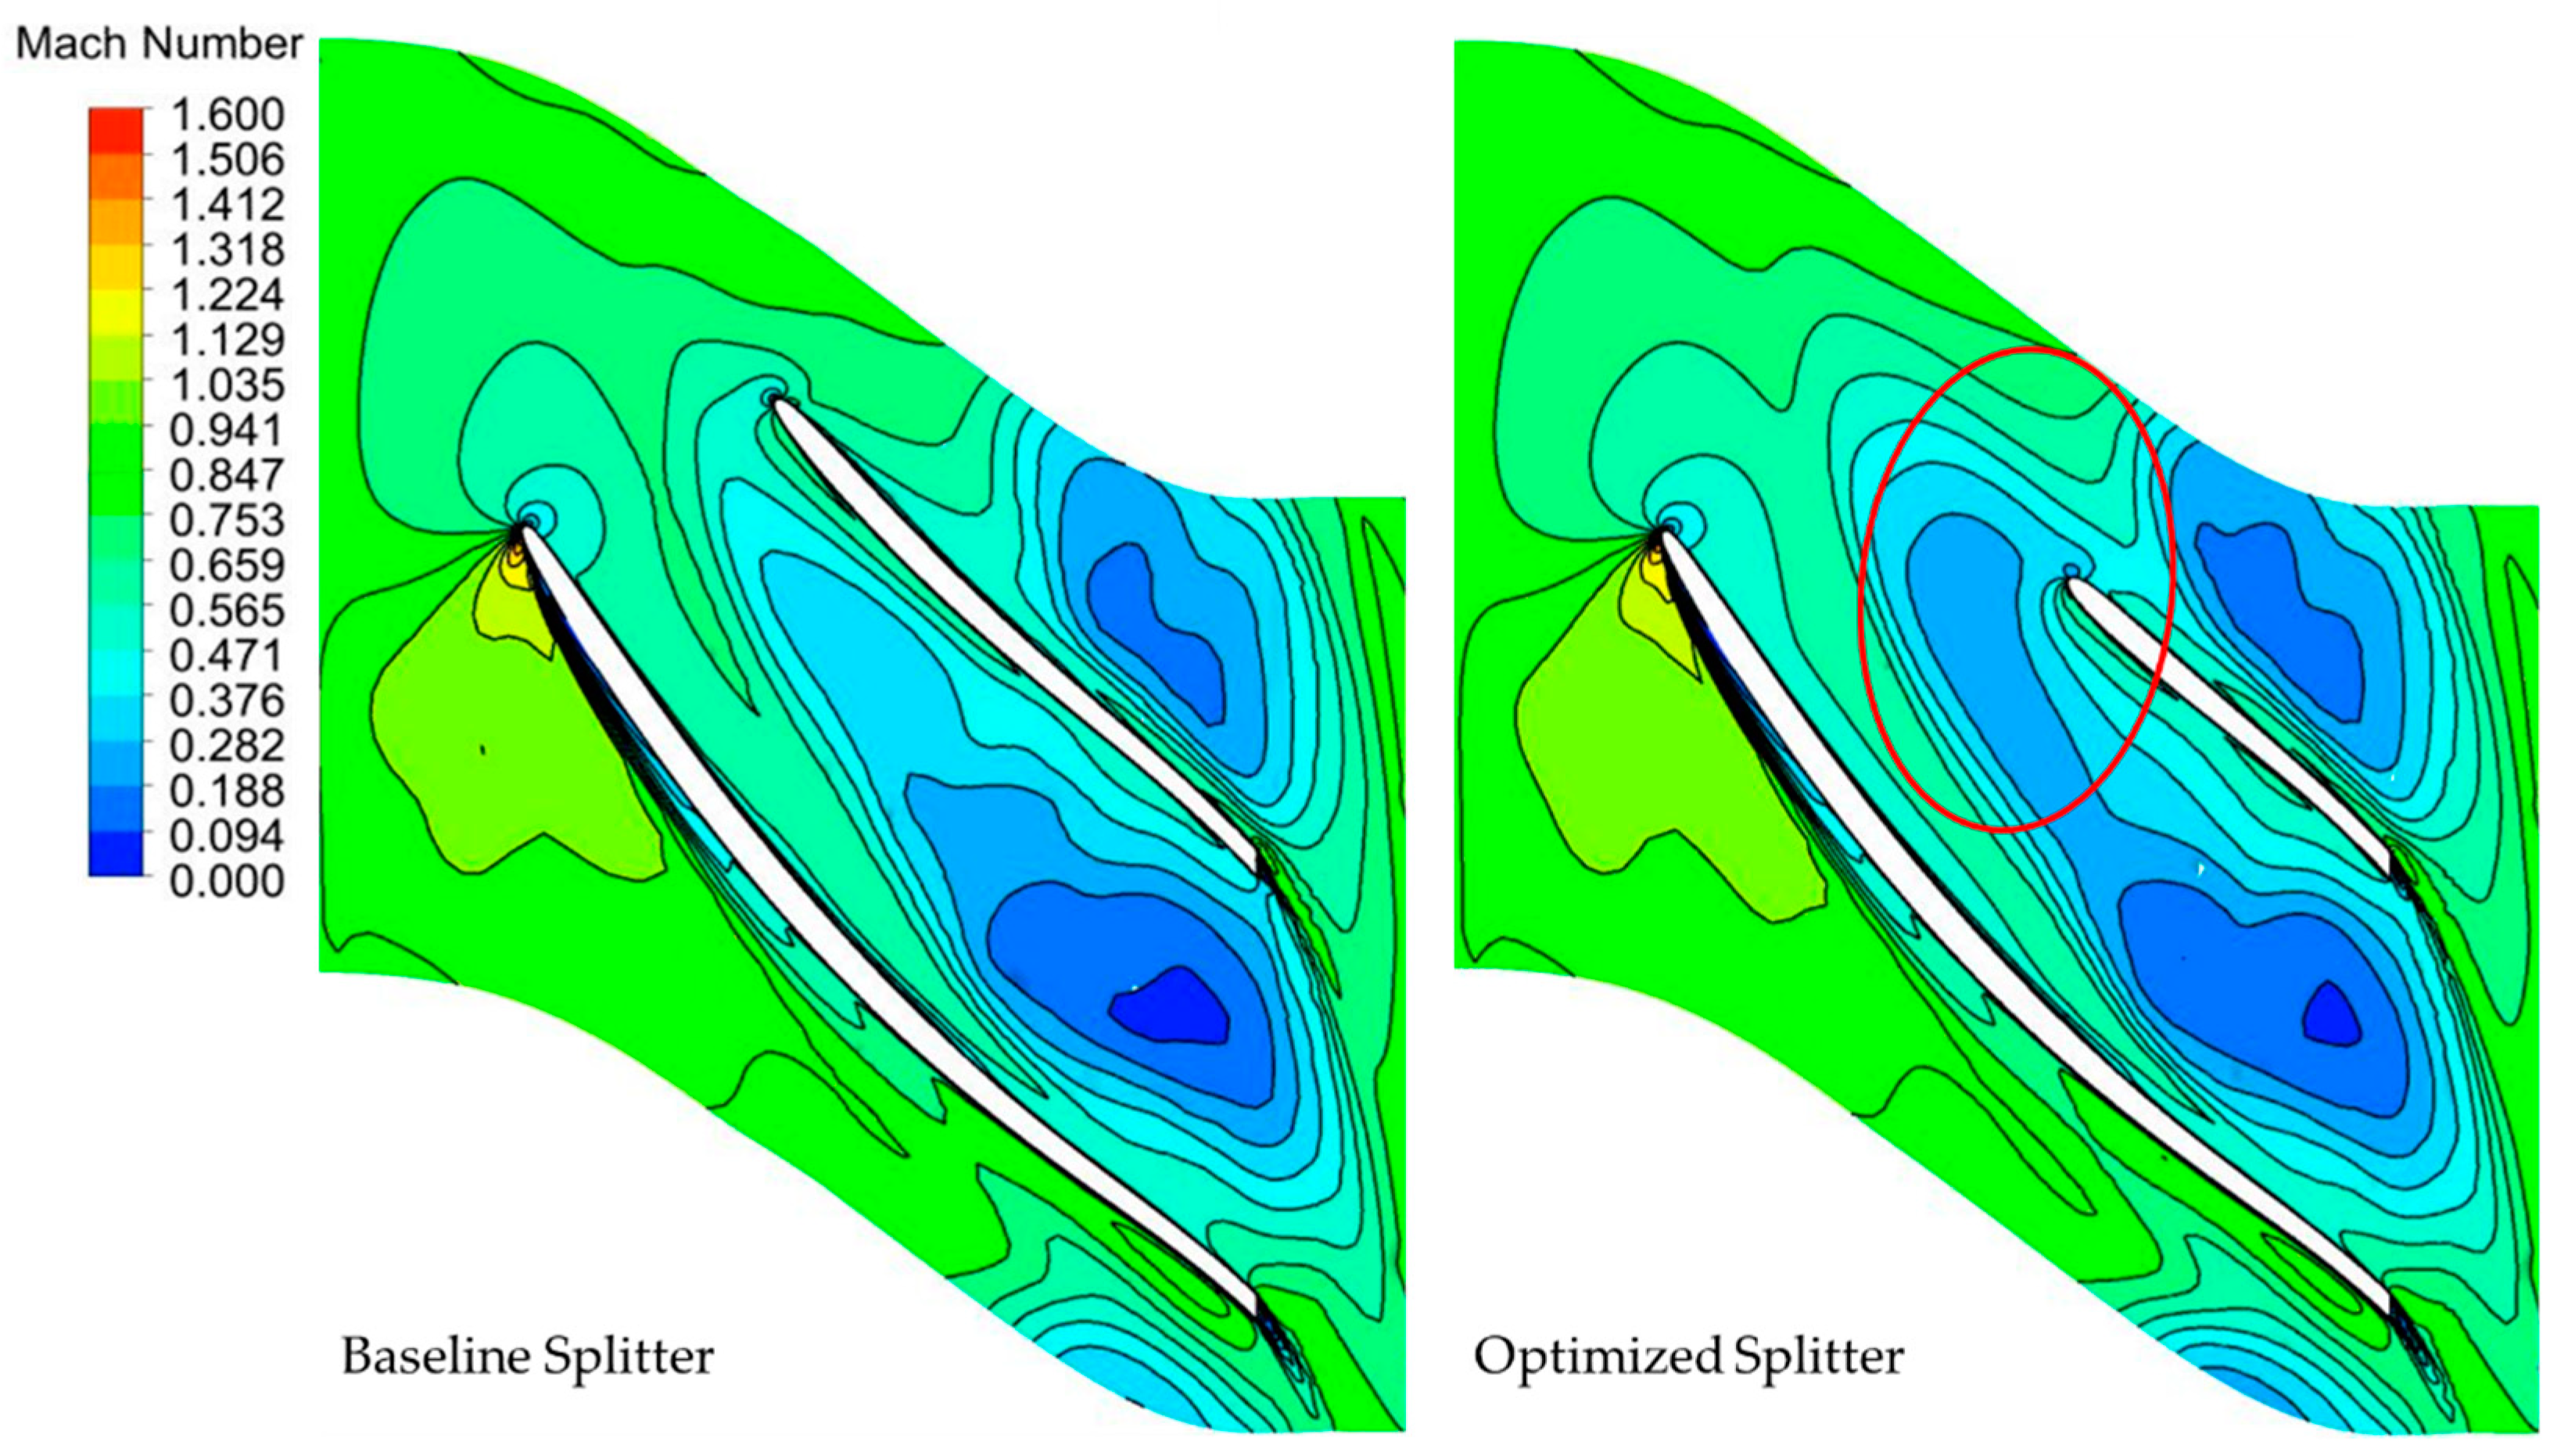
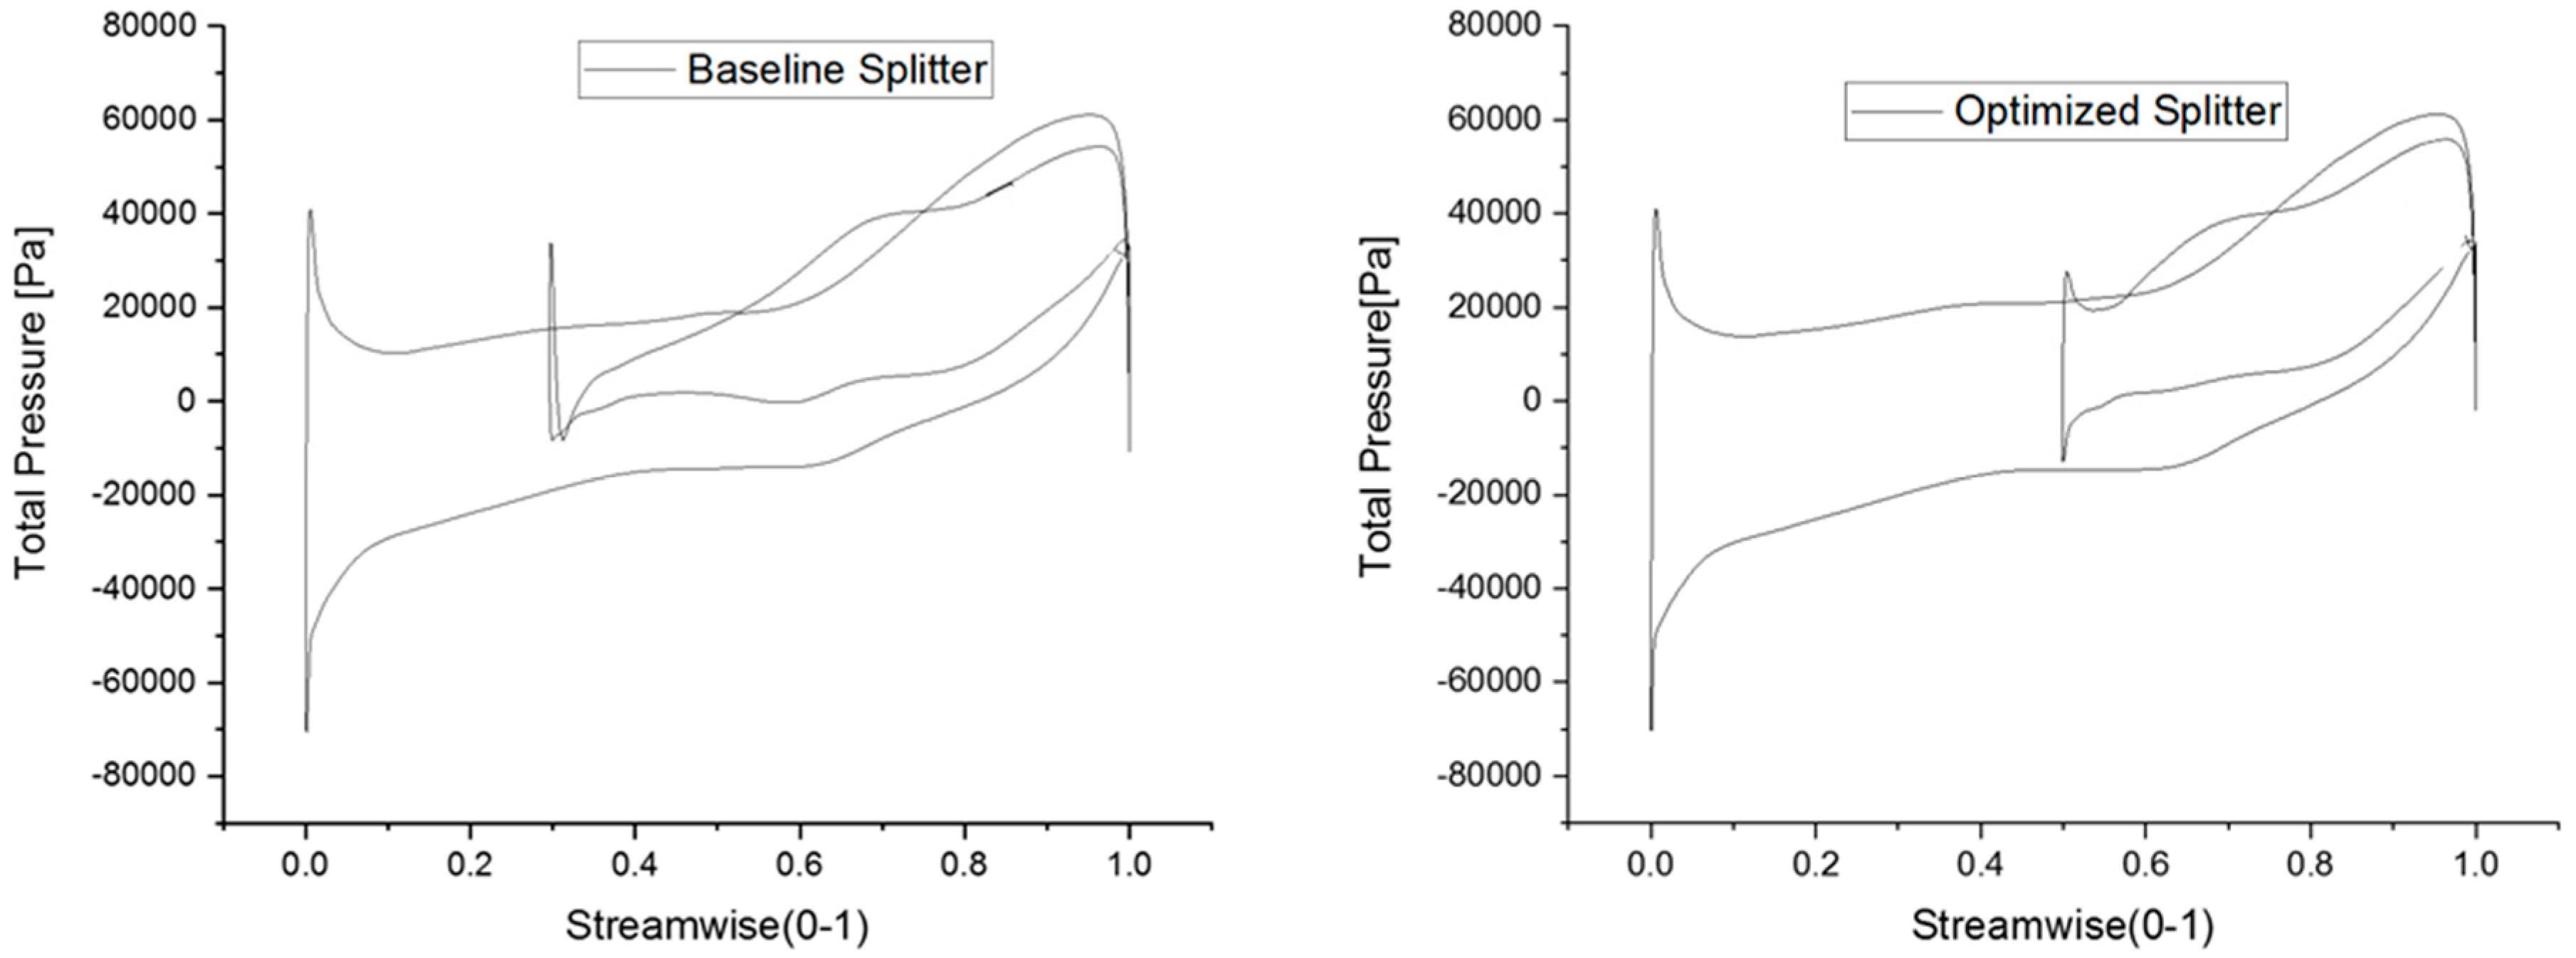
5.2. Comparison of the Baseline Splitter (Optimized Main-Base Splitter) and Optimized Splitter Impeller (Optimized Main-Optimized Splitter)

The LE position of the splitter blades was investigated on the beta distribution optimized (main blade optimized) impeller. As an optimization result, total-to-total isentropic efficiency was predicted as 76.6%, and RANS verified this result as 76.4% by CFD simulation. The results showed that the optimized LE location ( d m h u b = 48% and d m s h r = 50%) was shifted downstream by almost 20% in comparison with the baseline LE ( d m h u b = 30% and d m s h r = 30%), and efficiency improvement was observed as 0.4% at the design point. Furthermore, CFD simulations were carried out for several off-design points to investigate the effect of splitter position on the wide operation range. Figure 21 indicates that the baseline splitter achieved a higher efficiency at lower mass-flow rates (near-surge point). However, the optimized splitter achieved a higher efficiency at the design point and higher mass flow rates (near-choke point). Therefore, we can conclude that the optimized splitter blade cannot affect positively for wide operation range of compressor impeller.
The total-to-total pressure ratio was also compared for both the baseline and optimized splitters at the wide operation range. The pressure ratio was calculated at design point as 2.036 and 2.044 for the baseline splitter and optimized splitter, respectively. These negligible changes in pressure ratio were also observed at the wide operation range (Figure 22). Therefore, we can say there was no pressure ratio improvement based on optimization of the splitter.
The Mach number and blade loading were examined at near shroud (span 0.8) to find the reasons for efficiency improvement based on the shortened splitter blade. Figure 23 shows that flow was better captured with a lower Mach number by the shortened splitter blade than with the baseline one. Therefore, reduction in flow blockage and skin friction could be expected. These reductions, therefore, might have led to improved efficiency.
Furthermore, smoother flow was observed at the LE of the short splitter blade. Consequently, better blade loading was created around that region (Figure 24). This better flow stream might have affected the efficiency improvement.

6. Conclusions

This research aimed to increase the total-to-total isentropic efficiency of a compressor with wide operation range. Therefore, a single-objective optimization technique was performed by the screening method coupled with the non-parametric regression metamodel through three-dimensional RANS analyses. Initially, the full blade was optimized considering only beta distribution. Subsequently, the LE location of splitter blade was investigated to find the optimal LE position. As a result, the following were observed:
  • After two consecutive optimization processes, a 2.2% efficiency improvement (1.8% based on main blade optimization, 0.4% based on LE location optimization of splitter blade) was observed at the design point as well as the near-choke point. However, similar improvements were not seen in the near-surge region.
  • Beta distribution of the main blade and LE location of the splitter blade are adequate parameters to achieve dramatic aerodynamic performance by the optimization process.
  • Significant aerodynamic improvement in the micro impeller after the main blade focused optimization procedure indicated that splitter blades could be independently investigated; it was not necessary to assume they were short versions of the main blade.
  • Considering different parameterization method on the beta distribution could reduce design points on the fourth and higher-order Bezier curves in comparison to conventional method. Therefore, optimization performance would be increased.
  • The LE location of the splitter blade is also an important parameter that enables researchers to better capture the flow and provide better blade loading at the LE, even though it does not have significant impact on the efficiency.

Author Contributions

In this paper, O.F.A. designed the optimization process, performed the aerodynamic optimization analyses, and wrote the manuscript. J.-E.Y. supervised the research, created the methodology, and reviewed the manuscript. T.N. coordinated the research activities based on the schedule.

Funding

This research was funded by the Center for Environmentally Friendly Vehicles (CEFV) as the Global-Top Project of the Ministry of Environment, Korea (KMOE), grant number 2016002070003.

Acknowledgments

This research was supported by the Center for Environmentally Friendly Vehicles (CEFV) as the Global-Top Project of the Ministry of Environment, Korea (KMOE).

Conflicts of Interest

The authors declare no conflict of interest.

References

  1. Trigg, M.A.; Tubby, G.R.; Sheard, A.G. Automatic genetic optimization approach to two-dimensional blade profile design for steam turbines. ASME J. Turbomach. 1999, 121, 11–17. [Google Scholar] [CrossRef]
  2. Casey, M.; Gersbach, F.; Robinson, C. An optimization technique for radial compressor impellers. In Proceedings of the ASME Turbo: Power for Land, Sea, and Air, Berlin, Germany, 9–13 June 2008; pp. 2401–2411. [Google Scholar]
  3. Benini, E. Optimal Navier-Stokes design of compressor impellers using evolutionary computation. Int. J. Comput. Fluid Dyn. 2003, 17, 357–369. [Google Scholar] [CrossRef]
  4. Cho, S.-Y.; Ahn, K.-Y.; Lee, Y.-D.; Kim, Y.-C. Optimal design of a centrifugal compressor impeller using evolutionary algorithms. Math. Probl. Eng. 2012, 1–22. [Google Scholar] [CrossRef]
  5. Kim, J.H.; Choi, J.H.; Husain, A.; Kim, K.Y. Multi-objective optimization of a centrifugal compressor impeller through evolutionary algorithms. Proc. Inst. Mech. Eng. Part A J. Power Energy 2010, 224, 711–721. [Google Scholar] [CrossRef]
  6. Li, X.; Liu, Z.; Lin, Y. Multipoint and multiobjective optimization of a centrifugal compressor impeller based on genetic algorithm. Math. Probl. Eng. 2017. [Google Scholar] [CrossRef]
  7. Kim, J.-H.; Choi, J.-H.; Kim, K.-Y. Surrogate modeling for optimization of a centrifugal compressor impeller. Int. J. Fluid Mach. Syst. 2010, 3, 29–38. [Google Scholar] [CrossRef]
  8. Kim, J.; Choi, J.; Kim, K. Design optimization of a centrifugal compressor impeller using radial basis neural network method. ASME Turbo Expo 2009, 443–451. [Google Scholar] [CrossRef]
  9. Pierret, S.; Van Den Braembussche, R.A. Turbomachinery blade design using a Navier-Stokes solver and artificial neural network. ASME J. Turbomach. 1999, 121, 326–332. [Google Scholar] [CrossRef]
  10. Okui, H.; Verstraete, T.; Van Den Braembussche, R.A.; Alsalihi, Z. Three dimensional design and optimization of a Transonic Rotor in axial flow compressors. In Proceedings of the ASME 2011 Turbo Expo: Turbine Technical Conference and Exposition, Vancouver, BC, Canada, 6–10 June 2011; pp. 77–88. [Google Scholar]
  11. Verstraete, T.; Alsalihi, Z.; Van Den Braembussche, R.A.; Alsalihi, Z. Multidisciplinary optimization of a radial compressor for micro gas turbine applications. In Proceedings of the ASME Turbo: Power for Land, Sea, and Air, Montreal, QC, Canada, 14–17 May 2007. [Google Scholar]
  12. Whitfield, A.; Baines, N.C. Design of Radial Turbomachines; Long-man Scientific & Technical: Harlow, UK; New York, NY, USA, 1990. [Google Scholar]
  13. Dixon, S.L. Fluid Mechanics, and Thermodynamics of Turbomachinery, 5th ed.; Elsevier Butterworth-Heinemann: Oxford, UK, 1998. [Google Scholar]
  14. Chen, H.; Baines, N. Analytical optimization design of radial and mixed flow turbines. J. Power Energy 1992, 206, 177–187. [Google Scholar] [CrossRef]
  15. Moussavi, S.A.; Hajilouy Benisi, A.; Durali, M. Effect of splitter leading edge location on performance of an automotive turbocharger compressor. Energy 2017, 123, 511–520. [Google Scholar] [CrossRef]
  16. Van Den Braembussche, R.A.; Alsalihi, Z.; Verstraete, T.; Matsuo, A.; Ibaraki, S.; Sugimoto, K.; Tomita, I. Multidisciplinary Multipoint Optimization of a Transonic Turbocharger Compressor. In Proceedings of the ASME Turbo Expo: Turbine Technical Conference and Exposition, Copenhagen, Denmark, 11–15 June 2012. [Google Scholar]
  17. Farin, G. Curves and Surfaces for Computer Aided Geometric Design; Elsevier Inc.: New York, NY, USA, 1993. [Google Scholar]
  18. Montgomery, D.C. Design and Analysis of Experiments; Wiley: New York, NY, USA, 2006. [Google Scholar]
  19. Hazelton, M.L. Nonparametric Regression, 2nd ed.; Elsevier Wright JDBT-IE of the S& BS: Oxford, UK, 2015; pp. 867–877. [Google Scholar] [CrossRef]
  20. Fan, J. Design-adaptive nonparametric regression. J. Am. Stat. Assoc. 1992, 87, 998–1004. [Google Scholar] [CrossRef]
  21. Chagny, G.; Roche, A. Adaptive estimation in the functional nonparametric regression model. J. Multivar. Anal. 2016, 146, 105–118. [Google Scholar] [CrossRef] [Green Version]
  22. Miyamoto, H.; Nakashima, Y.; Ohba, H. Effect of splitter blades on the flows and characteristics in centrifugal impeller. JSME Int. J. 1992, 35. [Google Scholar] [CrossRef]
  23. ANSYS Inc. ANSYS Bladegen User’s Guide; ANSYS Inc.: Canonsburg, PA, USA, 2011. [Google Scholar]
  24. ANSYS Inc. ANSYS TurboGrid User’s Guide; ANSYS Inc.: Canonsburg, PA, USA, 2011. [Google Scholar]
  25. Menter, F.R.; Kuntz, M.; Langtry, R. Ten Years of Industrial Experience with SST Turbulence Model. In Proceedings of the Fourth International Symposium on Turbulence, Heat Transfer, Antalya, Turkey, 12–17 October 2003. [Google Scholar]
  26. ANSYS Inc. ANSYS CFX User’s Guide; ANSYS Inc.: Canonsburg, PA, USA, 2011. [Google Scholar]
  27. ANSYS Inc. ANSYS DesignXplorer User’s Guide; ANSYS Inc.: Canonsburg, PA, USA, 2011. [Google Scholar]
  28. Li, Z.; Zheng, X. Review of design optimization methods for turbomachinery aerodynamics. Prog. Aerosp. Sci. 2017, 93, 1–23. [Google Scholar] [CrossRef]
  29. Pinto, J.M.; Gut, J.A.W. A screening method for the optimal selection of plate heat exchanger configurations. Braz. J. Chem. Eng. 2002, 19, 433–439. [Google Scholar] [CrossRef] [Green Version]
  30. Xu, C.; Amano, R.S. Meridional Considerations of the centrifugal compressor development. Int. J. Rotat. Mach. 2012. [Google Scholar] [CrossRef]
Figure 1. Definition of beta (β) distribution and the meridional contour of the impeller and location of splitter leading edge.
Energies 11 01827 g001
Figure 2. Beta distribution at hub and shroud curve.
Energies 11 01827 g002
Figure 3. Definition of rake angle and illustration of theta angle distribution on the impeller.
Energies 11 01827 g003
Figure 4. Meridional position of the leading edge of the splitter blade for the base centrifugal compressor.
Energies 11 01827 g004
Figure 5. Discretization of the impeller inlet, outlet, and blade passage.
Energies 11 01827 g005
Figure 6. Discretization of the volute with a five-layer inflation.
Energies 11 01827 g006
Figure 7. CFD model and boundary conditions.
Energies 11 01827 g007
Figure 8. Goodness-of-fit of the response surface using non-parametric regression and the response surface of β h ,   L E ( β h 1 )– β h ,   T E ( β h 2 ) on the efficiency.
Energies 11 01827 g008
Figure 9. Local sensitivity of the design parameters for the efficiency and the shaft torque (TQ).
Energies 11 01827 g009
Figure 10. Single-objective optimization procedure for the beta distribution.
Energies 11 01827 g010
Figure 11. Local sensitivity and goodness-of-fit for efficiency.
Energies 11 01827 g011
Figure 12. Total-to-total efficiency comparison between the optimal and baseline impellers.
Energies 11 01827 g012
Figure 13. Total-to-total pressure comparison between the optimal and baseline impellers.
Energies 11 01827 g013
Figure 14. Beta distribution comparison between the optimal and baseline impellers.
Energies 11 01827 g014
Figure 15. Mach number distribution for span 0.2 at the blade-to-blade contour.
Energies 11 01827 g015
Figure 16. Mach number distribution for span 0.5 at the blade-to-blade contour.
Energies 11 01827 g016
Figure 17. Mach number distribution for span 0.8 at the blade-to-blade contour.
Energies 11 01827 g017
Figure 18. Static entropy distribution for span 0.2 at the blade-to-blade contour.
Energies 11 01827 g018
Figure 19. Static entropy distribution for span 0.5 at the blade-to-blade contour.
Energies 11 01827 g019
Figure 20. Static entropy distribution for span 0.8 at the blade-to-blade contour.
Energies 11 01827 g020
Figure 21. Total-to-total efficiency comparison between the optimal and baseline splitters.
Energies 11 01827 g021
Figure 22. Total-to-total pressure comparison between the optimal and baseline splitters.
Energies 11 01827 g022
Figure 23. Mach number distribution for span 0.8 at the blade-to-blade contour.
Energies 11 01827 g023
Figure 24. Blade loading comparison at span 0.8 for the baseline and optimized splitter blades.
Energies 11 01827 g024
Table 1. Geometric specifications of original micro compressor.
Geometric SpecificationsValue
Impeller inlet hub diameter9 mm
Impeller inlet tip diameter24 mm
Impeller exit tip diameter32.5 mm
Impeller exit width2.4 mm
Number of blades main/splitter5/5
Table 2. Bounded values of design parameters.
Design ParametersBoundary Values
β h , L E 55° ≤ β h , L E ≤ 65°
Δ β h 30° ≤ Δ β h ≤ 60°
β h , m a x 70° ≤ β h , m a x ≤ 76°
β h , T E 50° ≤ β h , T E ≤ 60°
β s , L E 25° ≤ β s , L E ≤ 35°
Δ β s 0° ≤ Δ β s ≤ 5°
β s , m a x 45° ≤ β s , m a x ≤ 55°
β s , T E 35° ≤ β s , T E ≤ 50°
d m h u b 0% ≤ d m h u b ≤ 55%
d m s h r 0% ≤ d m s h r ≤ 55%
Table 3. Mesh-Independency and computational time.
Size Factor in Mesh Size TabTotal Element SizeComputational TimeIterationIsentropic EfficiencyPressure Ratio
1.11,272,054364 min67074.64%1.99
1952,786301 min57074.15%1.98
0.9680,744282 min63573.58%1.97
0.8408,109184 min52873.02%1.96
0.7300,372176 min57172.8%1.95
Table 4. Optimal values of the beta distribution.
Design Parameters   β h , L E   Δ β h   β h , m a x   β h , T E   β s , L E   Δ β s   β s , m a x   β s , T E
Optimal Values55.3°53.8°71.9°54.6°25.6°2.3°52.9°45.9°
Table 5. Value of Beta distribution parameters of reference and optimized impellers.
Design ParametersBaseline ImpellerOptimized Impeller
β h , L E 58°55.3°
Δ β h 44°53.8°
β h , m a x 71°71.9°
β h , T E 54°54.6°
β s , L E 28°25.6°
Δ β s 2.3°
β s , m a x 48°52.9°
β s , T E 42.5°45.9°

