1. Introduction
Due to the rising costs and the scarce availability and depletion of traditional fossil fuels, efforts have intensified in looking for new sources that are preferably renewable in nature. The most abundant among renewable sources are solar and wind. Increasing the overall system’s efficiency is another major concern, which has tremendous overall system effect, and has increased interest in other small resources as well. Thermoelectric generators (TEG) perfectly fit into this category [
1]. TEGs are solid-state devices, which generate electricity directly from heat, in what is known as the Seebeck effect [
2]. The temperature gradient across the structure of the device is maintained to generate lucrative amounts of electrical energy that may be used to charge batteries and to add load support. The conversion efficiency of TEG material is characterized by the figure of merit (
ZT), which is defined as
, where
, and
k are Seebeck coefficient, electrical conductivity, operating temperature, and the thermal conductivity of the material, respectively [
3].
ZT for most TEG materials is around 1, however, feasible designs currently adapt materials with
around 2~3.
Historically, TEGs have low efficiencies in the range of 5%, which has kept their use limited to specialized medical, remote sensing, space, and military applications [
4]. However, the recent trend for harvesting energy at all scales, coupled with the technological development of new power processing devices and circuits, has placed the TEG on the list of viable energy sources that may be exploited and improved for commercial use. The recent cost reduction of TEG manufacturing, in addition to its silent operation, maintenance free service, and long life-time (~25–30 years) has increased attention to this vital energy production tool [
5,
6]. Recent development in the thermoelectric material manufacturing and the introduction of nanotechnology in the process has boosted new generations of TEGs with higher efficiency ranges that are predicted to reach 15–20% [
3].
The TEG can be used as an energy-harvesting device that recovers waste heat from sources such as industrial processes, which will result in an overall increase in the efficiency of these processes. They may also be utilized to harness power form some renewable sources such as solar thermal and geothermal energy sources. Tailored applications for TEG systems include low power autonomous sensors and wearable human diagnosis devices [
7,
8]. TEGs can now be successfully employed to scavenge energy from the rejected heat by many processes such as automotive [
9], stove tops [
10], geothermal [
11] and power plants [
12]. Heat rejected from exhaust gas systems are most likely to be the most attractive area of application for TEG energy-harvesting systems, and will be the real motivation for development.
Adaptation of power electronic converter interfacing has improved the capability of controlling non-conventional power sources as well as maximizing energy-harvesting due to the implementation of maximum power point tracking (MPPT) algorithms. To increase the generated power from the TEG module, a MPPT algorithm should be employed, to push the TEG’s operating point to its optimum location. A DC voltage source in series with an internal resistance is used to model the TEG characteristics and can be used to verify MPPT algorithms under different dynamics [
13]. The MPPT algorithm adaptively changes the load to match the internal resistance of the TEG module to secure maximum power transfer.
Many MPPT algorithms have been used for TEG systems, most of which were originally developed for photovoltaic (PV) systems [
14,
15,
16,
17]. The perturb and observe (P&O) method is the most widely used, due to its simple implementation and reliability. The most attractive feature of the P&O algorithm is its independence of actual circuit parameters and the variation of source/load conditions. However, this method does have some drawbacks, which are discussed in [
18]. Thus, modified MPPT algorithms are of recent and current research focus to overcome the flaws presented by conventional algorithms.
A PV module’s I-V characteristics are not linear, while in the case of the TEG, linearity governs the relationship between the voltage and current. The optimum operating point is related to the characteristics of the TEG module, as follows:
where
is the MPP voltage and
is the MPP current.
is the open circuit voltage and
is the short circuit current of the TEG.
or
is measured for proper operation of some of the main MPPT algorithms, [
19,
20,
21], in which it requires disconnecting the converter from the TEG module during the measurement action. Therefore, there is no energy flow during measurement, which can be at high frequency, especially in fast-dynamics systems where the temperature gradient is rapidly changing. In [
22], an open circuit voltage measurement technique that does not require disconnecting the TEG form the converter has been proposed. But, it can only be applied to converters with discontinuous input current, such as the buck and the buck-boost converters. The proposed method does not apply to continuous input current topologies, such as the boost converter.
In this paper, an expansion to the work in [
23] is presented where an innovative method for measuring both
and
without requiring disconnecting the converter form the TEG is proposed. The proposed technique is universal, and may be applied to all different types of converters and it is independent of the nature of the converter employed. The TEG module’s linear characteristics are exploited to derive the measurement approach. The measurement output will then be employed in the MPPT algorithm that is proposed in this paper. There are two modes of operation for the proposed MPPT algorithm, the P&O mode, which is used for fine tracking of the MPP and it is deployed when the temperature gradient across the structure is held nearly constant or it shows a slow rate of change with time. The other mode of operation is the transient mode, and it takes over when there is a fast or sudden change in the open circuit voltage due to a change in the temperature gradient. During this operating mode, the proposed
measurement method will be applied, to rapidly adjust for the new MPP location.
To maintain the MPPT algorithm controllability over a wide range of operating conditions, modeling and control of the power converter is essential for stable operation. To ensure that control theory is applicable in such circuits, feedback from various points in the system might be needed, such as the voltages and currents at both the input and output ports of the converters. Voltage and current sensing might not be the most trivial part of the design, as the placement of the sensors and their cost and accuracy, heavily affect the final product. Several researchers have attempted to minimize the number of sensors that were used for the control loops’ implementation [
24,
25,
26,
27,
28,
29,
30]. Some work has utilized estimation algorithms for some variables depending on the system models. Estimation techniques suffer from a stability point of view, as the dynamics of the power converter might shift the estimation accuracy beyond acceptable levels in addition to their complex implementation task. Reconstruction techniques are better, in the sense that one measured variable is decomposed into two or more variables using direct physical relations, which gives these methods the real time virtue over estimation techniques.
In this work, a novel voltage sensing approach is proposed in the DC/DC converters as well. The boost converter is selected as an example, but with the full capability to replicate the proposed method to other switching-type power converters. The voltage sensor is placed between two terminals of the circuit in which one is the switching terminal. Voltage equations during the ‘on’ and ‘off’ times of the converter’s main switch are constructed and voltage relations to the input and output terminals are derived. Simulation results and experimental verification show the effectiveness of the proposed MPPT algorithm and the voltage sensing technique.
2. System Configuration
2.1. TEG Characteristics
The principle of operation of the TEG module is based on the Seebeck effect, which states that an electromotive force appears between two semiconductors of different doping when a temperature gradient across the structure exists [
17,
31]. The developed voltage across the terminals of the TEG module is expressed by:
where
is the load voltage and
is the load current.
is the internal resistance of the TEG module.
is related to the TEG material and temperature difference, as shown in (3).
where
is the Seebeck coefficient of the material and
is the temperature difference between the hot and cold sides of the module. Higher voltage and current levels may be achieved with series and parallel connection of several modules.
The TEG can be electrically modeled under a constant temperature gradient as a voltage source with a series connected internal resistance [
13].
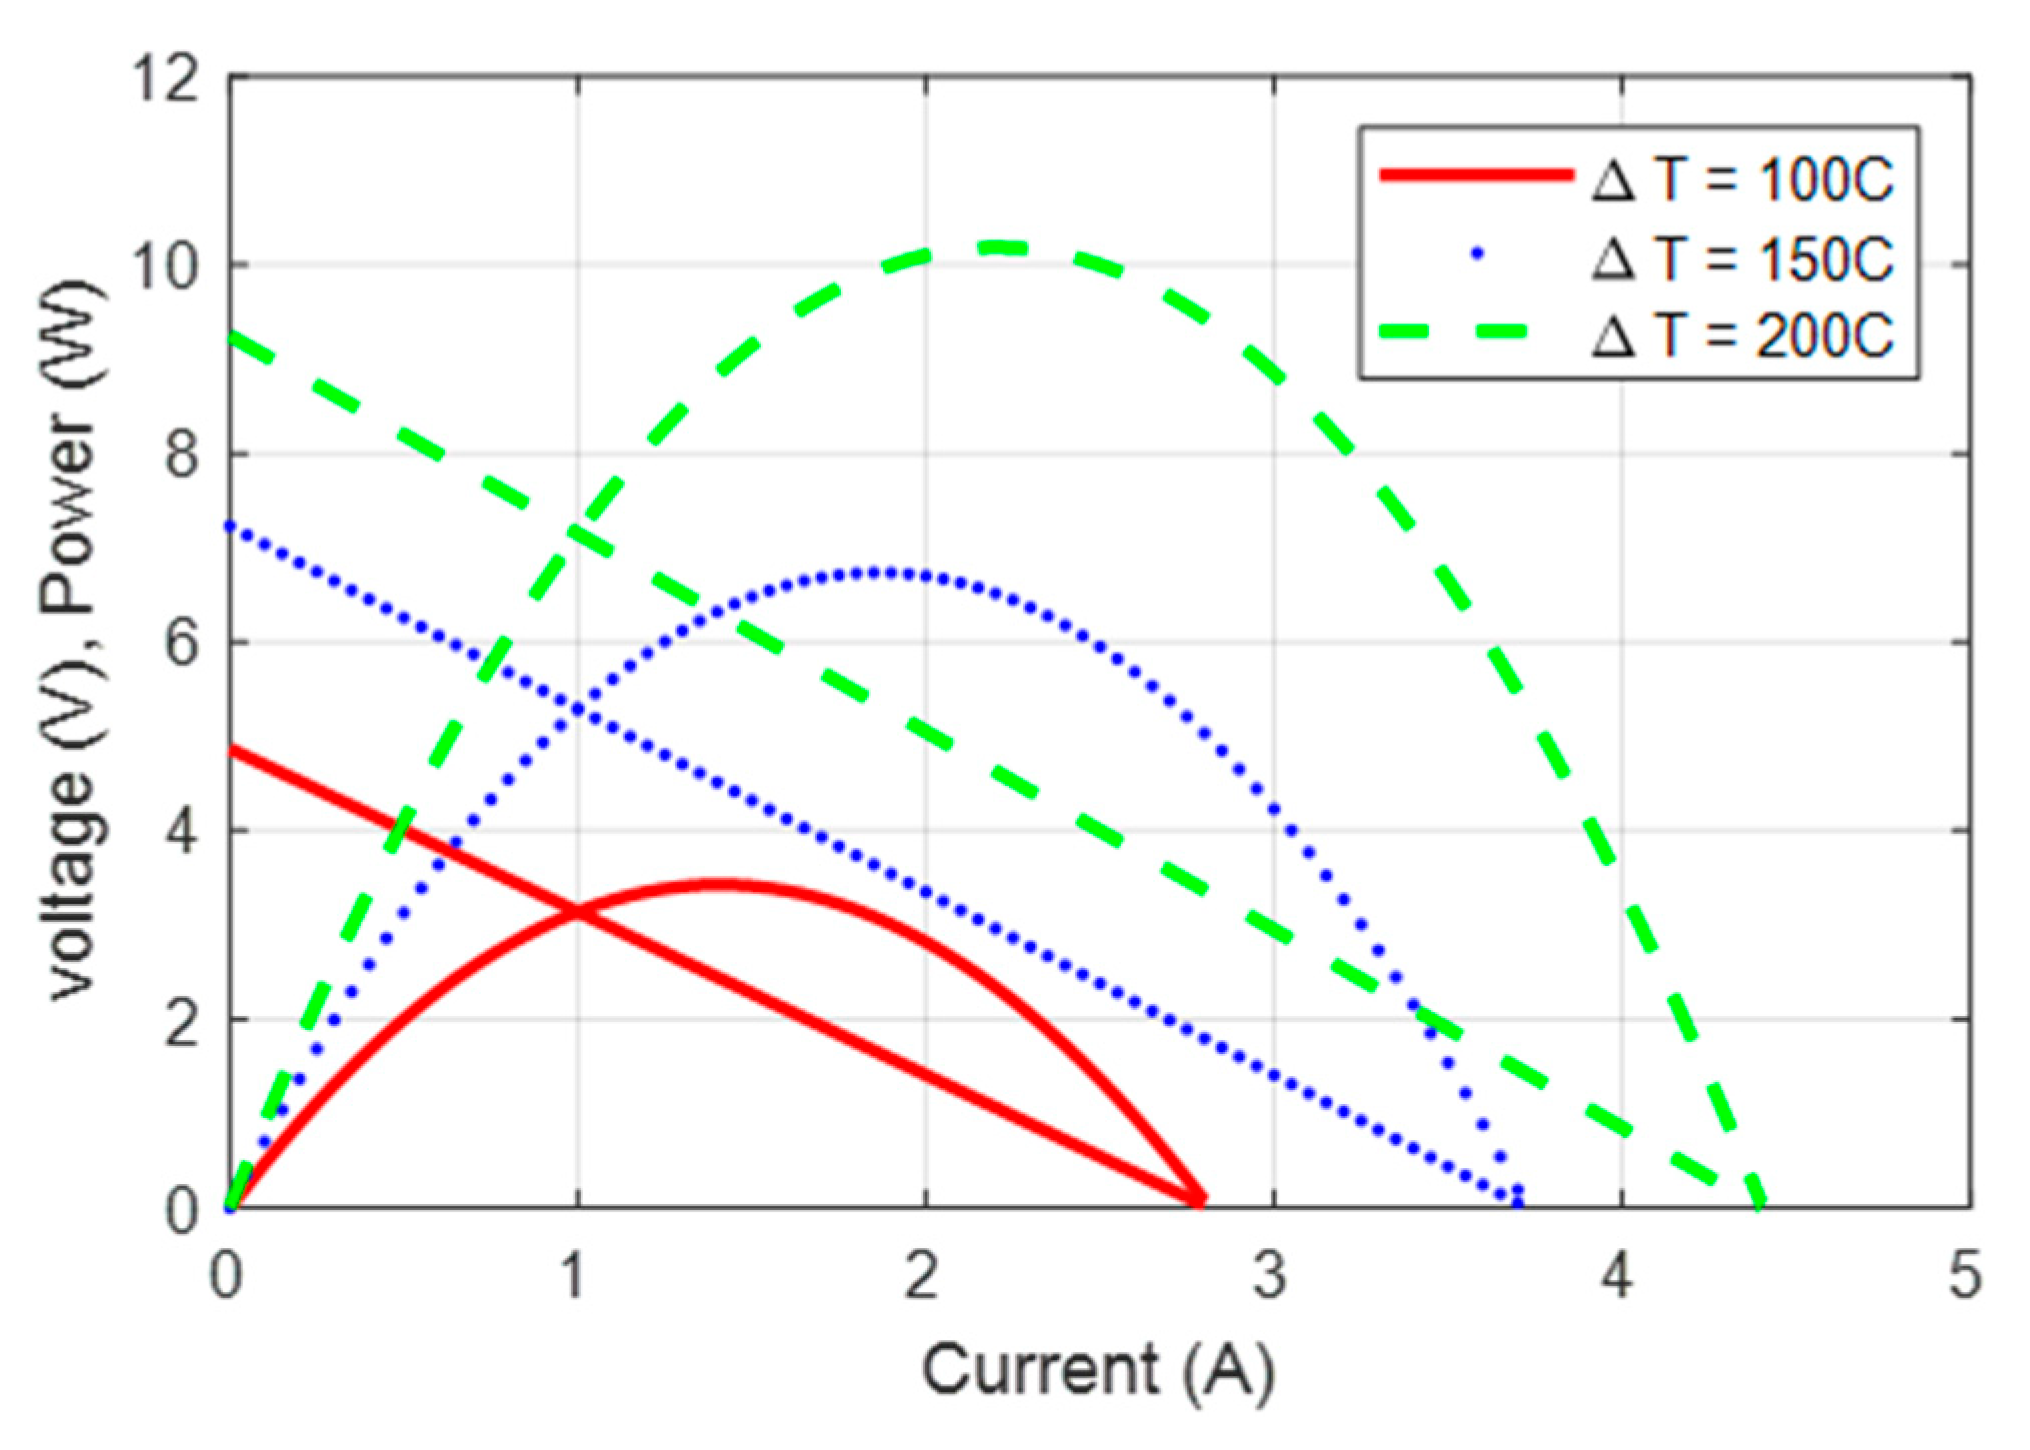
Figure 1 shows the typical TEG electrical characteristics, where it shows the current versus the voltage and power for the TEG module at different temperature gradients. It is clear that the optimum selection of the current will guarantee MPP operation, which is achieved by matching the load of the converter to the TEG internal resistance. Dynamic matching of the load for max power transfer is done by utilizing dc-dc converters. The boost converter is the most utilized power conditioning circuit for TEG modules, due to the high voltage gain ratio, simple to construct, and easy to control.
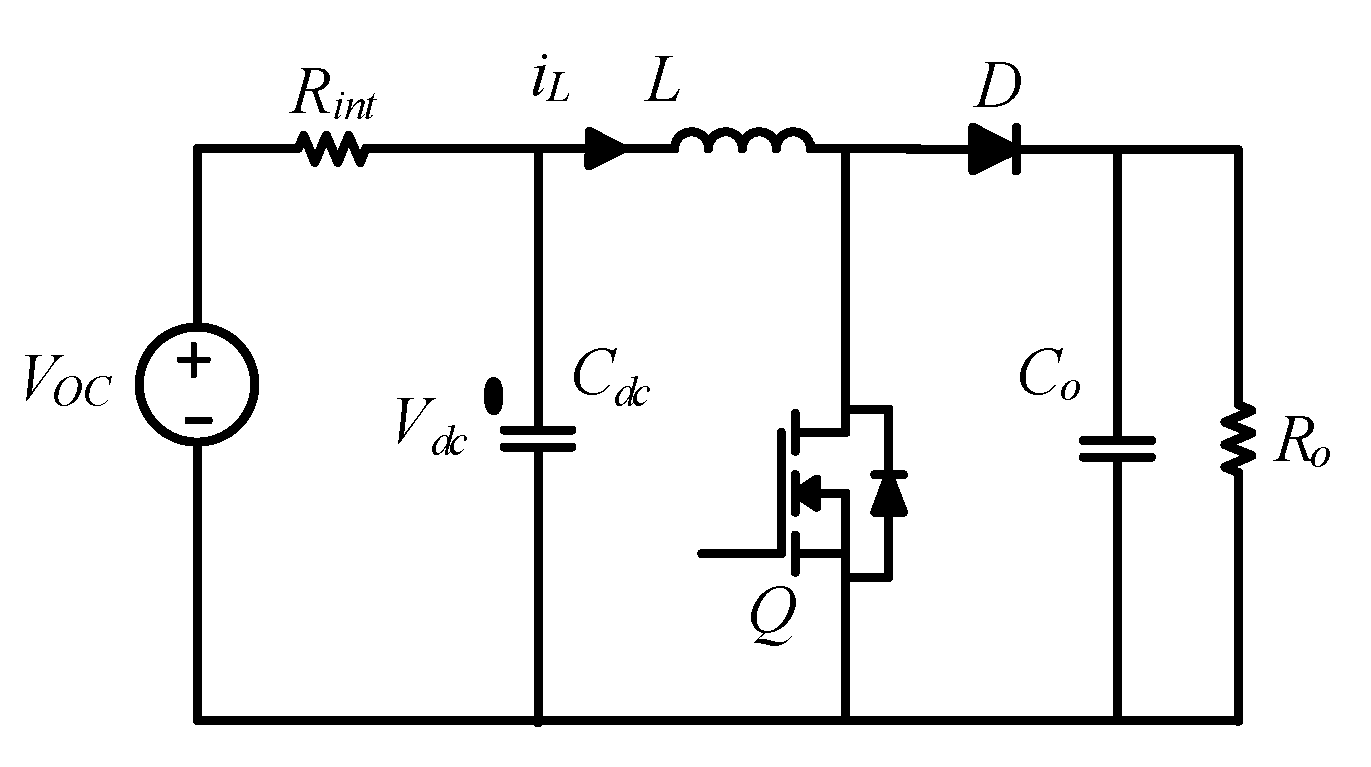
Figure 2 shows the boost converter that will be used in this paper, along with the TEG electrical model.
The input capacitor is used as a buffer for the output voltage of the TEG module and to support any load transients, but not too large as not to mask the true dynamics of the input source. As the inductor current is the output current of the TEG, it should be regulated to the optimum value to insure MPP operation. Another option to ensure MPP operation is to regulate the input voltage to its optimum value as well. Voltage control is usually slower than current control, but that highly depends on the input side capacitance. Dual loop control with current as the internal loop is also possible. This has the advantage of controlling both the transient voltages across the capacitor, and currents through the inductor, to guarantee that they are within the components’ ratings. In this paper, current control will be utilized to operate the converter at MPP and voltage control will be used to meet the battery charging requirements in the case of battery charging applications. In the case of a boost converter supplying a dynamic load, the voltage control loop is needed to regulate the output dc bus that interfaces with that load.
2.2. Open Circuit Voltage and Short Circuit Current Detection
From (2) and
Figure 1, it can clearly be seen that the MPP occurs when both the load current and the load voltage are regulated, such that the input impedance of the converter matches the internal resistance of the TEG module, and in this case, (1) is derived.
In essence, the MPPT point lies at the mid-point of the I-V characteristics line. Several methods have been proposed for measuring the open circuit voltage, which can then be used as a control input for the converter to guide the MPPT algorithm toward the optimum point. However, these methods need to physically disconnect the converter from the TEG to measure the port voltage and then use it for converter control. Measuring the voltage must happen at a frequency that is much higher than the dynamic speed of the system temperature variation to ensure that it captures all variations. This introduces system losses as no energy flows to the load during measurement. In this paper, an innovative approach to measure the voltage without the need to disconnect the converter from the TEG is proposed, as following:
First, the boost converter is assumed to be current controlled and that the P&O MPPT algorithm is deployed under normal operating conditions of the TEG. Normal conditions are defined as when the temperature gradient variation across the structure is slow. In this case, the current reference variation from the P&O algorithm will not induce large power increments at the output of the TEG, nor will it cause the output voltage of the TEG to vary sharply, since the step size of the reference current applied from the P&O algorithm is small enough to precisely track the MPP of the TEG.
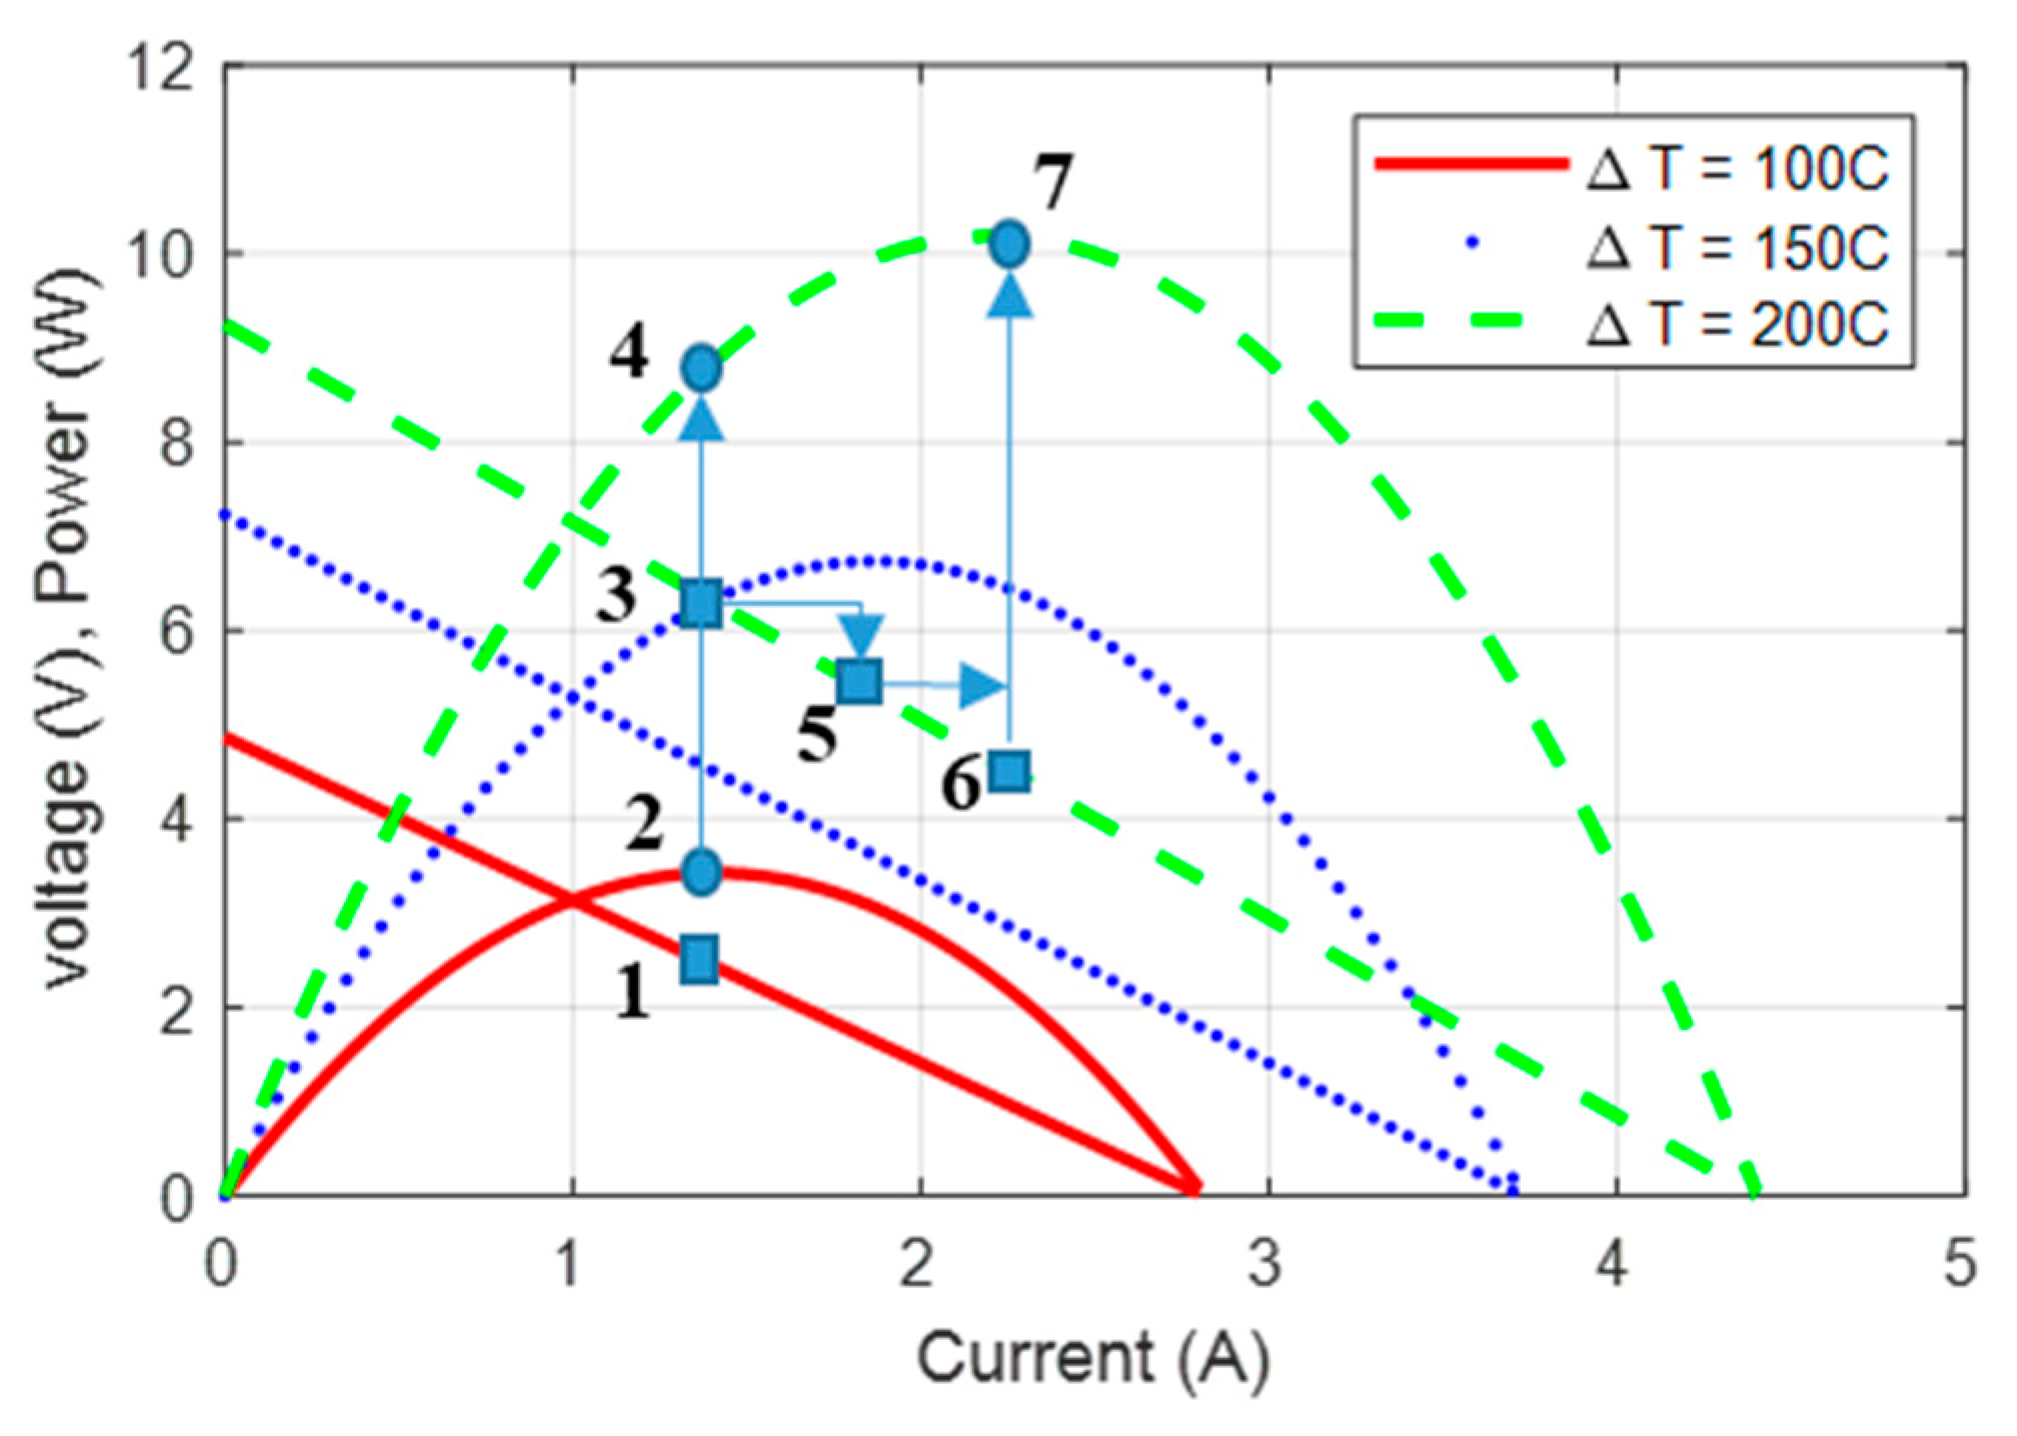
During sharp transients in the open circuit voltage of the TEG due to sudden temperature variation across the structure, first: the reference current to the boost converter is kept constant and it is not changed by the MPPT algorithm. This is represented by points 1–4 in
Figure 3. Point 1 is the optimum current command point for the TEG converter at
. When there is a sharp transient in the temperature gradient, the operating point over the power curve moves directly from point 2 to point 4, where the current is still fixed at point 1, which is the same as point 3. The circuit waits until it settles to the new voltage level at point 3. This operating point is recorded as
. A shift in the current command with suitable step size is then executed (e.g.,
) to push the operating point to point 5 in the I–V characteristics line. This step size depends on the system’s size and the TEG characteristics. The converter responds by regulating to the new current level at point 5, which will change the voltage at the output of the TEG to a new value (
). This is another point that is recorded. The linear characteristics of the TEG enable the construction of a straight line equation using two points (3 and 5) along its path, which are
. From these two points, the straight-line equation is formed, and the middle point (point 6) is determined by setting either the current or the voltage in the equation to zero. In this case, two points of operation is sufficient to measure both
or
. Ultimately, point 7 can be reached from point 3 in only two steps.
It should be noted that the shift in the current command (between point 3 and point 5 for example) is in the direction of the power increase or decrease during transients. During the measurement routine, the converter still delivers power to the output, hence, collecting more energy as compared to traditional methods. The measurement is independent of any offset that might exist in the voltage sensors, which can produce less accurate readings using traditional measurement techniques. Moreover, the measurement is fast as it takes only two iterations of the MPPT algorithm.
3. Proposed MPPT Control Algorithm
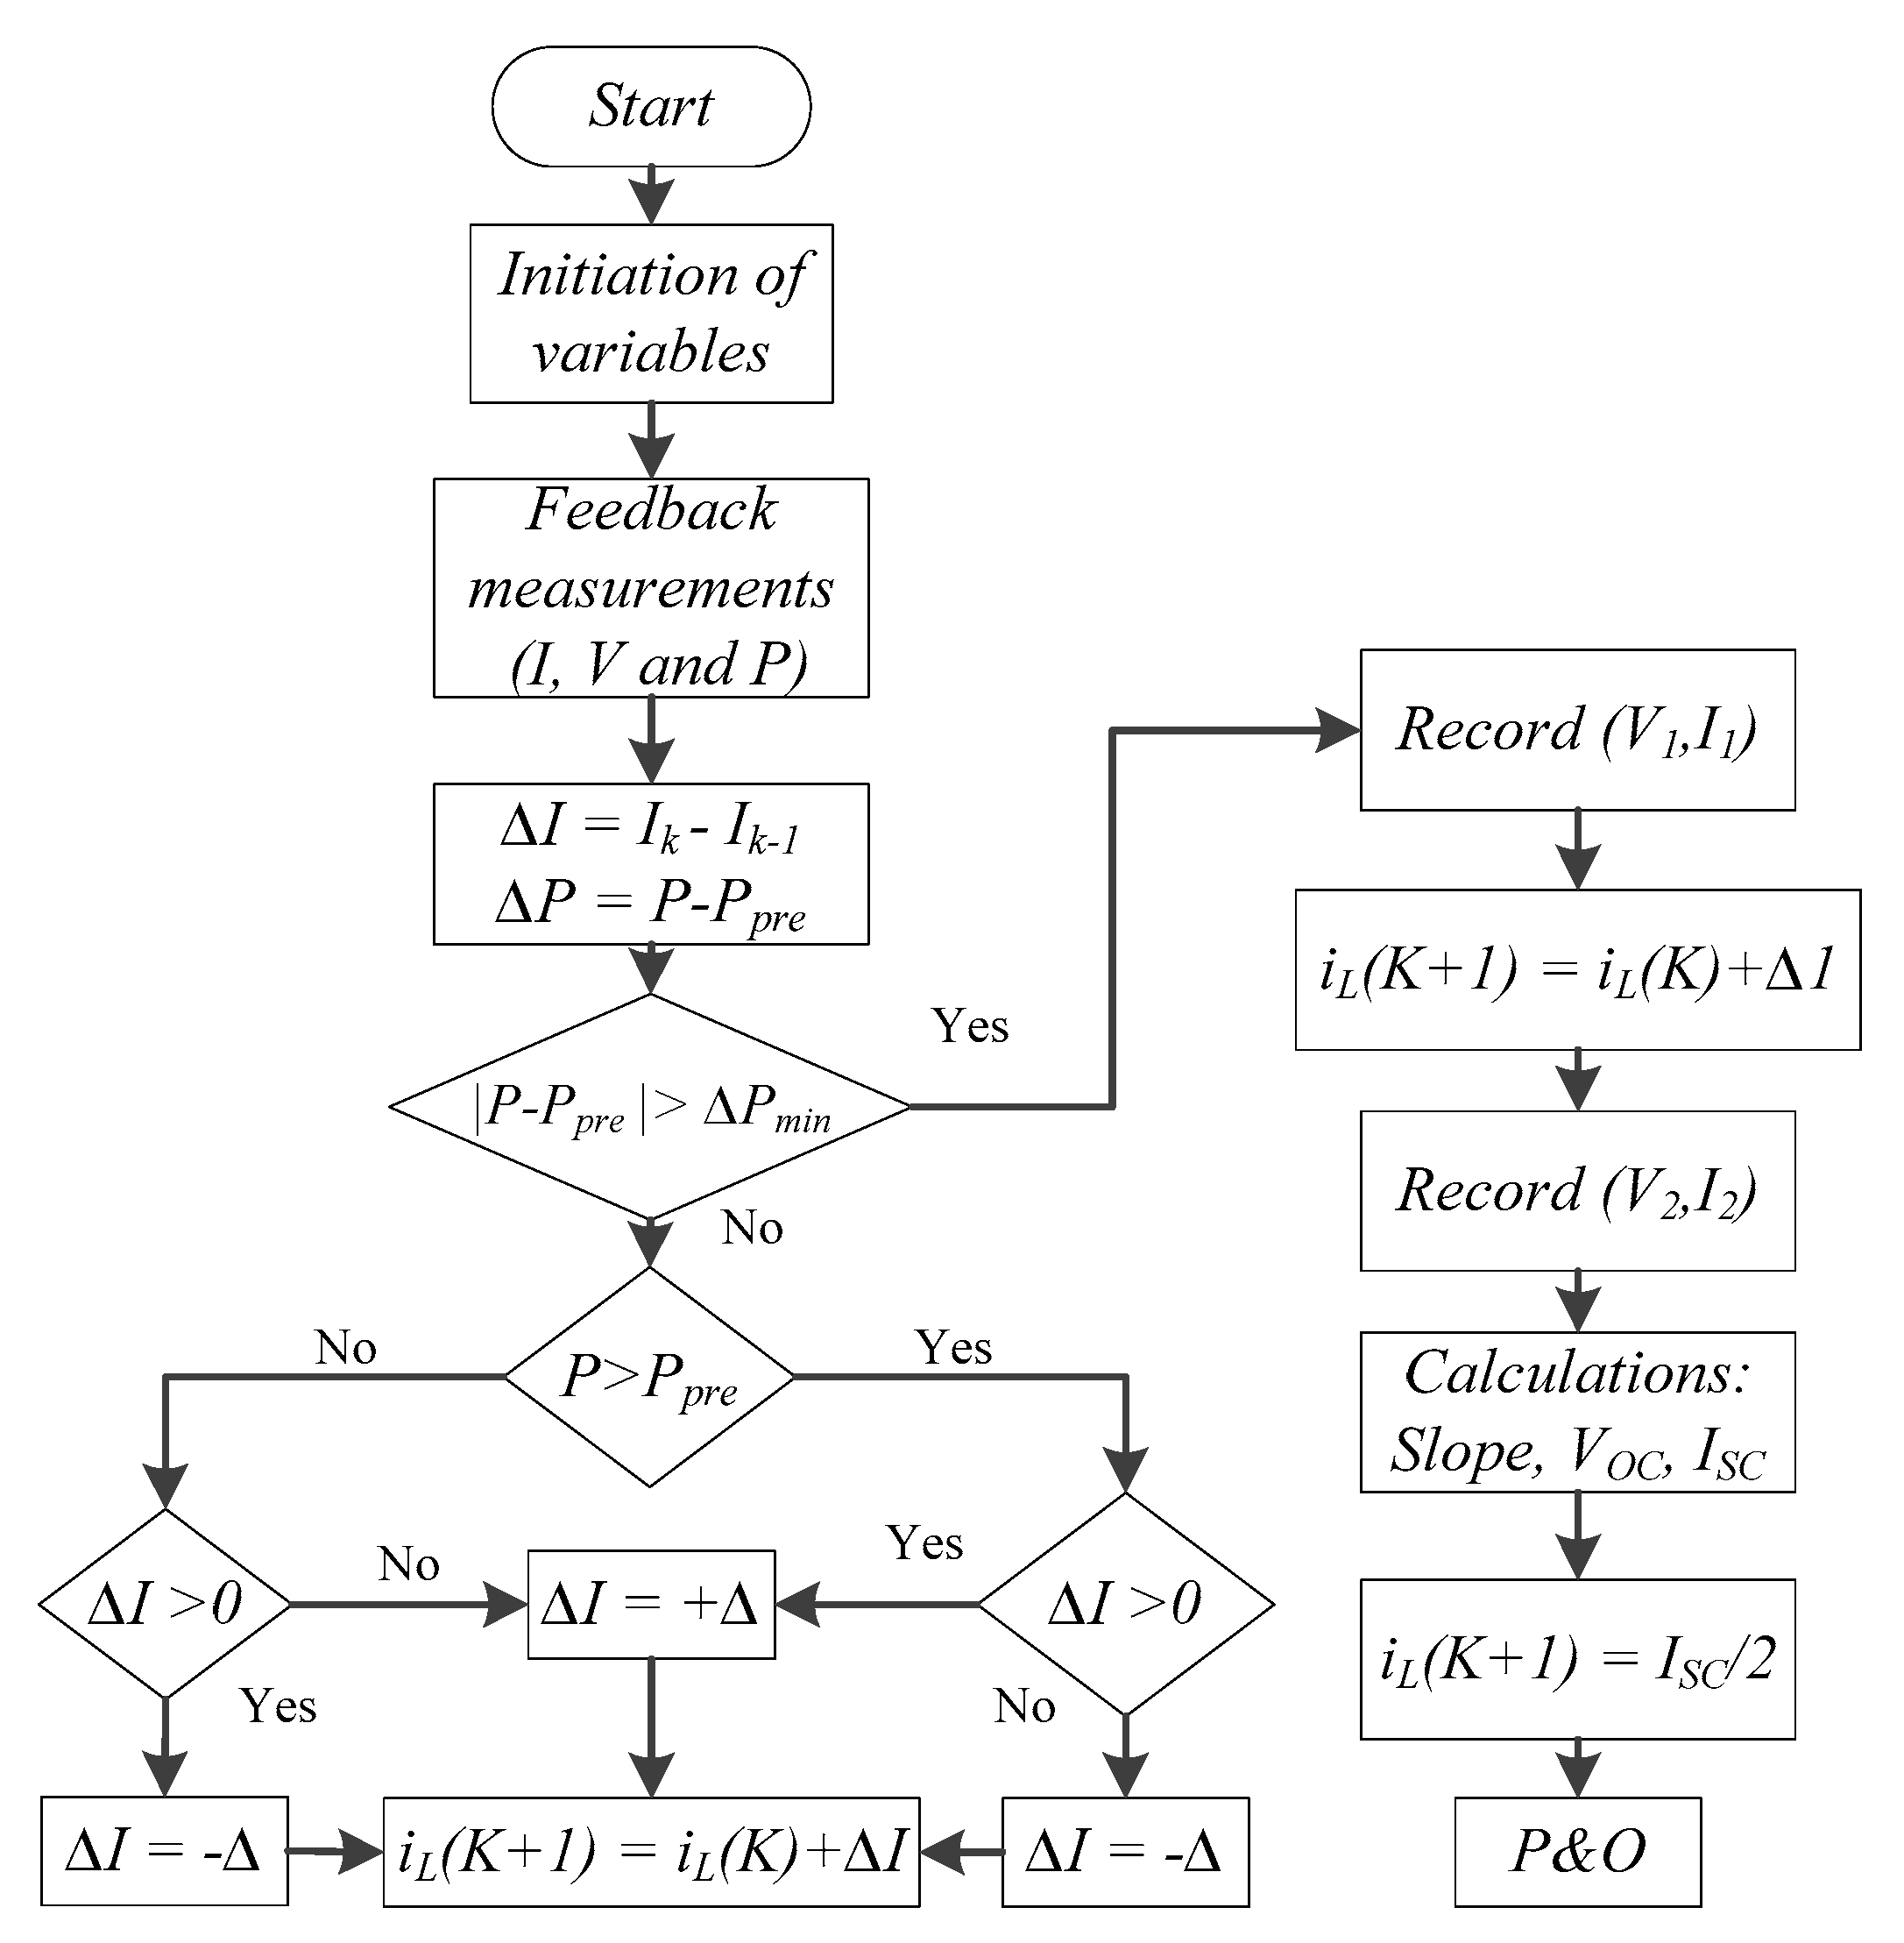
A flow chart for the proposed MPPT algorithm is shown in
Figure 4. First, the variables are measured and
and
are calculated. If
is less than a certain threshold, then it is concluded that the system is to run in the P&O mode, where incremental changes in power levels are small due to fine steps in the current command. If there is a sudden change in the open circuit voltage, due to sharp transients in the temperature gradient, large power increment is detected, and thus, the algorithm is operated in the transient mode. In this operating mode, the voltage and current readings of the last P&O step are recorded (i.e., before the algorithm moves to the transient mode). Then, the current is incremented by a sufficient magnitude to obtain distinct readings for the voltage and current to establish the other point needed to construct the line characteristics
for the TEG. The estimated relation is then used to find
and
. If the converter is current controlled, then the optimum current command would be
, which guarantees moving the operating point directly to the new MPP. Next, the system moves back to the normal P&O mode of operation.
The proposed MPPT algorithm uses the P&O mode for fine-tuning to the MPP, and the transient mode for the direct relocation of the operating point to the new MPP when there is a sudden change in the temperature gradient across the structure. The step size for the P&O mode is designed to be small in order to capture the closest point to the MPP and can be adaptive to be a scaled value of the measured power increment. The step size for the transient mode , is chosen such that the readings of the two points on the characteristics line are distinctive. It can be a design parameter that can be tuned for best performance.
4. Proposed Voltage Sensing Technique
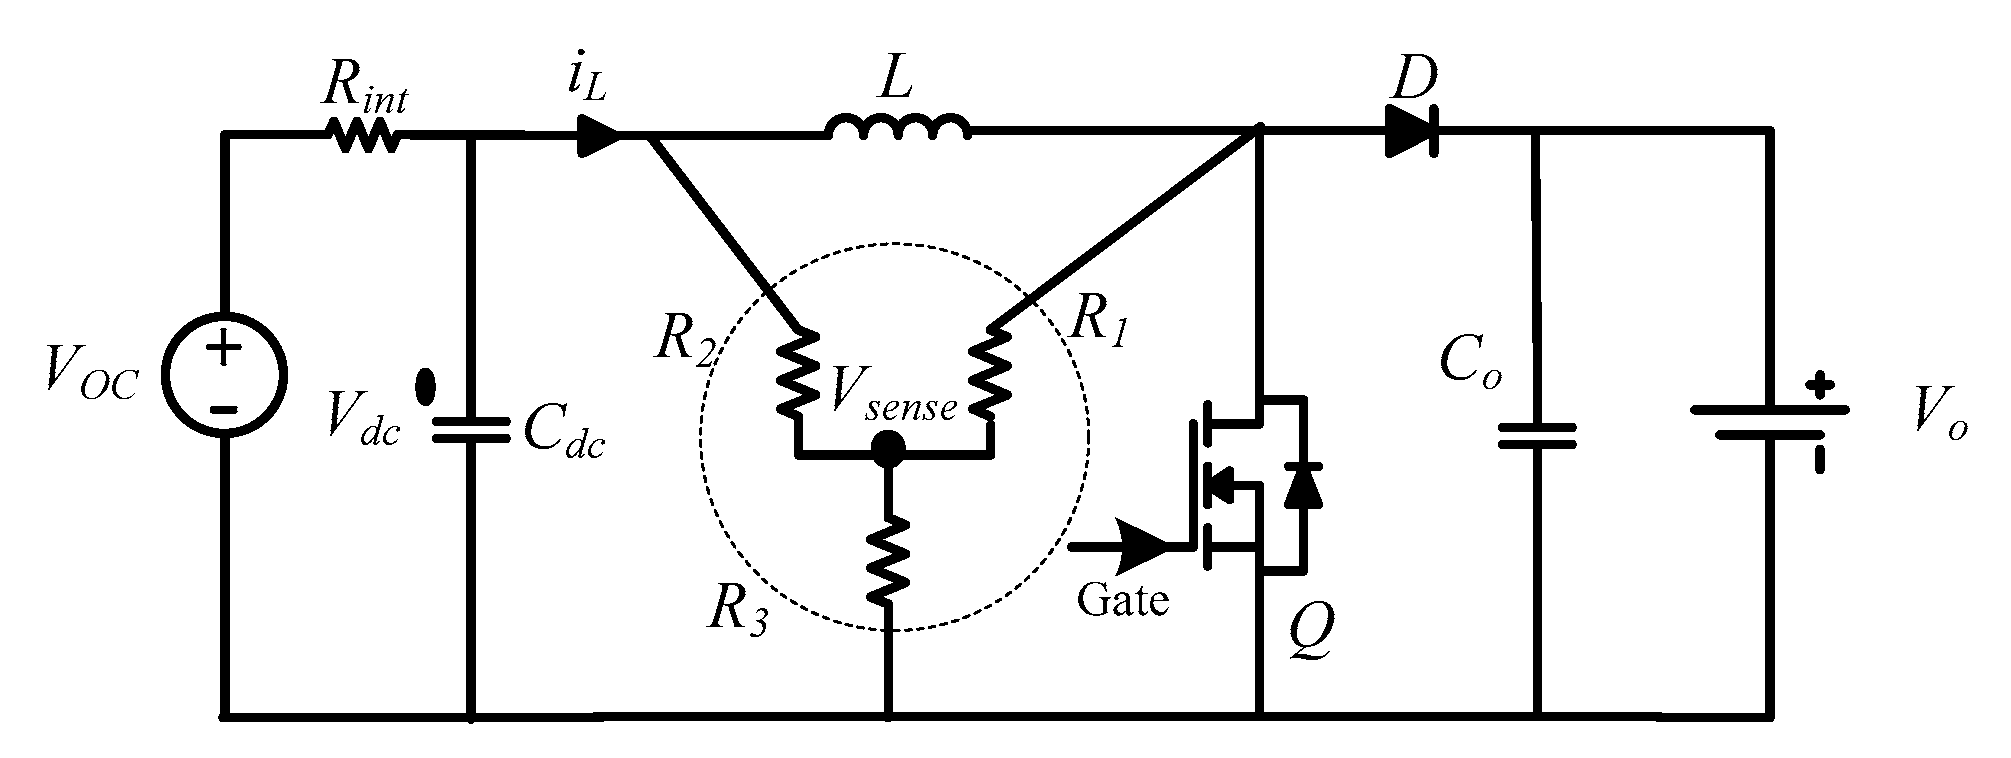
Figure 5 shows the schematic diagram of the boost converter under consideration. The output load in this case is a battery. The MPPT algorithm requires the collection of the power production information through the measurements of the input current and voltage. Moreover, the control objective of the MPPT algorithm is to tune the input voltage or current to its optimum point through dual control loops. While the input voltage is being measured and used in the control loops and MPPT algorithm, continuous monitoring of the output voltage is required to shift the controller from MPPT control to load matching (voltage mode control) in the case that the battery approaches its full charge (light load conditions). In the case where the converter is supplying a dynamic load instead of the battery, then control of the dc bus is needed, and in all cases, the output voltage information is needed to complete the cycle of the controller. The collection of the output voltage information is not intended in this paper to be used for the previously proposed MPPT algorithm, rather it is can be used to further control and monitor the load side, irrespective of load type.
For both control modes, MPPT and voltage mode control, the input and output voltages are needed. Usually two voltage sensors are placed at the input and output ports of the converter to acquire the voltage information in a real time manner. It should be noted that it is critical to have real time and direct measurements of the voltage for sensitive control implementation, especially if the battery is sensitive and excess charge cannot be permitted. Thus, utilizing estimation technique for either voltage might not be allowed.
In
Figure 5, the proposed voltage sensing circuitry is connected as a Y-connected resistive network. The voltage is sensed at the neutral point of the network as shown. The resistors
are design variables and they are large enough not to cause additional resistive losses in the circuit, common values ranges between
and 500
. The sensed voltage
is used to reconstruct the input and output voltage information at the same time. The idea of the connection of the Y-network is to attach one terminal to a reference point through
, and the second terminal to be constantly attached to a steady voltage, in this case
through
. The third terminal is connected to a switching voltage pole. In this case, to the switch voltage through
.
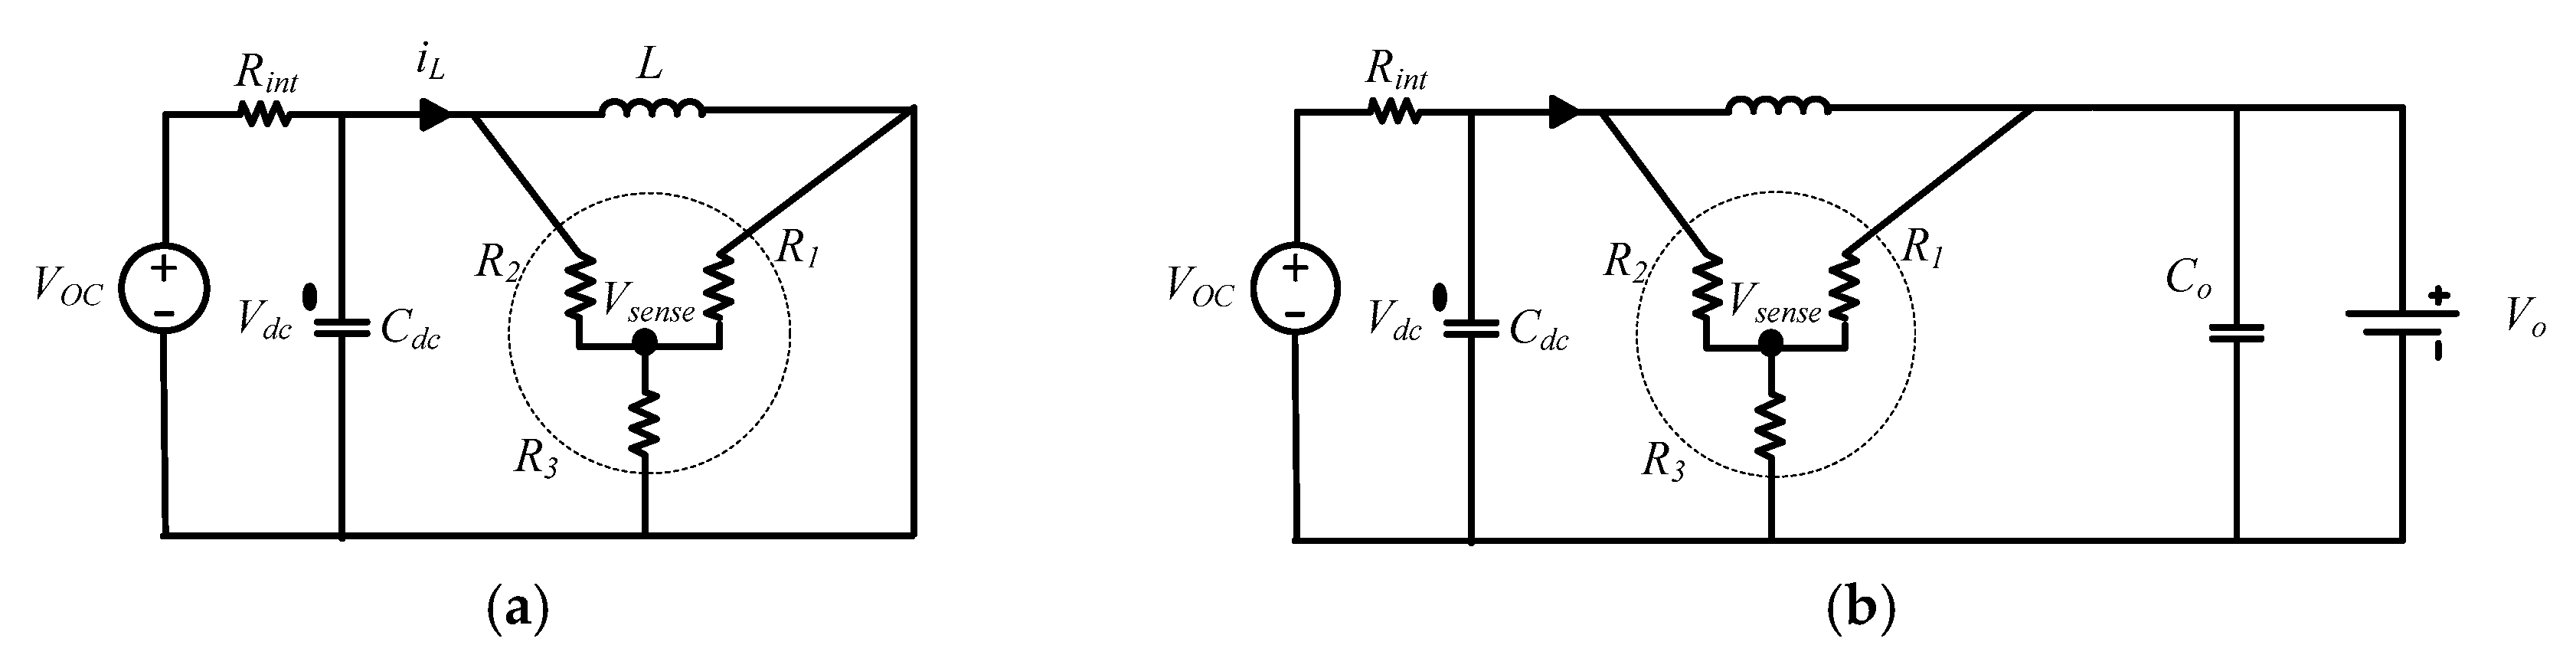
To derive the relation between
and the input and output voltages’ information, the converter is analyzed during the ON and OFF times of the switch, as shown in
Figure 6.
While the converter is operating under mode 1 (ON-time), the sensed voltage
in
Figure 6a can be described, as follows:
where
is the input voltage to the boost converter and it is across the capacitor
as
in
Figure 6. Equation (4) is reduced to (5) below.
where
.
During the off-time, which is mode 2 of the boost converter operation,
Figure 6b holds. In this case, the input and output voltages are considered as sources and the superposition principle is applied to find the
. First,
is killed and
is kept, which yields Equation (6).
Then,
is killed and
is kept, yielding the following:
Then, the sensed voltage during mode 2 is shown in (8).
From (5) and (8), it is apparent that
is closely related to both
. To examine the proportionality, the averaged voltage over one switching period with duty cycle
can be found, as follows:
Examining (9), the average sensed voltage carries the information of the input and output average voltages. Which means that the input and output voltages can be reconstructed by utilizing the instantaneous measurements of the voltage , as follows:
To reconstruct , Equation (5) is utilized, where it shows that during the turn ON time the sensed voltage is related to the input voltage through the factor Taking samples of during the ON times results in discrete samples of , which are fed in to establish continuous measurement for .
For reconstruction, and during off time, Equation (8) holds. However, does not include information only, but as well. During one switching period, the input voltage is not assumed to greatly vary, especially with the existence of the input capacitor , which holds the variation in the input voltage under slow dynamics compared to a time of one switching period. Thus, information during the ON time are utilized to reconstruct in (8).
In a digital signal processing environment, one sample per switching period is needed for each circuit variable to carry-on the control and monitoring tasks. Usually at the end of the PWM cycle. However, in the case of the proposed technique, two samples per switching period are needed for the to be able to reconstruct and . The first sample should be taken at the middle of the turn-on time to establish , and the other sample should be taken at the middle of the turn-off time to retrieve . Two samples per period can be easily carried out using simple and low cost processors. Analogue recovery of the voltage signals using simple and low cost analogue electronics is possible too.
6. Experimental Results
An in-lab hardware prototype was built and tested to verify the proposed algorithms. A boost converter built with components’ parameters shown in
Table 1. The sensing resistors, as shown in
Figure 7, were selected to be
each. A TMS320F28335 DSP processor is utilized to build and execute the proposed algorithms. The input source is a DC voltage source in series with a resistor to simulate the behavior of a TEG module. The power level of the input source can be tuned to represent a single TEG module or a complete set of TEG modules.
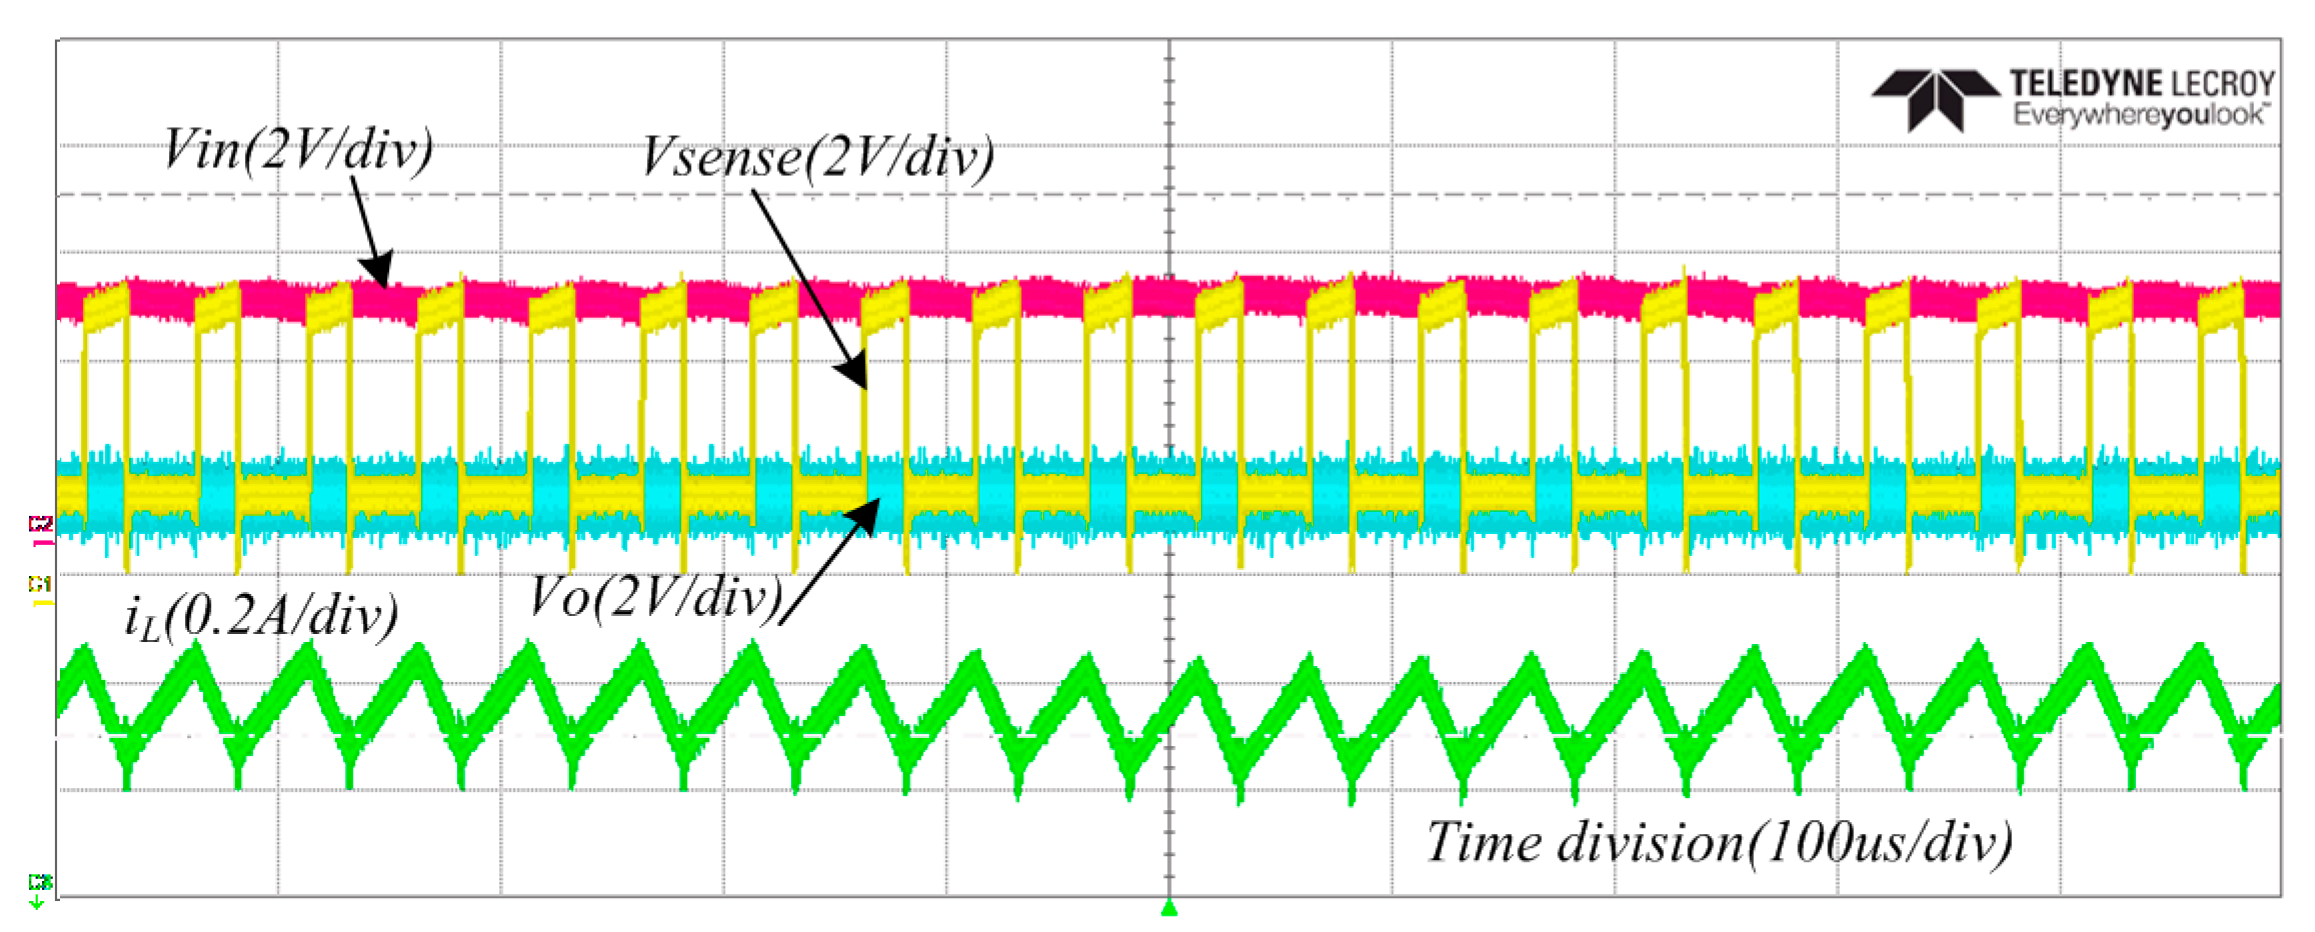
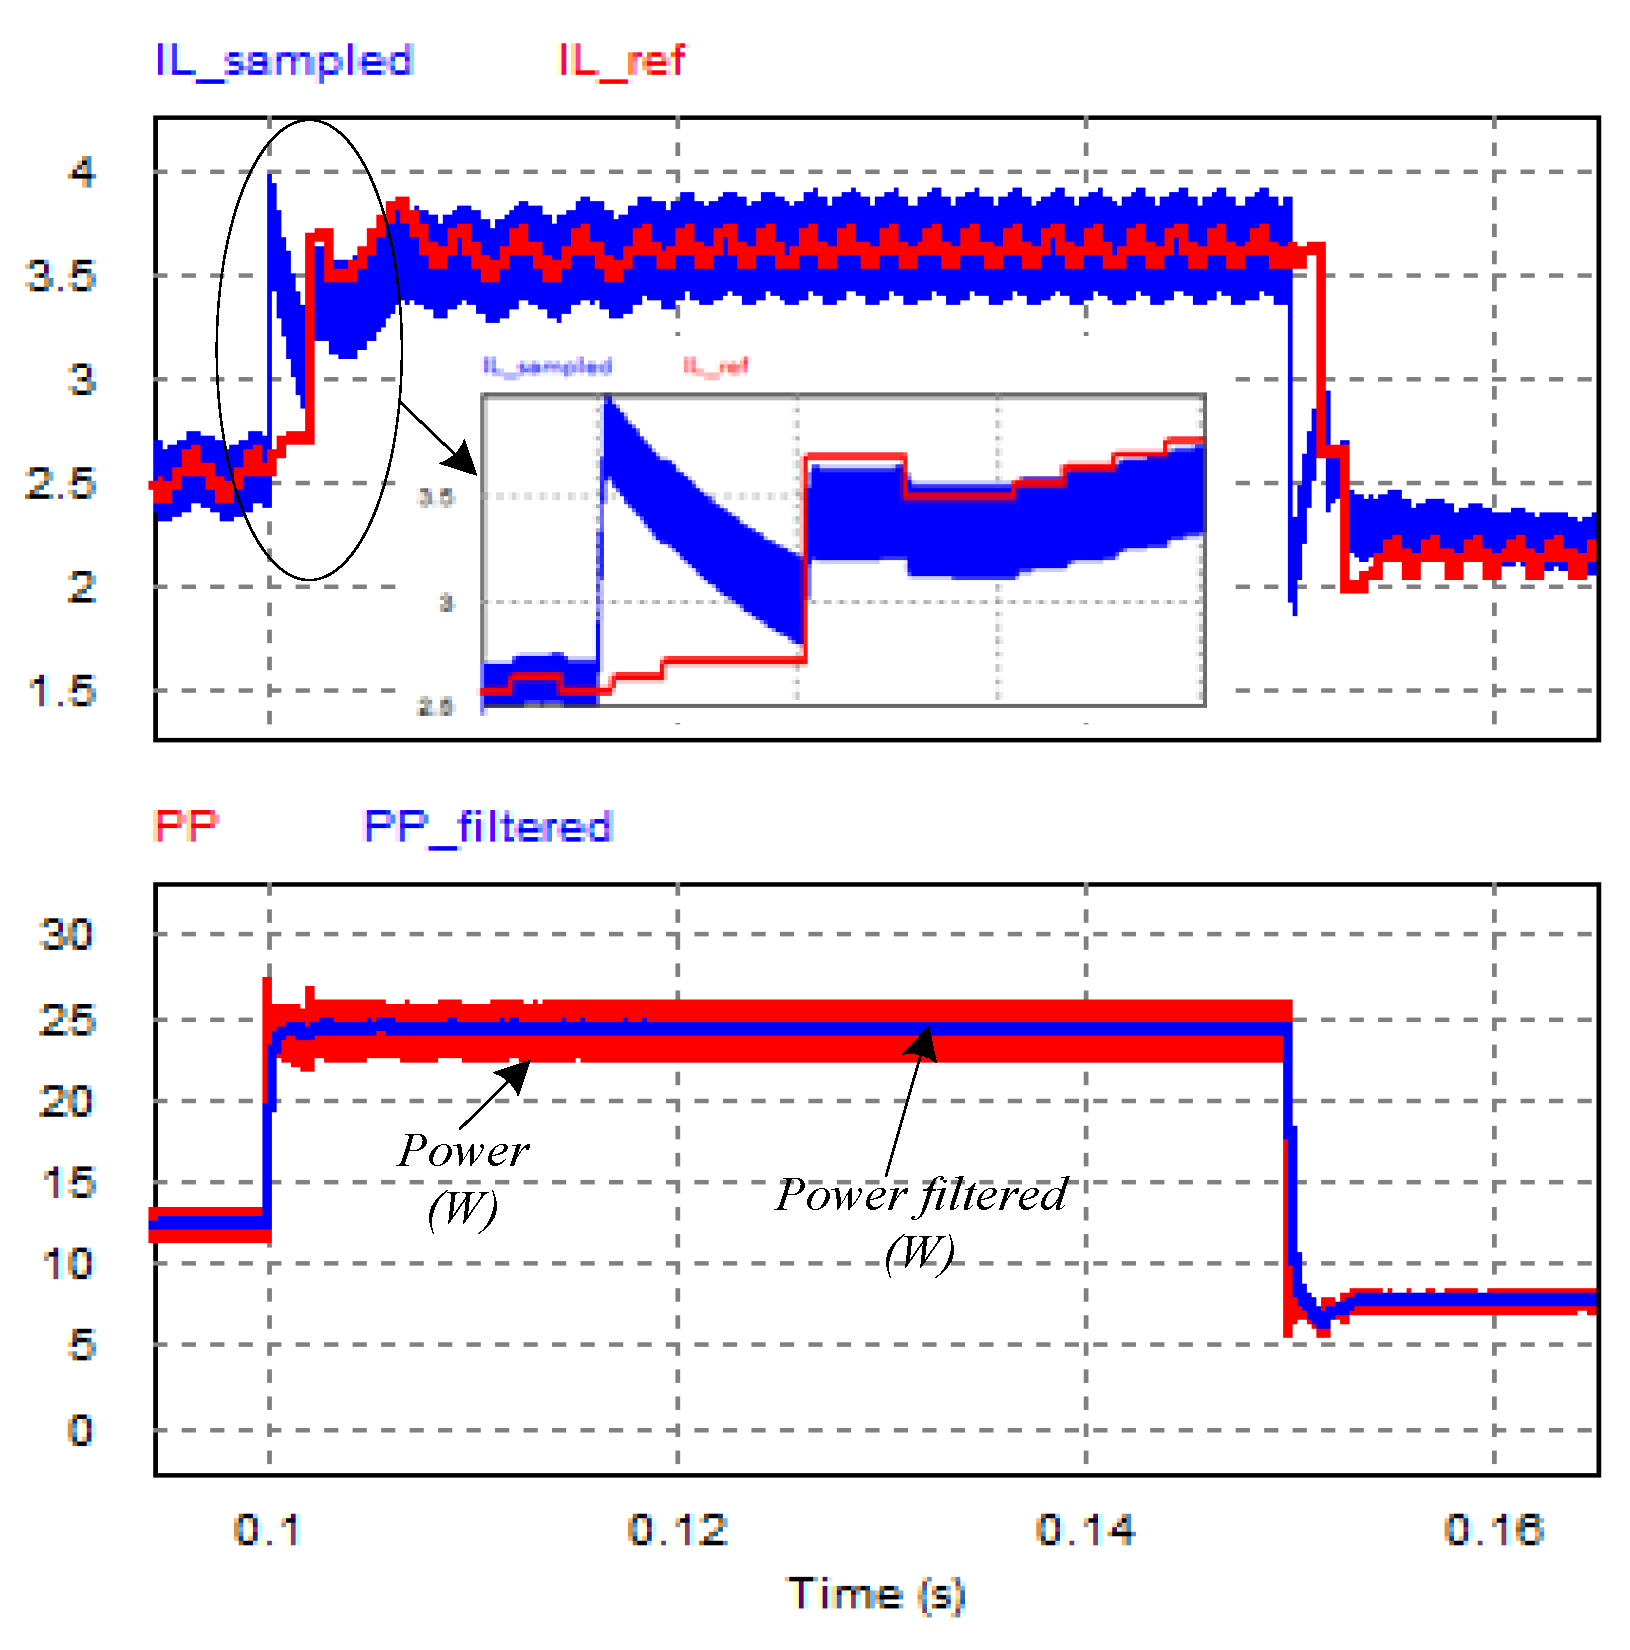
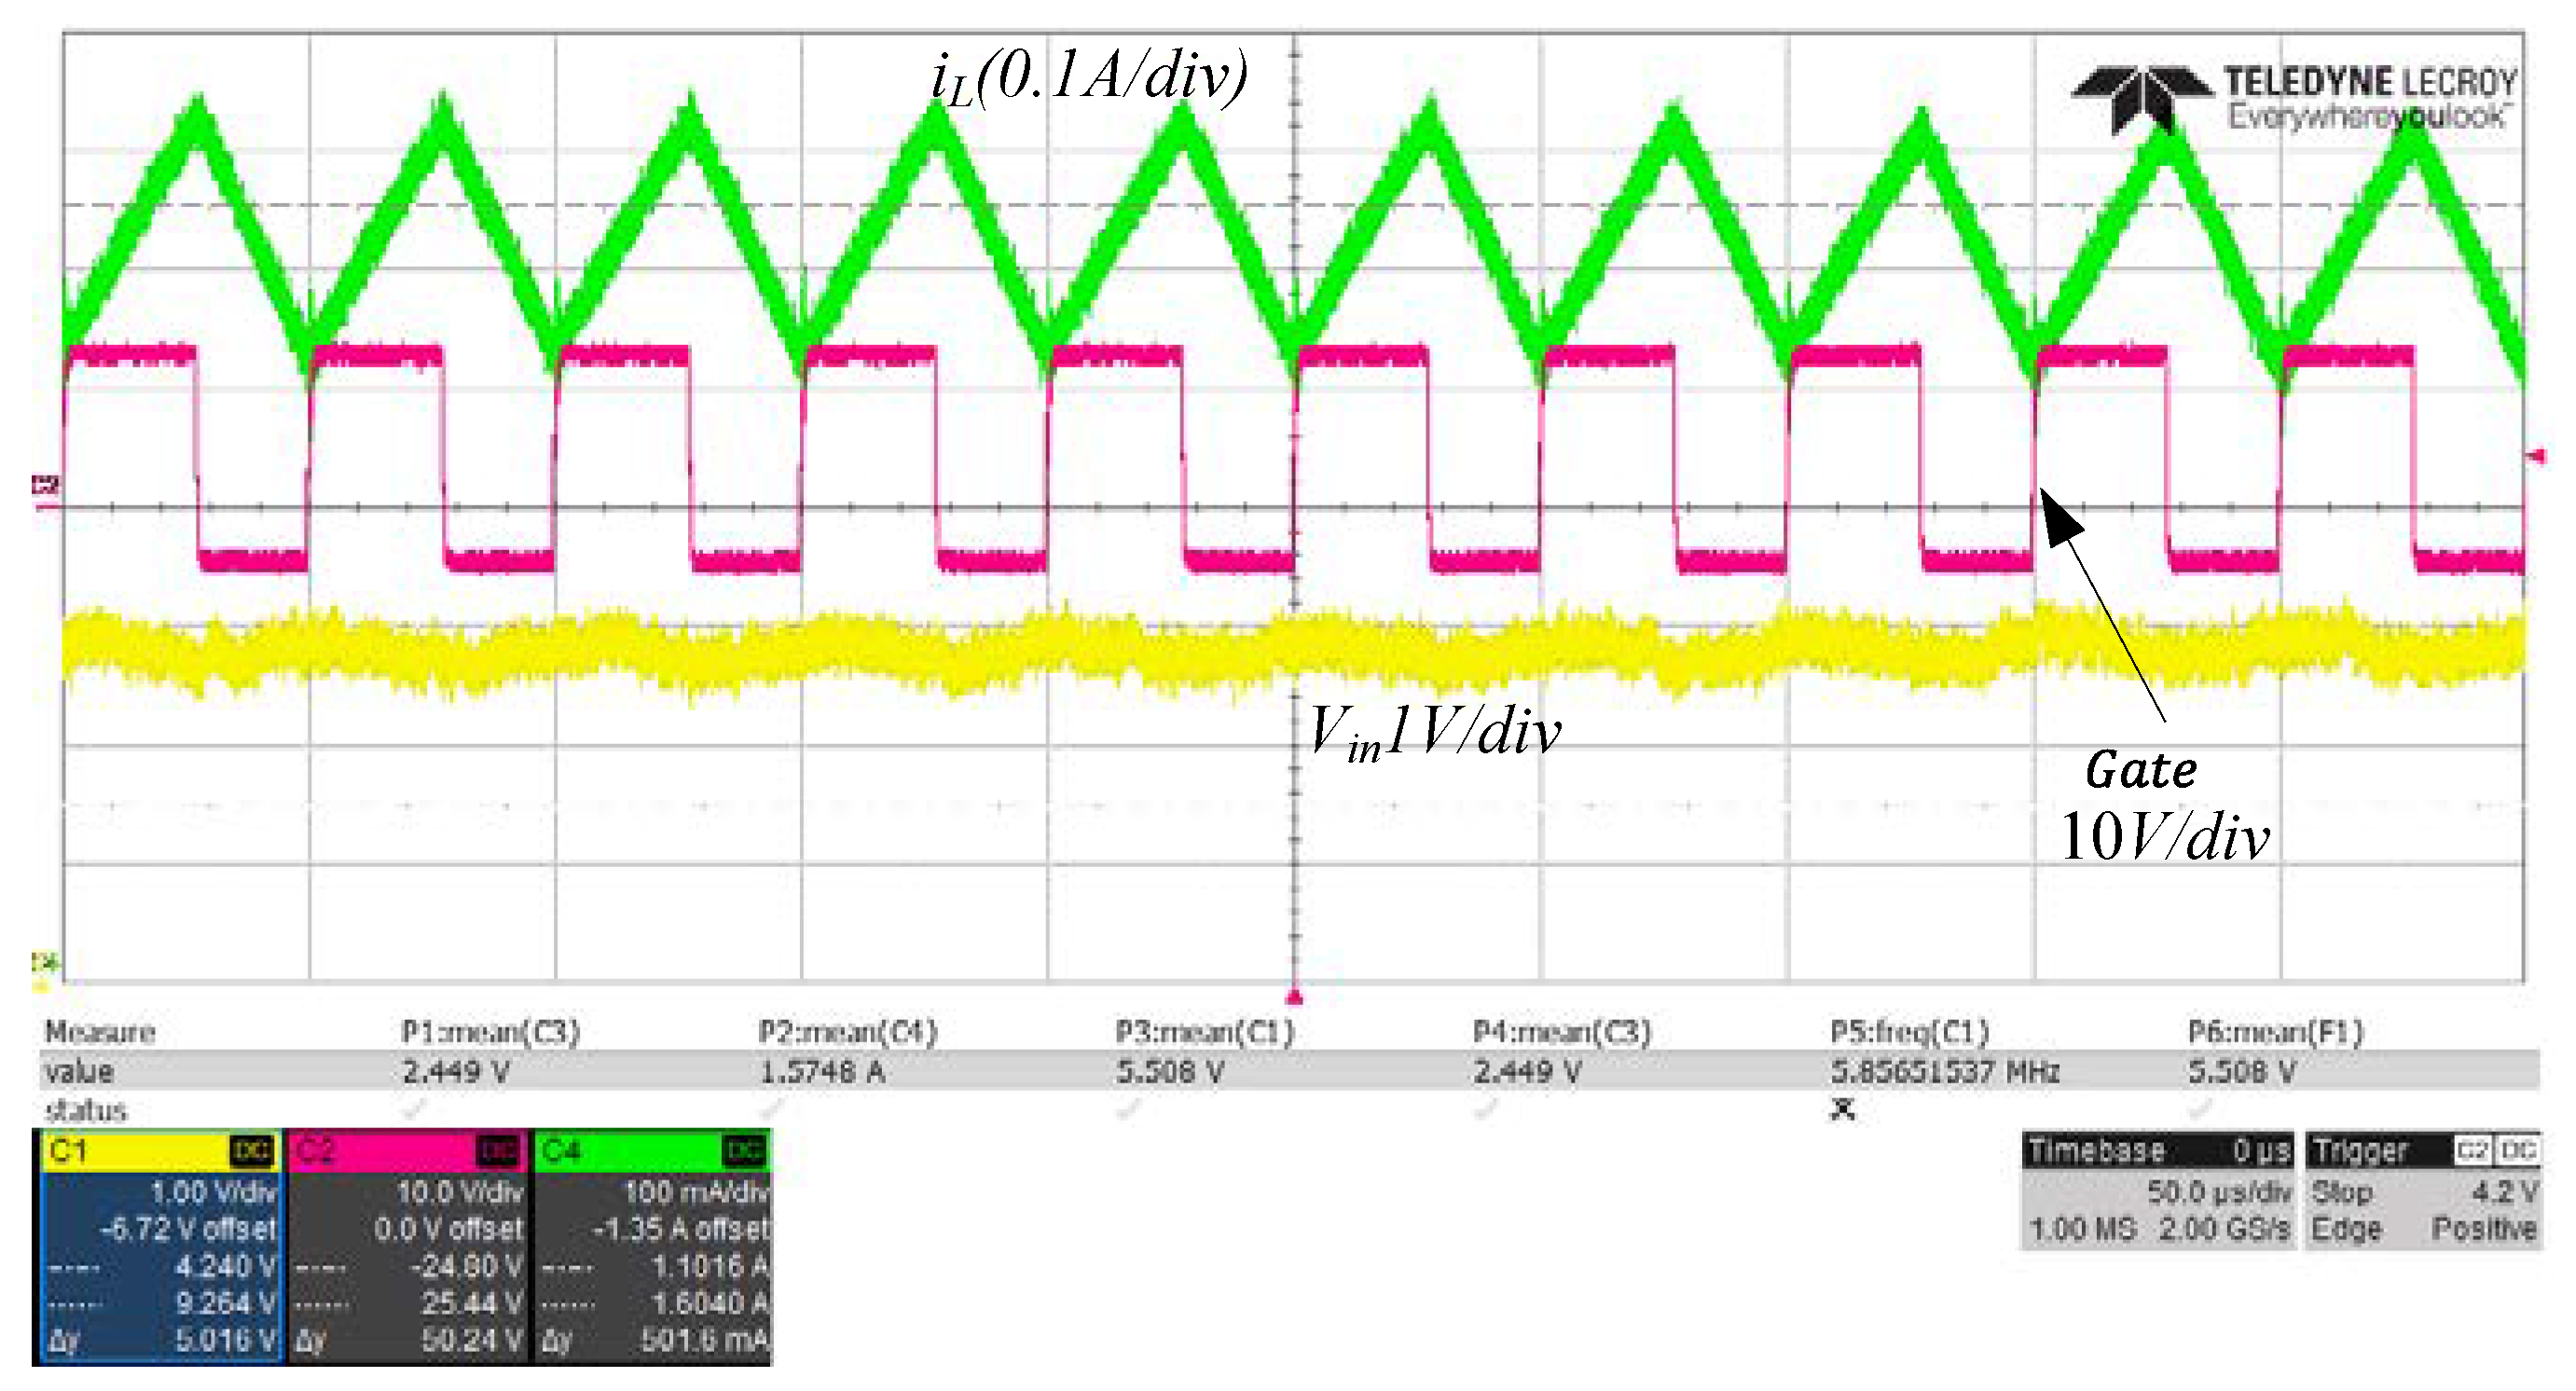
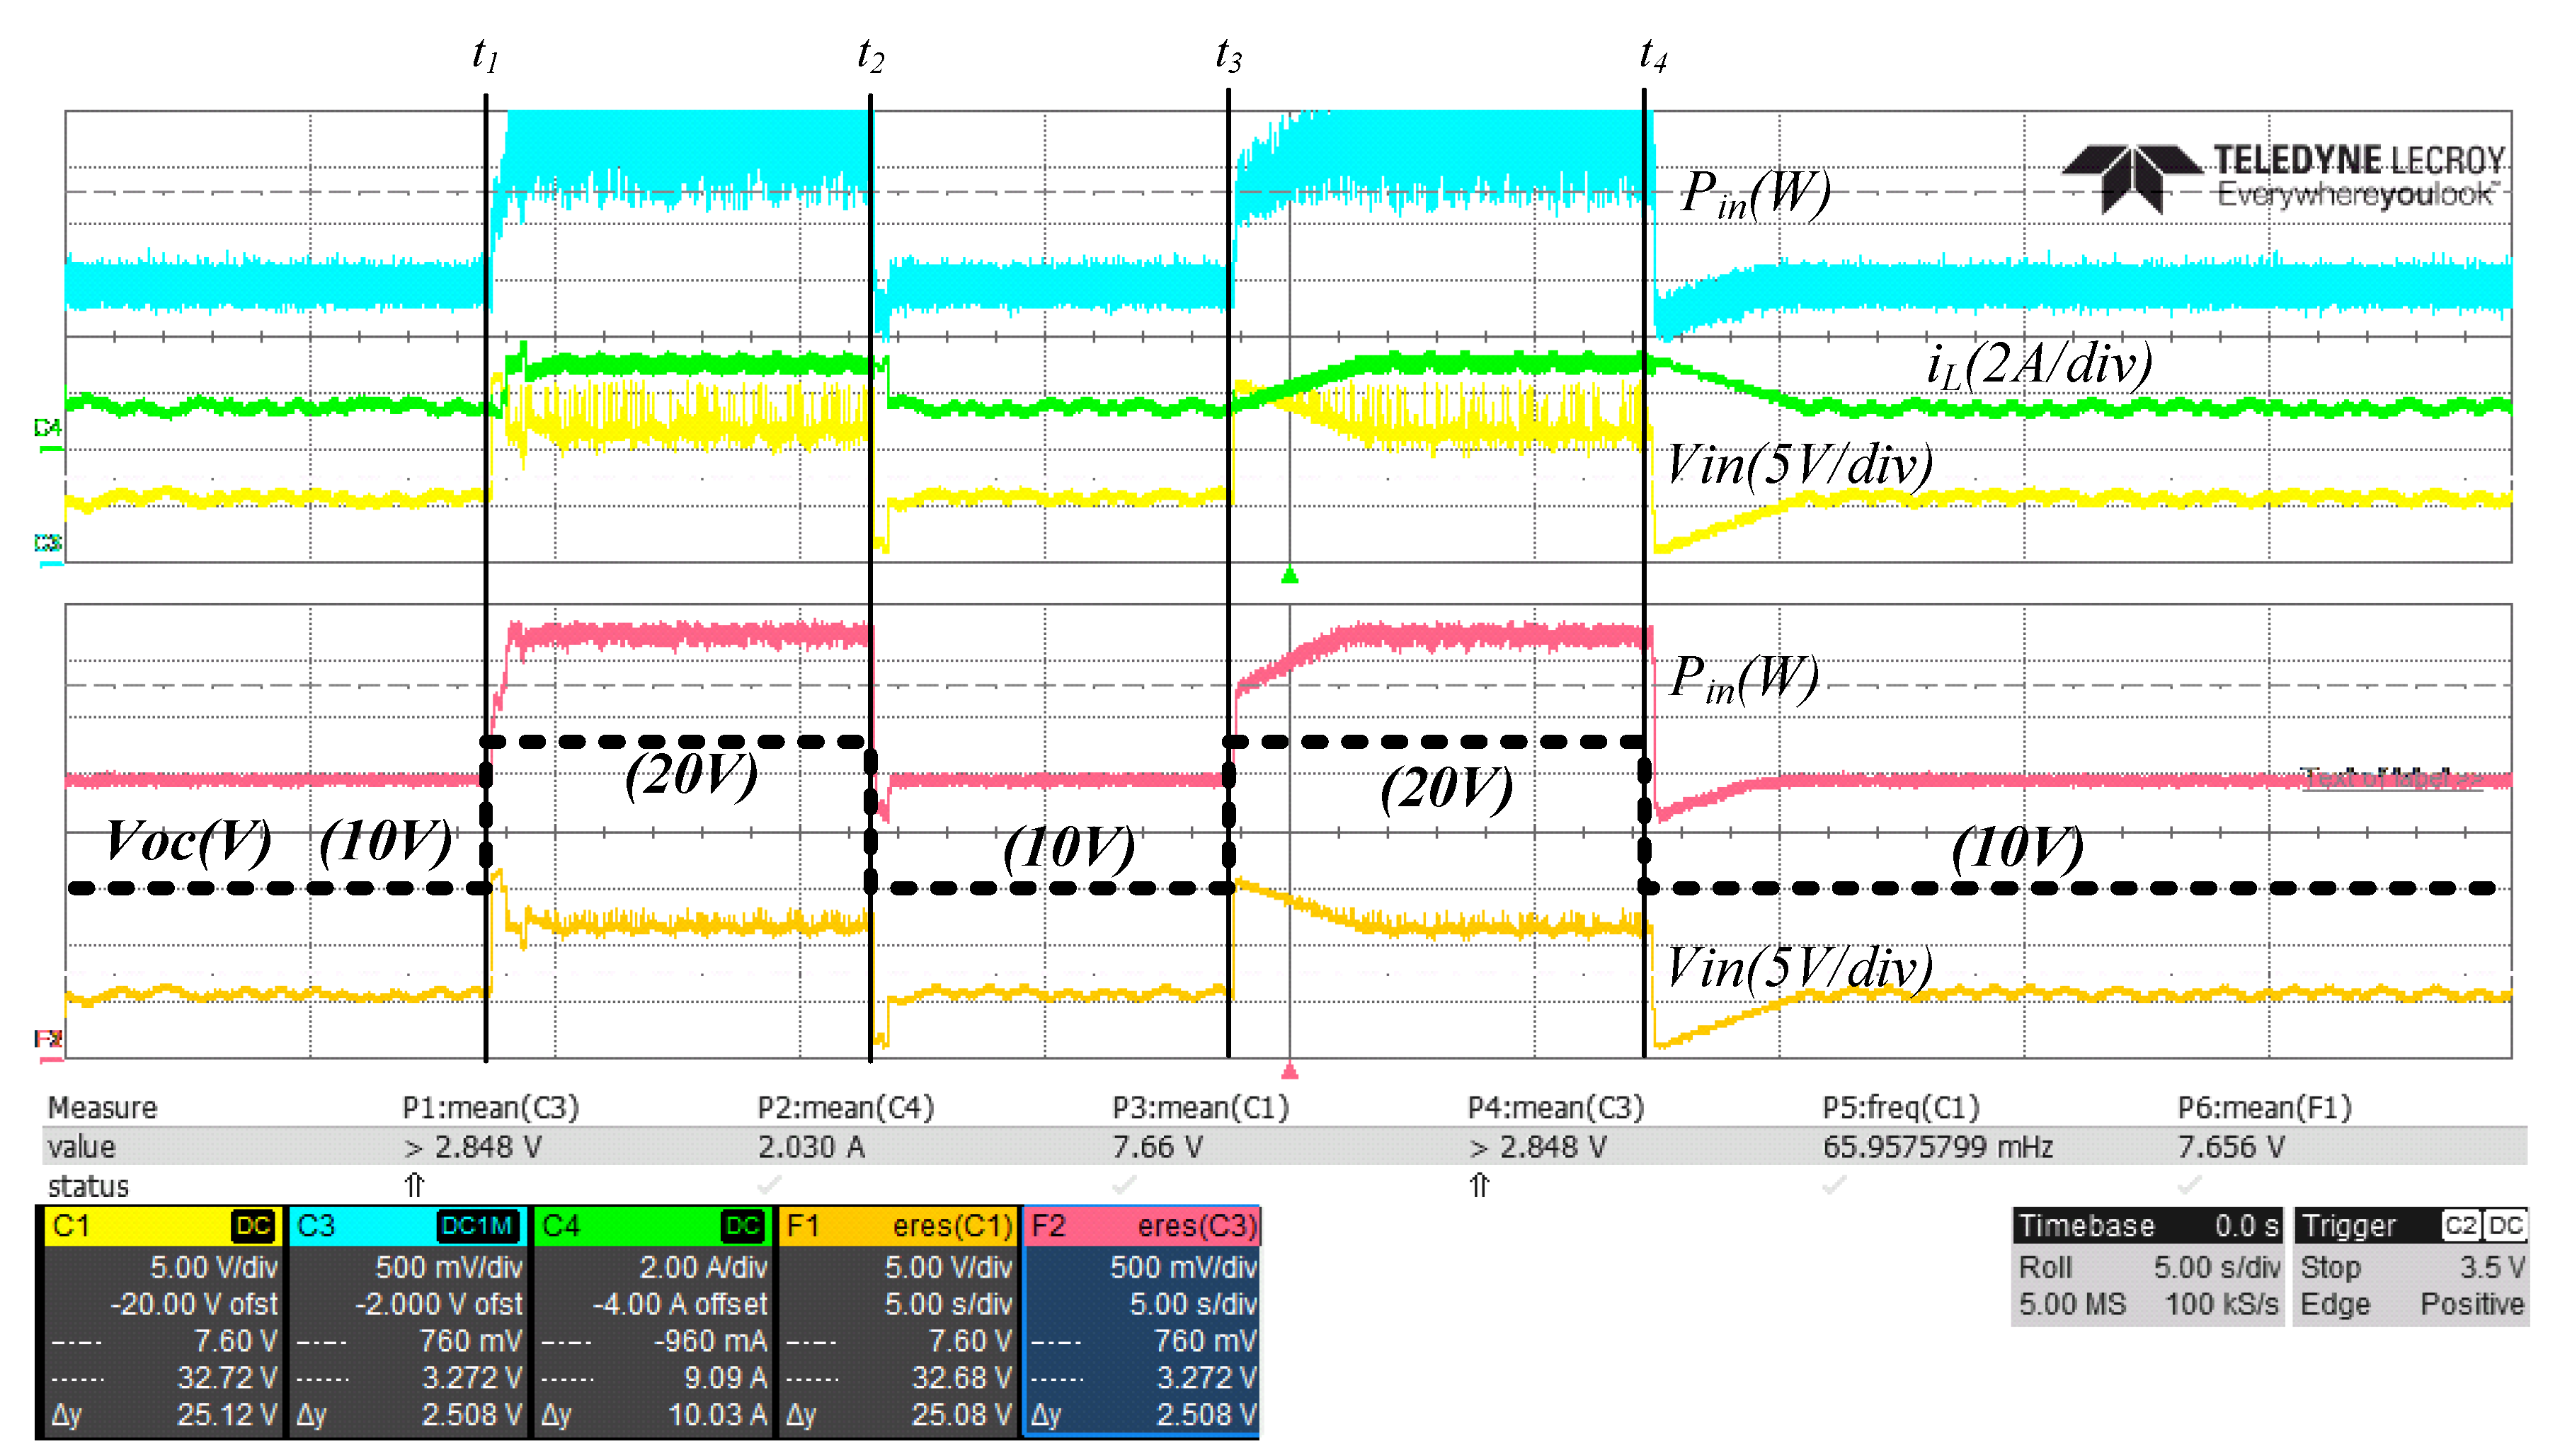
Figure 11 shows the proper operation of the boost converter where the current, input voltage to the boost, and gate signal are shown. Smooth controlled operation is verified first and then the proposed MPPT algorithm was executed and tested against conventional P&O MPPT algorithm, as shown in
Figure 12. At time
, the input power is increased by increasing the input source voltage in a step change behavior from 10 V to 20 V, and at
falls back to 10 V before repeating the same scenario starting at
. In the time interval
, the proposed MPPT algorithm is operating. As can be seen in the current waveform, the algorithm detects sudden change in input power, and accordingly, activates the transient mode. In this mode, two successive steps in the current command are introduced by the algorithm and proper voltage and current measurements are taken to estimate the open circuit voltage, and hence the position of the MPP. The algorithm steers the converter to operate at the estimated MPP and at the same time folds back to the regular P&O mode for fine tuning and to detect slow dynamics changes in input power. The exact same scenario happens exactly when the input power drops suddenly at time instant
.
The whole experimental procedure is repeated for time instants
and
where only P&O mode is operating. The delay in tracking the new MPP is clearly seen due to the natural behavior of P&O algorithm of applying small steps towards the new set point. Of course, some tuning can facilitate the conventional P&O algorithms but with flaws, as discussed in [
18]. The enhancement of the proposed MPPT algorithm over conventional ones can be clearly seen from the figure.
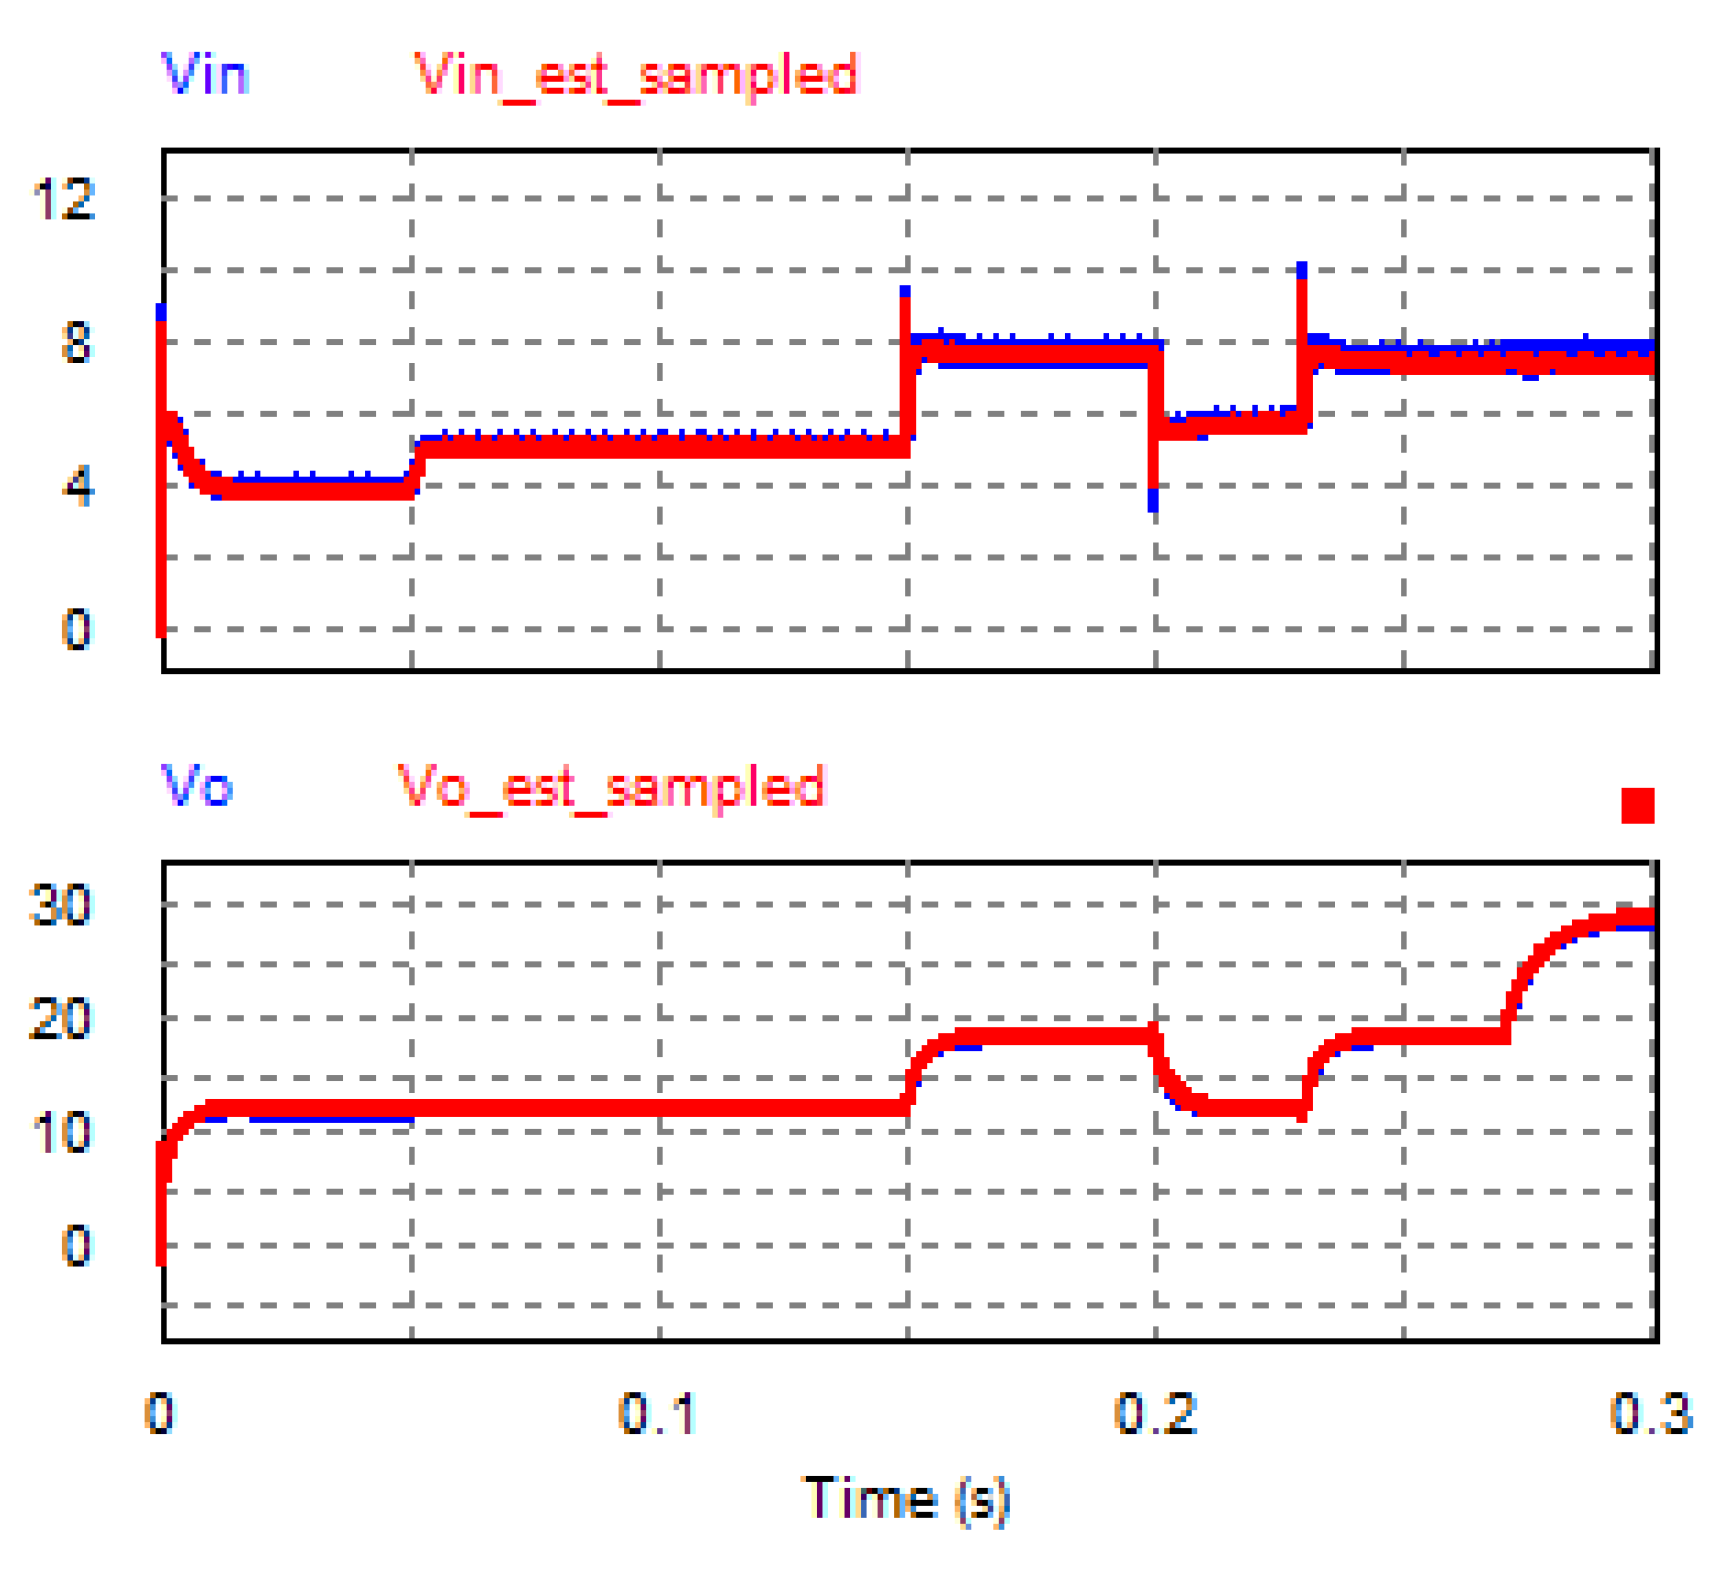
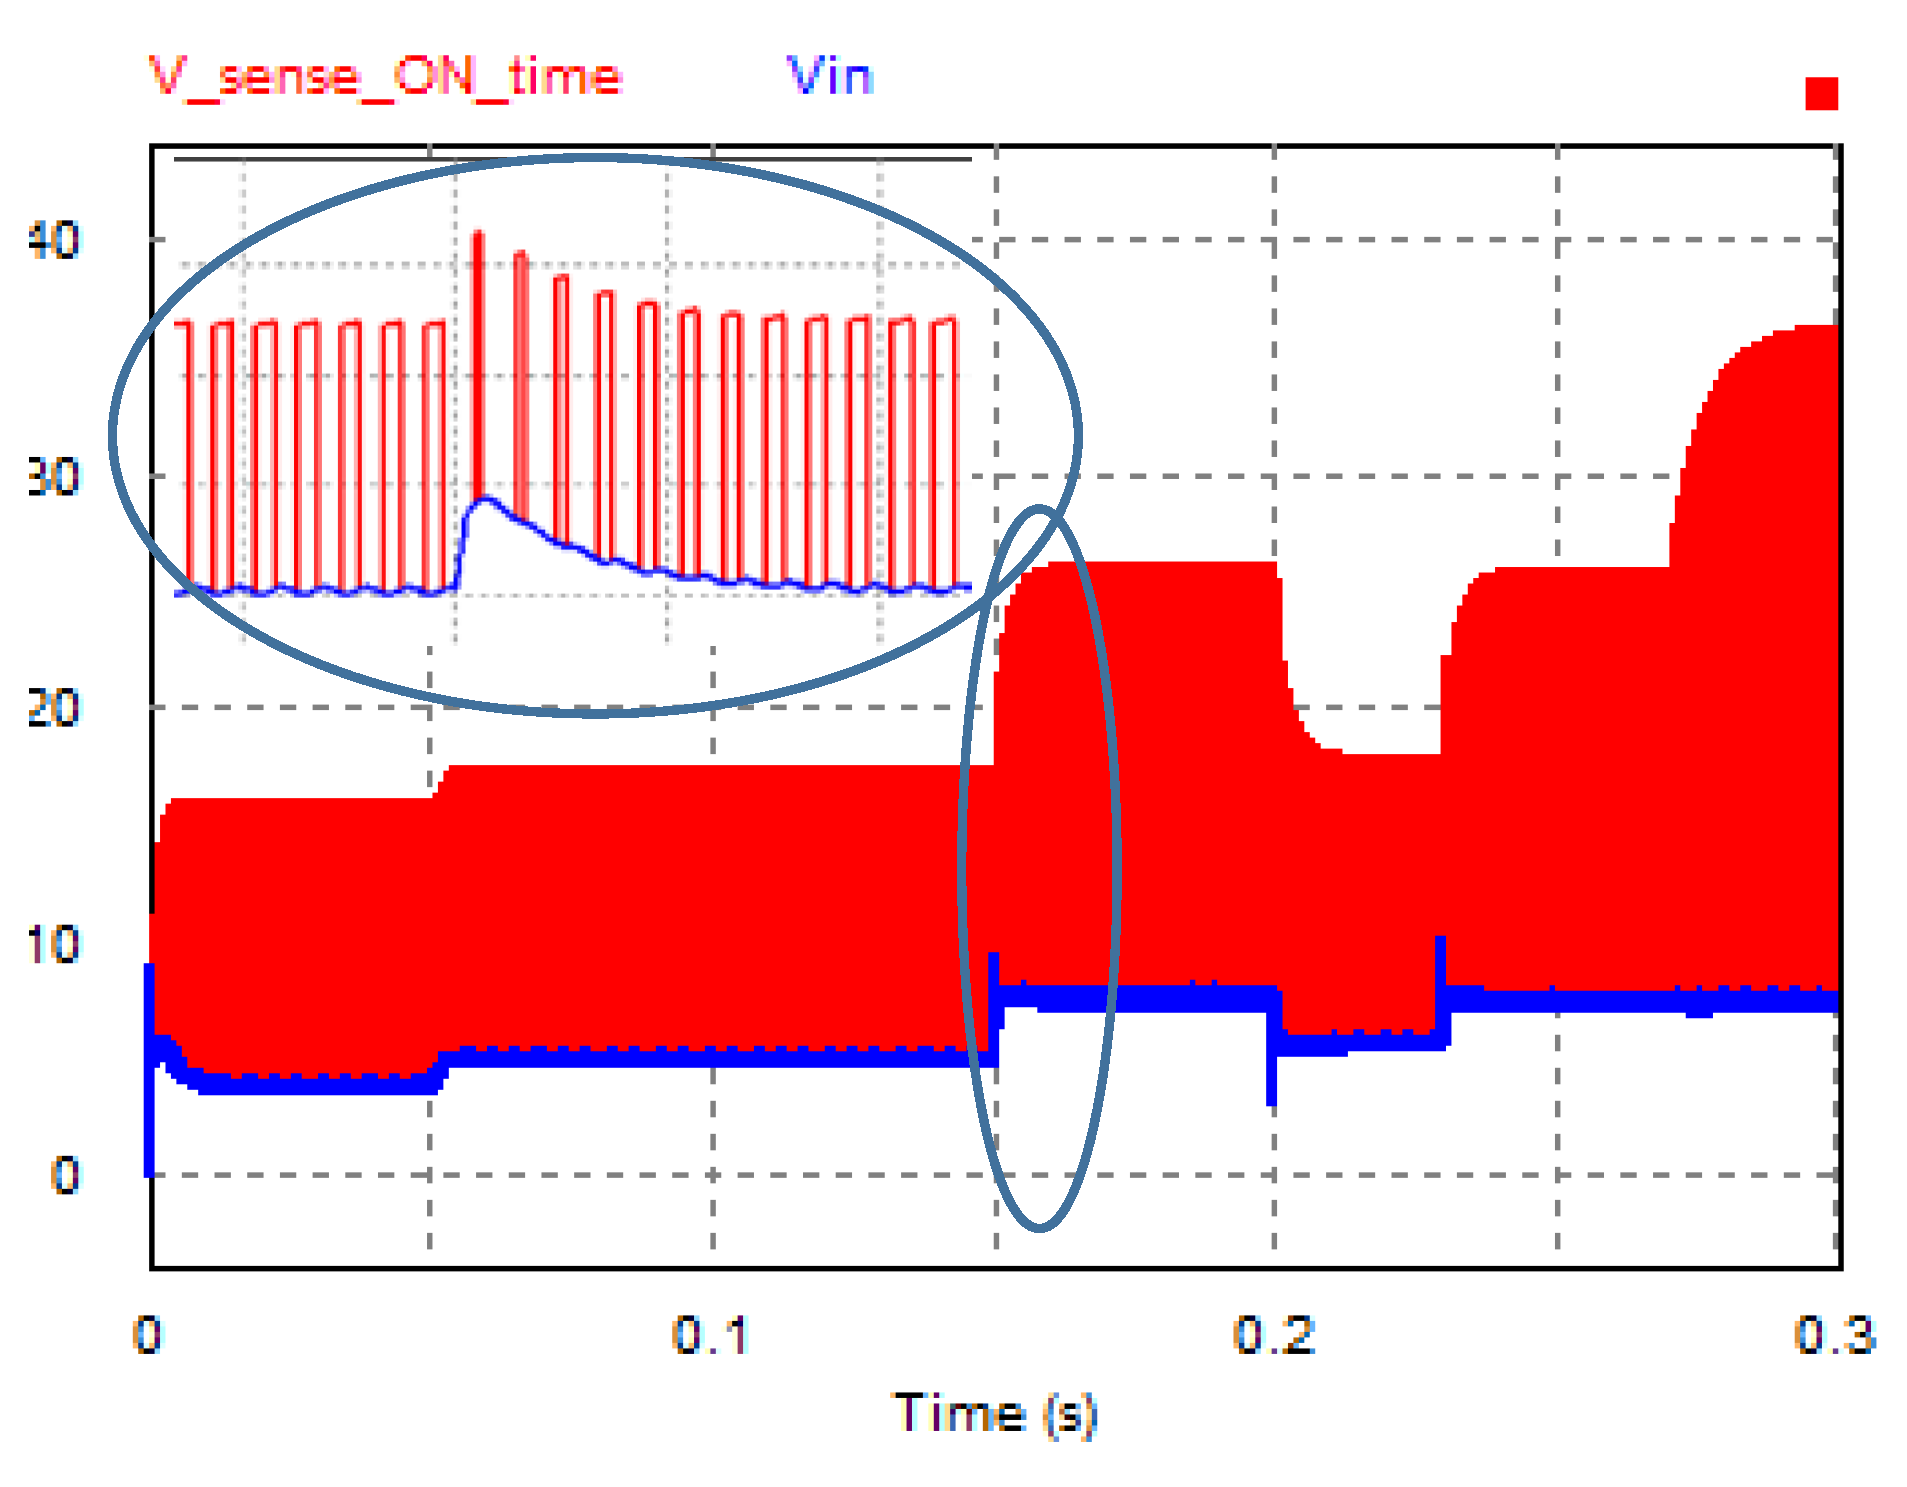
The proposed voltage sensing technique was implemented and tested using the exact same setup used for the MPPT algorithm verification. The sensed voltage
and the reconstructed input
and output
voltages are shown in
Figure 13. The sensed voltage is factorized using (5) and (8), as shown in
Figure 7, to reconstruct the input and output voltages. Excellent matching to the derivation and simulation can be seen. In
Figure 13, the traces are configured to better see the close behavior of the sensed voltage as compared to the input and output voltages. As shown in the figure,
is a switched waveform that resembles Equations (5) and (8). Noting that
does not coincide with either
or
, but the traces in the figure are configured to show the interrelation between the variables.
In
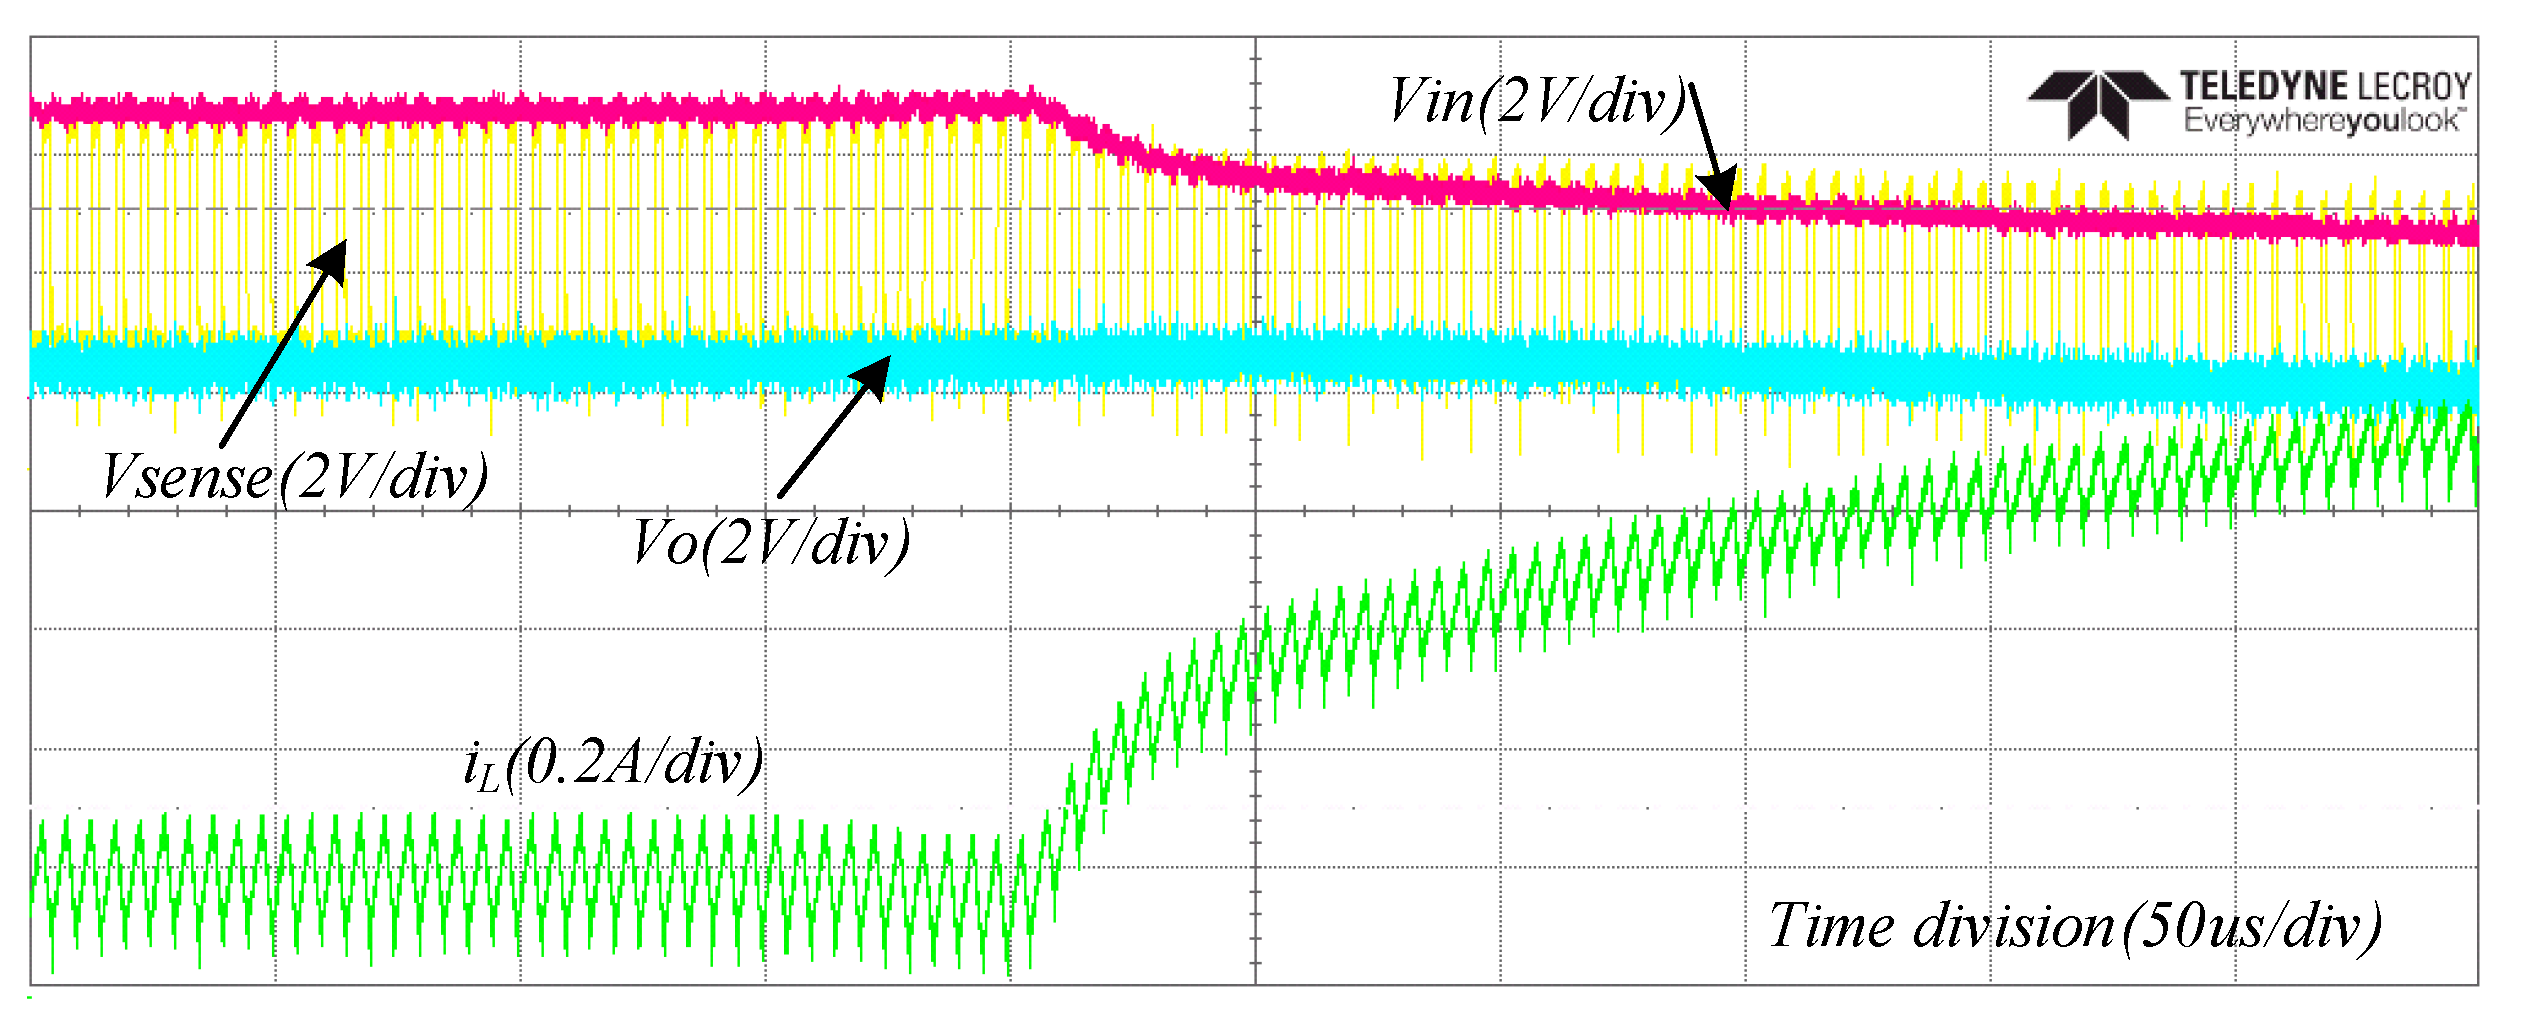
Figure 14, voltage sensing technique was tested under transient conditions, where it clearly shows how the reconstructed voltages follow the input and output voltages smoothly and justify using it as the only voltage to be sensed in order to completely close the control loop of the converter and to apply continuous monitoring over the output voltage in the case of battery charging application.
7. Conclusions
In this manuscript, the TEGs conversion system is considered, where a new MPPT control method is proposed. This new method is based on a novel strategy to measure the open circuit voltage and short circuit current of the TEG without using any special physical connection or disconnection form the source. The proposed detection method utilizes the inherent linear characteristics of the TEG I-V curve, and it is independent of operating or environmental conditions. During normal conditions, the P&O algorithm is used for fine tracking, where, as during fast changing dynamics, the transient mode is adapted. In the transient mode, the open circuit voltage is estimated, and conveniently, the operating point is moved towards where the MPP operation is maintained. Even during the normal operating conditions where the P&O is activated, verification of the proper MPP tracking might be needed and that can be achieved by utilizing the estimated open circuit voltage.
Moreover, for low computational overhead systems, where a minimum number of computations is desired, the proposed algorithm can serve very well without engaging the P&O mode. Spaced samples are enough to establish the measurements for the open circuit voltage and the operating point, which can be steered towards where MPPT is guaranteed.
The proposed algorithm utilizes the input voltage for tracking and the output voltage for controlling the load demand. Usually, the TEG power electronic converter interfaces with a battery or DC link capacitor, where the dc voltage at the output is a control variable and needs to be continuously measured and controlled. Thus, a novel voltage sensing technique is developed to reduce the used sensors count. Through a single point voltage measurements, the input and output voltage information were reconstructed in a real time manner with excellent accuracy. Simulation and hardware results show the effectiveness and verify the operation of the proposed methods.


