Model-Based Temperature Sensor Fault Detection and Fault-Tolerant Control of Urea-Selective Catalyst Reduction Control Systems

1
Wuhan University of Technology, Hubei Key Laboratory of Advanced Technology for Automotive Components, Wuhan 430070, China
2
Hubei Collaborative Innovation Center for Automotive Components Technology, Wuhan 430070, China
3
China Automotive Technology and Research Center Co., Ltd., Tianjin 300300, China
*
Author to whom correspondence should be addressed.
Energies 2018, 11(7), 1800; https://doi.org/10.3390/en11071800
Submission received: 5 May 2018
/
Revised: 20 June 2018
/
Accepted: 3 July 2018
/
Published: 9 July 2018
Abstract
:This paper aims at investigating the fault diagnosis of the selective catalyst reduction (SCR) outlet temperature sensors and fault-tolerant control methods of the SCR system, and three typical faults of downstream temperature sensors were modeled and analyzed to present influences of different faults on the SCR system performances (such as nitrogen oxides (NOx) emission and conversion efficiency, NH3 slip, urea dosage and ammonia coverage estimation). A temperature model was established to estimate the SCR outlet temperature, and diagnostics were developed based on the differences between model estimates and sensor measurements. Once a downstream temperature sensor fault was detected, the fault-tolerant control will be enabled, and the output of the sensor may be substituted with the estimates of the model. Thus, SCR performances shall be maintained within the acceptable ranges. Moreover, a 0-D SCR model was also established to validate the capability of diagnostics and fault-tolerant control strategy over the European transient cycle (ETC).
1. Introduction
Diesel engines are popular due to their high thermal efficiency, power and durability; however, the diesel exhaust emissions cause heavy environmental pollution, whose major exhaust pollutants include nitrogen oxides (NOx), particulate matter (PM), unburned hydrocarbons (HC), and carbon monoxide (CO). Because of the high air-fuel ratio and heterogeneous combustion of air-fuel mixture in the diesel cylinder, NOx and PM levels are relatively higher than those in the gasoline engine exhaust [1,2,3,4,5]. Selective catalyst reduction (SCR) systems have been extensively investigated for the removal of NOx [6], where an aqueous urea solution is injected into the upstream tailpipe of the SCR catalyst to be decomposed into NH3 and then restored on a catalyst surface for reaction with NOx in the exhaust gas, generating nitrogen (N2) and water vapor as the main products. Obviously, the urea dosing is a significant control object in the whole system; its excess injection will lead to high urea consumption and undesirable –NH3 slip, which is also regarded as a pollutant, while on the other hand, it is entirely possible that NOx emissions will exceed the regulation limit if the urea is underdosed [7].
With the increasing stringency of the emission legislations, it is crucial to develop effective control strategies conform to the legislation limits. SCR control strategies mainly focus on two modes (namely open-loop and closed-loop), which have been studied extensively in recent years. For example, the open-loop control strategy is sufficient to satisfy Euro-4 and Euro-5 emission legislation requirement with a NOx conversion efficiency of 60–80% under slowly changing operating conditions [8]; however, some corrections are needed when using the open-loop approaches in rapidly changing conditions, such as corrections for the changes of exhaust temperature, which require a lot of calibration efforts to obtain the specific correction values [9]. On the other hand, it is difficult to achieve high NOx reduction and low NH3 slip [10]. Thus, more efficient control techniques are necessary for such operating conditions, which include adaptive control [11,12], state estimation [13,14,15,16] and model predictive control [17], etc. A model-based closed-loop strategy along with a PI controller was designed in [9] to control the ammonia storage at a proper level, which has been validated under Euro-6 WHTC test cycle. Both simulation and experimental results showed that the control strategy was effective. Devarakonda et al. [13] designed a model-based estimator via simulation and a control system based on NH3 sensor feedback. A NOx sensor feedback-based control strategy was also developed for reference, and their outcomes showed that the performance of the NOx-based control strategy is slightly better than the NH3-based one.
As the structure of the SCR control system is becoming increasingly complicated, some sensors are required to provide corresponding signals for the control system. A SCR system is typically equipped with a downstream NOx sensor and upstream and downstream temperature sensors, respectively. Signals from the former are generally used to calculate the corresponding urea dosage, ammonia coverage ratio and NOx conversion efficiency, and signals from the latter also play a significant role in the calculation of the SCR chemical process; for instance, calculating the catalyst temperature and ammonia coverage ratio as they cannot be measured directly. Obviously, most of the advanced control strategies are based on sensor outputs and their performances are highly dependent on the accuracy of the outputs; moreover, SCR system typically works in poor environment with high temperature, erosion and vibration. All these unstable factors are harmful to the stability of sensors, which make them shall be prone to malfunction; what’s worse, faults from various sensors may be multiple, which may lead to a deterioration of SCR performances. Hence, it is significant to detect faults timely and regulate the control strategy to accommodate fault conditions, and restrain the performances degradation within acceptable ranges.
A number of studies have been conducted on fault diagnosis of SCR sensors and related components. Chen et al. [18] developed a model-based diagnostic method for the injection system and outlet NOx sensor. The simulation results indicated that it succeeded in fault detection and isolation with good robustness and sensitivity. Wang et al. [19] put forward an integrated on-board diagnosis and fault-tolerant control method for the SCR urea injection system. The methodology was based on the estimation of the injected urea flow by a linear parameter varying (LPV) model, which presented good performances in vehicle tests. Sun et al. [20] found a relationship between injector pulse amplitude modulated (PAM) commands and line pressures in their study, and a fault diagnosis algorithm was proposed based on power spectrum and time domain analysis. The diagnostic method was verified in a urea SCR system, which was shown to be effective. An OBD system for the SCR was developed by Matsumoto et al. [21], and it was based on a NH3 slip model with simplified descriptions of NOx or NH3 reaction formulae. The test results showed that it achieved good diagnostic performance which is required in Euro-6c.
Unfortunately, few papers can be found on temperature sensors fault diagnosis and fault-tolerant control of SCR systems. Pezzini et al. [22] proposed a model-based fault diagnosis algorithm on the basis of a reduced lean NOx trap (LNT) model. Diagnosis of the NOx sensor faults, temperature sensor faults, and thermal damage faults were investigated by simulation. Wang et al. [23] provided a method for on-board diagnosis of SCR temperature sensors, which was based on the differences between estimated temperature and real temperature measurements. However, further studies (such as the influence of faults and fault-tolerant control) were not discussed in the aforementioned papers. Temperature sensor faults occurring in various forms may influence SCR performances to various degrees. In this study, typical faults of the outlet temperature sensors were discussed firstly and then influences of different faults on SCR performances were investigated. Moreover, a model-based fault detection approach for SCR-out temperature sensors was developed based on the differences between model estimates and sensor measurements, where a high fidelity SCR temperature model was used to estimate the SCR-out temperature. In addition, a fault-tolerant control strategy was proposed, and validated over an ETC test cycle based on a 0-D SCR model.
2. Selective Catalyst Reduction Modeling and Control Strategy
2.1. Selective Catalyst Reduction Modeling
Principle of Selective Catalyst Reduction
The working processes of a urea-SCR system are described in the following steps [24]:
- (1)
- Urea is injected into the exhaust tailpipe.
- (2)
- What left after completing evaporation of urea solution are solid substances under the corresponding thermal decomposition temperature.
- (3)
- The above solid substances are decomposed into gaseous NH3.
- (4)
- Gaseous NH3 is adsorbed into catalyst along with desorption of NH3.
- (5)
- N2 and H2O are generated based on the reaction between NH3 and NOx.
The corresponding chemical reactions are given by the following equations:
Primary NOx removal reactions:
Equation (4) is often called as the “standard” SCR since its relatively fast reaction rate in a conventional catalyst (V2O5-WO3/TiO2) and high percentage of NO in NOx emissions (up to 90% in typical diesel exhaust). Equation (5) is known as the “fast” SCR reaction whose reaction rate is approximately 10 times faster than that of the standard SCR reaction. Equation (6) is the “slow” SCR whose reaction rate in V2O5-WO3/TiO2 is very low [25].
Meanwhile, oxidization of NH3 to N2 with O2 is also taken into account in the model, whose reaction is expressed by [26]:
In view of the complexity of chemical reactions in the SCR catalyst convertor, several assumptions and simplifications are made as follows [27,28]:
- (1)
- The components of exhaust gasses are considered as ideal gases, which are homogeneous and incompressible.
- (2)
- Effects of variations in the water and oxygen concentrations of exhaust gases are negligible.
- (3)
- The catalyst convertor may be discretized into several uniform cells along its flow axis.
- (4)
- All variables are homogeneous in the radial direction and only vary along the axis of convertor.
- (5)
- The reaction rate of adsorption/desorption is much slower than that of any other reaction.
- (6)
- Only adsorbed NH3 is involved in NOx reduction processes.
According to the Arrhenius law, rates of main reactions mentioned above can be defined by:
where Cs is the concentration of active atoms with respect to converter volume, and Sc is the area of 1 mol active surface atoms. αprob is the sticking probability. is the NH3 molar mass. R is the universal gas constant. T is the catalyst temperature of the catalyst convertor, which is a crucial parameter throughout reactions and will be discussed in detail later. θ is the ammonia surface coverage, and Ex and Kx represent the activation energies and pre-exponential factor of the reactions (x = ads, des, red, oxi).
Defining:
where Ncell is the number of cells of the SCR model, and one cell was used in this study.
Based on the mass conservation law and the continuous stirred tank reactor (CSTR) approach, the SCR model can be given by [27]:
Since the main reactions in the catalyst convertor are all temperature-dependent, the catalyst temperature remains a significant parameter throughout the whole NOx removal processes. The following formula is adopted here to calculate the catalyst temperature T:
where Tin and Tout represent the inlet and outlet temperatures of the SCR cell, respectively.
The upstream temperature of SCR changes dramatically along with the variation of engine operating conditions. Thus, to reduce impacts of any frequent upstream temperature fluctuation on the accuracy of model prediction, the weighing factors of upstream and downstream temperatures are assigned to 0.3 and 0.7, respectively.
2.2. Control Strategy
The SCR control strategy used here is the ammonia-coverage-ratio-based closed-loop control strategy [11,27,29], which is shown in Figure 1.
A feedforward controller is adopted to calculate the basic urea dosage based on the known parameters, which can be described by the following equation:
where madblue is the urea dosage. mexh is the exhaust mass flow rate. υ is the stoichiometric coefficient of urea decomposition (υ = 0.5). is the engine-out NOx concentration. ηmax is the maximum NOx conversion efficiency. ANR is the ratio of NH3 to NOx concentrations. Cadblue is the urea mass fraction in Adblue, which is 32.5%. Murea and Mexh represent the molar masses of urea and exhaust gas, respectively.
The ammonia coverage ratio is estimated by means of EKF, and the state space model of EKF for a nonlinear system is as follows:
where x(k) is the state vector. u(k) is the input vector. w(k) is the process noise with zero-mean Gaussian noise. f(x, u) is the nonlinear state function. z(k) is the measurement vector. v(k) is the measurement noise with zero-mean Gaussian noise, and h(x) is the nonlinear measurement function.
The state vector may be estimated in two steps:
Prediction Step:
where P is the error covariance matrix. F is the Jacobian matrix of the nonlinear state function (f), and Q is the covariance of w(k).
Updating Step: the state vector x(k) and the error covariance matrix P are updated in accordance with the difference between predicted and measured z(k).
where K is the Kalman gain. H is the Jacobian matrix of the nonlinear measurement function (h). R is the covariance of v(k), and I is the identity matrix.
The four-state EKF prediction model was derived here based on Equation (15):
where Δt is the step size for updating the EKF.
Then, measurements of the downstream NOx concentration and NH3 slip are selected as the observer vector here. The EKF measurement model is expressed as:
Meanwhile, a PID feedback controller is designed given by Equation (24). The input of the PID controller is derived from the difference between estimated and reference ammonia coverage ratio (see Figure 2). Thus, the controller is capable of regulating the urea dosage and maintaining the NOx emissions and NH3 slip within the reasonable ranges:
where uurea is the corrected urea dosage. Kp, KI and KD represent the proportional, integral and derivative factors, respectively. is the difference between the estimated and desired ammonia coverage ratios. The reference for the ammonia coverage ratio was derived by the following methods [30,31]:
- (1)
- In a specific test cycle, maximizing the NOx conversion efficiency and maintaining the ammonia slip within the limits (25 ppm at peak, 10 ppm on average) by regulating the urea dosage.
- (2)
- Calculating the ammonia coverage ratio based on Equations (25) and (26). Meanwhile, calculating the catalyst temperature by Equation (14).
- (3)
- Then the function relationship between ammonia coverage ratio and catalyst temperature can be derived by fitting and interpolation.
- (4)
- To avoid substantial ammonia slip caused by temperature fluctuation, limiting the ammonia coverage ratio at low temperatures.
2.3. Parameter Identification and Model Validation
The rate of reactions in the SCR catalyst primarily depends on the velocity and catalyst temperature. To ensure the accuracy of parameter identification, typical operating conditions should be considered in the identification experiment. Thus, the engine speed at 900 r/min, 1500 r/min, and 2500 r/min, and the exhaust temperature at 200 °C, 350 °C and 500 °C are covered. The urea injection follows the rule of insufficient dosage (ANR = 0.75), moderate dosage (ANR = 1) and over dosage (ANR = 1.25), respectively. Parameter identification of the SCR model is performed by using the Isqnonlin function in the Matlab/Simulink, which is based on the nonlinear least square method. The SCR model needs to be discretized before it is processed further, and the discretized model is expressed as:
where Ts is the sampling time, and k is the sampling point. Since the amount of parameters need to be identified is large, the values of some parameters (namely αprob, kdes, Edes, kox and Eox) were adopted from [27] to reduce the difficulty of identification. The identified parameters are shown in Table 1.
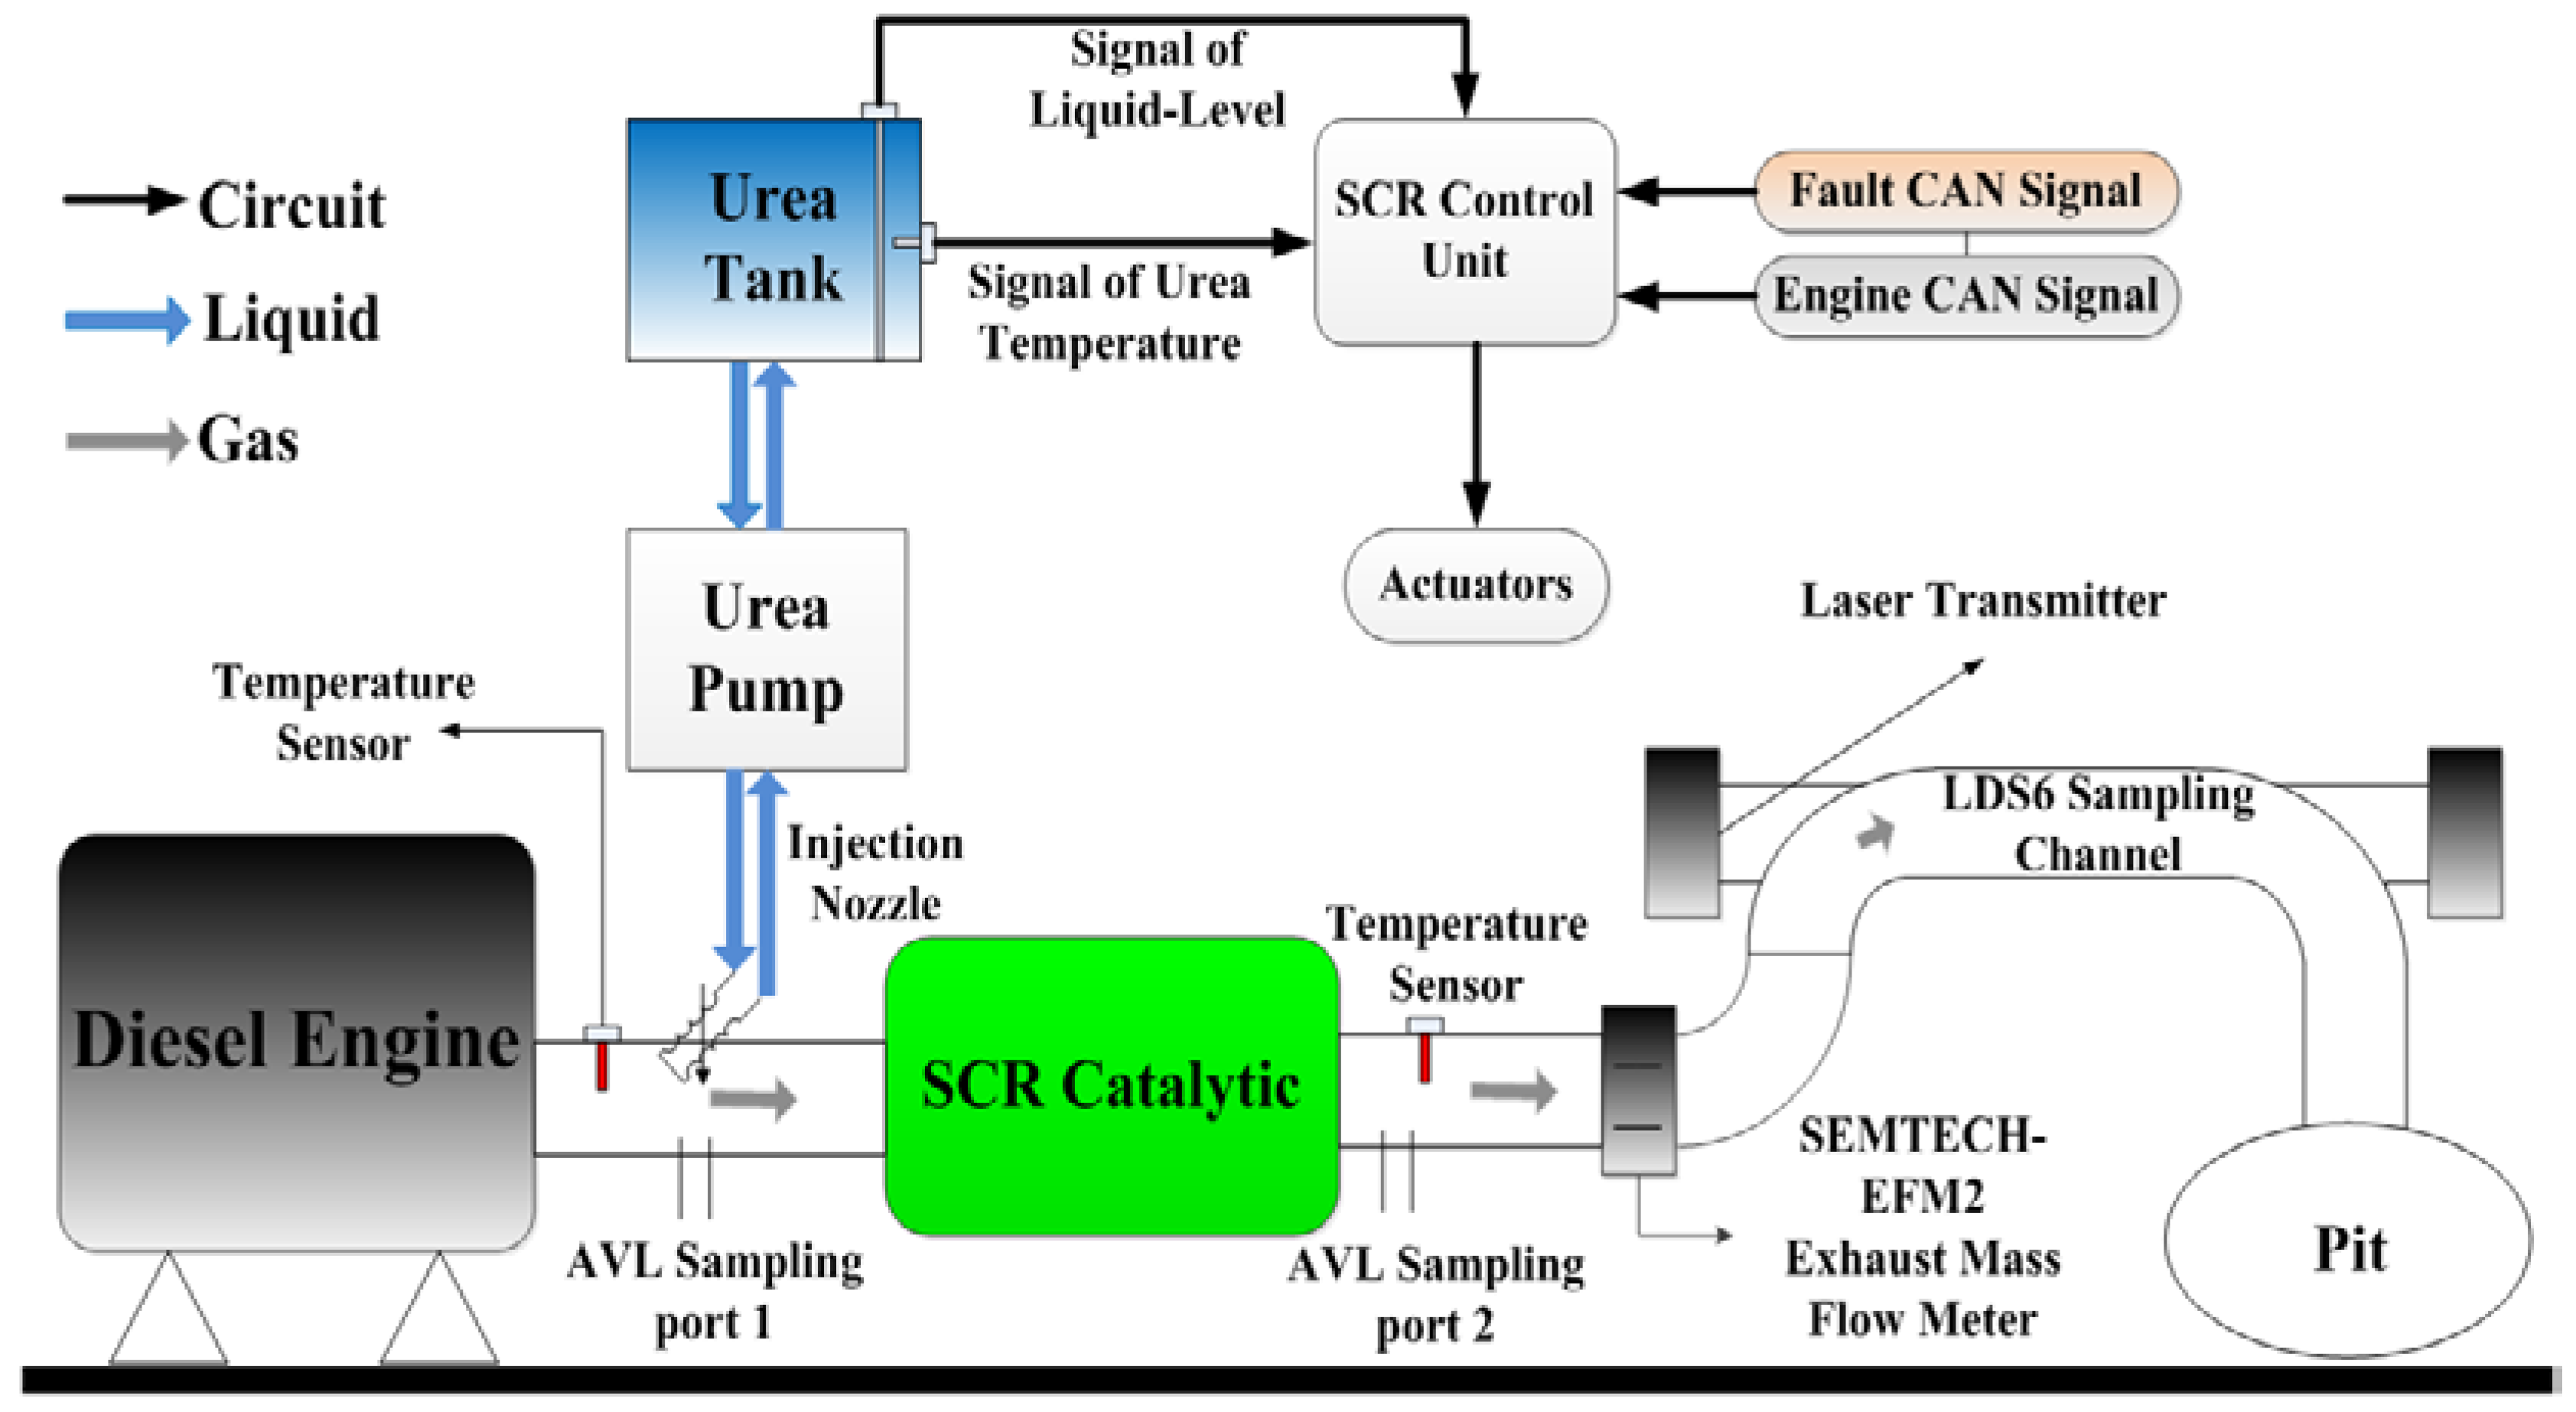
The data for validating the SCR model was collected from an engine test bench over an ETC cycle, whose layout diagram is shown in Figure 3 and which is made up of an inline 6-cyclinder YC6J-42 diesel engine equipped in the AVL PUMA OPEN test bench, a 13.5 L V2O5-WO3/TiO2 SCR catalyst convertor, two control units for engine operation and urea dosing, respectively, and measuring equipment of interest. The details of the engine specification and measuring equipment are listed in Table 2 and Table 3, respectively.
NOx and NH3 emissions as primary SCR performances were used to validate the SCR model. Figure 4 shows comparisons between simulation and experimental results over the ETC cycle. The simulation and experimental SCR-out NOx emissions are relatively in a good agreement with a mean absolute error (MAE) of 85.15 ppm, and the accumulated NOx emissions in the whole cycle are 1.92 g/kWh and 1.85 g/kWh, respectively. The estimated NH3 slip are also acceptable with a MAE of 0.98 ppm. The trends of NOx emission and NH3 slip are correctly estimated even though disagreements are found in certain operating points, and the reasons for the disagreements may be explained by the two factors below:
- (1)
- Several assumptions were induced for model simplification.
- (2)
- The operating conditions fluctuate drastically during certain periods of time, which makes it difficult to predict the corresponding NH3 and NOx emissions accurately.
3. Fault Detection and Fault-Tolerant Control
3.1. Description of Faults
SCR temperature sensors work in harsh environment including high temperature and corrosion from exhaust gas which may lead to structural damages or changes in chemical or physical property of measuring parts. Thus, the errors of sensor measurements exist on different degrees when the sensors malfunction. The fault outputs of a temperature sensor are complicated and can be expressed in several different forms [32,33,34], in a perspective of simulation, its typical faults may be primarily simplified into the following three forms:
(1) Stuck Faults: the outputs of the temperature sensor are fixed (normally at maximum) primarily due to open circuits, which can be given by:
where C is a constant.
(2) Drift Faults: the outputs decrease or increase linearly from their respective normal states [35], which can be described as:
where α is the drift slope.
(3) Gain Faults: the outputs are multiples of normal outputs, which can be given by:
where β is the proportionality coefficient.
Those faults are schematically presented in Figure 5 where the output signals are normal during the first fifty seconds and then a fault is induced at the 50th second.
3.2. Fault Detection and Fault-Tolerant Control
The methodology of fault detection is developed based on a temperature model which is used to estimate the SCR-out gas temperature, where two primary forms of heat transfer (namely convection between catalyst and exhaust gas flow and radiation between catalyst and ambient) are considered. The corresponding exchanged heat can be expressed by:
By applying the energy conservation law, the catalyst convertor has the following energy equilibrium [27,36]:
where cpc is the specific heat of the catalyst convertor. mc is the mass of the catalyst convertor. cp,exh is the specific heat at constant pressure of exhaust gas. mexh is the mass flow rate of exhaust gas. εRad is the emissivity of the catalytic convertor. σSB is the radiation constant. ARad is the radiating surface area of the convertor. Tamb is the ambient temperature.
Defining:
Then, Equation (33) is rewritten as:
Identification of parameter b1 and b2 was performed with the same method as aforementioned, whose results are 0.0712 and 8.03 × 10⁻¹³, respectively. The temperature model was validated over an ETC cycle, and the simulated and measured temperatures are in a good agreement (MAE: 4.66 K) as shown in Figure 6. Thus, the SCR-out temperature can be reasonably predicted by the temperature model.
Temperature sensor measurements will be compared with the estimates, and the temperature residuals RT can be expressed as:
where is the measurement of the outlet temperature sensor, and is the estimate of outlet temperature based on the temperature model.
When the residual is too large out of the threshold for a period of time, a fault will be detected by the diagnostic system [23]:
where the is the temperature residual threshold. The is the duration of temperature residual above the threshold, and the t* is the time threshold.
Once any temperature sensor malfunctions, its outputs with errors will be transferred to the control system to estimate catalyst temperature, which may have negative impact on SCR performances (see Section 4). Thus, an effective fault-tolerant control strategy, which is illustrated in Figure 7, is developed based on the temperature model to reduce the impacts of faults on SCR performances. While any fault of a downstream temperature sensor is detected, the sensor outputs will be substituted with the estimates.
4. Results and Discussion
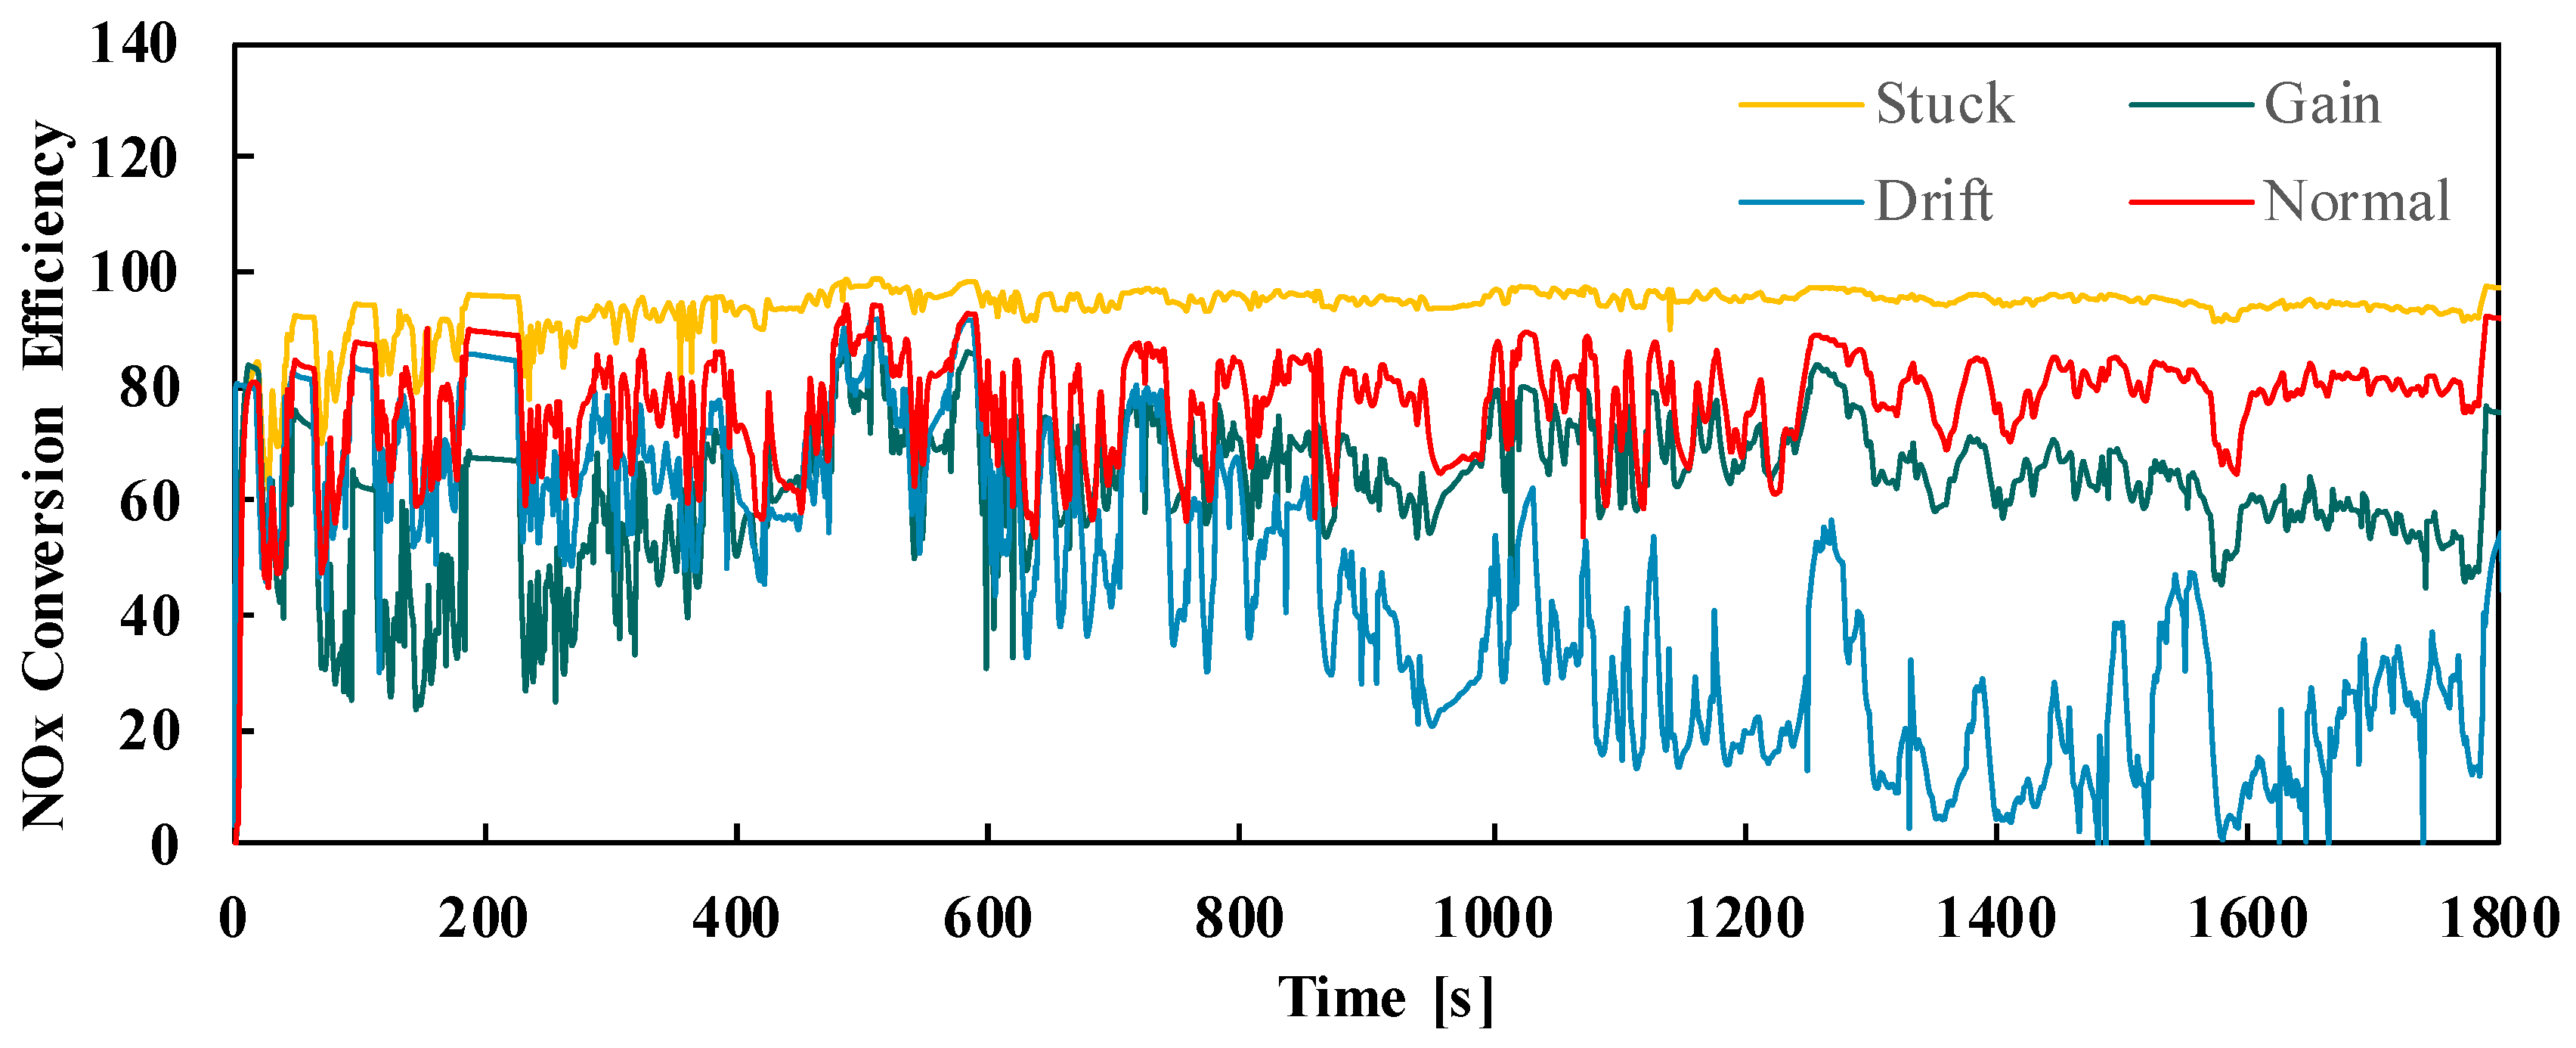
To investigate the influences of the faults on SCR performances, the aforementioned typical faults of downstream temperature sensors were simulated in Matlab/Simulink. The parameter C in the stuck fault was set to 1000. The parameter α in the gain fault was set to 0.7. The parameter β in the drift fault was set to −0.2. The faults were induced to the SCR model during the whole ETC cycle. The simulation results of SCR-out NOx concentration, NOx conversion efficiency and ammonia slip are demonstrated in Figure 8, Figure 9 and Figure 10. Comparing with the normal condition whose NOx emission and conversion efficiency are 1.90 g/kWh and 77.20%, respectively. The NOx emissions present clear increasing trends under some fault conditions; for example, especially under the drift fault, it reaches up to 4.60 g/kWh, which exceeds the Euro-5 emission limit (2 g/kWh), and the NOx conversion decreased to 44.30%.
In addition, under the gain fault conditions, the NOx conversion efficiency decreases to 62.57% and NOx emission increases to 3.02 g/kWh, which also exceeds the Euro-5 emission standard. Since the outputs of the faulty temperature sensors are smaller (e.g., under the gain and drift fault) than those of the normal ones, they will lead to erroneous predictions of the catalyst temperature and ammonia coverage ratio (Figure 11). It is noted that, the control strategy used here is based on the ammonia coverage ratio, and the estimated ammonia coverage ratio increases along with the decline of the catalyst temperature. Thus, when the fault outputs are smaller than the normal outputs, it will lead to the decline of urea dosage and NH3 slip, however, the increase of NOx emission. Moreover, it is found that the NOx conversion efficiency under the drift fault shows a significant decline in the later part of the cycle, and the corresponding NH3 slip and urea dosage decline markedly. This primarily because the absolute value of the temperature residual and the deviation of ammonia coverage ratio estimations from the real values (Figure 11c) become increasingly larger over time. Detailed SCR performances data of each condition are presented in Table 4.
The ammonia coverage ratio estimations show substantial discrepancies with the real values under fault conditions. For instance, under the stuck fault, the estimates are much smaller (see Figure 11a) due to the fault outputs of temperature sensor which are larger than the real temperature.
Moreover, under the stuck fault, the mean and peak NH3 slips are up to 13.02 ppm and 30.90 ppm, respectively, which exceed the Euro-5 emission limits (10 ppm on average, 25 ppm at peak). This is a fault where the fault outputs are larger than the normal outputs. The NH3 slip tends to increase in such a case, although the NOx conversion efficiency remains relatively high. The urea dosage is the primary control object in the SCR system, which directly influences the SCR performance. As shown in Figure 12, the mean urea dosage is up to 944.95 g/h under stuck fault, which obviously leads to the over-consumption of urea solution.
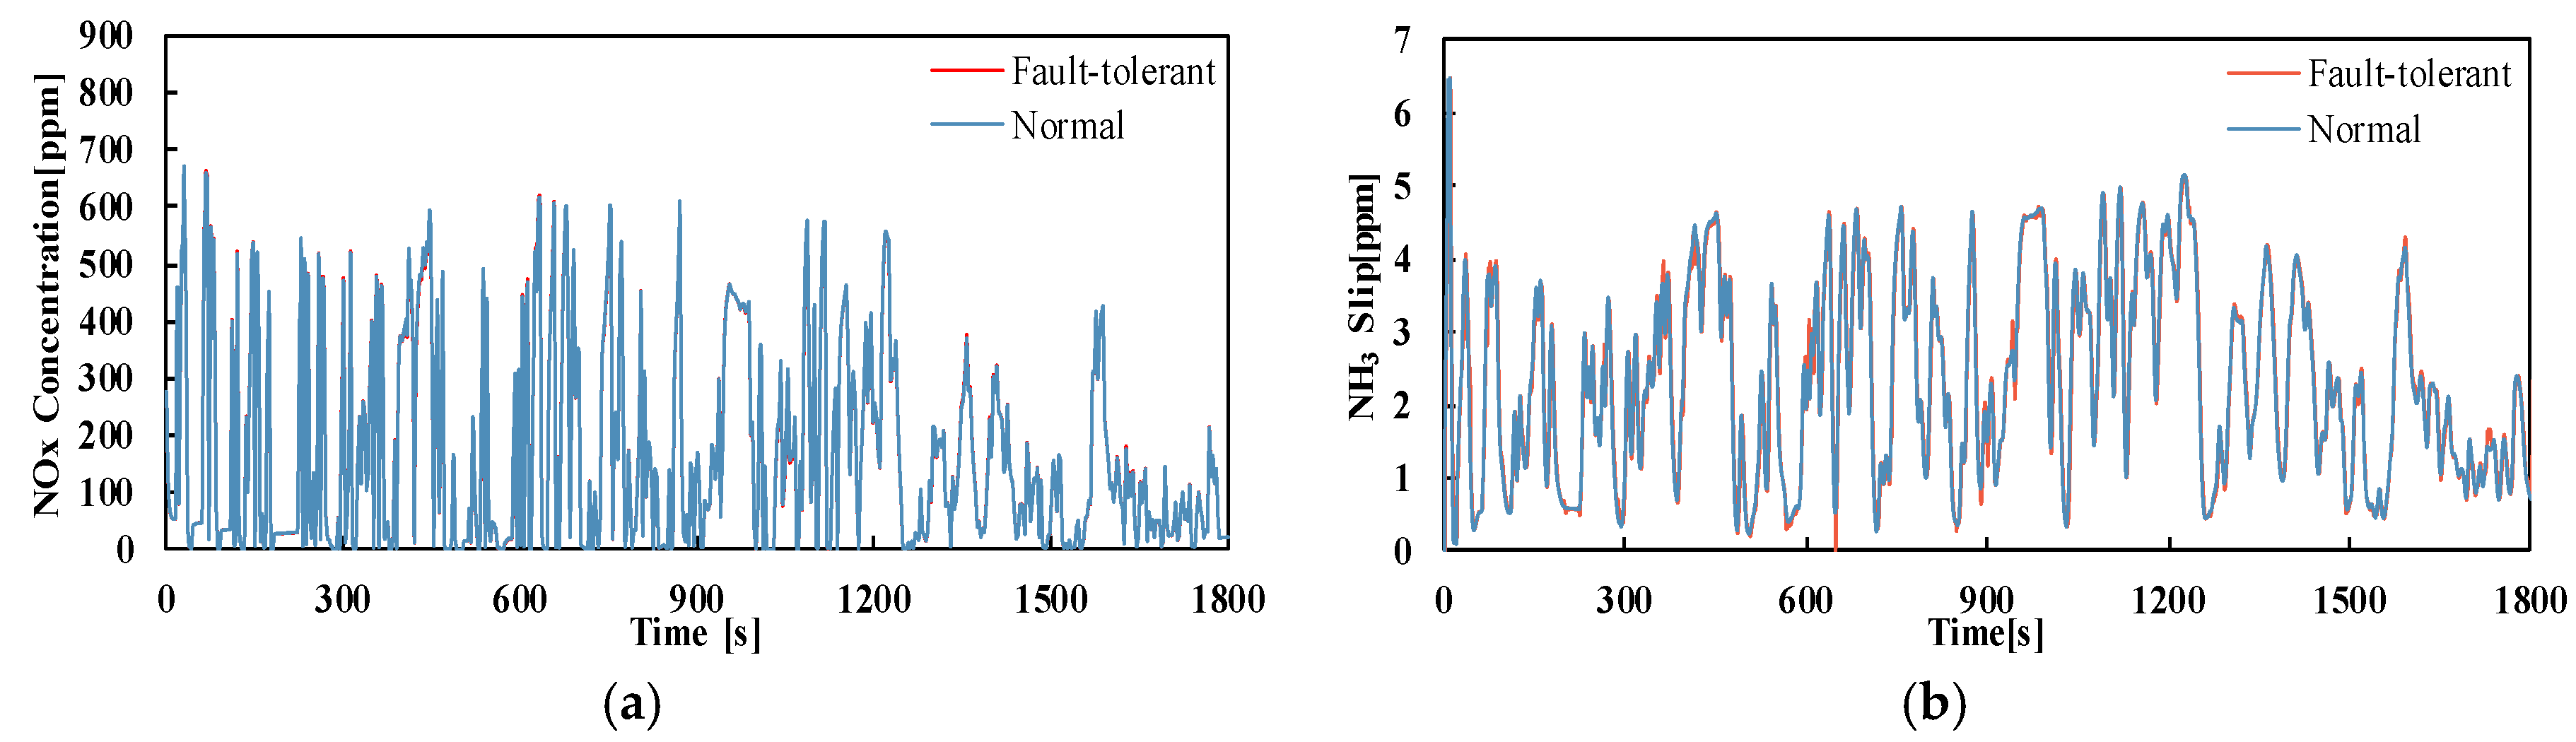
Overall, faults of SCR-out temperature sensors negatively impact SCR performances; thus, timely fault detection and fault-tolerant control shall be essential in such cases. To validate the proposed fault detection system and fault-tolerant control strategy, a fault is induced during the test cycle. For instance, a gain fault (α = 0.7) is injected in the downstream temperature sensor at the 380th second over an ETC cycle as shown in Figure 13a, after which the NOx emission grows obviously. Meanwhile, from Figure 13b, the temperature residual exceeds the threshold immediately. After the fault is detected by the diagnosis system, the fault-tolerant control take effect at the 410th second, and the NOx emission declines to the normal level.
SCR performances under fault-tolerant control over the whole ETC cycle are shown in Figure 14. The NOx emissions under fault-tolerant control and normal strategy are 1.94 g/kWh and 1.92 g/kWh, respectively. The mean NH3 slips are also similar, with 2.31 ppm under fault-tolerant control and 2.32 ppm under the normal strategy. Since the good performance of the temperature model, the SCR performances under fault-tolerant control are very similar with them of normal conditions after the measured temperature is replaced by the estimate.
5. Conclusions
The main conclusions of this study can be summarized as follows:
(1) Temperature sensors of SCR systems are prone to malfunction due to their harsh working conditions. In this study, three typical faults of downstream temperature sensor of the SCR catalyst were analyzed and modeled, and the influence of different temperature sensor faults on the SCR performance was investigated based on a 0-D SCR model. The results showed that temperature sensor faults occurring in various forms influence SCR performances to various degrees. In a case that the fault outputs are smaller than the normal outputs (e.g., the drift fault), the NOx emission tends to be larger than it under normal condition. However, in a case that the fault outputs are larger than the normal outputs (e.g., the stuck fault), the NH3 slip tends to be larger than it under normal condition.
(2) A model-based fault detection system and a fault-tolerant control strategy were developed, and the diagnosis algorithm was validated over the ETC cycle by simulation. The results indicated that the fault detection system is capable of detecting typical faults of temperature sensors after their occurrences, and the fault-tolerant control strategy proposed can take effect for regulating the SCR system under fault conditions and maintaining SCR performances within their reasonable ranges.
In summary, this study presents a clear illustration of how the SCR performances are influenced by three typical faults of the downstream temperature sensor, and it may contribute to the recognition of the fault propagation paths and rules in the SCR system. Furthermore, a fault detection system and a fault-tolerant control strategy are designed for the SCR control system. Simulation results on a 0-D SCR model proved their effectiveness, which indicates their enormous potential of practical application on vehicles. Further researches will focus on the experimental validation of the fault detection system and fault-tolerant control strategy; moreover, fault diagnosis of other sensors (such as NOx sensors and NH3 sensors) will be also investigated.
Author Contributions
All authors have contributed equally to the design of the research, data collection and analysis and the final preparation of the manuscript.
Funding
This research was funded by [National Key R&D Program of China] grant number [2017YFC0211203], [National Natural Science Foundation] grant number [51406140], [National Engineering Laboratory for Mobile Source Emission Control Technology] grant number [NELMS2017A08], [Natural Science Foundation of Hubei Province] grant number [2018CFB592] and [111 Project] grant number [B17034].
Acknowledgments
The authors would like to gratefully acknowledge the Hubei Key Laboratory of Advanced Technology for Automotive Components (Wuhan University of Technology).
Conflicts of Interest
The authors declare no potential conflict of interest.
References
- Tamilselvan, P.; Nallusamy, N.; Rajkumar, S. A comprehensive review on performance, combustion and emission characteristics of biodiesel fuelled diesel engines. Renew. Sustain. Energy Rev. 2017, 79, 1134–1159. [Google Scholar] [CrossRef]
- Liu, J.; Sun, P.; Huang, H.; Meng, J.; Yao, X. Experimental investigation on performance, combustion and emission characteristics of a common-rail diesel engine fueled with polyoxymethylene dimethyl ethers-diesel blends. Appl. Energy 2017, 202, 527–536. [Google Scholar] [CrossRef]
- Yamamoto, K.; Sakai, T. Simulation of continuously regenerating trap with catalyzed DPF. Catal. Today 2015, 242, 357–362. [Google Scholar]
- Ge, J.; Yoon, S.; Choi, N. Using Canola Oil Biodiesel as an Alternative Fuel in Diesel Engines: A Review. Appl. Sci. 2017, 7, 881. [Google Scholar] [CrossRef]
- Di, S.V.; Benedetto, A.D. Modeling and simulation of soot combustion dynamics in a catalytic diesel particulate filter. Chem. Eng. Sci. 2015, 137, 69–78. [Google Scholar]
- Gou, X.; Wu, C.; Zhang, K.; Xu, G.; Si, M.; Wang, Y.; Wang, E.; Liu, L.; Wu, J. Low Temperature Performance of Selective Catalytic Reduction of NO with NH3 under a Concentrated CO2 Atmosphere. Energies 2015, 11, 12331–12341. [Google Scholar] [CrossRef]
- Wang, Y.Y.; Zhang, H.; Wang, J. NOx Sensor Reading Correction in Diesel Engine Selective Catalytic Reduction System Applications. IEEE/ASME Trans. Mech. 2016, 1, 460–471. [Google Scholar] [CrossRef]
- Willems, F.; Cloudt, R.; van den Eijnden, E.; van Genderen, M.; Verbeek, R.; de Jager, B.; Boomsma, W.; van den Heuvel, I. Is Closed-Loop SCR Control Required to Meet Future Emission Targets? SAE Technical Paper 2007-01-1574; SAE: Warrendale, PA, USA, 2007. [Google Scholar]
- Wang, G.; Zhang, J.; Yang, B.; Li, C.; Shuai, S.-H.; Yin, S.; Jian, M. Development of Model Based Closed Loop Control Strategy of SCR System for Heavy-Duty Diesel Engines; SAE Technical Paper 2017-01-2383; SAE: Warrendale, PA, USA, 2017. [Google Scholar]
- Skaf, Z.; Aliyev, T.; Shead, L.; Steffen, T. The State of the Art in Selective Catalytic Reduction Control; SAE Technical Paper 2014-01-1533; SAE: Warrendale, PA, USA, 2014. [Google Scholar]
- Willems, F.; Cloudt, R. Experimental Demonstration of a New Model-Based SCR Control Strategy for Cleaner Heavy-Duty Diesel Engines. IEEE Trans. Control Syst. Technol. 2011, 5, 1305–1313. [Google Scholar] [CrossRef]
- Shost, M.; Noetzel, J.; Wu, Mi.; Sugiarto, T.; Bordewyk, T.; Fulks, G.; Fisher, G.B. Monitoring, Feedback and Control of Urea SCR Dosing Systems for NOx Reduction: Utilizing an Embedded Model and Ammonia Sensing; SAE-2008-01-1325; SAE: Warrendale, PA, USA, 2008. [Google Scholar]
- Devarakonda, M.; Parker, G.; Johnson, J.; Strots, V. Model-based control system design in a urea-SCR after treatment system based on NH3 sensor feedback. Int. J. Automot. Technol. 2009, 10, 653–662. [Google Scholar] [CrossRef]
- Hsieh, M.F.; Wang, J. Nonlinear observer designs for diesel engine selective catalytic reduction (SCR) ammonia coverage ratio estimation. In Proceedings of the 48h IEEE Conference on Decision and Control (CDC) Held Jointly with 2009 28th Chinese Control Conference, Shanghai, China, 15–18 December 2009; pp. 6596–6601. [Google Scholar]
- Ming, F.H.; Wang, J. An extended Kalman filter for NOx, sensor ammonia cross-sensitivity elimination in selective catalytic reduction applications. In Proceedings of the 2010 American Control Conference, Baltimore, MD, USA, 30 June–2 July 2010; pp. 3033–3038. [Google Scholar]
- Ming, F.H.; Wang, J. An extended Kalman filter for ammonia coverage ratio and capacity estimations in the application of Diesel engine SCR control and onboard diagnosis. In Proceedings of the 2010 American Control Conference, Baltimore, MD, USA, 30 June–2 July 2010; pp. 5874–5879. [Google Scholar]
- Li, W.; Yan, F.; Hu, J.; Xi, G.; Liu, B.; Zeng, J. NOx conversion efficiency optimization based on NSGA-II and state-feedback nonlinear model predictive control of selective catalytic reduction system in diesel engine. Appl. Energy 2017, 206, 959–971. [Google Scholar]
- Chen, R.; Wang, X. Model-Based Fault Diagnosis of Selective Catalytic Reduction Systems for Diesel Engines. SAE Int. J. Passeng. Cars Electron. Electr. Syst. 2014, 7, 449–453. [Google Scholar] [CrossRef]
- Wang, Y.Y.; Sun, Y.; Chang, C.-F.; Hu, Y. Model-Based Fault Detection and Fault-Tolerant Control of SCR Urea Injection Systems. IEEE Trans. Veh. Technol. 2016, 6, 4645–4654. [Google Scholar] [CrossRef]
- Sun, Y.; Wang, Y.; Chang, C.; Levijoki, S. Detection of Urea Injection System Faults for SCR Systems; SAE Technical Paper 2012-01-0431; SAE: Warrendale, PA, USA, 2012. [Google Scholar] [CrossRef]
- Matsumoto, A.; Furui, K.; Ogiso, M.; Kidokoro, T. Model-Based OBD Logic Utilizing Adsorption and Desorption Model of NH3 in SCR Catalyst; SAE Technical Paper 2016-01-0960; SAE: Warrendale, PA, USA, 2016. [Google Scholar] [CrossRef]
- Pezzini, A. A Methodology for Fault Diagnosis of Diesel NOx Aftertreatment Systems. IFAC Proc. Vol. 2009, 8, 911–916. [Google Scholar] [CrossRef]
- Wang, Y.Y.; He, Y. On-Board Diagnostics of Temperature Sensors for Selective Catalyst Reduction System. U.S. Patent 8,515,710, 16 March 2013. [Google Scholar]
- Zhang, H.; Wang, J. Ammonia coverage ratio and input simultaneous estimation in ground vehicle selective catalytic reduction (SCR) systems. J. Frankl. Inst. 2015, 352, 708–723. [Google Scholar] [CrossRef]
- Zhang, H.; Wang, J. Removal of NOx sensor ammonia cross sensitivity from contaminated measurements in diesel-engine selective catalytic reduction systems. Fuel 2015, 150, 448–456. [Google Scholar] [CrossRef]
- Devarakonda, M.; Parker, G.; Johnson, J.H.; Strots, V.; Santhanam, S. Adequacy of Reduced Order Models for Model-Based Control in a Urea-SCR Aftertreatment System; SAE Paper 2008-01-0617; SAE: Warrendale, PA, USA, 2008. [Google Scholar]
- Schär, C.M.; Onder, C.H.; Geering, H.P. Control of an SCR catalytic converter system for a mobile heavy-duty application. IEEE Trans. Contr. Syst. Trans. 2006, 14, 641–653. [Google Scholar] [CrossRef]
- Stadlbauer, S.; Waschl, H.; Re, L.D. Adaptive SCR Model for MPC Control Including Aging Effects; SAE Paper 2015-01-1045; SAE: Warrendale, PA, USA, 2015. [Google Scholar]
- Herman, A.; Wu, M.-C.; Cabush, D.; Shost, M. Model Based Control of SCR Dosing and OBD Strategies with Feedback from NH3 Sensors. SAE Int. J. Fuels Lubr. 2009, 1, 375–385. [Google Scholar] [CrossRef]
- Nova, I.; Tronconi, E. Urea-SCR Technology for deNOx After Treatment of Diesel Exhausts; Springer: New York, NY, USA, 2014. [Google Scholar]
- Bonfils, A.; Creff, Y.; Lepreux, O.; Petit, N. Closed-loop control of a SCR system using a NOx, sensor cross-sensitive to NH3. J. Process Control 2014, 2, 368–378. [Google Scholar] [CrossRef]
- Dunia, R.; Qin, S.J.; Edgar, T.F.; Mcavoy, T.J. Identification of faulty sensors using principal component analysis. Process Syst. Eng. 1996, 42, 2797–2812. [Google Scholar] [CrossRef]
- Kullaa, J. Detection, identification, and quantification of sensor fault in a sensor network. Mech. Syst. Signal Process. 2013, 40, 208–221. [Google Scholar] [CrossRef]
- Yu, Y.; Li, W.; Sheng, D.; Chen, J. A novel sensor fault diagnosis method based on modified ensemble empirical mode decomposition and probabilistic neural network. Measurement 2015, 68, 328–336. [Google Scholar] [CrossRef]
- Jan, S.U.; Lee, Y.; Shin, J.; Koo, I. Sensor Fault Classification Based on Support Vector Machine and Statistical Time-Domain Features. IEEE Access 2017, 5, 8682–8690. [Google Scholar] [CrossRef]
- Yuan, X.; Liu, H.; Gao, Y. Diesel Engine SCR Control: Current Development and Future Challenges. Emiss. Control Sci. Technol. 2015, 2, 121–133. [Google Scholar] [CrossRef]
Figure 1.
Schematic of the ammonia-coverage-ratio-based closed-loop control strategy.
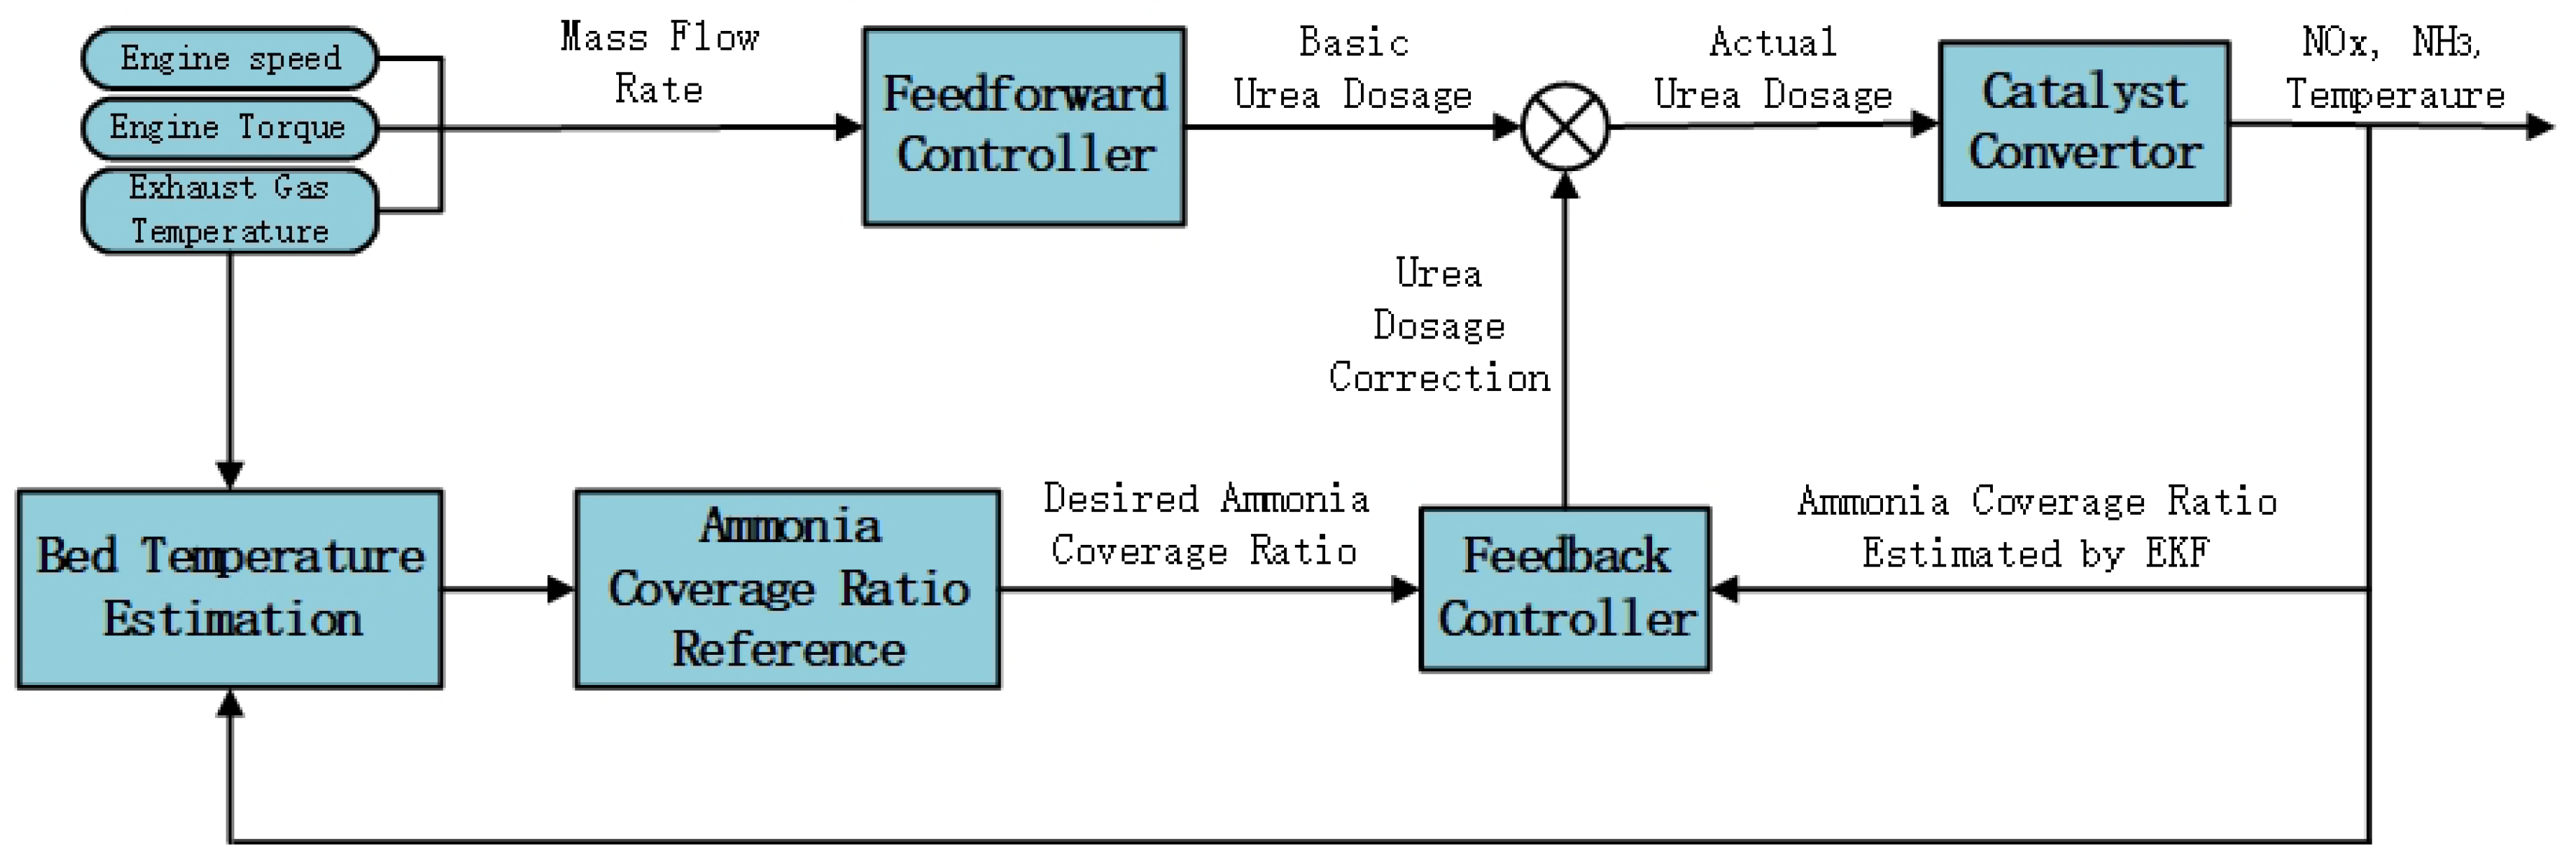
Figure 2.
Ammonia coverage ratio reference at different catalyst temperatures.
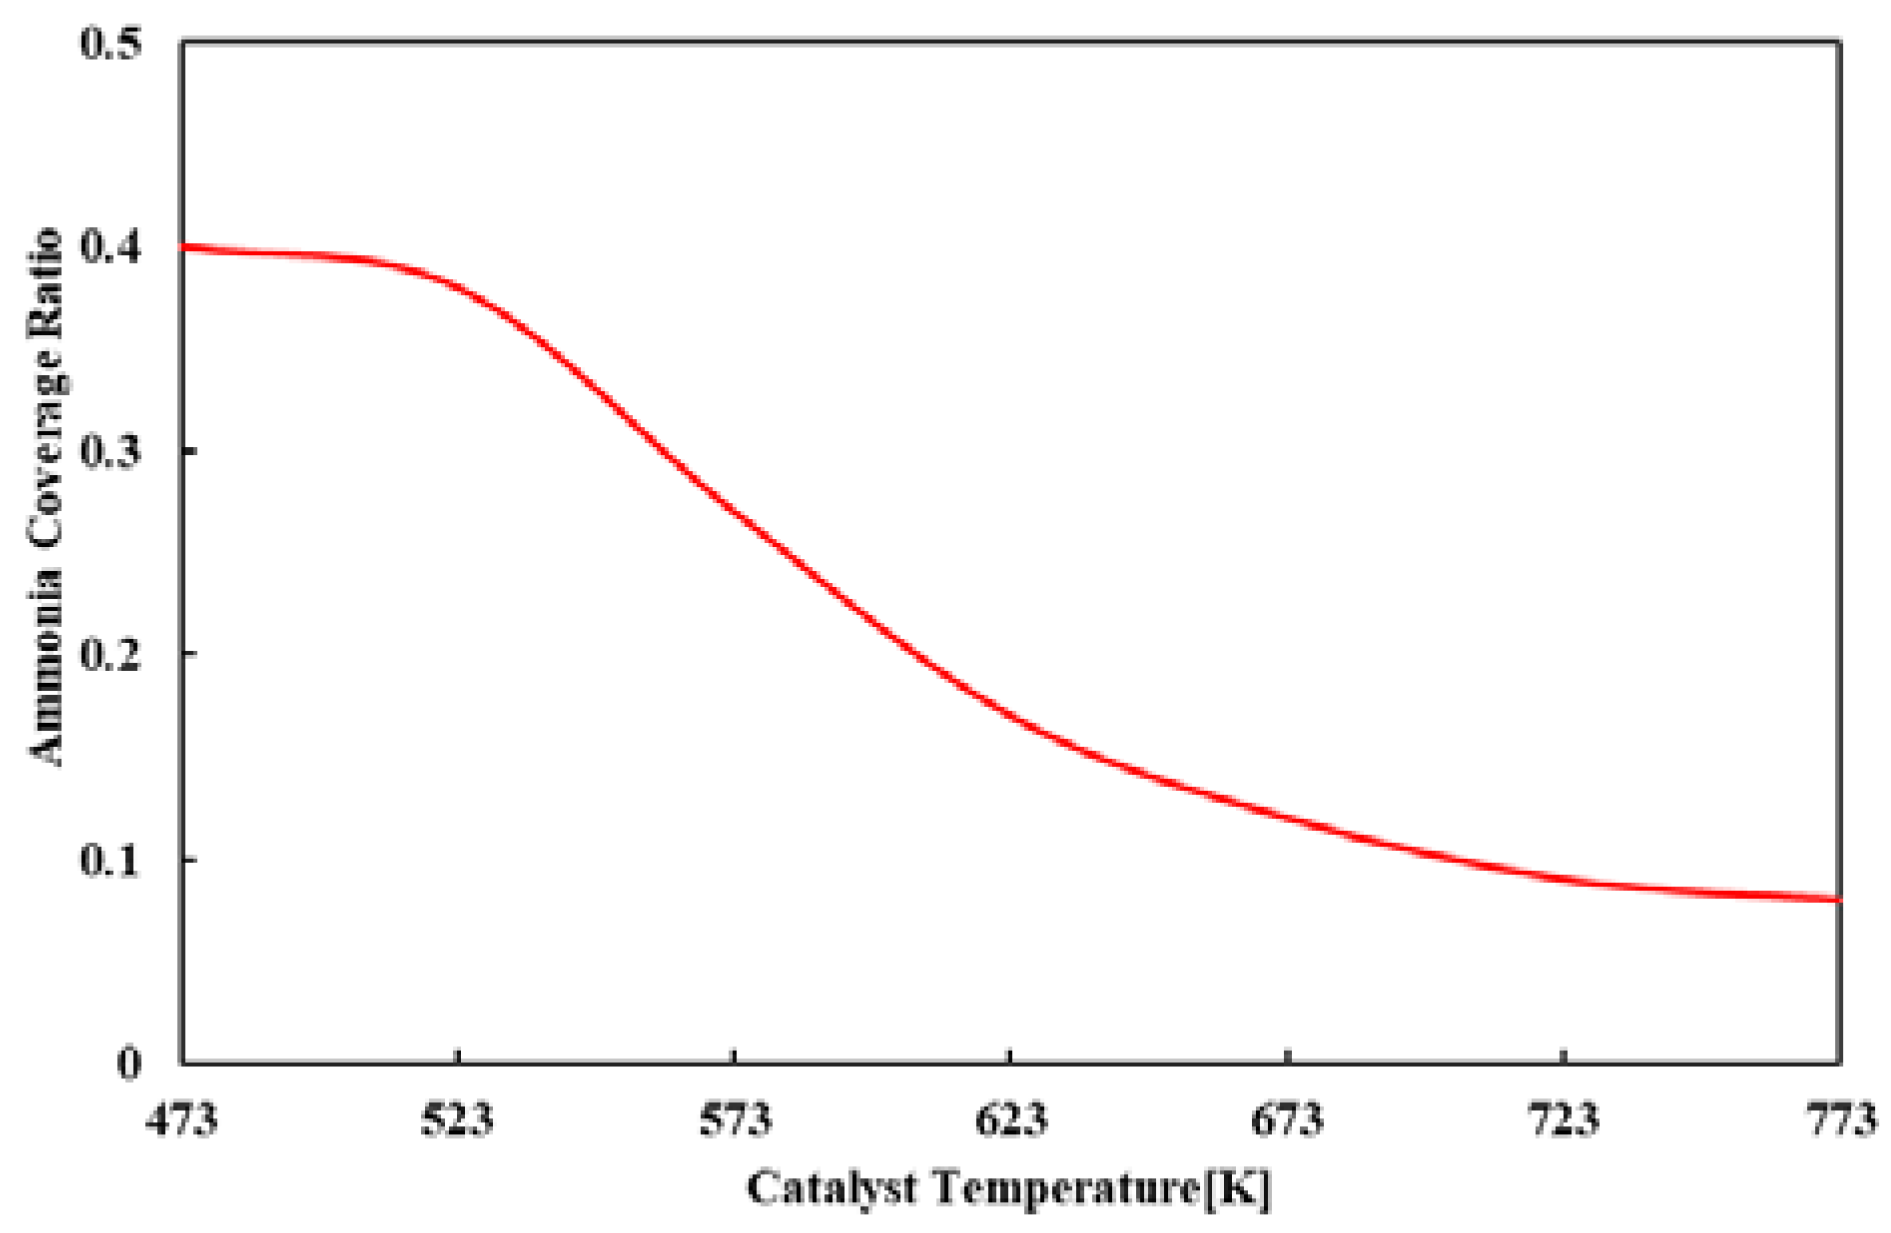
Figure 3.
Schematic diagram of our experimental setup.

Figure 4.
Comparison of simulation and experiment results. (a) NOx concentration; and (b) NH3 slip.
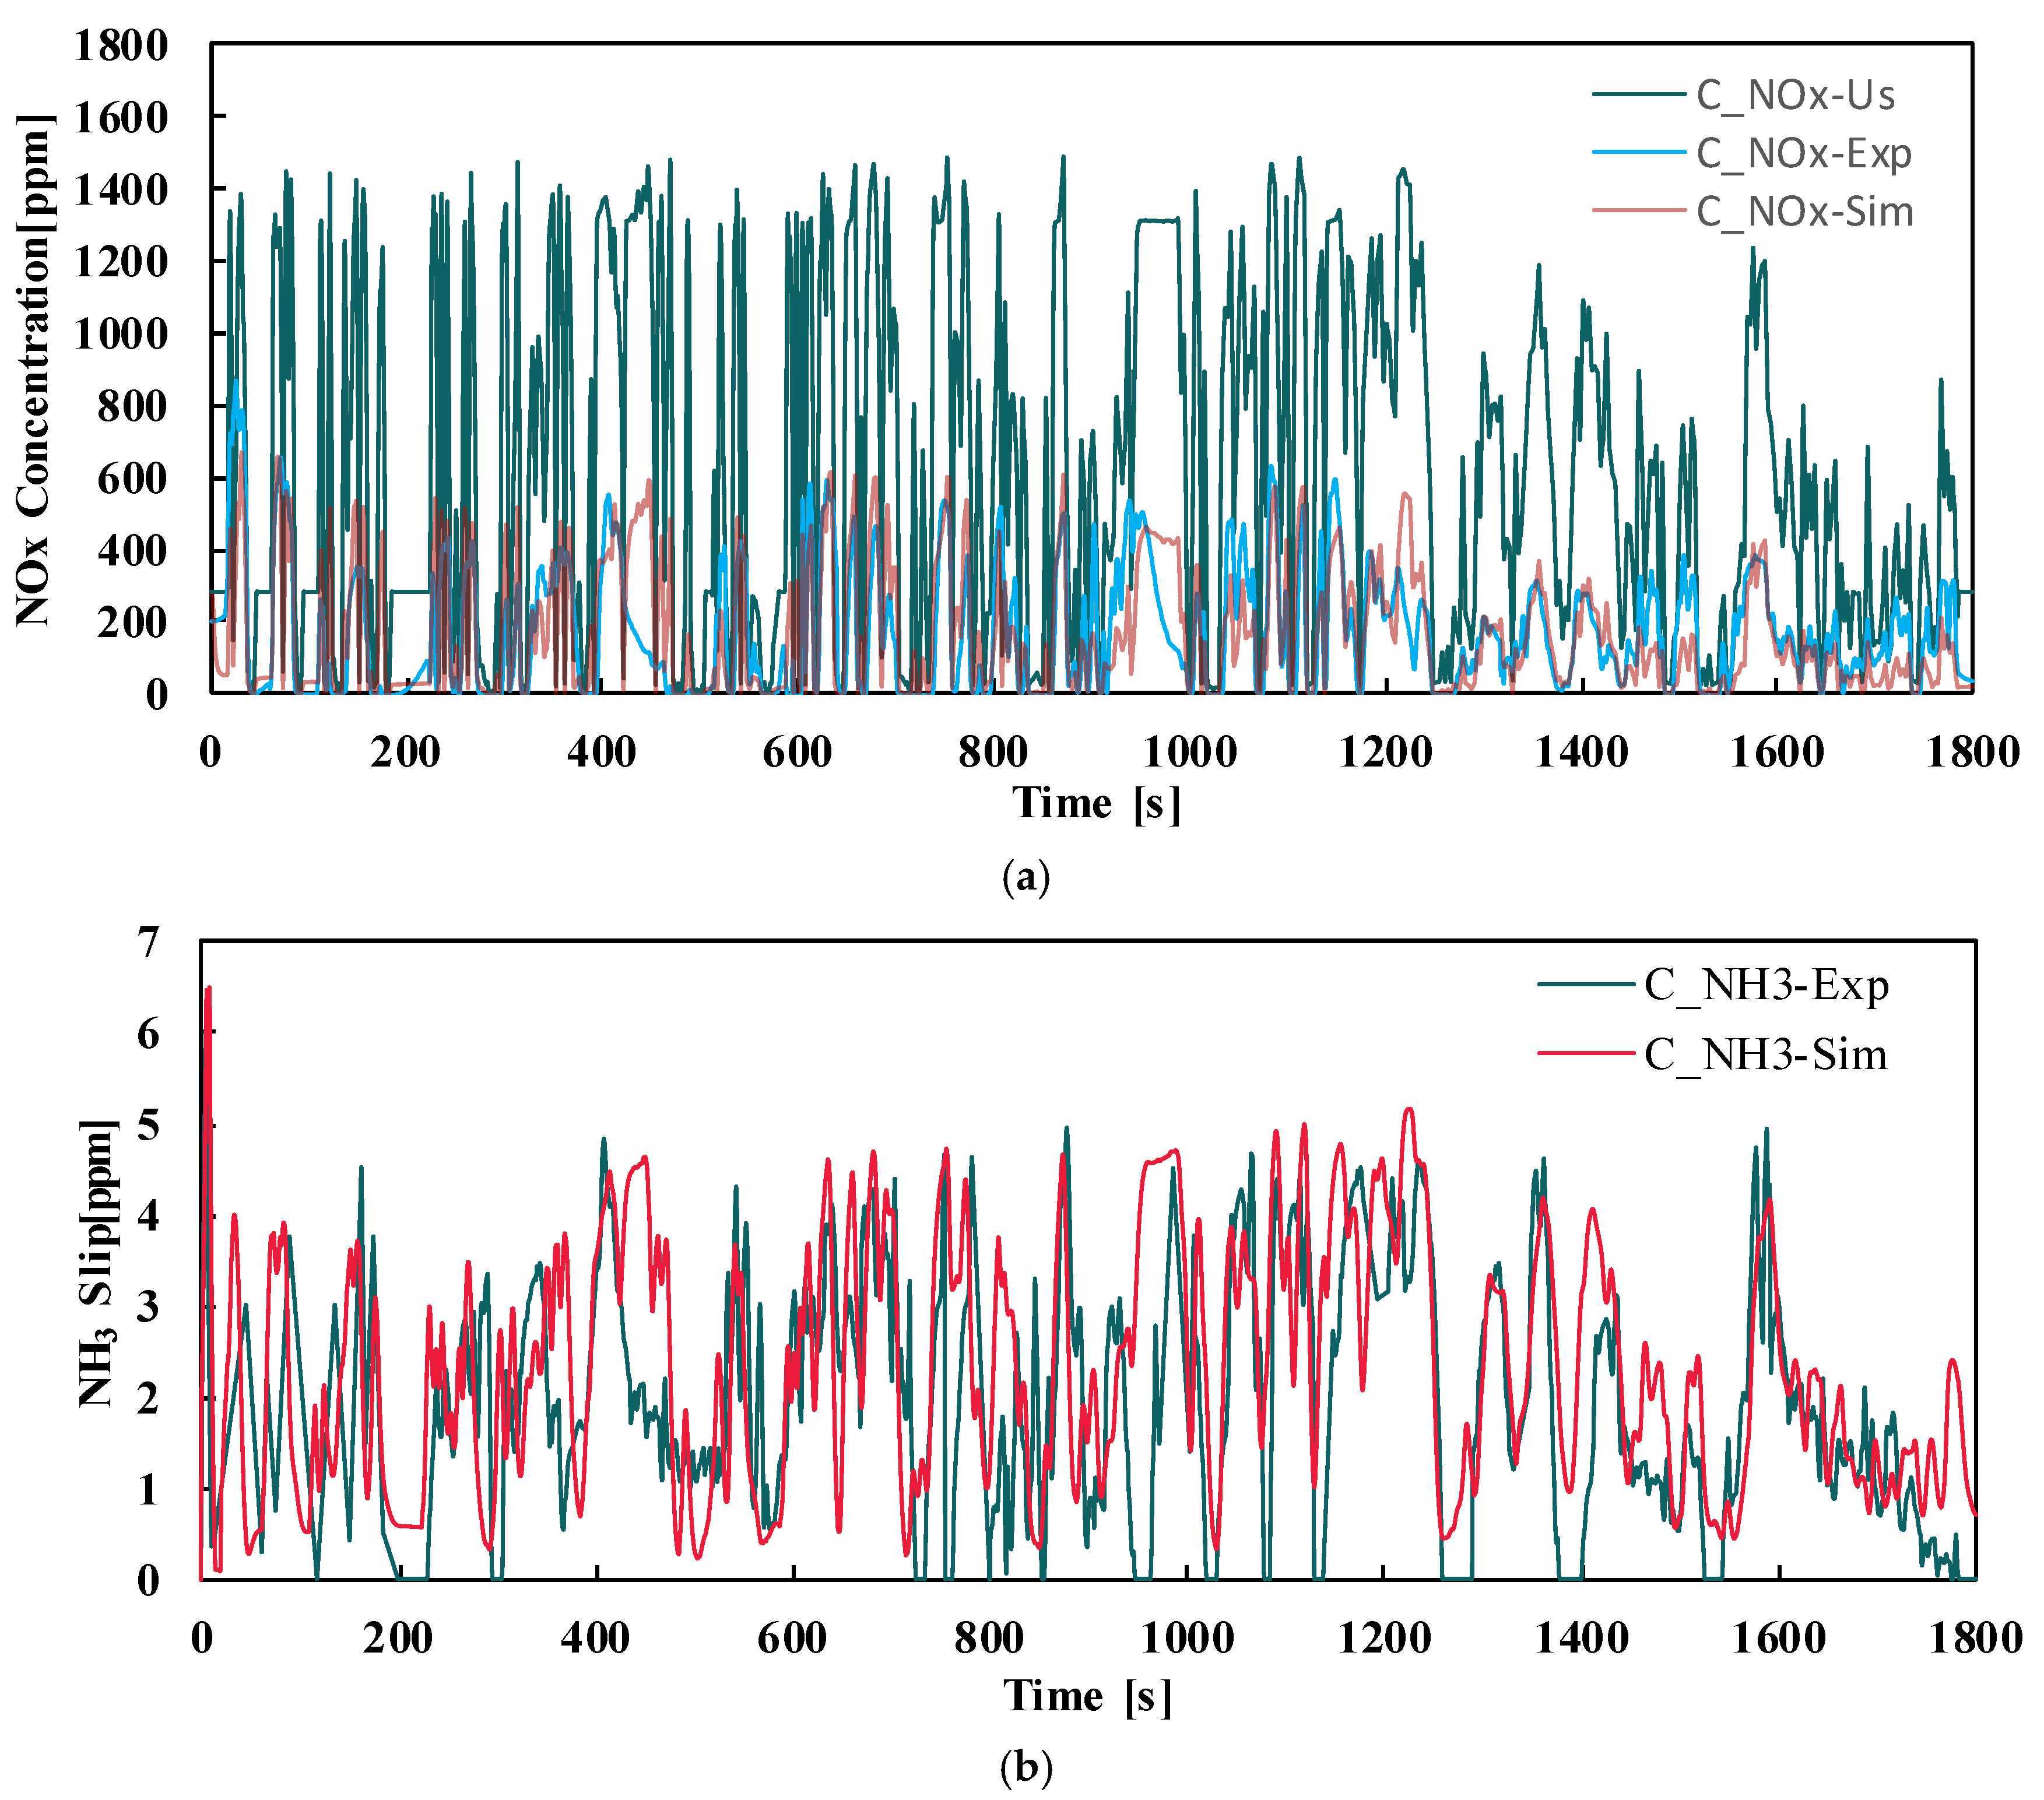
Figure 5.
Schematic diagram of fault samples. (a) Normal data; (b) stuck fault; (c) drift fault; and (d) gain fault.
Figure 5.
Schematic diagram of fault samples. (a) Normal data; (b) stuck fault; (c) drift fault; and (d) gain fault.
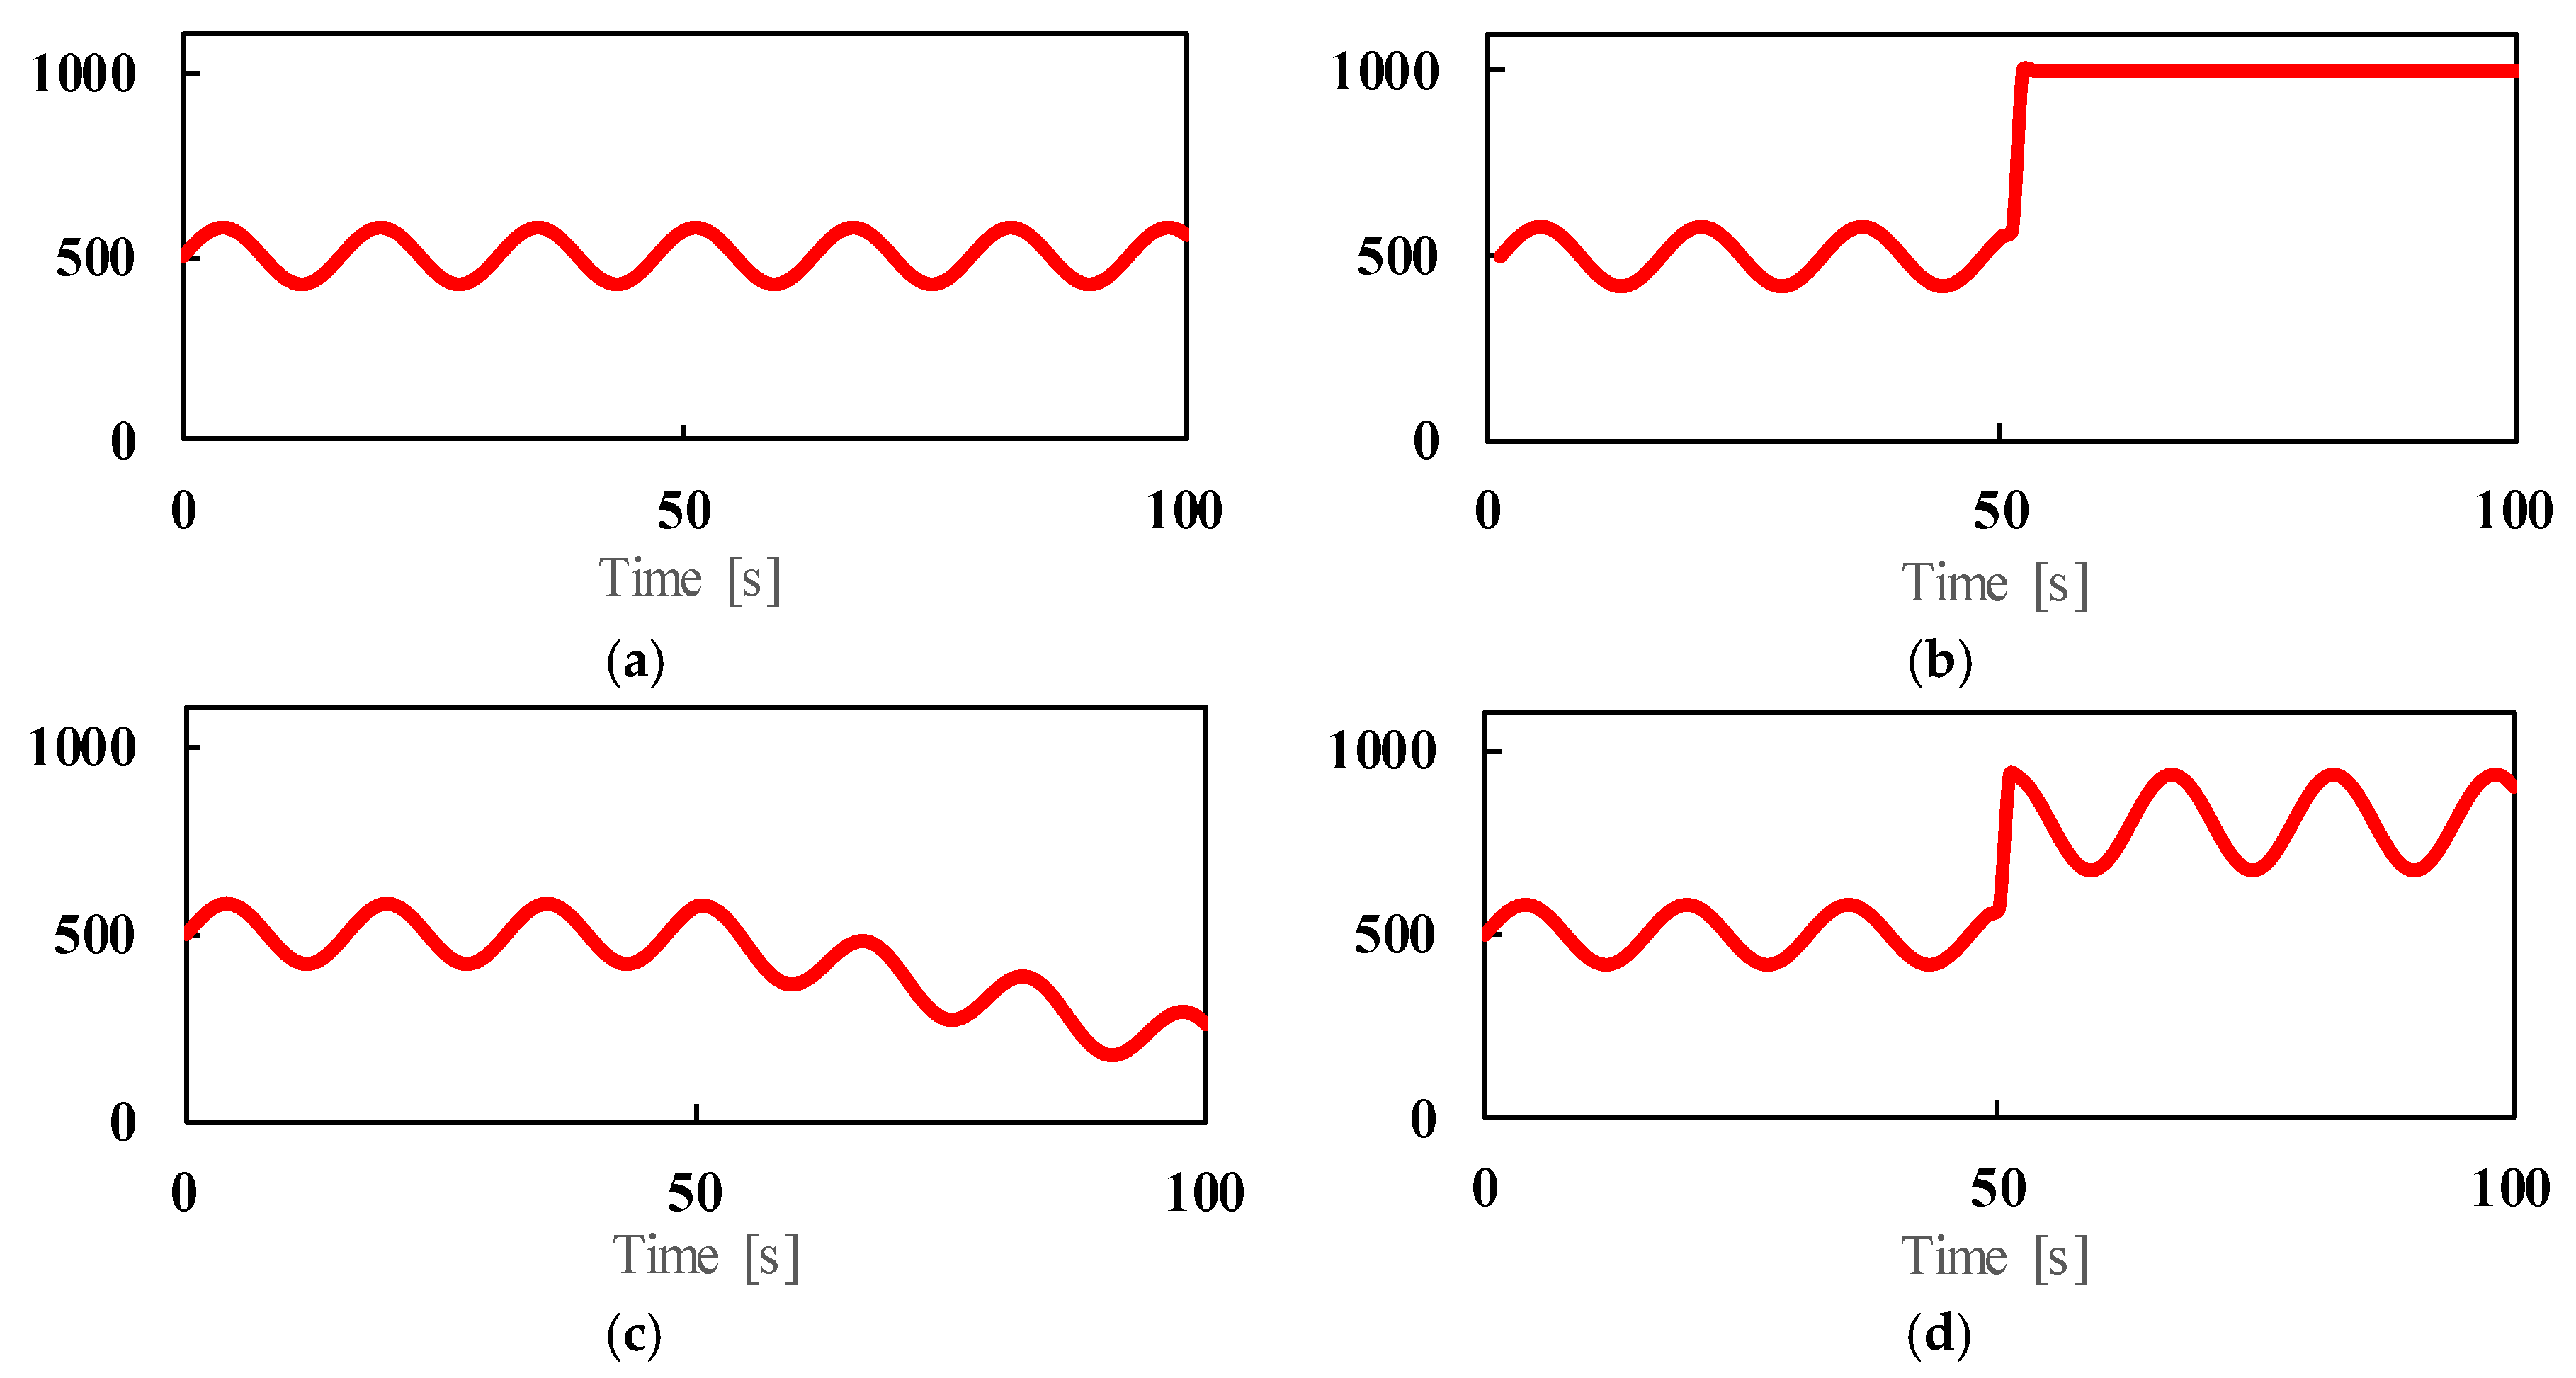
Figure 6.
Comparison of simulation and experimental results. (a) Temperature vs. time; and (b) absolute error.
Figure 6.
Comparison of simulation and experimental results. (a) Temperature vs. time; and (b) absolute error.
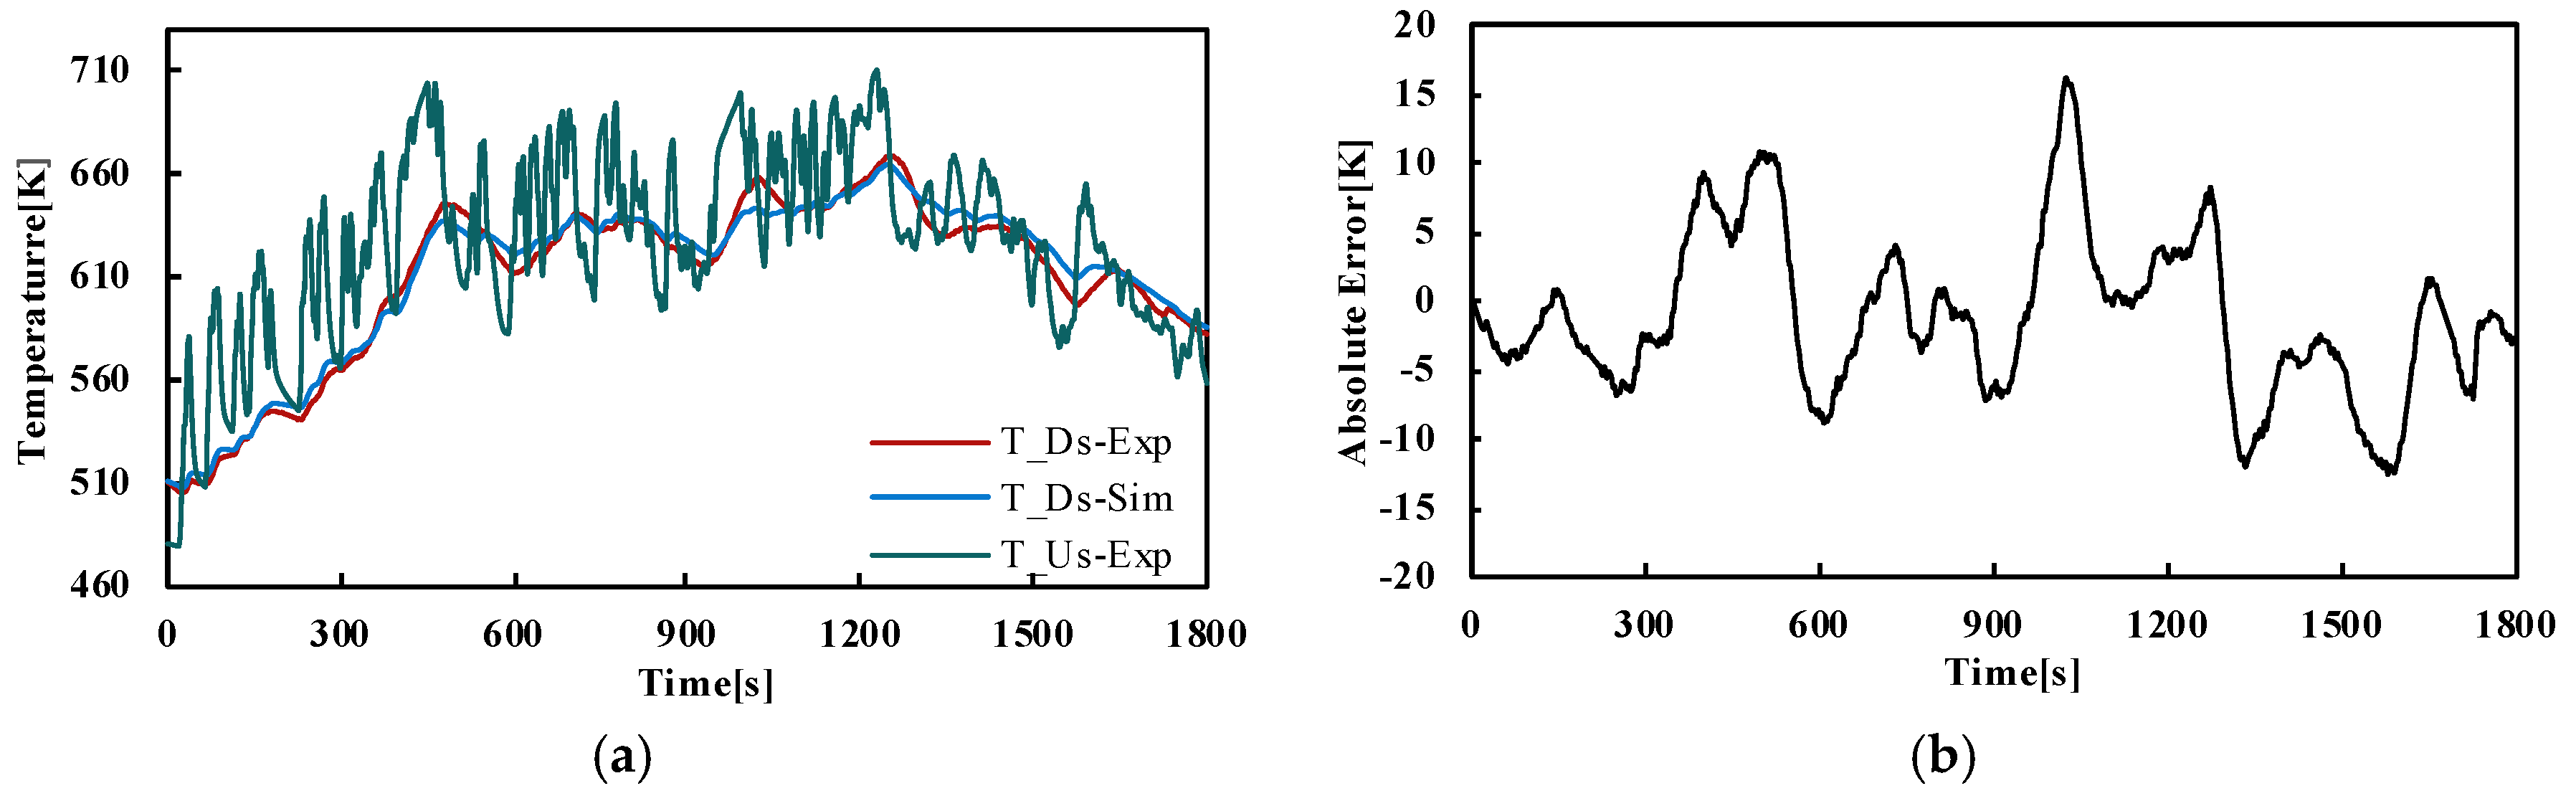
Figure 7.
Fault-tolerant control strategy of SCR system.
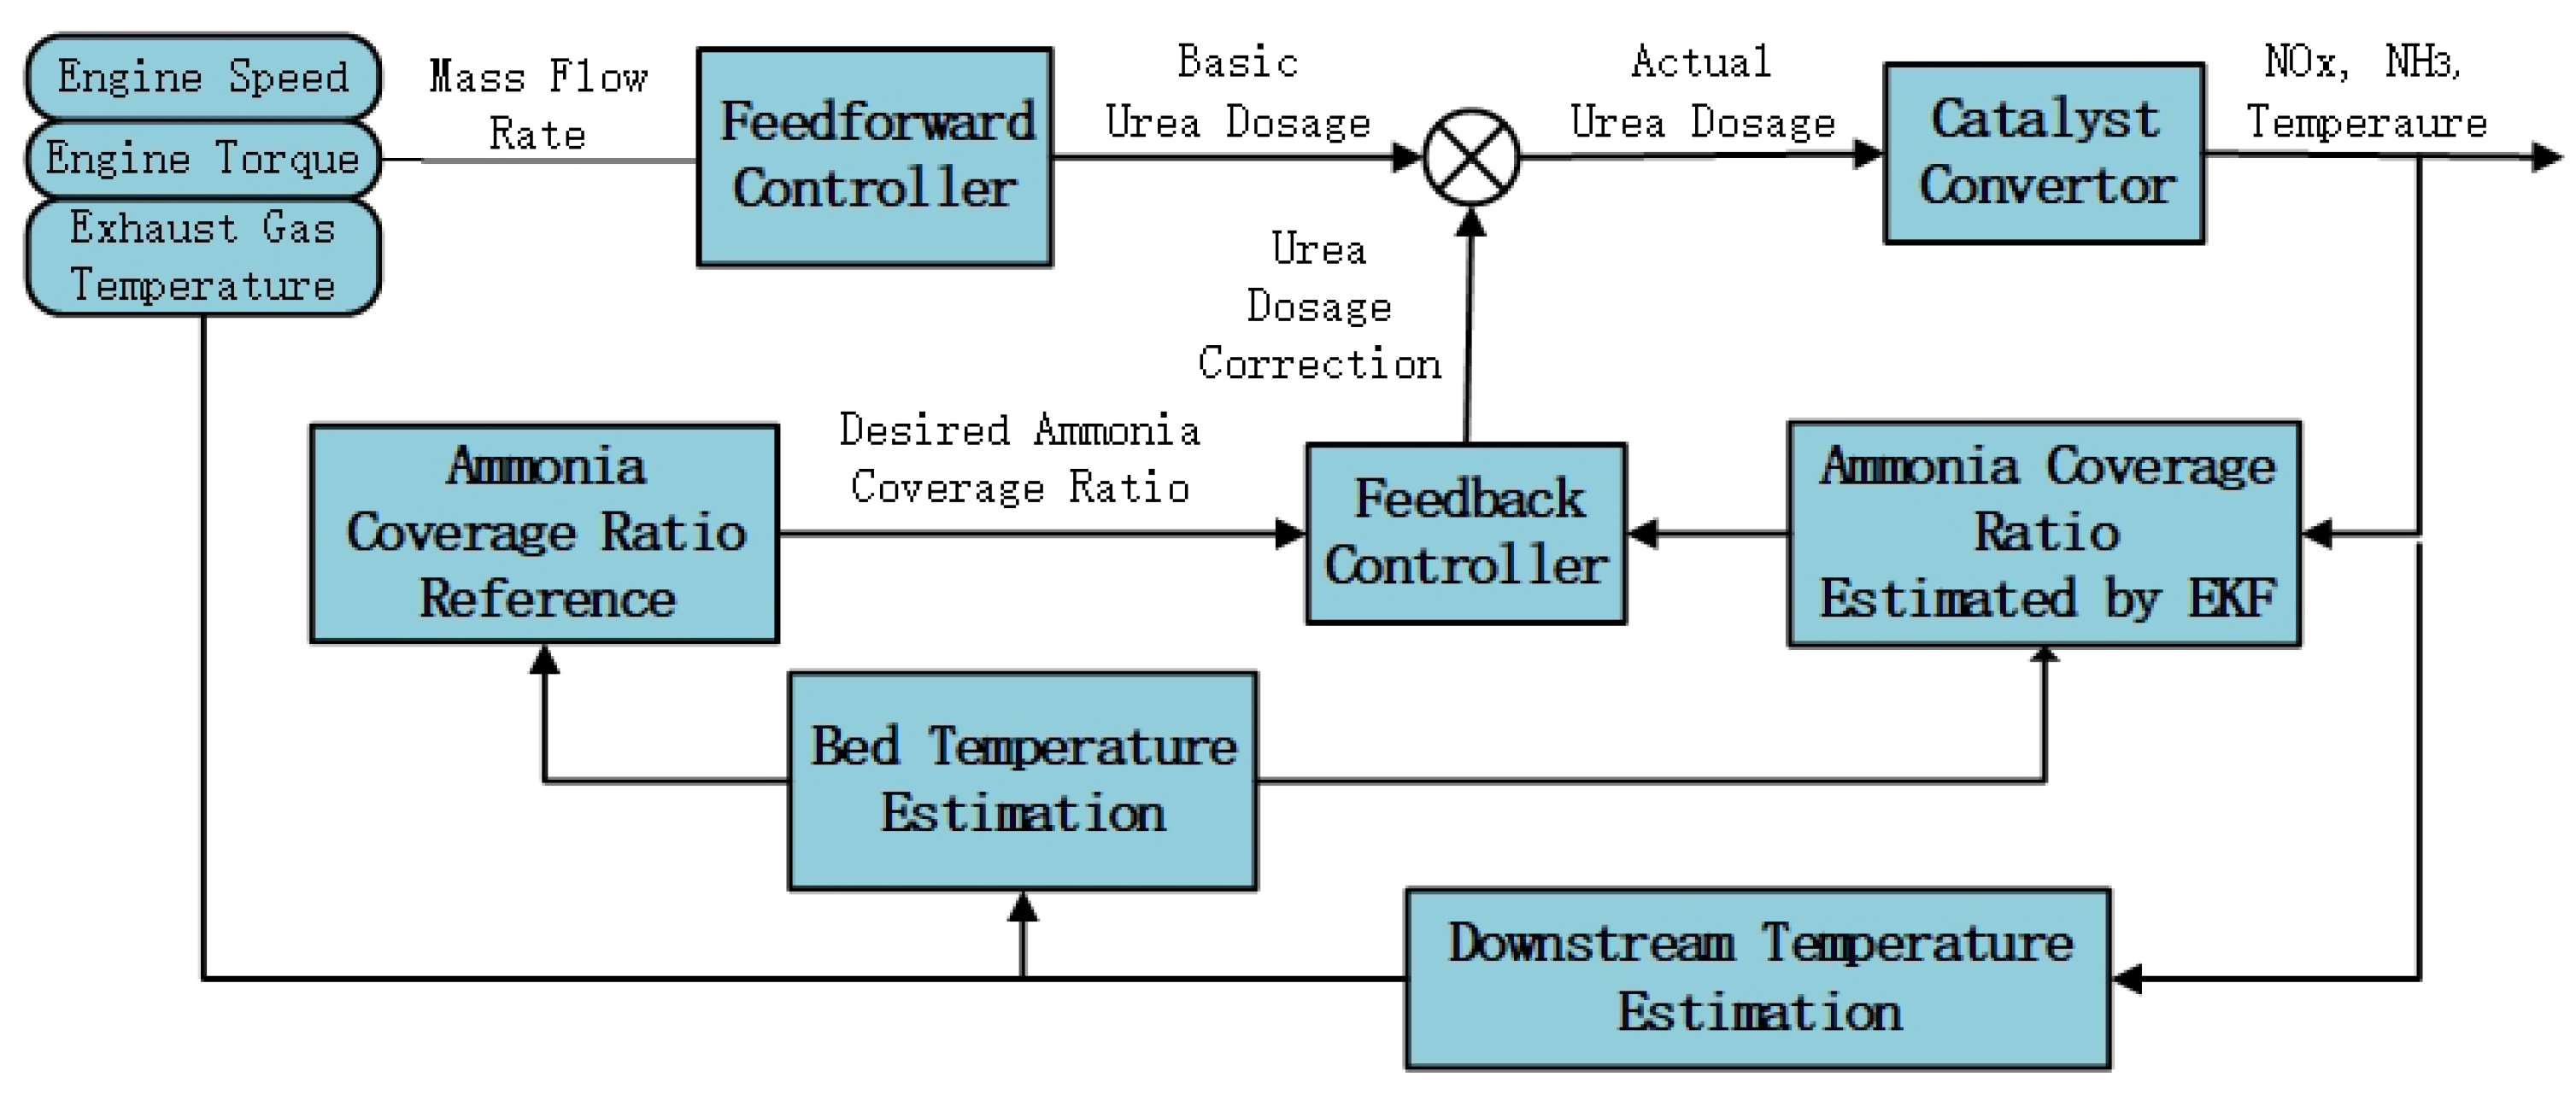
Figure 8.
Outlet NOx concentration vs. time.
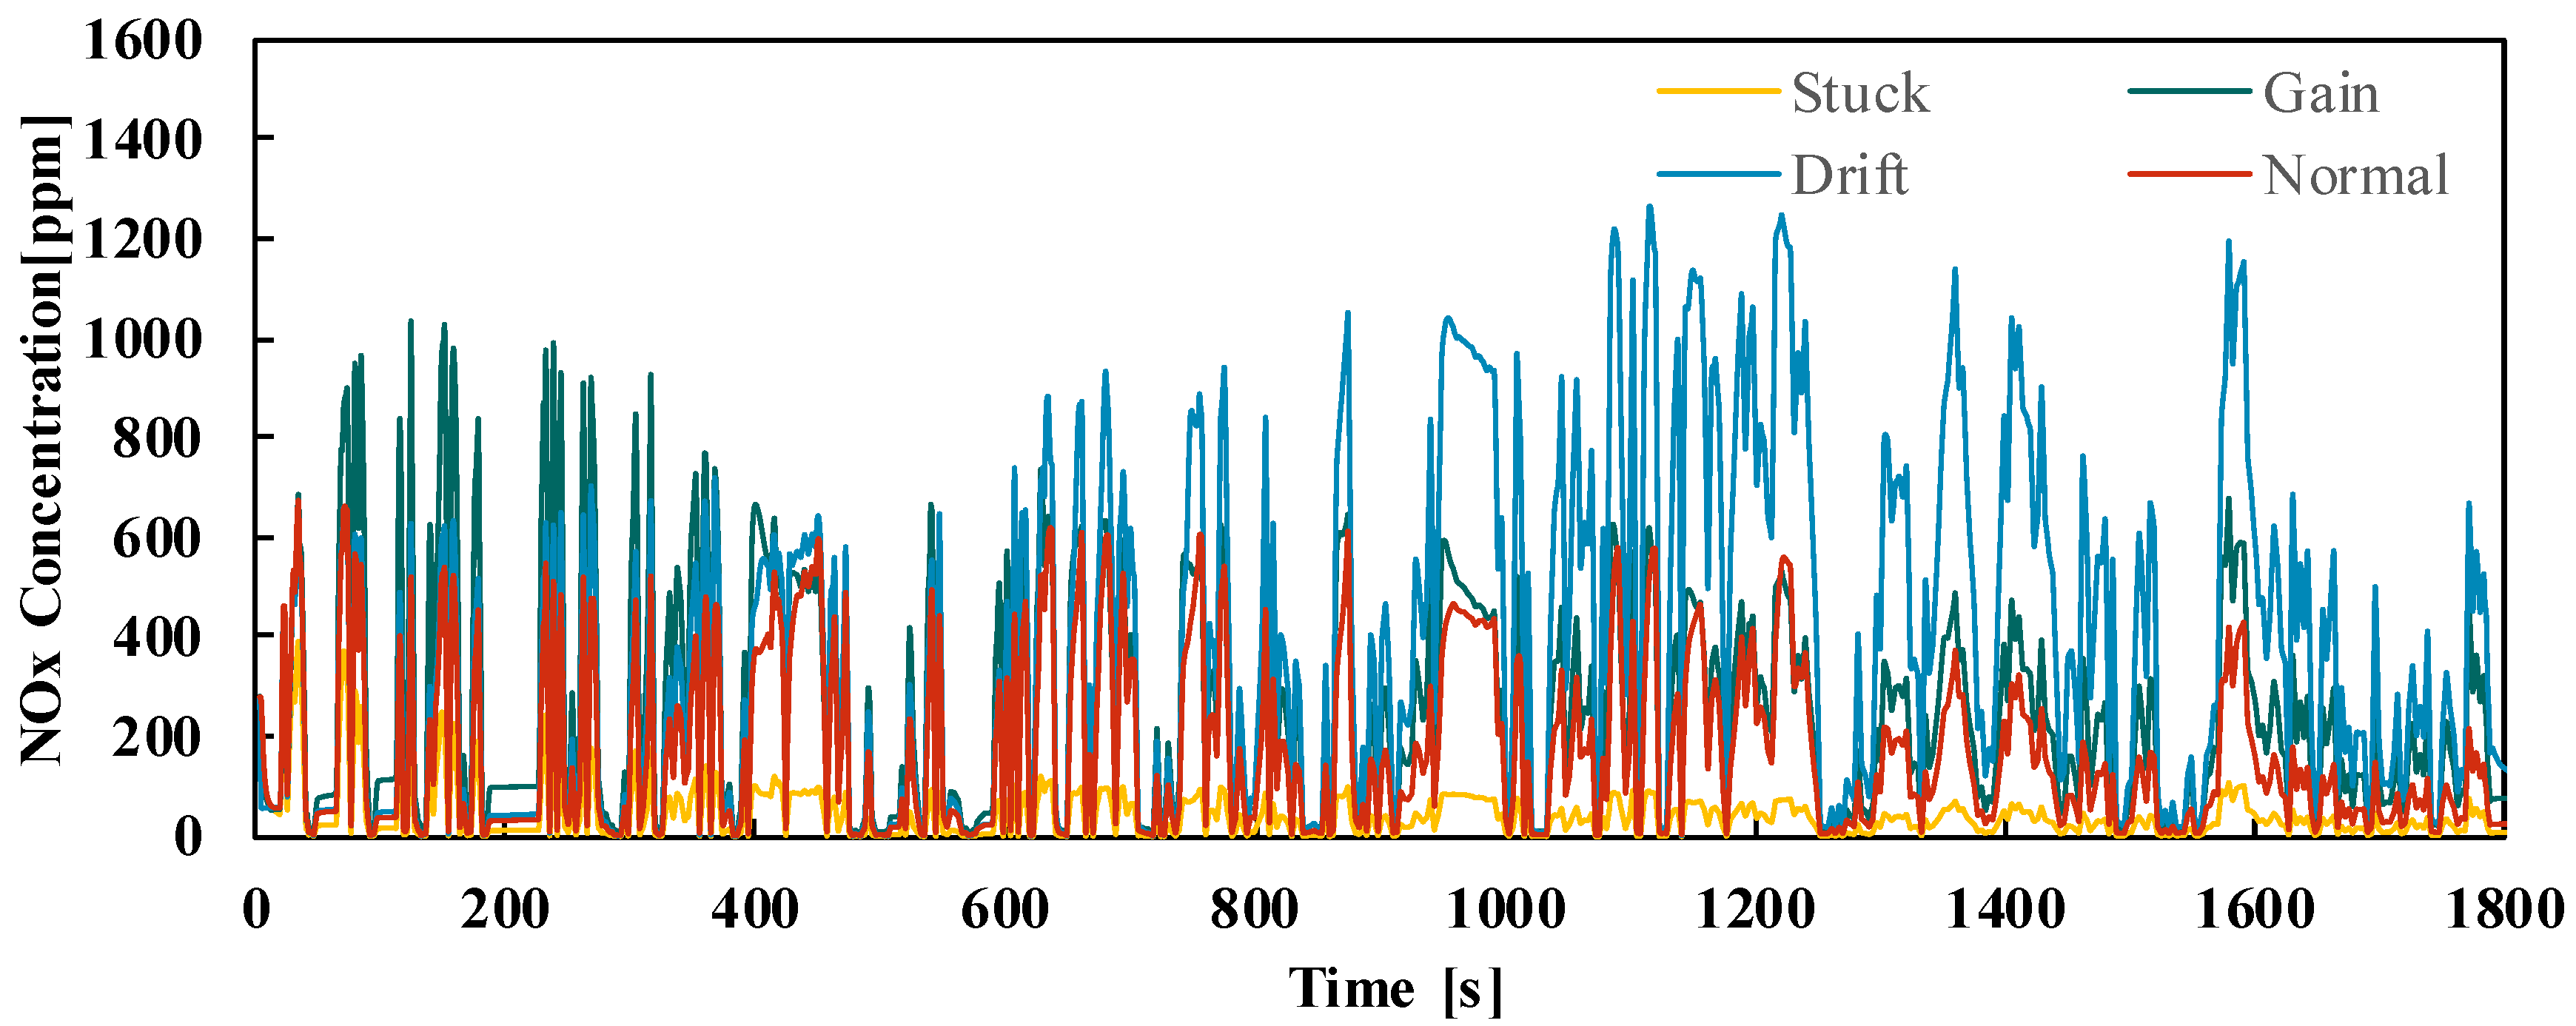
Figure 9.
NOx conversion efficiency vs. time.

Figure 10.
NH3 slip vs. time.
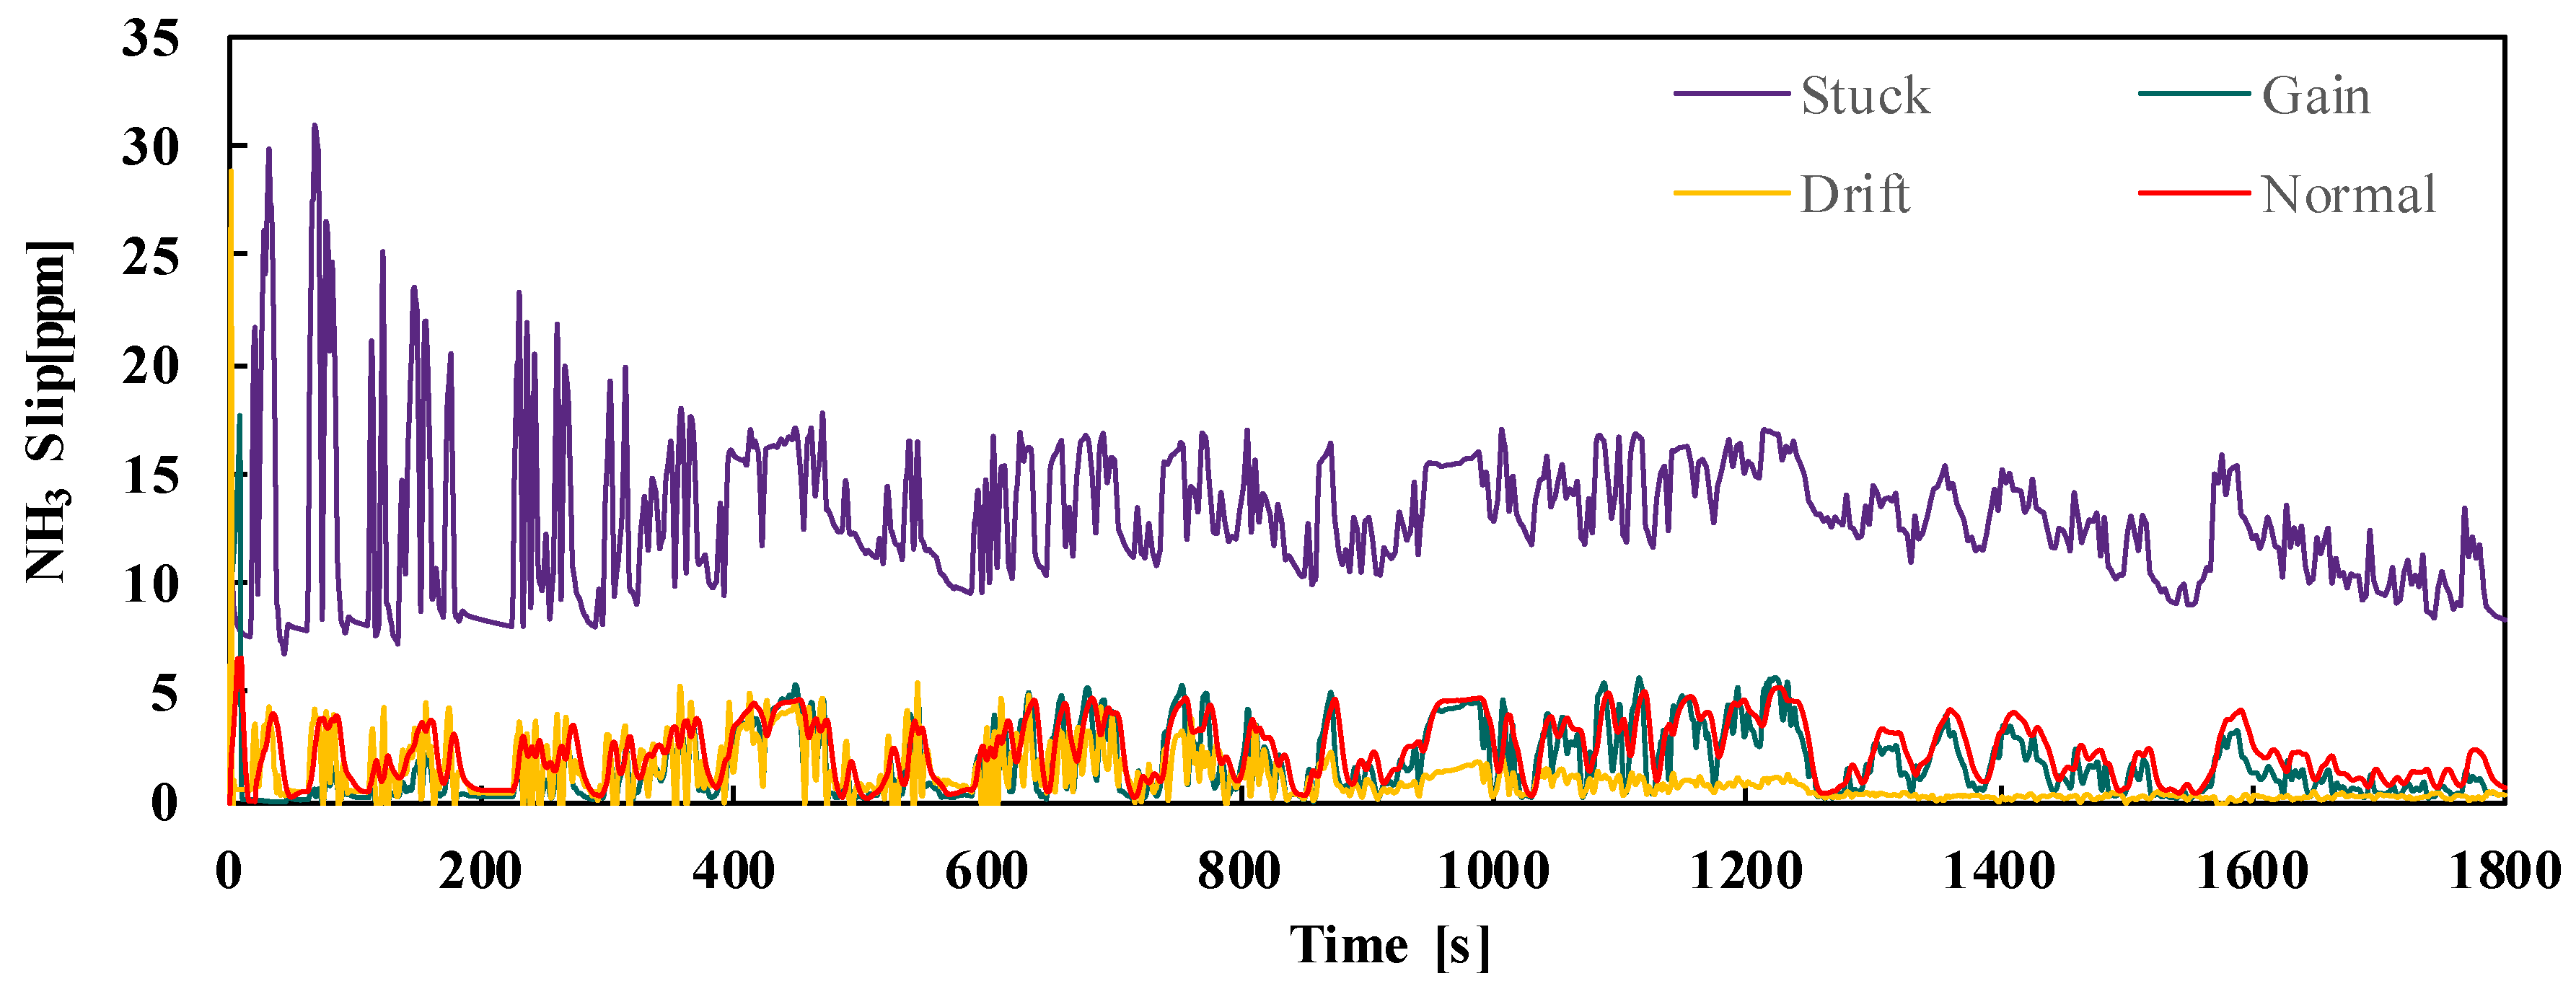
Figure 11.
Ammonia coverage ratio vs. time. (a) Stuck fault; (b) gain fault; (c) drift fault; and (d) normal.
Figure 11.
Ammonia coverage ratio vs. time. (a) Stuck fault; (b) gain fault; (c) drift fault; and (d) normal.
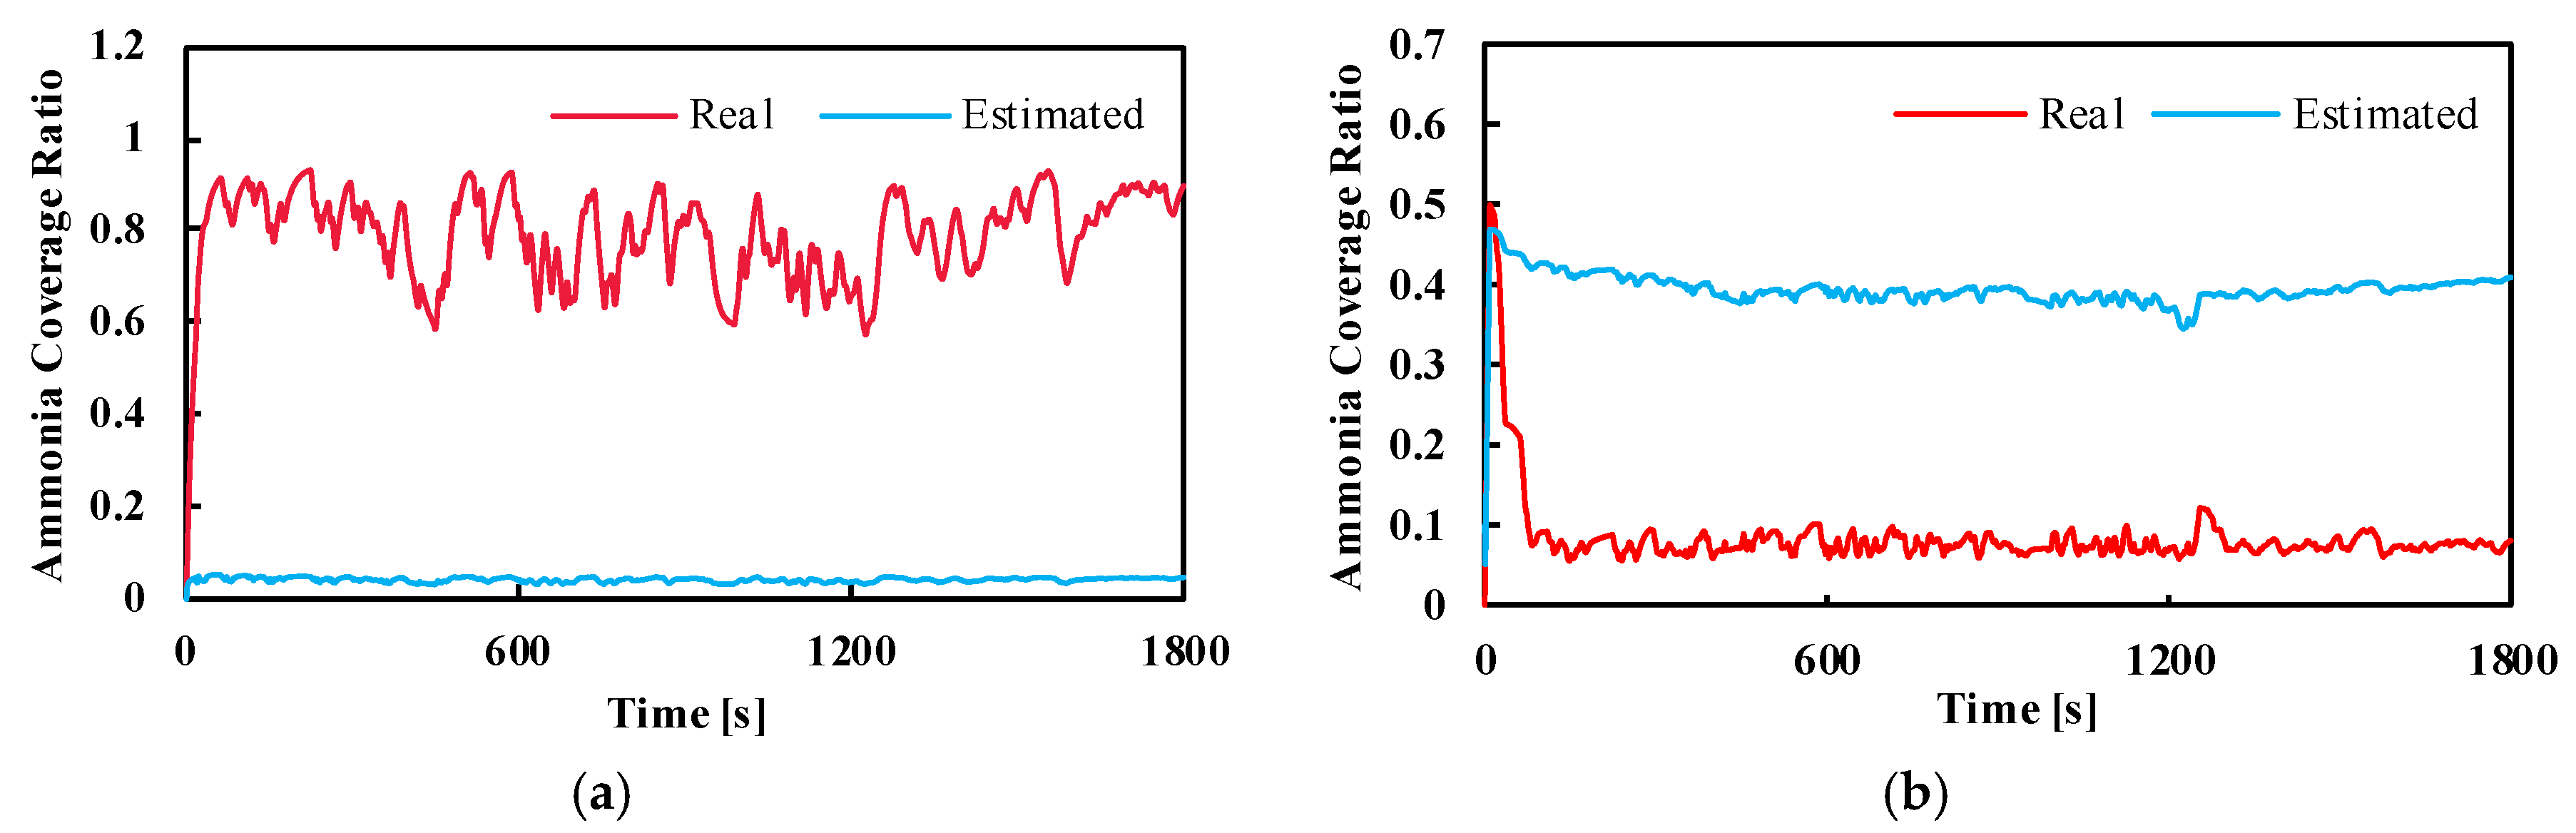
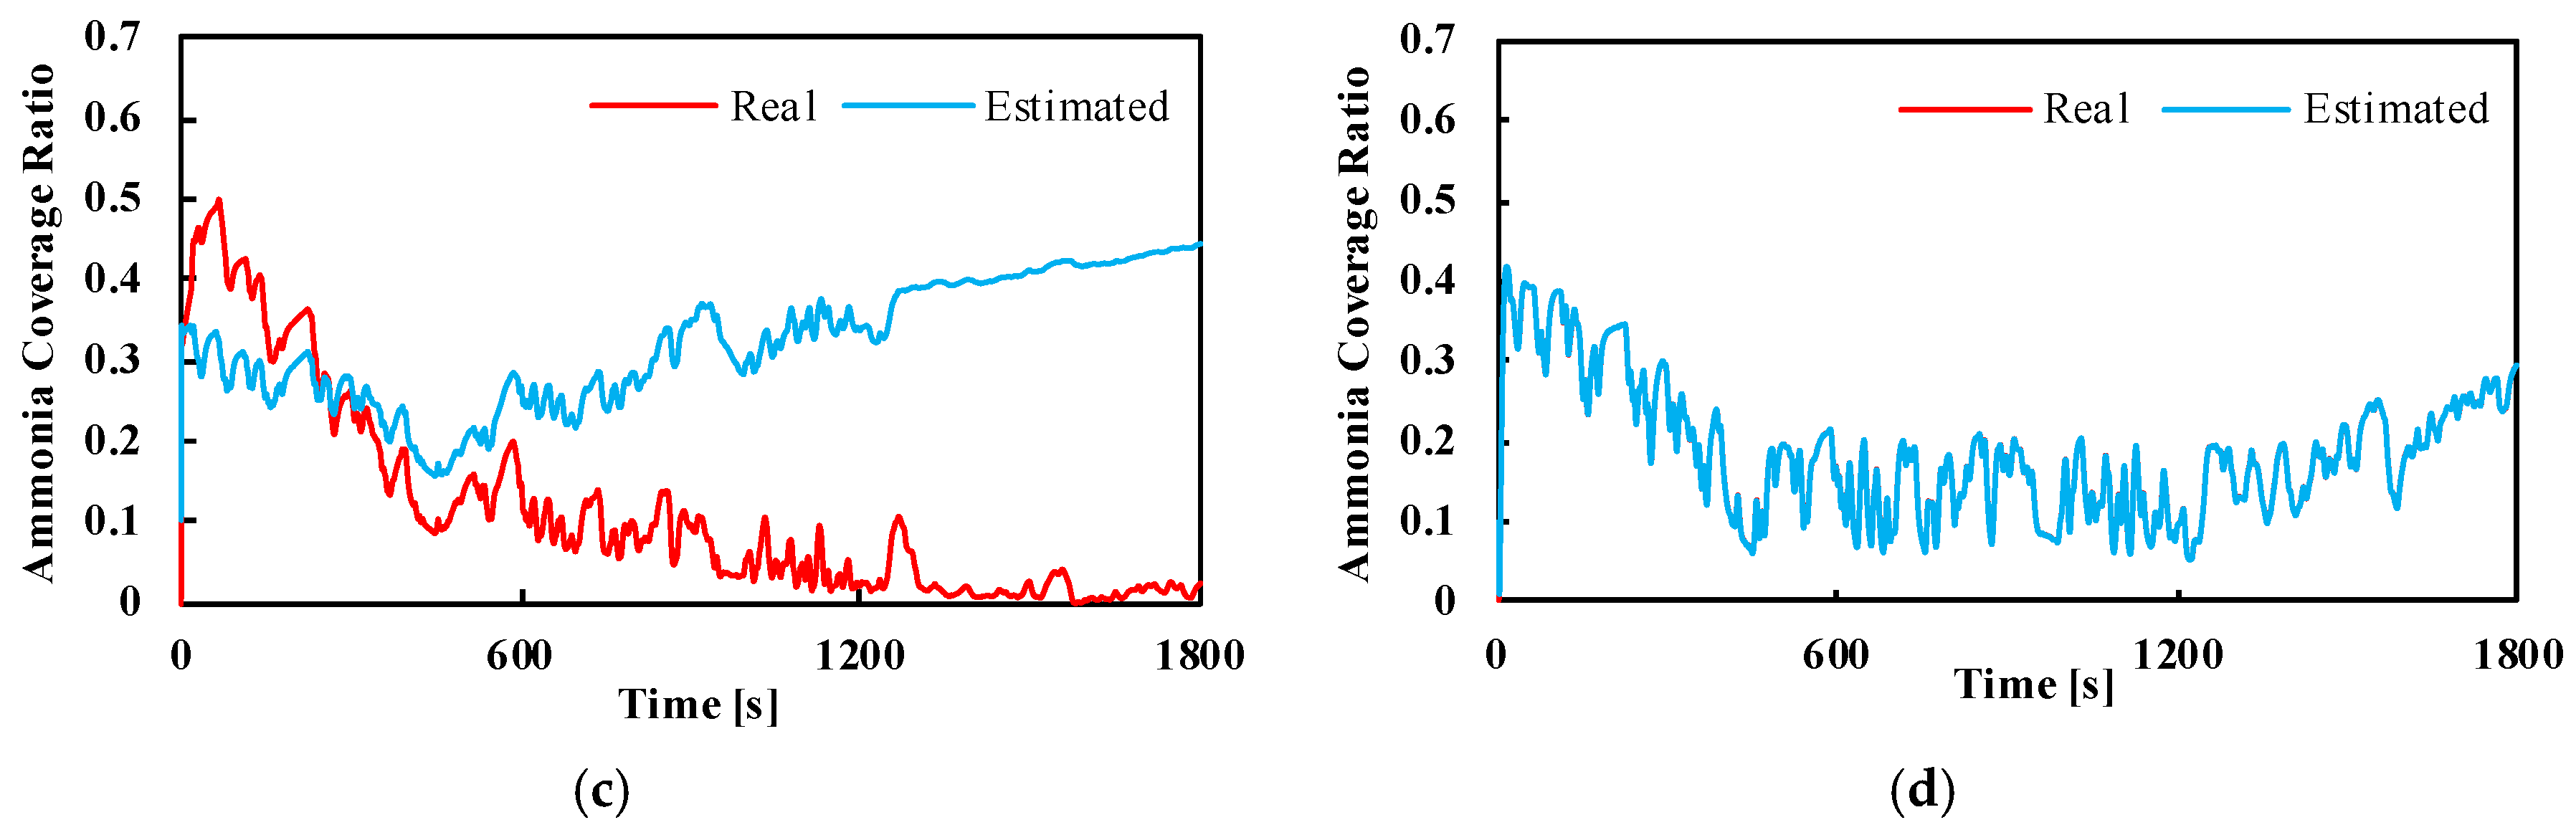
Figure 12.
Urea dosage vs. time.
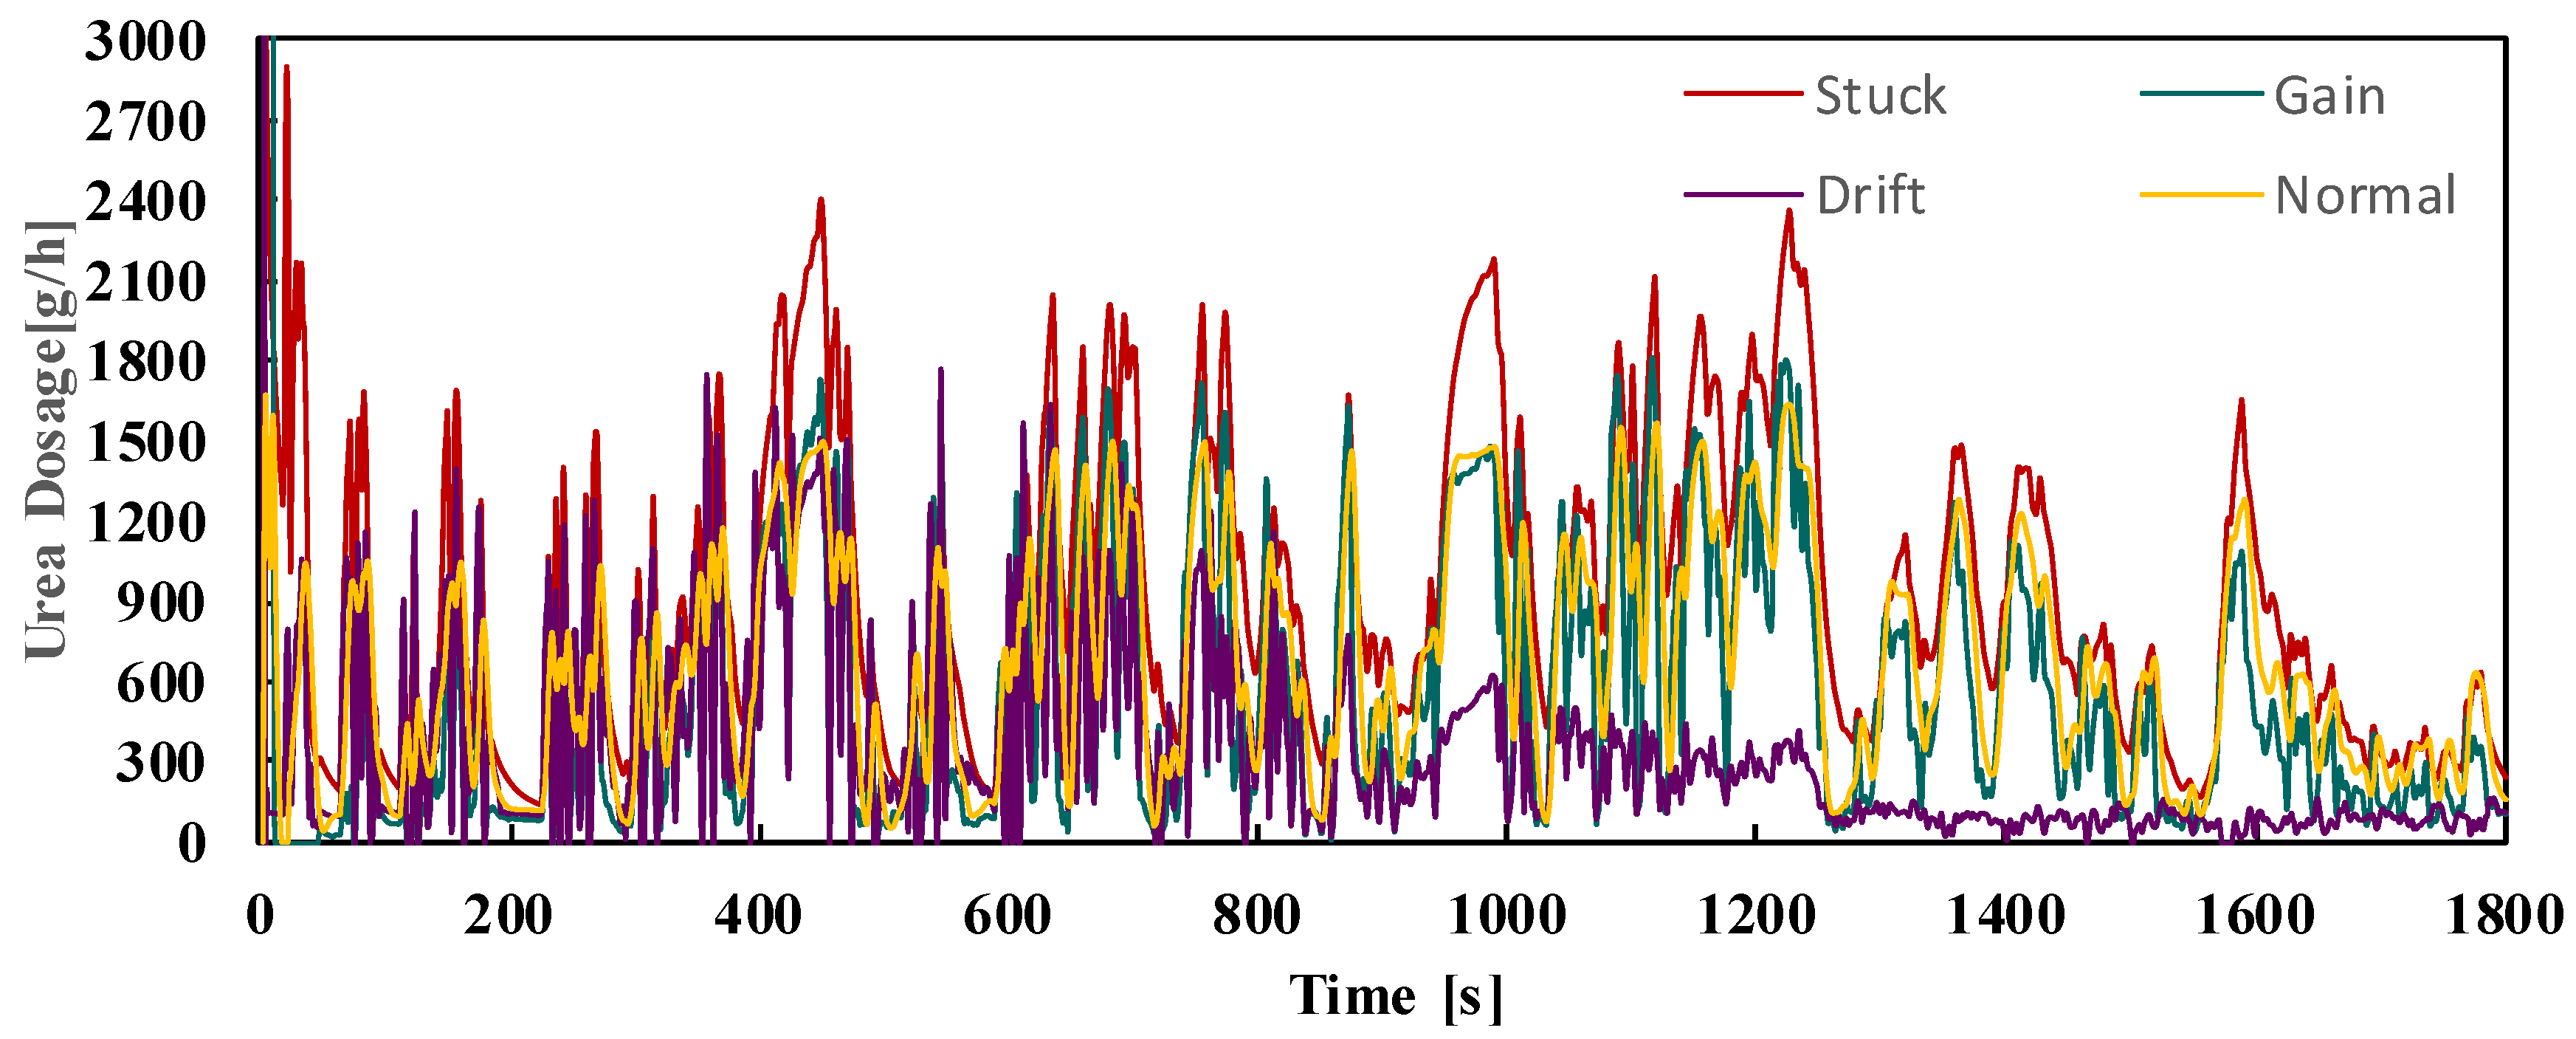
Figure 13.
Fault detection and fault-tolerant control performances. (a) NOx concentration; and (b) temperature residual.
Figure 13.
Fault detection and fault-tolerant control performances. (a) NOx concentration; and (b) temperature residual.
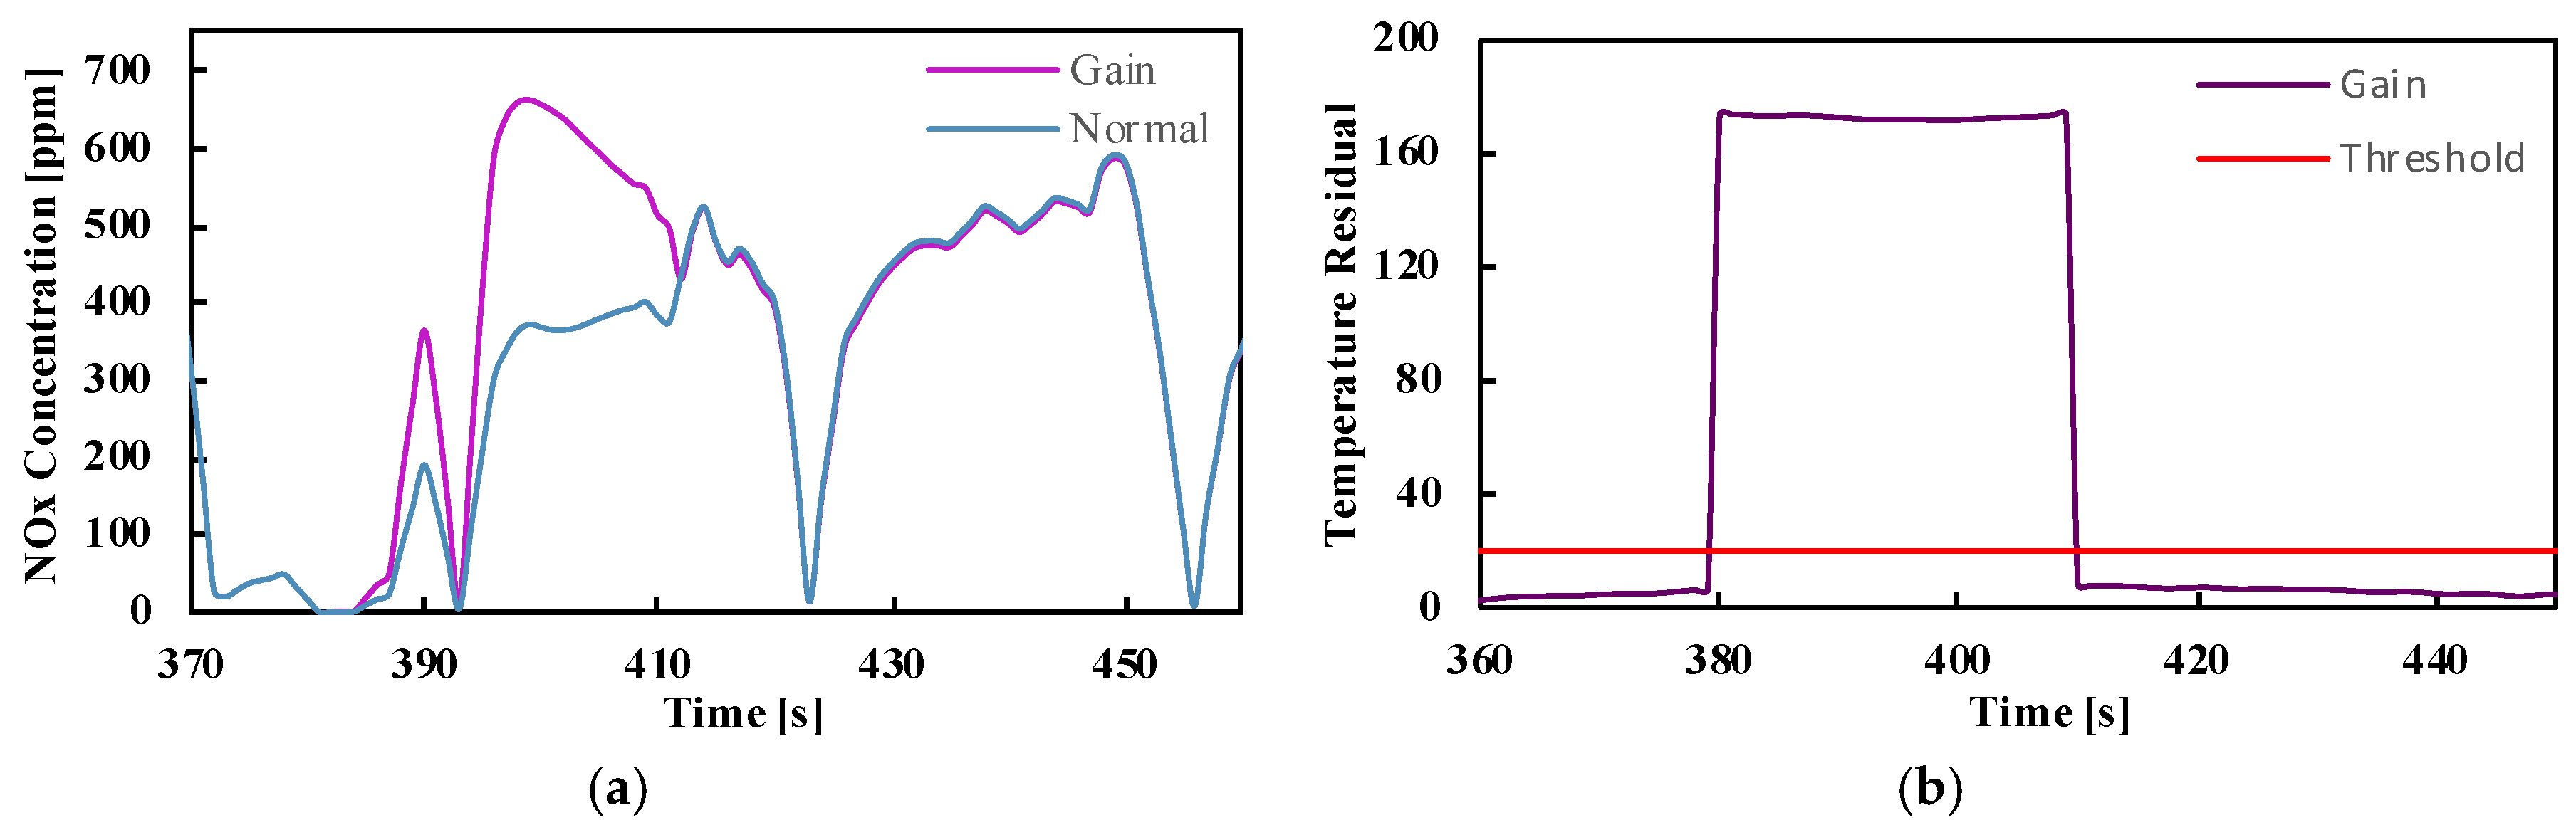
Figure 14.
SCR performances under fault-tolerant control. (a) NOx concentration; and (b) NH3 slip.

Table 1.
Result of parameter identification.
| Parameters | Identified Value | Unit |
|---|---|---|
| Sc | 13,300 | m2/mol |
| αprob | 1.11 × 10⁻³ | 1 |
| Cs | 4.5 | mol/m3 |
| kdes | 0.514 | 1/s |
| Edes | 15.2 | J/mol |
| kscr | 10 | m2/s |
| Escr | 28,471 | J/mol |
| kox | 3.34 × 10⁶ | 1/s |
| Eox | 1.16 × 10⁵ | J/mol |
Table 2.
Engine information.
| Features | Parameters |
|---|---|
| Engine model | Inline 6-cylinder, YC6J-42 |
| Displacement | 6.6 L |
| Rated power | 132 kW |
| Maximum torque | 660 N·m (1200–1700 r/min) |
| Idle speed | 650 ± 50 r/min |
Table 3.
Measuring and monitoring equipment.
| Equipment | Application | |
|---|---|---|
| AVL PUMA OPEN test bench | AC electrical dynamometer | Measuring engine speed and torque |
| Dynamometer control system | Controlling speed or torque of dynamometer to change the engine load | |
| Throttle actuator | Regulating the operating condition of engine | |
| Thermal measurement system | Monitoring thermodynamic parameters such as cooling water temperature, intake and exhaust pressure | |
| SEMTECH-EFM2 | Measuring exhaust flow rate | |
| AVL DiGas 4000 light (Port 1) | Measuring NOx concentration at upstream pipe | |
| AVL DiGas 4000 light (Port 2) | Measuring NOx concentration at downstream pipe | |
| NOx sensor | Measuring NOx concentration at downstream pipe | |
| LDS6 | Measuring NH3 slip | |
| Temperature sensor | Measuring upstream and downstream temperature | |
Table 4.
Selective catalyst reduction (SCR) performances under different faults.
| Fault Type | NOx Emission (g/kWh) | Mean NOx Conversion Efficiency | Mean NH3 Slip (ppm) | Mean Urea Dosage (g/h) |
|---|---|---|---|---|
| No fault | 1.92 | 77.20% | 2.32 | 671.26 |
| Stuck fault | 0.53 | 93.62% | 13.02 | 944.95 |
| Gain fault | 3.02 | 62.57% | 1.74 | 548.66 |
| Drift fault | 4.60 | 44.30% | 1.07 | 337.86 |
© 2018 by the authors. Licensee MDPI, Basel, Switzerland. This article is an open access article distributed under the terms and conditions of the Creative Commons Attribution (CC BY) license (http://creativecommons.org/licenses/by/4.0/).
Share and Cite
MDPI and ACS Style
Hu, J.; Wang, J.; Zeng, J.; Zhong, X. Model-Based Temperature Sensor Fault Detection and Fault-Tolerant Control of Urea-Selective Catalyst Reduction Control Systems. Energies 2018, 11, 1800. https://doi.org/10.3390/en11071800
AMA Style
Hu J, Wang J, Zeng J, Zhong X. Model-Based Temperature Sensor Fault Detection and Fault-Tolerant Control of Urea-Selective Catalyst Reduction Control Systems. Energies. 2018; 11(7):1800. https://doi.org/10.3390/en11071800
Chicago/Turabian StyleHu, Jie, Junliang Wang, Jiawei Zeng, and Xianglin Zhong. 2018. "Model-Based Temperature Sensor Fault Detection and Fault-Tolerant Control of Urea-Selective Catalyst Reduction Control Systems" Energies 11, no. 7: 1800. https://doi.org/10.3390/en11071800
Note that from the first issue of 2016, this journal uses article numbers instead of page numbers. See further details here.