Pan-European Analysis on Power System Flexibility
Abstract
:1. Introduction
- Flexibility requirements;
- Availability of flexibility resources;
- Power system adequacy;
- Power transmission grid adequacy.
2. Power System Flexibility Assessment
2.1. Step 1: Flexibility Requirements Indicators
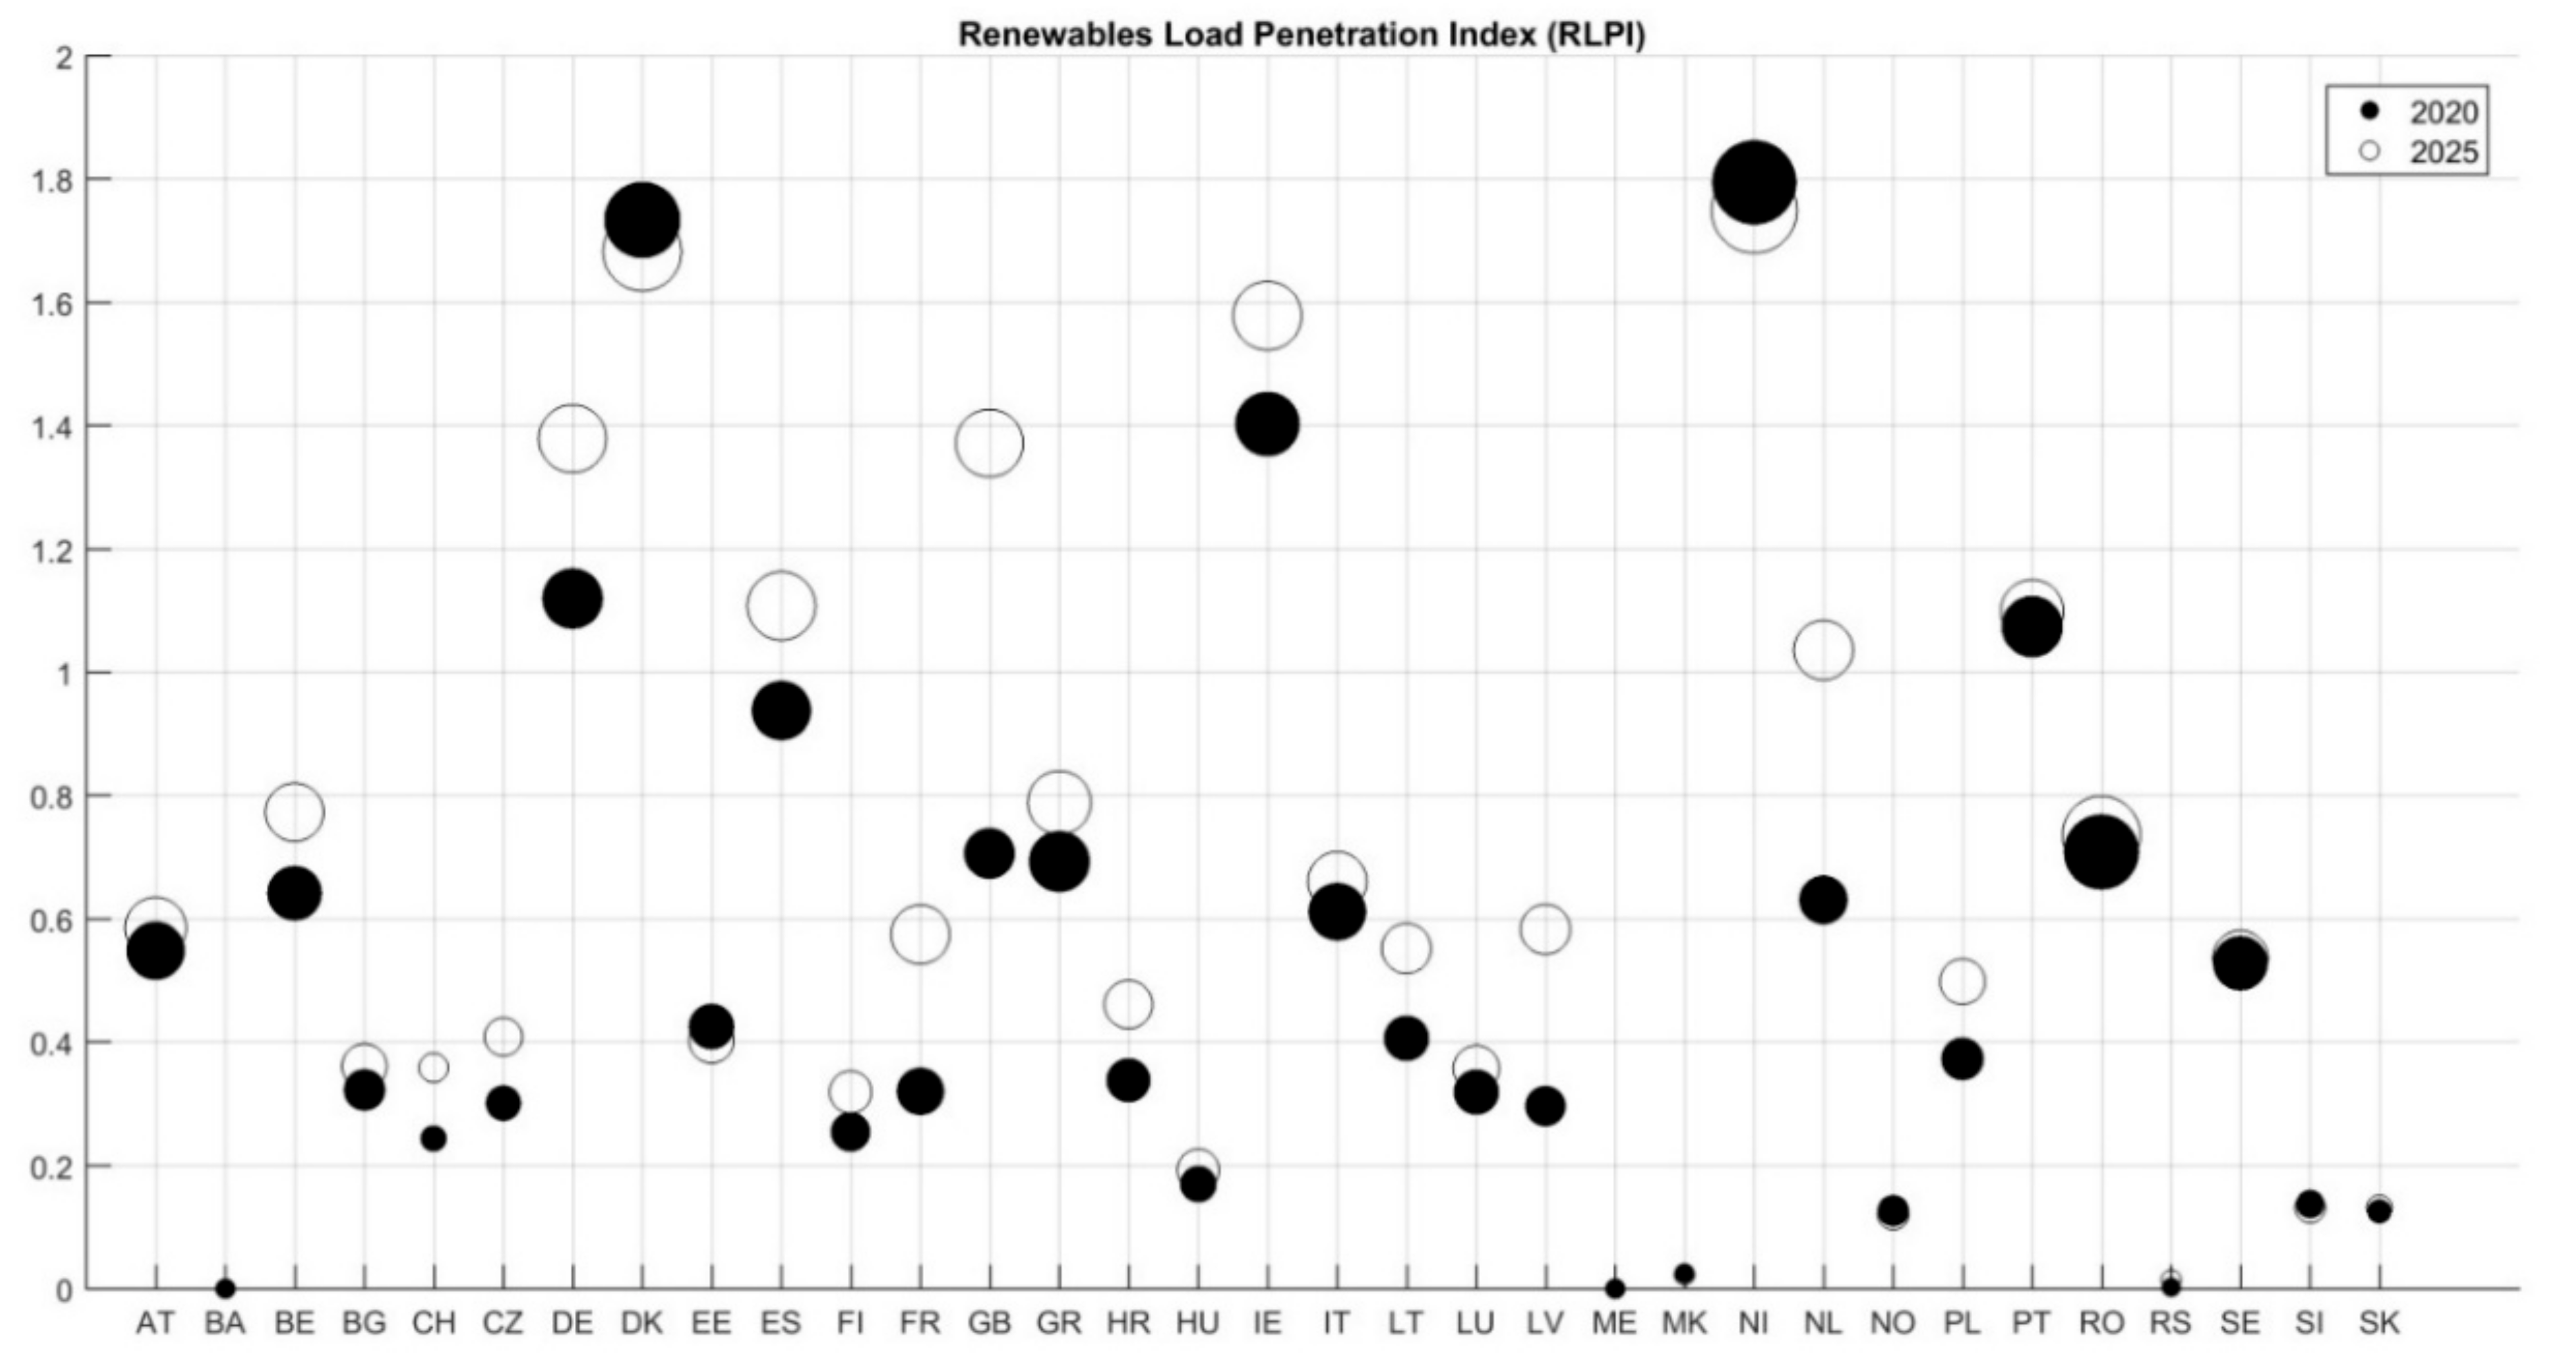
- RES Load Penetration Index (RLPI). This is the maximum hourly coverage of load by non-dispatchable renewables energy generation (wind and solar):where W(t), S(t), and L(t) are wind and solar energy generation, and the demand at time t respectively.
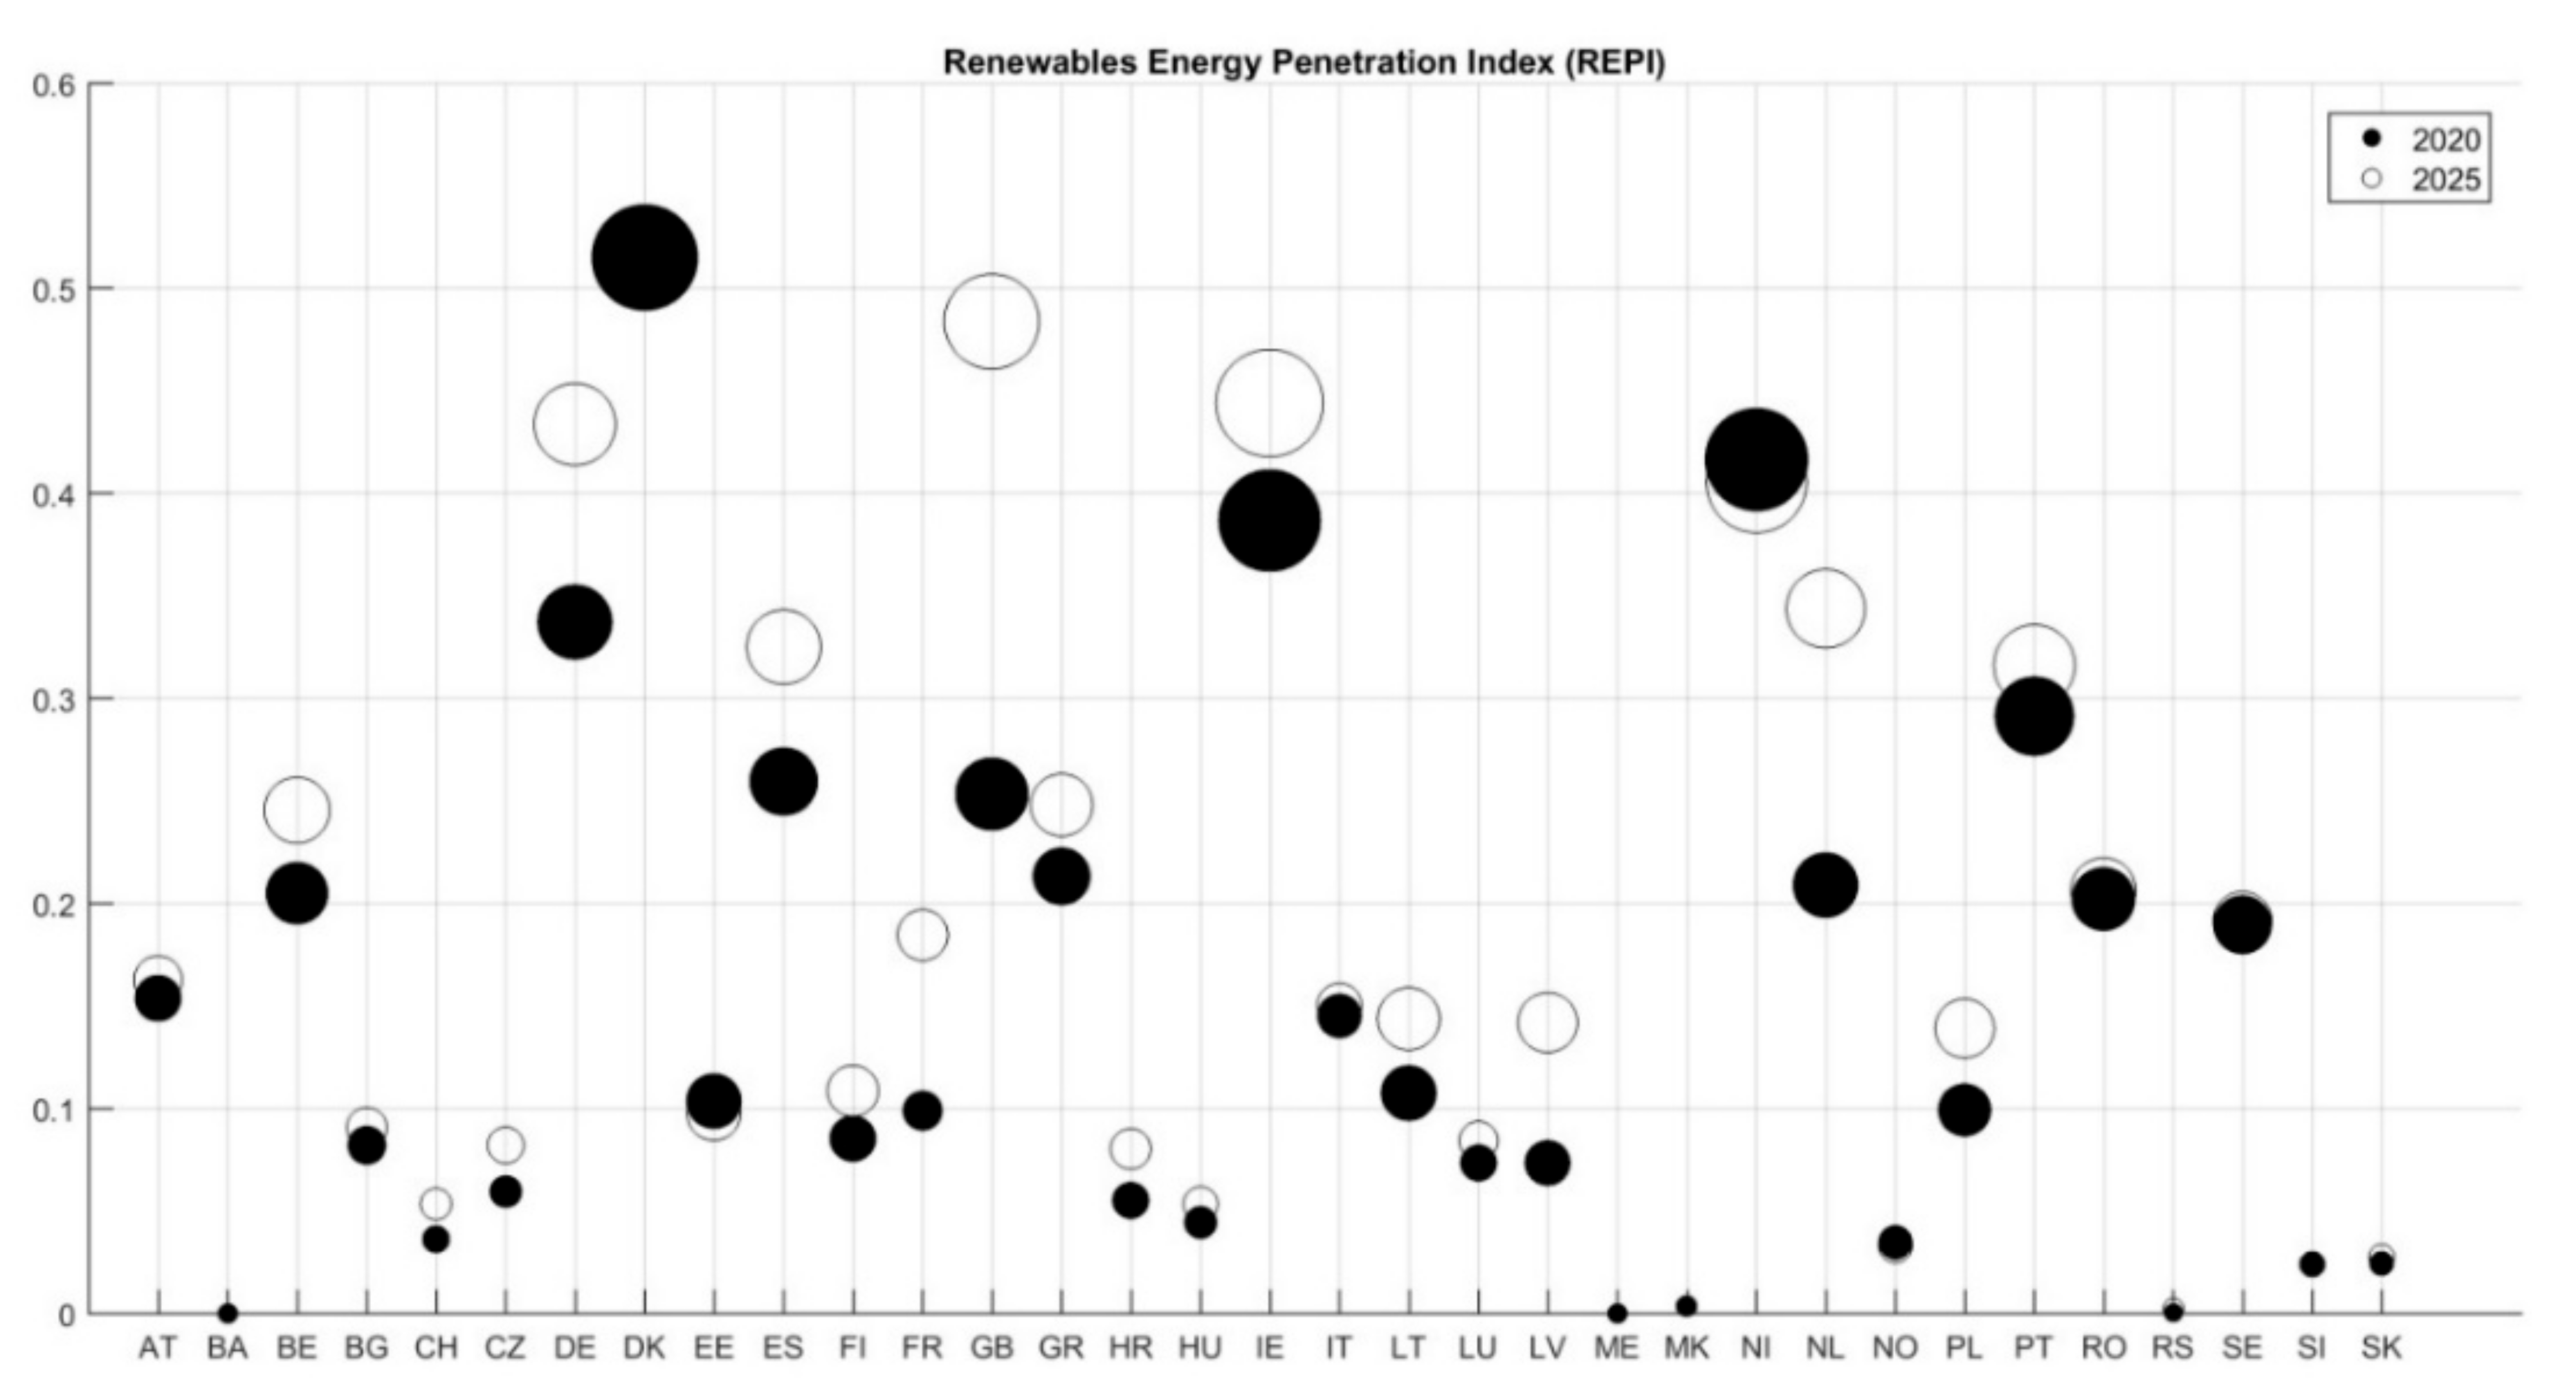
- Renewable Energy Penetration Index (REPI). This is the average value of demand covered by wind and solar generation:
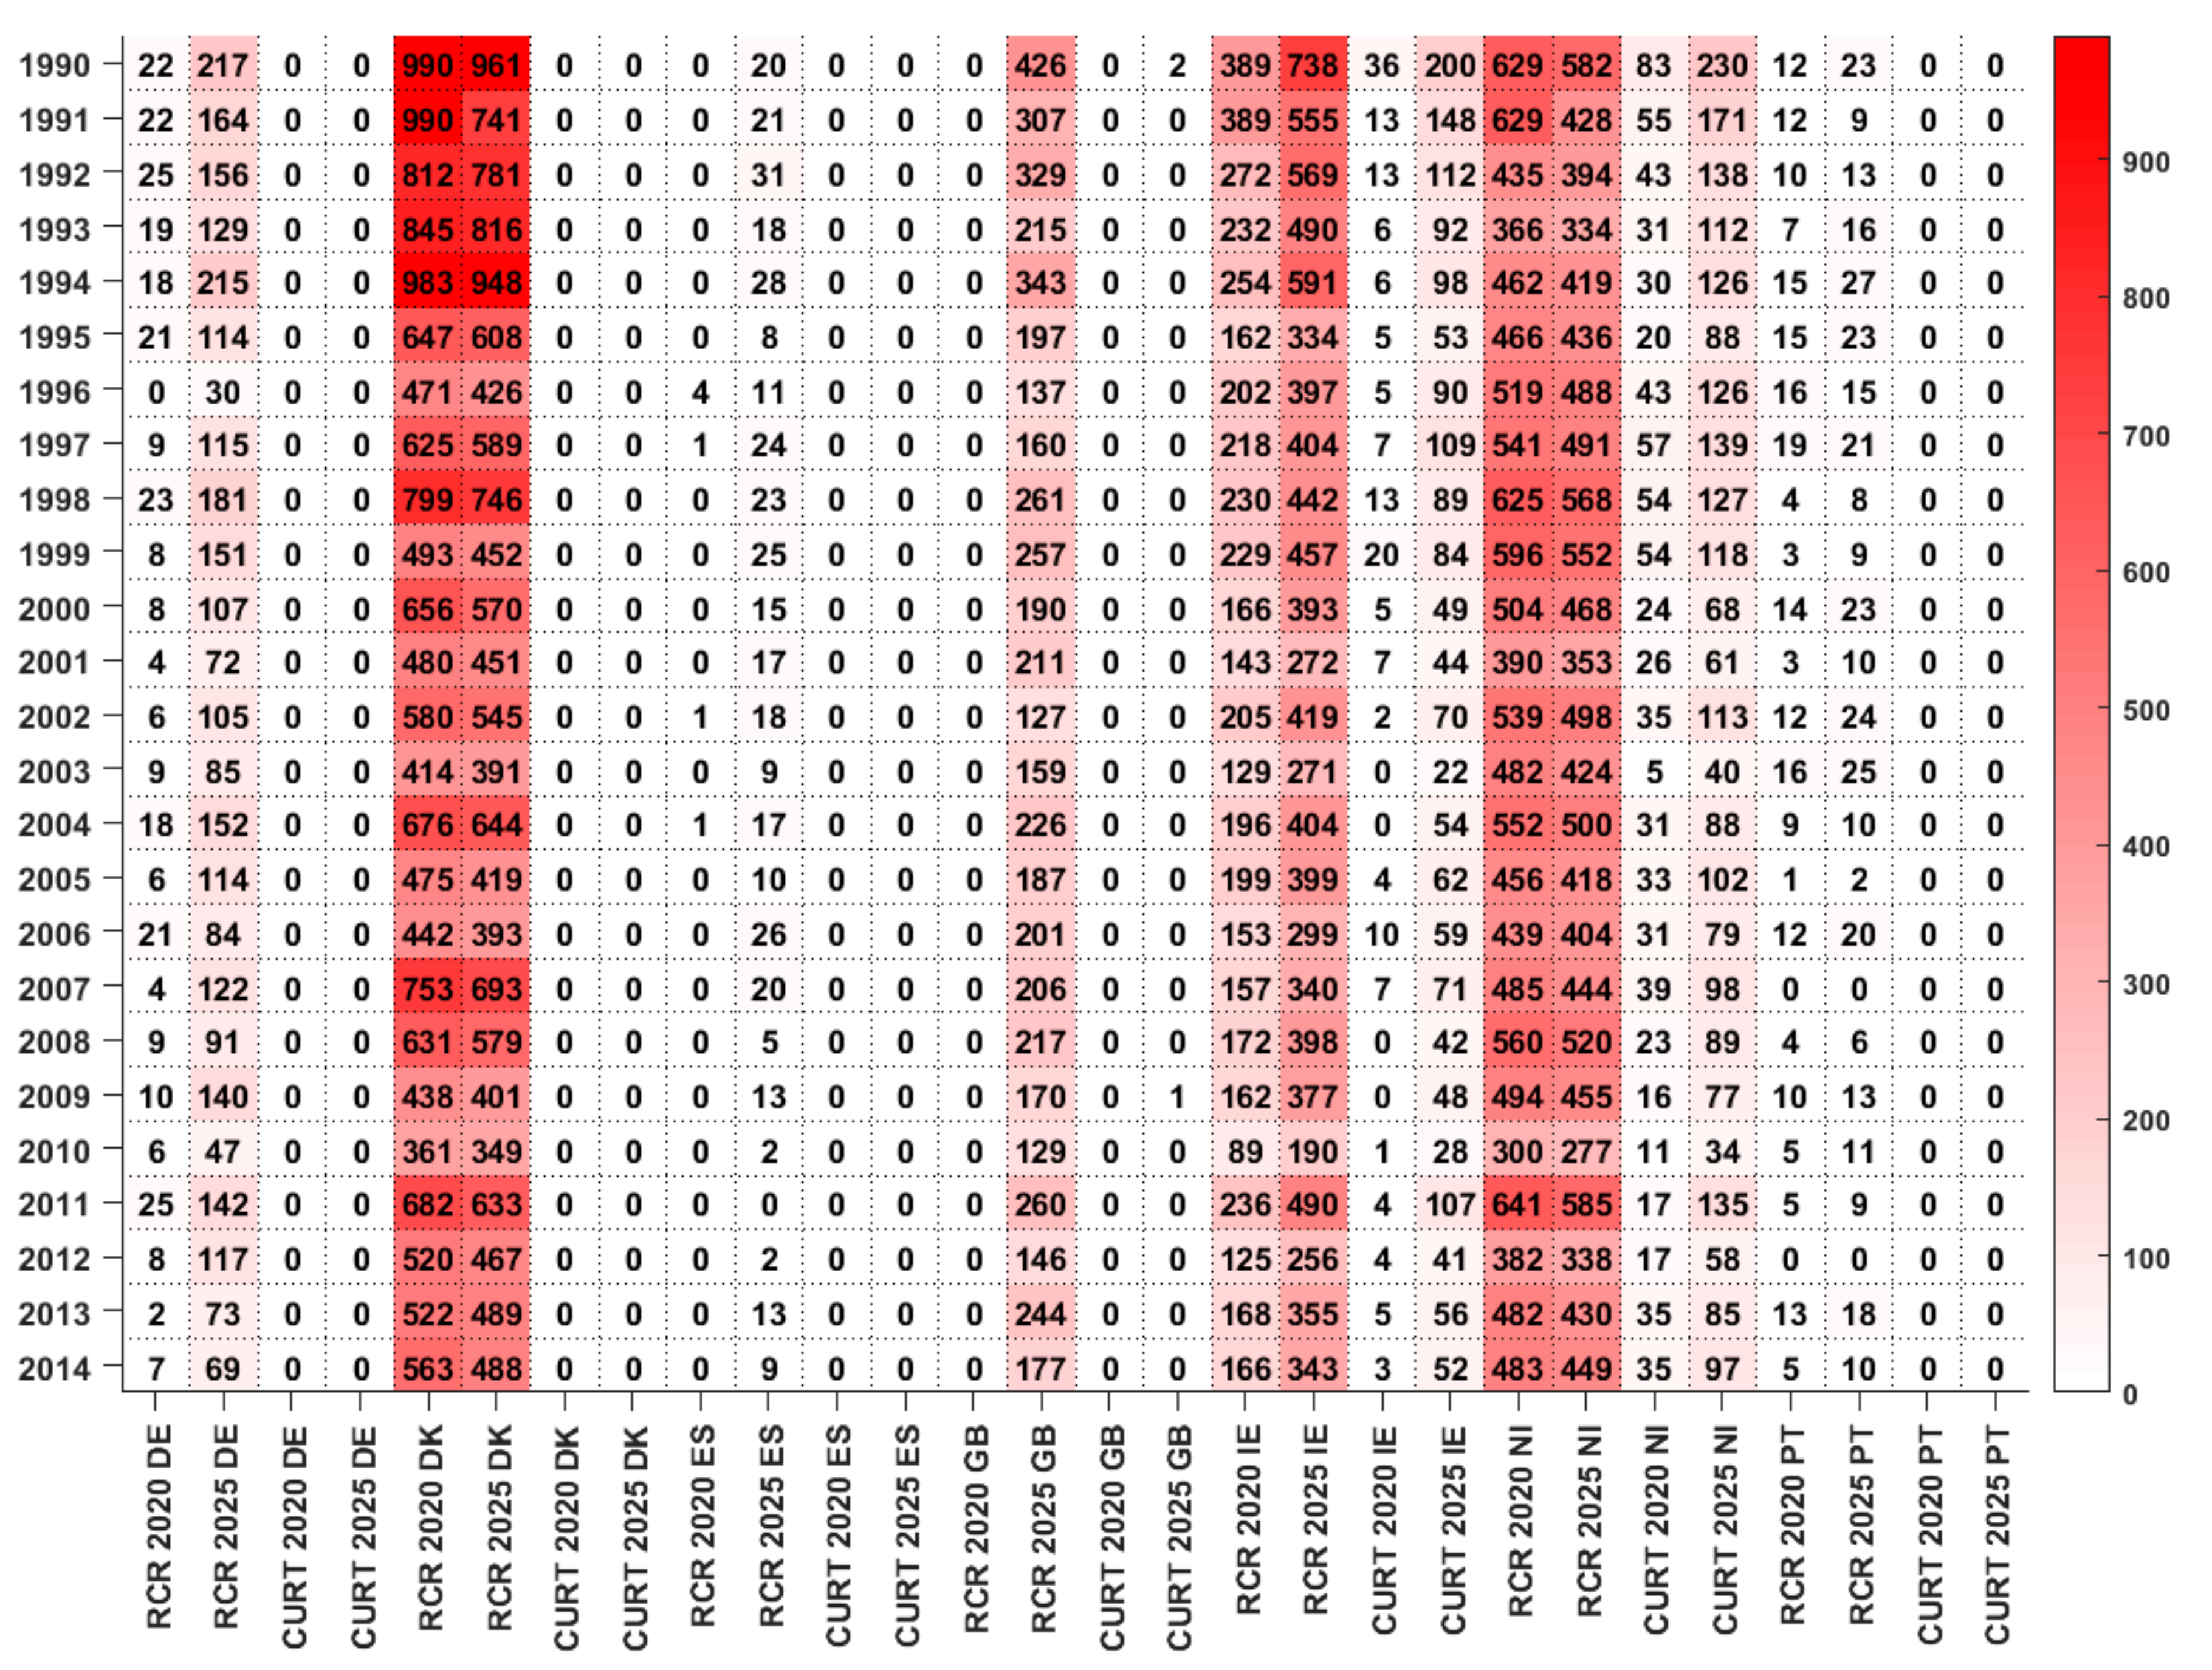
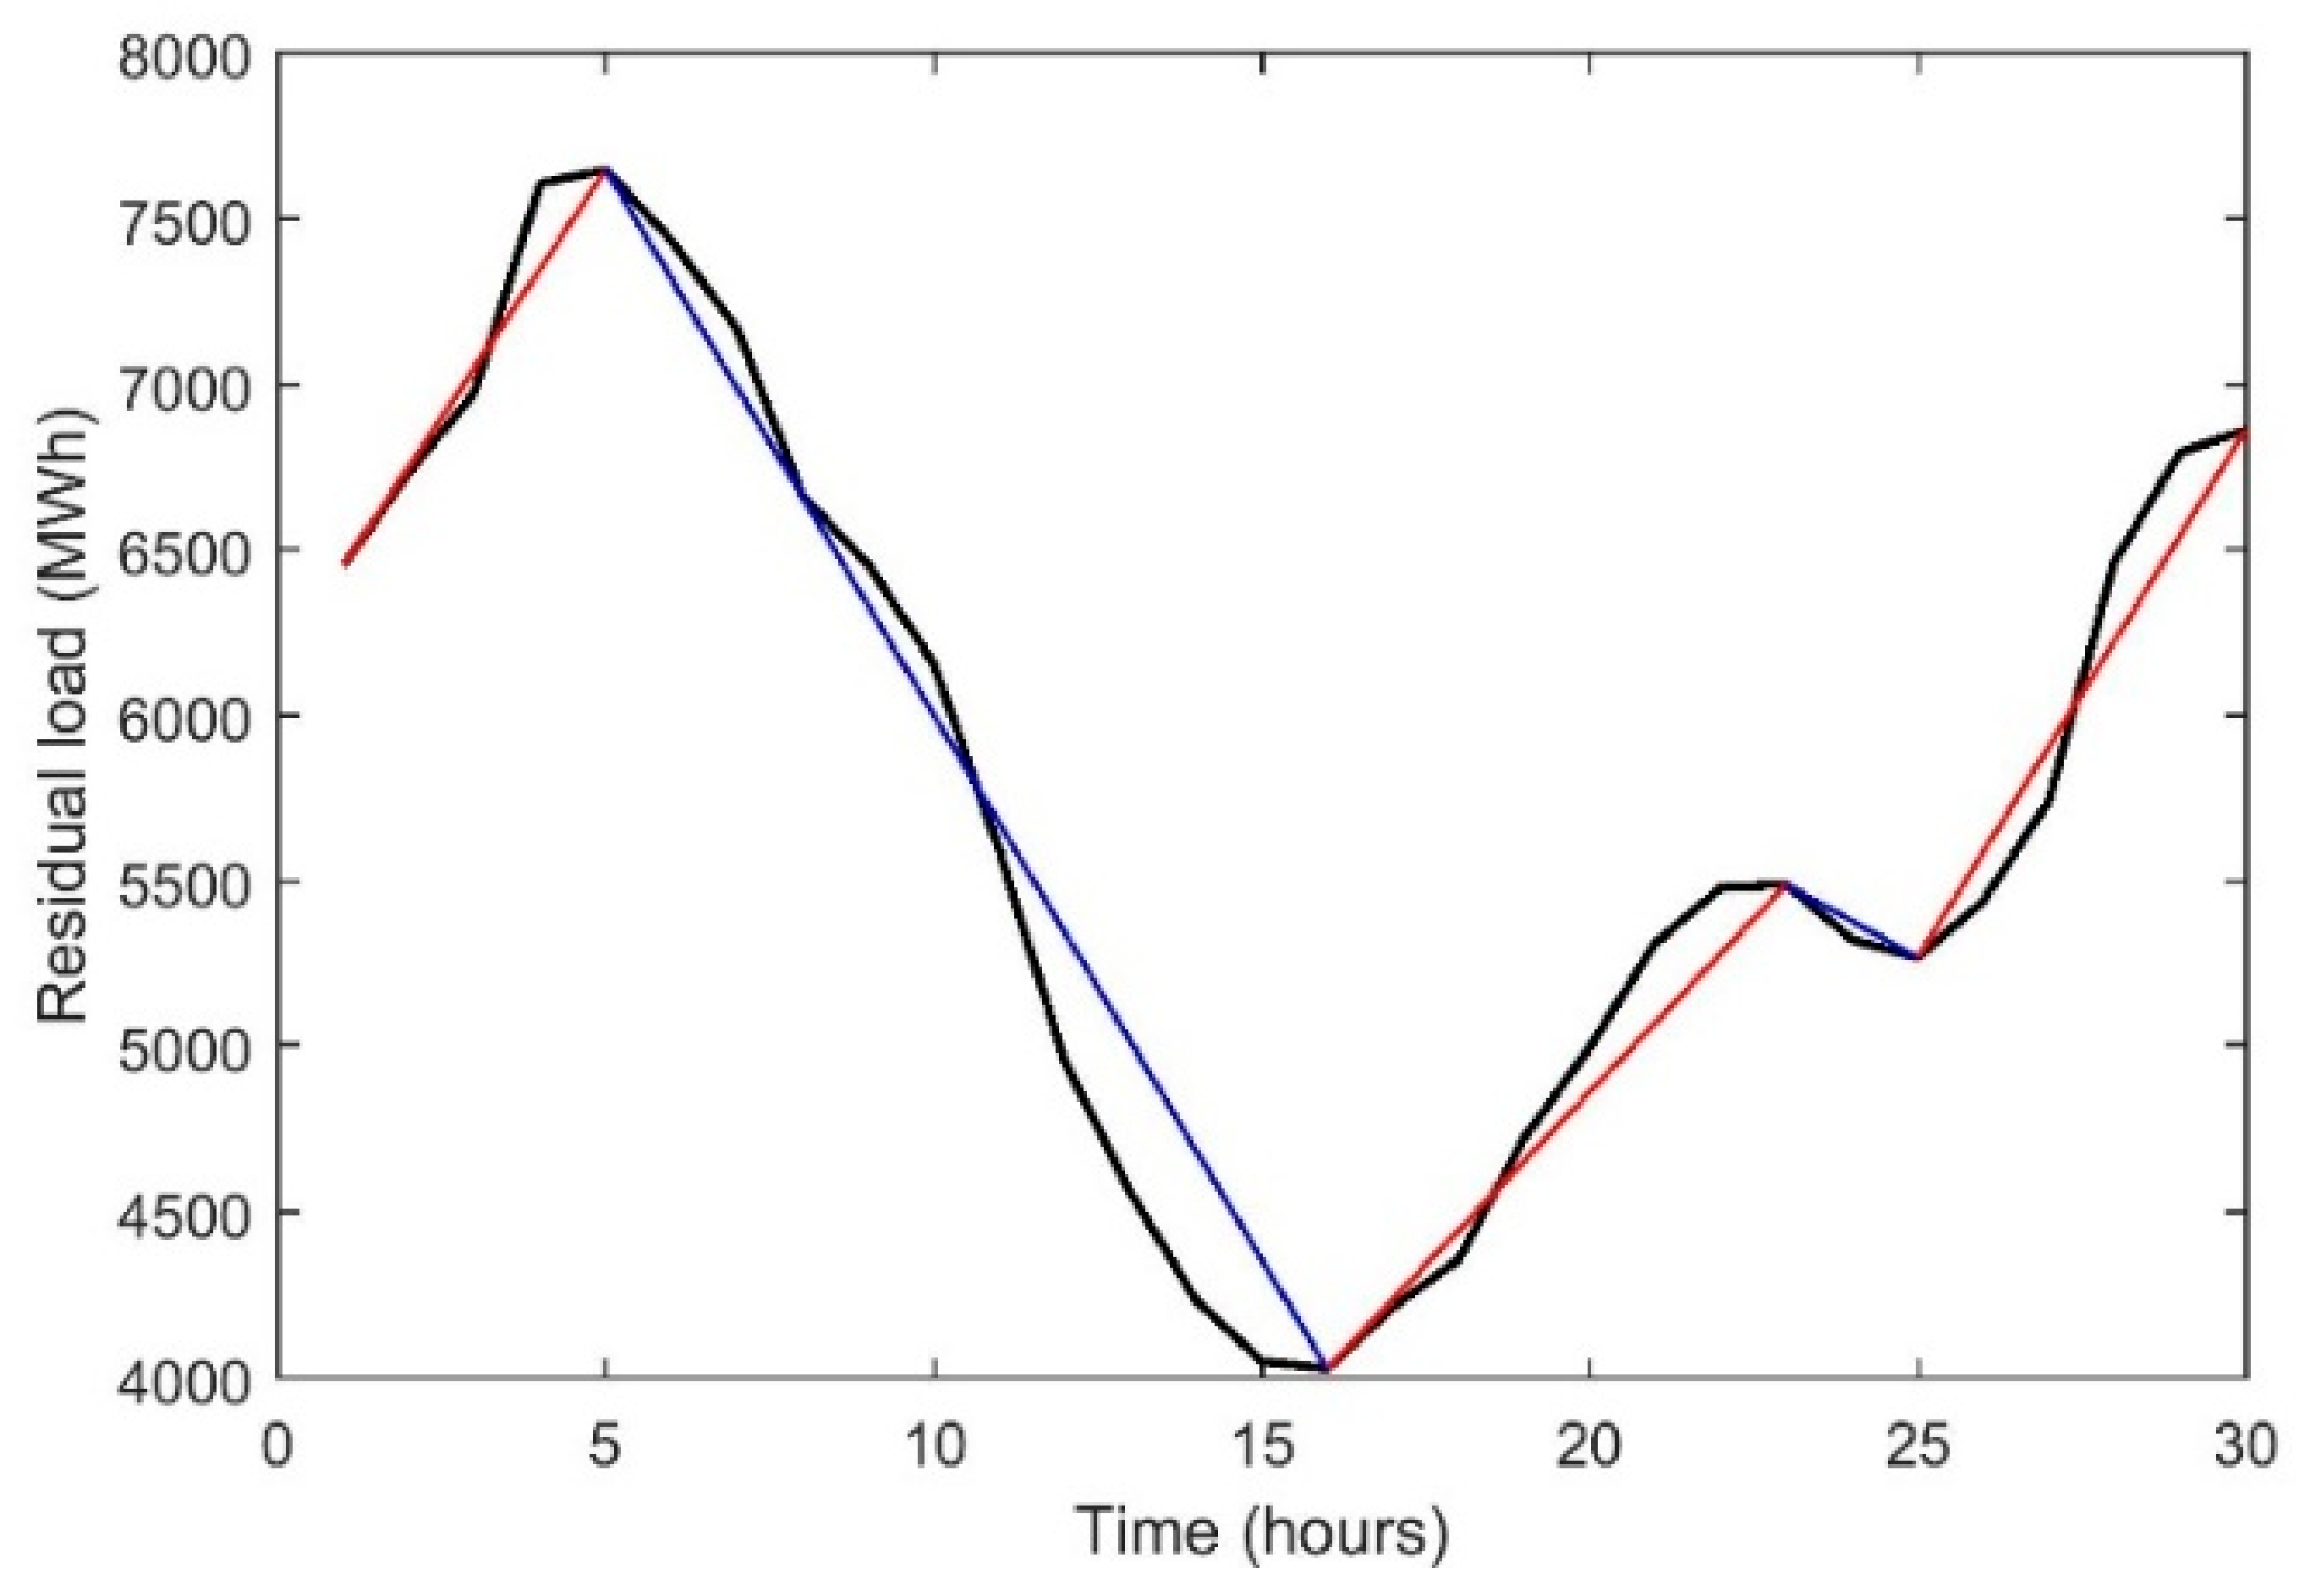
- Renewable energy generation Curtailment Risk (RCR):where RL(t) is the residual load at hour t. In this work, the residual load is defined as follows:
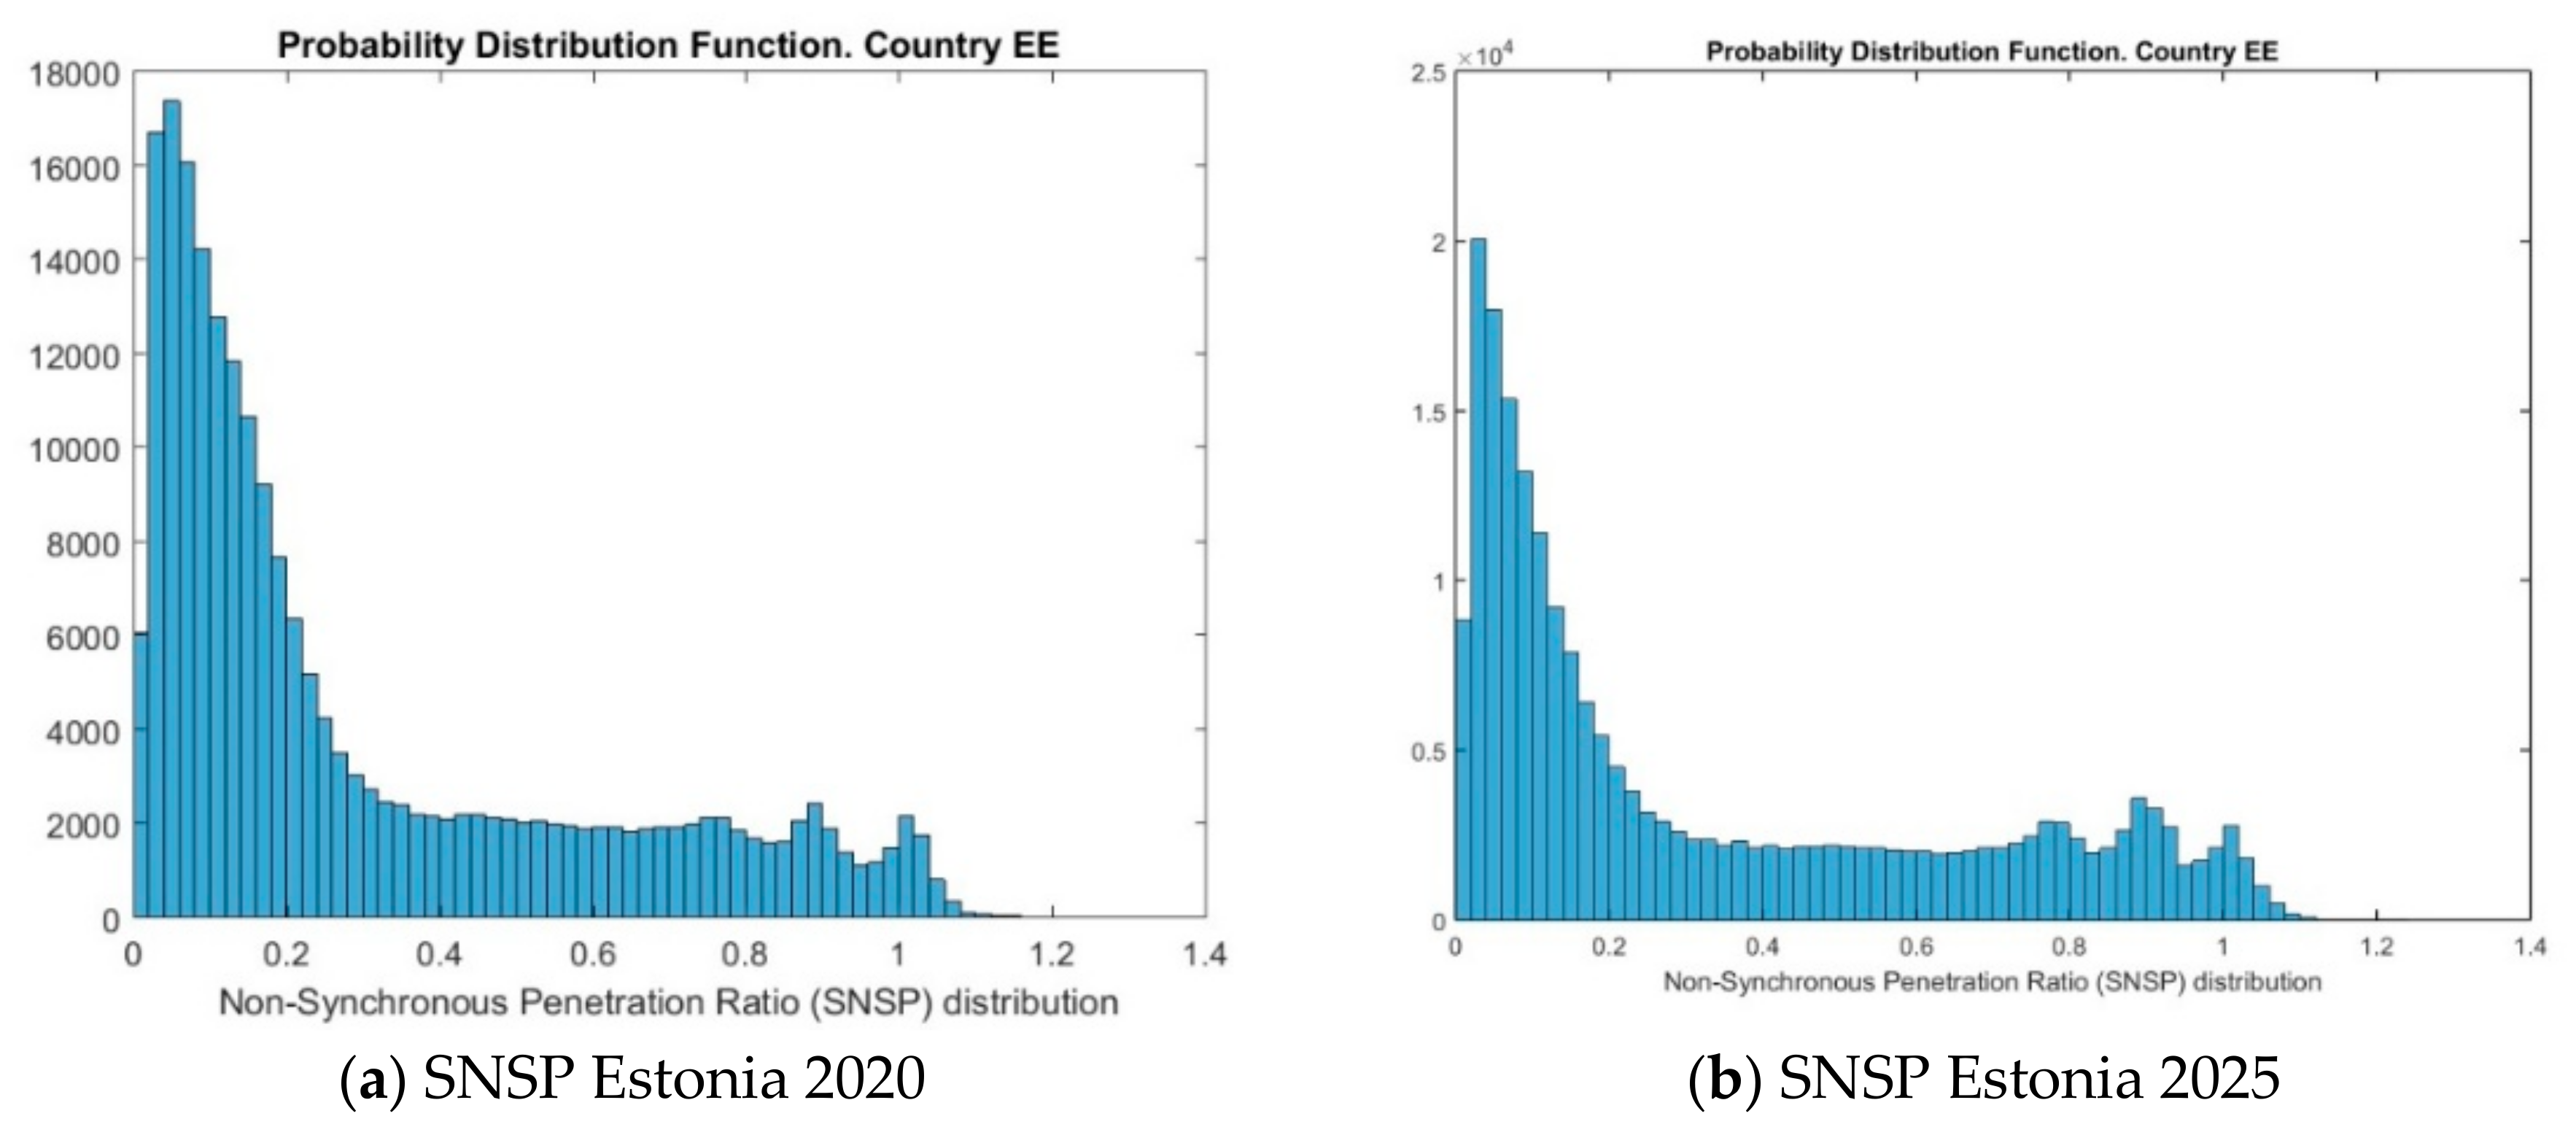
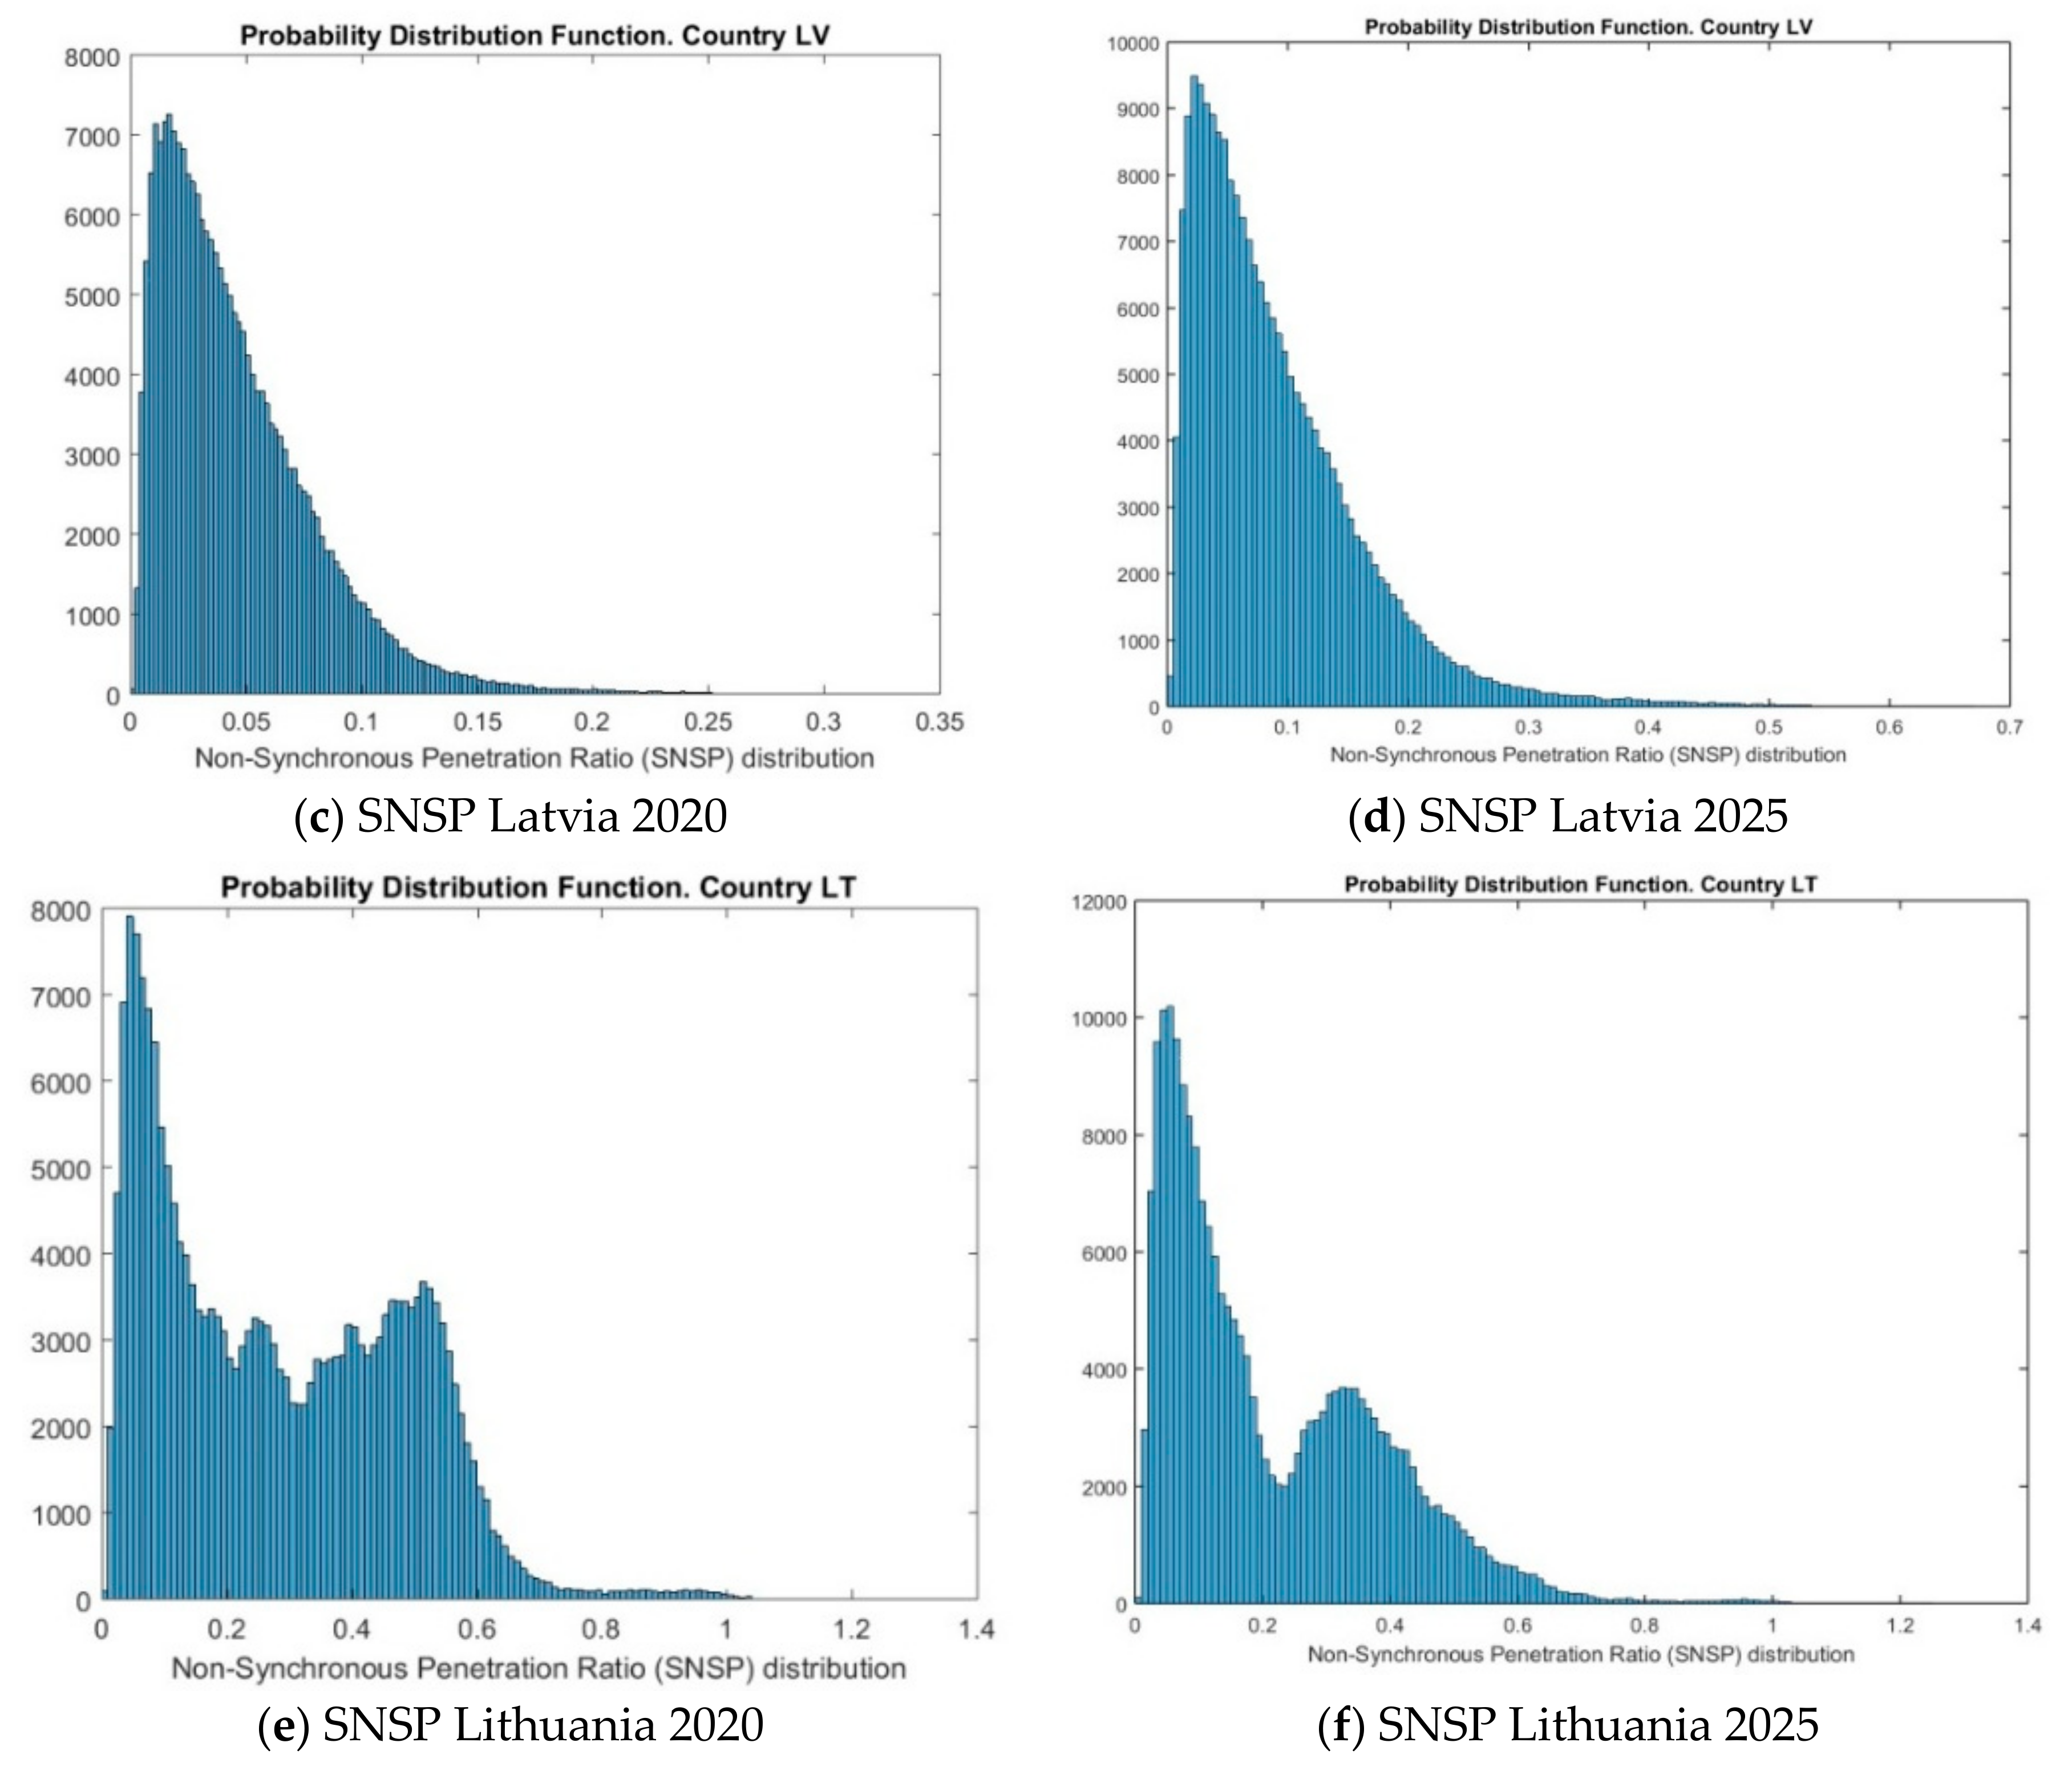
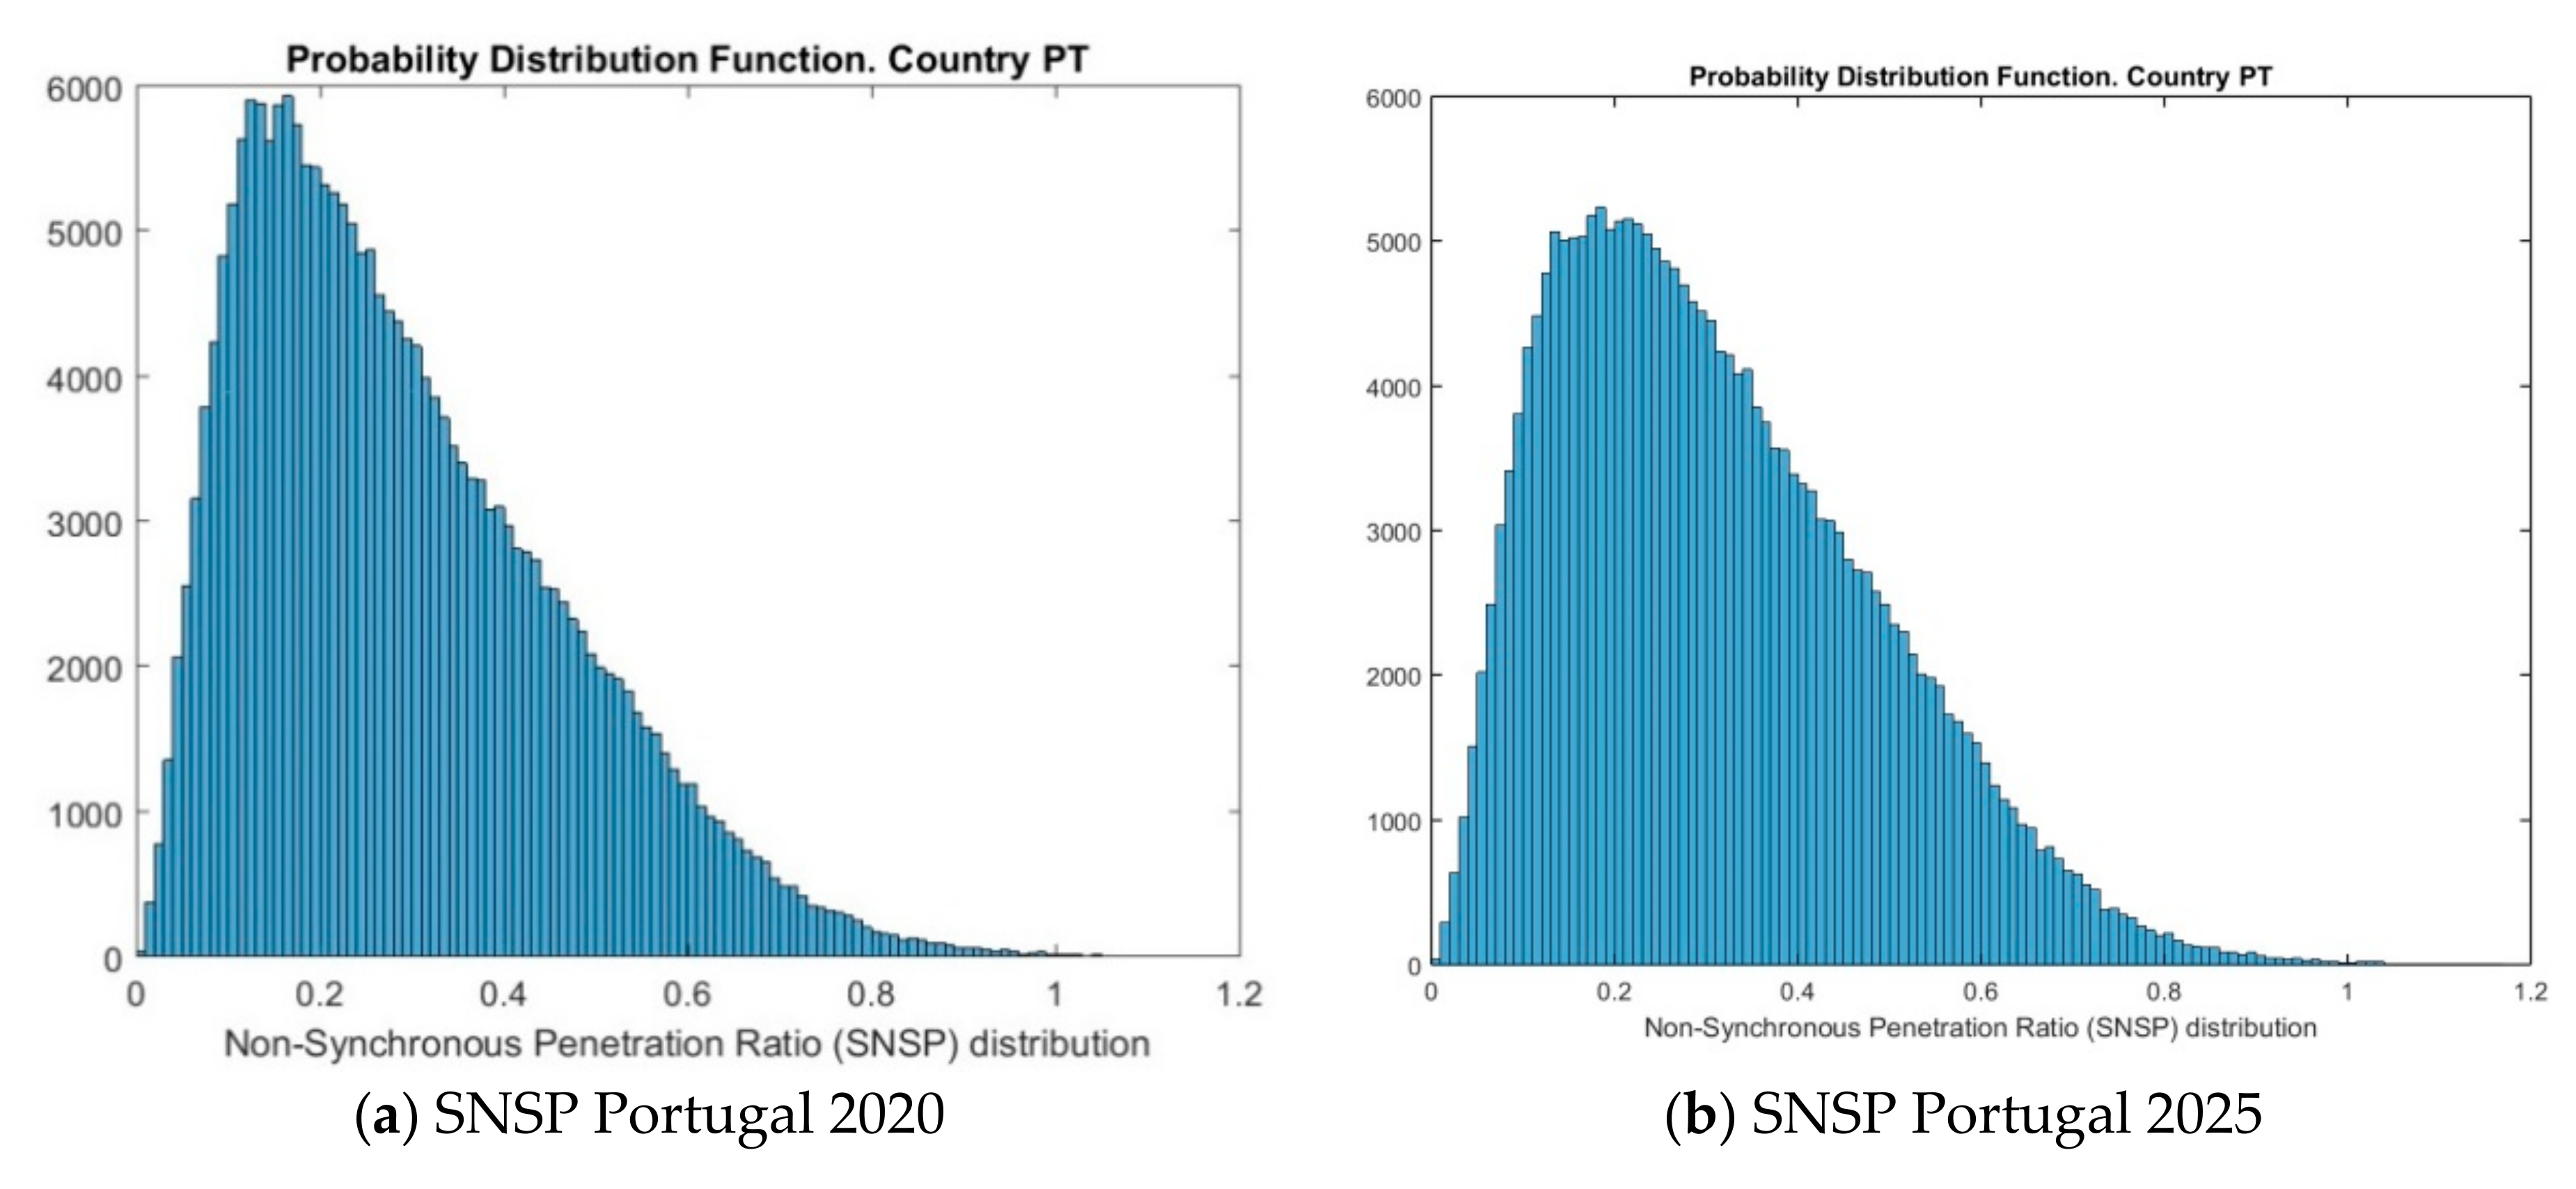
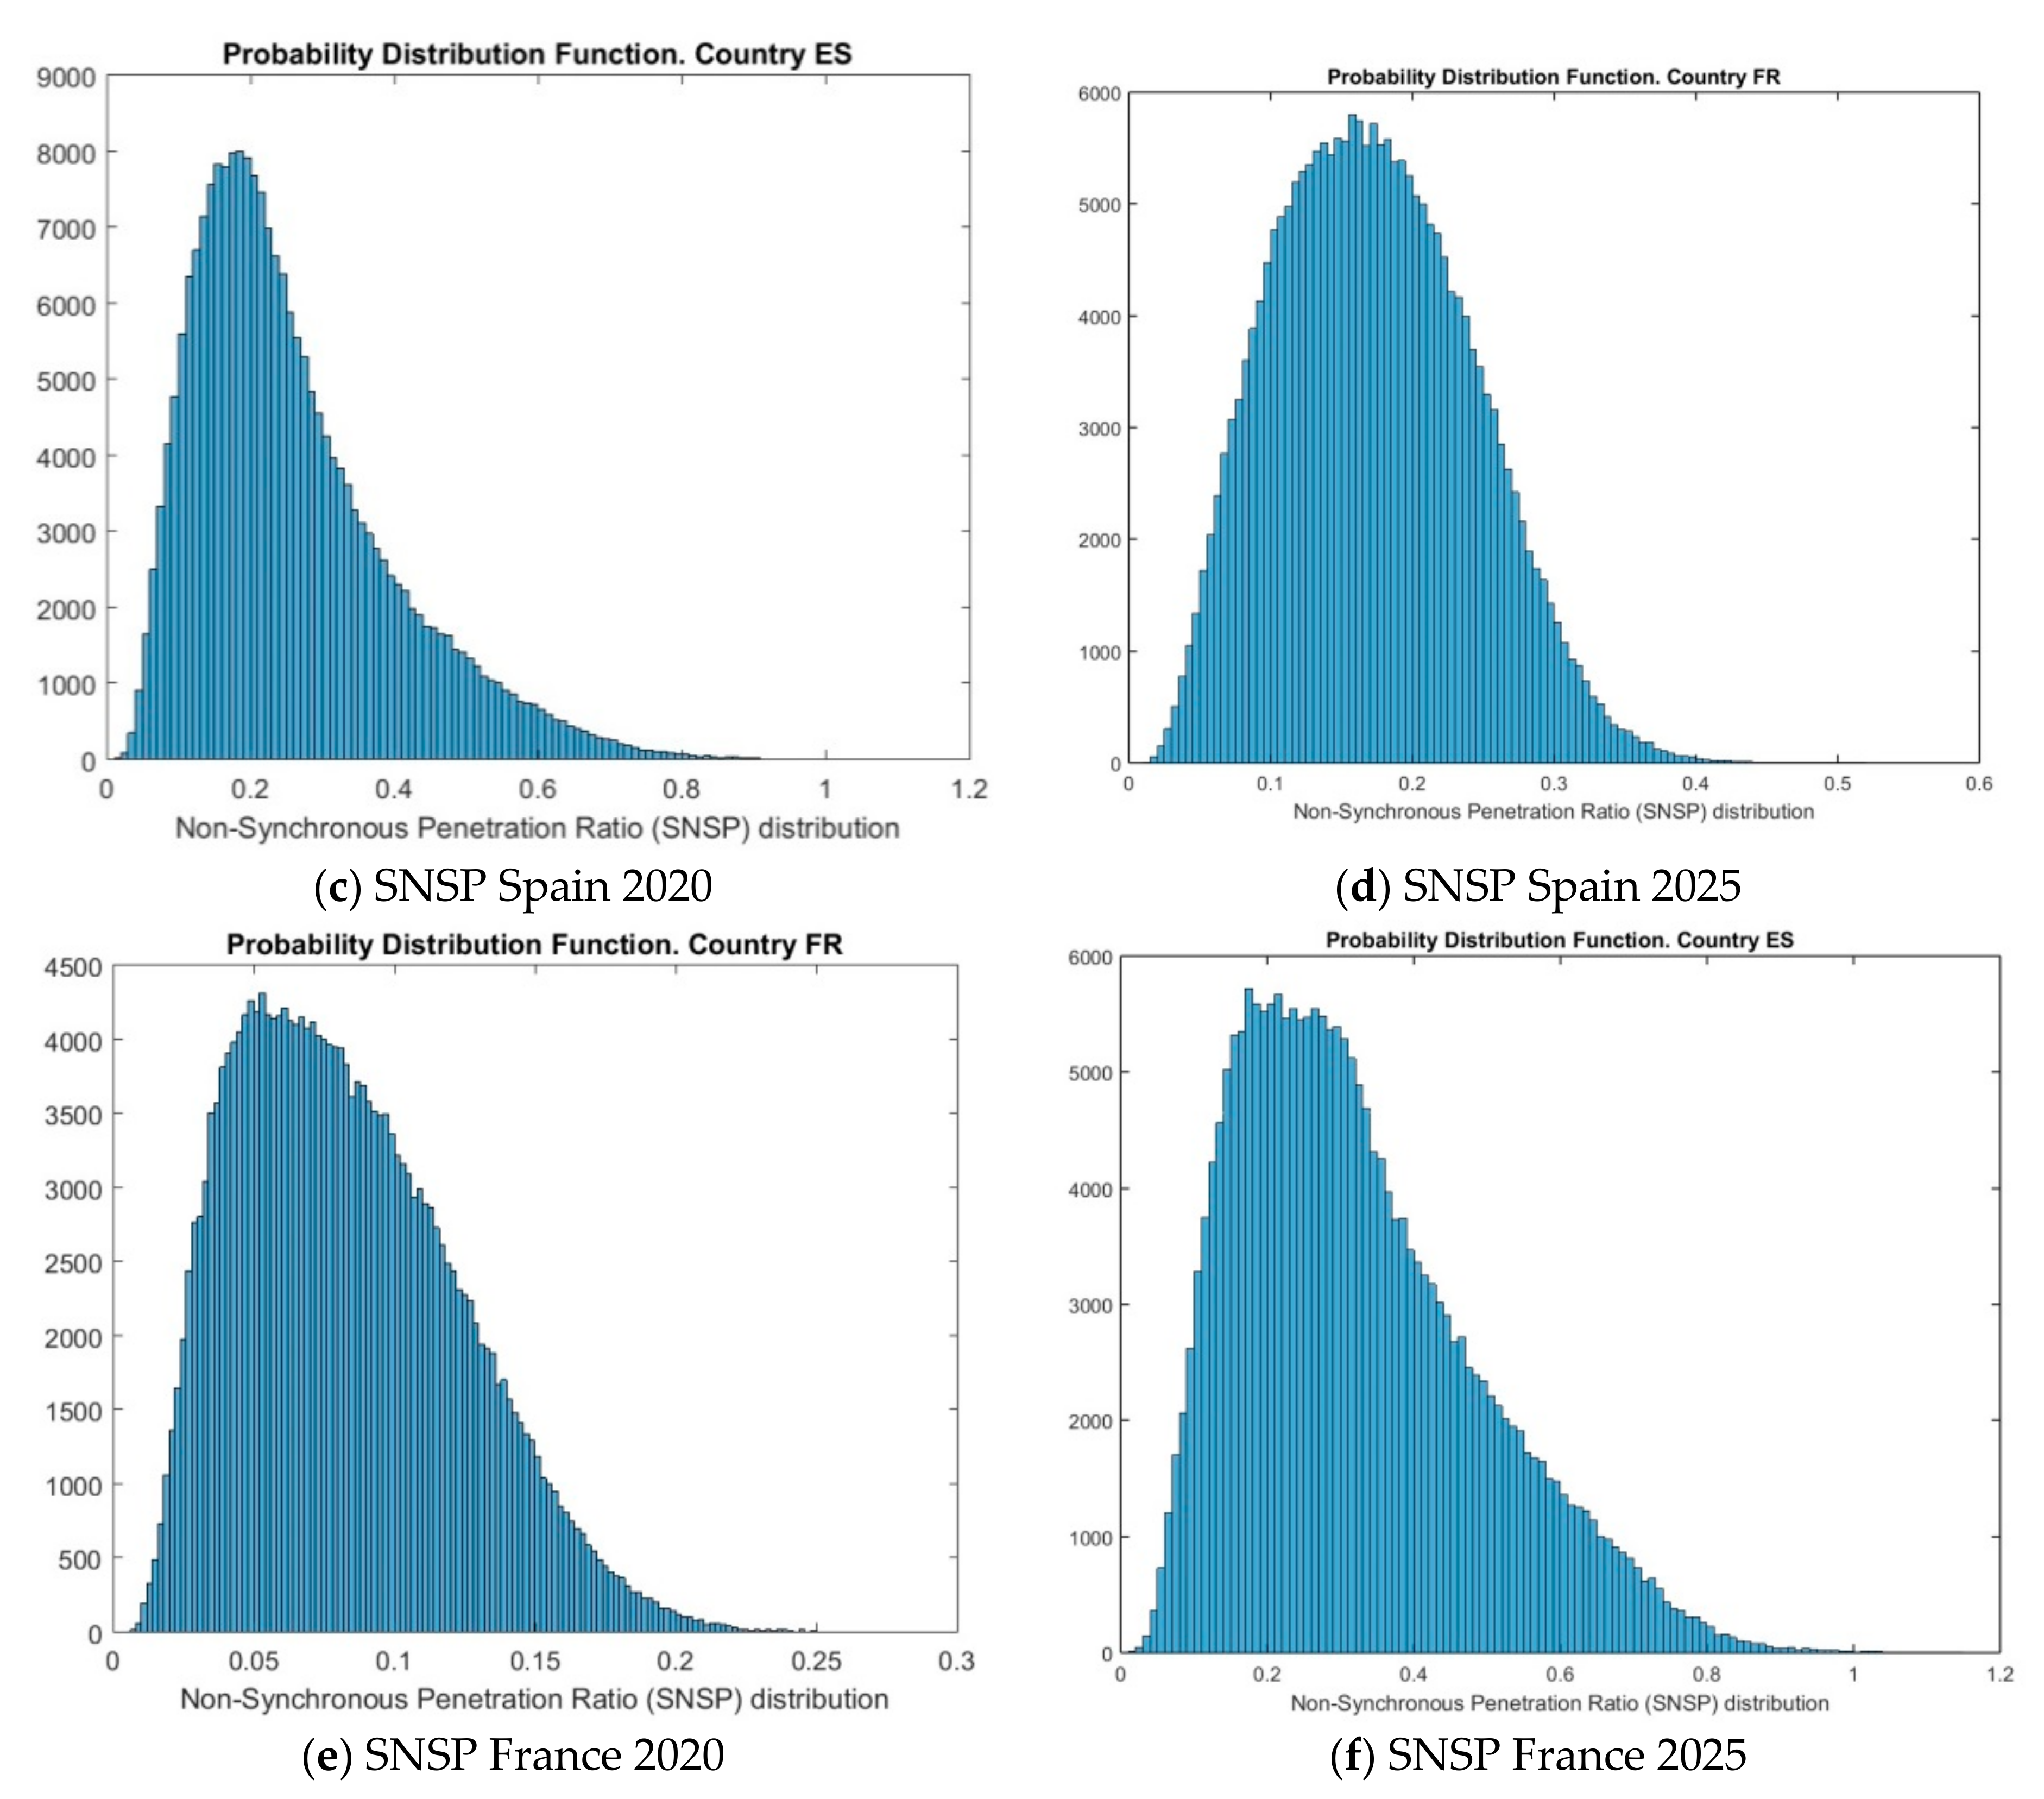
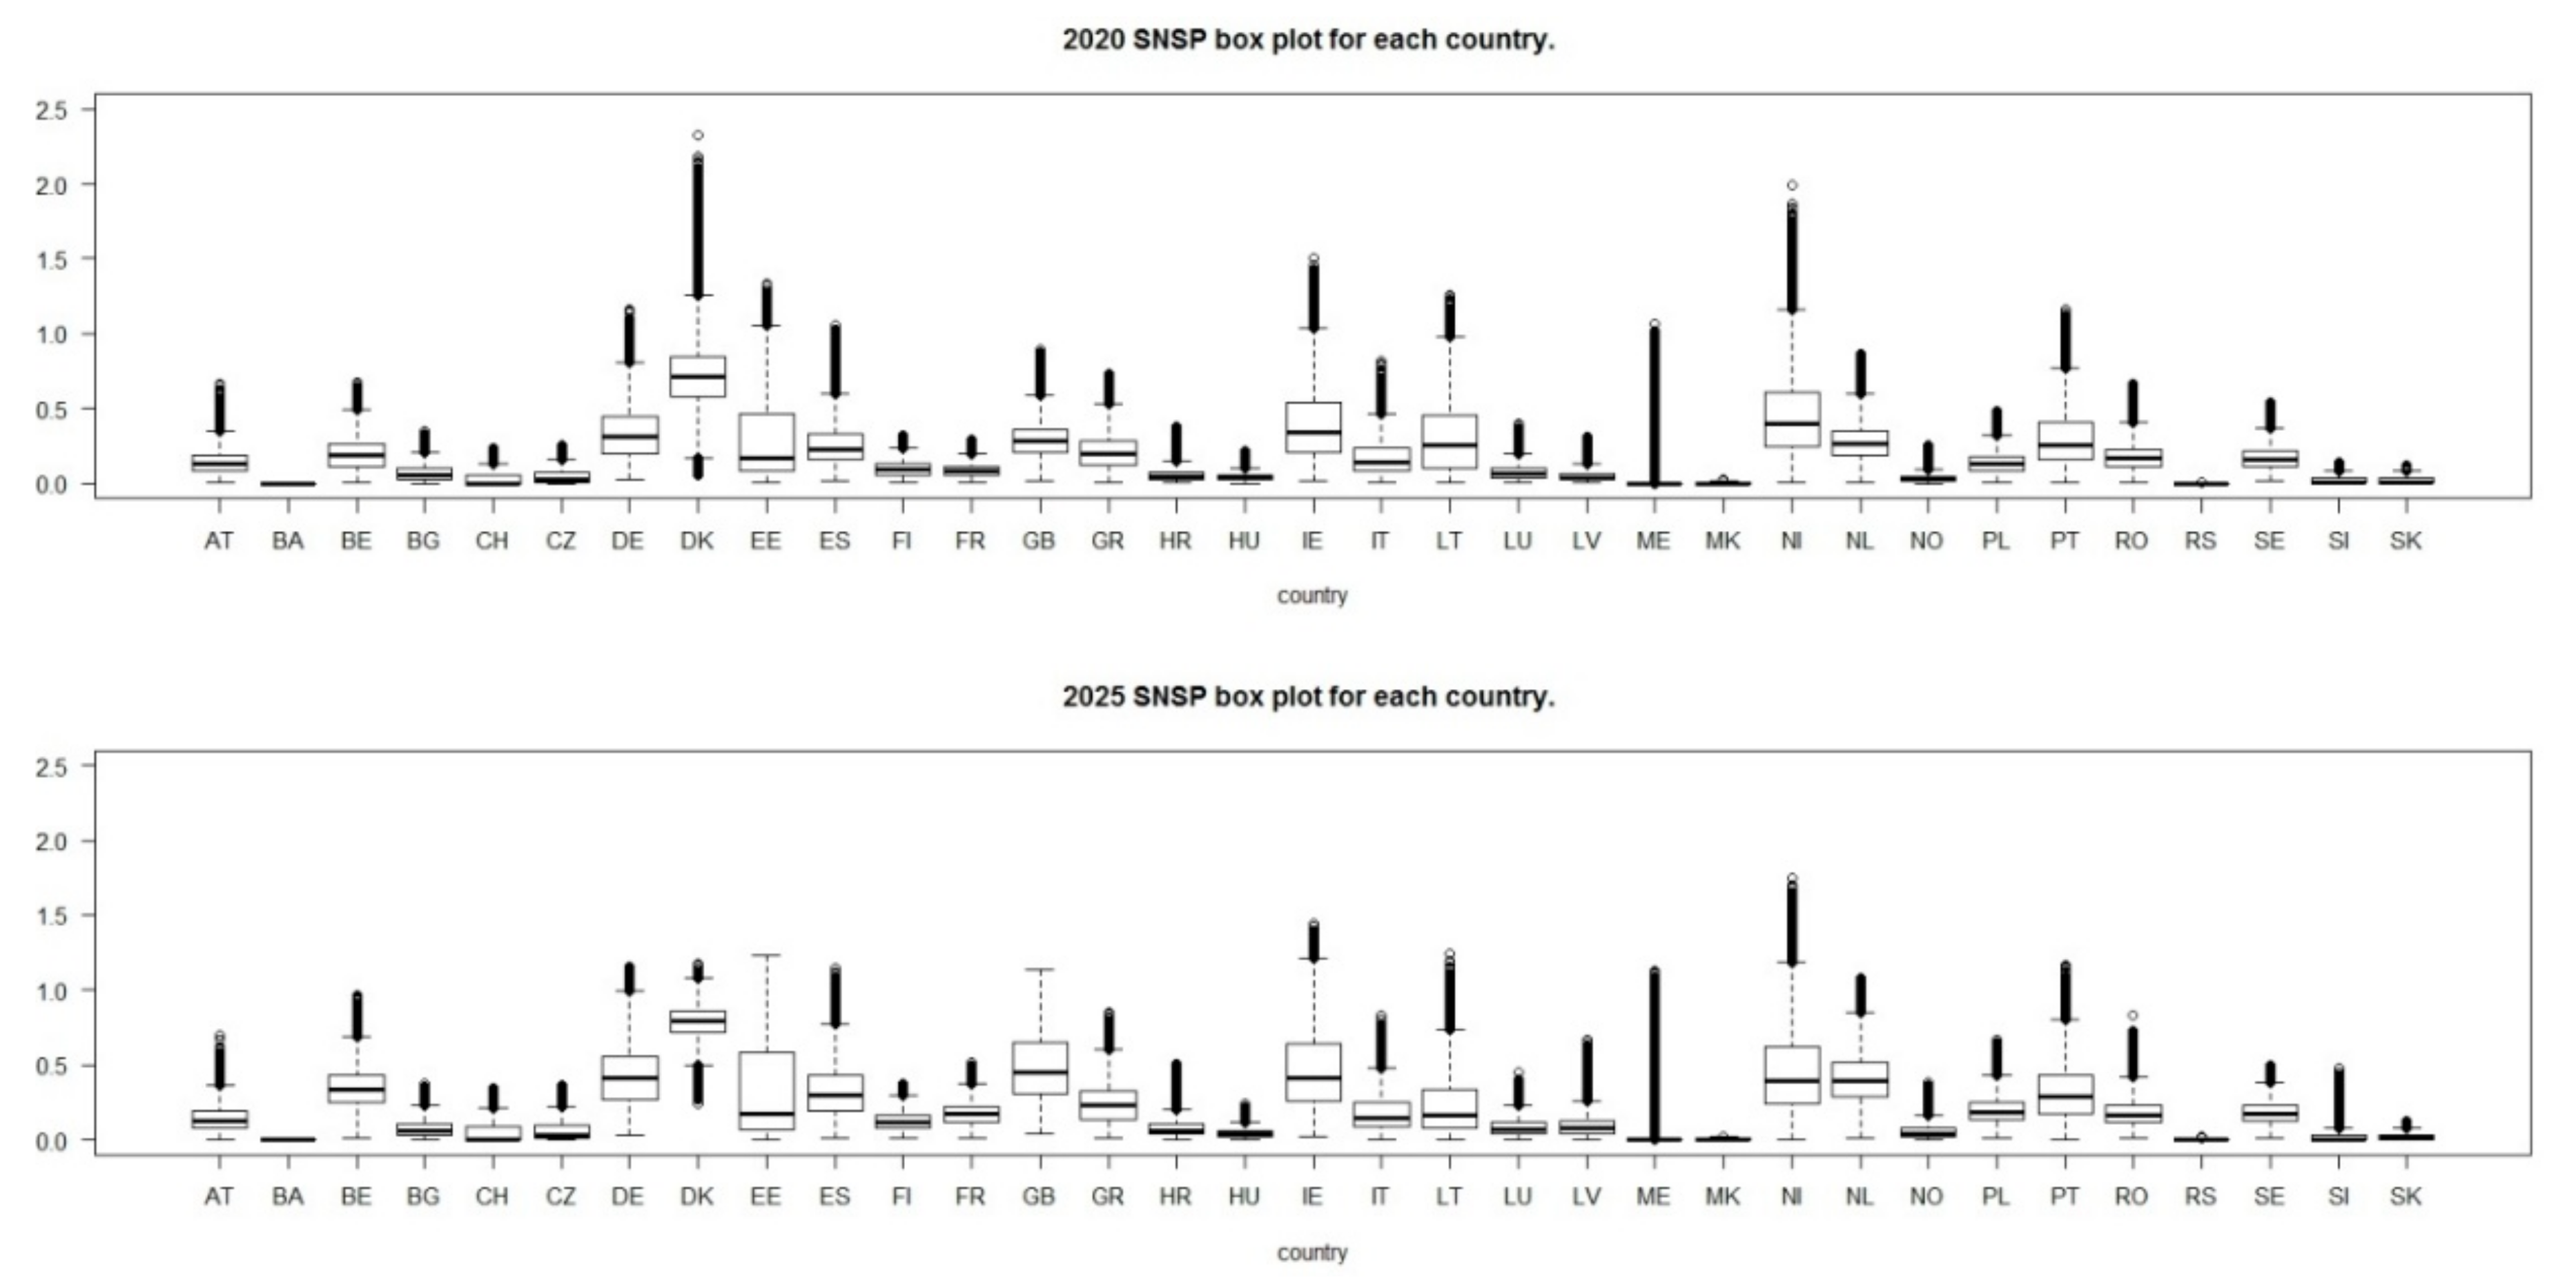
- Non-Synchronous Penetration Ratio (SNSP). An additional concern through the transition to a low carbon system is the evolution of system inertia, which is an important element of frequency stability. In [16], the authors propose the following indicator to monitor the evolution of the system inertia:where W(t) refers to wind power generation, L(t) is the system demand, and HVDC(t)import and HVDC(t)export are the imported and exported power through high voltage direct current (HVDC) interconnections respectively, all of them at time step t. This metric can be generalized as follows:Notice that the denominator HVDC(t)export has been replaced by P(t)export. This is because the original work [16] was focused on Ireland, which has only one interconnector, which has HVDC technology. It is worth to say that inverters can emulate system inertia, so when this capability is implemented, the numerator can be reduced accordingly (the emulation is different depending on the system the inverter is connected to: wind, PV, or HVDC interconnection). For example, since 2006, Hydro Quebec Transénergie has required system inertia emulation to wind farms with rated output greater than 10 MW [17].
2.2. Step 2: Flexibility Resources Indicators
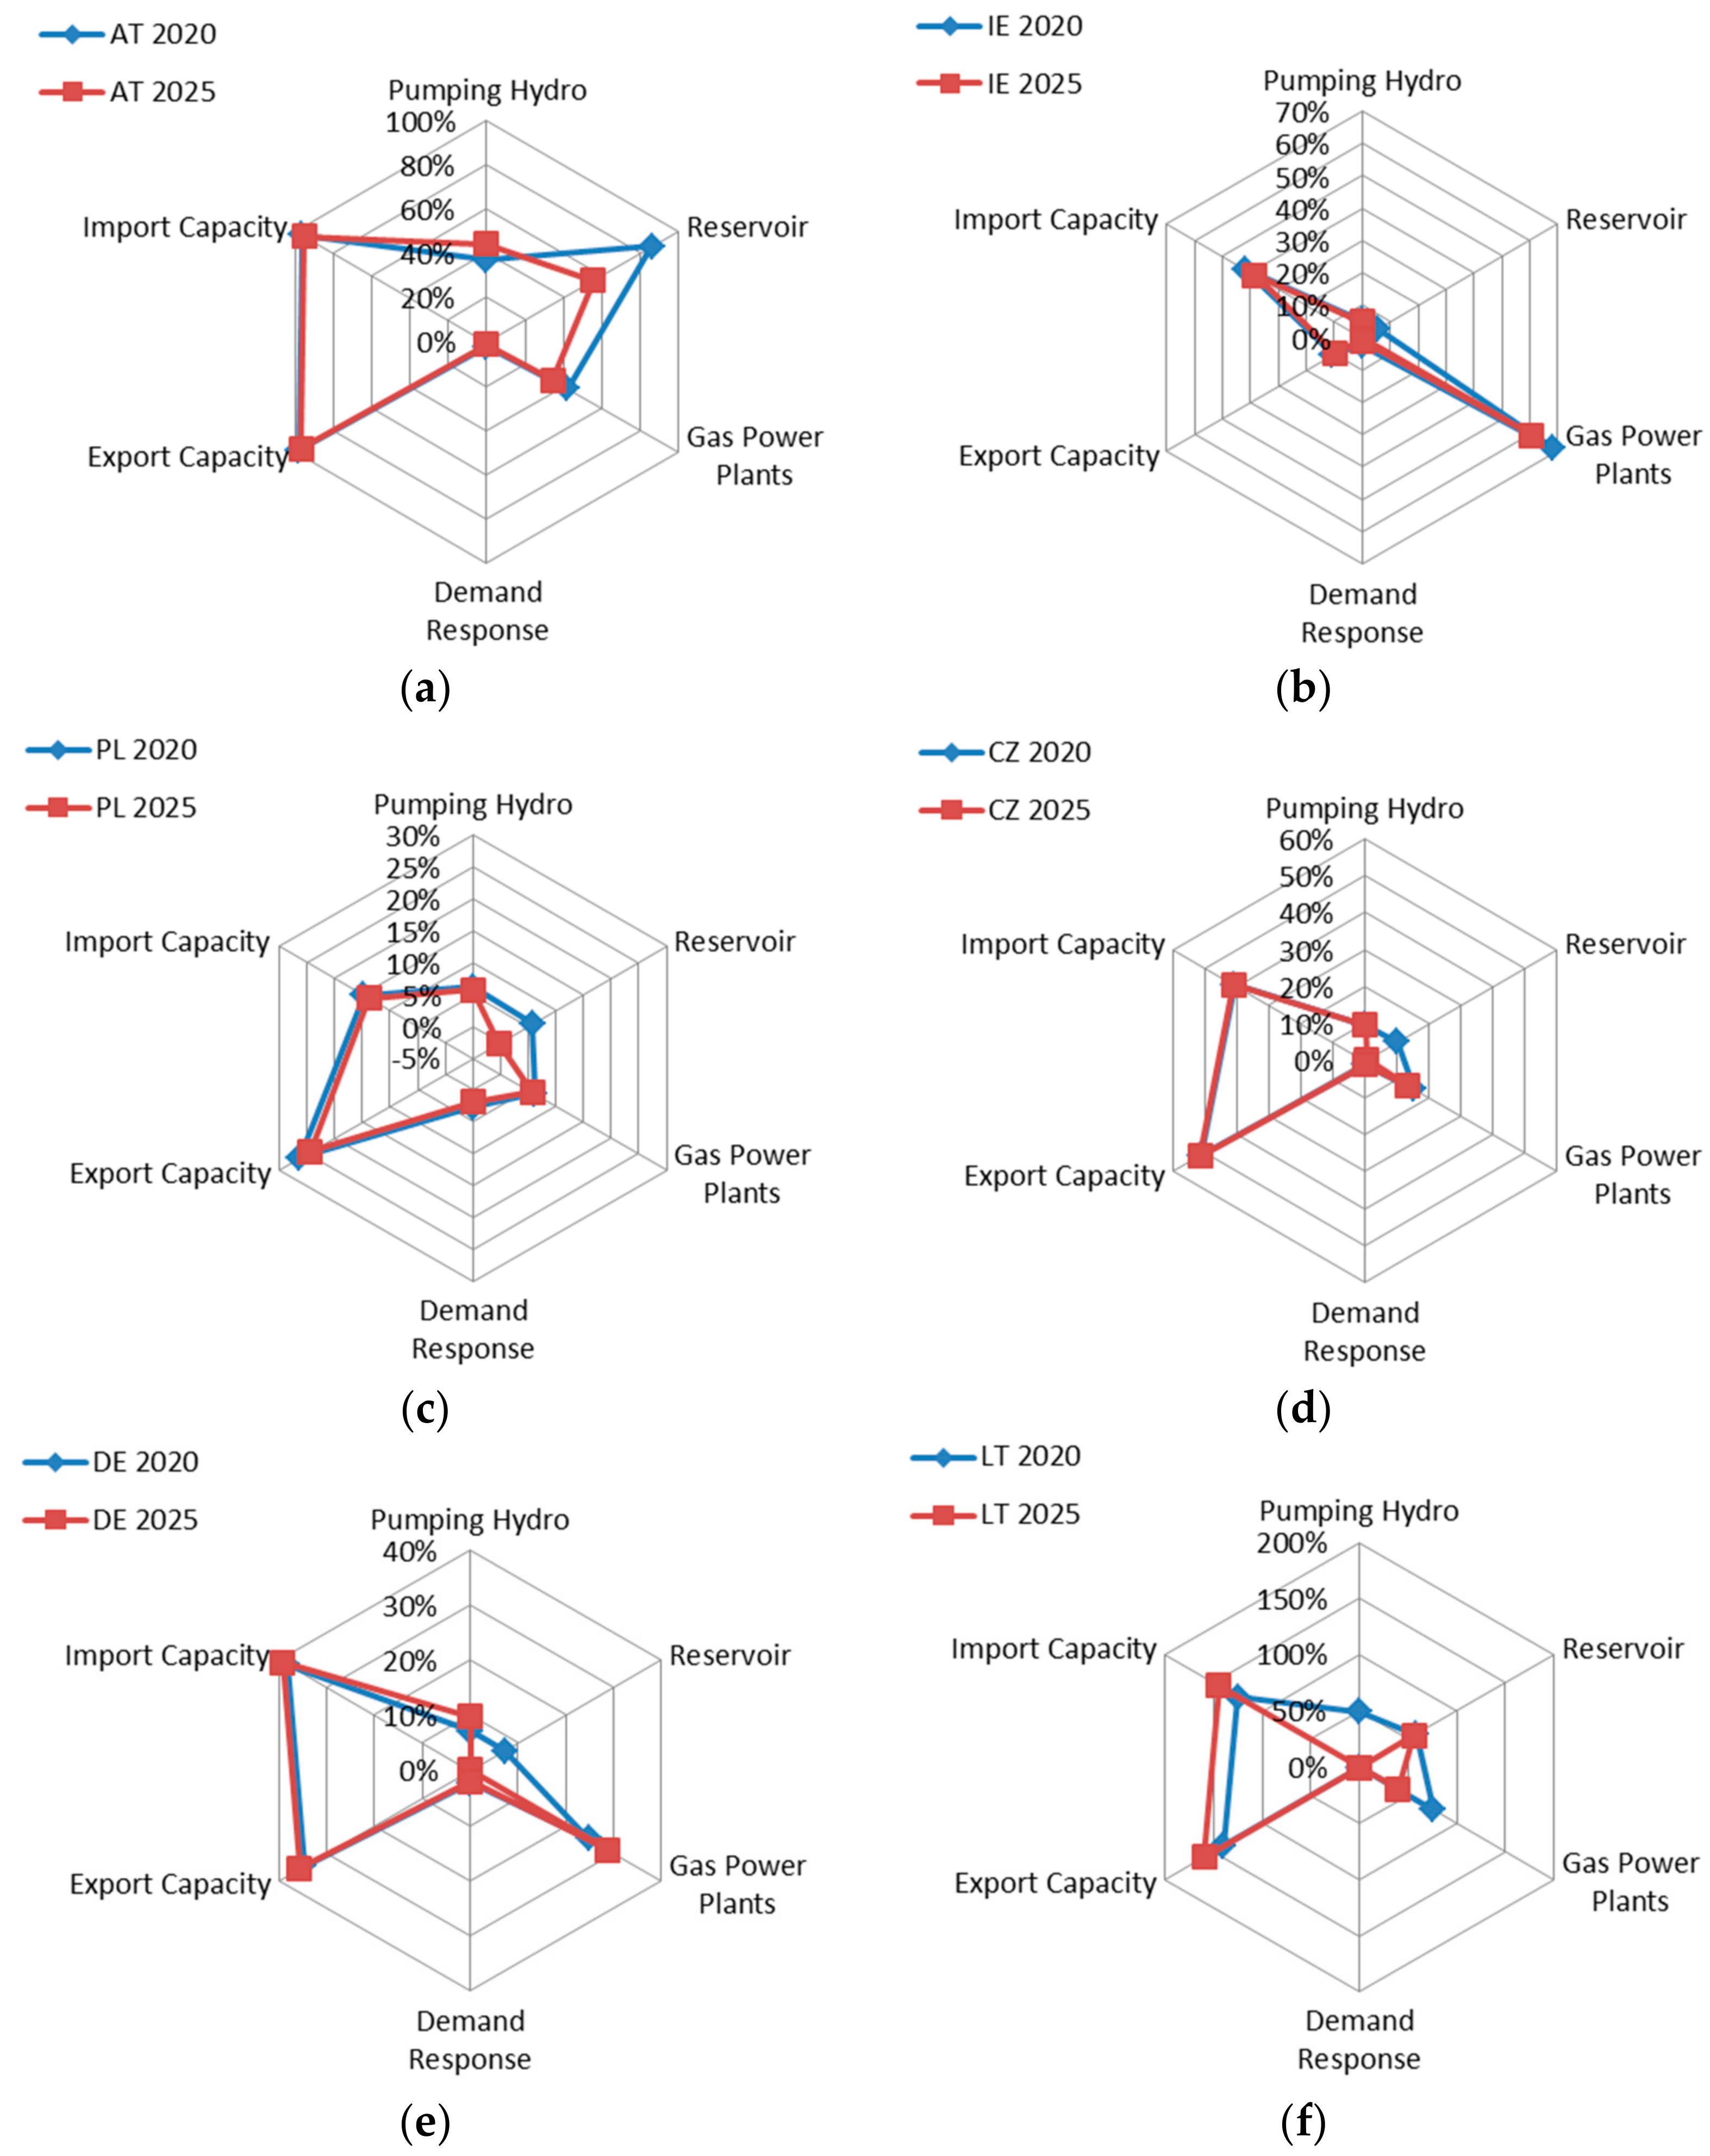
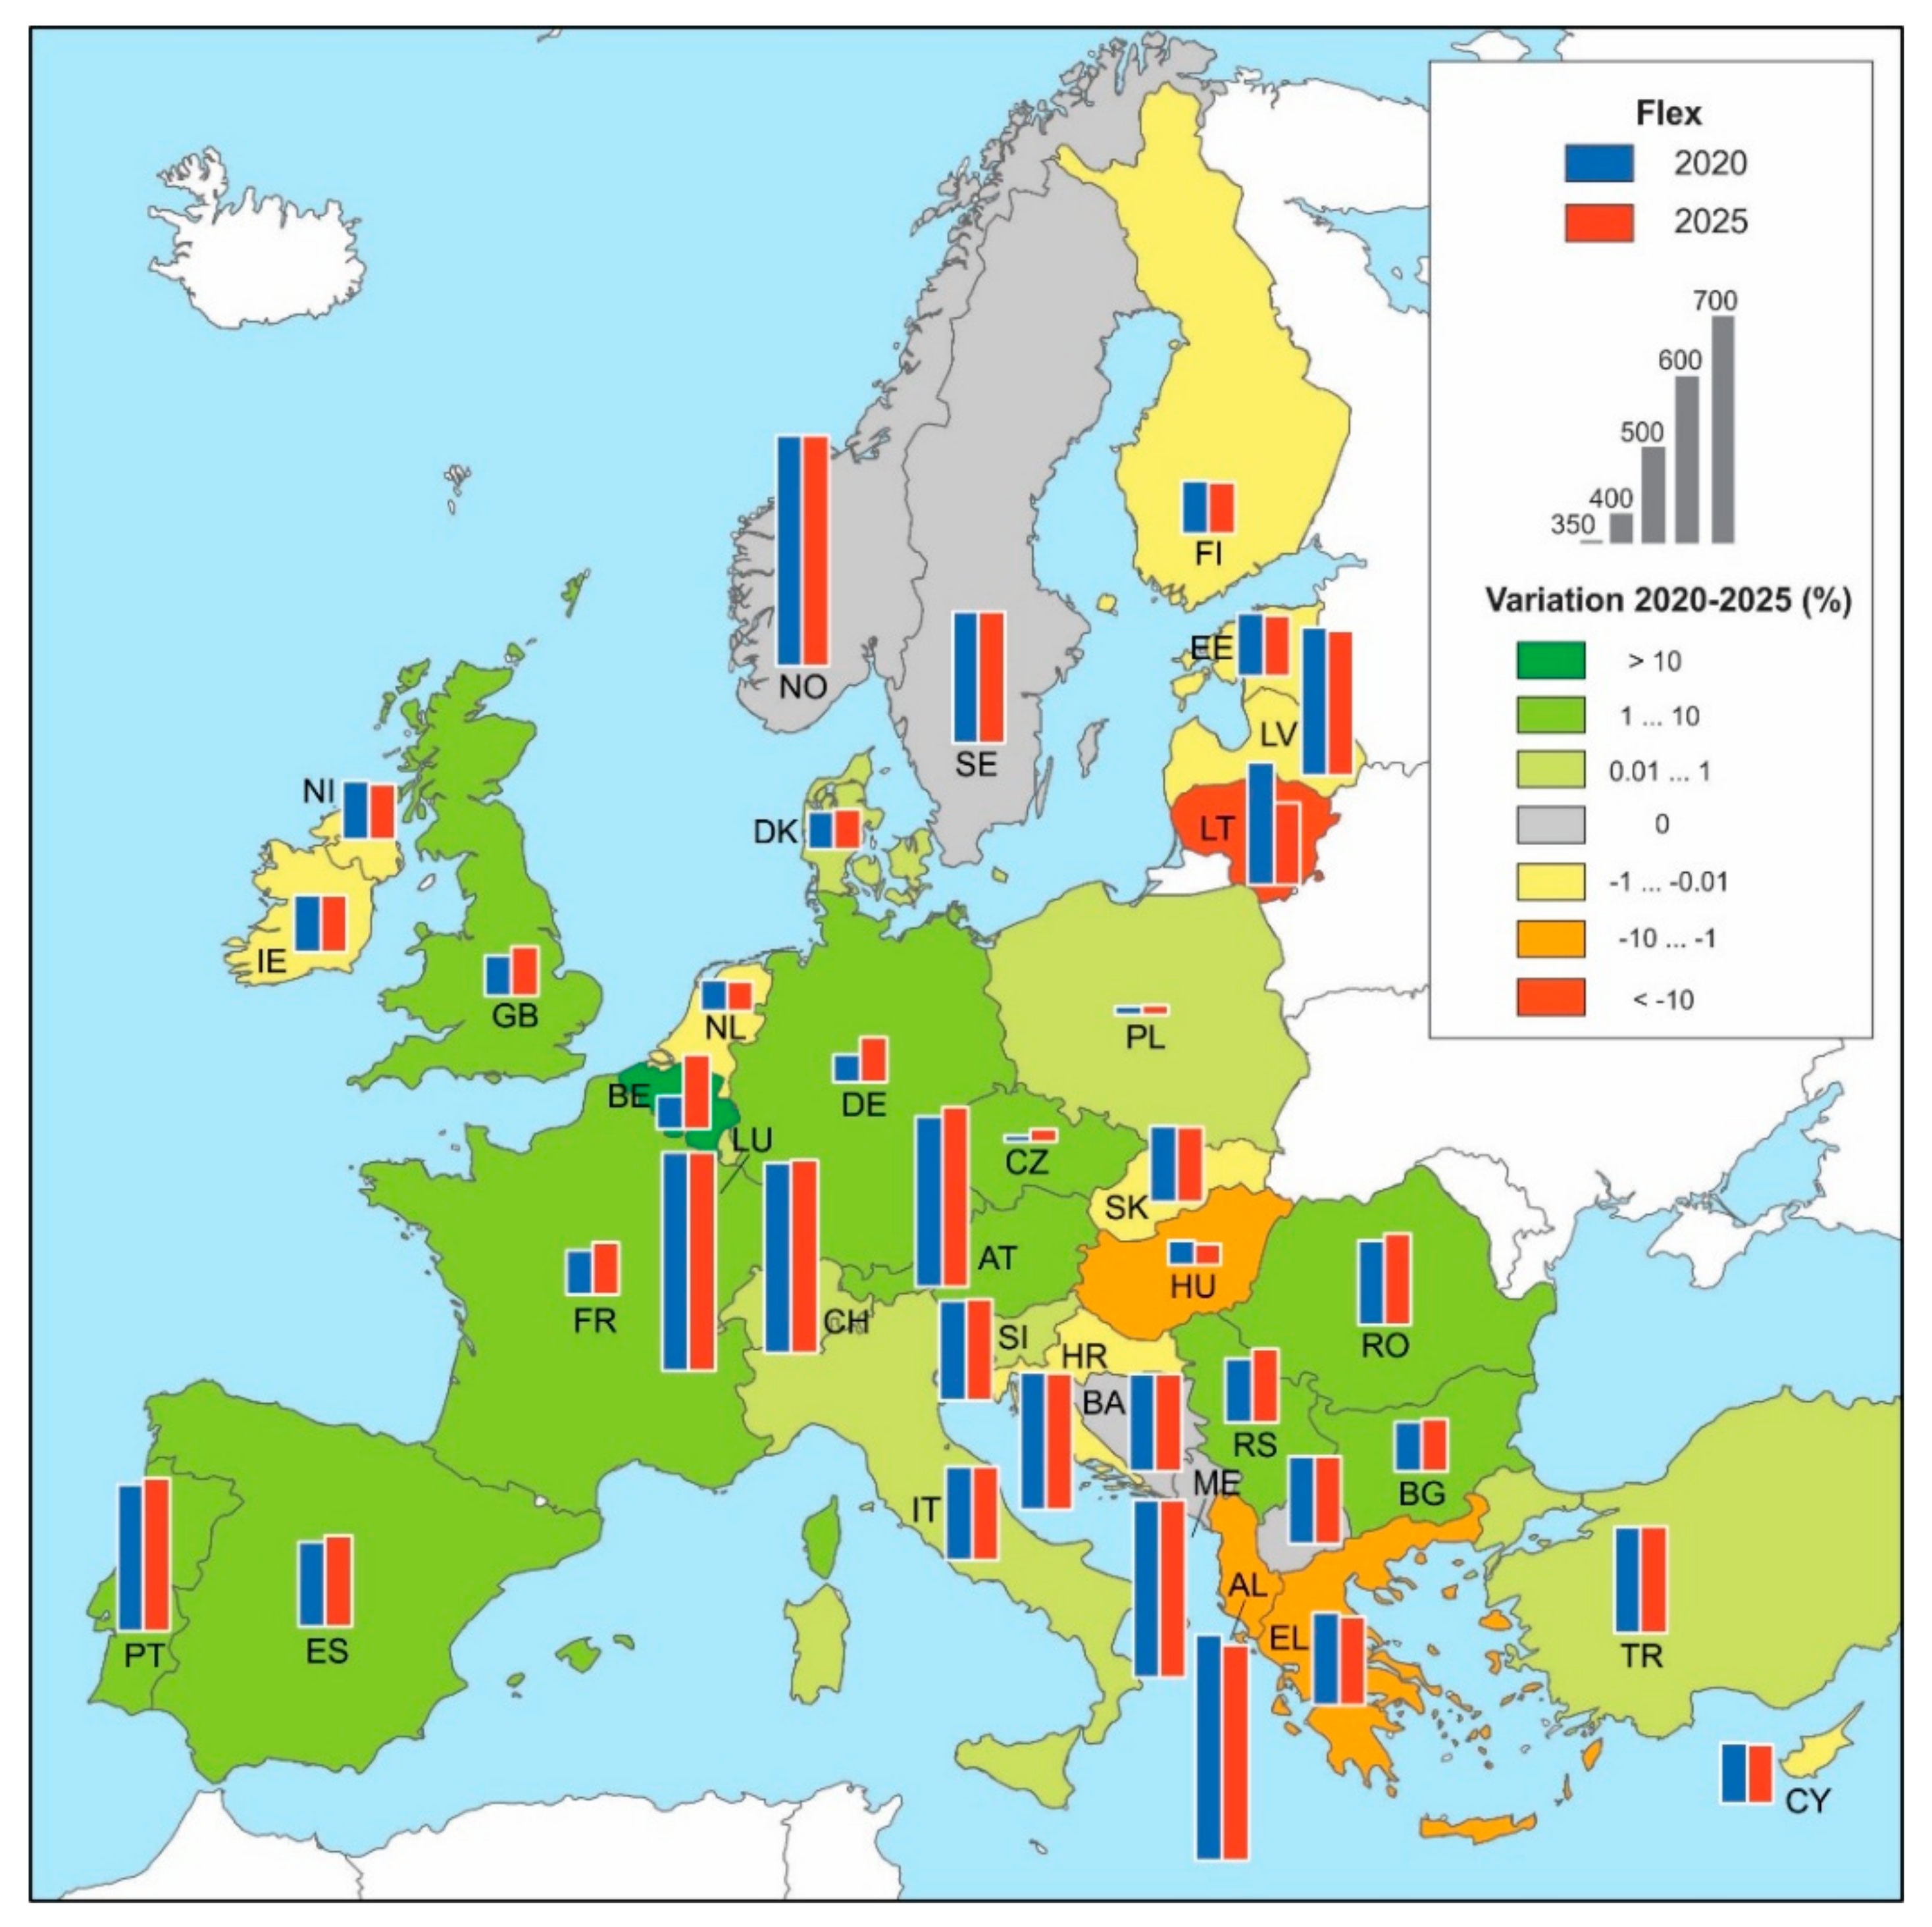
- Flexible Capacity Ratio (FCR): the percentage of installed capacity of a resource type relative to peak demand. This metric can be used to evaluate the diversity and potential capability of flexibility sources through a “flexibility chart” that is employed to visualize the dominant factors and compare the variety of solutions in different countries/areas [18].
- Flexibility index for a power system [20]:where is the maximum capacity of generator i and flex(i) is the flexibility index for generation unit i, which is defined as follows:where are the maximum and minimum stable generation capacity of generator i respectively. is the average value of , which indicates the speed of a unit to change its position within its operating range []. For comparison purposes the index was normalized by dividing by the maximum capacity. This indicator only assessed the flexibility of the generation fleet but not the flexibility due to other means, although it can be generalized using the same formula.
2.3. Step 3: Adequacy Indicators
- Renewable energy curtailments.
- Frequency excursions or dropped load (energy not served, ENS). Additional indicators to complement ENS are the loss of load duration (LLD) and loss of load occurrence (LLO).
- Area balance violations which are deviations from the schedule of the area power balance.
- In the wholesale power market, negative market prices and price volatility.
3. Model and Data
4. Results and Discussion
4.1. Step 1: Flexibility Requirements
4.2. Step 2: Flexibility Resources
4.3. Step 3: Adequacy
5. Conclusions
Author Contributions
Funding
Acknowledgments
Conflicts of Interest
Appendix A
References
- European Commission. Communication from the Commission to the European Parliament, the Council, the European Economic and Social Committee, the Committee of the Regions and the European Investment Bank, Clean Energy For All Europeans; COM(2016) 860 Final; European Commission: Brussels, Belgium, 2016. [Google Scholar]
- Alizadeh, M.; Moghaddam, M.; Amjady, N.; Siano, P.; Sheikh-El-Eslami, M. Flexibility in future power systems with high renewable penetration: A review. Renew. Sustain. Energy Rev. 2016, 57, 1186–1193. [Google Scholar] [CrossRef]
- Papaefthymiou, G.; Dragoon, K. Towards 100% renewable energy systems: Uncapping power system flexibility. Energy Policy 2016, 92, 69–82. [Google Scholar] [CrossRef]
- Ulbig, A.; Andersson, G. Analyzing operational flexibility of electric power systems. Int. J. Electr. Power Energy Syst. 2015, 72, 155–164. [Google Scholar] [CrossRef]
- Abdin, I.F.; Zio, E. An integrated framework for operational flexibility assessment in multi-period power system planning with renewable energy production. Appl. Energy 2018, 222, 898–914. [Google Scholar] [CrossRef]
- Lu, Z.; Li, H.; Qiao, Y. Probabilistic Flexibility evaluation for power system planning considering its association with renewable power curtailment. IEEE Trans. Power Syst. 2018, 33, 3285–3295. [Google Scholar] [CrossRef]
- Electric Power Research Institute (EPRI). Metrics for Quantifying Flexibility in Power System Planning. Available online: https://www.epri.com (accessed on 11 May 2017).
- Wang, Q.; Hodge, B.-M. Enhancing Power System Operational Flexibility with Flexible Ramping Products: A Review. IEEE Trans. Ind. Inform. 2016, 13, 1652–1664. [Google Scholar] [CrossRef]
- Cui, M.; Zhang, J.; Feng, C.; Florita, A.R.; Sun, Y.; Hodge, B.-M. Characterizing and analyzing ramping events in wind power, solar power, load, and net load. Renew. Energy 2017, 111, 227–244. [Google Scholar] [CrossRef]
- Kroposki, B.; Johnson, B.; Zhang, Y.; Gevorigain, V.; Denholm, P.; Hodge, B.-M.; Hannegan, B. Achieving a 100% renewable grid: Operating electric power systems with extremely high levels of variable renewable energy. IEEE Power Energy Mag. 2017, 15, 67–73. [Google Scholar] [CrossRef]
- Alemany, J.M.; Arendarski, B.; Lombardi, P.; Komarnicki, P. Accentuating the renewable energy exploitation: Evaluation of flexibility options. Int. J. Electr. Power Energy Syst. 2018, 102, 131–151. [Google Scholar] [CrossRef]
- Koltsaklis, N.E.; Dagoumas, A.S.; Panapakidis, I.P. Impact of the penetration of renewables on flexibility needs. Energy Policy 2017, 109, 360–369. [Google Scholar] [CrossRef]
- Huber, M.; Dimkova, D.; Hamacher, T. Integration of wind and solar power in Europe: Assessment of flexibility requirements. Energy 2014, 69, 236–246. [Google Scholar] [CrossRef]
- Cochran, J.; Miller, M.; Zinaman, O.; Milligan, M.; Arent, D.; Palmintier, B.; O’Malley, M.; Mueller, S.; Lannoye, E.; Tuohy, A.; et al. Flexibility in 21st Century Power Systems. NREL/TP-6a20-61721; National Renewable Energy Lab. (NREL): Golden, CO, USA, 2014, 0630. [Google Scholar] [CrossRef]
- European Network of Transmission System Operators (ENTSO-E) Scenario Outlook and Adequacy Forecast 2015. Available online: https://docstore.entsoe.eu/Documents/SDC%20documents/SOAF/150630_SOAF_2015_publication_wcover.pdf (accessed on 24 January 2017).
- O’Sullivan, J.; Rogers, A.; Flynn, D.; Smith, P. Studying the Maximum Instantaneous Non-Synchronous Generation in an Island System. Frequency Stability Challenges in Ireland. IEEE Trans. Power Syst. 2014, 29, 2943–2951. [Google Scholar] [CrossRef]
- Hydro-Québec TransÉnergie. Transmission Provider Technical Requirements for the Connection of Power Plants to the Hydro Québec Transmission System. Revision February 2009. Available online: http://www.hydroquebec.com/transenergie/fr/commerce/pdf/exigence_raccordement_fev_09_en.pdf (accessed on 24 January 2017).
- Yasuda, Y.; Ardal, A.R.; Carlini, E.M.; Estanqueiro, A.; Flynn, D.; Gómez-Lázaro, E.; Holttinen, H.; Kiviluoma, J.; Van Hulle, F.; Kondoh, J.; et al. Flexibility chart: Evaluation on diversity of flexibility in various areas. In Proceedings of the 12th International Workshop on Large-Scale Integration of Wind Power into Power Systems as well as on Transmission Networks for Offshore Wind Power Plants, London, UK, 22–24 October 2013; ISBN 978-3-98 13870-7-0. [Google Scholar]
- International Energy Agency (IEA). The Power of Transformation: Wind, Sun and the Economics of Flexible Power Systems; IEA/OECD: Paris, France, 2014. [Google Scholar] [CrossRef]
- Ma, J.; Siva, V.; Belhomme, R.; Kirschen, D.S.; Ochoa, L.F. Exploring the Use of Flexibility Indices in Low Carbon Power Systems. In Proceedings of the IEEE/PES Innovative Smart Grid Technologies Europe Conference, Berlin, Germany, 14–17 October 2012. [Google Scholar] [CrossRef]
- European Network of Transmission System Operators (ENTSO-E). Mid-Term Adequacy Forecast Edition 2016. Available online: https://www.entsoe.eu/outlooks/maf/Pages/default.aspx (accessed on 24 January 2017).
- Purvins, A.; Sereno, L.; Ardelean, M.; Covrig, C.F. Submarine power cable between Europe and North America: A techno-economic analysis. J. Clean. Prod. 2018, 186, 131–145. [Google Scholar] [CrossRef]
- Pfenninger, S.; Staffell, I. Long-term patterns of European PV output using 30 years of validated hourly reanalysis and satellite data. Energy 2016, 114, 1251–1265. [Google Scholar] [CrossRef]
- Pfenninger, S.; Staffell, I. Using bias-corrected reanalysis to simulate current and future wind power output. Energy 2016, 114, 1224–1239. [Google Scholar] [CrossRef]
- Eurostat. Available online: http://ec.europa.eu/eurostat/data/database (accessed on 10 February 2018).
- PLEXOS®. Available online: https://energyexemplar.com/ (accessed on 27 January 2017).
- Carlsson, J.; Fortes, M.D.M.P.; de Marco, G.; Giuntoli, J.; Jakubcionis, M.; Jäger-Waldau, A.; Lacal-Arantegui, R.; Lazarou, S.; Magagna, D.; Moles, C.; et al. ETRI-2014 Energy Technology Reference Indicator Projections for 2010–2050; Publications Office of the European Union: Luxembourg, 2014; ISBN 978-92-79-44403-6. [Google Scholar] [CrossRef]
- World Energy Council. Performance of Generating Plant: New Metrics for Industry in Transition; World Energy Council: London, UK, 2010; ISBN 978-0-946121-01-4. [Google Scholar]
- Freedman, D.; Pisani, R.; Purves, R. Statistics, 4th ed.; W. W. Norton and Company: New York, NY, USA, 2007; ISBN 13 978-0393929720. [Google Scholar]

| Wind Ramps | Residual Load Ramps | |||||||||
|---|---|---|---|---|---|---|---|---|---|---|
| Most Frequent Ramp Span (h) | Maximum Ramp (MW) | Maximum Ramp Span (h) | Maximum Average Rate (MW/h) | Maximum Average Rate Ramp Span (h) | Most Frequent Ramp Span (h) | Maximum Ramp (MW) | Maximum Ramp Span (h) | Maximum Average Rate (MW/h) | Maximum Average Rate Ramp Span (h) | |
| AT | 2 | 3514 | 26 | 2395 | 1 | 5 | 6292 | 16 | 2027 | 1 |
| BE | 2 | 4768 | 15 | 3548 | 1 | 5 | 7763 | 11 | 2943 | 1 |
| BG | 2 | 865 | 18 | 387 | 1 | 1 | 2917 | 10 | 514 | 1 |
| CZ | 2 | 661 | 20 | 311 | 1 | 4 | 3425 | 9 | 776 | 3 |
| DE | 2 | 51,834 | 27 | 25,626 | 1 | 6 | 67,086 | 19 | 30074 | 1 |
| DK | 1 | 5300 | 29 | 3558 | 1 | 1 | 6548 | 10 | 3602 | 1 |
| EE | 2 | 336 | 39 | 171 | 1 | 1 | 827 | 14 | 282 | 1 |
| ES | 2 | 23,360 | 25 | 11,616 | 1 | 6 | 31,224 | 18 | 17273 | 1 |
| FI | 2 | 2753 | 35 | 2040 | 1 | 1 | 4434 | 16 | 1973 | 1 |
| FR | 2 | 19,883 | 15 | 15,574 | 1 | 2 | 37,564 | 10 | 12,594 | 1 |
| GB | 2 | 36,624 | 37 | 20,622 | 1 | 5 | 50,288 | 16 | 26,593 | 1 |
| GR | 2 | 2883 | 17 | 1870 | 1 | 1 | 5964 | 16 | 1918 | 1 |
| HR | 1 | 783 | 30 | 187 | 1 | 1 | 2050 | 9 | 330 | 2 |
| HU | 2 | 738 | 27 | 516 | 1 | 1 | 2922 | 13 | 711 | 1 |
| IE | 1 | 3892 | 25 | 2768 | 1 | 1 | 6005 | 14 | 2373 | 1 |
| IT | 1 | 10,025 | 20 | 5830 | 1 | 5 | 34,739 | 17 | 5926 | 1 |
| LT | 2 | 578 | 35 | 370 | 1 | 1 | 1238 | 11 | 436 | 1 |
| LU | 2 | 161 | 14 | 134 | 1 | 1 | 475 | 10 | 184 | 1 |
| LV | 2 | 408 | 36 | 209 | 1 | 1 | 958 | 11 | 219 | 1 |
| NI | 2 | 1189 | 17 | 952 | 1 | 1 | 1884 | 12 | 936 | 1 |
| NL | 2 | 9677 | 27 | 5886 | 1 | 1 | 15,569 | 12 | 5844 | 1 |
| NO | 1 | 1218 | 20 | 932 | 1 | 1 | 7559 | 9 | 1346 | 4 |
| PL | 2 | 7085 | 35 | 4493 | 1 | 1 | 14,582 | 13 | 5386 | 1 |
| PT | 1 | 4913 | 21 | 3962 | 1 | 1 | 7287 | 14 | 3133 | 1 |
| RO | 2 | 3678 | 31 | 2600 | 1 | 1 | 5327 | 10 | 3311 | 1 |
| SE | 2 | 6299 | 28 | 5829 | 1 | 1 | 10,471 | 11 | 5227 | 1 |
| SI | 1 | 40 | 13 | 20 | 1 | 1 | 1105 | 9 | 218 | 4 |
| SK | 2 | 95 | 25 | 52 | 1 | 1 | 1461 | 6 | 398 | 1 |
| LLD (Hours/Year) | LLO (occ/Year) | ENS (MWh/Year) | |||||||||||||
|---|---|---|---|---|---|---|---|---|---|---|---|---|---|---|---|
| BG | FI | GR | IE | PL | BG | FI | GR | IE | PL | BG | FI | GR | IE | PL | |
| 1990 | 3 | 3 | 13.9 | ||||||||||||
| 1991 | 1 | 1 | 0.93 | ||||||||||||
| 1992 | 1 | 1 | 1.90 | ||||||||||||
| 1993 | |||||||||||||||
| 1994 | |||||||||||||||
| 1995 | |||||||||||||||
| 1996 | 2 | 2 | 6.25 | ||||||||||||
| 1997 | 1 | 1 | 6.15 | ||||||||||||
| 1998 | 2 | 1 | 2 | 1 | 14.84 | 4.20 | |||||||||
| 1999 | |||||||||||||||
| 2000 | |||||||||||||||
| 2001 | 8 | 1 | 3 | 1 | 4598 | 1.00 | |||||||||
| 2002 | 6 | 1 | 1 | 2 | 1 | 1 | 7263 | 2.76 | 3.60 | ||||||
| 2003 | 1 | 1 | 2.78 | ||||||||||||
| 2004 | |||||||||||||||
| 2005 | |||||||||||||||
| 2006 | |||||||||||||||
| 2007 | 1 | 1 | 1 | 1 | 3.06 | 1.4 | |||||||||
| 2008 | 1 | 1 | 3.58 | ||||||||||||
| 2009 | |||||||||||||||
| 2010 | 1 | 1 | 7.35 | ||||||||||||
| 2011 | |||||||||||||||
| 2012 | 1 | 1 | 1.93 | ||||||||||||
| 2013 | 1 | 1 | 33 | ||||||||||||
| 2014 | 1 | 1 | 3.15 | ||||||||||||
© 2018 by the authors. Licensee MDPI, Basel, Switzerland. This article is an open access article distributed under the terms and conditions of the Creative Commons Attribution (CC BY) license (http://creativecommons.org/licenses/by/4.0/).
Share and Cite
Poncela, M.; Purvins, A.; Chondrogiannis, S. Pan-European Analysis on Power System Flexibility. Energies 2018, 11, 1765. https://doi.org/10.3390/en11071765
Poncela M, Purvins A, Chondrogiannis S. Pan-European Analysis on Power System Flexibility. Energies. 2018; 11(7):1765. https://doi.org/10.3390/en11071765
Chicago/Turabian StylePoncela, Marta, Arturs Purvins, and Stamatios Chondrogiannis. 2018. "Pan-European Analysis on Power System Flexibility" Energies 11, no. 7: 1765. https://doi.org/10.3390/en11071765
APA StylePoncela, M., Purvins, A., & Chondrogiannis, S. (2018). Pan-European Analysis on Power System Flexibility. Energies, 11(7), 1765. https://doi.org/10.3390/en11071765


