Research on an Intelligent Behavior Evaluation System for Unmanned Ground Vehicles


1
College of Mechanical and Equipment Engineering, Hebei University of Engineering, Handan 056038, China
2
Merchant Marine College, Shanghai Maritime University, Shanghai 201306, China
*
Author to whom correspondence should be addressed.
Energies 2018, 11(7), 1764; https://doi.org/10.3390/en11071764
Submission received: 27 May 2018
/
Revised: 13 June 2018
/
Accepted: 3 July 2018
/
Published: 4 July 2018
Abstract
:A scientific and reasonable evaluation system for unmanned ground vehicles (UGVs) is very important. This paper studies the intelligent behavior of UGVs, and also proposes a comprehensive evaluation system for this intelligent behavior. The test and evaluation system includes the test content design, the test environment design, the test methods and the evaluation method. Using a hierarchical design approach, the test content is designed to be stage by stage, moving from simplicity to complexity and from individual modules to the entire vehicle. The hierarchical test environment is established according to the test content levels. The extension analytic hierarchy process (EAHP) has a better advantage than the analytic hierarchy process (AHP) to avoid the problem of the ambiguity of expert experience judgment and the consistency of the judgment matrix in determine the weight of each evaluation index. Using chaos theory to calculate the Lyapunov index, the quality of the trajectory of the UGV is characterized. The grey relational analysis method is used to analyze the correlation between the comparison series and the reference series, and a comprehensive quantitative result of the intelligent behavior of the UGV is obtained. The experiment shows that the intelligent behavior evaluation system of the UGV is scientific and effective.
1. Introduction
UGVs have great potential in reducing traffic accidents, alleviating traffic jams, improving roads and vehicle utilization and so on. In real life, there are many traffic violations such as drivers changing roads illegally, running red lights and so on, which lead to traffic accidents. The UGV can accurately observe the traffic rules, such as choosing the best path to change lanes, accurately identifying the traffic lights and making the corresponding decisions. The location of each other is detected by vehicles’ interaction, location sharing, and radar sensors to avoid collisions. Like electric vehicles [1,2], UGVs have great advantages in improving energy efficiency, and they have become a research hotspot for many research teams. The intelligence level of the UGV is the key factor in determining the quality of the UGV. Developing a scientific and reasonable evaluation system can promote the rapid development of some key technologies of the UGV.
With the development of individual technology and integrated systems, UGV test and assessment methods have evolved from a single test to a complex capability test. Urmson described tests for evaluating and comparing the navigational skills of UGVs [3]. The tests included blind path tracking tests, perception assisted path tracking tests and perception planning tests. Krotkov et al. proposed third-party test experiments for UGVs [4]. They proposed that the experiments should be conducted by a group independent from the developers. They described the detailed information of the test environment and the test content. However, they did not discuss the evaluation approach in detail.
Abroad, the evaluation the overall performance of UGVs is part of large UGV competitions such as the Defense Advanced Research Projects Agency (DARPA) Ground Challenge. The first DARPA Ground Challenge competition [5] required the vehicles be a UGV, without remote control, and capable of tracking every car in real time. In the final, none of the teams finished the whole competition [6]. The second DARPA Ground Challenge simply used “the number of completed competitions” and “the total number of passes” to rank the teams [7]. The third DARPA Ground Challenge is DARPA Urban Challenge, where the competing vehicles must comply with the traffic rules, and the total completion time is calculated by adding and subtracting scores to determine the victory or defeat, and the overtime, fouls and dangerous behavior will be deducted from the score. The three events are totally third party tests. However, the evaluation method used in the DARPA Challenge mainly cares about whether a vehicle completes the task and the time required to complete the task. It does not focus on the quality of the work. For example, Wei et al. indicated that some teams in 2007 DARPA Urban Challenge preferred to avoid difficult maneuvers in high-density traffic by stopping and waiting for a clear opening instead of interacting with it [8].
In the intelligent transportation system (ITS) field Australia launched the Smart Demo competition [9] in September 2005, focusing on the technological progress of the globe in the field of vehicle active safety in the past 10 years. In May 2006, Europe also held the first European Land Robot Trial (ELROB) competition [10] for land robots. Unlike the DARPA Ground Challenge, the European competition places more emphasis on autonomy. In August 2007, Europe also held an urban environment competition to investigate the perception, navigation and control capabilities of UGVs in an unknown environment. The Ground Cooperation Driving Challenge (GCDC) competition, held in 2011 [11], used the distance of vehicles to evaluate the performance of the UGVs’ longitudinal control and collaboration ability [12].
Research on UGVs in China started relatively late, and its evaluation work has relatively lagged. With the maturation of all aspects of UGV technology, a quantitative evaluation based on third parties occurred in China for the first time [13]. China has since held several competitions named “Future Challenge” based on the major research plan of cognitive calculation of audiovisual information of the National Natural Science Foundation of China, mainly to test the ability of UGVs to perceive the natural environment and automatically deal with audio-visual information. The first “Future Challenge” was held in June 2009. The competition required the UGVs to travel from the starting point without collision to the end. There were obstacles in the competition to investigate the obstacle avoidance ability of UGVs in a straight line. There was a traffic signal lamp to investigate the ability of the UGV to identify signal lights, as well as the decision-making and control ability. This was the first competition for UGVs in China [14]. Since then, the “Future Challenge” has been held nine times, focusing on investigating the Safety, Smartness, Smoothness, and Speed (4S) performance of UGVs.
With the rapid development of UGV technology safety problems have become increasingly prominent. Tesla vehicles have suffered several accidents while operating in automatic driving mode. The Google UGV also had an accident. In 2017, Baidu’s UGV got its first ticket during a road test. In 2018, an Uber UGV caused the world’s first fatal accident. The basic reason for those series of accidents is that the intelligence level of UGVs can’t currently meet the safety requirements to operate on the road, so testing and evaluating the intelligence level of UGVs has become a top priority.
To sum up, an objective and predetermined evaluation system have great significance to the promotion of UGV development [15]. The intelligence level of the UGV should be tested effectively by designing a hierarchical and phased test content and environment. The EAHP method is used to determine the weight of factors. It overcomes the ambiguity problem of AHP [16,17,18] in solving expert’s experience judgement problems, as it does not need to judge the consistency of judgement matrix, and effectively avoids a lot of trial work required in AHP. Chaos theory quantitative analysis for the driving track and grey relational analysis can better reflect the actual situation and can easily be transformed into a specific score. Grey relational analysis methods are applied to the intelligent behavior evaluation of UGVs, and not only can the individual evaluation index of intelligent behavior be evaluated, but also a comprehensive evaluation can be carried out in combination with the indexes at all levels. It can provide an intuitive comparison and rank result. Experiments show that the proposed evaluation system is both scientific and reasonable.
2. Test Content Design
UGVs use sensors installed in different places to sense the surrounding environment and obtain information about roads, positions, obstacles and environment [19]. Any subtle changes such as light, temperature changes and changes in surface roughness captured by the sensor will affect the behavior of the UGV, affecting the analysis decision of the UGV. Whether it is a task change or an environmental change, it will change the behavior of the UGV.
Environmental perception, behavior decision making and control, intelligent interaction and navigation are the key technologies and abilities of UGVs. These key technologies and abilities of UGVs are hard to test directly. The behaviors of UGVs reflect their key technologies and abilities; therefore, the behaviors of UGVs should be tested to evaluate their key technologies and abilities.
2.1. Test Content Scenario Design
Based on the requirements of intelligent behavior, taking into account the safety of testing, and according to the complexity of natural environment perception and intelligent behavior decision-making, the behavior is divided into four layers for examination. These are environmental perception, decision control, intelligent interaction, and navigation, respectively, as seen in Table 1.
2.2. Layer Test Content Design
The intelligence level of a UGV is gradually developed, and the corresponding cognitive ability is gradually developed from the primary level to the advanced level. This requires the UGV’s test contents to correspond to different stages and different layers. It reflects the development process from simple to complex and from easy to difficult. For the basic ability test of UGVs, simple test content can be designed. For the advanced and complex cognitive ability tests of UGVs, complex test content can be designed. For example, the navigation and path planning [20] ability of an UGV can be accomplished by global positioning system (GPS) navigation in a simple case, which reflects a simple cognitive ability. In complex situations, it is necessary to have more advanced cognitive ability when the UGV can’t complete the path planning by relying only on GPS navigation. In the same way, under simple and complex circumstances, UGV is also divided into different layers of primary and higher levels in environmental perception, control, and decision-making capabilities.
3. Test Environment Design
The intelligent behavior test of UGVs in a complex and unknown environment is an important task in the development of UGVs. It is an important means to carry out scientific and fair evaluation on the research level of key technology of environmental perception and behavior decision of UGVs and so on. In order to ensure the scientificity, repeatability and safety of intelligent behavior testing, we must ensure that testing is from easy to difficult and simple to complex, so the design of the test environment based on the content of UGV intelligent behavior tests must be studied.
Through the analysis of the relationship between the test environment and the intelligent behavior of the UGV, the definition and classification of test environment factors are studied, and a test environment model is established. According to the development trends, test targets and content of the UGV, the design requirements of test environment are analyzed, and a phased test environment is designed. The way to test the design of the environment is shown in Figure 1.
3.1. A Test Environment Model Establishment
By analyzing the relationship between environmental factors and key technologies of the UGV, the environmental impact factors are classified and all kinds of basic environmental factors and their components are defined. The basic environmental factors can be divided into the road environment factors, the weather environment factors, the driving environment factors, the traffic environment factors, the audio-visual environment factors and so on. Through the combination of various environmental factors, the establishment of various real road environments is studied, and a theoretical model of the test environment is formed to achieve the accurate simulation of the complex real environment. The research scheme for the construction of the theoretical model of the test environment is shown in Figure 2.
3.2. Test Layer Environment Design
According to the layer requirements of the testing content of UGV, a multi-layer design method based on the complexity of the test environment is studied. To test the basic ability of UGVs, a simple test environment is designed. Aiming at the advanced and complex cognitive ability test of the UGV, a complex test environment is designed by combining different types of environmental factors and prior knowledge of the environment. According to a test module, a test environment with different layers is designed, and the difficulty of testing is gradually increased.
Since the avoidance of static obstacles is a basic ability of an UGV, the corresponding test environment design reflects the lane changing factors, to improve the difficulty of avoiding static obstacle test ability by reducing the light factors and adding fog environment factors, to further assess the robustness of the UGV to avoid a static obstacle. UGVs must first detect and model the road [21], for the UGV lane-keeping ability test, by increasing road fouling factors (such as rain and snow cover, lane line breakage, etc.) and roadside environment factors (such as fences, bushes, etc.) to improve the test difficulty, which should maintain the speed according to the type of the road.
To test the ability to pass through intersections based on the traffic signs, a multi-layer test environment is designed by combining different prior knowledge of traffic signs, such as detailed location and specific type. Location information on traffic signs in the test environment can reduce the requirements for recognizing traffic signs provided. Traffic sign type information that can reduce requirements for identifying traffic signs is provided. By changing the prior knowledge of the test environment, changes to the complexity of the test environment can be made, gradually reducing the test difficulty for the UGV to go through the intersection based on traffic signs. Adding other dynamic vehicle environment factors through the intersection can also provide higher requirements for the ability of environment perception, control and decision-making of the UGV in the environmental design.
4. Intelligent Behavior Evaluation Method for UGV
The methods of evaluation of the intelligent behavior of UGVs are also different according to the different index properties. Some indexes of UGV intelligent behavior evaluation involve trajectory analysis and evaluation, in order to get a more objective evaluation result, using chaos theory by comparing the actual trajectory and ideal trajectory to calculate the Lyapunov index for quantitative evaluation of the intelligent behavior of the UGV.
The UGV intelligent behavior is evaluated by different evaluation methods, an if the evaluation method is different, and the scale of the index evaluation result will be different. The part indexes of the UGV are characterized by Lyapunov index, which is difficult to integrate with the evaluation results of other indexes. Using the grey relational theory to extract the optimal value of each index to form a reference series, by comparing and analyzing the correlation degree between the comparison series and the reference series, it is very good way to solve the problem that the evaluation results of each index are difficult to fuse. This can get a more reasonable quantitative result of each evaluation index of the intelligent behavior of the UGV.
4.1. Establishment of Index Evaluation System
Intelligent behavior tests of UGVs are an important method to realize the scientific and fair evaluation of the research level of key UGV technology, such as environment perception, control, and decision-making. The intelligence level of the UGV is tested by evaluating the intelligent behavior of the vehicle. Due to the continuous development of technology, we should set up an evaluation hierarchy that can reflect the characteristics of targets scientifically, objectively and comprehensively so we can comprehensively evaluate the UGV by the evaluation, target evaluation aspect, and evaluation factors.
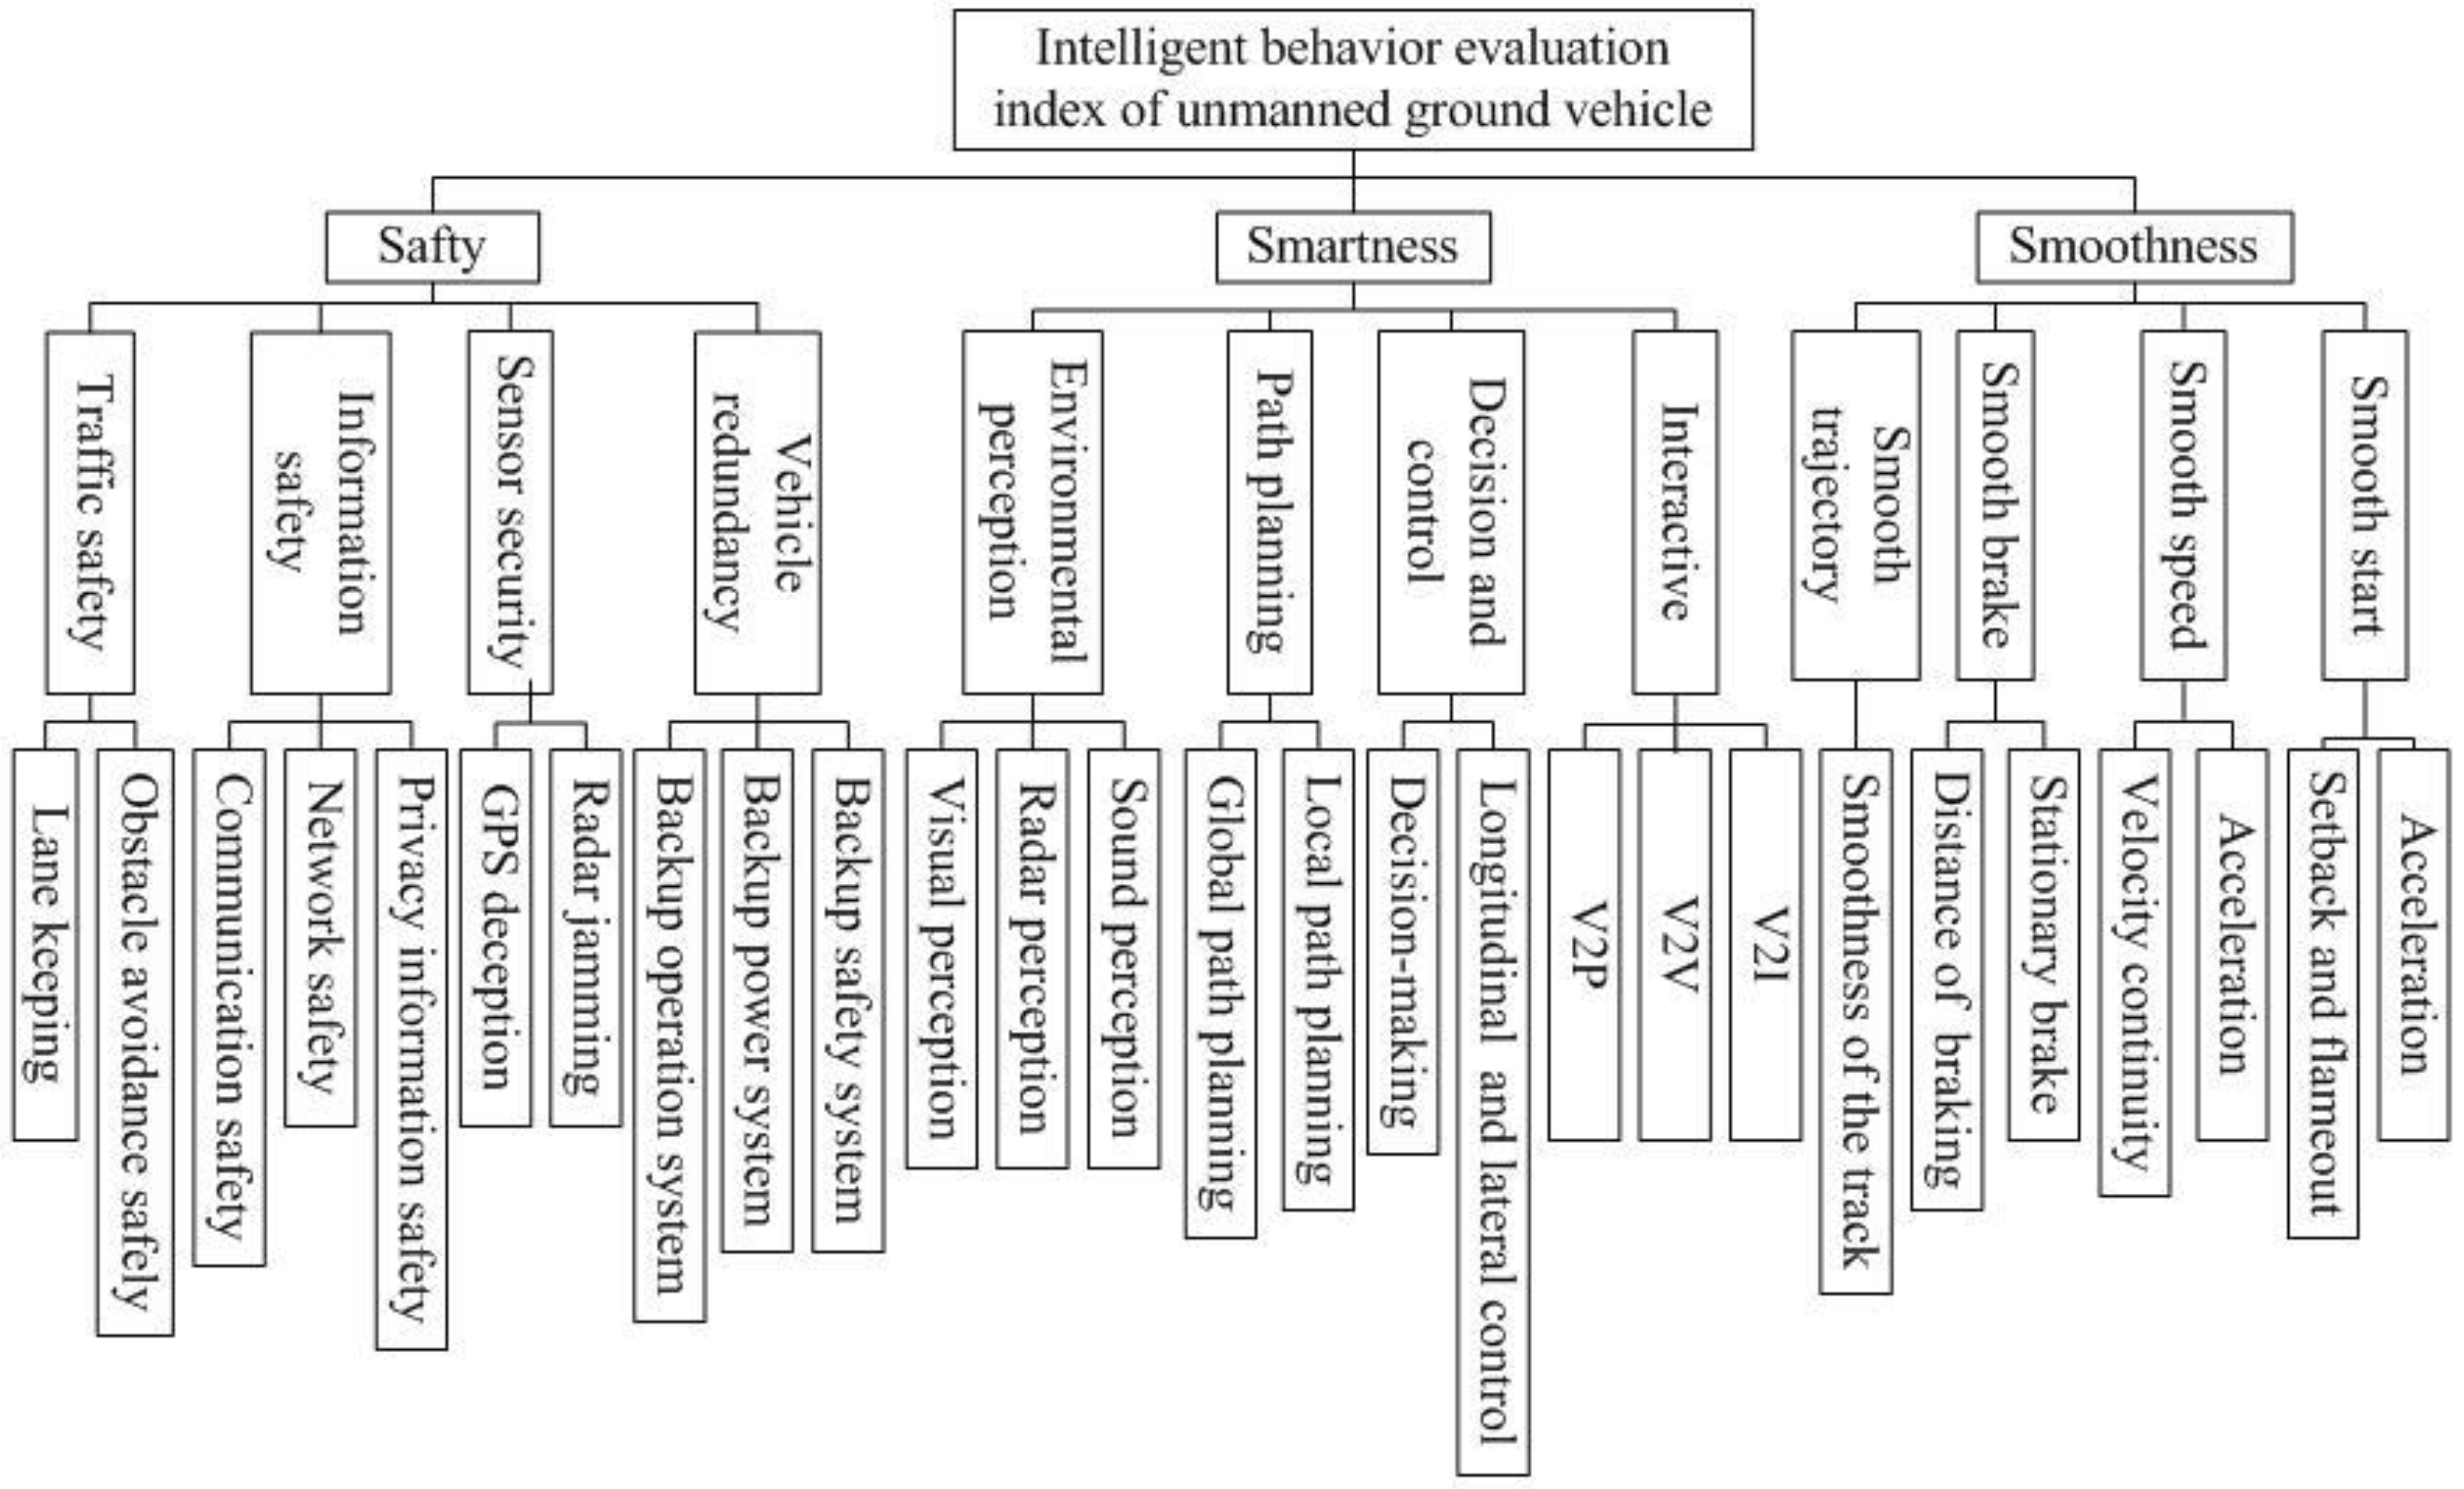
To establish a scientific and accurate comprehensive evaluation model, a scientific evaluation index system is a necessary prerequisite, and only when a scientific evaluation index system is obtained can we get accurate comprehensive evaluation results. Before constructing the evaluation system, the selection of evaluation index should follow the principles of completeness, scientificity, independence, operability, hierarchy, and purpose. After the selection, it is necessary to use scientific methods to analyze and select the selected evaluation indexes. Using literature analysis methods and reading relevant literature, we have summarized the current global evaluation indexes used for the qualitative evaluation of UGV intelligence behavior, comprehensively analysing the evaluation indexes of major UGV competitions at home and abroad, and refining the indexes to get the initial evaluation index and layer. Using the Delphi method for multiple rounds of investigation and consultation from an expert, we collected opinions gradually and screened the initial evaluation index. Finally, we get 12 sub-indexes according to the three major indexes: “Safety”, “Smartness” and “Smoothness” and the evaluation index system and hierarchical relationship of the intelligent behavior of UGV are set up. Because the speed and smoothness of vehicles are related, we fuse the speed into the smoothness. For example, a uniform speed can reflect the speed of vehicles, and vehicles can run smoothly. If the vehicle undergoes frequent acceleration and brakes rapidly, then the vehicle loses its smoothness. The complexity of the natural environment perception and intelligent behavior decisions of UGVs are divided into different layers. The layer structure analysis is shown in Figure 3.
4.2. EAHP Method
The EAHP method is used to calculate the weight assignment of each evaluation index, and the EAHP is based on the extensible theory, structure judgment matrix by interval number instead of the point number. This overcomes the ambiguity problem of AHP in solving expert’s experience judgement choices, which does not need judge the consistency of the judgement matrix, and effectively avoids a lot of trial work in AHP. It is more reasonable to determine the weight of each evaluation index of the intelligent behavior of the UGV.
4.2.1. Construct the Extension Judgment Matrix
The process of establishing judgement matrix is a scalar process. This is the process of transforming all kinds of raw data into a directly comparable format through a certain scale system. The reciprocal 1–9 scale method [22] is used as a scalar method for the EAHP. Under a certain criterion, experts compare the relative importance of different evaluation indexes belonging to the same level of UGV. Construction of extension interval judgment matrix , i, j = 1, 2,…, n, and is an extension interval number, , is the upper and lower endpoints of the I row J column extension interval elements of the matrix.
4.2.2. Calculation of Comprehensive Extension Judgment Matrix and the Weight Vector
For an extension interval number judgment matrix , is the lower extreme point and the upper extreme point of the interval. The following steps are used to find the weight vector that satisfies the consistency conditions:
- (1)
- The normalized eigenvectors with positive components corresponding to the maximum eigenvalues of and are and .
- (2)
- The values of k and m are calculated by and :where, k and m are all positive real numbers of , .
- (3)
- Judge the consistency of the matrix. If , it shows that the consistency of the extension interval judgment matrix is better. However, when consistency is too low, measures should be taken to correct the judgement matrix or allow experts to re-judge until the requirements are met.
- (4)
- Finding the weight vector:where, is the extension interval weight vector of the k layer and the n factor on one of the factors of the upper layer.
4.2.3. Hierarchy Sorting
Set , , if (i ≠ j) is the degree of possibility of , then:
, . is a single order for a factor on the upper layer of the i factor on a layer. The obtained by normalization is a single sort weight vector of each factor relative to a factor on the upper layer. is the upper and lower endpoint of the extension interval number of two single layer weight vectors.
Calculated all , k is the number of layers, and h is the factor. When the order matrix is obtained:
If the rank weight vector of the layer to the total target is , then the synthetic sorting of all factors on the k layer for the total target is:
and in general, there are , is a single sort vector.
The factor of each level has a different importance level in the evaluation index system. The EAHP is therefore used to get a reasonable weight distribution of the evaluation system.
4.3. Quantitative Analysis Method for Driving Track of UGV
Part indexes of the UGV are evaluated by the quantitative analysis of the trajectory. Traffic safety includes lane keeping, obstacle avoidance safely, straight lanes, curved roads and complex lane keeping. In fact, this is achieved through controlling the driving path of the UGV. Static or dynamic obstacle avoidance and emergency obstacle avoidance are actually road changing processes. The quality of the change directly affects the intelligent behavior of the UGV. Path planning includes global path planning and local path planning. By comparing the actual driving path and the optimal path, we can evaluate the driving quality of the UGV. The control includes longitudinal control and lateral control, and the smooth trajectory includes the smoothness of the track, etc. In the process of lateral and longitudinal control of a UGV, there should be no sharp turning and unstable driving. Whether the change of displacement track of a UGV is smooth and reasonable or not also characterizes the intelligent behavior of the UGV. The Lyapunov index is calculated by comparison and analysis of the ideal trajectory with an actual trajectory to quantitatively evaluate the intelligent behavior of the UGV.
The quantitative analysis of the driving trajectory of an UGV needs to reconstruct the phase space of the time sequence of the deviations of the driving trajectory. First, the time data sequence is obtained from the deviation between the actual driving trajectory and the ideal trajectory. Then the phase space according to the deviation of time data sequence is reconstructed. Finally, the Lyapunov index of the time data sequence of the driving trajectory deviation is calculated.
4.3.1. Phase Space Reconstruction Using the C-C Method
“Phase space” refers to the space of all possible states of a system; every possible state of the system has a corresponding point of phase space. In order to fully reveal the information contained in the deviation time series of the trajectory and recover the attractor’s characteristics, C-C method is used to reconstruct the phase space [23].
For the time series , the appropriate time delay and the embedding dimension are selected, and the dimensional phase space is constructed:
- (1)
- The standard deviation of the time series of the driving trajectory deviation is calculated by , and selecting
- (2)
- The following three formulas are calculated:The time variable t takes the natural number less than 200, and , as follows:
- (3)
- Drawing according to the results of the calculation:
- (1)
- The first minimum value of is t and corresponding to the best time delay.
- (2)
- The first zero point t of is the best time delay t.
- (3)
- The minimum value t of the corresponding to the time window . The greater the trajectory deviation change from the actual trajectory corresponds to the ideal trajectory that made the phase space fuzzier and the dimensions larger.
The selection of time delay should not be independent of the embedding dimension. The time window function introduced by the C-C method can simultaneously determine the time delay and embedding dimension. The C-C method has the advantages of small calculation, easy operation, suitable for a nonlinear problem, reliable to the small data group, consistent effect and mutual information method, and strong anti-noise ability.
4.3.2. Calculation of the Lyapunov Index
According to chaos theory, if the largest Lyapunov index is negative it indicates that the motion of the system will eventually converge to a stable equilibrium point. If the largest Lyapunov index is zero it indicates that the motion of the system will eventually converge to a stable motion form. If the largest Lyapunov index is positive it indicates that the motion of the system will be chaotic. The value of the largest Lyapunov index also characterizes the speed of the system converging to a stable response. The reciprocal of the Lyapunov index is the largest predictability of the motion state of the system [23].
The wolf method is used to calculate the Lyapunov index of the time series of the driving trajectory deviation of the UGV:
- (1)
- The fast Fourier transform of the time series of the driving trajectory deviation of the UGV is calculated using the fast Fourier transform (FFT), and the average period of is calculated.
- (2)
- The time delay and the embedding dimension are calculated by the C-C method.
- (3)
- Reconstructing phase space according to time delay and embedded dimension .
- (4)
- Finding the nearest neighbor point of each point in the phase space and limit the transient separation, that is:
- (5)
- For each point in the phase space , the distance after the discrete time steps corresponding to the adjacent point is calculated:
- (6)
- For each , we calculate the average of all , that is:where, is the number of non-zero , the least-squares method is used to make the regression line. The slope of the straight line is the largest Lyapunov index of the time series of the driving trajectory deviation of the UGV.
4.3.3. Design Ideal Trajectory
In fact, evaluation indexes analysis is the quantitative analysis of the driving trajectory of the UGV. For example, traffic safety can be divided into lane keeping and safe obstacle avoidance. Control can be divided into lateral control and longitudinal control. Path planning can be divided into local path planning and global path planning. The evaluation of these indexes is an evaluation of the trajectory of the UGV. The method of chaos theory is used to quantify the driving trajectory of the UGV, so as to evaluate the intelligence level of the UGV. For the quantitative analysis and calculation, the actual trajectory and the ideal trajectory of the UGV are needed for the quantitative analysis calculation.
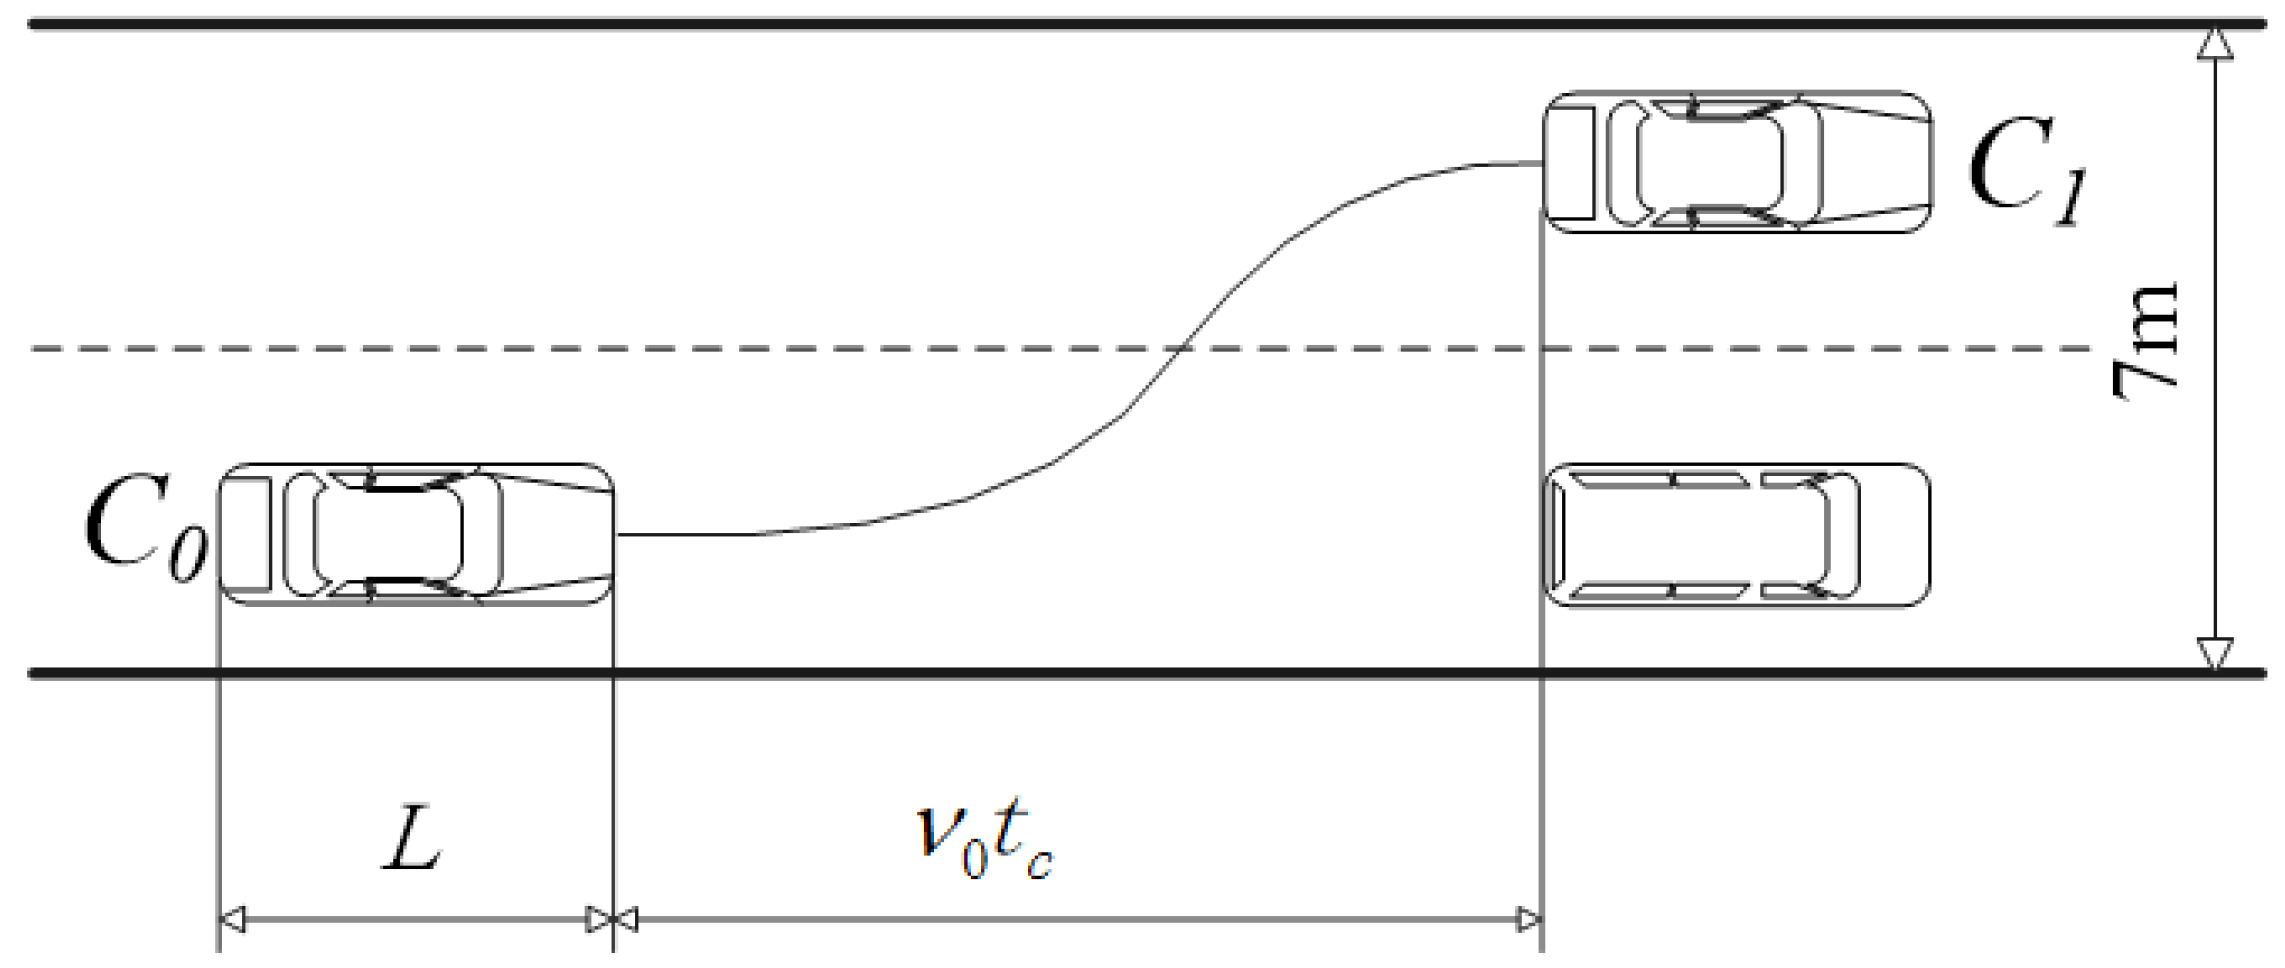
The actual trajectory of the UGV can be obtained through the combined location test technology, but for different scenarios and tasks, the ideal trajectory of the UGV is different. In this paper, the method of determining the ideal trajectory of the UGV is introduced by taking the static obstacle as an example. The test scenario is shown in Figure 4.
First, we collect the driving trajectory of an excellent driver’s vehicle and get the driving parameters of vehicle: displacement, speed, time, heading angle and front wheel deflection angle, so as to get the initial state and target state during vehicle driving.
According to the initial state and target state of the excellent driver’s driving, the UGV is planned to avoid the static obstacles to change the trajectory, so that the vehicle can reach the adjacent lane at the appointed time. We use the function to describe the track of lane changing, so we try to find a trajectory in a functional family. Its existence is restricted by the geometric structure of the road. It can fully describe the dynamic characteristics of the whole process from the initial location to the target location. Structural the family of functions of change path, a quintic polynomial is selected for the constructor of the lane changing trajectory:
The derivative with respect to time is:
The second derivative is:
The initial state and the target state of the lane changing of UGV are:
represent the longitudinal displacement, the longitudinal velocity, the longitudinal acceleration, the lateral displacement, the lateral velocity and the lateral acceleration of the vehicle. The longitudinal displacement and lateral displacement of the initial state are all 0. The lateral displacement of the target state is the width of the lane, the longitudinal displacement of the target state should consider the safety factors, and the safety distance between the moving vehicle and the static obstacle must be determined. The safety distance model based on headway [24] takes account not only of the speed of the vehicle but also the distance between vehicles. This model is simple and feasible. Therefore, this paper selects the safe distance model based on headway.
According to China’s “highway traffic management approach”, under normal circumstances, when the driving speed is about 100 km/h, the distance between vehicles should be more than 100 m. When the driving speed is about 70 km/h, the distance between vehicles is more than 70 m, so we calculate that the safe time distance is 3 to 4 s.
The test scenario in this paper is to avoid obstacles and change lanes. The front obstacles are stationary and the speed is zero, so the safe distance of lane change is:
where, is a safe spacing; is the initial vehicle speed; is the minimum safe spacing. Minimum safe spacing derived from [25] is the product of the speed difference between the front vehicle and back vehicle and the change time. This paper is to avoid static obstacles, so:
The safety distance to avoid static obstacles and change the path is:
Substituting into the initial and target states and rearranging according to Equation (10):
where:
where, is the initial time for the change of the path, and the is the target time of the change of the path.
Therefore, the trajectory design becomes the problem of satisfying the boundary conditions, A and B are obtained according to the boundary conditions. Finally, we get the quintic polynomial of x and y.
4.4. The Grey Relational Analysis Method
It is difficult to give the exact criteria for evaluation of some indexes of the intelligent behavior evaluation of UGVs. This is a typical grey system. Therefore, the EAHP and grey relational analysis method are applied to the intelligent behavior evaluation of UGVs, as they not only evaluate the individual evaluation index of intelligent behavior, but also a comprehensive evaluation can be carried out in combination with the indexes at all levels. Therefore, a more reasonable evaluation result can be obtained.
4.4.1. The Index Quantitative Standard
Some evaluation indexes of UGVs accord with the requirements of the grey relational analysis method. For example, information security is a guarantee of UGV information and personal privacy. The degree of cracking the communication, network, and privacy information are evaluated as the standard. Sensors are the main way for the vehicle to obtain information from the outside world. Sensor security is evaluated by testing the robustness of sensors and the degree of anti-interference, such as GPS deception, radar jamming, ultrasonic interference with gyroscopes and so on. Vehicle redundancy is very important for the reliability of the vehicles. When a vehicle suffers a sudden failure, the standby system can ensure that the vehicle can continue to travel safely. Redundancy is evaluated by the loading rates of systems such as the backup systems of operation, braking, steering, power supply, collision detection and collision planning of the UGV. The quality of environmental perception affects the accuracy of decision making. Visual perception is evaluated by the recognition accuracy of traffic signs, signal lights, lane lines, and objects. Radar perception is evaluated by perceiving the accuracy of the distance, speed, and the quality of the three-dimensional reconstruction of the external objects. Sound perception can be evaluated by the perceptual accuracy of traffic sound, special sound, and passenger voice commands. The UGV makes a decision by analyzing the perceived environment; evaluate the quality of decision-making by judging whether the decision of the overtaking, lane changing, steering or parking is correct. Interaction can be evaluated by the interaction of Vehicle to People (V2P), Vehicle to Vehicle (V2V), and Vehicle to Infrastructure (V2I). Vehicle stability can be evaluated by the distance of vehicle parking or the braking, whether there are any rapid acceleration and rapid deceleration in driving or setback and flameout in the starting process.
The expert group is composed of the members of the research group. With a full score 10 point system, based on the evaluation basis, the grey relational analysis method is used to evaluate the indexes of each UGV. The comprehensive score of each index is obtained. The intelligent behavior score of the UGVs are calculated by the grey relational analysis method.
4.4.2. Establishing Reference Series and Comparison Series
For the evaluation of the intelligent behavior of the UGV, each index of each UGV that can reflect the level of intelligence constitute a comparative series, it is:
where i = 1, 2, …, n represents the number of UGVs participating in the competition. j = 1, 2, …, m indicates the number of indexes in each vehicle.
When the grey relational analysis method is used for comprehensive evaluation, the evaluation criterion is the best value of each index (the bigger the index is, the better the index will be. The maximum value of the index of the intelligent behavior of each vehicle is taken. The smaller the index is, the better the index will be. The minimum value of the index of the intelligent behavior of each entry vehicle is taken.). The reference series is recorded as:
Because there are different orders of magnitude among the evaluation indexes, so there is a need for dimensionless indexes:
4.4.3. Calculation of the Correlation Coefficient of Reference Series
According to the grey system theory, the correlation coefficient of the comparison series for the reference series on the index is:
In the Equation ; is the first minimum difference, is the second minimum difference, is the second maximum difference. is the resolution coefficient, and its function is to improve the difference between the correlation coefficients. It is selected between 0–1, usually 0.5.
4.4.4. Calculate Correlation Degree of Comprehensive Evaluation
In order to evaluate the intelligent behavior of an UGV in a holistic manner, it is necessary to concentrate on the correlation coefficient of the individual evaluation indexes of the participating vehicles. The value of the correlation degree is obtained. The correlation degree is , and its expression is:
where, is the weight of each index of the participating vehicles. Using Equation (28), the overall correlation degree of the intelligent behavior of each participating vehicle can be obtained. The greater the value of is, the better the level of intelligent behavior of the participating vehicles. The three correlation degree of each participating vehicle is obtained. Integrated three evaluation weights and the total score is:
5. Experimental Verification
The ninth “Further Challenge” (FC’2017) focuses on investigating the ability of traffic scene recognition, adaptability of different road environment and mobility of UGVs (i.e., Safety, Smoothness, Sharpness, and Smartness). The competition is carried out in a real environment, including two parts: urban and rural road testing and an elevated road test. There are test items such as traffic signs, marking recognition, non-motor vehicle mixing, pedestrian avoidance, satellite navigation signal missing, rural road, traffic flow and simulation toll station, comprehensive testing the ability of environment perception and intelligent decision of UGV. The data of a convoy of the competition are now taken as an example to introduce the test and evaluation process of the UGV.
5.1. Data Acquisition of the Driving Track of an UGV
The global positioning system (GPS) and inertial navigation system is used to collect position and posture information of the vehicle, the driving parameters of the UGV are obtained by high precision combined positioning test technology. The driving trajectory of the UGV is .
5.2. Quantitative Analysis
In this paper, the quantitative process of an UGV driving trajectory is introduced by an example of obstacle avoidance. We have found an excellent driver who has been driving for 10 years. He has hardly had a traffic accident and has had fewer than five traffic violations. An excellent driver’s driving trajectory is collected for the static obstacle avoidance, as shown in Figure 5. The process of vehicle lane changing can be seen intuitively by the figure, and the driving parameters such as lateral displacement and longitudinal displacement can be easily obtained.
According to the driving trajectory of obstacle avoidance for the excellent driver’s driving we get the initial state (the initial displacement, velocity, and acceleration of x-direction and y-direction,) and target state (the final displacement, velocity, and acceleration of x-direction and y-direction). The ideal trajectory of obstacle avoidance for a UGV is planned by the quintic polynomial method using Equations (21) and (22). As shown in Figure 5 on the dotted line.
The ideal trajectory of a UGV for obstacle avoidance is calculated as shown in Figure 5. The graph shows that the curvature of the ideal trajectory is continuous, without changes, and the curvature of the start and the end of the lane change is zero. By comparison, it can be seen that the ideal trajectory is smoother than the driving trajectory. Collecting the actual driving trajectory of UGV (see Figure 6), the deviation time series of the actual driving trajectory and the ideal trajectory are calculated.
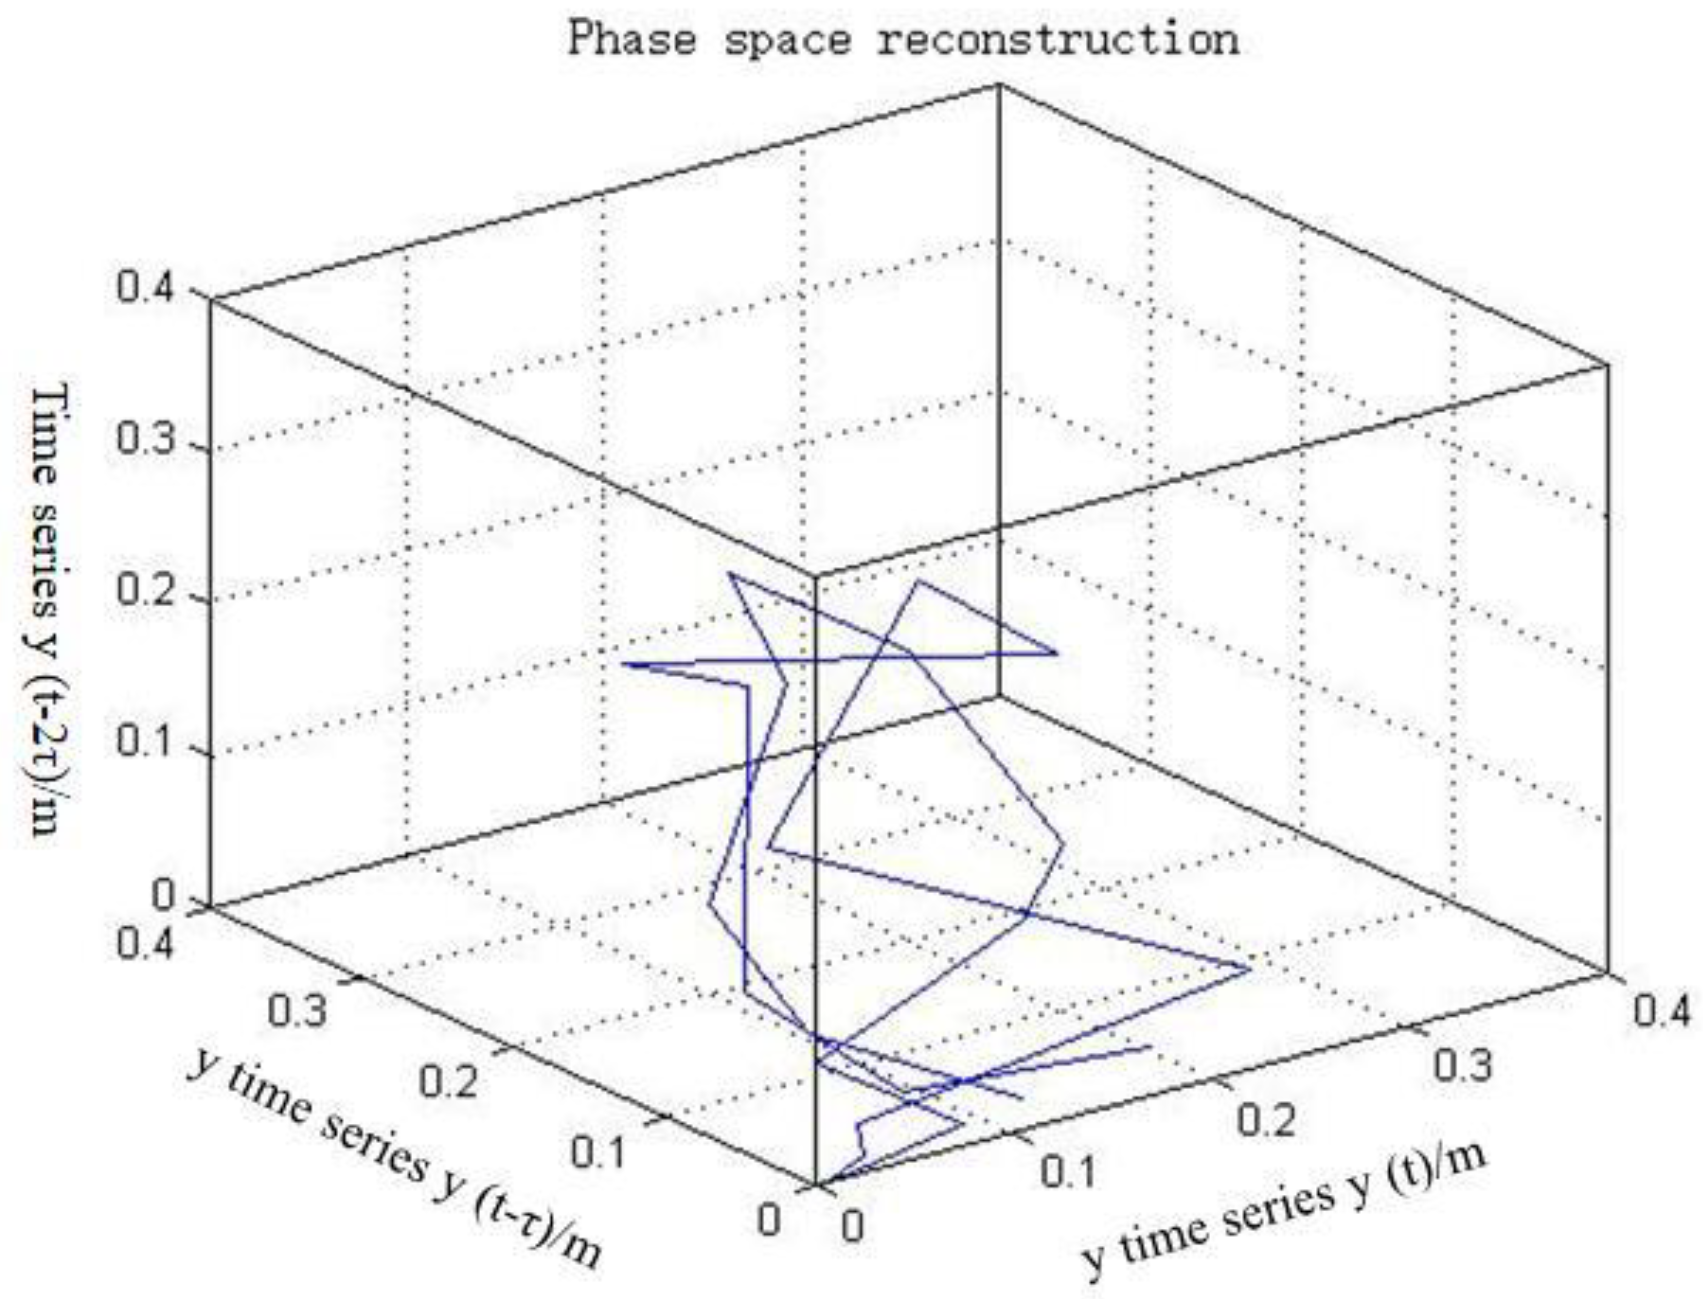
The C-C method [23] is used to determine the time delay (see Figure 7) and the embedding dimension of deviation time series of the actual trajectory and the ideal trajectory of the UGV, so as to realize the reconstruction of the phase space of the deviation time series (see Figure 8).
According to the mutual information method in [23], the amount of mutual information of the first minimum point of the curve in Figure 7 is smaller the beginning of the folding can be distinguished clearly. Therefore, the dynamic characteristics of the attractor can be quantitatively and qualitatively analyzed by reconstructing the phase space. According to the curve in Figure 7, the first minimum point is the τ, τ = 2, and the embedding dimension is calculated by the C-C method, m = 9. Finally, the Lyapunov index of the UGV for obstacle avoidance is calculated. It is 11.9088.
The Lyapunov index of the trajectory of an UGV for obstacle avoidance is positive. This indicates that the process of obstacle avoidance for the UGV is chaotic. The size of the Lyapunov index represents the speed of response of converging to the steady state. The reciprocal of the Lyapunov index represents the maximum prediction time for the motion state of the UGV. The larger the Lyapunov index, the greater the chaos and the shorter the maximum prediction time of the system. The trajectory quality of UGV and can be directly quantified by the Lyapunov index.
5.3. Comprehensive Evaluation of Intelligent Behavior
5.3.1. Determine the Weight Coefficient of Each Index
According to the evaluation indexes of comprehensive evaluation model (see Figure 3) of the intelligent behavior of the UGV, the extension interval number judgment matrix was constructed. Each team is evaluated by 10 experts in the field of UGVs based on the quality of completing the task. Table 2 is the matrix given by the expert group.
Because of , so the consistency of the extension interval judgment matrix is better.
According to Figure 1, a comparison of each layer the extension interval judgment matrix is obtained, and then the weight coefficients of each index are determined. The weight of the indexes of evaluation aspect is shown in Table 3 (only taking the weight determination of evaluation aspect as an example).
According to Equation (2):
According to Equation (3):
The weight of the three evaluation indexes to the total target layer can be obtained by the normalization treatment:
By analogy, other indexes are calculated step by step. The result is shown in Table 3. Thus, EAHP with interval numbers instead of the point number is used to structure the judgment matrix, combine the weight vector solution and matrix consistency test, and consider the fuzziness of people’s judgment and the practical experience of many decision-makers, satisfying the requirements of consistency and no requiring more consistency checks. This can not only guarantee the authenticity of the judgment result of the expert, but also guarantee the consistency of the judgment matrix, and make the judgment matrix more reasonable. The problem that the judgment matrix of AHP is inelastic and need consistency check is solved. The factor of each level has a different importance level in the evaluation index system. The EAHP is therefore used to get a reasonable weight distribution of the evaluation system.
5.3.2. Comprehensive Evaluation of Grey Relational Analysis Method
Because of the environment perception index is more complex, it cannot be quantified by a single factor, and it needs to be divided into several secondary indexes to evaluate and analyze. The weight of each index is calculated by EAHP and the grey relational analysis method is used to analyze and evaluate each index. Weight and analysis results are shown in Table 4.
Put the evaluation results in Table 3. According to the score assignment method in the quantitative standard, the evaluation matrix of each index (see Table 3) is obtained, and grey relational analysis method is used to make a comprehensive evaluation of each scoring matrix. The process of evaluation is as follows:
The comparison series of the evaluation value of the smartness evaluation index for each UGV is:
According to the theory of grey relational analysis method, the reference (optimal) series are selected as follows:
According to the Equation (26), the data of the comparison series and the reference series are processed without dimension, as follows:
According to the Equation (28) the correlation coefficients for each index of the reference series are calculated by each comparison series:
The weight of each factor in smartness is obtained from Table 4 as follows:
According to the Equation (29), the scored of smartness of each vehicle is as follows:
If the full score is 100, the scores of each vehicle are:
In accordance with the above methods, the scored of the safety of each vehicle is as follows:
If the full score is 100, the scores of each vehicle are:
The scored of smoothness as follows:
If the full score is 100, the scores of each vehicle are:
The score of each vehicle is:
According to the Equation (30) and the weight , the total score of each UGV as follows:
The competition results of FC’2017 are shown in Table 5.
From the scores of the evaluation elements of Vehicle 1, it can be seen that the smartness and the smoothness are high enough to meet the competition requirement, but the safety is low. For Vehicle 3, the safety and smoothness are able to meet the competition requirement, but the smartness is low. For Vehicle 2, the smoothness grudgingly meets the competition requirement, but the smartness and the safety are low.
Table 5 shows the total scores and rank of Vehicle 1, Vehicle 2 and Vehicle 3. The total score is the quantitatively evaluated result. The higher the total score is, the better is the overall technical performance of the UGV. The intelligence level of Vehicle 1 is high enough to meet the competition requirement because of the relatively high total score. However, the safety is low. Therefore, the problems and deficiencies in this aspect should be found and the corresponding technologies improved. The experiment results show that the proposed EAHP method and grey relational analysis method can quantitatively evaluate the overall technical performance and individual technical performance of an UGV.
6. Conclusions
An UGV test content and test environment are designed, according to the complexity of natural environment perception and intelligent decision-making, the test contents are divided into four layers: environmental perception, decision, control, intelligent interaction, and navigation; simple and complex test scenarios are designed. Through the analysis of the relationship between the test environment and the intelligent behavior of the UGV, the definition and classification of test environment elements are studied, and a test environment model is established. Based on the traffic environment factors, driving environment factors, road environment factors, natural environment factors, and audio-visual environment factors, a multilevel design method for the testing environment based on complexity is proposed. A more reasonable test content and test environment for the UGV are designed.
An intelligent behavior evaluation method of UGVs is proposed. The perception of natural environment and complexity of intelligent behavior decision are hierarchical for evaluation. The index evaluation system has been set up. By using EAHP, the weight of “Safety”, “Smartness” and “Smoothness” is 0.52, 0.35 and 0.13. The Lyapunov index of the static obstacle avoidance of the UGV is calculated by chaos theory. The result is 11.9088. According to the evaluation system, the index of the UGV is evaluated. Quantitative analysis of each evaluation index of the intelligent behavior of the UGV by grey relational analysis method, not only the individual evaluation index of intelligent behavior can be evaluated, but also the comprehensive evaluation can be evaluated. And the comprehensive score of each UGV is 84.39, 60.70 and 67.02. According to the score, the UGVs are ranked as follows: Vehicle 1 is the first, Vehicle 3 is the second, and Vehicle 2 is the third. New ideas and new methods are proposed for the evaluation of the intelligent behavior of UGVs.
Compared with other test systems for UGVs, the proposed system has some strengths. First, this system is more complete as it includes the test contents, the test environment, the test methods and the evaluation method. Second, it can quantitatively evaluate the individual modules and the overall technical performance of UGVs. Third, it is much more concerned about the quality of UGVs to complete the task. This system can help to evaluate scientifically the key technologies and abilities of UGVs.
The described methodology is most suitable for testing UGVs, however, it can also be used by other researchers and UGV performance testers with a few adjustments. For example, in the analysis of the test requirements, combining different targets, the matching environmental factors can be chosen. Based on the combination of different complexity elements and compositions, the various environments can be set up. Moreover, the corresponding test content, test method and evaluation method can be adopted according to the process described in this paper.
Author Contributions
Y.S. conceived the idea behind this research, designed the test content and test environment; H.Y. researched the evaluation method, performed the simulations and wrote the paper; F.M. collected the experimental data and calculation.
Funding
This work was supported by the Natural Science Foundation of Hebei Province (No. F2016402106) and Department of Education of Hebei Province (No. QN2015129).
Conflicts of Interest
The authors declare no conflict of interest.
References
- Xi, L.; Zhang, X.; Sun, C.; Wang, Z.; Hou, X.; Zhang, J. Intelligent Energy Management Control for Extended Range Electric Vehicles Based on Dynamic Programming and Neural Network. Energies 2017, 10, 1871. [Google Scholar] [CrossRef]
- Vidhi, R.; Shrivastava, P.; Sciubba, E. A Review of Electric Vehicle Lifecycle Emissions and Policy Recommendations to Increase EV Penetration in India. Energies 2018, 11, 483. [Google Scholar] [CrossRef]
- Urmson, C.; Baker, C.; Dolan, J.; Rybski, P.; Salesky, B.; Whittaker, W.L.; Ferguson, D.; Darms, M. Autonomous driving in traffic: Boss and the urban challenge. AI Mag. 2009, 30, 17–29. [Google Scholar] [CrossRef]
- Krotkov, E.; Fish, S.; Jackel, L.; McBride, B.; Perschbacher, M.; Pippine, J. The DARPA Percept OR evaluation experiments. Auton. Robot. 2007, 22, 19–35. [Google Scholar] [CrossRef]
- Behringer, R.; Sundareswaran, S.; Gregory, B.; Elsley, R.; Addison, B.; Guthmiller, W.; Daily, R.; Bevly, D. The DARPA grand challenge development of an autonomous vehicle. In Proceedings of the 2004 IEEE Intelligent Vehicles Symposium, Parma, Italy, 14–17 June 2004; pp. 226–231. [Google Scholar]
- Sun, Y.; Xiong, G.; Song, W.; Gong, J.; Chen, H. Test and evaluation of autonomous ground vehicles. Adv. Mech. Eng. 2014, 2014. [Google Scholar] [CrossRef]
- Miller, I.; Lupashin, S.; Zych, N.; Moran, P.; Schimpf, B.; Nathan, A.; Garcia, E. Cornell University’s 2005 DARPA grand challenge entry. J. Field Robot. 2006, 23, 625–652. [Google Scholar] [CrossRef]
- Junqing, W.; Dolan, J.M. A robust autonomous freeway driving algorithm. In Proceedings of the 2009 IEEE Intelligent Vehicles Symposium, Xi’an, Shaanxi, China, 3–5 June 2009; pp. 1015–1020. [Google Scholar]
- Rui, L. Research on Path Tracking Algorithm and Lower Control System for Intelligent Vehicle; Beijing University of Technology: Beijing, China, 2013. [Google Scholar]
- Wildermuth, D.; Wolf, H. Professional ground robotic competitions from an educational perspective: A consideration using the example of the European land robot trial (ELROB). In Proceedings of the 2012 6th IEEE International Conference Intelligent Systems, Sofia, Bulgaria, 6–8 September 2012; pp. 399–405. [Google Scholar]
- Geiger, A.; Lauer, M.; Moosmann, F.; Ranft, B.; Rapp, H.; Stiller, C.; Ziegler, J. Team Annie WAY’s entry to the Grand Cooperative Driving Challenge 2011. IEEE Trans. Intell. Transp. Syst. 2012, 13, 1008–1017. [Google Scholar] [CrossRef]
- Lauer, M.; Gerrits, A. Next steps for the grand cooperative driving challenge: ITS Events. IEEE Intell. Transp. Syst. Mag. 2009, 1, 24–32. [Google Scholar] [CrossRef]
- Yang, S.; He, Y. Grading unmanned ground vehicles in terms of intelligence. Sci. Technol. Rev. 2017, 35, 80–83. [Google Scholar]
- Sun, Y.; Xiong, G.M.; Chen, H.Y.; Wu, S.B.; Gong, J.W.; Jiang, Y. A cost function-oriented quantitative evaluation method for unmanned ground vehicles. Adv. Mater. Res. 2011, 301–303, 701–706. [Google Scholar] [CrossRef]
- Sun, Y.; Tao, G.; Xiong, G.; Chen, H. The FUZZY-AHP evaluation method for unmanned ground vehicles. Appl. Math. Inf. Sci. 2013, 7, 653–658. [Google Scholar] [CrossRef]
- Xiong, G.; Zhao, X.; Liu, H.; Wu, S.; Gong, J.; Zhang, H.; Tan, H.; Chen, H. Research on the Quantitative Evaluation System for Unmanned Ground Vehicles. In Proceedings of the 2010 IEEE Intelligent Vehicles Symposium, University of California, San Diego, CA, USA, 21–24 June 2010; pp. 523–527. [Google Scholar]
- Feng, Y.X.; Gao, Y.C.; Song, X.; Tan, J. Equilibrium Design Based on Design Thinking Solving: An Integrated Multicriteria Decision-Making Methodology. Adv. Mech. Eng. 2013, 5. [Google Scholar] [CrossRef]
- Vaidya, O.S.; Kumar, S. Analytic hierarchy process: An overview of applications. Eur. J. Oper. Res. 2006, 169, 1–29. [Google Scholar] [CrossRef]
- Chen, H.Y.; Xiong, G.M.; Gong, J.W.; Jiang, Y. Introduction to Self-Driving Car; Beijing Institute of Technology Press: Beijing, China, 2014; pp. 32–64. [Google Scholar]
- Chen, Y.; Mei, Y.; Yu, J.; Su, X.; Xu, N. Three-dimensional unmanned aerial vehicle path planning using modified wolf pack search algorithm. Neurocomputing 2017, 266, 445–457. [Google Scholar]
- Liu, Y.; Xu, W.; Dobaie, A.M.; Yan, Z. Autonomous road detection and modeling for UGVs using vision-laser data fusion. Neurocomputing 2018, 275, 2752–2761. [Google Scholar] [CrossRef]
- Saaty, T.I. The Analytic Hierarchy Process; McGraw Hill Inc.: New York, NY, USA, 1980. [Google Scholar]
- Lv, J.H.; Lu, J.A.; Chen, S.H. Analysis and Application of Chaotic Time Series; Wuhan University Press: Wuhan, China, 2002. [Google Scholar]
- Li, K.Q.; Wang, Y.J.; Gao, F. Driving assistant system based on ITS. J. Jiangsu Univ. 2005, 26, 294–297. [Google Scholar]
- You, F. Study on Autonomous Lane Changing and Autonomous Overtaking Control Method of Intelligent Vehicle. Ph.D. Thesis, Jilin University, Changchun, China, 2005. [Google Scholar]
Figure 1.
Test environment design.
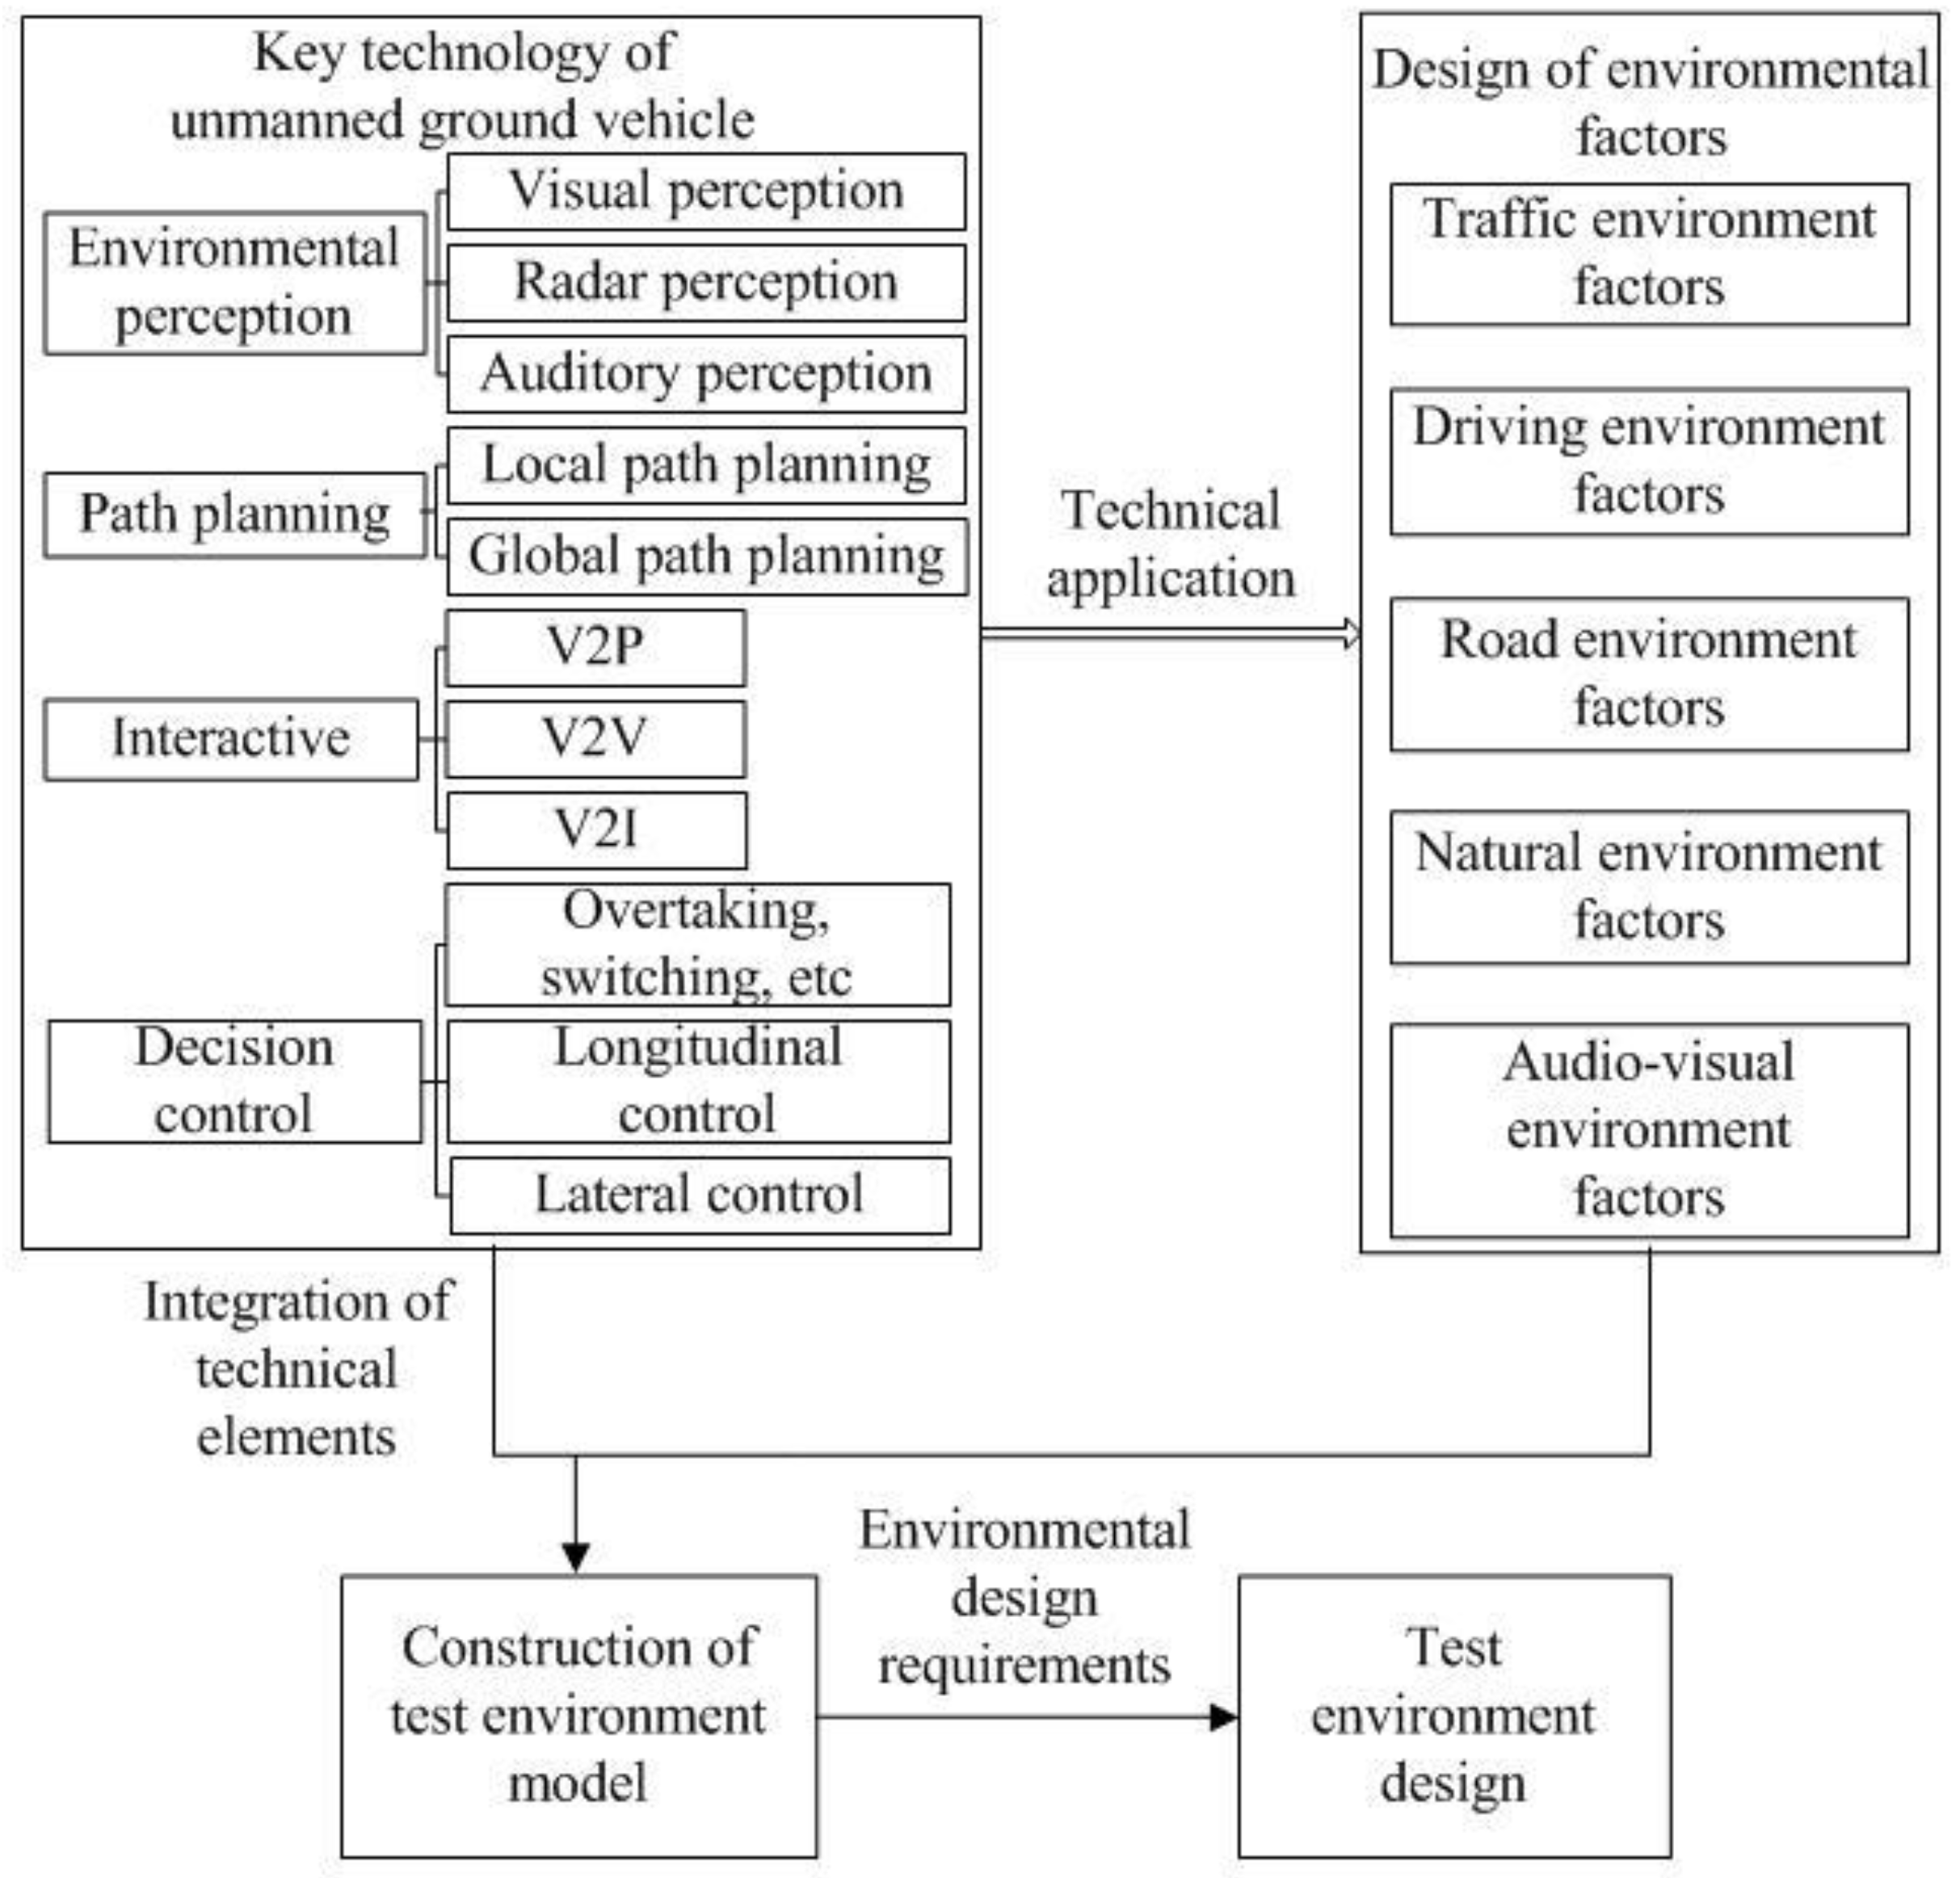
Figure 2.
Construction of test environment model.
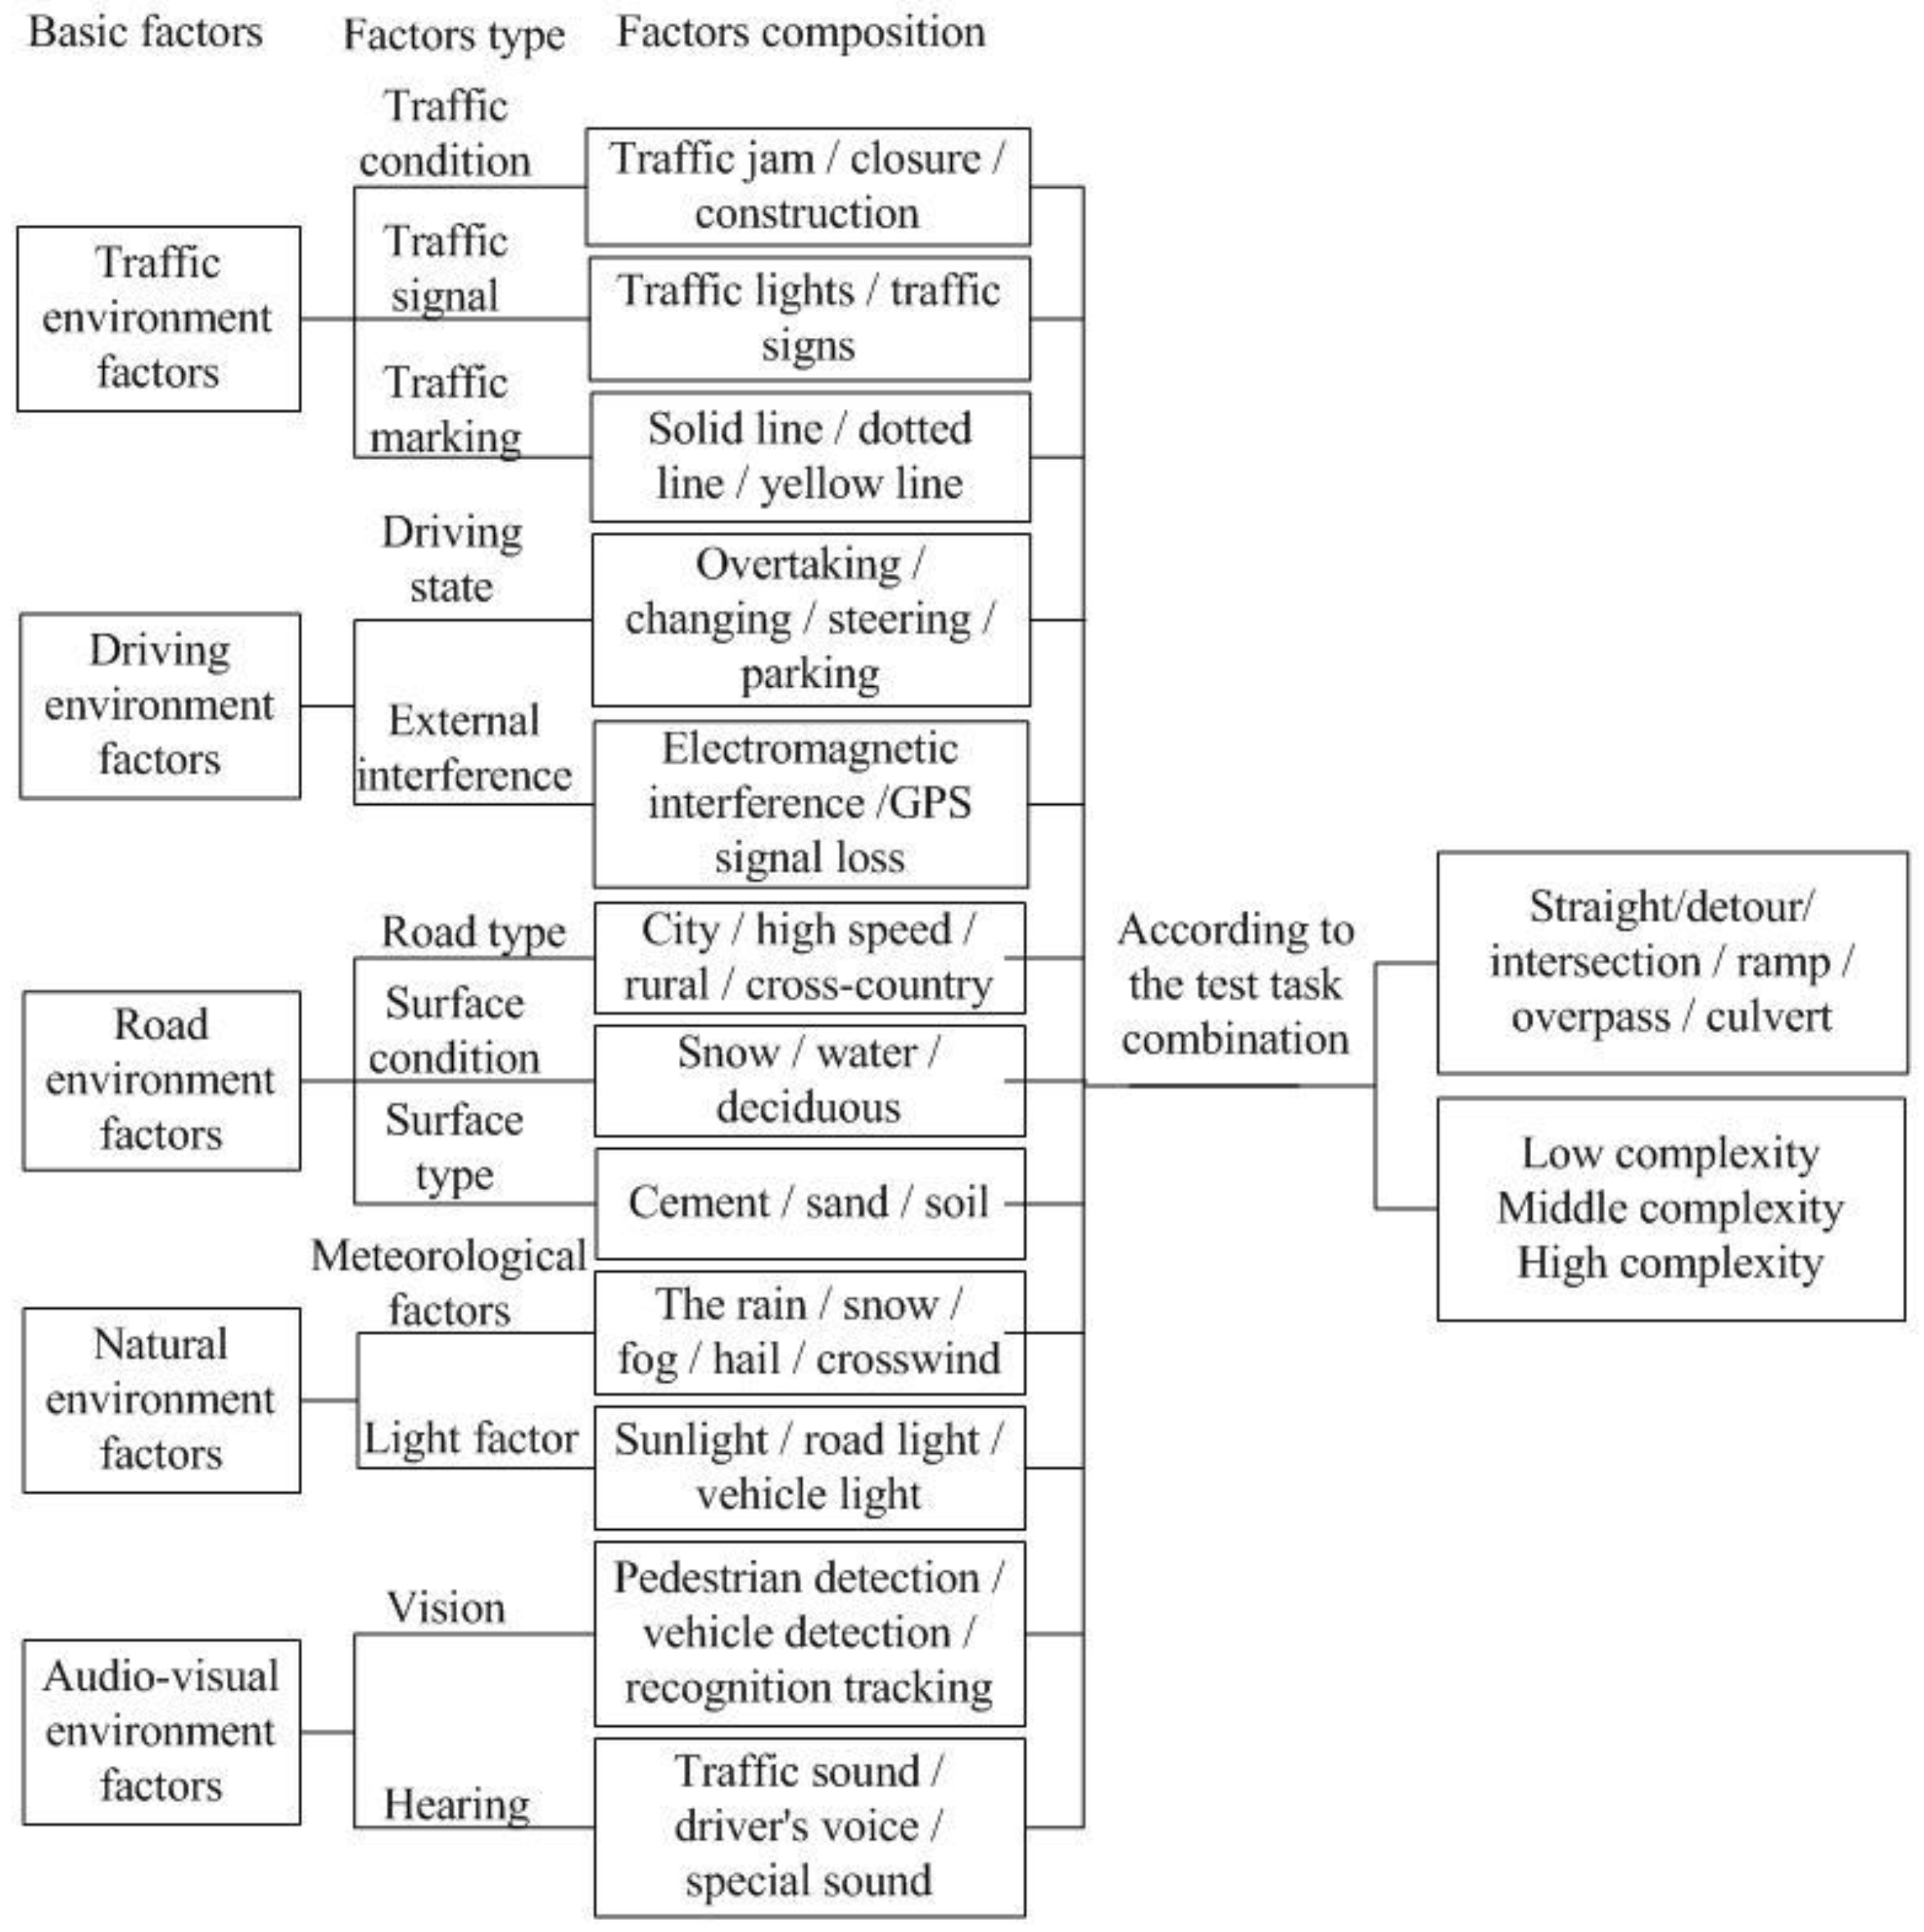
Figure 3.
Intelligent behavior evaluation index of unmanned ground vehicles (UGVs).

Figure 4.
Static obstacle avoidance scene.

Figure 5.
Path of static obstacle avoidance.
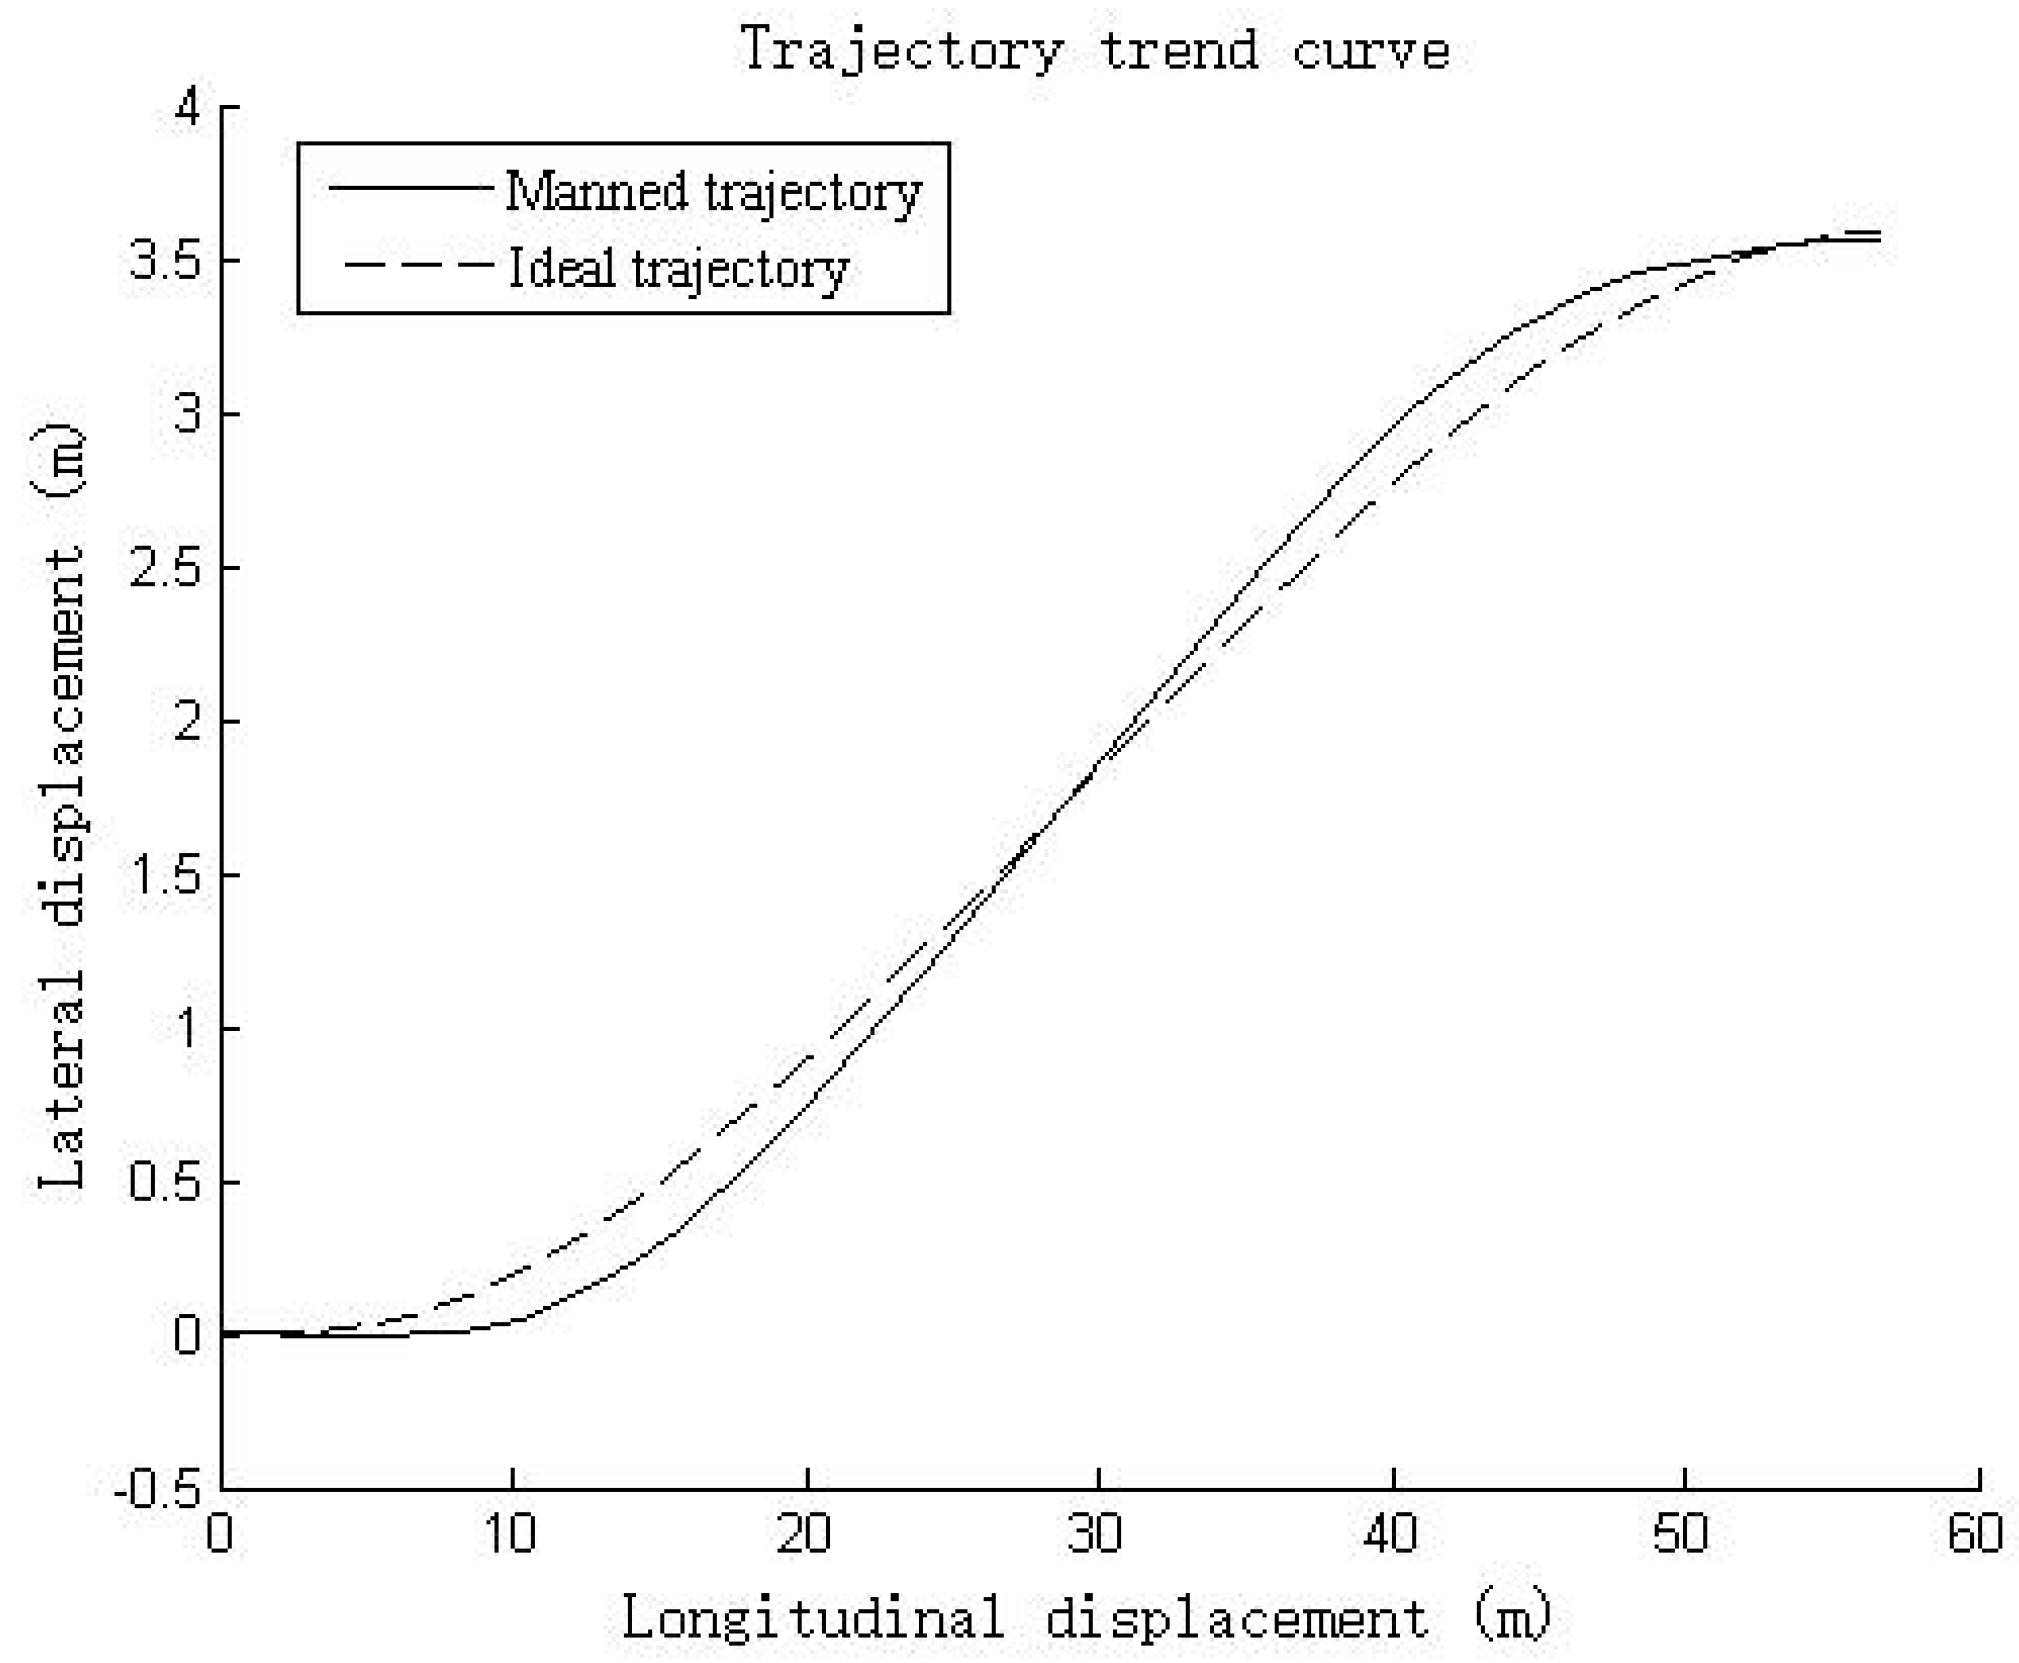
Figure 6.
The actual driving trajectory.

Figure 7.
The time delay of deviation time series.
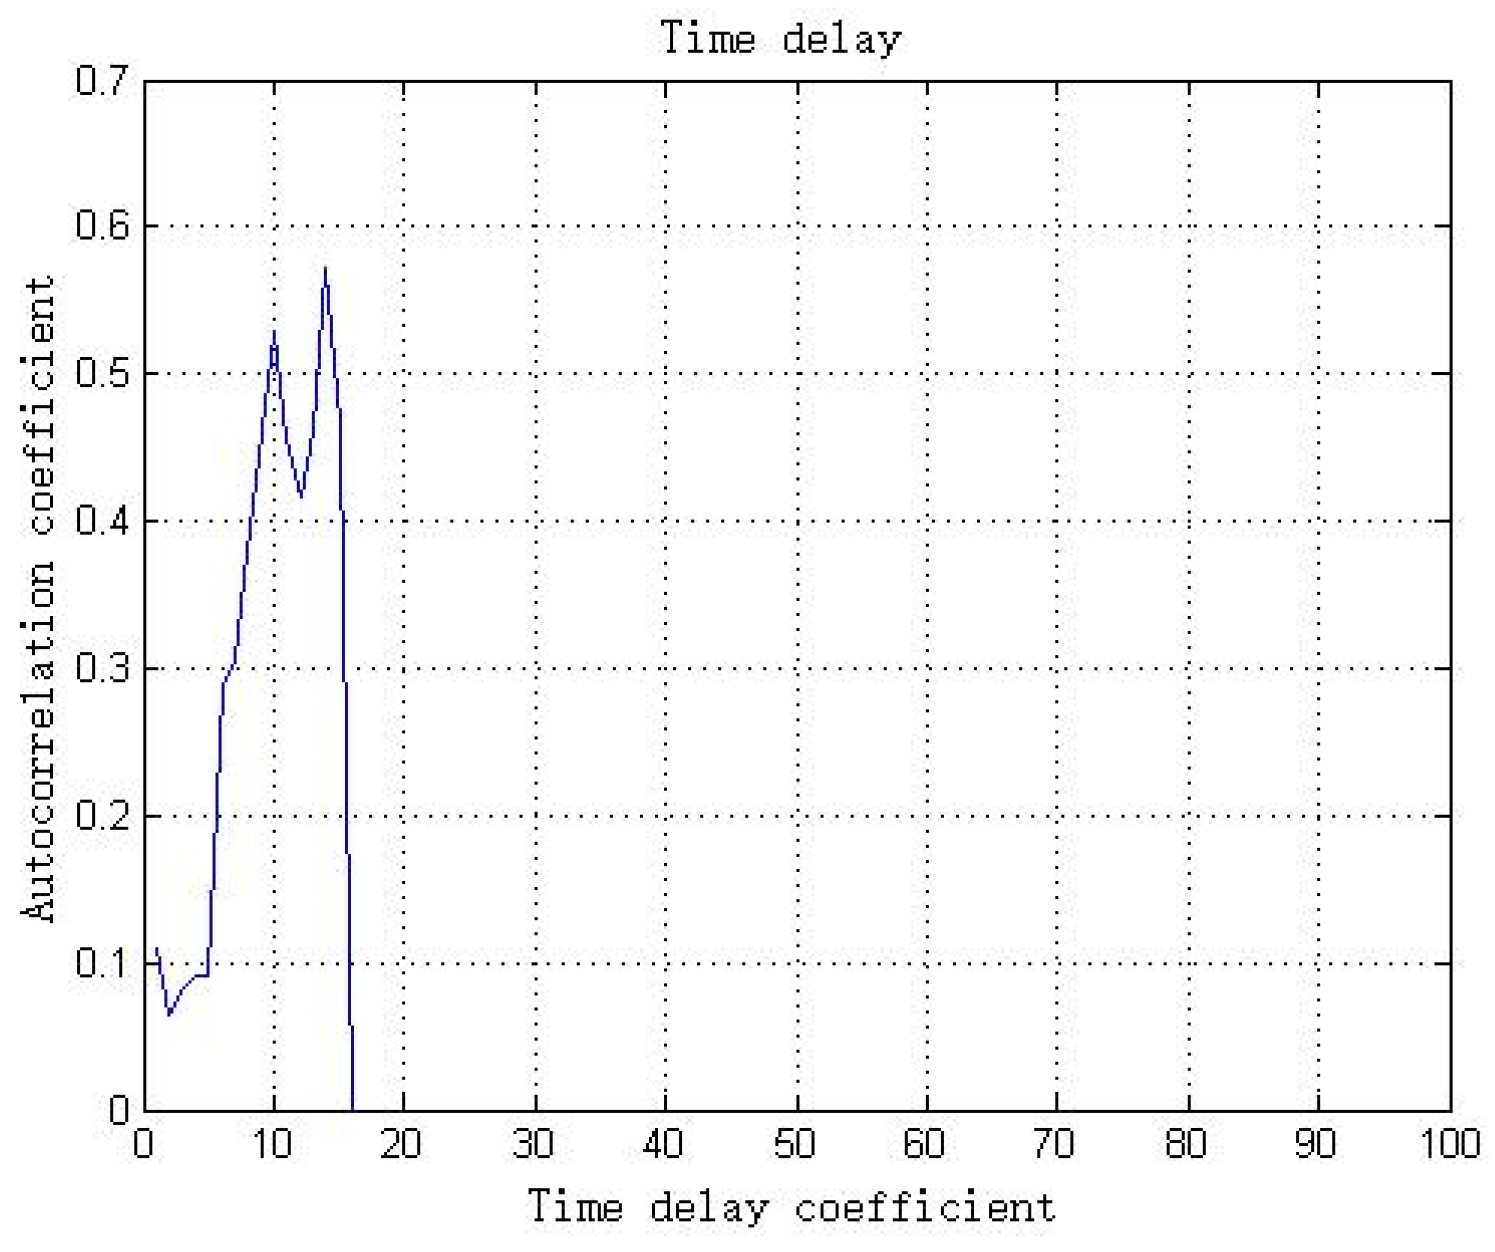
Figure 8.
Phase space of the deviation time series.

Table 1.
Design of unmanned ground vehicle (UGV) test content scene (global positioning system (GPS)).
Table 1.
Design of unmanned ground vehicle (UGV) test content scene (global positioning system (GPS)).
| Test content | Test Layer | Simple Scene | Complex Scene |
| Environmental perception | Traffic sign recognition | Understanding of traffic signs | |
| Lane line recognition | Object tracking | ||
| Object recognition | Target distance and velocity perception | ||
| Whistle perception | Map drawing | ||
| Decision control | Straight | Overtaking, switching | |
| Turn | Static dynamic obstacle avoidance | ||
| Accelerate | Emergency obstacle avoidance | ||
| Stop | Complex lane keeping | ||
| Intelligent interaction | Passenger interaction | Pedestrian interaction | |
| Location sharing | Environmental interaction | ||
| Information sharing | Traffic equipment interaction | ||
| Single car interaction | Multi vehicle interaction | ||
| Navigation | Simple path planning | Complex path planning | |
| Optimal path | Special weather navigation | ||
| Complete only by GPS | GPS signal loss | ||
| Straight navigation | Road, off-road navigation |
Table 2.
Weight coefficient determination of target layer.
| Evaluation Aspect | Smartness | Safety | Smoothness | Single Layer Weight |
|---|---|---|---|---|
| Smartness | <1, 1> | <1, 1.5> | <1.5, 2> | 0.52 |
| Safety | <0.6667, 1> | <1, 1> | <1, 2> | 0.35 |
| Smoothness | <0.5, 0.6667> | <0.5, 1> | <1, 1> | 0.13 |
Table 3.
The ninth “Further Challenge” (FC’2017) comprehensive evaluation of a team.
| Evaluation Aspect | Evaluation Factor | Quantitative Results V | ||||||
|---|---|---|---|---|---|---|---|---|
| k | uk | ak | j | uj | j | Assignment Matrix | ||
| Vehicle C1 | Vehicle C2 | Vehicle C3 | ||||||
| 1 | Smartness | 0.52 | 1 | Environmental perception | 0.47 | 8 | 6 | 5 |
| 2 | Path planning | 0.18 | 1.25 | 3.54 | 2.33 | |||
| 3 | Decision | 0.1 | 4.5 | 4 | 6 | |||
| 4 | Control | 0.1 | 2.15 | 1.73 | 2.82 | |||
| 5 | Interactive | 0.15 | 7 | 3.5 | 5.5 | |||
| 2 | Safety | 0.35 | 1 | Traffic safety | 0.55 | 2.33 | 2.45 | 1.55 |
| 2 | Information safety | 0.31 | 5 | 5 | 4 | |||
| 3 | Sensor safety | 0.08 | 5.5 | 6 | 3.5 | |||
| 4 | Redundancy | 0.06 | 4 | 3 | 3.5 | |||
| 3 | Smoothness | 0.13 | 1 | Smooth start | 0.2 | 4 | 4.5 | 3.5 |
| 2 | Smooth speed | 0.46 | 6.5 | 5.5 | 6 | |||
| 3 | Smooth brake | 0.13 | 7 | 6.5 | 5.5 | |||
| 4 | Smooth trajectory | 0.21 | 1.32 | 4.53 | 2.66 | |||
Table 4.
Comprehensive evaluation of environmental perception.
| Aspect | Element | ak | Factor | j | Matrix | Results | ||||
|---|---|---|---|---|---|---|---|---|---|---|
| C1 | C1 | C2 | C1 | C2 | C3 | |||||
| Environmental perception | Visual perception | 0.42 | Traffic sign recognition | 0.35 | 7.5 | 6 | 6.5 | 0.82 | 0.58 | 0.52 |
| Traffic signal lamp recognition | 0.28 | 7 | 8 | 7.5 | ||||||
| Lane line recognition | 0.22 | 7 | 6.5 | 8 | ||||||
| Object recognition | 0.15 | 8.5 | 7.5 | 7.5 | ||||||
| Radar perception | 0.38 | Target distance perception | 0.3 | 8 | 7 | 6.5 | ||||
| Target speed perception | 0.3 | 8.5 | 6.5 | 7.5 | ||||||
| Obstacle perception | 0.25 | 7.5 | 8 | 6 | ||||||
| 3D reconstruction | 0.15 | 6 | 5.5 | 6 | ||||||
| Sound perception | 0.2 | Traffic sound | 0.33 | 7 | 6.5 | 6 | ||||
| Special sound | 0.36 | 8 | 7.5 | 7 | ||||||
| Voice command | 0.31 | 7 | 7.5 | 7 | ||||||
Table 5.
Competition Results in FC’2017.
| Vehicle | Smartness | Safety | Smoothness | Total Score | Rank |
|---|---|---|---|---|---|
| Vehicle 1 | 93.35 | 66.68 | 96.20 | 84.39 | 1 |
| Vehicle 2 | 56.32 | 62.17 | 74.25 | 60.70 | 3 |
| Vehicle 3 | 57.51 | 78.22 | 74.92 | 67.02 | 2 |
© 2018 by the authors. Licensee MDPI, Basel, Switzerland. This article is an open access article distributed under the terms and conditions of the Creative Commons Attribution (CC BY) license (http://creativecommons.org/licenses/by/4.0/).
Share and Cite
MDPI and ACS Style
Sun, Y.; Yang, H.; Meng, F. Research on an Intelligent Behavior Evaluation System for Unmanned Ground Vehicles. Energies 2018, 11, 1764. https://doi.org/10.3390/en11071764
AMA Style
Sun Y, Yang H, Meng F. Research on an Intelligent Behavior Evaluation System for Unmanned Ground Vehicles. Energies. 2018; 11(7):1764. https://doi.org/10.3390/en11071764
Chicago/Turabian StyleSun, Yang, He Yang, and Fei Meng. 2018. "Research on an Intelligent Behavior Evaluation System for Unmanned Ground Vehicles" Energies 11, no. 7: 1764. https://doi.org/10.3390/en11071764
Note that from the first issue of 2016, this journal uses article numbers instead of page numbers. See further details here.