Article

Experimental Assessment of the Energy Performance of a Double-Skin Semi-Transparent PV Window in the Hot-Summer and Cold-Winter Zone of China

1
College of Architecture and Environment, Sichuan University, Chengdu 610065, China
2
Institute of New Energy and Low-Carbon Technology, Sichuan University, Chengdu 610065, China
3
Department of Architecture and Built Environment, Faculty of Engineering, The University of Nottingham, University Park, Nottingham NG7 2RD, UK
*
Author to whom correspondence should be addressed.
Energies 2018, 11(7), 1700; https://doi.org/10.3390/en11071700
Submission received: 11 May 2018 / Revised: 20 June 2018 / Accepted: 25 June 2018 / Published: 1 July 2018
(This article belongs to the Special Issue Building renewable energy and thermal energy storage system 2018)

Abstract

:
The energy performance of the semi-transparent PV (STPV) window was carried out in a hot-summer and cold-winter zone of China. Semi-transparent PV (STPV) windows generate electric, reduce the heating load and aim to utilize daylighting efficiently. In order to analyze the energy performance of semi-transparent windows, a comparison test rig was set up which includes two test rooms of the same size. One room was installed with the STPV window and the other with a conventional window. The lighting, thermal, and electrical performance of STPV window was tested and compared with those of conventional window in the same ambient environment. It was observed that the maximum power generation of the STPV (a-SiGe) window was 33.3 W/m2 on a typical sunny day. Compared with the conventional windows, the average solar heat gain (SHGC) and Uvalue of STPV windows were 0.15 and 1.6, respectively, which is better than those of conventional window. On a sunny day, the Useful Daylighting Illuminance (UDI) of the test room was up to 52.2% better than the UDI of the conventional room. The results could support the application of photovoltaic technology in buildings in Southwest China.

1. Introduction

The application of photovoltaic technology in buildings has huge potential in Southwest China. The climatic conditions of the area can be classified as a hot-summer and cold-winter zone. The windows can be considered as the least energy efficient parts of the buildings [1,2]. The semi-transparent PV (STPV) window is a suitable alternate for this area. It saves energy, improves the living environment, and lessens the economic strain of the people.
In recent years, STPV windows have attracted the attention of many researchers. A single STPV window consist of two layers of conventional glass and intermediate PV module. Many previous studies have been aimed to estimate the effect of single semi-transparent PV windows on indoor environment. The study by Wong et al. [3] found that the semi-transparent PV windows are able to reduce the energy consumption in indoor air conditionings. Wang et al. [4] also found that the semi-transparent PV windows have a positive effect on indoor heating on sunny days in winter and it could also need space heating on cloudy days from the outdoor test. Fung and Yang [5] used a simulation model to evaluate the influence of orientation on the performance of STPV windows. It was found that the south direction is best suited to be the installation wall.
To improve the insulation performance of STPV windows, a type of double-skin STPV window is used. This double-skin window consists of a layer of single STPV windows, a layer of conventional window with a vacuum air layer in between. It was been found that the double-skin STPV window took into account both the thermal insulation and power generation performance compared to the single-layer window from a previous study. It is suitable for use as the exterior window of buildings. He, W. et al. [6] compared the thermal performance of double-skin STPV windows with single STPV windows by using the test rig and simulation model. They found that the double-skin STPV windows could reduce the indoor heating and cooling load more effectively. Wang et al. [7] developed a simulation model that has been validated by experimental data to further evaluate the overall performance of the double-skin STPV windows. The results have all shown that the performance of the double-skin STPV window is better than the conventional window. Costanzo et al. [8] set up a method to analyze energy performance of building integrated photovoltaics, keeping the urban context in mind. It was found that the BIPV system can achieve the renewable energy directive target of 20%. Cucchiella et al. [9] used the net present value (NPV), internal rate of return (IRR), discounted payback period (DPbP), discounted aggregate cost benefit ratio (BCr) and reduction of emissions of carbon dioxide (ERcd) to evaluate the environmental impact and economics of building integrated photovoltaic systems in Italy. Park et al. [10] evaluated thermal-electric performance of the double-skin STPV window based on experimental test. The maximum rate of decrease of power generation efficiency with the increase of temperature could reach 0.52%/°C from the test. Olivieri and Kapsis et al. [11,12] studied lighting-electric performance of the double-skin STPV window through the simulation. The results show that lighting-electric performance of the double-skin STPV window is impact by the visible transmittance. Li et al. [13] found that the STPV window could generate power and cut down the energy requirement of lighting and cooling to benefit the environmental, energy, and economic aspects through the simulation.
Most of previous studies have focused on single or double aspect evaluation of STPV window performance and used numerical simulation to evaluate the energy performance of the double-skin STPV windows. Since the STPV window generate electricity and have an impact on the heating and cooling load of the test room. At the same time, the visible transmittance of the STPV window will have an impact on the lighting load of the room. The performance of STPV windows could be fully reflected by a comprehensive analysis of those three elements. This paper focuses on the analysis study of the electricity-thermal-lighting energy performance of the double-skin STPV window under the ambient environment of Chengdu, which is located on the longitude and latitude of 30.67 °N using an experimental test. The energy performance test lasted three weeks. Three consecutive typical days were selected for analysis (from 13 February 2018 to 15 February 2018).

2. Energy Performance Experimental Study

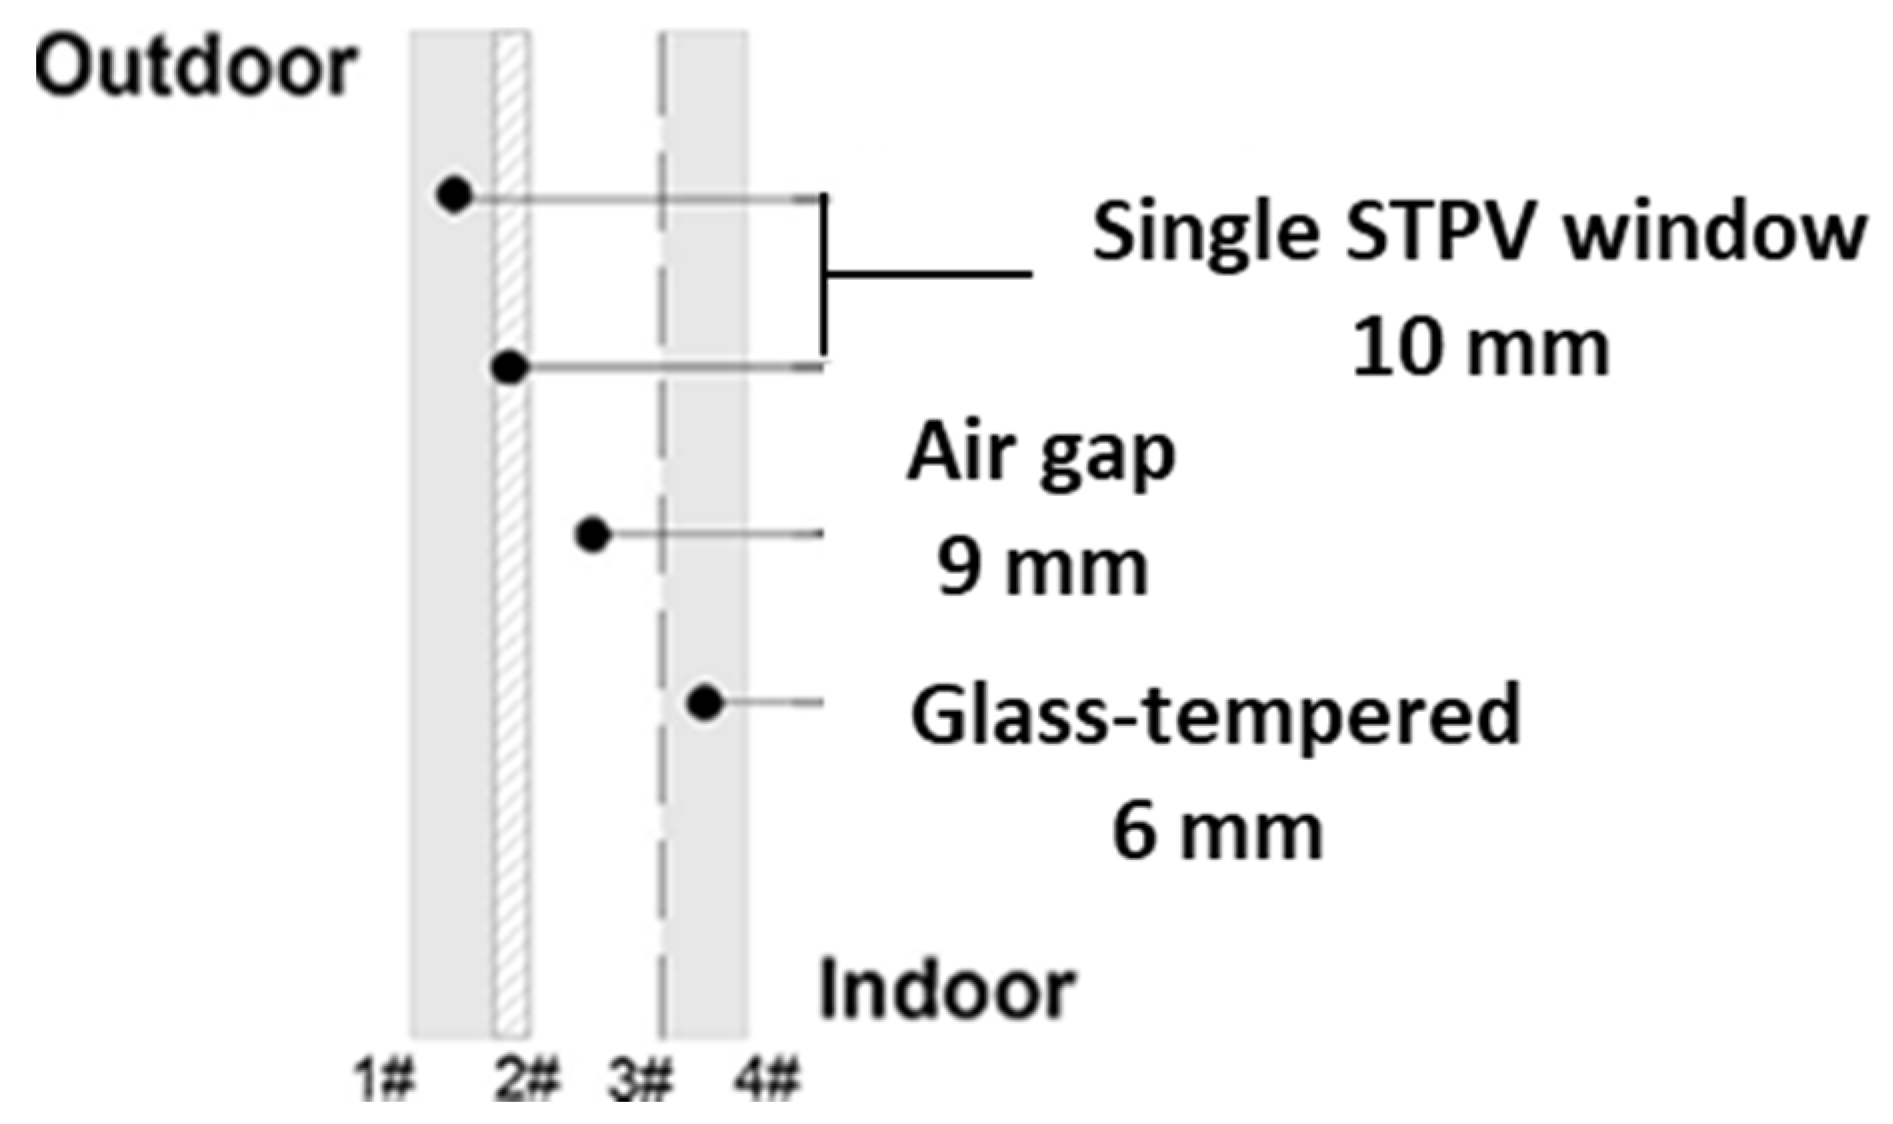
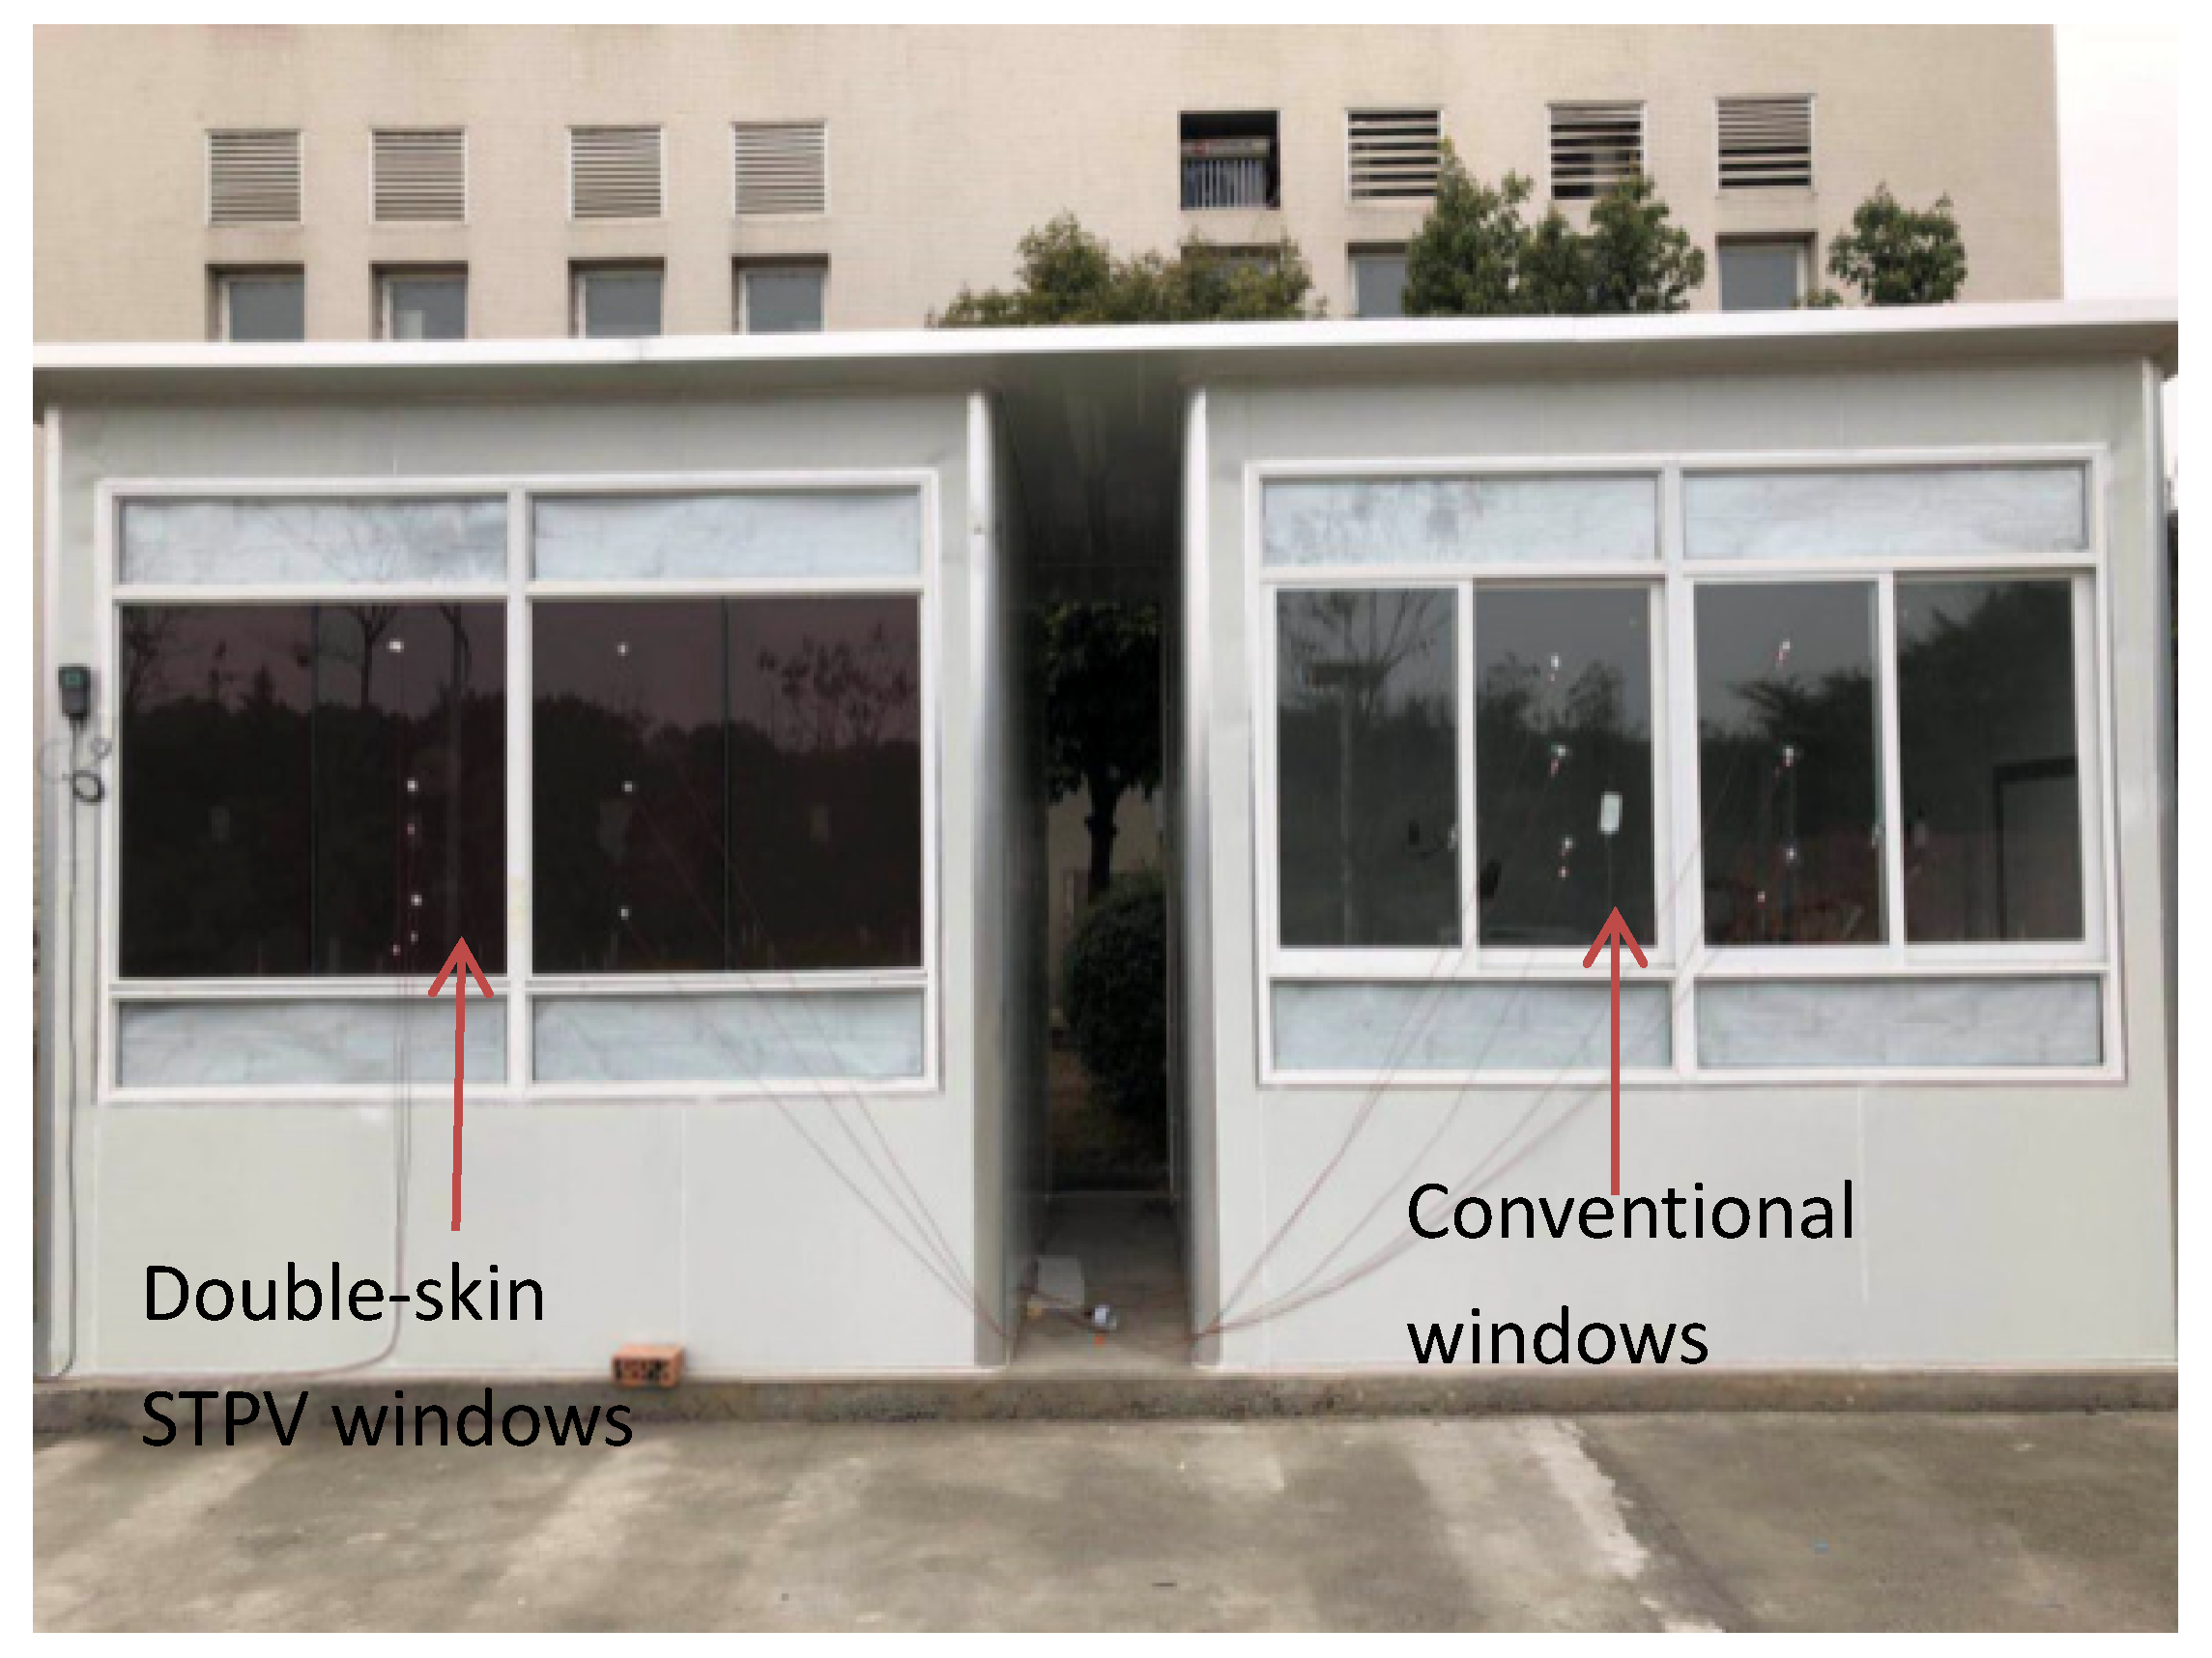
2.1. Double-Skin STPV Window
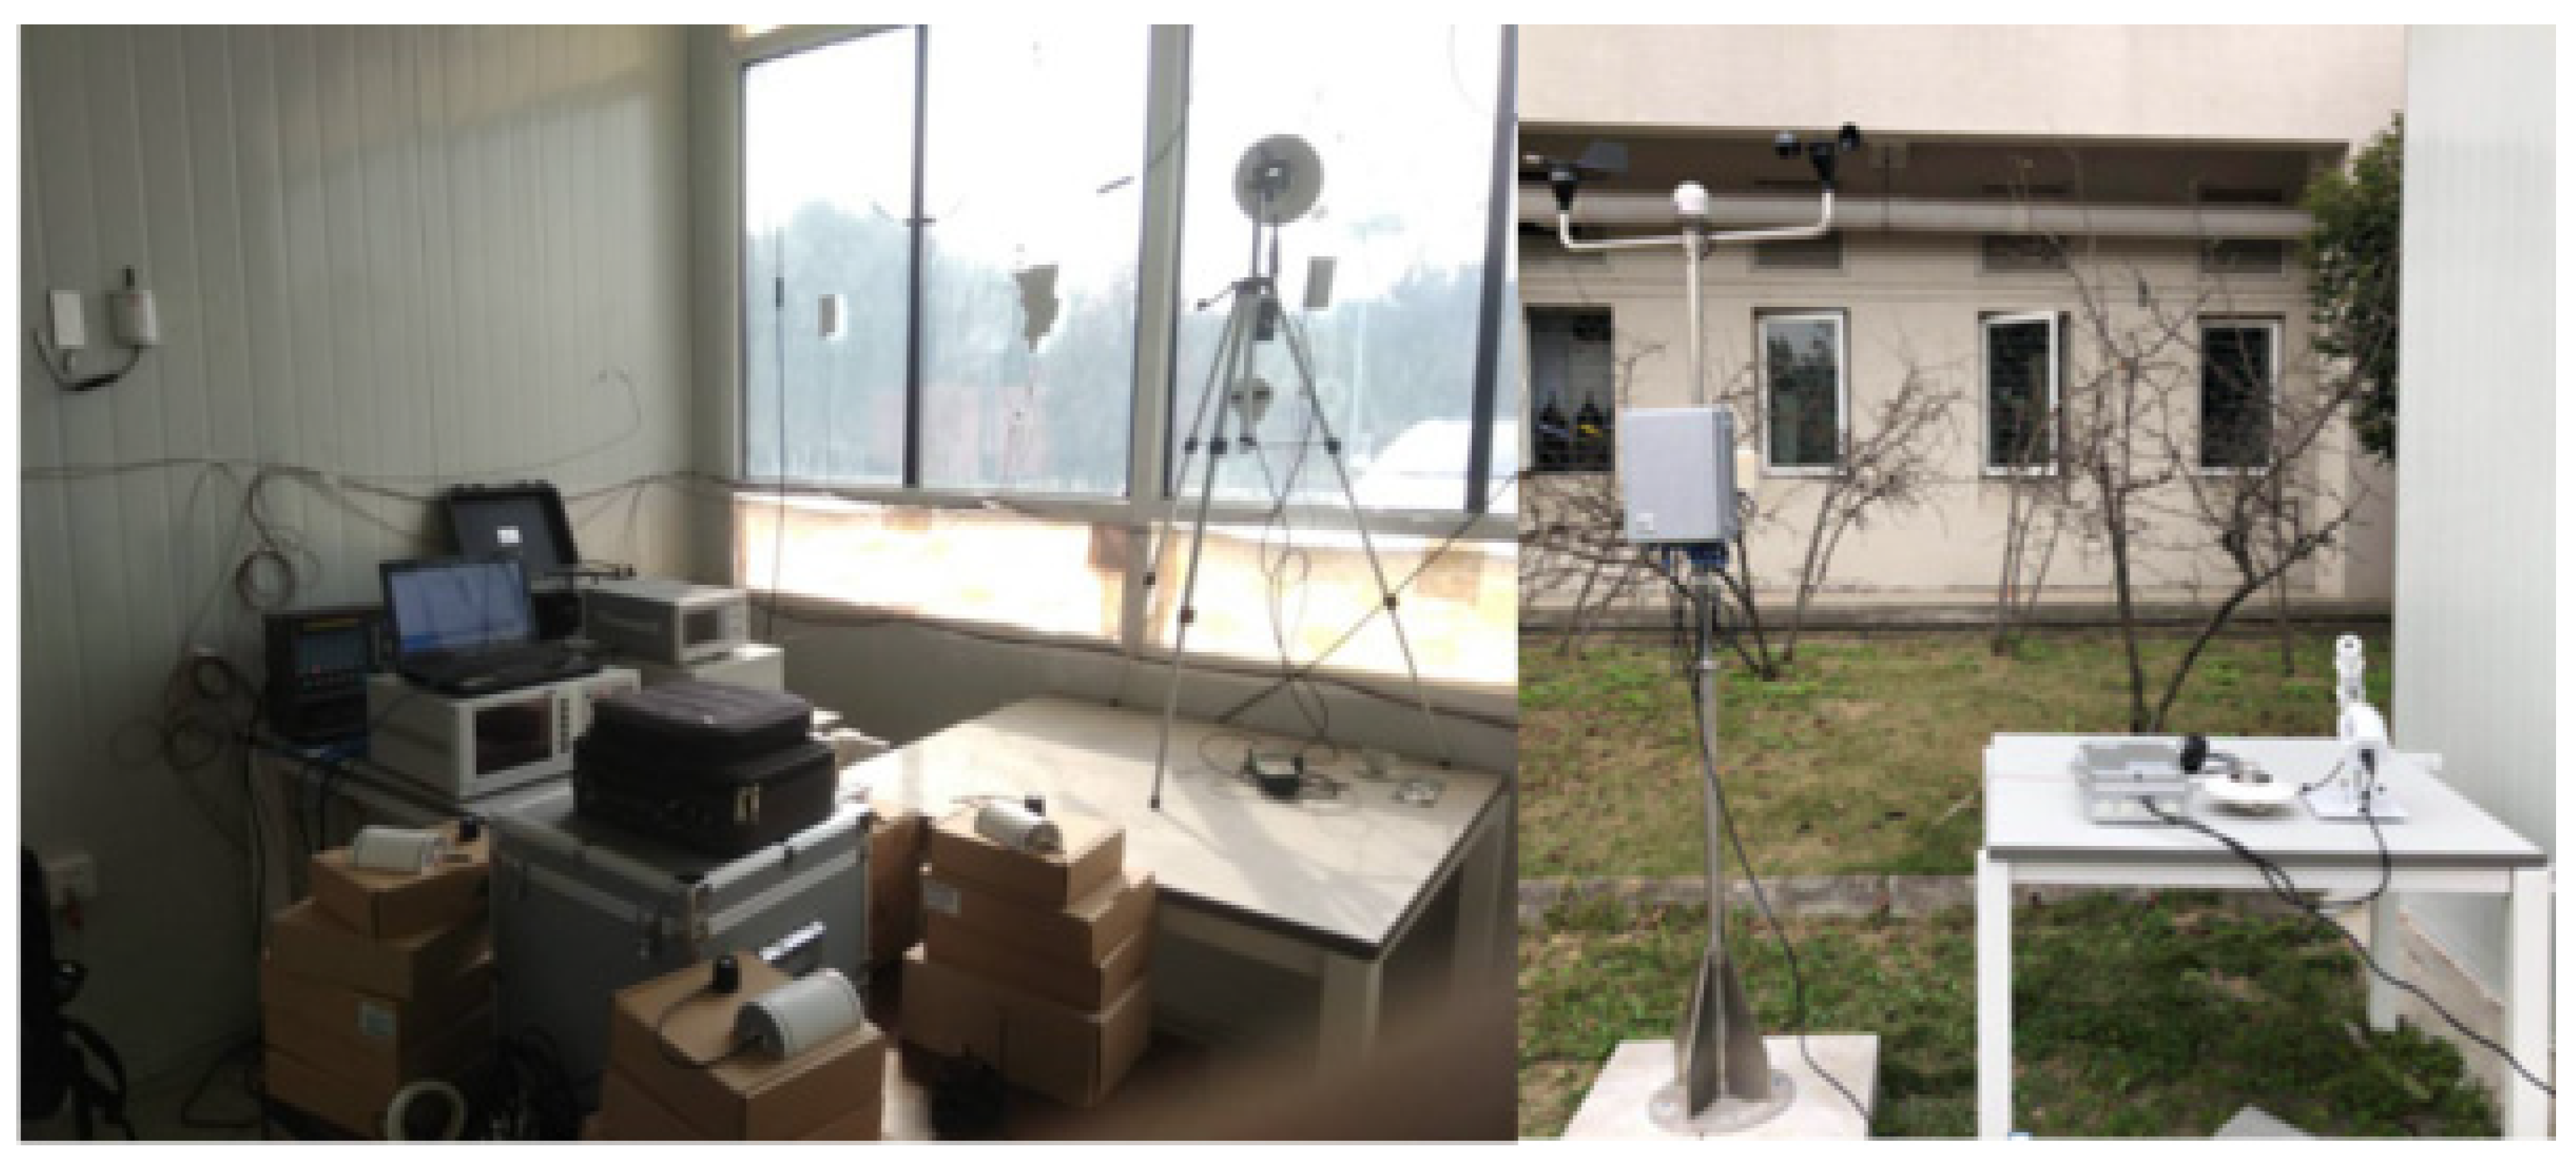
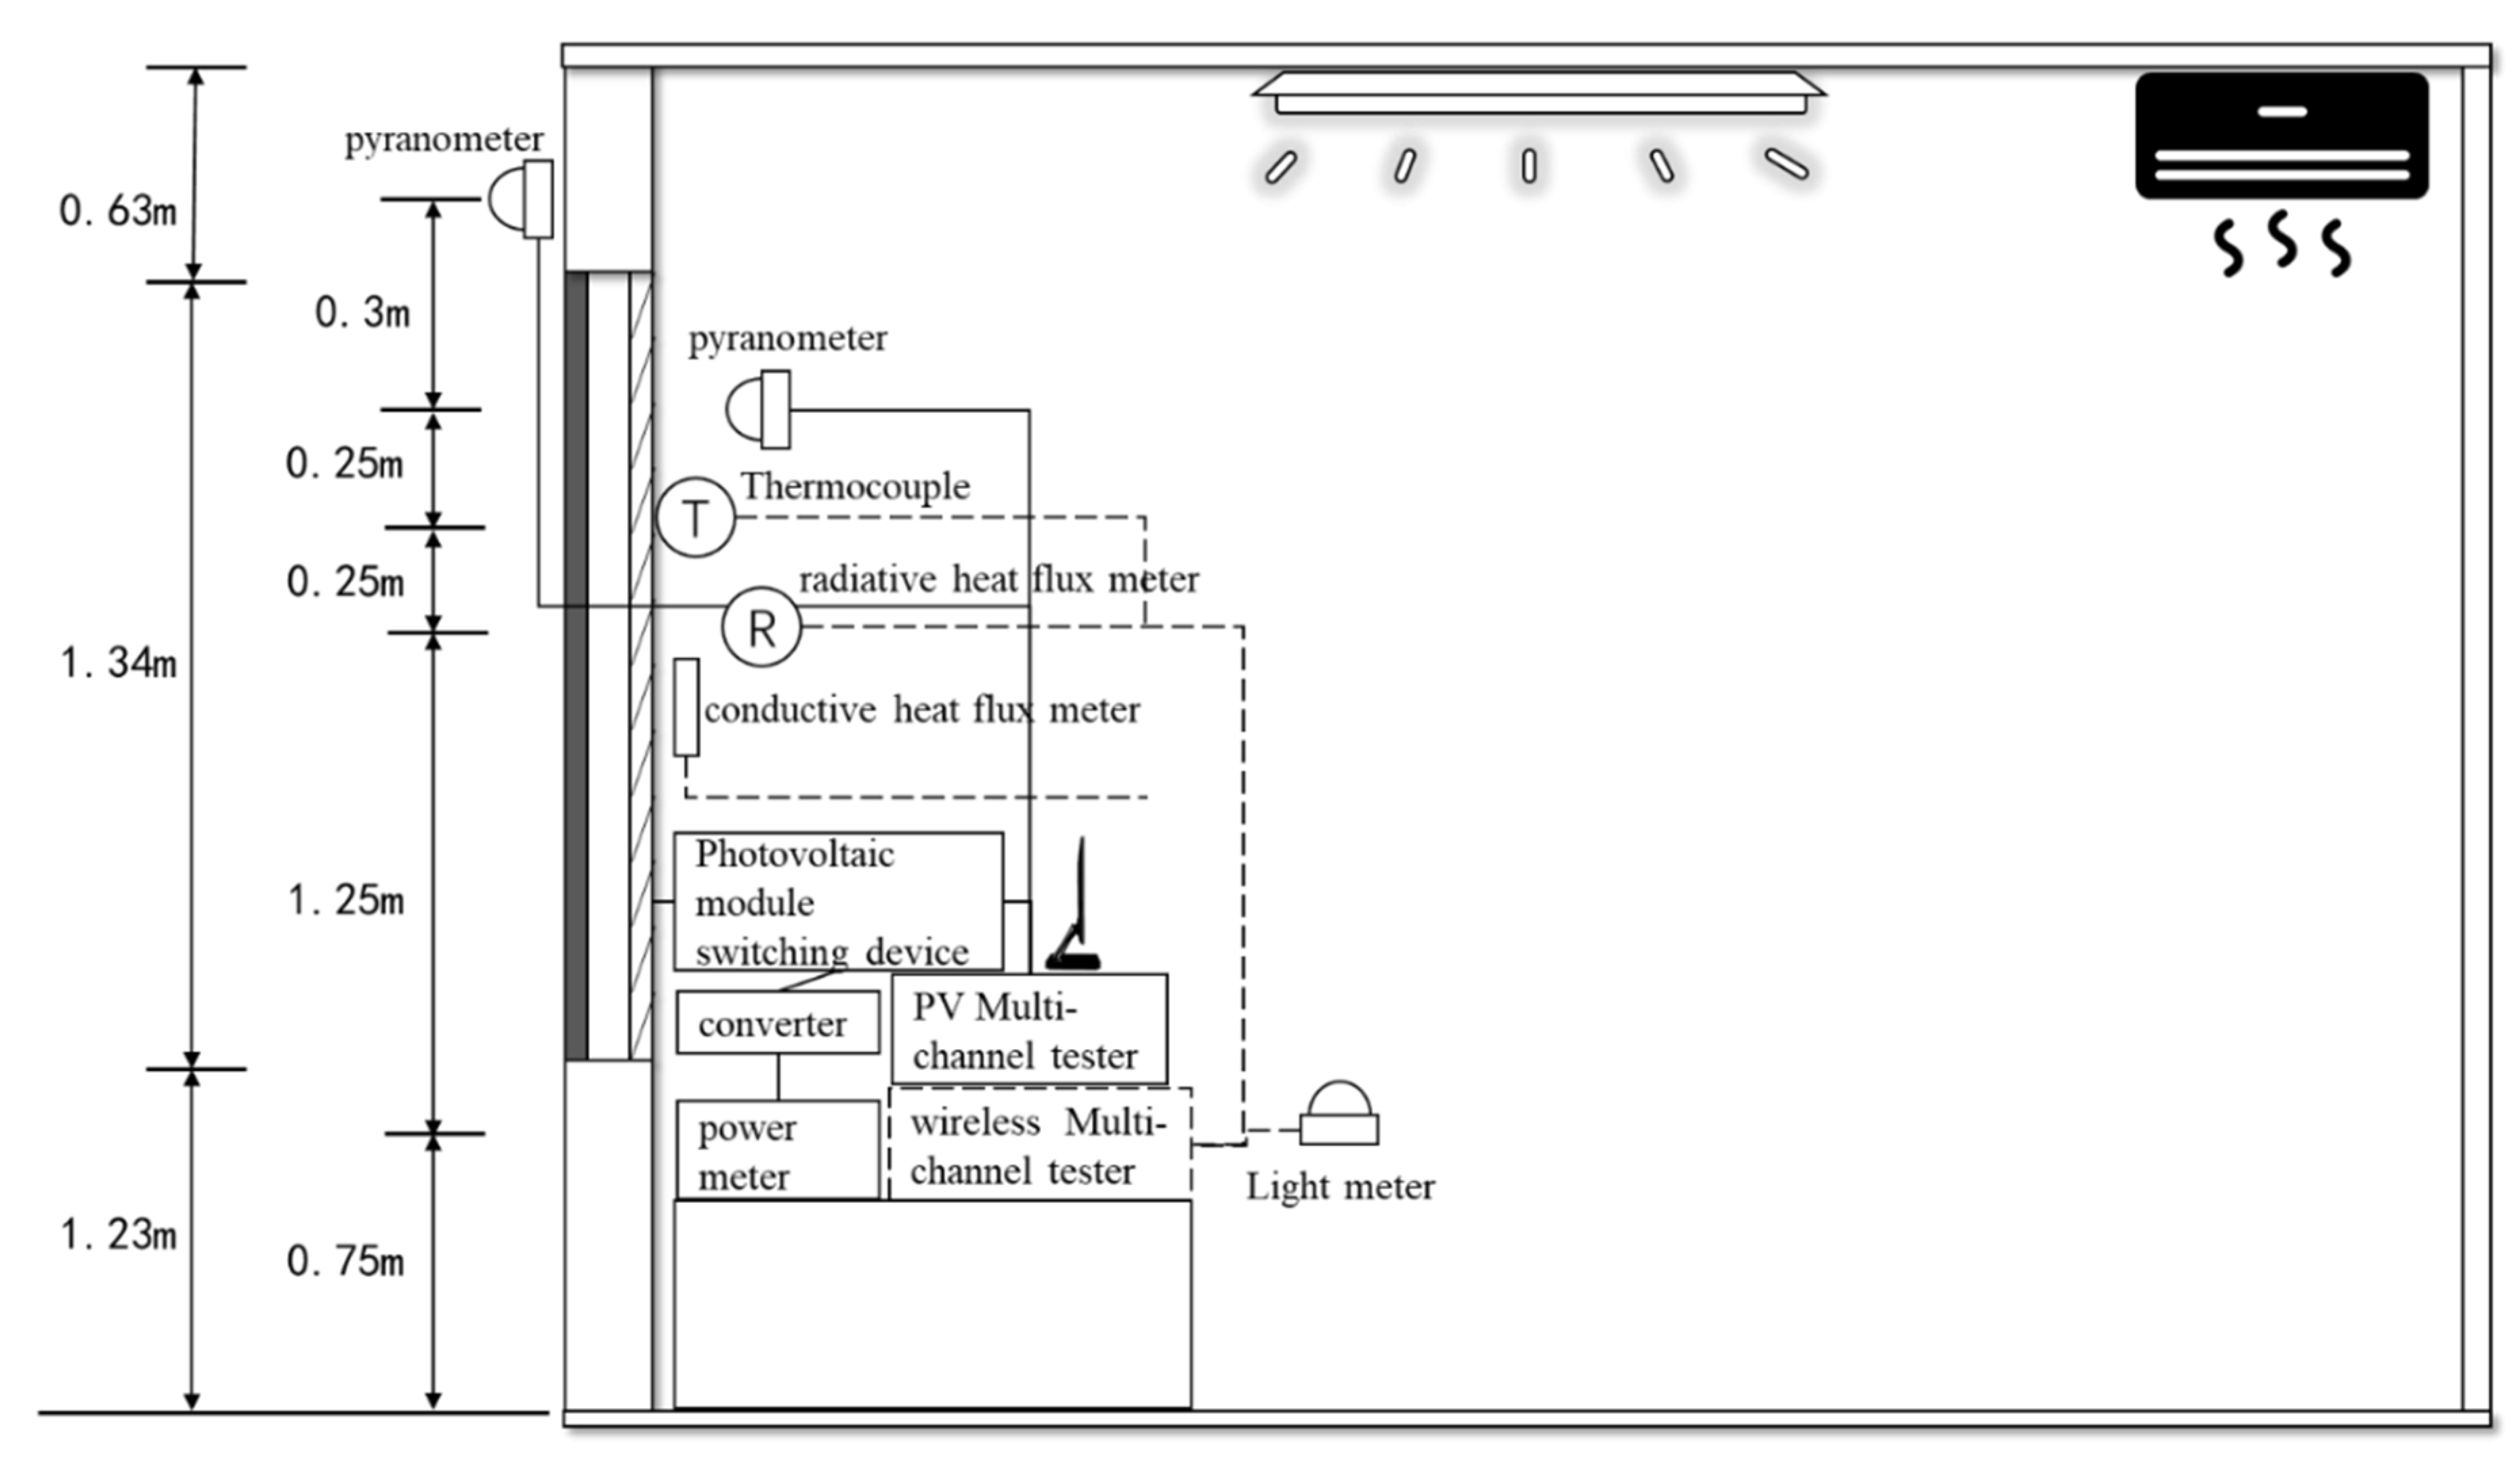
The double-skin STPV window was designed and processed by Sichuan University and the Hanergy Company. As shown in Figure 1, the double-skin STPV window consists of one layer of single STPV windows, and one layer of conventional window with a vacuum air layer. The key characteristics of the PV module are shown in Table 1.

2.2. Test Rig

To test the comprehensive performance of the double-skin STPV window, a test rig had been built in Sichuan University as shown in the Figure 2. The test rig included two tt units. Each unit had the same dimension of 3 m (depth) × 3 m (width) × 3 m (height). A 75 mm thick sandwich rock wool board had been used as the materials of wall and roof to meet the requirements of thermal insulation.
The windows were installed on a south facing wall. As shown in the Figure 3, the weather data (outdoor temperature, humidity, wind direction, wind speed, air pressure, direct solar radiation and global solar radiation, etc.) were tested by the outdoor test equipment. The double-skin window related parameters like IV curves, solar radiation upon south façade, generation power were measured by the outdoor PV testing equipment. The indoor temperature could be tested by the wireless temperature sensors and wireless lighting sensors were used to measure the illumination on the work surface. The experimental data except electrical parameters were collected by a wireless multi-channel data recorder with a sampling interval of 1 min. A few temperature sensors and heat flux meters were used to measure the temperature and heat flux of the two windows for the purpose of evaluating their thermal performances. The schematic diagram of the indoor environment test instruments was shown in Figure 4. All the key instruments and their specifications have been shown in Table 2.

2.3. Energy Performance Analysis

The comprehensive energy performance of STPV windows were evaluated based on the electricity-thermal-lighting energy values. The conversion efficiency (η) could be used to evaluate the electrical performance of the STPV windows. It mainly characterized the ability of STPV windows to convert solar radiation into electric energy. Equation of calculating η is as follows [15]:
η = p A w × R a = FF × I s c × V o c A w × R a × 100
where η is the conversion efficiency of STPV windows. P is the power generation of the STPV windows, W. Aw is the area of the STPV windows, m2. Ra is the solar radiation upon the south façade, W/m2. Voc is open circuit voltage. Isc is short circuit i. FF is fill factor.
The conversion efficiency is calculated using the ratio of the power generated to the amount of solar radiation upon the STPV window. The power generated and the solar radiation were tested by the outdoor PV test equipment. The total heat flux through the STPV windows consisted of the solar radiation though the windows, radiation heat flux, and conductive heat flux from the window to the indoors; it was calculated using the following [16]:
G i = G d + G r + G c
where G is total heat flux through the STPV windows, W/m2. Gd is the solar radiation penetrating though the STPV window, W/m2. It can be tested by pyranometer. Gr is the radiant heat flux from the window to the indoors, W/m2, and can be tested by the radiative heat flux meter. Gc is the conductive heat flux from the window to the indoors, W/m2, and it can be tested by the conductive heat flux meter.
To further evaluate the thermal performance of STPV window, the solar heat gain coefficient (SHGC) and Uvalue were calculated by the following equations [17,18,19]:
SHGC = G i G
where Gi is the total heat flux through the STPV window, W/m2, and G is the solar radiation upon the south façade, W/m2:
U v a l u e = G r + G c Δ T
where Gr is the radiant heat flux from the window to the indoors, W/m2. Gc is conductive heat flux from the window to the indoors, W/m2. ∆T is the difference of the indoor and outdoor air temperature, °C.
The SHGC was used to present the fraction of the incident irradiance which penetrated though the STPV window. The Uvalue is the overall heat transfer coefficient of the window.
The wireless light meters were used to test the illumination on the working sface (0.75 m height plane) at the specific location (the four points are evenly arranged in the room. The distance between the adjacent test points is 1 m). According to the “Standard for daylight design of buildings” GB50033-2012, only when the minimum illumination on the working surface reached 300 lx, the indoor daylight could meet the minimum requirements of the indoor work. At the same time, excessive illumination on the working surface could also cause discomfort to the people indoor. Wei, W. et al. [20] reported that the highest level of human acceptance of illumination is between 700 and 1800 lx.
The useful daylight illuminance (UDI) was used to evaluate indoor lighting environment more effectively. It was calculated using the following equation [21]:
UDI = t U D t T
where tUD is the time that the daylight can be used useful, s. The tT is the total daytime, s.
The UDI is mainly used to predict the time of the day when the daylight can be used effectively. The experimental data of the daylighting test can be divided into three sections using UDI: daylight that is within the available range (100–2000 lx), daylight that did not meet the visual needs (≤100 lx), and daylight that exceeded the visual needs (≥2000 lx).
The uniformity ratio of daylighting which was used to characterize the uniformity of indoor lighting has also been used to evaluate of the impact of STPV windows on indoor light environment. It was calculated by the following equations [22]:
C a v = C i n
U = C m i n C a v
C i = E i E w × 100 %
where Ci is the daylighting coefficient of the i points. Ei is the illumination on the working surface of the i points. Ew is outdoor diffuse illuminance on the working surface at the same time. Cav is the average indoor daylighting coefficient on the working surface. The symbol n is the number of indoor lighting test points. U is the uniformity ratio of daylighting. Cmin is the minimum indoor lighting coefficient.

3. Experimental Results and Analysis

The incident solar radiation upon the south façade (G) of those three days is shown in Figure 5. The selected days for analysis were a sunny day (15th), a cloudy day (13th), and a sunny to cloudy day (14th). The maximum incident solar radiation upon the south façade on the sunny day was 600 W/m2. The average ambient air temperature reached 15.6 °C during daytime on the 15th and the air temperature on the cloudy day was around 13 °C.

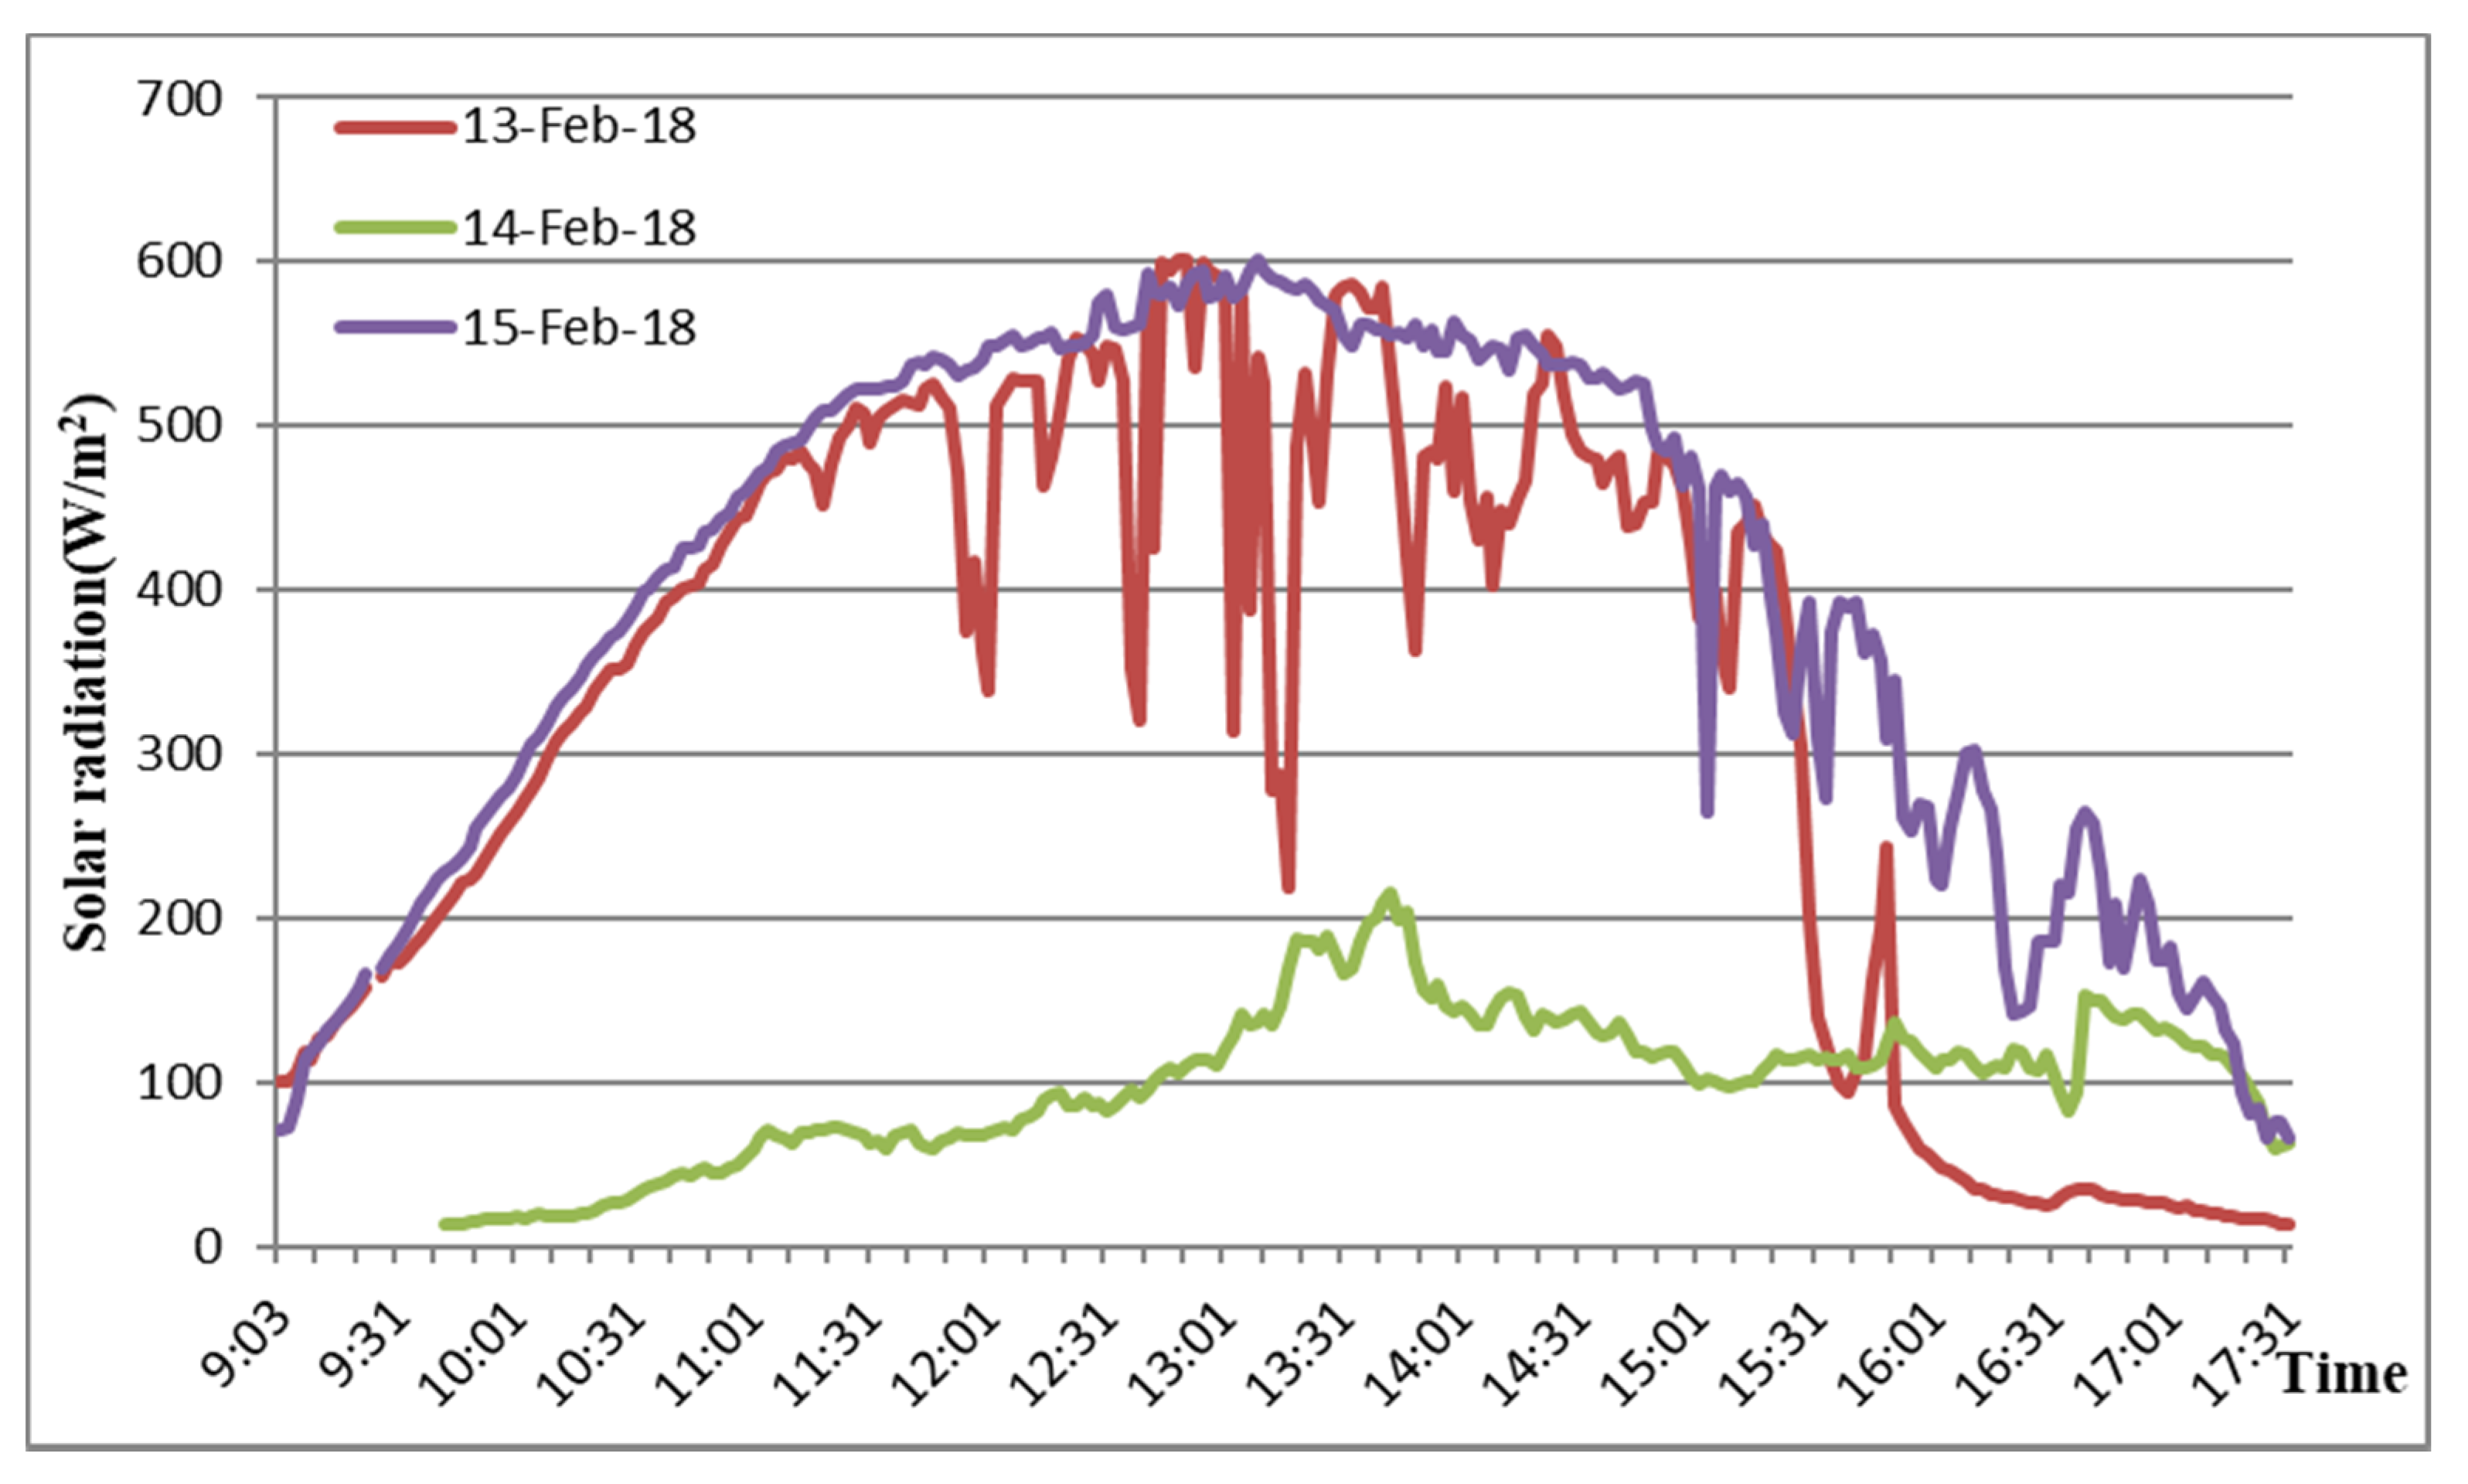
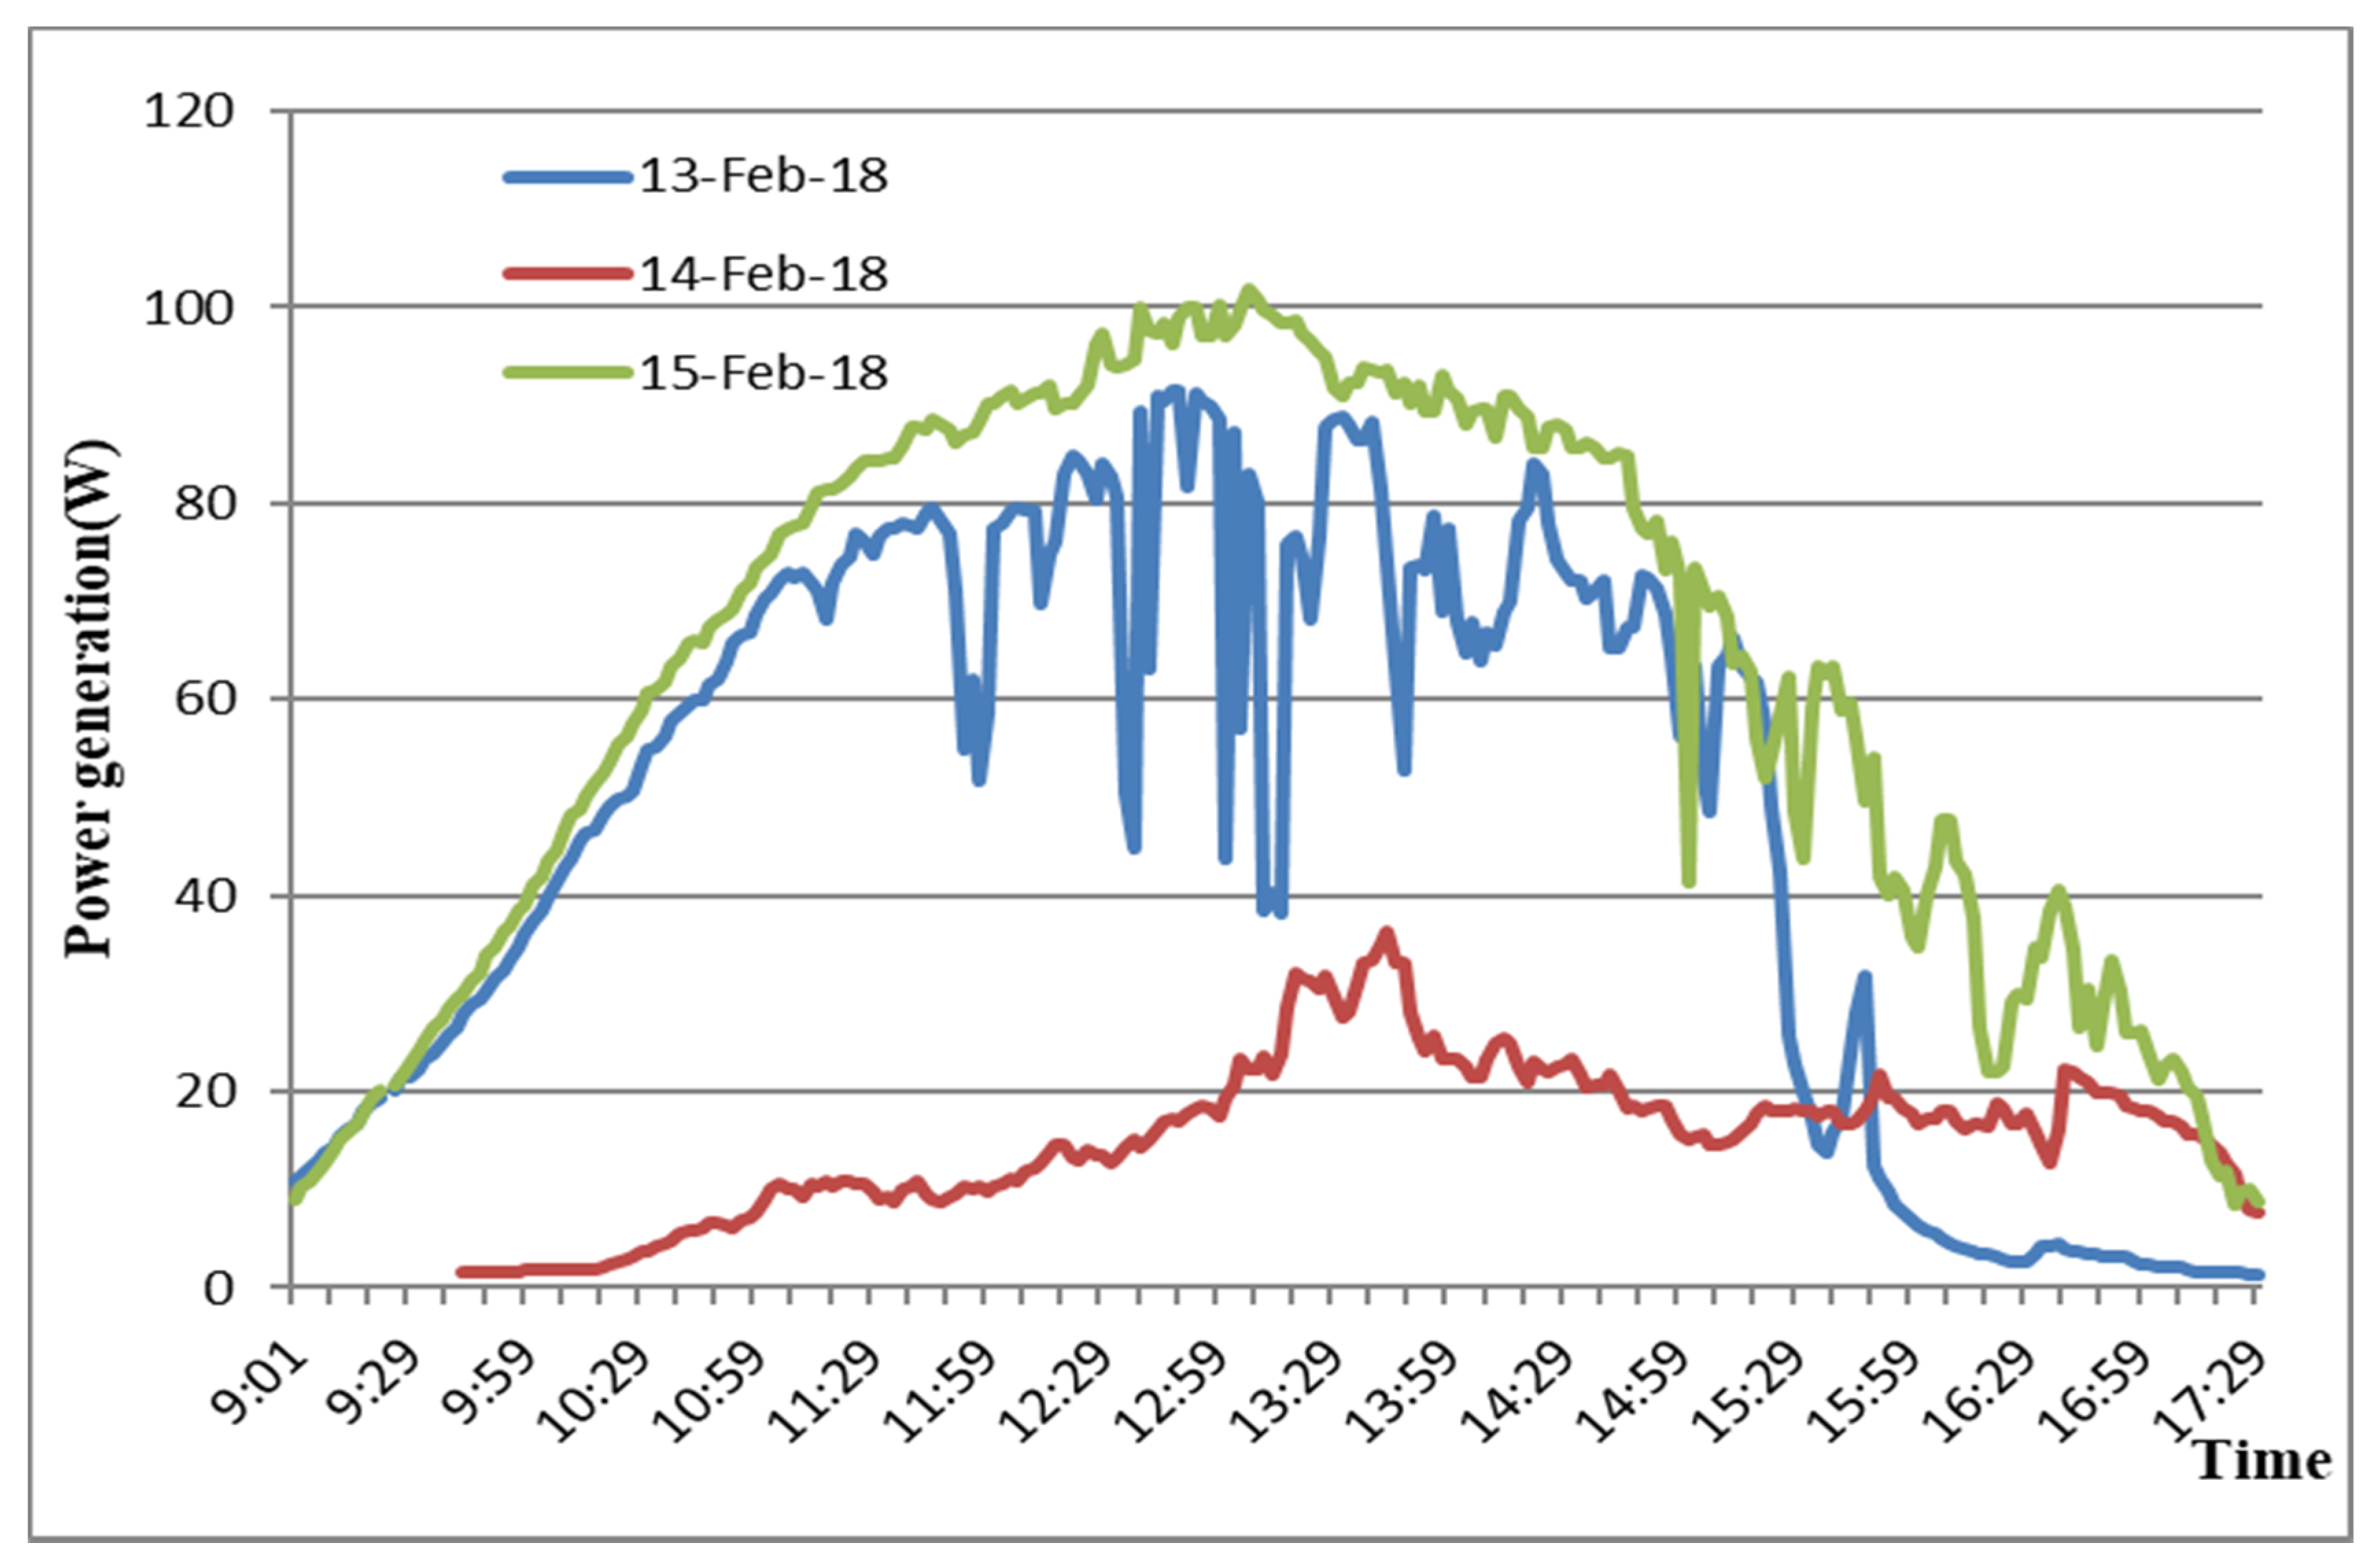
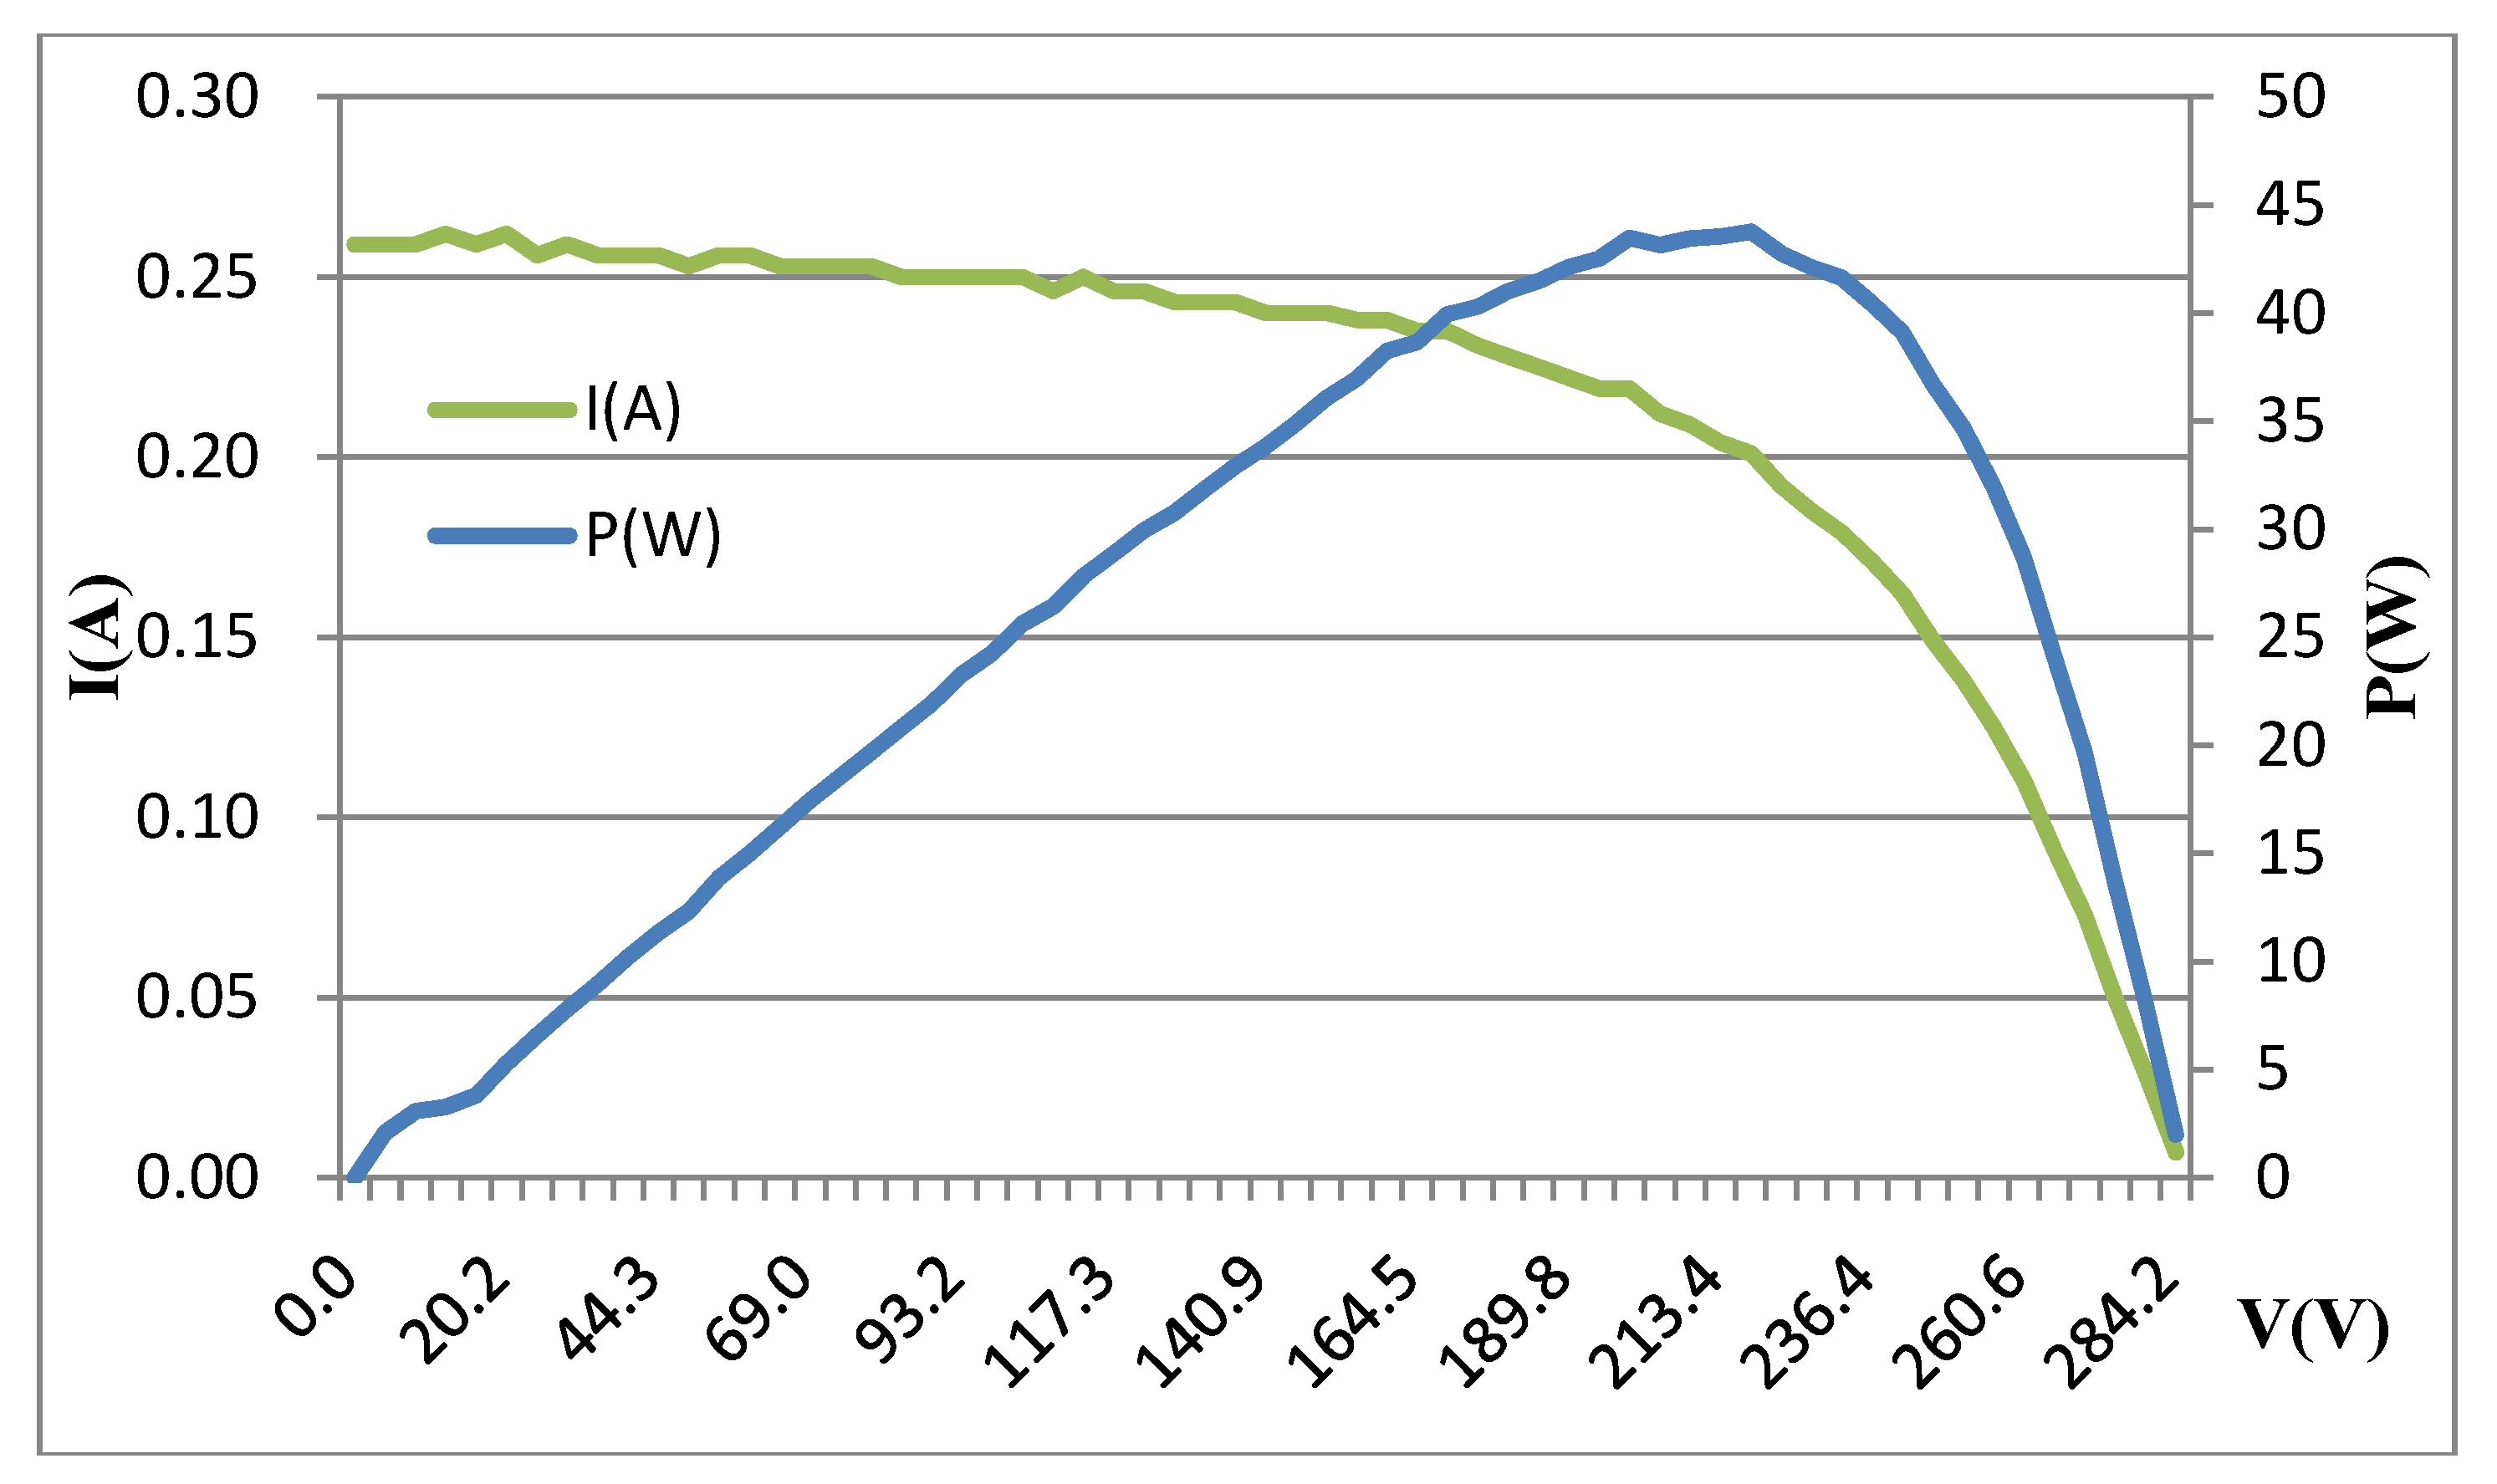
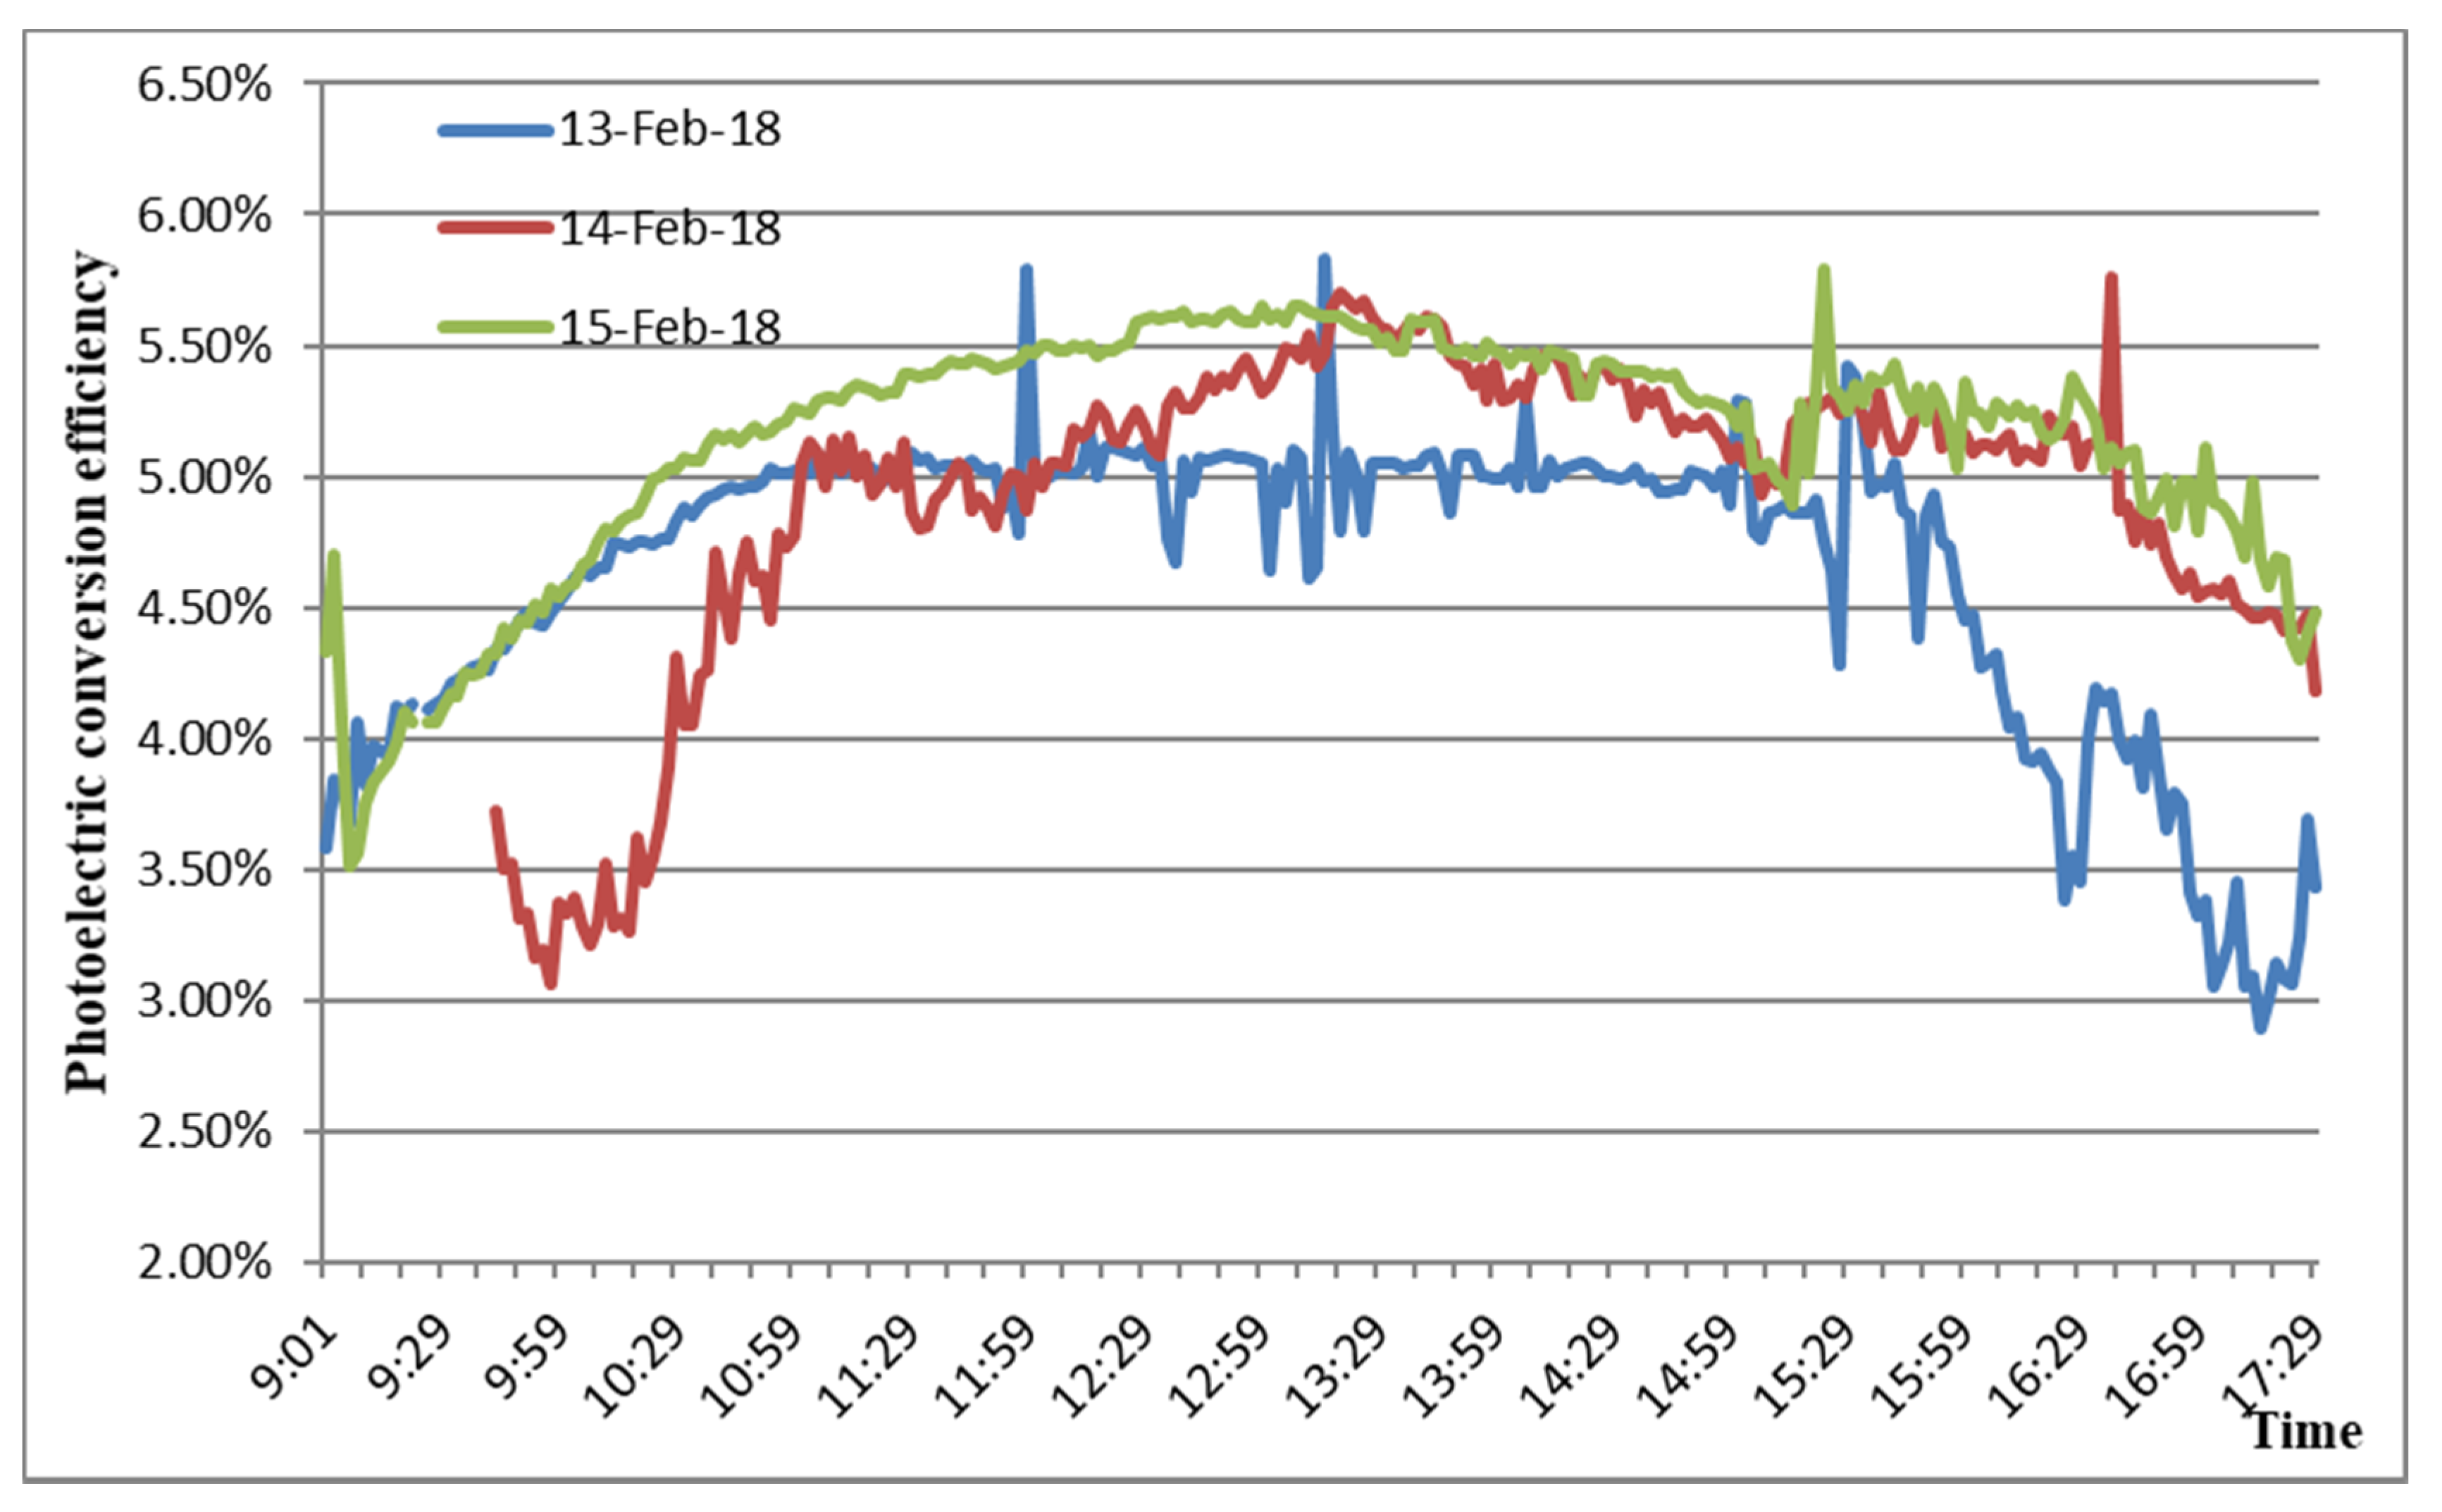
3.1. Electrical Performance Test

The power generation is shown in the Figure 6 and the real-time photoelectric conversion efficiency is shown in the Figure 7. The maximum power generated off the PV window reached 100 W while the G was 600 W/m2. In combination with Figure 5 and Figure 6, the reduction of instantaneous irradiance caused by the cover of cloud also leads to the reduction of instantaneous power generation.
The IV curve of the STPV windows on the 13th noon is shown in the Figure 8. The G was 314 W/m2. It was found that the open circuit voltage was 284.2 V. The short-circuit current was 0.26 A and the maximum power of the STPV windows was 43.76 W. The conversion efficiency of the STPV window at this time was 4.6%, and the fill factor of the STPV windows was 58, which was calculated using Equation (1). The conversion efficiency is lower than the efficiency presented in Table 1 because the efficiencies in Table 1 were measured under the standard test conditions and the energy losses were not included. The IV curve was smooth and the PV window work normally under the winter climate condition.
As shown in the Figure 8, the maximum photoelectric conversion efficiency was 5.79% while the average photoelectric conversion efficiency was 4.91%. Since the a-SiGe module could make better use of the low-intensity solar radiation. Compared to sunny days, the conversion efficiency on cloudy days was slightly reduced, and the maximum value was maintained at around 5%. The electrical performance test results of the a-SiGe window shows that the power generated off of the a-SiGe window could meet partial energy demand of the building in this test during winter when intensity of the solar radiation is low.

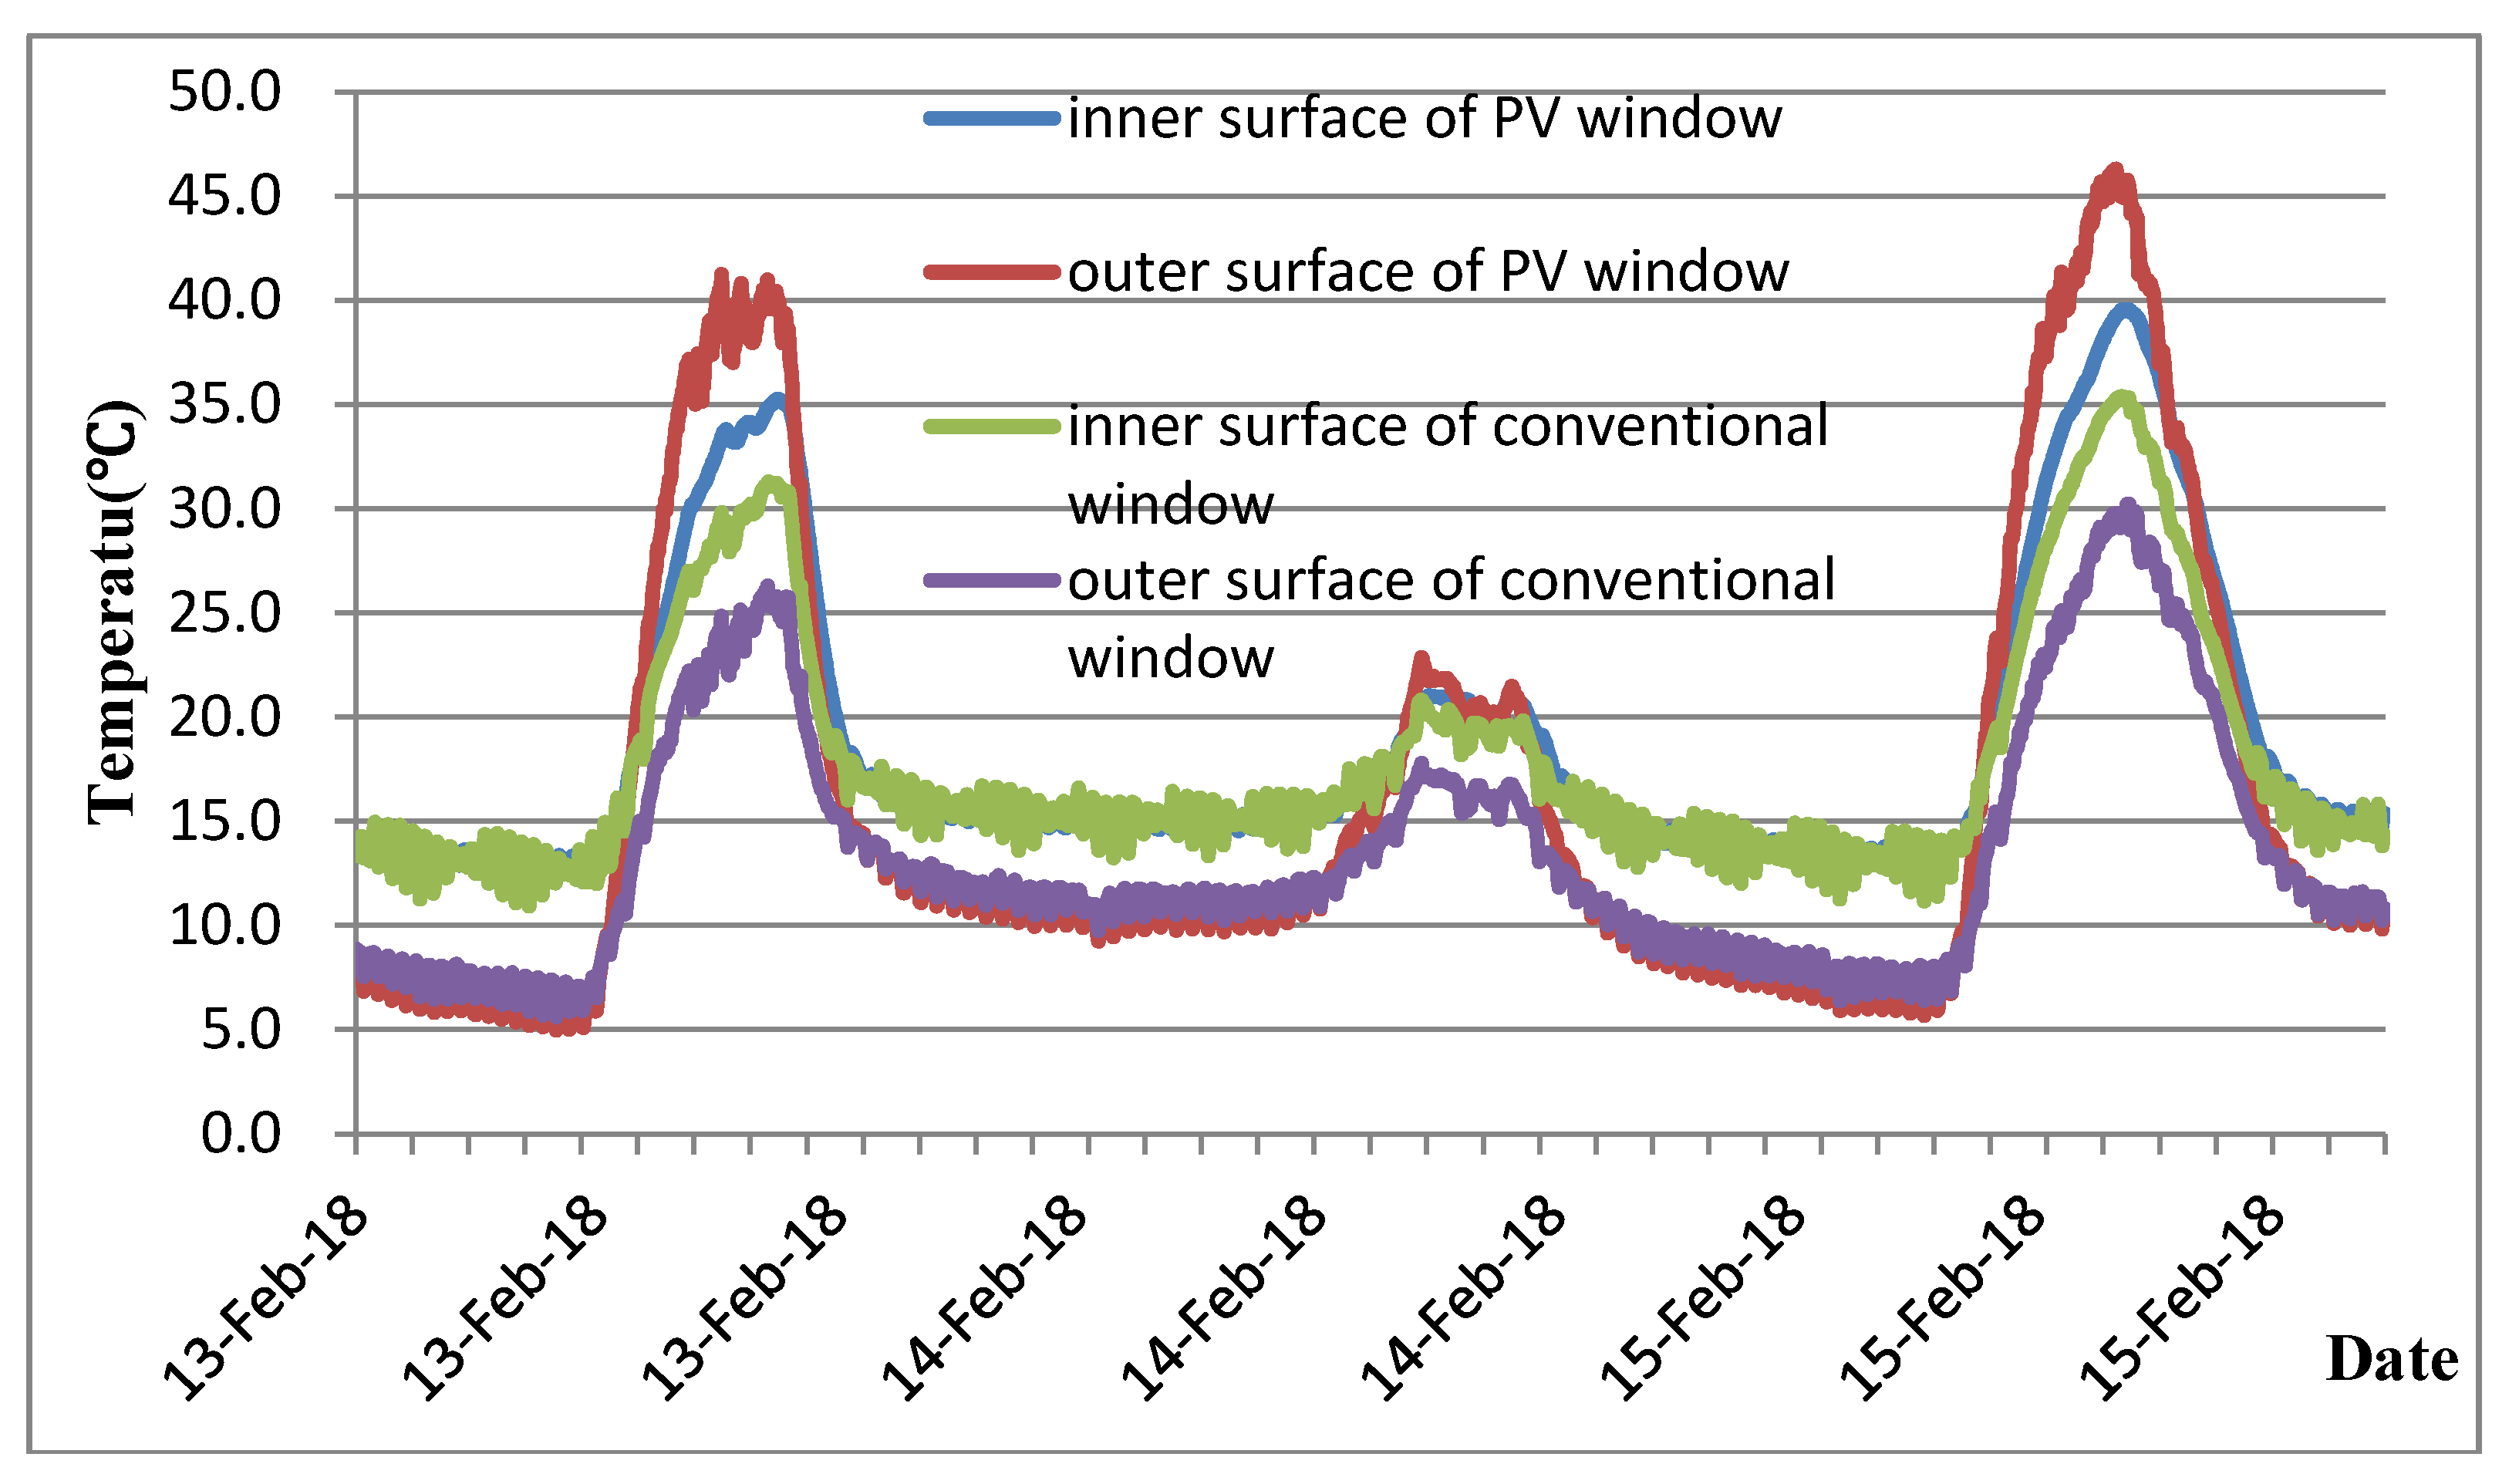
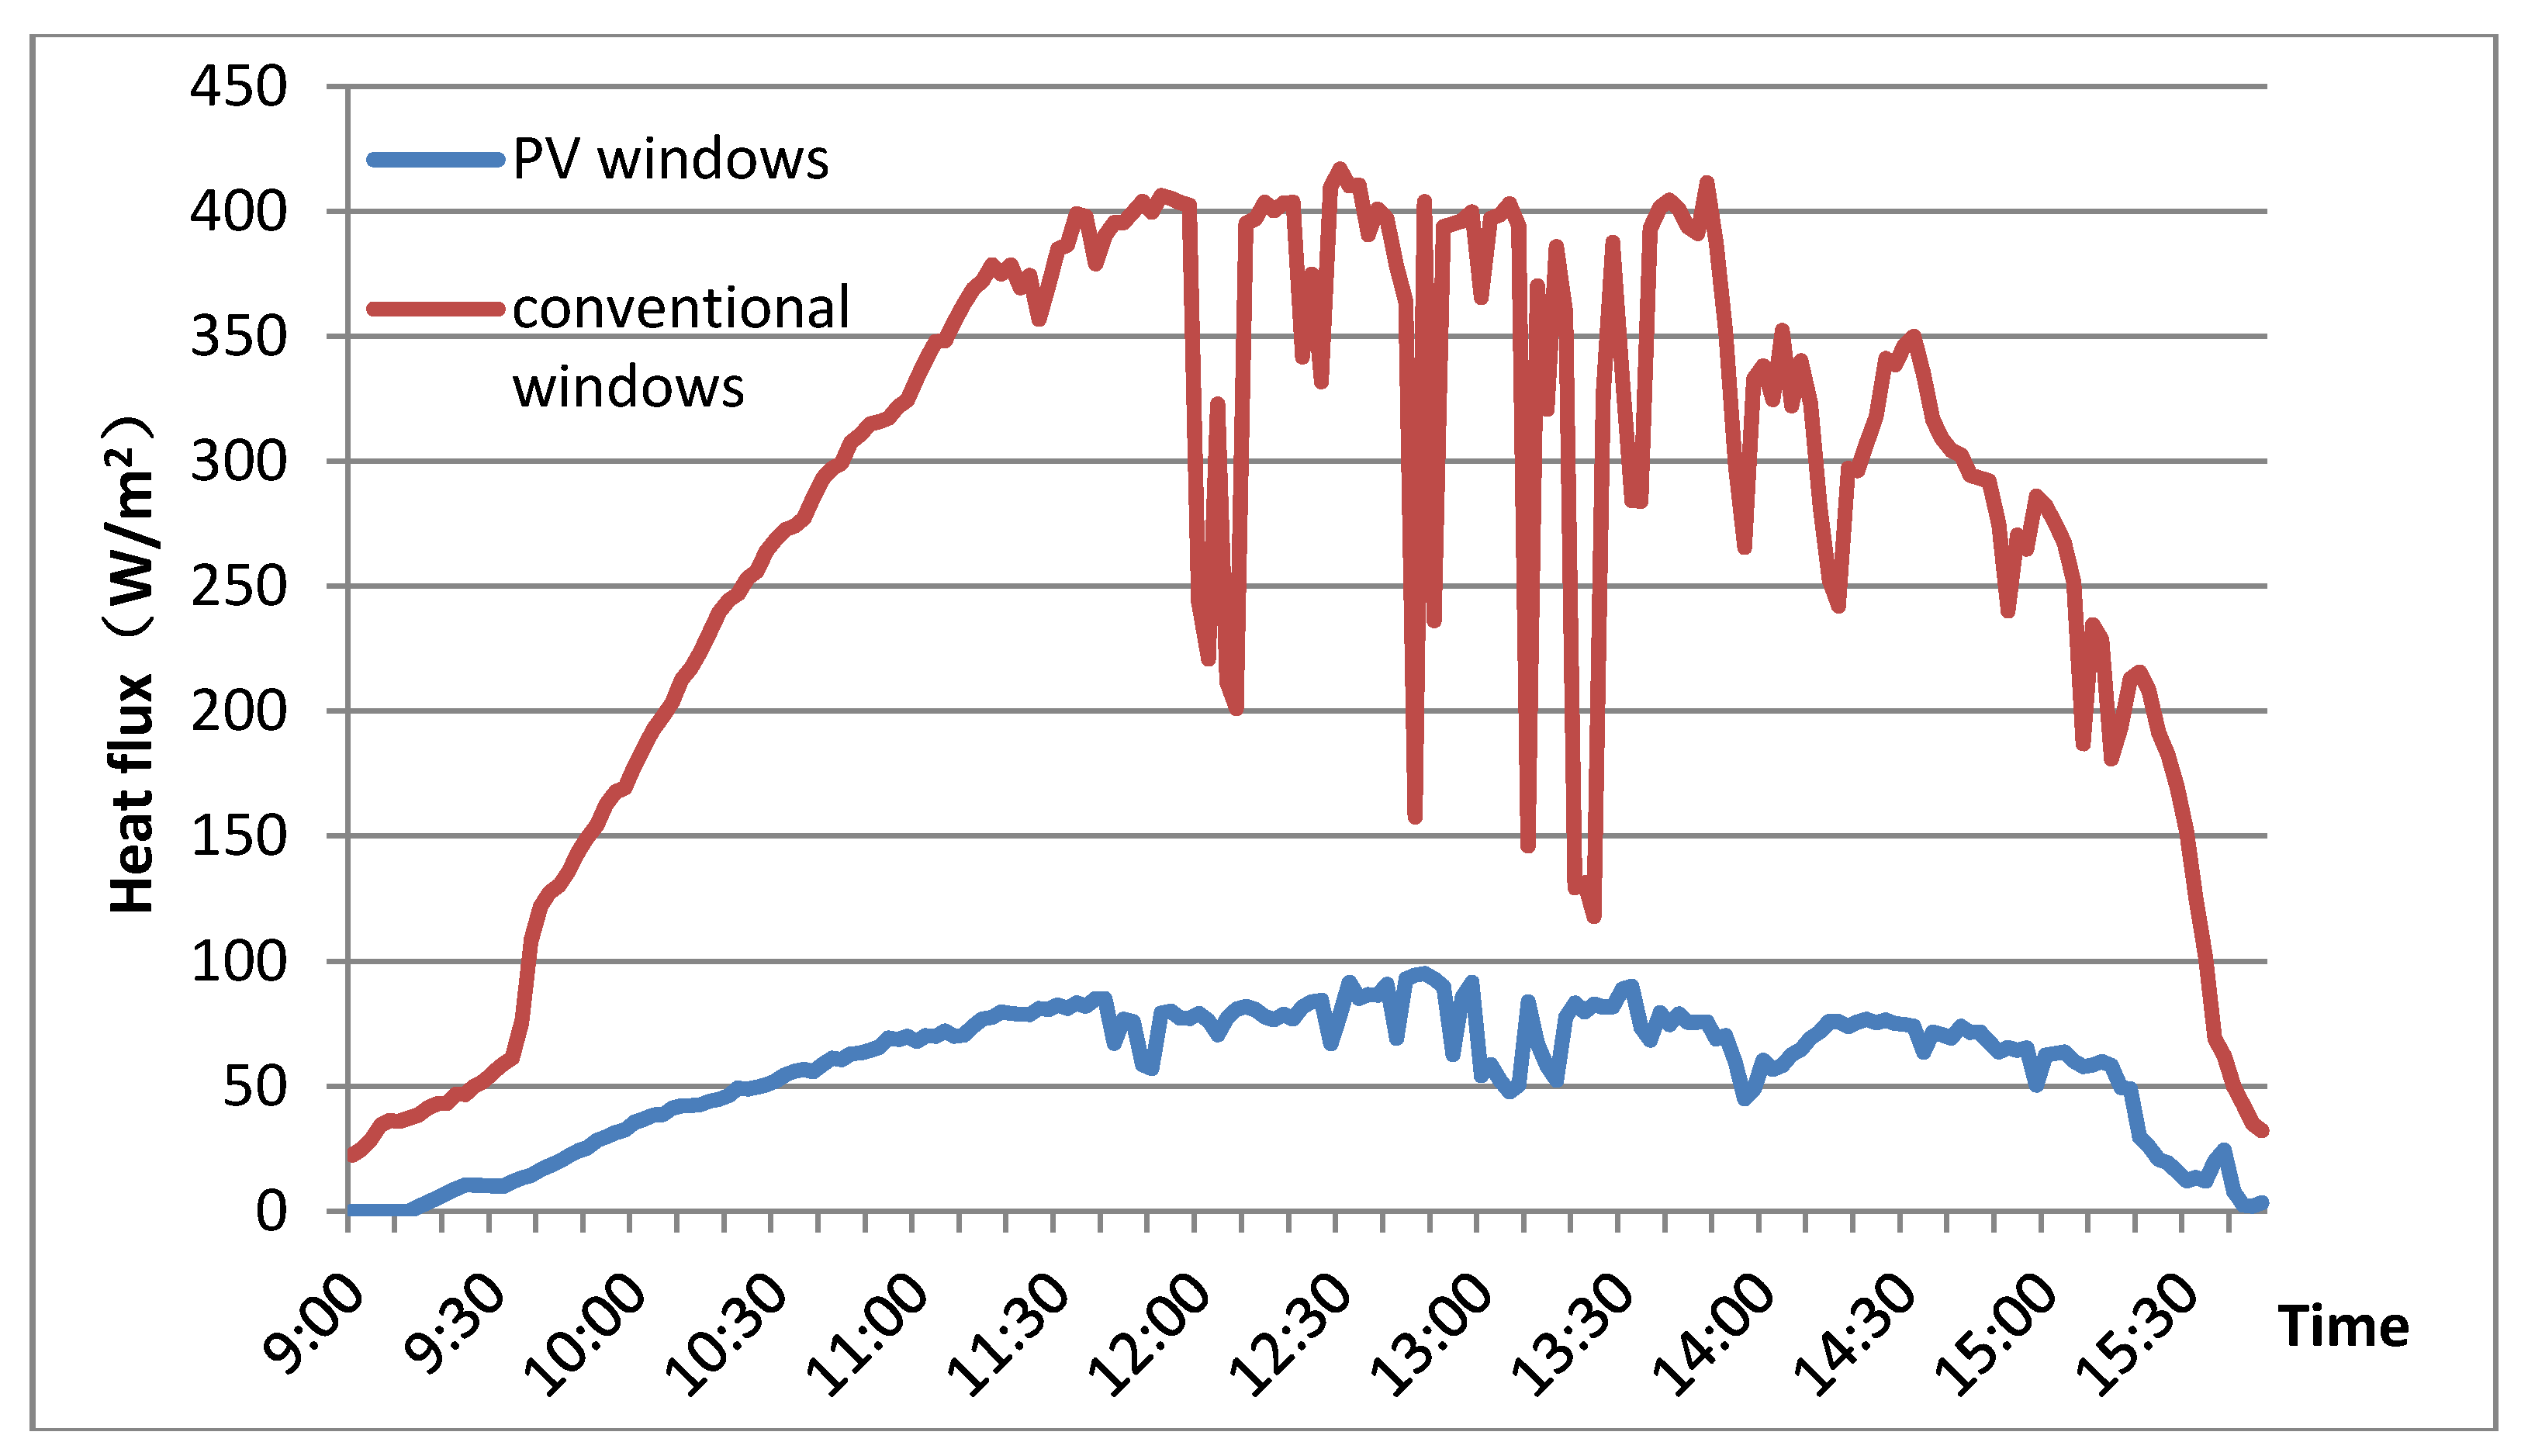
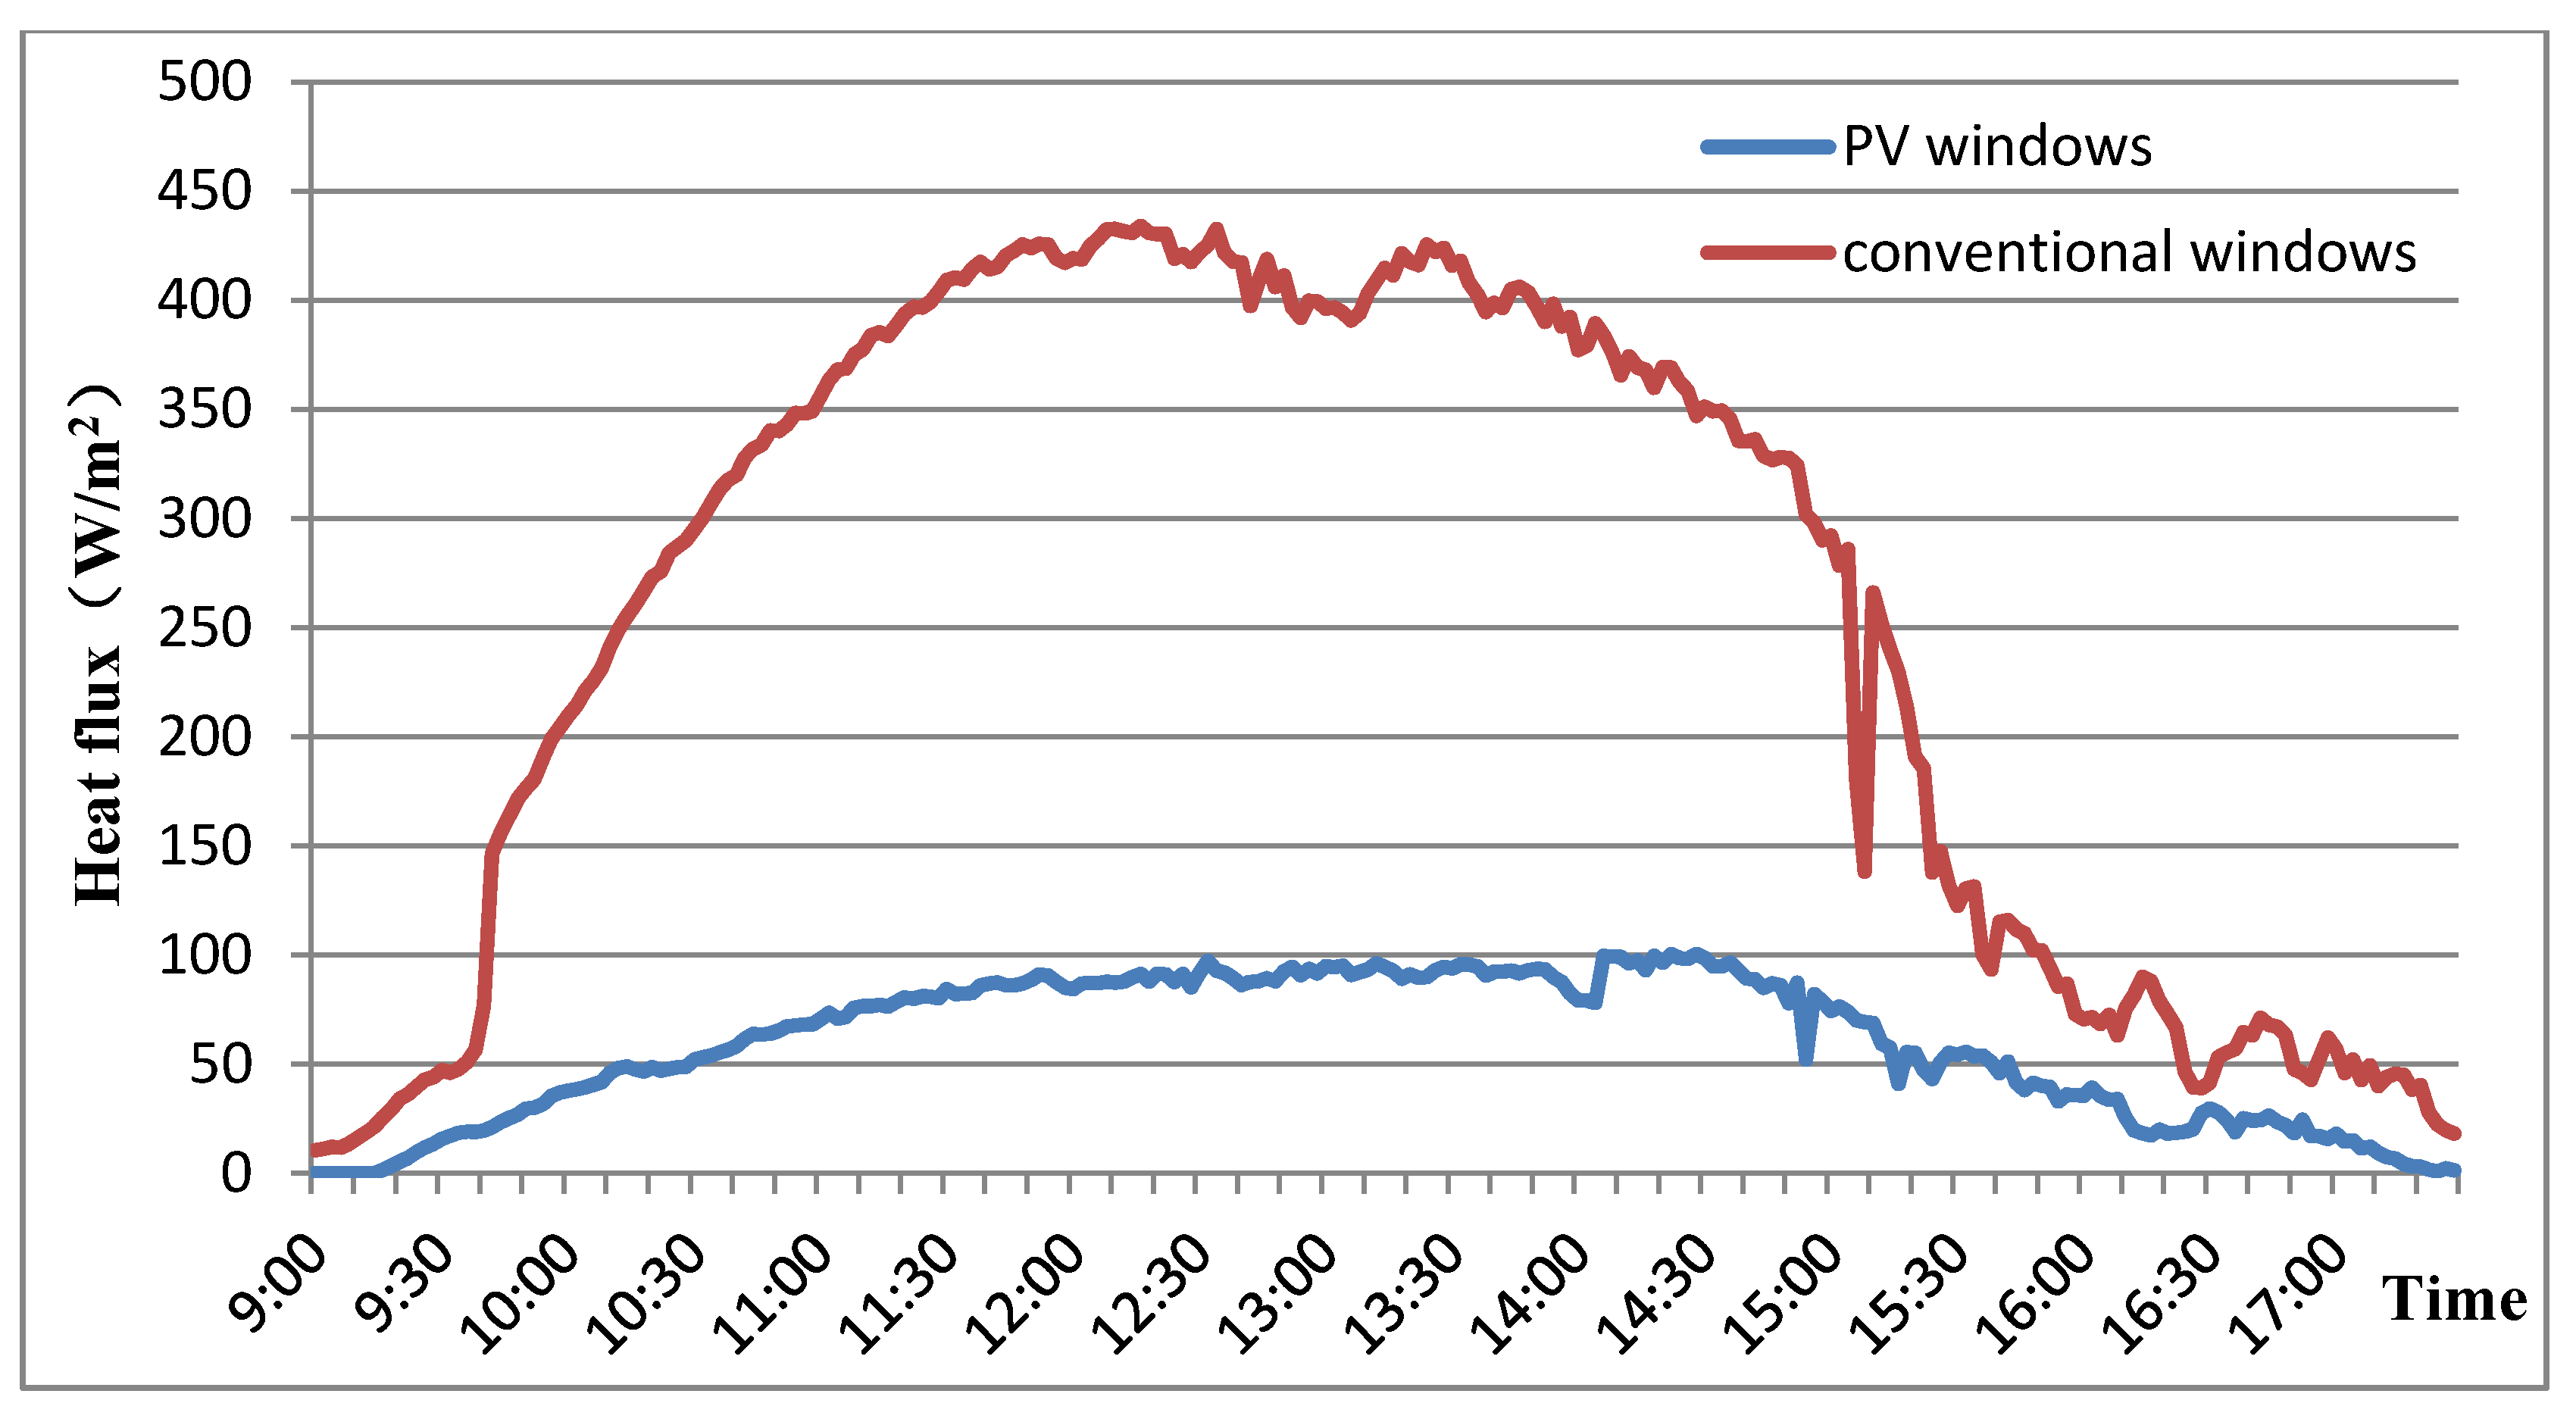
3.2. Thermal Performance Test

The thermal parameters of STPV window that had been tested include surface temperature, solar radiation, and conductive and radiant heat flux. The surface temperature of the windows during those three days is shown in Figure 9. An air-conditioning system was used to maintain the constant indoor temperature of 18 ± 1 °C in accordance to the “Design Code for Heating Ventilation and Air Conditioning of Civil Buildings” GB50736-2012. Since the STPV window releases the heat, the outside surface temperature of STPV windows were higher than inside surface during the day-time. The outside surface temperature of the STPV windows were lower than that of the conventional windows during the night time. It can be observed from Figure 9 that the inside surface temperature remained constant during the night due to the indoor air-condition system. The heat flux of the STPV windows conducted from outdoor to indoor.
Calculated by Equation (4), The Uvalue of the double-skin STPV windows and the conventional windows were 1.6 and 1.7, respectively. The lower Uvalue indicates that the STPV window can reduce the building heating load and, thereby, reduce the potential energy consumption of air conditioning.
The heat flux data of two windows has been shown in Figure 10 and Figure 11. The total heat flux (Gi) was calculated in accordance to Equation (2). The total heat flux consists of conductive heat flux, radiative heat flux, and the solar radiation penetrating though the windows. The average of proportion of the solar radiation penetrating though the windows in total heat flux during the daytime is 80%. The solar radiation that penetrated though the STPV windows was lower than that of conventional windows due to the sunshield of STPV windows during the daytime. The total heat flux of the STPV windows was lower than that of conventional window.
Through the calculation of Equation (3), the SHGC of the double-skin STPV windows and the conventional windows were 0.15 and 0.62, respectively. The lower SHGC value shows that STPV windows could effectively reduce the solar radiation penetrating through the window during the daytime.

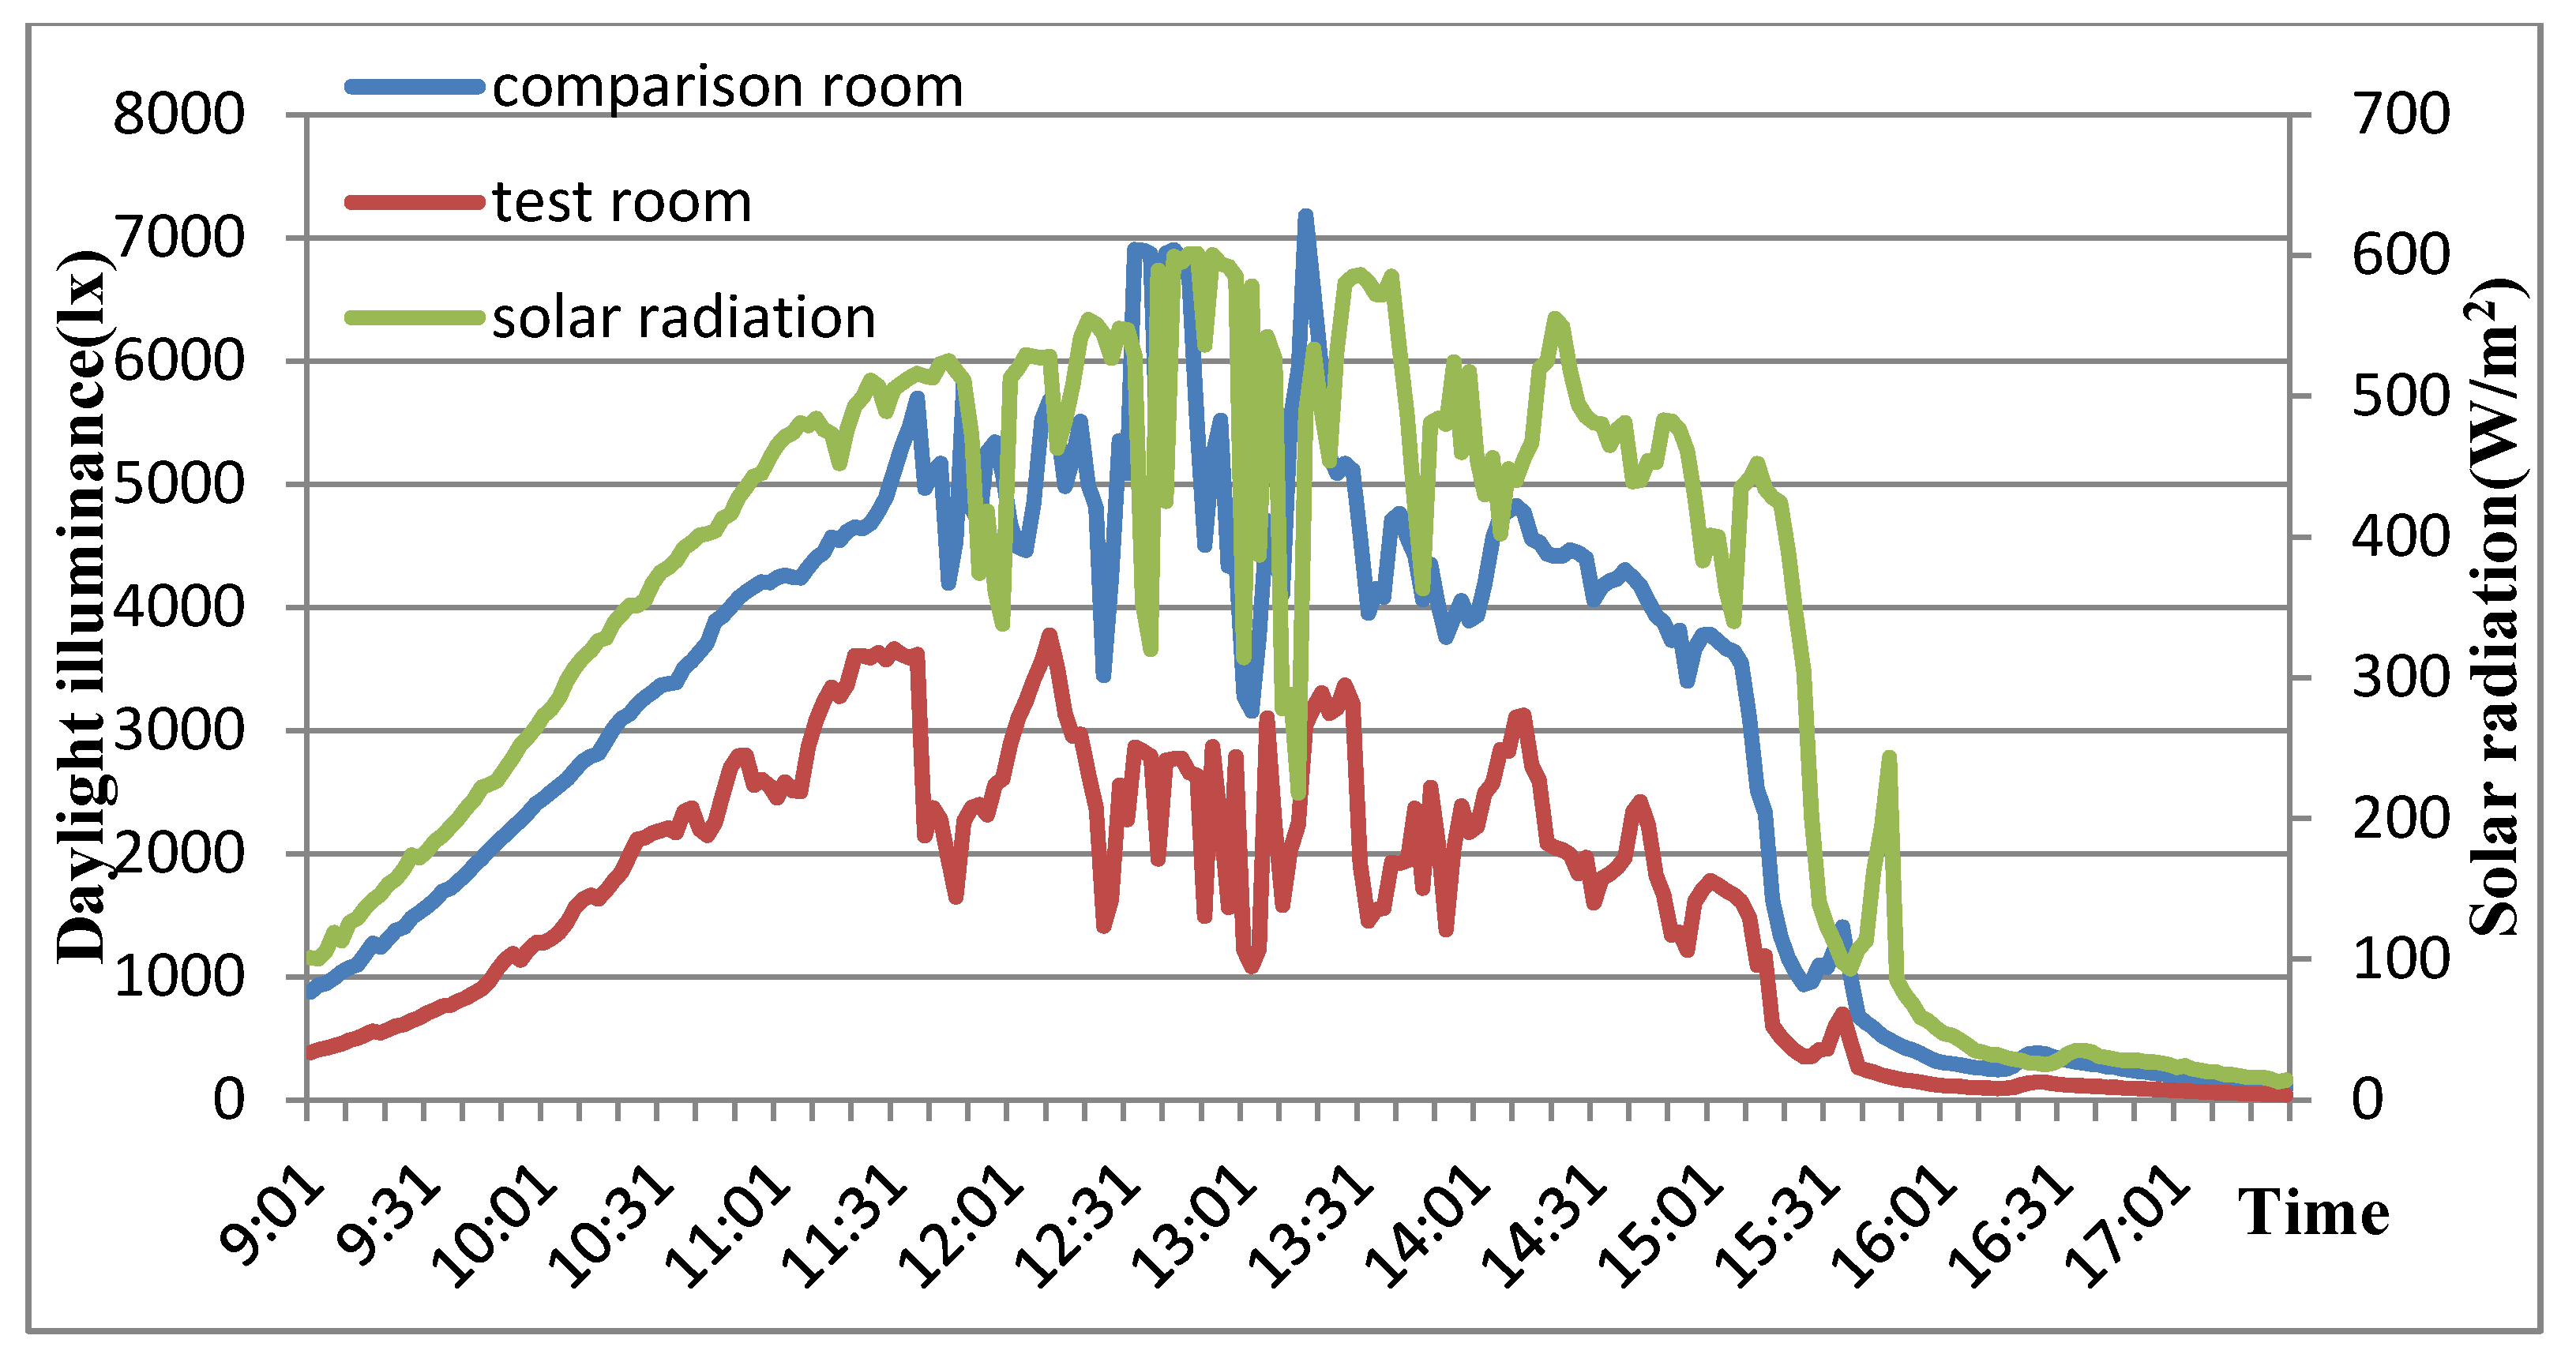
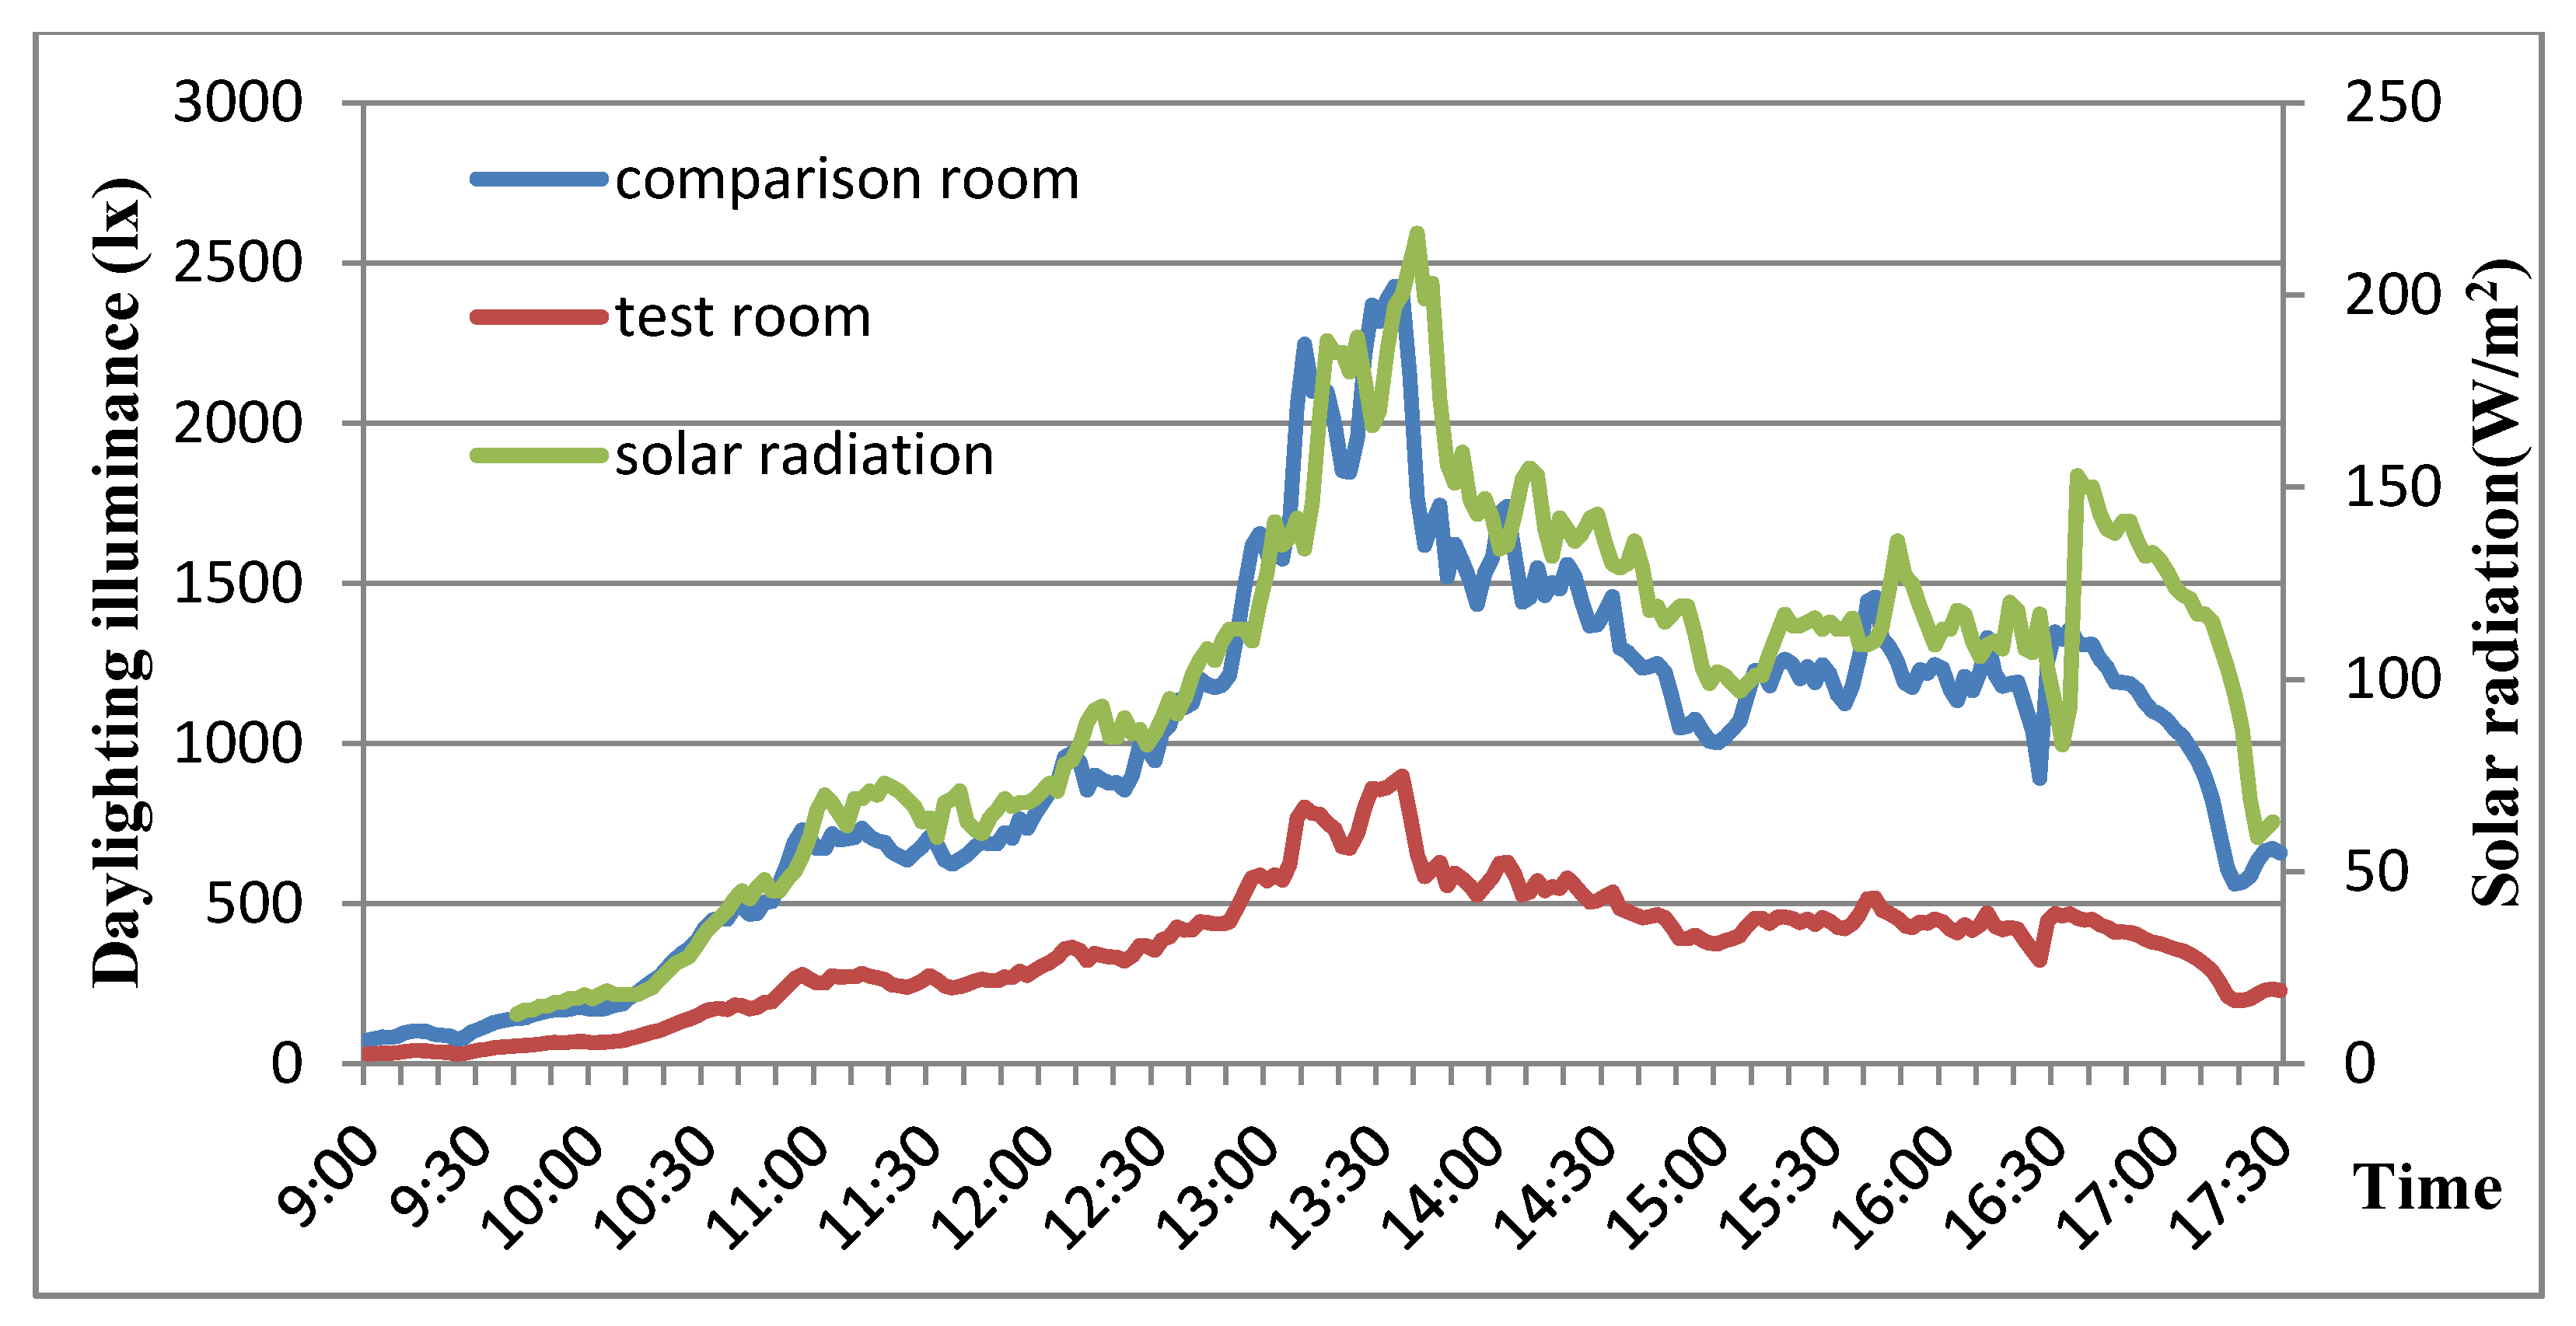
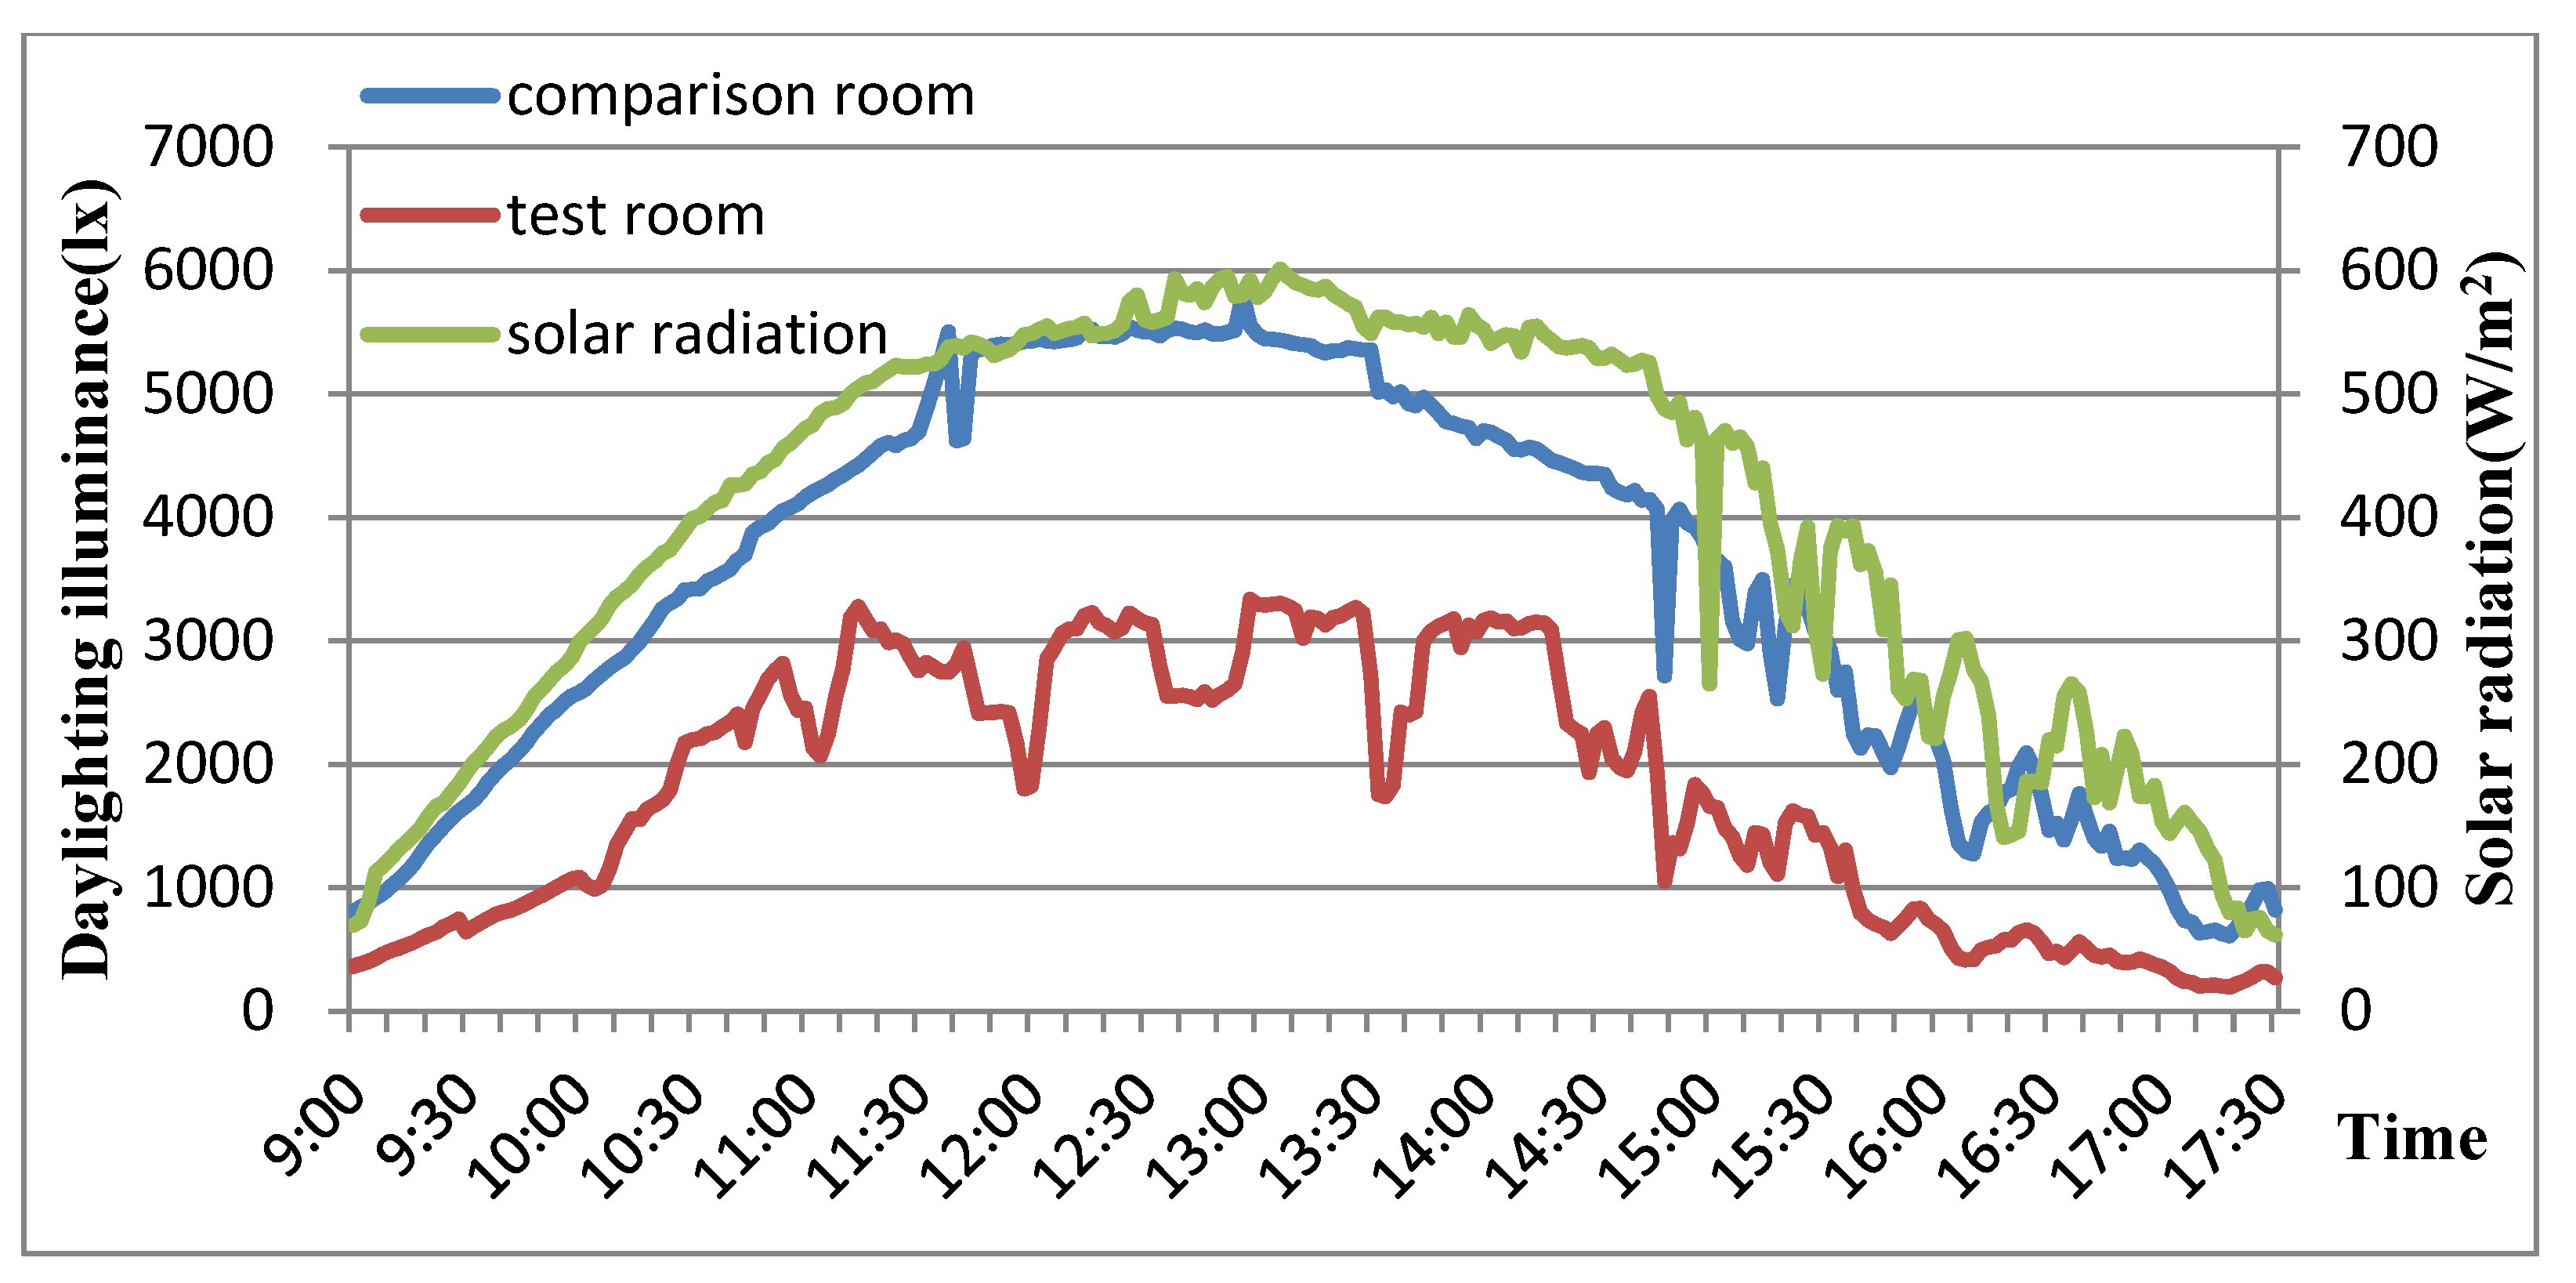
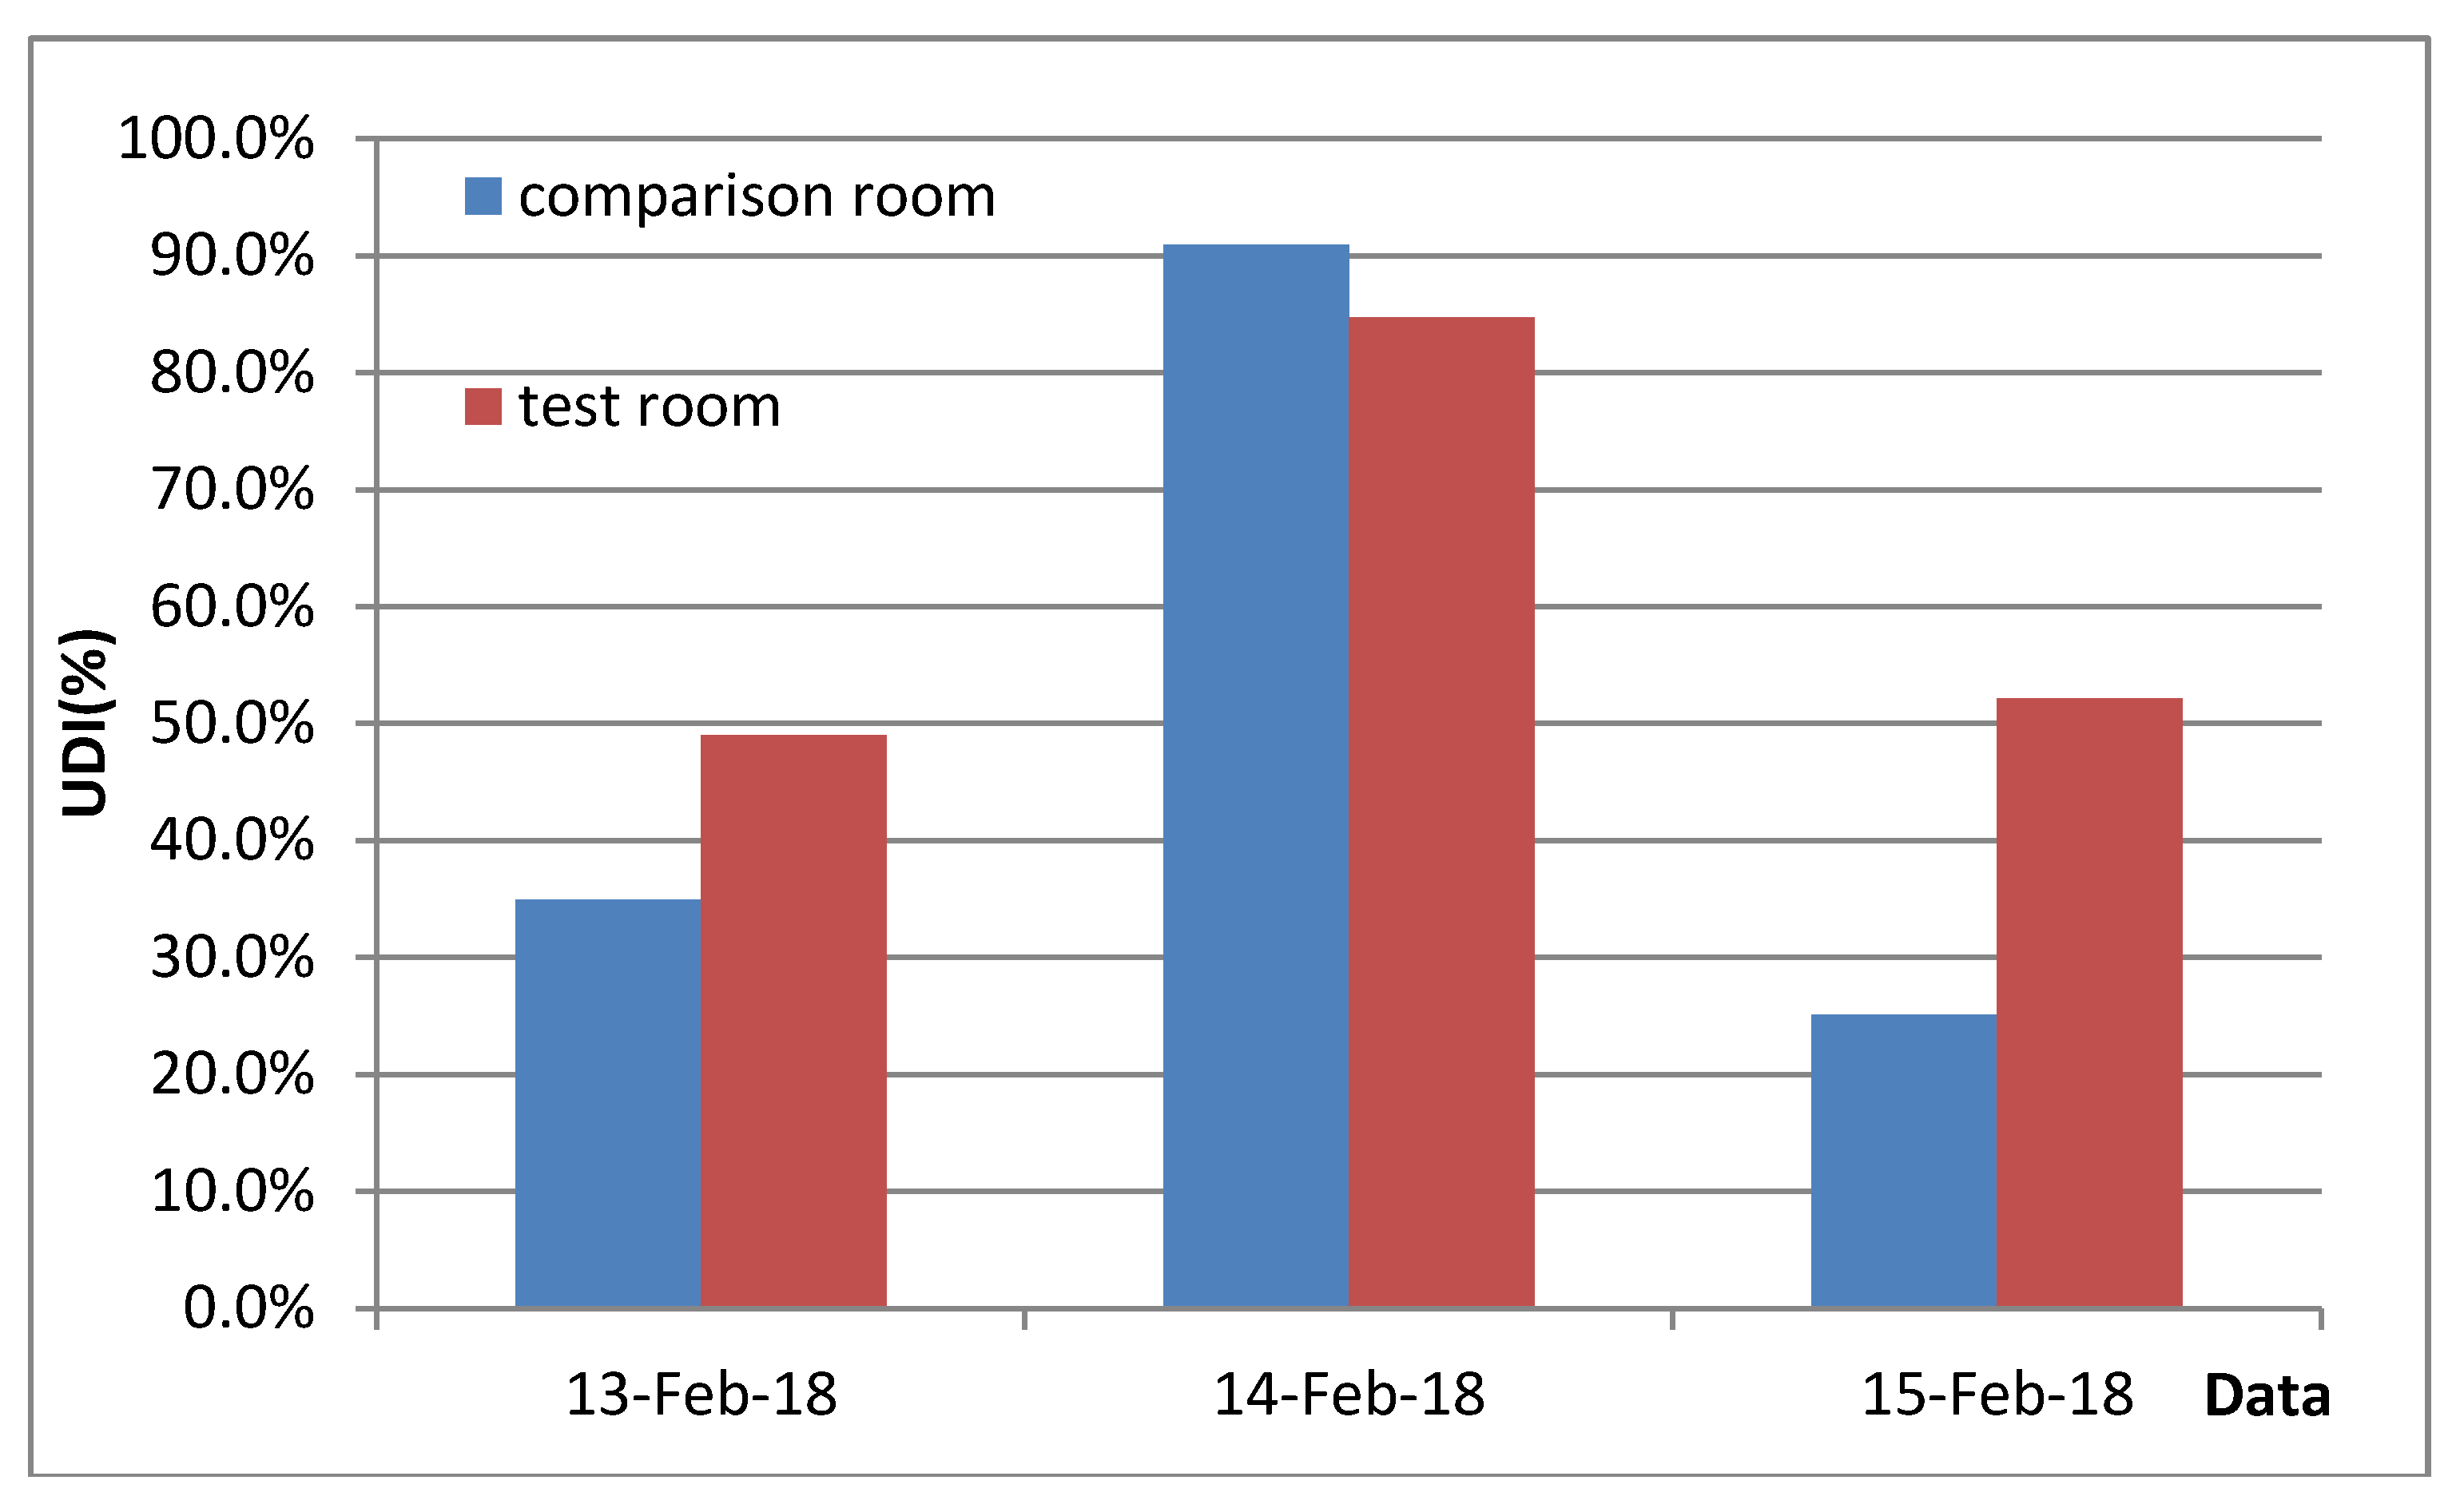
3.3. Lighting Performance Test

The illumination had been tested as shown in Figure 12, Figure 13 and Figure 14. The illumination in the test room with the STPV window was always lower in comparison room to the conventional window since the visible transmittance of STPV window was only 20%.
As shown in Figure 13, the illumination in the test room on a sunny day met requirements (300 lx) determined by the “standard for daylight design of buildings” GB50033-2012. Since the visible transmittance of the STPV window is 20%, it was found that the maximum daylighting illuminance of the test room with STPV windows was only 3165 lx on the sunny day (from Figure 14) while daylight of the comparison room was 6000 lx. This means that the probability of occurrence of glare in comparison room was much higher than that of the test room. On the cloudy day, it was observed that only when the solar radiation was high, the illumination of test room with STPV windows reached 300 lx.
The UDI of those three days is shown in the Figure 15. On a sunny day, the UDI of the test room was better than that of comparison room due to the shielding of the STPV window. The UDI of the test room was 52.2%, while the UDI of the comparison room was only 25.1%. On a cloudy day, since the intensity of solar radiation was low, the UDI of the test room was only 84.7%, while the UDI of the comparison room was 91.0%. In combination with Figure 14 and Figure 15, the illumination in the test room was lower than that in the contrast room, and the UDI of the test room was higher than the comparison room. This means that the STPV window can make more efficient use of daylighting.
In accordance to Equations (6)–(8), Due to the shielding of the STPV window, the average indoor daylighting coefficient on the working surface of the test room was higher than that of the comparison room at 0.67 while that of the comparison room was only 0.12. This shows that the indoor light environment of the test room was always better than that of comparison room. The STPV windows play an important role in the optimization of indoor lighting design.

4. Conclusions

In this paper, the comprehensive energy performance of the a-SiGe STPV windows had been evaluated by the comparison test rig in Chengdu. The highlight conclusions were collected as follows:
  • For the electrical test, the photoelectric conversion efficiency of the STPV windows reached up to 5.79%, even in winter when the intensity of solar radiation was low. The electrical generation of the a-SiGe STPV windows could resolve the partial energy demands of the building in this test because of better utilization of the low-intensity solar radiation.
  • As for the thermal performance test, the SHGC of the double-skin STPV windows and the conventional windows were 0.15 and 0.62 respectively. The Uvalue of the double-skin STPV windows and the conventional windows were 1.6 and 1.7, respectively. The lower SHGC shows that STPV windows could effectively reduce the solar radiation penetrating through the window during the day time. The lower Uvalue indicates that the STPV window can reduce the heat transfer between the inside and outside of building and, thus, reduce the potential energy consumption of air conditioning.
  • With regard to the aspect of day lighting of the test room, the daylighting illuminance of the test room was always lower than that of the comparison room because of the 20% visible transmittance of STPV windows. The results of indoor UDI test show that the UDI of the test room could reach 52.2 on a sunny day, and the UDI of the comparison room was only 25.1. On the cloudy day, it was found that the light uniformity of the test room was better than that of the comparison room. This showed that STPV windows can effectively reduce the illumination of indoor working face when the solar radiation is strong, thereby effectively reducing indoor glare and optimizing indoor natural lighting.
The double-skin a-SiGe STPV windows can provide electrical power in winter even when the solar radiation is weak, reduce heating load and improve the indoor lighting environment comfort. The test results in this paper can be used to support the optimal BIPV design of the BIPV buildings in a hot-summer and cold-winter zone.

Author Contributions

Conceptualization, W.Z.; Methodology, Y.W.; Formal Analysis, W.W.; Investigation, H.T.; Resources, L.Z.; Writing-Original Draft Preparation, W.W.; Writing-Review & Editing, W.Z.; Supervision, W.Z.; Project Administration, L.X.

Funding

This research was funded by National Key Research and Development Program of China: Newton Fund-China-UK Research and Innovations Bridges (No. 2016YFE0124500), the National Natural Science Foundation of China (No. 51508352) and the Key Laboratory Deep Underground Science and Engineering Foundation of Sichuan University, China (No. DUSE201702).

Acknowledgments

This project is funded by National Key Research and Development Program of China: Newton Fund-China-UK Research and Innovations Bridges (No. 2016YFE0124500), the National Natural Science Foundation of China (No. 51508352) and the Key Laboratory Deep Underground Science and Engineering Foundation of Sichuan University, China (No. DUSE201702).

Conflicts of Interest

The authors declare no conflict of interest.

References

  1. Djamel, Z.; Noureddine, Z. The Impact of Window Configuration on the Overall Building Energy Consumption under Specific Climate Conditions. Energy Procedia 2017, 115, 162–172. [Google Scholar] [CrossRef]
  2. Hui, J.Y. The Research on Residential Windows Energy Conservation of the Hot-Summer and Cold-Winter Area. Master’s Thesis, Hunan University, Changsha, China, 2008. [Google Scholar]
  3. Wong, P.W.; Shimoda, Y.; Nonaka, M.; Inoue, M.; Mizuno, M. Semi-transparent PV: Thermal performance, power generation, daylight modelling and energy saving potential in a residential application. Renew. Energy 2007, 33, 1024–1036. [Google Scholar] [CrossRef]
  4. Wang, M.; Peng, J.; Li, N.; Lu, L.; Yang, H. Experimental Study on Thermal Performance of Semi-transparent PV Window in Winter in Hong Kong. Energy Procedia 2017, 105, 864–868. [Google Scholar] [CrossRef]
  5. Fung, T.Y.Y.; Yang, H. Study on thermal performance of semi-transparent building-integrated photovoltaic glazings. Energy Build. 2007, 40, 341–350. [Google Scholar] [CrossRef]
  6. He, W.; Zhang, Y.X.; Sun, W.; Hou, J.X.; Jiang, Q.Y.; Ji, J. Experimental and numerical investigation on the performance of amorphous silicon photovoltaics window in East China. Build. Environ. 2010, 46, 363–369. [Google Scholar] [CrossRef]
  7. Wang, M.; Peng, J.; Li, N.; Lu, L.; Ma, T.; Yang, H. Assessment of energy performance of semi-transparent PV insulating glass units using a validated simulation model. Energy 2016, 112, 538–548. [Google Scholar] [CrossRef]
  8. Costanzo, V.; Yao, R.; Essah, E.; Shao, L.; Shahrestani, M.; Oliveira, A.C.; Araz, M.; Hepbasli, A.; Biyik, E. A method of strategic evaluation of energy performance of Building Integrated Photovoltaic in the urban context. J. Clean. Prod. 2018, 184, 82–91. [Google Scholar] [CrossRef]
  9. Cucchiella, F.; D’Adamo, I.; Lenny Koh, S.C. Environmental and economic analysis of building integrated photovoltaic systems in Italian regions. J. Clean. Prod. 2015, 98, 241–252. [Google Scholar] [CrossRef]
  10. Park, K.E.; Kang, G.H.; Kim, H.I.; Yu, G.J.; Kim, J.T. Analysis of thermal and electrical performance of semi-transparent photovoltaic (PV) module. Energy 2010, 35, 2681–2687. [Google Scholar] [CrossRef]
  11. Olivieri, L.; Caamaño-Martin, E.; Olivieri, F.; Neila, J. Integral energy performance characterization of semi-transparent photovoltaic elements for building integration under real operation conditions. Energy Build. 2014, 68, 280–291. [Google Scholar] [CrossRef] [Green Version]
  12. Kapsis, K.; Dermardiros, V.; Athienitis, A.K. Daylight Performance of Perimeter Office Façades utilizing Semi-transparent Photovoltaic Windows: A Simulation Study. Energy Procedia 2015, 78, 334–339. [Google Scholar] [CrossRef]
  13. Li, D.H.W.; Lam, T.N.T.; Cheung, K.L. Energy and cost studies of semi-transparent photovoltaic skylight. Energy Convers. Manag. 2009, 50, 1981–1990. [Google Scholar] [CrossRef]
  14. Manual for Outdoor PV Test SYSTEM. 2018. Available online: http://www.ei41.com/Home/JSZC_Search?openPartTypeName=jishuzhichi_chanpinziliao (accessed on 15 March 2018).
  15. Nie, J.; Weng, Z.; Liu, B.; Zhang, G.; Zhang, M.; Wei, S.; Chen, D. The Influence of Different Wavelength Light on the Characteristics of Flexible Solar Cell. Phys. Bull. 2015, 3, 118–121. [Google Scholar]
  16. Lv, X. The Strategy of Energy Saving Design of Office Building Windows in Hot-Summer and Cold-Winter Area. Master Thesis, Hefei University of Technology, Hefei, China, 2010. [Google Scholar]
  17. Chow, T.T.; Li, C.; Lin, Z. Innovative solar windows for cooling-demand climate. Sol. Energy Mater. Sol. Cells 2010, 94, 212–220. [Google Scholar] [CrossRef]
  18. Marinoski, D.L.; Güths, S.; Pereira, F.O.R.; Lamberts, R. Improvement of a measurement system for solar heat gain through fenestrations. Energy Build. 2007, 39, 478–487. [Google Scholar] [CrossRef]
  19. Fokaides, P.A.; Kalogirou, S.A. Application of infrared thermography for the determination of the overall heat transfer coefficient (U-Value) in building envelopes. Appl. Energy 2011, 88, 4358–4365. [Google Scholar] [CrossRef]
  20. Wei, W.; Kunpeng, L. An Introduction of New Daylighting Evaluation Criteria: A Replacement for Daylight Factor. China Illum. Eng. J. 2012, 23, 1–7. [Google Scholar]
  21. Nabil, A.; Mardaljevic, J. Useful daylight illuminances: A replacement for daylight factors. Energy Build. 2006, 38, 905–913. [Google Scholar] [CrossRef]
  22. Method of Daylighting Measurement; Standardization Administration of China: Beijing, China, 2017.
Figure 1. Schematic diagram of double-skin STPV window.
Energies 11 01700 g001
Figure 2. Test rig.
Figure 2. Test rig.
Energies 11 01700 g002
Figure 3. Measurement instruments of the test rig.
Energies 11 01700 g003
Figure 4. Schematic diagram of the indoor environment test instruments.
Energies 11 01700 g004
Figure 5. G.
Figure 5. G.
Energies 11 01700 g005
Figure 6. Power generation of PV windows.
Energies 11 01700 g006
Figure 7. The IV curve of STPV window at noon on 13 February.
Energies 11 01700 g007
Figure 8. Photoelectric conversion efficiency.
Energies 11 01700 g008
Figure 9. Surface temperature of windows.
Energies 11 01700 g009
Figure 10. Heat flux through windows in 13 February 2018.
Energies 11 01700 g010
Figure 11. Heat flux through windows in 15 February 2018.
Energies 11 01700 g011
Figure 12. Illumination on work surface in 13 February 2018.
Energies 11 01700 g012
Figure 13. Illumination on work surface in 14 February 2018.
Energies 11 01700 g013
Figure 14. Daylight illuminance on work surface in 15 February 2018.
Energies 11 01700 g014
Figure 15. The UDI of those three days.
Energies 11 01700 g015
Table 1. Physical and electrical properties of STPV window and conventional window.
a. Physical properties of STPV window
Layer/Propertythickness (mm)
glass-tempered6
Air gap9
Single STPV window10
b. Physical properties of conventional window
Layer/Propertythickness (mm)
glass-tempered8
Air gap9
glass-tempered8
c. Electrical properties of STPV window
PV module typea-SiGe
Maximum power under STC (W)50
Photoelectric conversion rate6.7%
d. Other properties of windows
Dimension of each STPV window and conventional window1.24 m (L) × 0.64 m (W)
Visible transmittance of the STPV window20%
Weight density of the double-skin STPV window40 kg/m2
Table 2. The key instruments and their specifications [14].
EquipmentManufactureFunction and ModelAccuracy/Sensitivity
Outdoor multi-channel PV test equipmentCeyear AV6595APV testing (three 500 W module and one 10 kW module)0 W–10 kW
Solar radiation test equipmentAV87110Testing the solar radiation upon the south façade0~1800 W/m2; ±3%
Weather stationJ.tWeather condition recorderTemperature: ±0.5 °C, humidity: 0.1%, ±2%; atmospheric pressure: 1 mbar; wind rate: 0.1 m/s; wind direction: ±5%
ThermocouplesJ.tTemperature test (T type thermocouple)−20 °C–100 °C; 0.1 °C; ±0.5 °C
Heat flux metersJ.tHeat flux testing−2000 W/m2–2000 W/m2; 0.1 W; 4%
Light meterJ.t-0–100,000 lux; 1 lux; ±4%
Multi-channel data recorderJ.tData collectorThe minimum resolutions are 1 μV and 0.1 °C

