Abstract
The medium-voltage direct-current (MVDC) ship power system has been extensively investigated and discussed in recent years. This paper presents an alternating current/direct-current (AC/DC) power flow algorithm based on complex affine arithmetic for the zonal MVDC shipboard power system in the presence of power variation. The power converter effect is considered, and an affine power converter model is proposed in the power flow model. An affine-analysis-based sequential method is adopted to solve AC/DC power flows. With the proposed algorithm, the bounds of bus voltages can be effectively obtained. A relative influence factor is defined to quantitatively assess the effect of power variation on voltage profile. Four cases are studied in detail to demonstrate the applicability of the proposed algorithm. The proposed algorithm is useful in network architecture design, planning, and online operations of MVDC power systems when such decisions are subject to power variation.
1. Introduction
With the exploitation of integrated electrical propulsion technologies and the gradual increase in high-energy electrical loads, the U.S. Navy proposed the Medium Voltage DC (MVDC) distribution architecture for the all-electric shipboard power systems (SPSs) [1,2]. The MVDC distribution has benefits, such as higher energy efficiency and power density, lower installation and maintenance costs, and a more flexible design [3,4]. However, as a newly proposed concept, detailed investigation for operational characteristics of MVDC distribution is of great concern [5]. Two topologies for an MVDC shipboard power system have been defined [6]. One is the radial distribution, which has the advantages of simplicity and low cost. The other is the zonal distribution, in which the medium voltage power supply path is circular. Any zonal load is supplied by two lines to avoid power outage; the network structure is more complex and flexible for the zonal distribution. This network structure can improve the reliability of the power supply and survivability of the system. It is recognized as having future potential as the main structural form. Since the MVDC electric distribution systems are still in a conceptual phase, there is a lack of benchmark systems, which makes the need to fully understand the operating characteristics of the zonal MVDC distribution crucial.
MVDC shipboard power systems are characterized by short lines, special load types, lots of converters, isolated networks, and complex operating conditions. High stability and reliability are requested for this system. It is important to maintain both the voltage and the line power flow within limits to keep steady state security under all kinds of operating conditions [7], especially for navy ships. Power flow analysis is the most fundamentally used tool to assess the static security of a power system for specified input values, referred to here as a deterministic power flow which has been widely applied in early non-electric propulsion ship systems. Deterministic power flow algorithm is studied for MVDC shipboard distribution systems in [8,9]. However, it is remarkable that load powers are changeable in the different operational conditions for MVDC shipboard power systems. For instance, propulsion loads, which make up nearly two-thirds of the whole system load, vary with large range under full speed, cruise, and docking mode. Service loads, cable lifter, and other loads also have power variation according to the different operating mode. Furthermore, renewable energies have been recommended for use in large ship systems to save energy and reduce emissions; fluctuating power is characteristic of renewable energy generation. Thus, it can be seen that the power fluctuation is more complicated and changeable for the MVDC shipboard power system compared with the traditional ship power system. In order to fully understand and master the impact of power fluctuation to the system, numerous power flow scenarios need to be analyzed that require a large investment of time and computational resources. In addition, the future warship is envisioned to have an approximate 70% (or greater) decrease in the numbers of crew and a subsequent increase in automation. Thus, it is crucial that the ship’s crews are provided with quick decision support, and action could be taken more quickly and effectively in some circumstances, such as network reconfiguration due to battle damage or equipment failure. A rapid and effective method is therefore needed to analyze power flow under power uncertainty, which is convenient and useful for shipboard power network topology design, reconfiguration, network optimization, voltage control, and others [10,11].
There are three major methods to model uncertainty power flow: the probabilistic method [12], the fuzzy method [13], and the interval method. The first two methods depend on the statistical dependence or probability distributions of input data. However, it is hard to obtain statistical load change data due to complex operational conditions or lack of prior experience for ship zonal MVDC power systems. The interval algorithm (IA) is able to solve the power flow when the upper and lower bounds of uncertain input data are known. The application of IA to power flow analysis has been investigated by various authors [14,15,16]. However, its conservativeness results in impractical bounds, especially in complicated expressions or long iterative computations. To overcome the IA limitations, an affine algorithm (AA) is proposed. This algorithm uses the affine form instead of the interval form to describe the uncertainties of power injections and has been researched widely in recent years [17,18,19,20,21,22,23,24,25]. References [18,21] demonstrate that the AA-based power flow method returns tighter bounds on power flow results than those obtained via IA and has a better computational performance. In addition, AA can trace the impacts of individual input uncertainties on power flow solutions; it is helpful for shipboard zonal-distribution topology-structure design and network reconfiguration.
Affine arithmetic was first applied to transmission system power flow according to ref. [18]; it was shown that affine arithmetic better handles uncertainty compared to the traditional and widely used IA approaches. As well, balanced and unbalanced three-phase radial distribution system power flow based on affine arithmetic have been presented [19,20]; an index of relative influence is proposed in ref. [20] to study the impacts of uncertainties on power flows. AA is applied to an optimization-based power flow model for computing reliable enclosures of uncertain power flow in ref. [21,22]. Evidence theory and AA are combined to analyze uncertain power flow, which can deal with probabilistic, possibilistic, and interval inputs [23]. AA is further used to explore the application for optimal power flow, regional control of unscheduled power fluctuation, and stochastic information management [22,24,25]. At present, these papers mainly focus on uncertain power flow of AC transmission and distribution systems. To the best of the authors’ knowledge, AA has not been presented for an AC/DC power system with converters, and in particular, for an MVDC shipboard power system, in which the widespread use of converters complicates the network structure [26]. The MVDC shipboard power system is an AC/DC hybrid system, where generators transmit power to DC networks through converters, and loads receive power from DC networks through converters. There are many rectifier and inverter converters on both generator and load sides for the MVDC shipboard power system; converter power loss cannot be omitted for accurate power flow calculation. Thus, AC/DC power flow based on AA needs to be investigated carefully. The present paper provides a power flow algorithm based on affine arithmetic for an MVDC shipboard power system with consideration of power variation. A power flow model of power converters based on AA is derived. A complex AA-based sequential AC/DC power flow method is discussed for an MVDC shipboard power system to analyze the effects of power variation. Two alternative network structures are compared, and the effect of the power variation on bus voltages is analyzed.
The rest of the paper is organized as follows: Section 2 briefly describes the zonal MVDC shipboard power system architecture. Section 3 gives a description of affine arithmetic. Section 4 develops a sequential power flow algorithm based on AA. Section 5 presents a relative influence factor for analyzing the effect of power variations on the MVDC shipboard power system. Section 6 discusses case studies.
2. Zonal MVDC Shipboard Power System Architecture
A zonal MVDC shipboard power system architecture is shown in Figure 1. The medium voltage DC ring bus is used to collect and distribute power with voltage range from ±3 kV to ±10 kV. The two main and the two auxiliary generators feed power to the DC bus through transformers and rectifiers; then, DC power is distributed to propulsion loads, pulsed loads, and load centers along the DC line. All kinds of low voltage AC loads and DC loads, distribution modules, and converters are included in load centers. Each load center is fed by two lines for improving reliability and survivability of shipboard power system. In this study, a simplified model is considered, which means that all loads are treated as a lumped load in each load center.

Figure 1.
Zonal MVDC shipboard distribution systems.
3. Concept and Rules of AA
Power variations include active and reactive power changes and need to be described in complex affine form. Uncertain complex variables x can be represented by linear polynomials:
where refers to real values of noise in the interval [−1, 1] that are independent of each other. is the central value of affine form , which is a complex number. is also a complex number. are error terms that indicate nonlinear dependency.
The four fundamental operation rules of complex affine arithmetic can be found in [27]. In addition, this work requires , , and operations; further details are provided in ref. [28].
In the case of a shipboard power system, the upper and lower bounds of power variation can normally be estimated, giving the interval [,]. It is necessary to convert complex intervals to complex affine forms and vice versa for the purpose of calculation. A complex interval number is given by:
which can be converted into the equivalent complex affine form [27]:
where , , and .
There is no information loss when an interval is converted to an affine form. Similarly, considering an affine number as given in Equation (1), the interval number may be obtained according to , where:
Note that all information regarding interdependencies between parameters is lost in the process of conversion.
4. Complex AA-Based AC/DC Power Flow Algorithm
An AC/DC hybrid power flow can usually be subdivided into unified and sequential methods. Unlike unified methods, in which the AC and DC system are computed simultaneously, the sequential method solves the AC and DC system equations sequentially. For the sequential method, it is easy to extend existing AC power flow programs to AC/DC programs. In view of this advantage, the present work adopts a sequential method. The sequential method comprises three parts: AC network power flow, converters calculations, and DC network power flow.
4.1. Complex Affine Mathematical Model for AC Power Flow Algorithm
In AC systems, all variables are complex numbers, and the affine equations are given as complex forms. AC networks have radial topologies with high R/X ratio of lines in MVDC shipboard power systems. Therefore, the forward–backward sweep method is suited for solving the power flow. For the convenience of the following formulation, a typical model of AC series components in a shipboard DC power system is shown in Figure 2.
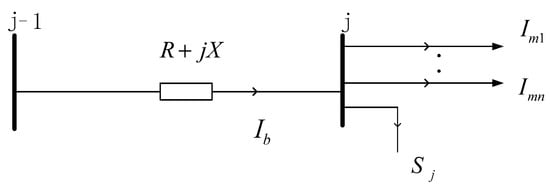
Figure 2.
Structure of AC series components.
AA-based AC power-flow equation for the forward–backward sweep method is given below. There are mainly three iterative steps:
(1) Nodal current injections
Initial bus voltages can be set as nominal voltage values; in the next iteration steps represented by Equation (6), bus voltages will be affine numbers:
where is the bus number.
Nodal power injection, which is the difference between generator power and load power, has an uncertain relation to power variation. It is expressed by complex affine numbers as shown in Equation (7):
Then, nodal current injections of complex affine form in th iterative step can be calculated:
(2) Branch current calculations
The branch currents are calculated from the end bus to the root bus; the affine form of each branch current can be calculated in th iterative step as follows:
where is the current of the branch directly connected to branch b.
(3) Bus voltages update
The bus voltages are updated from the root bus towards the end bus; usually, the root node voltage is given for radial networks. In the MVDC shipboard power system, the root bus of each AC network is connected to a converter, and the root node voltage is controlled and given by the converter. The affine form of each bus voltage can be calculated via Equation (10):
The iterative process between the Formulas (8)–(10) continues until the distance between and of all bus voltages are sufficiently close; the convergence conditions can be determined as:
where is number of nodes, and , are interval upper and lower bound of bus voltage, which are obtained from affine values of bus voltage via Equations (4) and (5). is the specified voltage error tolerance value; here, .
4.2. Complex Affine Mathematical Model for the Converter
Among several types of converters, voltage source converter (VSC) technology is desirable for the MVDC distribution system due to its rapid and independent control ability of real and reactive power [29,30]. The mathematical model of a VSC is crucial for solving AC/DC power flow. The AA model of the VSC for the sequential method is given below.
A model of a VSC station is shown in Figure 3. is the reactor impedance, and are the voltage and current of the DC bus connected to the VSC station, respectively; AC bus is connected to AC generators or AC loads; , , and represent injected active and reactive power and voltage at bus ; and is the modulation voltage of bus c connecting with the VSC station. The voltage magnitude and angle of can be controlled; i.e., the power flow through the VSC is controllable.
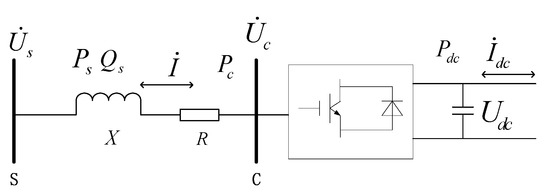
Figure 3.
Model of a VSC station.
The key to modeling the converter is to determine the modulation voltage . According to circuit theory and the complex affine algorithm, the complex affine value of current flowing between buses and can be written as:
where is the complex affine value of power, and is the complex affine value of voltage.
The complex affine value of modulation voltage can be expressed as:
where is the complex affine value of the voltage difference between buses and .
In addition, power and voltage constraints between the converter and the DC side need to be satisfied:
where is the modulation factor, , and and are the AC- and DC-side active power of the converter, respectively. Formulas (12)–(15) constitute the VSC converter complex affine model for the power flow calculation.
4.3. AA-Based DC Power Flow Equation
The iterative algorithm of the power flow of the DC network depends on the shipboard network structure. In practice, zonal loads are usually supplied by one line, and the other line is run as a standby option. The zonal distribution architecture thus contains only one looped network and is known as a weakly meshed distribution system. The forward–backward sweep method works well for the radial and weakly meshed distribution system. The AA-based DC power-flow algorithm is given below:
Step 1: The meshed network is broken at breakpoint in order to convert the DC network into one pure radial network.
Step 2: Solve the radial network by the forward–backward sweep method. In a DC system, all variables are real numbers, and thus, the affine equations are also real. The calculation steps of DC radial network are the same as the AC power flow algorithm in Section 4.1, except compensating currents are injected.
Backward sweep branch currents can be written as:
where is breakpoint compensating current if node j is just a breakpoint, and the initial value is set to zero.
Forward sweep bus voltage is as follows:
Step 3: Calculate the compensating current at broken node. As shown in Figure 4, the branch currents interrupted by the creation of breakpoint can be replaced by compensating current injections at its two end nodes. The compensating current can be solved in kth iterative process as in Equation [31]:
where refers to the port resistance, is breaking-point voltage which can be obtained from Step 2. Note that the compensating current must be injected with opposite polarity at the two nodes of the breakpoint shown as Figure 4.
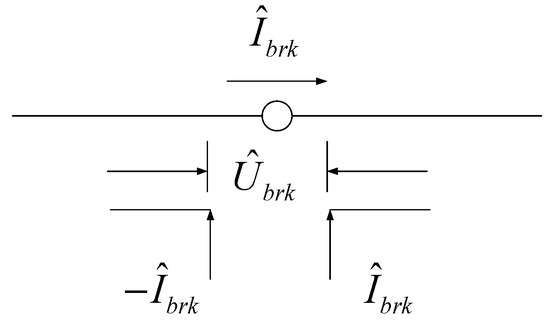
Figure 4.
Breakpoint current injection.
Step 4: Update the compensating current:
The iterative process between Step 1 to Step 3 continues until the distance between and of all bus voltages are sufficiently close in radial network, and the breakpoint voltage mismatch is small enough. The convergence can be written as:
where is number of DC nodes, and are the upper and lower bounds of bus voltage, respectively. is error and takes a value of 0.0001.
4.4. Flow Chart of AC/DC Power Flow Algorithm
Figure 5 is a flow chart of the AA-based AC/DC sequential power-flow algorithm. The control variables of the VSCs are usually on the AC side but connected to the DC swing bus. Firstly, the AC power flow can be solved; therefore, the procedure of AC/DC power flow incorporating the VSC begins from solving AC networks. With AC network voltages and power injection obtained by Equations (7)–(11), the converter-side modulation voltage , current , and DC-side power can be calculated using Equations (12), (13), and (15). With known, DC power flow can be obtained according to Equations (16)–(20).
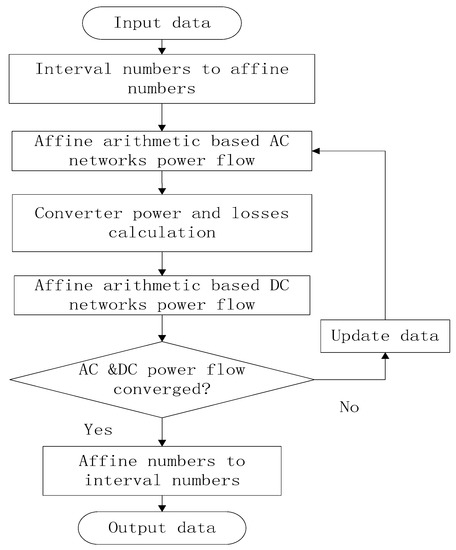
Figure 5.
Flow chart of affine-arithmetic-based AC/DC power flow.
5. Relative Influence Factor
AA can be used to track the relevance between input and output variables along with the calculation procedure, thereby providing a record of the effects of individual input changes on the output variables. The index of the relative influence of uncertain variables on outcome has been defined in ref. [20] and describes the effect of the real affine number inputs on output variables, whereas it is not applicable for complex affine number inputs. Either active power or reactive power variations can affect bus voltages in the system. The relative influence factor is proposed to evaluate the effect of the uncertain load power on bus voltages in this paper and can be used to quantify the effects of the complex uncertainty input on output variables.
For a system, any independent uncertain input variable can be expressed by Equation (21), and the output can be written as:
where coefficients represent contributions of uncertain input variables to output variables. The relative influence factor of a complex affine input variable for real and imaginary components of an output variable are therefore defined as:
For instance, considering two uncertain input variables , , the function can be written as . The relative influence factors of two uncertain variables and the error approximation term for the real component of are 61.5% (i.e., 8/13), 30.7% (i.e., 4/13), and 7.7% (i.e., 1/13), respectively. Similarly, the relative influence factors of two uncertain variables and error approximation term for the imaginary component of are 56.1% (i.e., 32/57), 38.5% (i.e., 22/57), and 5.2% (i.e., 3/57), respectively.
6. Case Studies
This section presents simulation results of the proposed sequential AC/DC power flow algorithm based on affine arithmetic. All tests were performed in MATLAB software. Figure 6 presents 20-bus ship MVDC distribution systems suggested by local shipbuilding corporations as test systems [8]. Two alternative structures of generators and converters, referred to as the unit-connected generation scheme (UCGS) and group-connected generation scheme (GCGS), are considered, as shown in Figure 6a,b. The former is more reliable while the latter is easy to manage and control. The present paper compares the static performances of the UCGS and GCGS under the same operating conditions and analyzes the effect of the power variation on bus voltages.
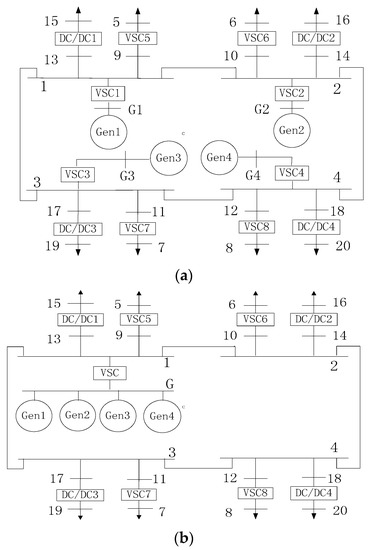
Figure 6.
MVDC shipboard test systems. (a) Unit-connected generation scheme; (b) Group-connected generation scheme.
Figure 6 shows that there are four DC/DC converters in addition to the VSC; the purpose of these four converters is to step down a medium DC voltage to a lower DC voltage for supplying DC loads. The converters can be regarded as a DC transformer, with a duty ratio D = 0.4. In addition, considering the MVDC shipboard power system structure as only generators and loads, there is no other network on the AC side, in contrast to the situation for an AC/DC power system on land. VSC control modes should therefore keep AC-side voltages, except the VSC1 voltage, constant; i.e., the voltages of buses 2–8 are 1.0 (p.u.), while VSC1 is regarded as a swing bus of the DC network that maintains the DC power balance. Appendix A lists element data and given values of variables. In this system, AC loads of buses 6 and 8 are loads of the propeller propulsion motor.
6.1. Case A: Validity of the Proposed Algorithm
In order to demonstrate the effectiveness of the proposed algorithm, the IA-based algorithm and Monte Carlo (MC) method with 5000 trials are listed to compare with the proposed algorithm (AA based algorithm). Without loss of generality, it is assumed that there is power uncertainty tolerance on all loads and Gen3 (suppose Gen3 is renewable generator). UCGS are used to test, and bus voltages bounds obtained by three algorithms are depicted in Figure 7; the simulation results show that the ranges of solutions of proposed algorithm completely contain the bounds obtained from the MC method. It demonstrates that the proposed algorithm has proper approximation of power flow solutions, and this can be regarded as an advantage of the proposed approach, because the MC method tends to underestimate the worst-case variations in the absence of the probability distribution of input variables. Moreover, the ranges of solutions of the proposed algorithm can give tighter bounds than that of the IA-based method; it reflects that the proposed algorithm has more accurate results and avoids the overestimation of the IA-based method.
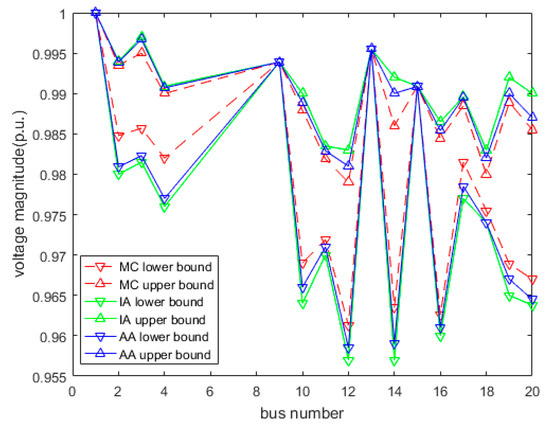
Figure 7.
Bus voltage bounds for three different methods.
The mean absolute error (MAE) is used to compare the accuracy of the proposed algorithm and the IA-based algorithm in Table 1. The upper and lower bounds of the voltage in the MC simulation are assumed to yield the “correct” solution; power uncertainty tolerance from to are considered. Results show that the MAEs of two algorithms increase as the uncertainty tolerance increases, however the proposed algorithm always has less deviation than the IA-based algorithm.

Table 1.
MAE analysis under different uncertainty tolerances.
6.2. Case B: Network Topology Selection
As propulsion loads make up nearly two-thirds of the whole system load, which mainly affects the shipboard power system, the power fluctuation of the propulsion loads is considered in this case. According to different operating conditions, the sliding interval of the load power of two propellers is set as [0.8, 1] + j[0.16, 0.2], corresponding to the affine form .
Employing the proposed AC/DC power flow algorithm, bus interval voltage bounds of the UCGS (VupU and VloU) and GCGS (VupG and VloG) are depicted in Figure 8. Voltages of buses 9, 13, and 15 do not change because they are connected to swing bus 1, while other bus voltages change with the load power variation. For the same load variation, the bus voltage is closer to the rated value (1.0 p.u.) for the UCGS than that for the GCGS. Most voltages are out of range (0.95 p.u.) in the GCGS. The differences between upper and lower limits of the voltage interval values (DULVI) for the two alternatives are shown in Figure 9a. A larger difference is observed for the GCGS, which means that DC voltages are strongly affected by the load variation in the GCGS. The differences between upper and lower bounds of M interval values (DULMI) for the two alternatives are depicted in Figure 9b. Similarly, it is found that M undergoes larger variations to maintain a constant AC-side bus voltage in the GCGS than in the UCGS.
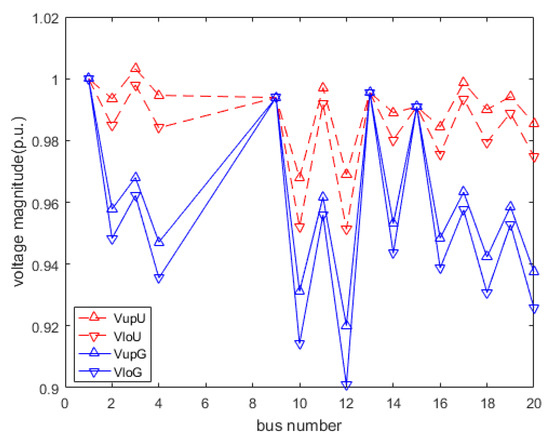
Figure 8.
Bus voltage bounds for UCGS and GCGS.
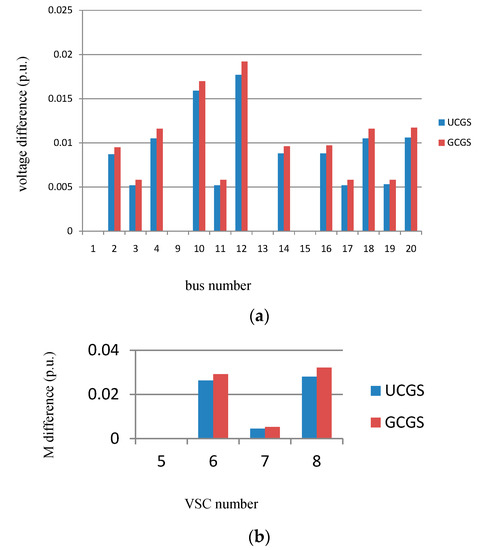
Figure 9.
Voltage and M difference for UCGS and GCGS; (a) DULVIs for UCGS and GCGS; (b) DULMIs for the UCGS and GCGS.
As a consequence, the UCGS structure has better static performance and system operating efficiency. In addition, Figure 9a reveals that the DULIVs of buses 10 and 12 are larger than those of other buses for both the UCGS and GCGS, indicating that a load variation mostly affects the DC buses that the load is connected to.
6.3. Case C: Impact of Propulsion Load Position to the Network
Considering the better performance of the UCGS, only the UCGS is considered for Case C. The conditions are the same as those in Case B for the UCGS, except that locations of the propeller propulsion loads are different. Propulsion loads are changed from buses 6 and 8 to buses 5 and 7, and loads of buses 5 and 7 are connected to buses 6 and 8. This scheme is named UCGS-1. Results are presented in Figure 10a,b. The DULVIs of buses 9 and 11 and DULMIs of VSCs 5 and 7 are much larger in the UCGS-1 scheme than in the UCGS scheme, and it is noted that buses 9 and 11 connect with the propeller propulsion load in UCGS-1. Therefore, voltages of buses 9 and 11 are strongly affected according to analysis in Case A, and similarly, M values of VSCs 5 and 7 change too greatly for the AC bus voltage to remain constant. In addition, the DULVIs are almost unchanged for buses 1, 3, 13, 15, 17, and 19 and are much smaller for remaining buses 2, 4, 10, 12, 14, 16, 18, and 20 in the UCGS-1 scheme in contrast to the UCGS scheme. The location of varying loads thus affects bus voltages. The power output interval of the swing bus is calculated as [0.465, 0.924], which shows that the varying power of a load is compensated by the swing bus. Figure 6a reveals that buses 1, 3, 13, 15, 17, and 19 are included in the power supply path from the swing bus to the varying load; however, buses 2, 4, 10, 12, 14, 16, 18, and 20 are not included in the same path in the UCGS-1 scheme. It is concluded that a load variation mostly affects the buses that are included in the power supply path of the load. M values have the same tendency. The position of propeller installation is therefore a critical factor in the design of an MVDC shipboard power system.
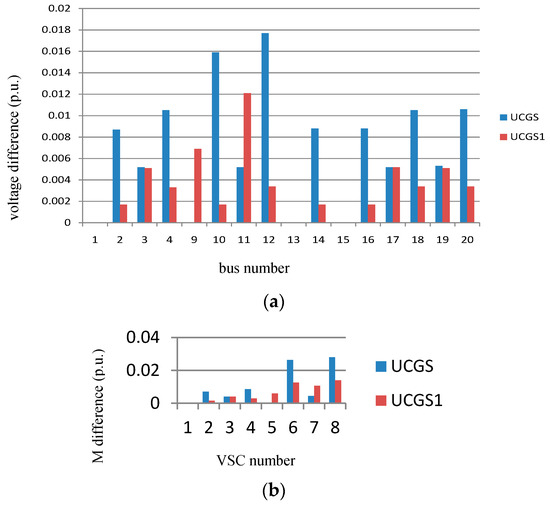
Figure 10.
Voltage and M difference for UCGS and UCGS1. (a) DULVIs for the UCGS and UCGS1; (b) DULMIs for the UCGS and UCGS1.
6.4. Case D: Relative Influence Factor Analysis
Assuming that the loads of buses 7 and 19 have power variations except for the propeller propulsion load in the UCGS, the interval form is set as [0.18, 0.22] + j[0.045, 0.055] at bus 7, with the corresponding affine form being , and the interval form is set as [0.135, 0.165] at bus 19, with the corresponding affine form being . Figure 11 shows the relative influence factor of the load power and reactive power variation for the DC bus voltage. Values of for buses 9, 13, and 15 are zero because the buses are connected to the swing bus. The reactive power has little effect on the DC voltage and can be neglected. The load variations mainly affect the buses that the varying loads are connected to. As shown in Figure 10, of the propeller propulsion load is 95.55% at bus 10 and 93.04% at bus 12, of the bus-7 load is 27.60% at bus 11, and of the bus-19 load is 29.81% at bus 19. The level of variation plays a major role, with the propulsion load having the strongest effect among these varying loads owing to it having the highest level of variation. Figure 10 shows that of the propeller propulsion load for each voltage is much bigger than that of other loads.
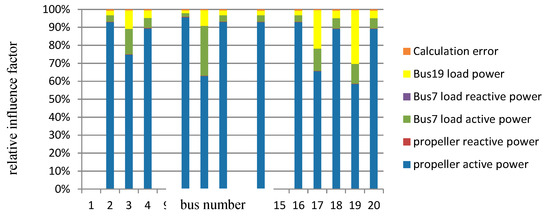
Figure 11.
Relative influence factor of load variations for bus voltages.
7. Conclusions
An AC/DC power flow algorithm based on complex affine arithmetic was presented to explore the effects of power variation on MVDC shipboard power systems. The bus voltage bounds could be obtained effectively in the presence of injection power variation. The relative influence factor defined can reflect quantitatively the impact of injection power variation on bus voltages. Simulation results indicate that the proposed method works well in dealing with injection power uncertainty for the zonal MVDC shipboard power system. The proposed method can be used to assess the network architecture design, planning, and online operation security of an MVDC power system.
Author Contributions
F.L. (Fang Lu) and Hongda Liu conceived and designed the experiments; Liang Yan performed the experiments and analyzed the data; F.L. (Fanming Liu) contributed materials; F.L. (Fang Lu) wrote the paper.
Funding
This research was funded by Nature Science Foundation of China grant number [51761135013] and Fundamental Research Funds for the Central Universities grant number [HEUCF180408]. We received funds for covering the costs to publish in open access.
Conflicts of Interest
The authors declare no conflict of interest. The founding sponsors had no role in the design of the study; in the collection, analyses, or interpretation of data; in the writing of the manuscript, and in the decision to publish the results.
Appendix A
Table A1.
Converter data of the test system.
Table A1.
Converter data of the test system.
| Converter | ||
|---|---|---|
| VSC | 0.01 | 0.025 |
| VSC1 | 0.04 | 0.1 |
| VSC2 | 0.04 | 0.1 |
| VSC3 | 0.04 | 0.1 |
| VSC4 | 0.04 | 0.1 |
| VSC5 | 0.04 | 0.1 |
| VSC6 | 0.04 | 0.1 |
| VSC7 | 0.04 | 0.1 |
| VSC8 | 0.04 | 0.1 |
| DC/DC1 | 0.01 | - |
| DC/DC2 | 0.01 | - |
| DC/DC3 | 0.01 | - |
| DC/DC4 | 0.01 | - |
Table A2.
DC line data of test system.
Table A2.
DC line data of test system.
| From Bus | To Bus | |
|---|---|---|
| 1 | 9 | 0.03 |
| 1 | 13 | 0.03 |
| 2 | 10 | 0.03 |
| 2 | 14 | 0.03 |
| 3 | 11 | 0.03 |
| 3 | 17 | 0.03 |
| 4 | 12 | 0.03 |
| 4 | 18 | 0.03 |
Table A3.
Generator Data of Test System.
Table A3.
Generator Data of Test System.
| Bus No. | Bus Type | ||
|---|---|---|---|
| Swing | - | 1.0 | |
| Generator | 0.75 | 1.0 | |
| PV | 0.75 | 1.0 | |
| PV | 0.75 | 1.0 |
Table A4.
Load Data.
Table A4.
Load Data.
| Bus No. | Load Type | ||
|---|---|---|---|
| 5 | AC Load | 0.2 | 0.05 |
| 6 | AC Load | 0.9 | 0.18 |
| 7 | AC Load | 0.2 | 0.05 |
| 8 | AC Load | 0.9 | 0.18 |
| 15 | DC Load | 0.15 | - |
| 16 | DC Load | 0.15 | - |
| 19 | DC Load | 0.15 | - |
| 20 | DC Load | 0.15 | - |
References
- Doerry, N.; Mccoy, K. Next Generation Integrated Power System Technology Development Roadmap; Naval Sea Systems Command: Washington, DC, USA, 2007. [Google Scholar]
- Bosich, D.; Vicenzutti, A.; Pelaschiar, R.; Menis, R.; Sulligoi, G. Toward the future: The MVDC large ship research program. In Proceedings of the 2015 AEIT International Annual Conference (AEIT), Naples, Italy, 1–6 October 2015. [Google Scholar]
- Castellan, S.; Menis, R.; Tessarolo, A.; Sulligoi, G. Power electronics for all-electric ships with MVDC power distribution system: An overview. In Proceedings of the 2014 Ninth International Conference on Ecological Vehicles and Renewable Energies, Monte-Carlo, Monaco, 1–7 March 2014. [Google Scholar]
- Sudhoff, S.D. Currents of change. IEEE Power Energy Mag. 2011, 9, 30–37. [Google Scholar] [CrossRef]
- Jin, Z.; Sulligoi, G.; Cuzner, R.; Meng, L.; Vasquez, J.C.; Guerrero, J.M. Next-Generation shipboard DC power system: Introduction smart grid and dc microgrid technologies into maritime electrical networks. IEEE Electr. Mag. 2016, 4, 45–57. [Google Scholar] [CrossRef]
- BE IEEE 1709-2010-IEEE Recommended Practice for 1 kV to 35 kV Medium-Voltage DC Power Systems on Ships; IEEE Std.: Piscataway, NJ, USA, 2010.
- Arccidiacono, V.; Monti, A.; Sulligoi, G. Generation control system for improving design and stability of medium voltage DC power systems on ships. IET Electr. Syst. Transp. 2012, 2, 158–167. [Google Scholar] [CrossRef]
- Yeleti, S.; Fu, Y. Load flow and security assessment of VSC based MVDC shipboard power systems. In Proceedings of the North American Power Symposium, Boston, MA, USA, 1–7 August 2011. [Google Scholar]
- Su, C.; Lin, K.; Chen, C. Power flow and generator-converter schemes studies in ship MVDC distribution systems. IEEE Trans. Ind. Appl. 2016, 52, 50–59. [Google Scholar] [CrossRef]
- Shi, J.; Amgai, R.; Abdelwahed, S. Modelling of shipboard medium voltage direct current system for system level dynamic analysis. IET Electr. Syst. Transp. 2015, 5, 156–165. [Google Scholar] [CrossRef]
- Shariatzadeh, F.; Kumar, N.; Srivastava, A.K. Optimal control algorithms for reconfiguration of shipboard microgrid distribution system using intelligent techniques. IEEE Trans. Ind. Appl. 2017, 53, 474–482. [Google Scholar] [CrossRef]
- Villanueva, D.; Pazos, J.E.L.; Feijoo, A. Probabilistic load flow including wind power generation. IEEE Trans. Power Syst. 2011, 26, 1659–1667. [Google Scholar] [CrossRef]
- Gouveia, E.M.; Costa, P.M. Constrained fuzzy power flow models with correlation between nodal injections. Int. Trans. Electr. Energy Syst. 2016, 26, 94–105. [Google Scholar] [CrossRef]
- Das, B. Radial distribution system power flow using interval arithmetic. Int. J. Electr. Power Energy Syst. 2002, 24, 827–836. [Google Scholar] [CrossRef]
- Wang, S.; Xu, Q.; Zhang, G.; Yu, L. Modeling of wind speed uncertainty and interval power flow analysis for wind farms. Autom. Electr. Power Syst. 2009, 33, 82–86. [Google Scholar]
- Preira, L.; da Costa, V.; Rosa, A. Interval arithmetic in current injection power flow analysis. Int. J. Electr. Power Energy Syst. 2012, 43, 1106–1113. [Google Scholar] [CrossRef]
- Piccolo, A.; Vaccaro, A.; Villacci, D. Thermal rating assessment of overhead lines by Affine Arithmetic. Electr. Power Syst. Res. 2004, 71, 275–283. [Google Scholar] [CrossRef]
- Vaccaro, A.; Canizares, C.A.; Villacci, D. An affine arithmetic-based methodology for reliable power flow analysis in the presence of data uncertainty. IEEE Trans. Power Syst. 2010, 25, 624–632. [Google Scholar] [CrossRef]
- Gu, W.; Luo, L.; Ding, T.; Meng, X.; Sheng, W. An affine arithmetic-based algorithm for radial distribution system power flow with uncertainties. Int. J. Electr. Power Energy Syst. 2014, 58, 242–245. [Google Scholar] [CrossRef]
- Wang, S.; Han, L.; Wu, L. Uncertainty tracing of distributed generations via complex affine arithmetic based unbalanced three-phase power flow. IEEE Trans. Power Syst. 2015, 30, 3053–3062. [Google Scholar] [CrossRef]
- Pirnia, M.; Canizares, C.A.; Bhattacharya, K.; Vaccaro, A. An affine arithmetic method to solve the stochastic power flow problem based in a mixed complementarity formulation. In Proceedings of the 2012 IEEE Power and Energy Society General Meeting, San Diego, CA, USA, 22–26 July 2012; pp. 1–7. [Google Scholar]
- Vaccaro, A.; Canizares, C.A. An affine arithmetic based framework for uncertain power flow and optimal power filw studies. IEEE Trans. Power Syst. 2017, 32, 274–288. [Google Scholar] [CrossRef]
- Luo, J.; Shi, L.; Ni, Y. Uncertain power flow analysis based on evidence theory and affine arithmetic. IEEE Trans. Power Syst. 2018, 33, 1113–1115. [Google Scholar] [CrossRef]
- Luo, L.; Gu, W.; Wang, Y.; Chen, C. An affine arithmetic-based power flow algorithm considering the regional control of unscheduled power fluctuation. Energies 2017, 10, 1794. [Google Scholar] [CrossRef]
- Liang, H.; Tamang, A.K.; Zhuang, W.; Shen, X. Stochastic information management in smart grid. IEEE Commun. Surv. Tutor. 2014, 16, 1746–1770. [Google Scholar] [CrossRef]
- Li, W.; Monti, A.; Ponci, F. Fault detection and classification in medium voltage DC shipboard power systems with wavelets and artificial neural networks. IEEE Trans. Instrum. Meas. 2014, 63, 2651–2665. [Google Scholar] [CrossRef]
- Stolfi, J.; de Figueirido, L.H. Self-validated numerical methods and applications. In Proceedings of the 21st Brazilian Mathematics Colloquium, Rio de Janeiro, Brazil, 1–4 July 1997. [Google Scholar]
- Manson, G. Calculating frequency response functions for uncertain systems using complex affine analysis. J. Sound Vib. 2005, 288, 487–521. [Google Scholar] [CrossRef]
- Leman, J.T.; William, E.J.; Johnson, B.K. DC fault dynamics in a VSC based MVDC shipboard distribution. In Proceedings of the 2015 IEEE Power & Energy Society General Meeting, Denver, CO, USA, 26–30 July 2015. [Google Scholar]
- Kankanala, P.; Srivastava, S.C.; Srivastava, A.K.; Schulz, N.N. Optimal control of voltage and power in a multi-zonal MVDC shipboard power system. IEEE Trans. Power Syst. 2012, 27, 642–650. [Google Scholar] [CrossRef]
- Wu, W.C.; Zhang, B.M. A three-phase power flow algorithm for distribution system power flow based on loop-analysis method. Electr. Power Energy Syst. 2008, 30, 8–15. [Google Scholar] [CrossRef]
© 2018 by the authors. Licensee MDPI, Basel, Switzerland. This article is an open access article distributed under the terms and conditions of the Creative Commons Attribution (CC BY) license (http://creativecommons.org/licenses/by/4.0/).