Article

The Future of Fossil Fired Power Plants in Germany—A Lifetime Analysis

1
Institute of Electrochemical Process Engineering (IEK-3), Forschungszentrum Jülich GmbH, 52425 Jülich, Germany
2
RWTH Aachen University, c/o Institute of Electrochemical Process Engineering (IEK-3), Forschungszentrum Jülich GmbH, 52425 Jülich, Germany
*
Author to whom correspondence should be addressed.
Energies 2018, 11(6), 1616; https://doi.org/10.3390/en11061616
Submission received: 27 April 2018 / Revised: 6 June 2018 / Accepted: 11 June 2018 / Published: 20 June 2018
(This article belongs to the Section F: Electrical Engineering)

Abstract

:
In many German energy projections, the assumption of power plant lifetimes plays a central role, since it is often used in projections for the existing fleet of power plants or as a criterion for decommissioning in model-based investigations. The result of these analyses is a power plant capacity retirement graph, which is then used to determine the replacement demand. Especially in the context of the German Energy transition (“Energiewende”) the amount and dynamics of replacement play an important role. Against this background, a large number of studies have been evaluated and fleet developments compared. Many studies refer to empirical values for the assumption of lifetimes without specifying them in greater detail. This approach was used to conduct an ex post lifetime analysis—accurate to each number of units—of German power plants that have been decommissioned since 1990. The analysis is conducted with the aid of a power plant database, which has been continuously updated for each individual unit since 1985. In addition to the power plants currently in operation, the database includes also includes power plant units that have been successively decommissioned over the past decades. The ex post analysis presents the first lifetime analysis for decommissioned German plants, which can serve as a basis for future power plant fleet projections. The analyses show that the lifetime of fossil-fired power plants has extended considerably. For example, whereas the real lifetimes of coal-fired power plants were in a range of 30 to 35 years in the 1990s, today they amount to 40 to 45 years on average.

1. Introduction

The electricity sector is the biggest emitter of CO2 in Germany, accounting for more than 40% of the country’s overall CO2 emissions. A significant increase in renewable electricity production is being targeted in an attempt to meet the Federal Government’s objective of reducing national greenhouse gas emissions by 80% or 95% by 2050. The aim is for renewable energy to account for at least 80% of electricity production in 2050 and to replace fossil-fuelled electricity generation. In addition, the Federal Government has set out sectoral targets in its latest Climate Action Plan [1] in a bid to meet its reduction objectives. In this context, the early phase-out of coal-fired power generation—and thus also the lifetime of conventional power plants—has become the focus of energy and climate policy discussions. The assumed lifetimes of power plants are important control variables for all energy projections and scenarios, since they are often used to project the development of the existing power plant fleet [2,3,4,5,6,7,8,9,10,11]. It is also important for the national grid development plan (Netzentwicklungsplan Strom), which serves as a fundamental planning basis for the future expansion of the electricity grid. The grid development plan is based on various scenarios, which, in turn, are based on the development of the power plant fleet—calculated on the basis of varied lifetime assumptions. The lifetime of power plants is also of great significance in many other national projections [2,3,4,5,6,7,8,9,10,11,12], serving as a central assumption for the simulation of the fleet dynamics.
An analysis of the lifetime assumptions of the respective energy projections reveals that they are often insufficiently substantiated. As a rule, projections refer to empirical values without specifying them in greater detail. Also, in an international context, only a few studies are focusing on lifetime analysis and decommissioning aspects. Farfan and Breyer [13,14] analysed lifetimes for power plants on a global and European scale using different data bases. However, they state that the data availability is poor. García-Gusano et al. [15] analysed the impact of lifetime extension of coal fired power plants located in Spain. The authors focused on technology retrofits like desulphurisation and denitrification. However, they didn’t investigate in detail the age of existing power plants. Johnson et al. [16] analysed global coal phase out strategies using the Message model. In the model a maximum lifetime for coal fired power plants of 30 years is assumed without specifying in greater detail. Odenberger and Johnsson [17] explored how investment in the UK electricity sector can contribute to meet the UK CO2 emission reduction goals. In their model a technical lifetime of 40 years was assumed for all thermal power plants. The authors did not specify this assumption. Both from a national and international perspective, it can be concluded that the derivation of lifetimes of power plants is a neglected topic. It is therefore scarcely possible to classify or evaluate the projected development of the fleet. This paper will thus analyse how the lifetimes of fossil-fired power plants have developed over the last few decades in Germany. The analysis will be conducted with the aid of a power plant database, which has been continuously updated since 1985 and in which Germany’s fossil-fired power plants are registered—accurate to each individual unit. In addition to the power plants currently in operation, the database includes power plant units that have been successively decommissioned over the past decades. The average lifetimes of decommissioned plants can thus be determined. The results of the analysis help to provide a basis for the lifetime assumptions of future energy projections. Furthermore, they enable an evaluation of capacity projections. These form the basis of national coal phase-out scenarios, for example.
The subsequent analysis is structured as follows. Section 2 features a description of the current power plant fleet in Germany and its age structure. Section 3 contains an analysis of existing national studies in which the development of the power plant fleet is projected using lifetime assumptions. Section 4 includes an ex post analysis of power plants—down to the number of units—that have been decommissioned over the last three decades in Germany. Section 4 features a discussion on lifetime assumptions as well as a summary of the findings.

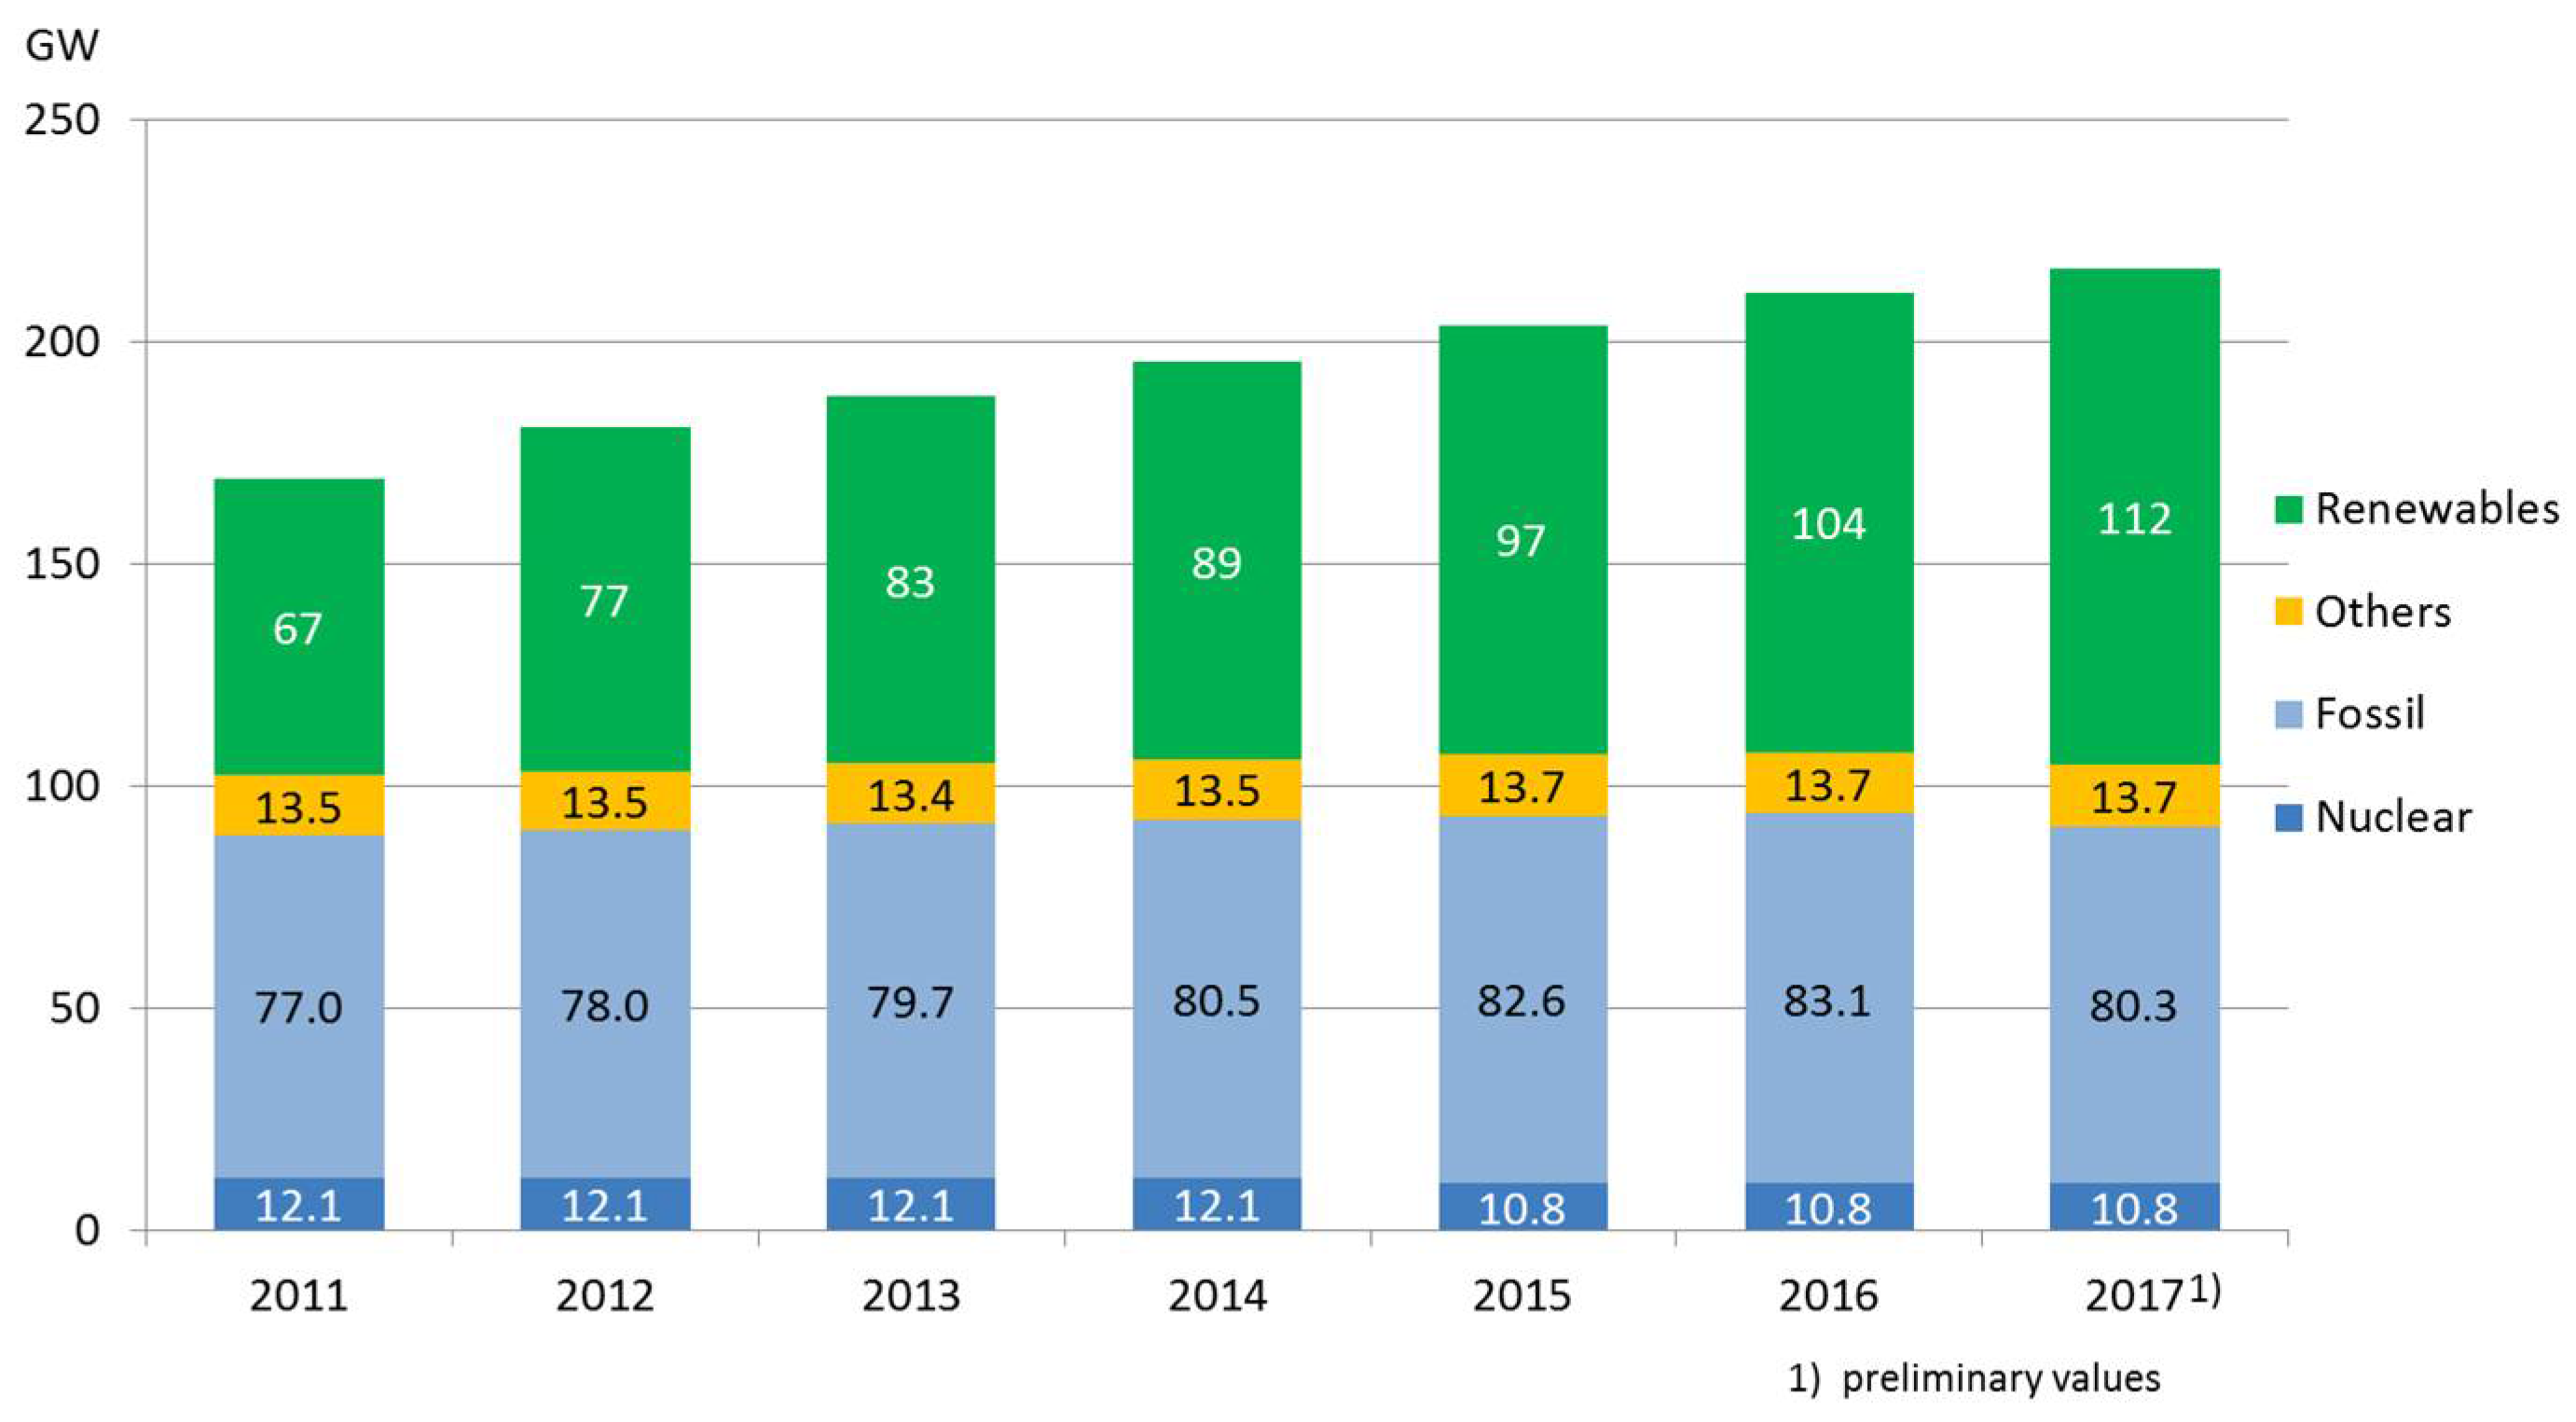
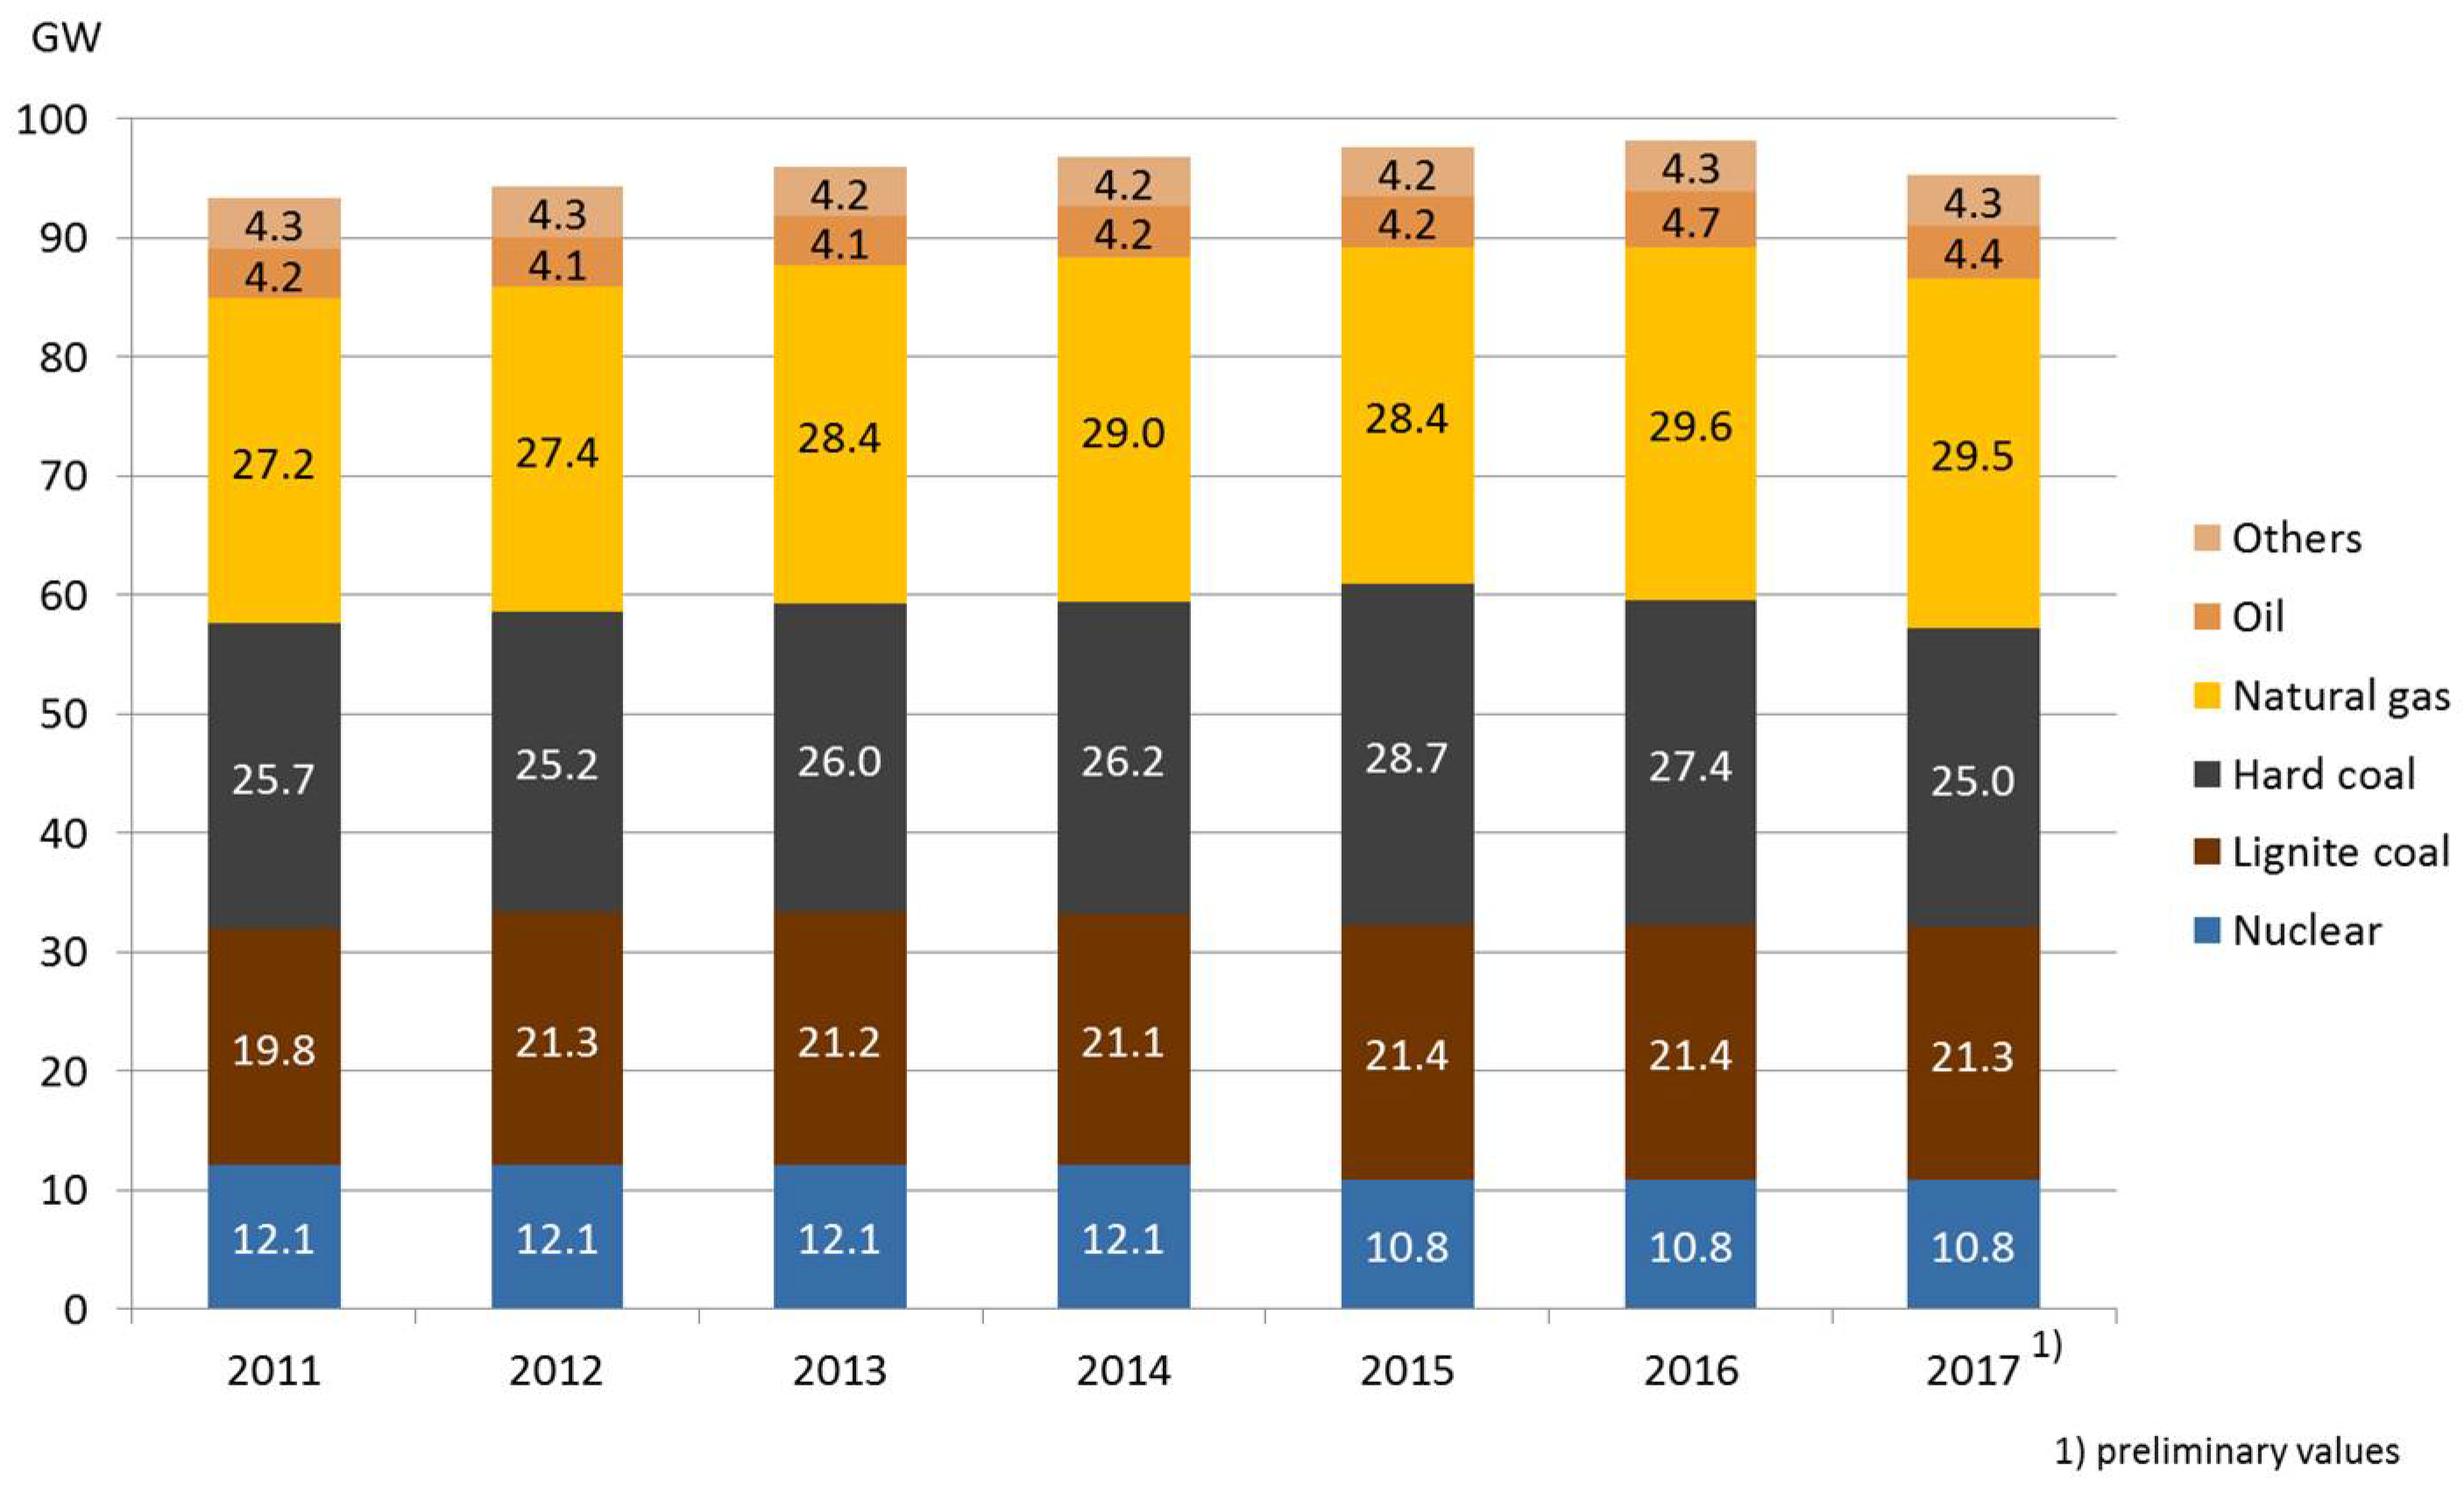
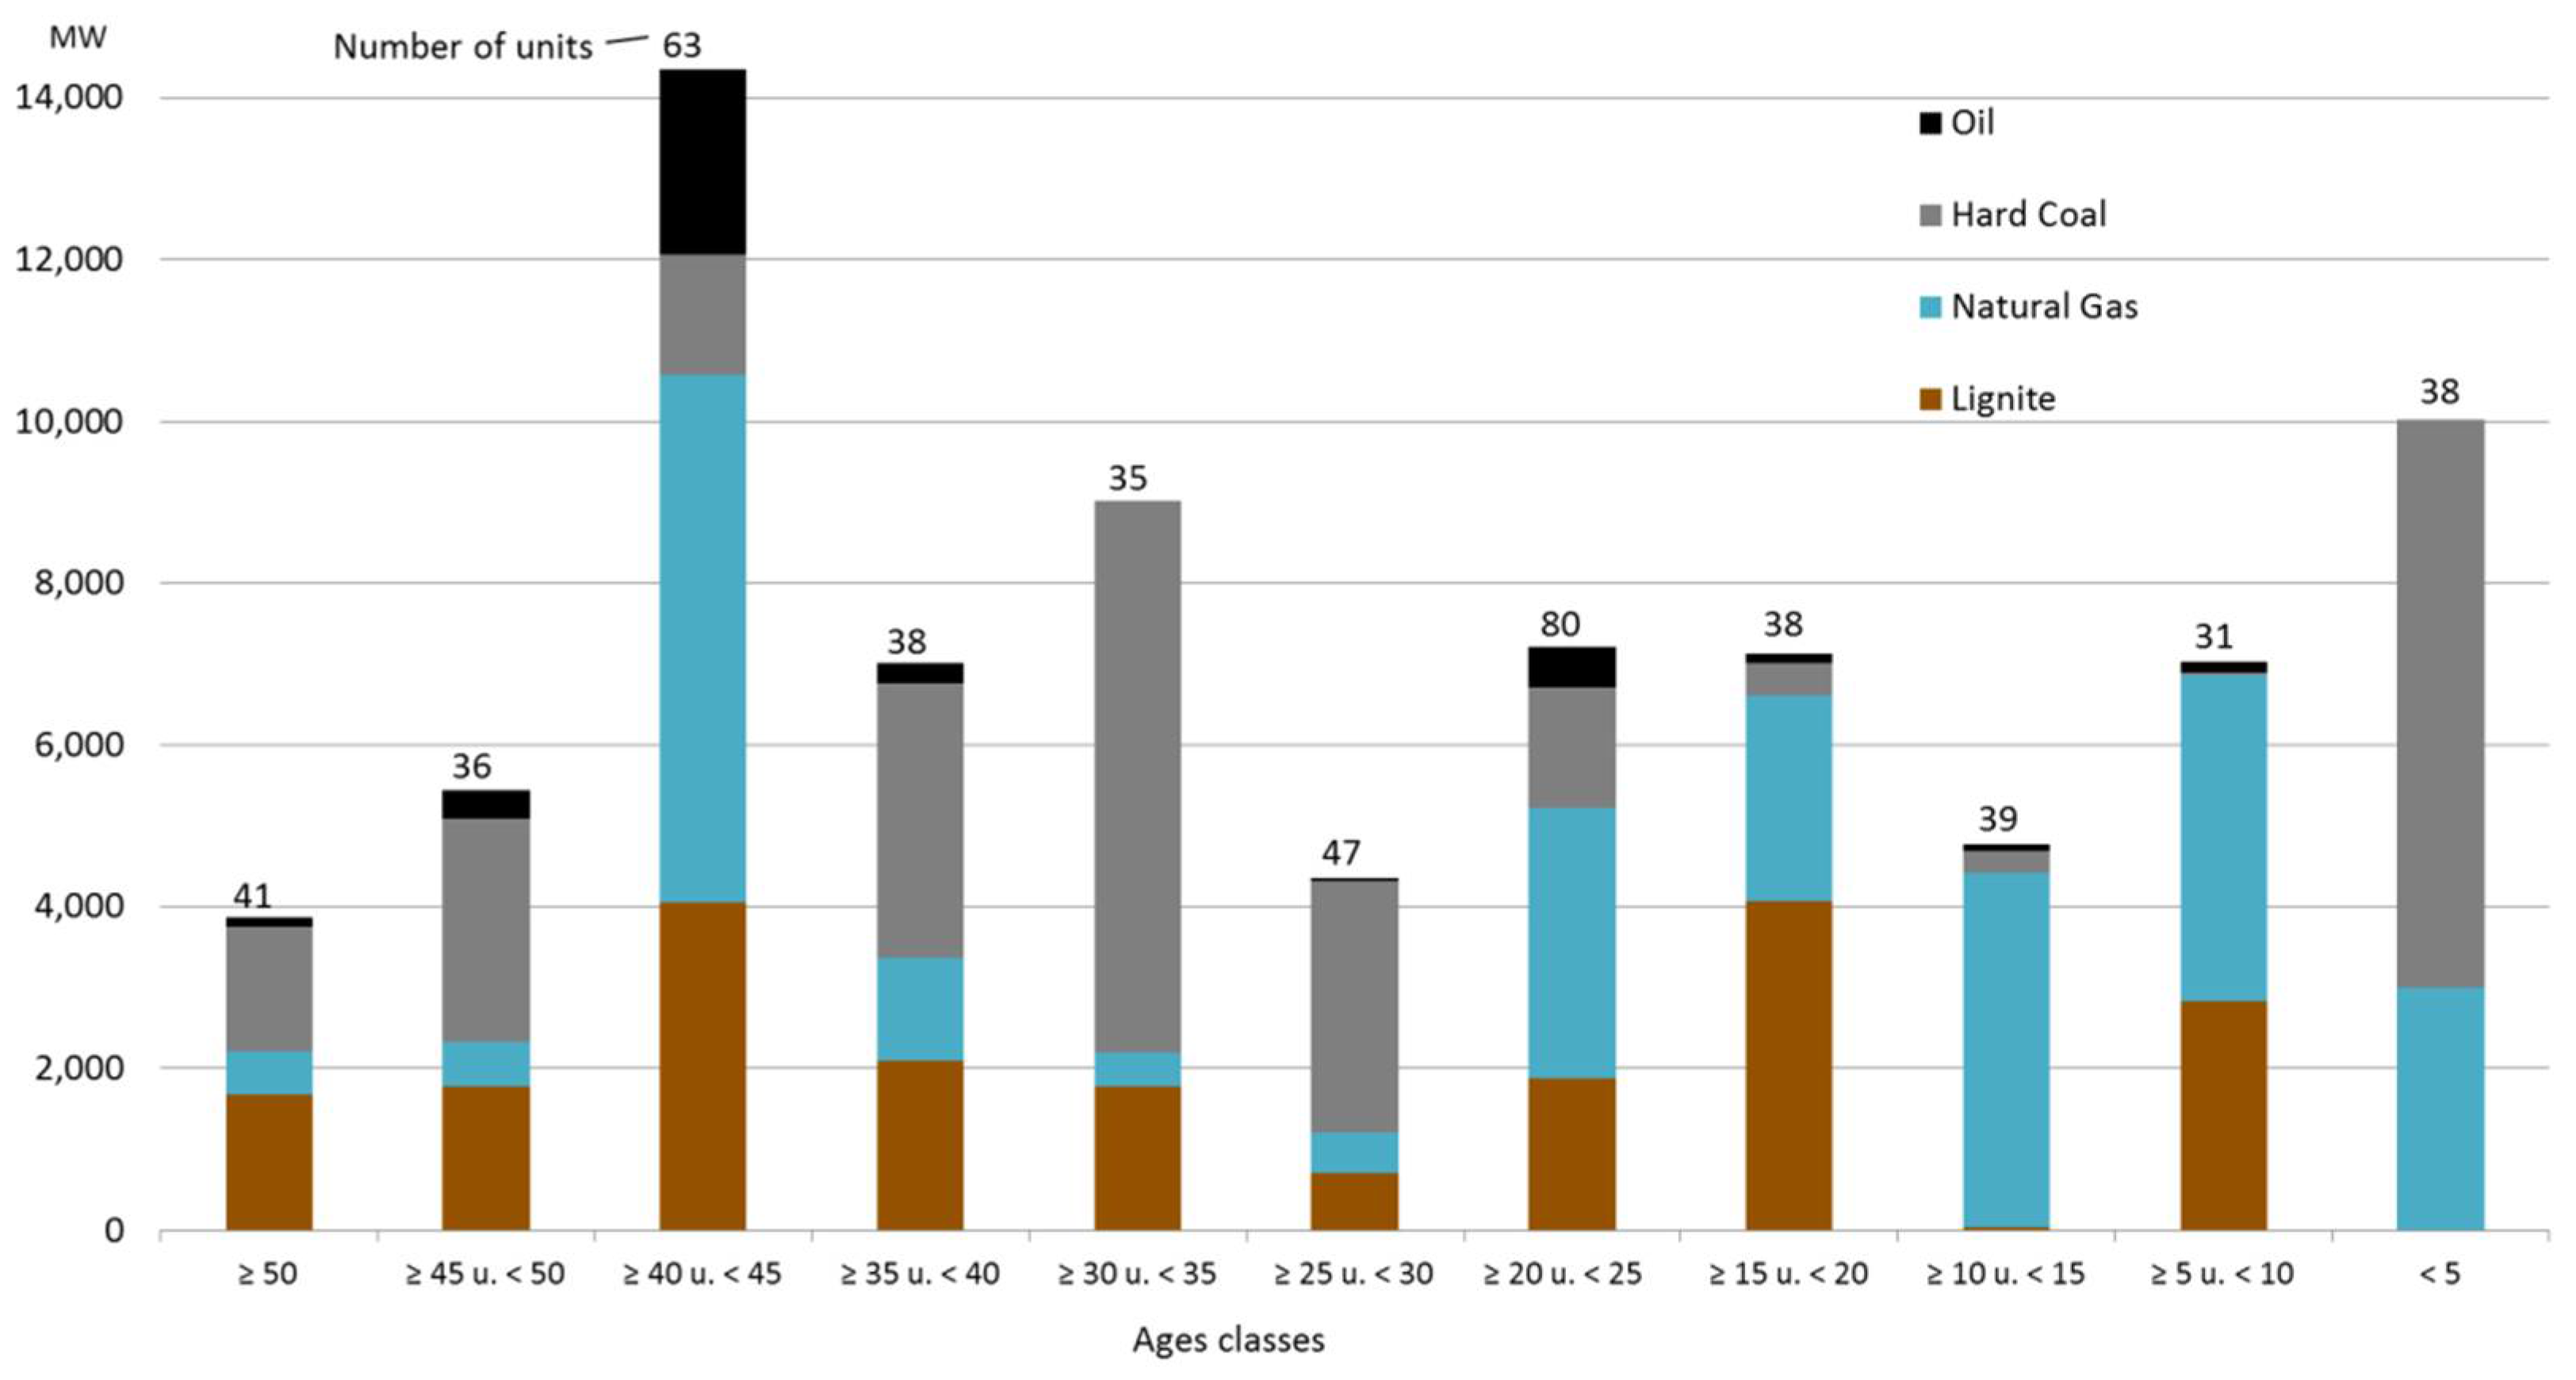
2. Germany’s Power Plant Fleet

The total installed capacity of power plants in Germany amounted to around 218 GW in 2017 (Figure 1 and Figure 2). In 2017 the capacity of conventional thermal power plants (nuclear, fossil, waste) was about 92 GW in total. Fossil-fired plants account for around 42% (82.3 GW) of the installed power plant capacity. In 2017, they represented a roughly 50.8% (332 TWh) share of gross electricity production. The installed capacity of renewable energy-based plants amounts to around 112 GW in 2017. Electricity production in 2017 stood at around 217 TWh, which corresponds to a roughly 33.3% share of gross electricity production. Whilst renewable energy continues to gain importance, around 62.4% of electricity production in Germany currently comes from conventional thermal power plants (fossil-fired, nuclear) (Table 1) [18,19,20,21].
The transformation of the energy sector (Energiewende) has led to a significant expansion of renewable electricity production capacity in the last few years. From 1970 to around 2005, the increase in power plant capacity has correlated with the rise in electricity production and consumption. Since 2005, an increasing divergence of installed power plant capacity from electricity consumption/production has been observed (Figure 3). This is due to the significant expansion of renewable energy (especially wind, PV) and, in turn, the considerably reduced full-load hours as a result of the fluctuating nature of power being fed into the grid. All of this means that a significantly higher production capacity is required to cover electricity consumption.
In Germany, 486 fossil-fired power plant units are currently in operation with an overall capacity of 80.1 GW [27]. Figure 4 shows an evaluation of the Federal Network Agency’s official power plant database (as of March 2017), which registers all plants with a capacity greater than 10 MW. According to the evaluation, 213 plants with an overall capacity of 39.6 GW are older than 30 years. Coal-fired power plants are significantly older than the average value. A total of 36 of all lignite-fired power plants (55% of all units, installed capacity: 11.3 GW) and 58 of all hard-coal-fired power plants (57% of all units, installed capacity: 16 GW) are older than 30 years. The following average age (Table 2) can be calculated for the lignite-fired power plants currently in operation: a lignite-fired power plant unit today has an average age of 32.9 years (weighted with number of units). If weighted with unit capacity, the average age per MW is around 30.4 years (weighted with capacity). The comparable values for hard-coal-fired power plants amount to 32.9 years (weighted with number of units) or 27.3 years (weighted with capacity). The values weighted with the number of units are higher, since in the past, unit capacity was lower and the number of plants was higher. In comparison, natural-gas-fired power plants are considerably younger. Only 86 of 283 power plants with a capacity of 9.3 GW are older than 30 years, which corresponds to a 33% share of overall natural-gas-fired capacity. The average age amounts to 22.8 years (weighted with capacity) or 24.1 years (weighted with number of units).

3. Lifetime Assumptions in National Energy Projections

The following section is an evaluation of selected national energy projections and scenario frameworks that play, or have played, a significant role in the discussion on energy policy in Germany. The evaluation is focused on the development of the fleet of fossil-fired power plants as well as the assumptions that are made in the process. Before evaluating the studies in detail, a classification of the term “lifetime” is made, since very different terms are used in many studies with respect to the life cycle or lifetime of a power plant. The term “technical” lifetime, for instance, is frequently used. A power plant is a complex technical system, comprising a large number of parts and components. The term “technical” lifetime is well established and is often used in the field of plant engineering for individual, highly stressed parts and components, for which the degree of exhaustion or remaining lifetime consumption must be given in accordance with the relevant regulations. Ultimately, technical aspects such as continuous wear or spontaneous damage are the reasons for components being replaced. It is only in such cases that the term “technical” lifetime applies. However, a power plant consists of thousands of individual components, meaning it is generally not possible to determine the technical lifetime of a power plant system. Furthermore, the reasons for decommissioning a complex power plant system are never motivated solely by technical aspects. In addition to the technical condition of a plant (dependent on the type of maintenance strategy), the decision to decommission a power plant is subject to the context of the electricity market, the framework conditions of energy and environmental policy, and also on fuel markets. It must also be emphasized that the decision to decommission a plant is always a strategic and economic calculation made on the part of a single energy supply company, and one which also optimizes that company’s portfolio. If one power plant has several supply functions (electricity, district heat, process steam), this limits the decision-making scope of a company, which in turn has a direct influence on the decommissioning decision. The same applies for the dependence on fuel procurement in the case of lignite-fired power plants. It is therefore not correct to use the term “technical” lifetime for a power plant system. Thus the term “lifetime” or, in accordance with Farfan and Breyer [13], “operational lifetime” should be used. A lifetime assumption, as made for energy projections, describes the sum of all causes or influences that lead to the decommissioning of a power plant. Only in a few exceptional cases is a decision to decommission a plant taken on the basis of a few individual causes. If the lifetime assumptions are based on observed empirical values, it must be noted that to a certain extent they always reflect the prevailing context of energy and environmental policy as well as market conditions.

3.1. Evaluation of Lifetime Assumptions in Projections

This section features an evaluation of existing scenarios and forecasts in which the development of the power plant fleet is projected. The selection of studies was made according to significance (e.g., grid development plan) and topicality. A particular focus is placed on studies that were conducted as part of the coal phase-out discussion. Table A1 (Appendix A) contains the respective lifetime assumptions that were compiled for a projected fleet development in the individual studies. For the national electricity grid development plans, which are compiled every two years, the development of the existing fleet of power plants is projected for each projection year on the basis of the year the plants were commissioned and the lifetime of plants. The same lifetime was assumed in the grid development plans from 2011 to 2014, independent of scenarios. This lifetime was described as being in the “upper range of lifetimes” assumed in studies. However, there is no mention of which studies were referred to. The demand of critics for a varied lifetime assumption rather than a blanket figure was not fulfilled in the first grid development plan [28]. It was only in 2015 that the grid development plans started to include different assumptions—dependent on scenarios—for the lifetimes of fossil-fired power plants. The lifetimes vary in a range of 10 years based on the values of previous grid development plans. There is no explanation as to why the range of 10 years was chosen. Lignite-fired power plants represent a peculiarity in the scenario framework for the 2015 grid development plan. In the scenario framework draft [29] published for consultation, the transmission grid operators of lignite-fired power plants propose a projection of the existing fleet based on the service life of open-cast mining areas. The reason given is that power plant operation and coal extraction cannot be considered separately. However, lifetimes are neither cited nor is the calculation method explained.
In a coal phase-out study commissioned by AGORA [30], different lifetimes of coal-fired power plants are assumed for individual periods of time. Based on the assumption of a coal phase-out by 2040, various phases (initiation, consolidation, phase-out) are defined over the course of time. For these phases, the lifetime assumptions are increasingly reduced over time to ensure that a phase-out can be achieved by 2040. In doing so, framework conditions such as the sufficient amortization of newer plants are taken into consideration. The decision as to which individual plants are shut down in the various phases is made according to the age of the plants. As a general rule, it is assumed that the older a power plant unit is, the lower its efficiency is. The phase-out study also contains a reference development, which serves as a standard of comparison for the coal phase-out. In addition, different types of phase-out are investigated (2045: gradual phase-out; 2035: ambitious phase-out). In the reference scenario, a lifetime of 40 years and 50 years is assumed for hard-coal-fired and lignite-fired power plants, respectively. There is no detailed justification for these assumptions.
Various coal phase-out scenarios (SZ2, SZ3, etc.) are analyzed in a study by the Institute for Future Energy Systems (IZES) [8]. A comparison is made with a reference scenario, whose power plant fleet development is based on the “Strom 2015” grid development plan. The gradual retirement of the fleet is calculated according to the specific CO2 emissions of each individual power plant unit. This is determined on the basis of efficiency, which in turn is dependent on the age of a plant. It is generally assumed that the oldest plants have the worst efficiencies. For the ambitious phase-out scenarios, relevant corrections (earlier decommissioning of capacities) are made so as to meet the targets set (e.g., CO2 reduction target by 2020 or complete phase-out by 2040). There is no explanation given for the corrections made.
In an analysis by the German Institute for Economic Research (DIW) [11,31], a partial phase-out of coal-fired power plants is investigated against the backdrop of the Climate Action Programme in order to maintain the CO2 reduction target by 2020. The dynamics of the additional reduction in coal power capacity is determined via blanket capacities to be decommissioned (differentiated according to lignite and hard coal). Age is the determining factor with respect to which individual plants make up the capacities to be decommissioned. As with the analyses of [8,30], it is assumed that a power plant becomes less efficient with increasing age. On this basis, a ranking is produced of plants to be decommissioned.
A study by ECOFYS [32], which played an important role in the energy policy discussions of policymakers, analyzes the phasing out of coal-fired power generation (hard coal: 2040, lignite: 2030). In this study, the projection of the coal-fired power plant fleet is determined on the basis of emission allowances as well as the specific emissions of each individual power plant unit. If the emissions allowance is used up, the power plant unit is shut down. Particular attention is paid to combined heat and power plants, which are only ever shut down after the decommissioning of all power plants without district heat extraction.
On the basis of Forschungszentrum Jülich investigations [33,34], which were completed almost 20 years apart, it can be seen that significantly higher lifetimes are today being assumed than was previously the case. A separate analysis investigated the extent to which an assumed lifetime must be reconciled with the operating hours outlined in the design phase and operation mode of a power plant (warm or cold starts) [35]. The number of warm and cold starts is interpreted as consuming lifetime, which in turn is used to calculate the lifetime of a power plant. In this context, it is worth referencing a study by Meinke [36] for an existing hard-coal-fired power plant, in which lifetime consumption was analyzed in detail as a function of the operation mode of the plant.
A Ph.D. thesis of Nollen [37] looks at the technical lifetime of power plants as well as expenditure for the maintenance and servicing of older fossil-fired and nuclear power plants. On the one hand, the study analyzes the influence of increasing maintenance and servicing costs over time with the aid of a dynamic investment appraisal. An “economic” lifetime can thus be derived for different types of power plants, whereby various parameters (e.g., energy carrier prices, utilization) can be varied. On the other hand, the influence of aging is analyzed in the form of maintenance and servicing strategies within the context of the entire power plant fleet. Using a model that depicts the German power plant fleet, expansion strategies are calculated and thus scenario-dependent lifetimes are derived within the context of the power generation system as a whole.
The Federal Ministry of Economics and Energy (BMWi) periodically commissions national energy projections to be conducted, which have played an important role in the context of national discussions concerning the energy sector. For this reason, projections from the last 20 years are analyzed with respect to their assumed lifetimes. In the energy forecast from 1995 [38], for example, lifetimes of 30 to 35 years were assumed, although no specific distinction of power plants was cited. There is no justification given for this assumption. It is only in the forecasts from 1999 [39] and 2005 [40] that there is first reference to how the point of decommissioning for a power plant is determined in a manner endogenous to the model. The 2005 forecast also states that an additional maximum technical lifetime is given in the model which must not be exceeded. There is no mention of the basis on which this assumption was made. One criterion endogenous to the model for shutting down a power plant is such that if the contribution margin of a power plant is not sufficient to cover the fixed costs, the plant is shut down. A more detailed explanation of the principles underlying the model is not given.
There is also an evaluation of a study concerning energy scenarios for an energy concept [6], which served as an essential guide in formulating the German Federal Government’s Energy Concept [41] and was again commissioned by the Federal Ministry of Economics and Energy (BMWi). With respect to the power plant fleet projections, there is no information concerning the lifetime assumptions or the method for deriving the point of shut-down for plants.
The evaluation highlights that in many projections, lifetimes are neither cited nor addressed. All studies in which the lifetimes are assumed exogenously are based on empirical values of which the data source is not mentioned. In other studies concerning the coal phase-out [2,11,32], a ranking is determined as a function of efficiency and specific CO2 emissions. Based on the assumptions of national emissions caps for the power plant fleet, the power plants with the highest emissions levels are then shut down successively. In the studies of [10,39,40], the point of decommissioning is determined endogenous to the model. However, in such instances, maximum possible technical lifetimes are set as a limit. If this limit is reached, the power plants are definitely shut down.

3.2. Classification of Fleet Projections According to the Example of Coal-Fired Power Plants

As shown in the previous evaluation, not all studies refer to lifetimes. In such cases, only the fleet development is given. This is particularly true for studies [10,39,40] in which lifetimes are determined endogenously. In order to assess the fleet dynamics, however, the capacity trends of current projections will be compared in the following, based on the example of coal-fired power plants. In doing so, a distinction will be made between lignite-fired power plants and hard-coal-fired plants. The capacity projections are illustrated in Figure 5 and Figure 6. A number of studies only indicate the installed capacities for a few individual years, meaning it is not possible to depict more finely defined fleet dynamics. In these cases, residual capacities are marked as dots in Figure 5 and Figure 6. The range of scenarios within the studies is represented by an upper and a lower value.

3.2.1. Lignite Coal-Fired Power Plants

In order to assess the fleet dynamics of the studies, fleet developments (Figure 5) through to the year 2050 are calculated on the basis of today’s fleet of power plants and under the assumption of different lifetimes (40, 50, and 55 years), which are then used as a standard of comparison. As database, we use our own database. Based on the year the plants were commissioned and the various lifetime assumptions, the decommissioning year for individual power plants was calculated and the individual capacities determined for the relevant years. Figure 5 shows the fleet developments resulting from these calculations (gray lines). If a lifetime of 50 years is assumed, the remaining capacity would fall to around 10.8 GW by 2030 and to just 4.5 GW by 2050. If a lifetime of 40 years is assumed, however, the comparable values amount to 8.7 GW (2030) and 2.7 GW (2050), respectively. It can also be seen that the initial capacity in 2015 is much lower than the actual existing capacity. This is due to the fact that many plants are today already significantly older than 40 years (cf. Figure 4).
The scenario framework of the grid development plan 2025 (NEP Strom 2025) [42] assumes lifetimes of 40 to 50 years for coal-fired power plants. A comparison of the calculated fleet development as well as the values for 2035 (purple dots) shows good agreement and illustrates the validity of the calculated capacity developments which serve as a standard of comparison.
Of particular interest are the studies [5,10] in which the authors state that fleet development and thus also the lifetimes of power plants were determined endogenously. The upper value of the study of EWI/Prognos/GWS (BMWi energy report) [5] characterizes a trend scenario (business as usual) and the lower value the target scenario (−80% by 2050). In both scenarios, the endogenously determined lifetimes are much higher than 55 years. A similar development is observed in the study of Öko-Institut/ISI FhG [10]. The capacity data reveal that the endogenously calculated lifetimes fall within a range of 50 years (−80% CO2 reduction scenario by 2050) and more than 55 years (reference case).
Figure 5 also contains the fleet developments of various studies that include an accelerated coal power phase-out. The most ambitious of the proposed fleet developments is that of [8], which outlines a more than 15 GW capacity withdrawal within a very short period of time (2018–2020). For the period after 2020, the residual capacity remains more or less at the same low level. The fleet developments in the [2,32] studies commissioned by Greenpeace in 2012 and 2015 are also ambitious. The course of development until 2026 roughly corresponds with a lifetime in the range of 40 to 50 years. It is only after 2026 that a very accelerated phase-out of lignite power is assumed.

3.2.2. Hard Coal-Fired Power Plants

Similar to the previous section, fleet developments (gray lines) for hard-coal-fired power plants were also calculated, which are based on the existing power plant fleet and lifetimes of 40, 50, and 55 years (Figure 6). As database, we use our own database. These calculations again serve as a standard of comparison in the following observations. If a lifetime of 45 years is assumed, 17.7 GW of today’s hard-coal-fired power plant capacity would still be available in 2030, a figure which falls to roughly 8 GW by 2050. If a lifetime of 40 years is assumed, the comparable residual capacities amount to 10.5 GW (2030) and 8 GW (2050), respectively. In comparison with the capacity development of the grid development plan 2025 [42], there is a significant disparity for the year 2025. Its lower value amounts to around 8 GW. For the year 2035, the disparity between the lower and upper value is only minimal. This suggests that the assumed lifetimes of 40 and 50 years were not consistently applied to all power plant units in the grid development plan. The two studies of EWI et al. [5] and Öko-Institut et al. [10], in which the fleet development was determined endogenously, are again discussed in more detail. The reference development (trend) of the study of EWI/Prognos/GWS 2014 (BMWi Energy Report) [5] is well above the retirement graph of 55 years. Until 2040, it roughly corresponds to a fleet development that assumes a lifetime of 55 years. For the period thereafter, a considerably higher lifetime is assumed. Remarkably, there is an increase in capacity between 2020 and 2030 in the trend scenario (upper value). A similar effect can be seen in the reference development (upper value) of the study by Öko-Institut/FhG ISI 2015 [10]. The reason given for the capacity increase is that the capacity data only cover the power plants in operation. Power plants in cold reserve, and which are thus temporarily decommissioned, are not counted. In 2030, a number of these plants are reactivated and put into operation again, which leads to an increase in capacity of the power plants in operation. As can be seen in Figure 6, from 2030 onwards the fleet development of the reference scenario for the [10] study lies considerably above the calculated fleet development in which a lifetime of 55 years was assumed. This indicates that the lifetimes of plants are considerably higher than 55 years from 2030. In the reference scenario of the EWI/Prognos/GWS study 2014 [5], which has been carried out on behalf of the Federal Ministry for Economic Affairs and Energy (BMWi) the fleet dynamics are oriented towards the development of the calculated fleet dynamics. It is only as of 2040 that a significantly higher capacity is assumed.
Figure 6 also includes a number of fleet developments that were determined within the framework of the coal phase-out discussion. The most ambitious reduction in coal-fired power plant capacity is described in the scenario (−95% CO2 reduction) in the study by the Öko-Institut/FhG ISI 2015 [10]. As early as 2020, more than 50% of the entire power plant fleet would have to be decommissioned, which would correspond to a lifetime considerably below 40 years. Until 2040, the curve follows that of the calculated fleet dynamics (40 years) and falls off sharply thereafter. Another ambitious phase-out scenario (SZ3) can be seen in the study by IZES [8]. The hard-coal-fired power plant capacity declines to a value of almost 7 GW by 2030 and remains more or less at this level until 2050. A comparison with the calculated fleet development (40 years) shows that the lifetime of the plants is also considerably below 40 years. In the projection of ECOFYS 2012 [32] study, the fleet projection lies between the calculated curves (40, 45 years). From 2035 onwards, an accelerated reduction in hard coal power capacity is assumed. Furthermore, a complete phase-out is assumed by the year 2040.

4. Ex Post Analysis

The analysis in the previous section shows that in many studies lifetime assumptions are used to project power plant fleet developments. Other studies, in which the point of shut-down is calculated endogenously, take maximum technical lifetimes as an absolute limit which must not be exceeded. The exogenous specification of lifetimes is essential, irrespective of the methodology used to determine the fleet developments. Nearly all studies rely on figures based on “empirical values” when making lifetime assumptions, without specifying them more closely, however. The validity of the assumptions made cannot be determined. For this reason, an ex post analysis is conducted to determine the real lifetimes of power plants. The analysis covers all fossil-fired power plants that were decommissioned in Germany over the last 30 years. The basis for the data is provided by, for instance, the power plant database of Forschungszentrum Jülich, which was established in the mid 1980’s and has been continuously updated ever since. In addition to the power plant units currently in operation, the database also includes decommissioned plants. The following ex post analysis exclusively takes into account the decommissioned plants, whose characterization (year of commissioning, energy source used, year of decommissioning) is clear. The analysis investigates the periods from 1990 to 1999 and 2000 to 2014. For many decades the electricity market was a monopoly market. The liberalization of the electricity market was initiated in 1998. Against this background, the periods were set. If operators wish to decommission a power plant, they are legally obliged to inform the Federal Network Agency in accordance with § 13a of the Energy Industry Act (EnWG). The Federal Network Agency maintains a list of power plant closure notifications. The power plant units listed in the decommissioning list (as of 30 March 2017) are also included in this lifetime analysis.

4.1. Plants Decommissioned between 1990 and 1999

The following analysis for the given period is specifically restricted to plants in the old federal states of Germany (West Germany). This is because the power plants decommissioned in the new federal states (East Germany) following German reunification represent an exception and the history of these plants cannot be compared to those in the old states. A total of 72 fossil-fired power plant units were decommissioned in the old states during this period (Figure 7). The total capacity of decommissioned power plants amounted to around 6240 MW (Figure 8). Hard-coal-fired power plants had the largest total number of units decommissioned (28), followed by oil (18), lignite (16), and natural gas (10). The average age (weighted with capacity) amounted to 36.3 years for lignite-fired power plant units, 32.9 years for hard-coal-fired plant units, and 30.5 years and 26.2 years for natural gas-fired and oil-fired power plant units, respectively. In nearly all cases, the decommissioned power plant units are what would today be considered as relatively small plant units that reflect the state of the art of their respective years of commissioning. The total decommissioned capacity is relatively low in comparison to the total capacity decommissioned between 2000 and 2014 (14,400 MW). One of the reasons for this was the retrofitting of existing coal-fired power plants with flue gas desulfurization and denitrification facilities between 1983 and 1993. This was generally accompanied by a modernization process, which extended the lifetimes of the plants. Furthermore, it can be seen that a significant number of power plant units were already decommissioned during the implementation of the Federal Immission Control Act. As a result of this act (13th BlmSchV) entering into force, the operators of coal-fired power plants were faced with the choice of retrofitting existing coal power plants with flue gas desulfurization and denitrification facilities or indicating the remaining lifetime of the plants before shutting them down by no later than 1993. This is why around 5700 MW of coal-fired power plants (hard coal: 3000 MW; lignite: 2700 MW) were decommissioned between 1985 and 1993. Due to economic reasons, it made no sense to retrofit these existing plants [33]. This was the case for a total of 35 hard-coal-fired power plant units and 28 lignite-fired plant units. The average lifetime (weighted with capacity) amounted to 30.1 years (hard coal) and 34 years (lignite), respectively. If these lifetimes are compared with the values for the period from 1990 to 1999, it can be seen that the plants decommissioned as part of 13th BImSchV were taken offline roughly two years prior to their expected end of life.

4.2. Plants Decommissioned between 2000 and 2014

In the following section, we look at power plant units decommissioned in Germany between 2000 and 2014 (Figure 9 and Figure 10). The analysis does not cover the power plants put into cold reserve, whose capacity amounted to around 5100 MW in 2014 (19 power plant units, predominantly gas-fired). A total of 99 units with a capacity of around 14,400 MW were decommissioned between 2000 and 2014. Hard coal made up the biggest share of capacity at around 40%, while also accounting for roughly half of all decommissioned plants. Gas-fired power plant capacity made up a roughly 25% (19 units) share of capacity. This mainly concerned large gas-fired steam power plant units built in the 1970s that were no longer economically viable to operate. The same was true for the oil-fired power plant units, which accounted for a roughly 16% share of capacity. The average lifetimes (weighted with capacity) of hard-coal- and lignite-fired power plants amounted to 40.9 years and 43.3 years, respectively. The range of observed lifetimes is again considerable, spanning from 26 to 55 years (hard coal power plants) and from 23 to 57 years (lignite power plants). If the lifetimes of coal-fired power plants during this period are compared to those of the plants decommissioned between 1990 and 1999, a significant increase in lifetime of seven years for lignite and eight years for hard coal can be seen. One of the reasons for this is likely the modernization of the plants which took place during the retrofitting of flue gas cleaning facilities, thus extending their lifetimes. Around 45% of the decommissioned hard coal power plant capacity and 55% of the decommissioned lignite power plant capacity were shut down during the last five years (since 2010). While the decommissioning of hard coal plants is predominantly due to long-term planning measures (e.g., replacement with new plants), the increasingly difficult revenue situation is also likely to have been a significant factor in their decommissioning over recent years. Following the liberalization of the market, it soon became clear that there was a significant overcapacity of power plants in Germany, established within the framework of a monopolized market (see Markewitz & Vögele [43]). The pressure of a liberalized market led to a large number of plants being put into cold reserve or long-term preservation. The strategic retention of the power plant site is also likely to have played a role. As electricity production from renewable energy sources increased, this subsequently led to the decommissioning of many plants. The strategically motivated calculation behind the retention of a power plant site was thus dropped, as the reconstruction of coal-fired power plants and the replacement of obsolete plants became increasingly unlikely.

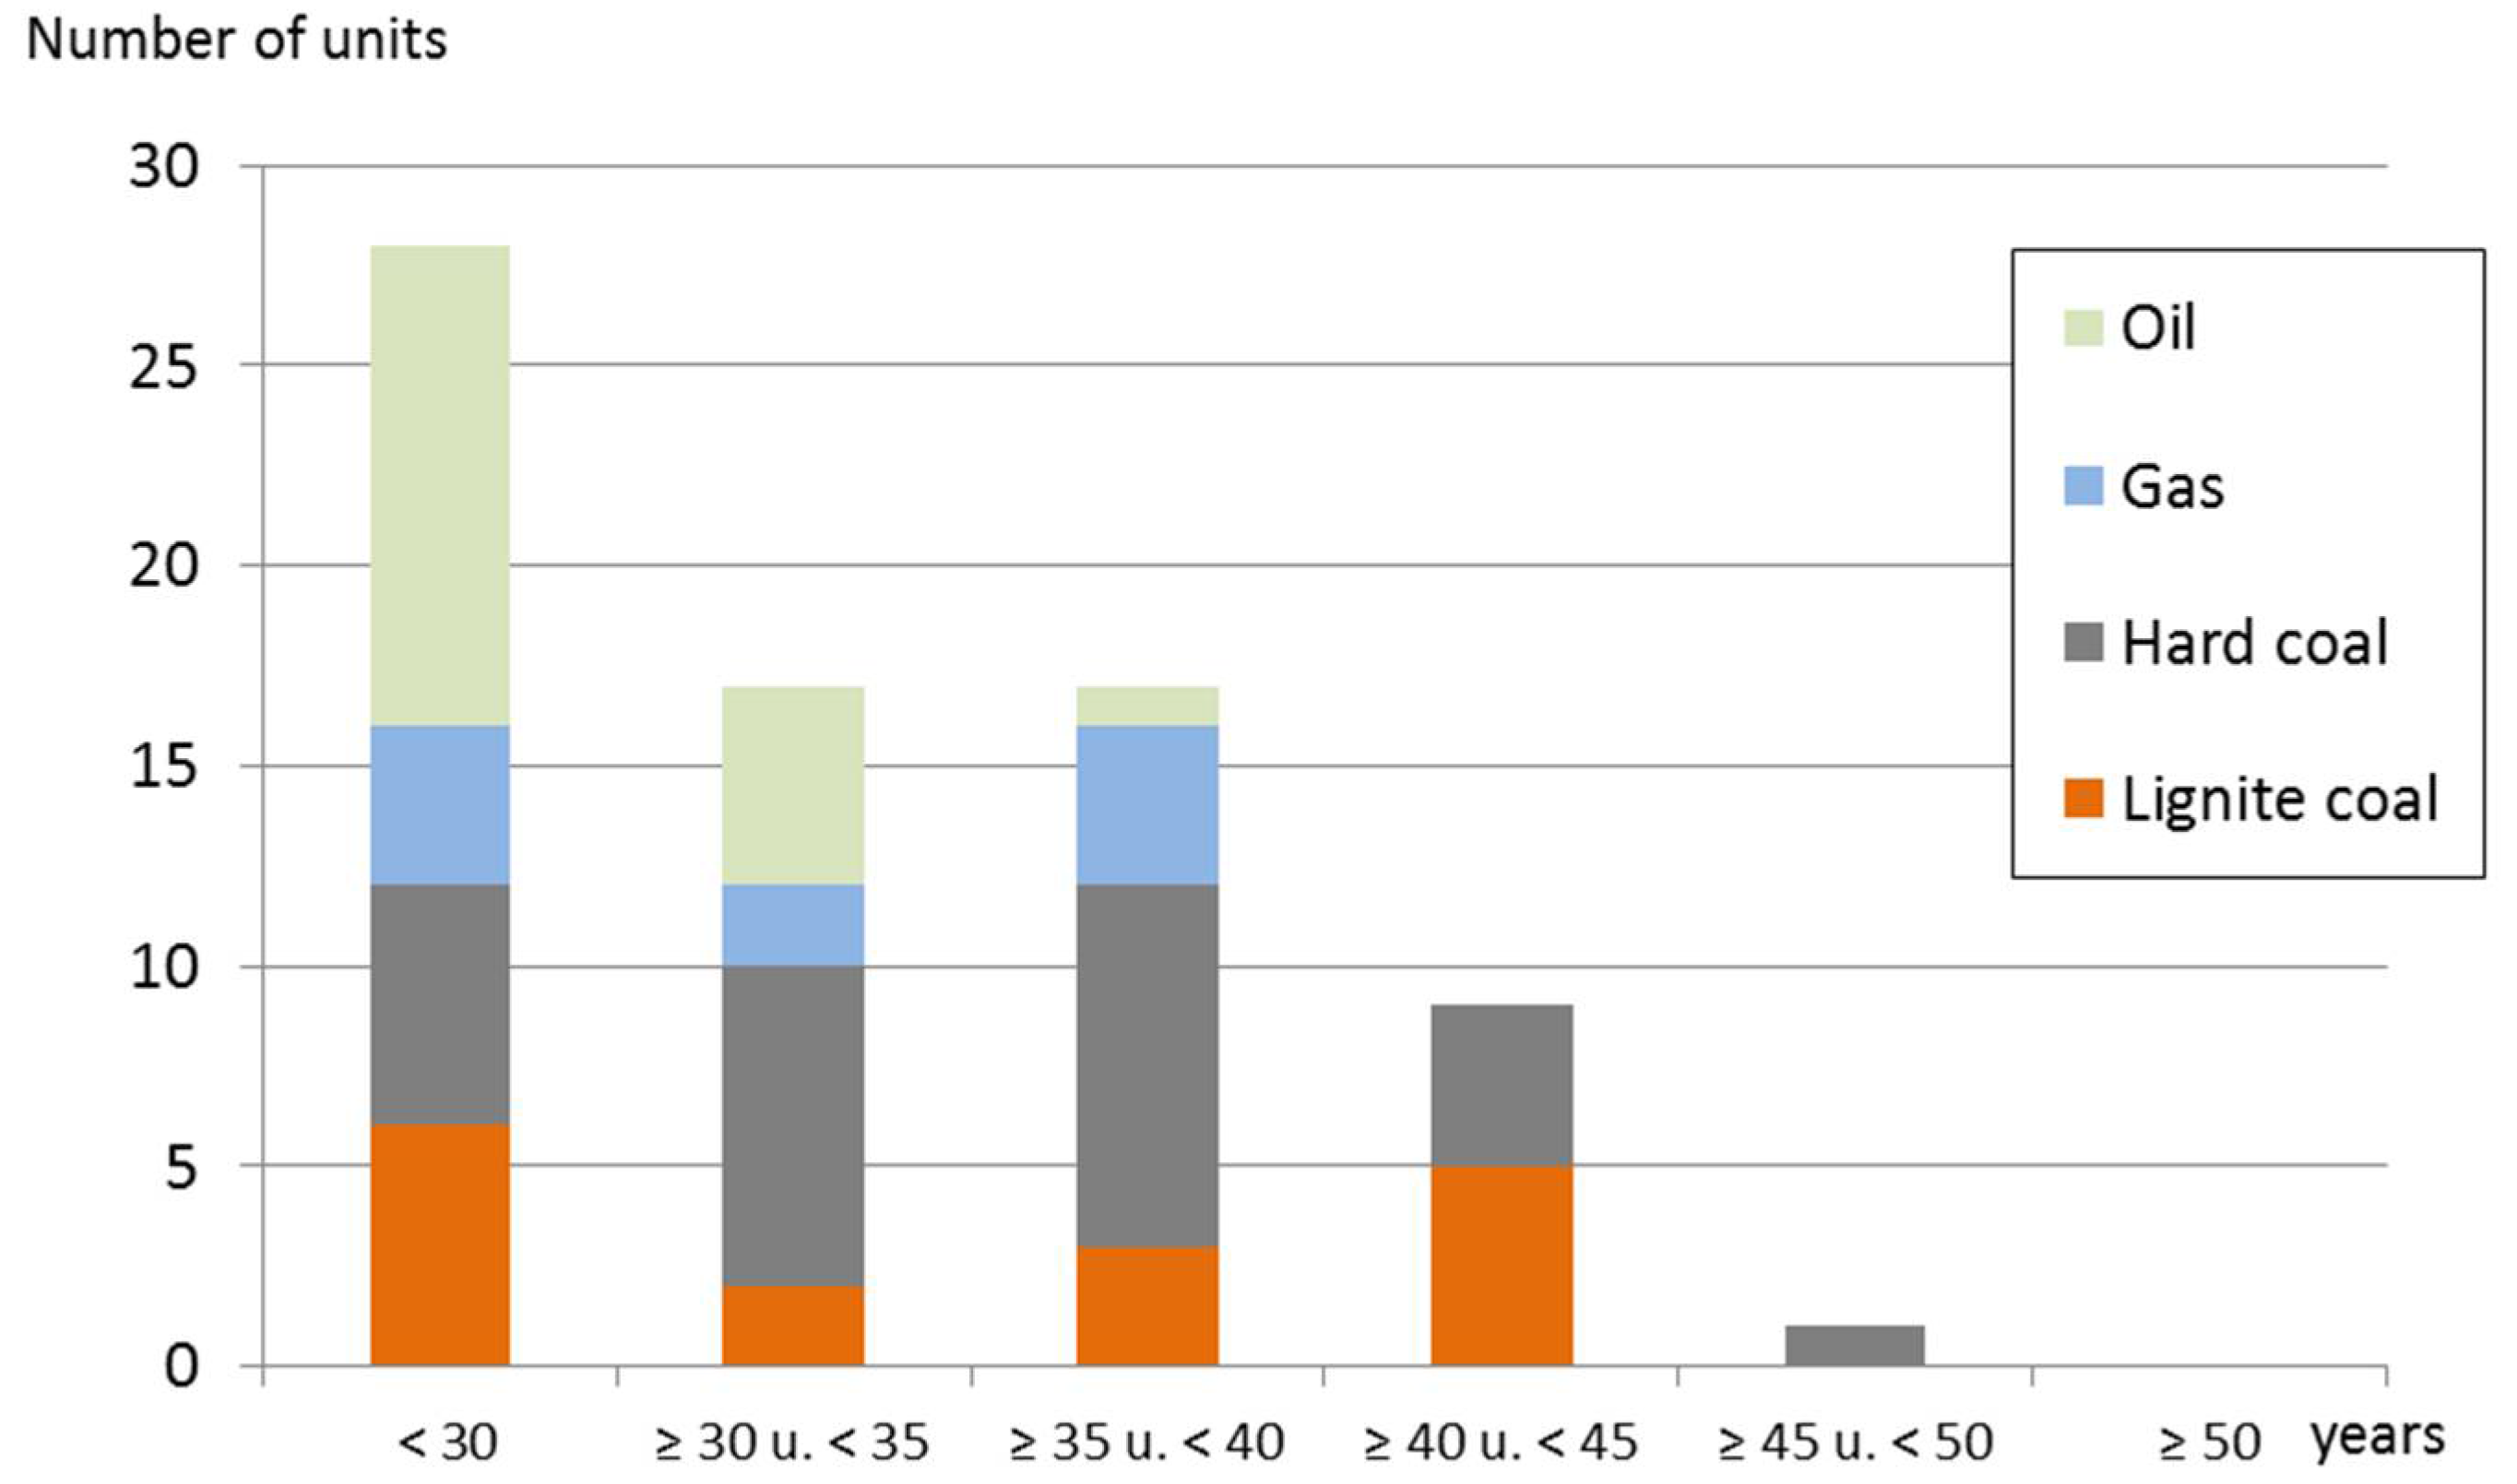
4.3. Federal Network Agency’s List of Power Plant Closure Notification

The following section features an analysis of the power plants that are expected to be dismantled in the near future (Figure 11 and Figure 12). The analysis is based on the Federal Network Agency’s list of power plant closures (as of 30 March 2017), which includes all closure notifications submitted by power plant operators in accordance with § 13a of the EnWG [44]. The following analysis does not make a distinction between whether the power plant closure is a temporary or final measure. Power plants classified as systemically relevant are also included in the analyses, since closure requests are made by operators who intend to decommission plants. For power plants that have been submitted for closure without a specific year of decommissioning, 2018 is taken to be the year of closure for reasons of simplicity.
The total installed capacity of the fossil-fired power plant units listed for closure (37 in total) amounted to 8947 MW. This includes the lignite-fired power plant units that will initially be available only as security reserve before subsequently being decommissioned (electricity market law). Gas-fired power plants make up around 16.5% of the total capacity to be decommissioned (13 units), whereas hard-coal-fired power plants have a roughly 57% share (13 units) and lignite-fired power plants and oil-fired power plants account for 23.5% (7 units) and about 3% (4 units), respectively. The lifetimes are broken down into time intervals and depicted in Figure 11 and Figure 12. Around 54.7% of lignite-fired power plant capacity and 60% of hard-coal-fired plant capacity is older than 35 years. Weighted with capacity, lifetimes of 39.5 years and 38.6 years are calculated for lignite and hard coal power plants, respectively. For oil-fired power plants, the comparable value amounts to 47.5 years. If the seven lignite-fired power plant units set to be put in a temporary back up reserve are taken as a basis, this works out at an age of 44.2 years (weighted by capacity) if the maximum possible operating lifetime (4 years) is exhausted. Five of these plants alone will have demonstrated a lifetime of 50 years by the next possible point of closure.

4.4. Results Comparison

The ex post analysis reveals that the lifetimes of power plants have increased significantly in the last few years. Table 3 contains a summary of the lifetimes weighted with capacity for the respective periods of time. For example, the average age of coal fired power plants in the period from 2000 to 2014 was considerably over 40 years. The lifetimes of power plant units currently listed for closure are slightly lower than in the period from 2000 to 2014, with the exception of oil-fired power plants. Table 4 includes the lifetimes of decommissioned units, whereby the average value is calculated using the number of units. The previously identified trend of increasing power plant lifetimes is also confirmed here.
With the exception of gas-fired power plants, the current fleet of fossil-fired power plants in Germany is relatively old. For instance, a coal-fired power plant unit in Germany has an age of around 33 years on average. Nearly 36% of all lignite-fired plants and 30% of all hard-coal-fired power plants are older than 40 years, whilst 22 coal-fired power plant units are older than 50 years. However, compared with the lifetimes of decommissioned plants, a significant number of coal-fired power plants have considerably lower lifetimes in the event of an accelerated premature phase-out, as has been observed in the recent past.
Farfan and Breyer [13,14] did a lifetime analysis for different power plant types on a global scale. 900 power plant units which have been decommissioned worldwide are analyzed. The analysis shows that average lifetime (weighted with capacity of units) for different technologies is 34 years (gas-fired), 34 years (oil-fired), and 40 years (coal-fired). The authors do not differentiate between lignite and hard coal-fired power plants. The values for gas-fired and oil-fired power plants are larger than the lifetimes observed in Germany (1990–2014). The global values for coal-fired power plants are only in line with operational lifetimes of hard coal power plants, which have been analyzed for the time (2000–2014) in Germany.

5. Summary and Conclusions

The assumption of lifetimes plays an important role in many capacity forecasts. The evaluation of various national studies illustrates the effects of assuming different lifetimes on capacity forecasts. It should also be noted that many studies refer to empirical values for the assumption of lifetimes without specifying them in greater detail. This approach was used to conduct an ex post lifetime analysis—accurate to each number of units—of German fossil fired power plants that have been decommissioned since 1990. The analyses show that lifetimes of fossil power plants increased significantly over the past decades. Between 1990 and 1999 the average lifetime of coal fired power plants ranged from 33 years (hard coal) to 36 years (lignite coal). In contrast, between the years 2000 and 2014, they were significantly higher by seven to eight years.
A reliable statement on the reasons why a plant is decommissioned can only be made qualitatively. In general, it can be said that behind any decision to shut down a plant is an economic calculation focused on optimizing a company portfolio which takes external influences (e.g., electricity market revenues, fuel market, CO2 prices, etc.) into particular consideration. Only in exceptional cases can an operator’s decision to decommission a plant be traced back to a few specific reasons. It is much more the case that such a decision is generally a result of numerous reasons and considerations, which are also reflected in the previously monitored lifetimes. The analyses show that there has been a significant increase in average lifetimes over the last few decades. An analysis of the Federal Network Agency’s current list of power plant closure notifications suggests that this development is set to continue in the near future. The implementation of the Federal Immission Control Act between 1983 and 1990 demonstrates to what extent environmental policy can have an influence on decisions concerning the decommissioning of plants. During this period, a large number of plants were decommissioned ahead of schedule, since it was not worthwhile retrofitting the plants with desulfurization and denitrification facilities. A further example of energy policy influencing decommissioning decisions was the transition from a monopoly-driven market to a liberalized electricity market initiated in 1998. This transition led to a completely new market environment, thus changing the thinking behind operators’ decisions and, in particular, the risk assessment of investment decisions. We can only assume that this also influenced decommissioning decisions. In this context, reference must be made to the major uncertainties which followed the liberalization of the market, since the detailed structuring of the electricity market only took place gradually. It stands to reason that these developments triggered a shift in investment decisions, which in all likelihood led to a significant extension in the lifetimes of power plants.
This ex post analysis presents the first lifetime analysis for decommissioned German plants, which can serve as a basis for future power plant fleet projections. Compliance with the CO2-reduction targets by 2050 requires the phasing out of coal-fired power generation. An implementation of new technologies is necessary. Our lifetime analysis enables a more in-depth analysis and evaluation of the dynamics of diffusion processes (e.g., [45]) as well as lock in effects. The analysis of future electricity market developments requires the specification of stock developments. The result of our ex post analysis can contribute to these purposes. However, it must be noted that the calculated lifetimes represent average values. As is also seen in the analyses, individual plants can reach lifetimes of much greater than 50 years. In general, it should be noted, when interpreting the lifetimes of power plants determined during an ex post analysis, that they always reflect energy and environmental policies as well as the market environment of the investigated period.

Supplementary Materials

The following supplementary materials are available online at https://www.mdpi.com/1996-1073/11/6/1616/s1.

Author Contributions

P.M. proposed the research topic. He did the calculations and wrote most parts of the paper. M.R. took part in discussing the results and gave a valuable input. He took also part in revising the paper. Together with P.M. he included the reviewer comments. D.S. also validated the idea and reviewed the final paper.

Funding

This research received no external funding.

Conflicts of Interest

The authors declare no conflict of interest.

Appendix A

Table A1. Lifetime assumptions for fossil-fired power plants in various national studies.
StudyHard CoalLignite CoalNatural GasOilLiterature
GDP (1) Electricity 201350504550[46]
GDP Electricity 201450504550[28]
GDP Electricity 2025 (first draft) [29]
Scenario A50-(2)4545
Scenario B40-(2)4545
GDP Electricity 2025 [42]
Scenario A50504545
Scenario B45454040
Scenario C40403535
IZES 2015 projection [8]
Coal phase out scenariosDepending on efficiencies and specific CO2-emissions and limited emissions caps (3)--
DIW projection [31]
Coal phase out scenariosDepending on efficiencies and specific CO2-emissions (4)
Öko-Institut/ISI FhG 2014454530–4030–35[47]
Öko-Institut/ISI FhG 2015555530–3530–35[10]
AGORA [4]
Reference scenario5040--
Coal phase out scenarios
until 2025>40--
2026-203035–39--
2031-203530–34--
2036-204027–29--
>204027–29--
Forschungszentrum JülichCalculation based on life time consumption via operation hours and operation modes[35]
Forschungszentrum Jülich35 (5)35 (5) -[33]
Forschungszentrum Jülich [34,48]
Reference case45503535
Coal phase outModel calculation3535
Policy scenarios VI455025–5030–35[7]
Greenpeace (8)-39 (7)--[2]
BMWi Energiemärkte Report 199530–35[38]
BMWi Energiemärkte Report 1999Model calculation (6)[39]
BMWi Referenz-prognose 2005A maximum technical lifetime (7) has been assumed, year of phase-out was calculated by using a model[40]
BMWi Energie-prognose 2009No information available[9]
Energy scenario for a national energy concept 2010No information available[6]
BMWi Energie-referenzprognose 2014No information available[5]
Folke, PhD Thesis 2000505030 (10) 35 (11)-[49]
ECOFYS [32]
Reference case49 (5),(7)47 (5),(7)--
Coal phase out39 (8),(3)36 (8),(3)--
Notes: (1) GDP: National grid development; (2) year of phase-out has been calculated according to first year of operation and lifetime of lignite mines, no values available; (3) see Figure 5 and Figure 6; (4) no values available (5) In the case of retrofitting (desulfurization, denitrification) an additional lifetime of 15 years has been assumed (35 years + 15 years = 50 years); (6) Criteria for phase-out decision: contribution margin is not sufficient for fixed and variable costs; (7) No value for maximal lifetime available; (8) Average lifetime (weighted with number of units): own calculations; (9) only lignite phase out; (10) open cycle gas turbine; (11) Combined cycle.

References

  1. BMU Klimaschutzplan 2050—Kabinettbeschluss vom 14. 2016. Available online: www.bmub.bund.de (accessed on 15 November 2016).
  2. Energy Brainpool. Auswirkungen Eines Partiellen Kohleausstiegs. Studie im Auftrag von Greenpeace e.V.: 2. 2015. Available online: http://www.energybrainpool.com/analyse/studienverzeichnis.html (accessed on 25 April 2018).
  3. Enervis Energy Advisors. Ein Kraftwerkspark im Einklang mit den Klimazielen. Handlungslücke, Maßnahmen und Verteilungseffekte bis 2020. Studie im Auftrag der Agora Energiewende. 2015. Available online: www.agora-energiewende.de (accessed on 25 April 2018).
  4. Enervis Energy Advisors. Der Klimaschutzbeitrag des Stromsektors—Entwicklungspfade für die deutschen Kohlekraftwerke und deren wirtschaftliche Entwicklung. Studie im Auftrag der Agora Energiewende. 2015. Available online: www.agora-energiewende.de (accessed on 25 April 2018).
  5. EWI; Prognos. GWS Entwicklung der Energiemärkte—Energiereferenzprognose. Studie im Auftrag des Bundesministeriums für Wirtschaft und Technologie, Projekt Nr. 57/12. 2014. Available online: https://www.bmwi.de/Redaktion/DE/Publikationen/Studien/entwicklung-der-energiemaerkte-energiereferenzprognose-endbericht.pdf?__blob=publicationFile&v=7 (accessed on 15 March 2018).
  6. EWI/gws/Prognos. Energieszenarien für ein Energiekonzept der Bundesregierung. Studie im Auftrag des BMWi, Projekt Nr. 12/10. 2010. Available online: http://www.ewi.uni-koeln.de/fileadmin/user_upload/Publikationen/Studien/Politik_und_Gesellschaft/2010/EWI_2010-08-30_Energieszenarien-Studie.pdf (accessed on 20 November 2017).
  7. Hansen, P.; Gorres, S.; Matthes, F.C. Politikszenarien für den Klimaschutz VI—Treibhausgas-Emissionsszenarien bis zum Jahr 2030; Schriften des Forschungszentrums Jülich, Reihe Energie und Umwelt, Band 203, Advances in Systems Analysis 5; Forschungszentrum Jülich GmbH: Jülich, Germany, 2014. [Google Scholar]
  8. Horst, J.; Leprich, U.; Luxenburger, M.; Klann, U.; Weber, A.; Zipp, A.; Klinski, S. Kraftwerks-Stilllegungen zur Emissionsreduzierung und Flexibilisierung des Deutschen Kraftwerksparks: Möglichkeiten und Auswirkungen. Studie der izesgGmbH im Auftrag des MWKEL des Landes Rheinland-Pfalz. 2015. Available online: http://www.izes.de/de/projekte/ (accessed on 26 March 2018).
  9. IER/rwi/ZEW. Die Entwicklung der Energiemärkte bis 2030 (Energieprognose 2009). Studie im Auftrag des BMWi Projekt Nr. 23/08. 2008. Available online: http://www.rwi-essen.de/media/content/pages/publikationen/rwi-projektberichte/PB_Energieprognose-2009.pdf (accessed on 20 October 2017).
  10. Öko-Institut; FhG-ISI. Klimaschutzszenario 2050—2. Runde Studie im Auftrag des BMU. 2015. Available online: https://www.oeko.de/oekodoc/2451/2015-608-de.pdf (accessed on 16 March 2018).
  11. Reitz, F.; Gerbaulet, C.; Kemfert, C.; Lorenz, C.; Pao-Yu, L.; von Hirschhausen, C. Szenarien einer nachhaltigen Kraftwerksentwicklung in Deutschland. Studie im Auftrag der Heinrich Böll Stiftung. DIW Berlin: Politikberatung kompakt 90. 2014. Available online: www.diw.de (accessed on 25 May 2018).
  12. Robinius, M.; Stein, F.; Schwane, A.; Stolten, D. A Top-Down Spatially Resolved Electrical Load Model. Energies 2017, 10, 361. [Google Scholar] [CrossRef]
  13. Farfan, J.; Breyer, C. Aging of European power plant infrastructure as an opportunity to evolve towards sustainability. Int. J. Hydrog. Energy 2017, 42, 18081–18091. [Google Scholar] [CrossRef]
  14. Farfan, J.; Breyer, C. Structural changes of global power generation capacity towards sustainability and the risk of stranded investments supported by a sustainability indicator. J. Clean. Prod. 2017, 141, 370–384. [Google Scholar] [CrossRef]
  15. García-Gusano, D.; Iribarren, D.; Dufour, J. Is coal extension a sensible option for energy planning? A combined energy systems modelling and life cycle assessment approach. Energy Policy 2018, 114, 413–421. [Google Scholar] [CrossRef]
  16. Johnson, N.; Krey, V.; McCollum, D.L.; Rao, S.; Riahi, K.; Rogelj, J. Stranded on a low-carbon planet: Implications of climate policy for the phase-out of coal-based power plants. Technol. Forecast. Soc. Chang. 2015, 90, 89–102. [Google Scholar] [CrossRef]
  17. Odenberger, M.; Johnsson, F. Achieving 60% CO2 reductions within the UK energy system—Implications for the electricity generation sector. Energy Policy 2007, 35, 2433–2452. [Google Scholar] [CrossRef]
  18. Bundesministerium für Wirtschaft und Energie (BMWi). Fünfter Monitoring-Bericht zur Energiewende—Die Energie der Zukunft Berichtsjahr 2015; Bundesministerium für Wirtschaft und Energie (BMWi): Berlin, Germany, 2016. Available online: https://www.bmwi.de/Redaktion/DE/Publikationen/Energie/fuenfter-monitoring-bericht-energie-der-zukunft.pdf?__blob=publicationFile&v=24 (accessed on 31 December 2016).
  19. Arbeitsgruppe Erneuerbare Energien-Stastitik (AGEE-Stat). Erneuerbare Energien in Zahlen. 2018. Available online: https://www.erneuerbare-energien.de/EE/Navigation/DE/Service/Erneuerbare_Energien_in_Zahlen/erneuerbare_energien_in_zahlen.html (accessed on 24 May 2018).
  20. Bundesnetzagentur. Monitoringbericht 2017. 2017. Available online: https://www.bundesnetzagentur.de/SharedDocs/Downloads/DE/Allgemeines/Bundesnetzagentur/Publikationen/Berichte/2017/Monitoringbericht_2017.pdf?__blob=publicationFile&v=3 (accessed on 24 May 2018).
  21. Markewitz, P.; Robinius, M.; Stolten, D. Energietransport und -verteilung. Brennstoff-Wärme-Kraft 2018, 70, 47–55. (In German) [Google Scholar]
  22. Arbeitsgemeinschaft Energiebilanzen (AGEB). Bruttostromerzeugung in Deutschland in Deutschland ab 1990 nach Energieträgern. Available online: https://www.ag-energiebilanzen.de/ (accessed on 24 May 2018).
  23. Bundesministerium für Wirtschaft und Energie (BMWi). Die Elektrizitätswirtschaft in der Bundesrepublik Deutschland im Jahre 1986—Statistischer Jahresbericht des Referats Elektrizitätswirtschaft im Bundesministeriums für Wirtschaft (BMWi). Elektrizitätswirtschaft 1987, 86, 805–871. [Google Scholar]
  24. Bundesministerium für Wirtschaft und Energie (BMWi). Die Elektrizitätswirtschaft in der Bundesrepublik Deutschland im Jahre 1989—Statistischer Jahresbericht des Referats Elektrizitätswirtschaft im Bundeministerium für Wirtschaft (BWMi). Elektrizitätswirtschaft 1990, 89, 1111–1195. [Google Scholar]
  25. Bundesministerium für Wirtschaft und Energie (BMWi). Die Elektrizitätswirtschaft in der Bundesrepublik Deutschland im Jahre 1990—Statistischer Jahresbericht des Referats Elektrizitätswirtschaft im Bundesministerium für Wirtschaft; VWEW-Verlag: Frankfurt am Main, Germany, 1992; p. 63.
  26. Bundesministerium für Wirtschaft und Energie (BMWi). Gesamtausgabe der Energiedaten—Datensammlung BMWi; Bundesministerium für Wirtschaft und Energie (BMWi): Berlin, Germany, 2018. Available online: https://www.bmwi.de/Redaktion/DE/Artikel/Energie/energiedaten-gesamtausgabe.html (accessed on 25 March 2018).
  27. Bundesnetzagentur Kraftwerksliste. Available online: https://www.bundesnetzagentur.de/DE/Sachgebiete/ElektrizitaetundGas/Unternehmen_Institutionen/Versorgungssicherheit/Erzeugungskapazitaeten/Kraftwerksliste/kraftwerksliste-node.html (accessed on 20 March 2017).
  28. Übertragungsnetzbetreiber. Szeanriorahmen 2013. 50Hertz, Amprion, TenneT TSO, TransnetBW (Genehmigt von der BNA am 30 August 2013). 2013. Available online: https://www.bundesnetzagentur.de/SharedDocs/Pressemitteilungen/DE/2012/120720_SzenariorahmenNEP2013.html (accessed on 25 April 2018).
  29. Übertragungsnetzbetreiber. Szenariorahmen für die Netzentwicklungspläne Strom 2015—Entwurf der Übertragungsnetzbetreiber. 50Hertz Transmission, Amprion, TenneT TSO, TransnetBW. 2014. Available online: https://www.netzausbau.de/home/de.html (accessed on 25 April 2018).
  30. Agora Energiewende. Elf Eckpunkte für Einen Kohlekonsens. Konzept zur Schrittweisen Dekarbonisierung des Deutschen Stromsektors. 2016. Available online: www.agora-energiewende.de (accessed on 25 April 2018).
  31. Reitz, F.; Gerbaulet, C.; Kemfert, C.; Lorenz, C.; Oei, P.-Y.; von Hirschhausen, C. Szenarien einer nachhaltigen Kraftwerksentwicklung in Deutschland. Studie im Auftrag der Heinrich-Böll Stiftung und der European Climate Foundation, DIW Berlin Politikberatung Kompakt 90. 2014. Available online: https://www.boell.de/de/2014/11/19/studie-szenarien-nachhaltige-kraftwerksentwicklung-deutschland (accessed on 16 March 2018).
  32. Klaus, S.; Beyer, C.; Jaworski, P. Allokationsmethoden der Reststrommengen nach dem Entwurf des Kohleausstiegsgesetzes. Studie im Auftrag der Greenpeace Deutschland e.V. 2012. Available online: www.greenpeace.de (accessed on 25 April 2018).
  33. Markewitz, P.; Nollen, A.; Th, P. Die Altersstruktur des westdeutschen Kraftwerksparks. Brennstoff-Wärme-Kraft 1998, 50, 38–42. (In German) [Google Scholar]
  34. Heinrichs, H.; Markewitz, P. A Coal Phase-out in Germany—Clean, Efficient and Affordable? Energy Procedia 2015, 75, 2541–2547. [Google Scholar] [CrossRef]
  35. Markewitz, P.; Nollen, A.; Vögele, S. German Power Plants: A Market Potential for the Plant Construction Sector? VGB PowerTech 2002, 82, 28–31. [Google Scholar]
  36. Meinke, S. Modellierung thermischer Kraftwerke vor dem Hintergrund steigernder Dynamikanforderungen Aufgrund Zunehmender Windenergie- und Photovoltaikeinspeisung. Ph.D. Thesis, Universität Rostock, Fakultät Maschinbau und Schiffstechnik, Rostock, Germany, 2012. (In German). [Google Scholar]
  37. Nollen, A. Lebensdaueranalysen von Kraftwerken der Deutschen Elektrizitätswirtschaft. Ph.D. Thesis, RWTH Aachen, Aachen, Germany, 2002. (In German). [Google Scholar]
  38. Prognos AG. Die Energiemärkte Deutschlands im Zusammenwachsenden Europa—Perspektiven bis Zum Jahr 2020 (Energieeport II)—Studie im Auftrag des Bundesministeriums für Wirtschaft; Schäffer-Poeschel Verlag für Wirtschaft: Stuttgart, Germany, 1995; p. 647. [Google Scholar]
  39. Prognos AG; EWI. Die Längerfristige Entwicklung der Energiemärkte im Zeichen von Wettbewerb und Umwelt (Energiereport III), Studie im Auftrag des BMWi; Schäffer-Poeschel Verlag: Stuttgart, Germany, 1999; p. 492. [Google Scholar]
  40. EWI/Prognos. Die Entwicklung der Energiemärkte bis zum Jahr 2030—Energiewirtschaftliche Referenzprognose; Oldenbourg Industrieverlag München: München, Germany, 2005. [Google Scholar]
  41. Bundesministerium für Wirtschaft und Energie (BMWi). Energiekonzept für eine Umwelt Schonende, Zuverlässige und Bezahlbare Energieversorgung; Bundesministerium für Wirtschaft und Technologie (BMWi): Berlin, Germany, 2010. Available online: http://www.bmwi.de/BMWi/Navigation/Service/publikationen,did=360808.html (accessed on 25 April 2018).
  42. Bundesnetzagentur (BNetzA). Genehmigung des Szenariorahmen 2025 für den NEP Strom 2025 Sowie O-NEP 2025; Bundesnetzagentur (BNetzA): Bonn, Germany, 2015. Available online: www.netzausbau.de (accessed on 21 March 2018).
  43. Markewitz, P.; Vögele, S. Kraftwerksüberkapazität in Deutschland. Energiewirtschaftliche Tagesfragen 2002, 52, 36–39. (In German) [Google Scholar]
  44. Bundesnetzagentur Liste der Kraftwerksstilllegungsanzeigen vom. 2017. Available online: https://www.bundesnetzagentur.de/DE/Sachgebiete/ElektrizitaetundGas/Unternehmen_Institutionen/Versorgungssicherheit/Erzeugungskapazitaeten/KWSAL/KWSAL_node.html (accessed on 5 April 2017).
  45. Heinz, B.; Graeber, M.; Praktiknjo, A.J. The diffusion process of stationary fuel cells in a two-sided market economy. Energy Policy 2013, 61, 1556–1567. [Google Scholar] [CrossRef]
  46. Übertragungsnetzbetreiber. Szenariorahmen für den Netzentwicklungsplan Strom 2013—Entwurf; Übertragungsnetzbetreiber (50Hertz, Amprion, TenneT TSO, TransnetBW): Stuttgart, Germany, 2012. [Google Scholar]
  47. Öko-Institut; FhG-ISI. Klimaschutzszenario 2050. Studie im Auftrag des BMU. 2014. Available online: www.oeko.de (accessed on 25 April 2018).
  48. Heinrichs, H.U.; Markewitz, P. Long-term impacts of a coal phase-out in Germany as part of a greenhouse gas mitigation strategy. Appl. Energy 2017, 192, 234–246. [Google Scholar] [CrossRef]
  49. Folke, C. Minderung der Kohlendioxidemissionen Durch Erneuerung Vorhandener Kohlekraftwerke in der Europäischen Union und Dadurch Verursachte Kosten; Fortschritt-Berichte VDI, Reihe 6 Energietechnik, Nr. 439; VDI-Verlag: Düsseldorf, Germany, 2000. [Google Scholar]
Figure 1. Net power plant capacity in Germany [18,19,20,21].
Energies 11 01616 g001
Figure 2. Net capacity of thermal conventional power plants in Germany [17,19,20].
Energies 11 01616 g002
Figure 3. Development of capacity, electricity production, and consumption since 1970 [23,24,25,26].
Energies 11 01616 g003
Figure 4. Age distribution of fossil-fired power plants in Germany (data source: [27]), power plant database of the Federal Network Agency, as of March 2017).
Energies 11 01616 g004
Figure 5. Selected power plant capacity scenarios (lignite-fired power plants) compared with calculated capacity developments (lifetime: 40 years, 50 years, 55 years). Legend: ECOFYS 2012: [32], Greenpeace 2015: [2], AGORA 2015: [4], EWI/Prognos/GWS 2014: [5], NEP Strom 2025: [42], IZES-SZ2 2015: [8], Öko-Institut/ISI FhG 2015: [10].
Energies 11 01616 g005
Figure 6. Selected power plant capacity scenarios (hard coal fired power plants) compared with calculated capacity developments (lifetime: 40 years, 45 years, 55 years). Legend: ECOFYS 2012: [32], AGORA 2015: [4], EWI/Prognos/GWS 2014: [5], NEP Strom 2025: [42], IZES-SZ3 2015: [8], Öko-Institut/ISI FhG 2015: [10].
Energies 11 01616 g006
Figure 7. Number of decommissioned fossil-fired power plant units in the period from 1990 to 1999 in Germany (only states of former West Germany).
Energies 11 01616 g007
Figure 8. Capacity of decommissioned fossil-fired power plant units in the period from 1990 to 1999 in Germany (only states of former West Germany).
Energies 11 01616 g008
Figure 9. Number of decommissioned fossil-fired power plant units in the period from 2000 to 2014 in Germany.
Energies 11 01616 g009
Figure 10. Capacity of decommissioned fossil-fired power plant units in the period from 2000 to 2014 in Germany.
Energies 11 01616 g010
Figure 11. Number of fossil-fired power plant units scheduled for closure according to Federal Network Agency list (as of 30 March 2017) [44].
Energies 11 01616 g011
Figure 12. Capacity of fossil-fired power plant units scheduled for closure according to Federal Network Agency list (as of 30 March 2017) [44].
Energies 11 01616 g012
Table 1. Electricity production and power plant capacity in Germany 2017 according to [18,22].
Energy SourcesElectricity Production (TWhGross)Share of Total Electricity Production (%)Capacity (GWNet)Share of Total Installed Capacity (%)
Lignite coal147.522.521.39.8
Hard coal92.614.12511.5
Natural gas86.513.229.513.5
Oil5.90.94.42.0
Nuclear76.311.710.85.0
Wind106.616,355.825.6
PV39.96.142.419.5
Biomass45.56.97.83.6
Note: All values are preliminary.
Table 2. Average age of existing fossil-fired power plants in Germany.
Energy SourcesAge (Weighted with Capacity)Age (Weighted with Number of Units)
Lignite coal30.432.9
Hard coal27.332.9
Gas22.824.1
Oil37.534.4
Table 3. Average age of existing power plants and average lifetime of decommissioned power plants in Germany (weighted with capacity of units).
AgeLifetime of Decommissioned Power Plants
Energy SourceExisting Stock≥1990 and ≤1999≥2000 and ≤2014 (1)Scheduled for Decommissioning § 13a EnWG
Lignite30.436.343.339.5
Hard coal27.332.940.938.6
Gas22.830.529.527.5
Oil37.526.229.547.5
Note: (1) excluding cold reserve.
Table 4. Average age of existing power plants and average lifetime of decommissioned power plants in Germany (weighted with number of units).
AgeLifetime of Decommissioned Power Plants
Energy SourceExisting Stock≥1990 and ≤1999≥2000 and ≤2014 (1)Scheduled for Decommissioning § 13a EnWG
Lignite32.933.945.138.9
Hard coal32.935.139.541.0
Gas24.131.232.729.0
Oil34.432.332.947.5
Note: (1) excluding cold reserve.

