1. Introduction
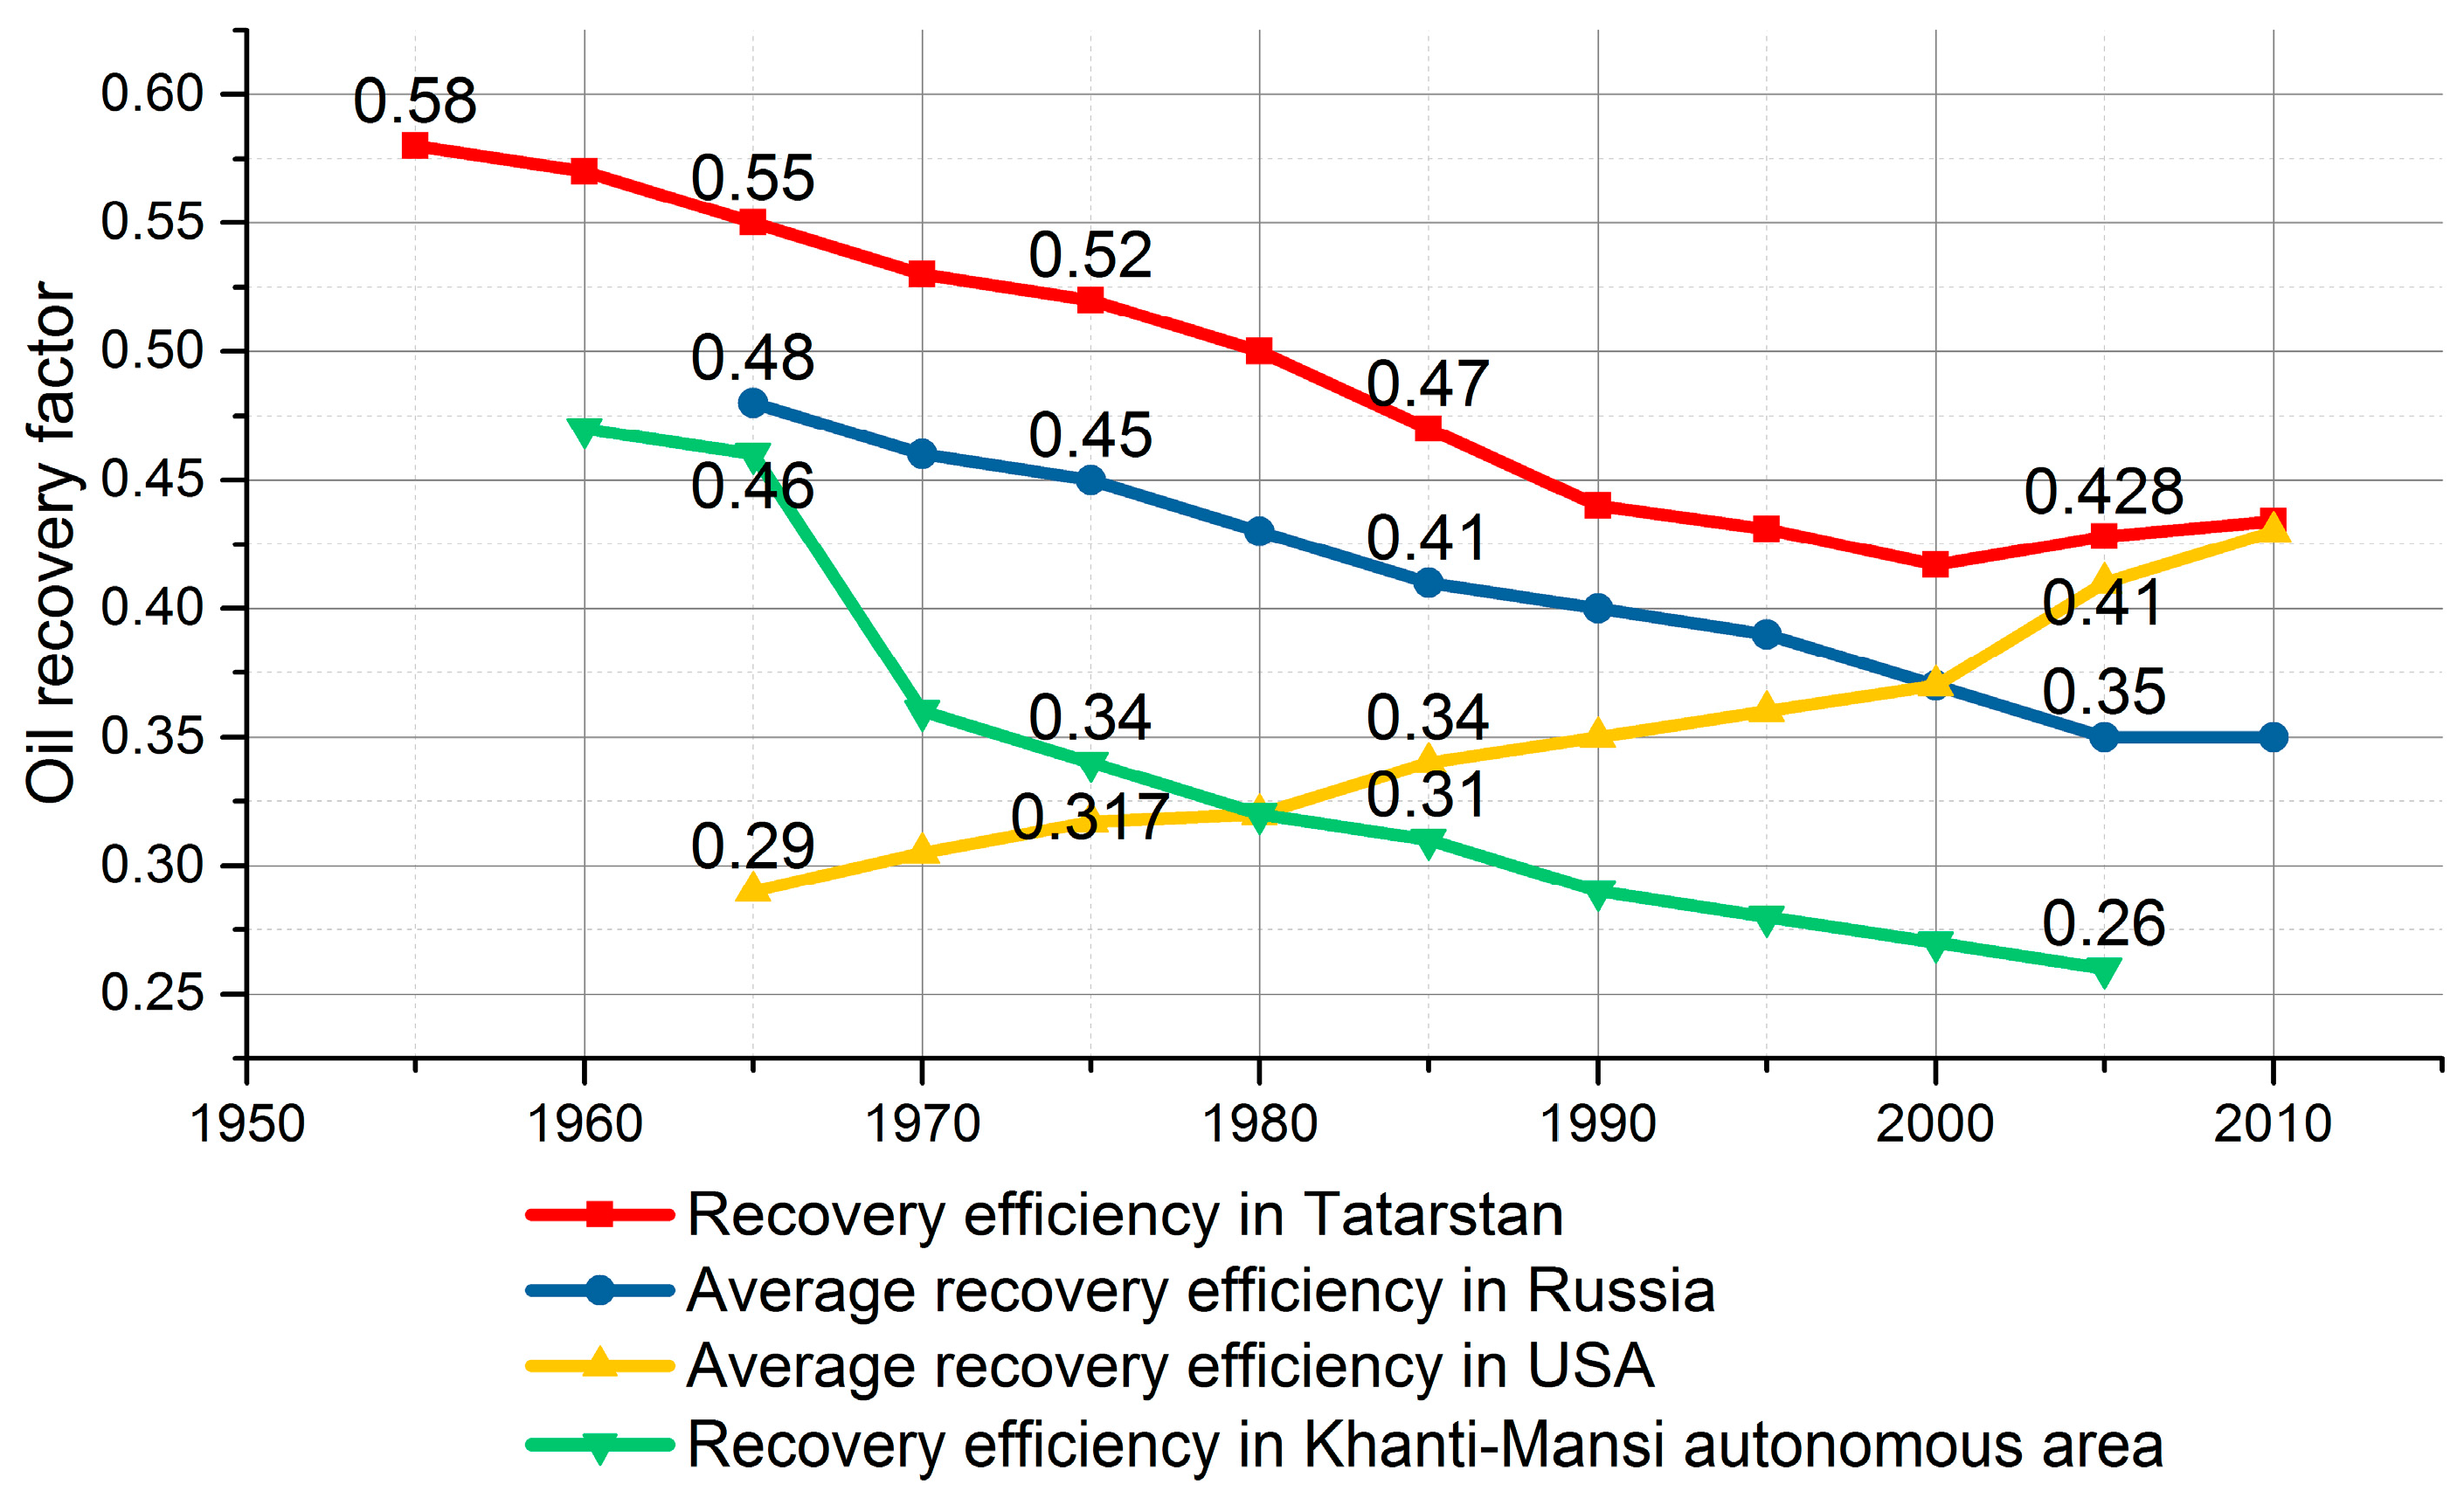
The average efficiency of oil recovery in Russia, by different estimates, ranges between 27 and 34%, and thus 65–70% of Russian oil remains untapped in the reservoir [
1]. By way of a comparison, the global average recovery efficiency is 30–35% [
2], and in the USA recovery efficiency has reached 40%—with a far less favorable structure of reserves (
Figure 1). To a great extent, the high US oil recovery factor can be explained by governmental programs to enhance oil extraction through the development of modern enhanced oil recovery (EOR) technologies [
3], supported at the state level; e.g., through taxation subsidies [
4].
One especially significant method of EOR for the Russian oil industry is miscible flooding (injection of CO
2 or carbonized water, natural gas, and nitrogen) because the majority of the oil remaining in place in the depleted fields is in the form of flooded residual reserves. With high sweep efficiency, residual oil saturation of a reservoir can be as low as 2–5% [
5].
Although the US was the leader in CO
2-EOR during the late 20th century, the USSR also possessed experience in CO
2-EOR [
6]. The assessment of CO
2-EOR prospects for several deposits in Bashkortostan, Tatarstan and the Samara oblast pilot-scale operations in the Tuymazy were quite positive—it was found that CO
2 flooding could increase recovery efficiency by 13–15%; however, for financial reasons, the projects were discontinued [
7].
Compared to the US, the application of modern EOR methods in Russia is only at the initial stages of development, which is partly due to the technical and socio-economic development of the post-Soviet oil industry, and partly because of current negative trends in the oil market [
9]. However, taking into account the importance of the oil sector for the economy of Russia, the promotion of new EOR methods, including economic incentives, must become a strategic goal of the national oil industry.
One of the modern threats to the long-term development of the Russian oil industry is the depletion of easily recoverable oil reserves. The only way to maintain the current level of oil production (525–530 million tons per year) is the development of hard-to-recover oil resources, including marine ones, since the oil reserves in the fields currently being developed are exhausted by more than 65% in the European part and by more than 70% in the Ural and the Volga regions. In General, the average rate of depletion of large Russian deposits is close to 60%. 77% of the current level of oil production is provided by the development of large fields, and the reserves will last another 8–12 years. As the share of hard-to-recover reserves increases, more deposits with heavy oils, low-permeability rocks, and huge under-gas-cap zones are being brought into production; the need to improve the existing methods of developing these depleted fields is evident.
Existing research articles devoted to Carbon Capture and Storage (CCS) can be divided into four principal areas. Firstly, the development and improvement of CCS technologies, which includes a risk assessment of present and future technologies [
10]. A promising direction is the production of methane and geothermal energy from geopressured-geothermal aquifers using CO
2, which could offset the energy cost of CCS [
11]. An alternative is the use of captured CO
2 for the production of various products, such as methanol. However, these technologies are not yet profitable [
12]. Also of interest are articles on the potential of carbonated water injection to increase oil recovery [
13]. Such studies are the main driver for CCS development and the enhancement of its competitiveness, due to the low current technical and economic efficiency of all production stages [
14].
Secondly, the development of methods for promoting CCS; its social perception and historical aspects. The annual number of publications in this area doubled between 2009 and 2013 [
15]. Their main purpose is CCS popularization. In many ways, public perception may play a significant role in reducing the carbon intensity of these economies [
16], although in [
17] it was shown that financial factors a play primary role together with the environmental policy of the government [
18]. The problem with these studies is that they are conducted mainly in countries that have a clear and structured CCS development policy. In other words, countries where CCS receives some public support include already developed systems of carbon taxation and carbon trading.
Third is the development of methods for assessing the technical and economic efficiency of CCS projects and technological chains. This direction is the most widespread, because such an assessment is a sufficiently nonlinear task. Its results depend on a various number of factors such as the type of the captured object; coal- and gas-fired power plants [
19], coal-and-biomass-to-liquids-and-electricity plants [
20], or cement plants [
21]. Another significant factor is the available methods of CO
2 capture, among which the oxy-combustion power plant cycle [
22], which uses an integrated gasification combined cycle process using sorbent [
23] and various biomass-based energy supply chains [
24], appears promising. In major cases such studies are based on regression, correlation, or scenario analysis, which seem to be a reliable approach that takes into account the immaturity of the carbon capture technologies.
In contrast to the two mentioned factors, which are related to the first stage of CCS technology, it is also important to assess the availability of necessary infrastructure [
25], which relates not only to a specific project, but is also interconnected with the general regional socio-economic systems; for example, a system of pipelines [
26]. The presence of infrastructure leads us to the question of effective CO
2 use/utilization. On the one hand, it is a highly promising area to increase oil recovery with CO
2 [
27,
28]. On the other hand, in the long term, with oil share decreasing in the global energy balance, the primary role could be given over to the production of carbonated goods [
29]. However, such a transition requires significant state support of carbon reduction projects and research [
30,
31].
Fourth are CCS development forecasts. Today, the United States is the leader in CCS, followed by many developed and emerging countries that have the potential for CO
2 capture, such as South Korea [
32]. Naturally, the majority of the publications in recent years are dedicated to China’s economy, because it is the largest CO
2 producer in the world [
33]. This is largely due to the introduction of China’s “13th Five-Year Plan”. Besides scientific publications, forecasts are also developed by national and international agencies and corporations. Despite various forward-looking statements, many studies evince the prospects for reducing the cost of the technology, the long-term significant potential of CCS, and its impact on the socio-economic development of countries [
34].
The analysis of publications in the field of CCS development allows us to say that almost all of them focus on countries and regions that have CO
2 medium- and long-term emission reduction programs; e.g., China [
35]. However, there are some exclusions, such as an evaluation of the Canadian reservoirs [
36,
37] carried out in the beginning of the century when there was no government regulation of CO
2 emission, or the economic evaluation of the CO
2-EOR potential for the Iranian oil reservoirs [
38]. But in general, the countries that have significant potential for CCS development but have no legal framework in this respect are “overboard” [
39].
A solution to this problem lies in the development of capacity assessment models not for specific projects and technological chains, but for regions, taking into account the plans for industry development. For example, this aspect is absent from one of the most pertinent articles in this area [
40]. Such models allow technical and economic experience accumulated from the existing projects and specific socio-economic and political situations in the analyzed region to be linked, taking into account the existing infrastructure and production capacity.
In this paper we propose the first iteration of this model for a potential CO2-EOR assessment consisting in the selection of sources and sinks, creation of maps, solution of a transportation problem, and classification of the regions. Federal subjects of the Russian Federation were chosen as the object of the research, due to a lack of scientific papers devoted to the analysis and evaluation of the potential of the local and federal CCS technological chains. Around 24 research papers (18 in Russian-language journals) were published over the last 10 years, more than half of which by the authors of this article. Despite the specificity of the chosen research object, the main elements of the proposed model can be applied to other world regions.
The rest of this paper is organized as follows: in
Section 2, materials and methods are presented, including a methodology of CO
2 capture, transport, and injection costs calculation, and the basics of regional evaluation. The results of the evaluation and a discussion are shown in
Section 3, and conclusions are drawn in
Section 4.
2. Materials and Methods
2.1. CCS Technological Chains
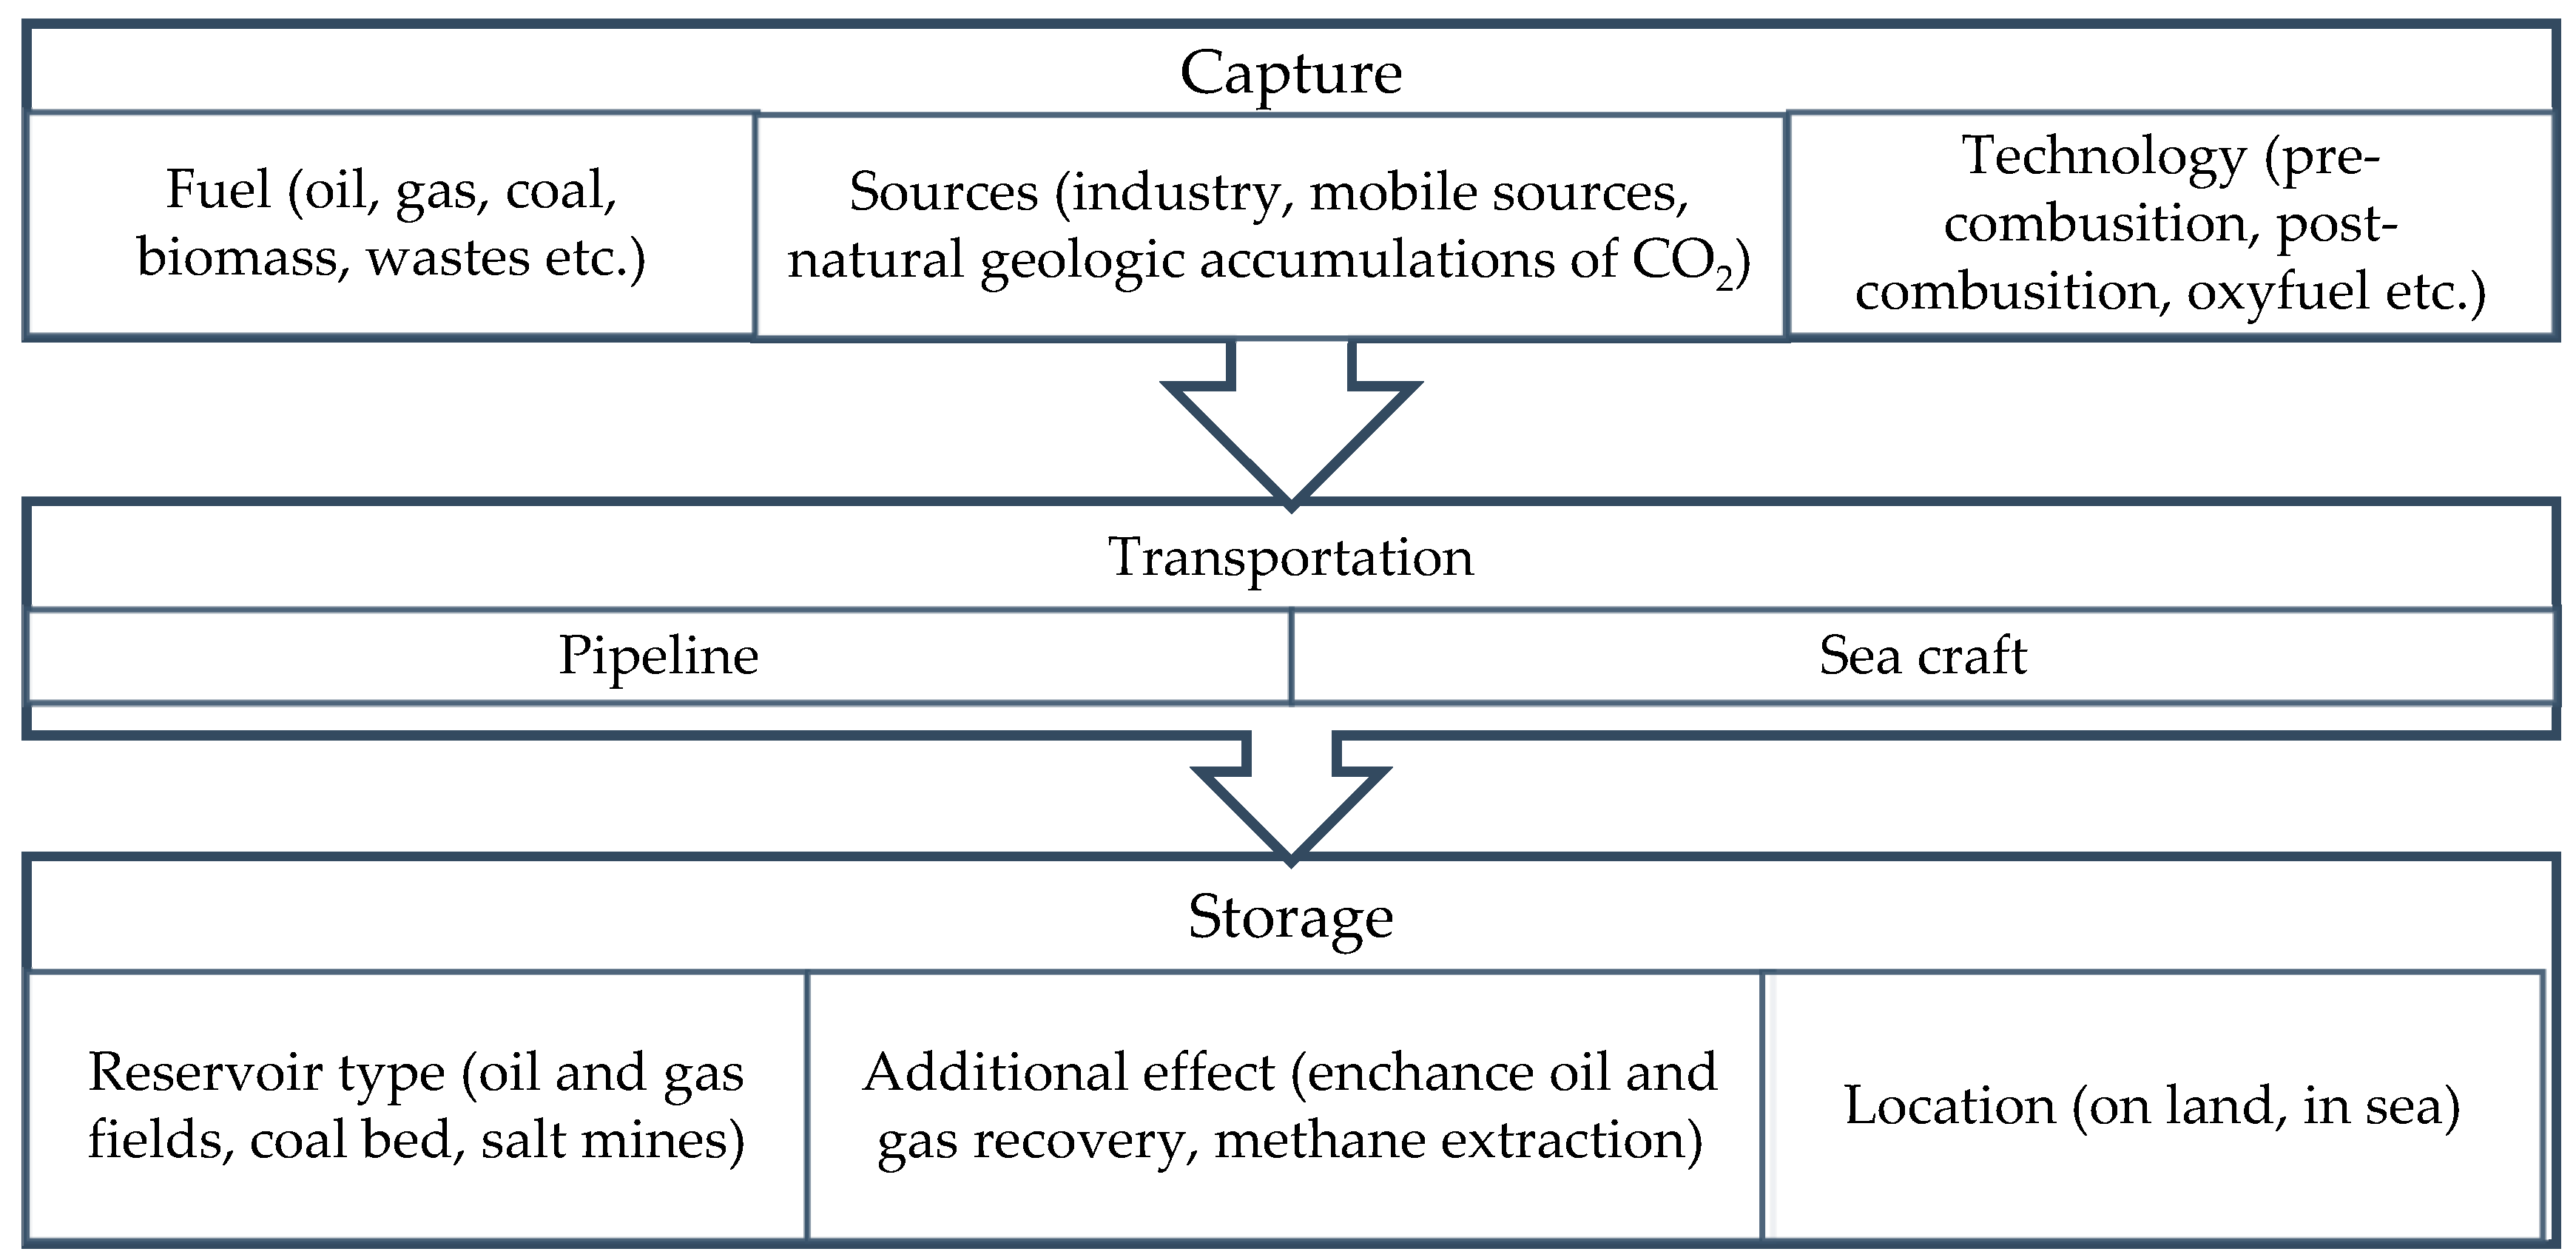
In General, CCS refers to many possible combinations of technologies that develop separately from each other (
Figure 2).
First stage involves capture of CO
2 at one or several possible sources. Most energy-intensive industries, such as energy, cement, oil and gas processing plants, as well as iron and steel plants, which account for about 70% of total CO
2 emissions, could be considered in the assessments of CCS projects [
42]. Natural geological accumulations of CO
2 are extremely rare, only a few large objects in the United States, China, Europe and some other countries have been found (in Russia there are no such objects) [
43]. Therefore, it is not possible to talk about the potential of their large-scale use.
On the one hand, CO2 capture from mobile sources, such as cars, has a number of technical, economic and social problems. On the other hand, the problem of “mobile CO2 emission” can be solved by implementing carbonless technologies, which requires multidirectional system of government support that exists in a number of developed countries (USA, Norway, Japan, etc.). In Russia such projects are unrealizable due to the lack of a well-established citizens’ and government’ understanding of the importance of greenhouse gases reduction.
Theoretically it is possible to transport CO
2 in the cooled state with LNG carriers, which will provide greater flexibility compared to pipeline delivery [
44]. However, in practice, such a scheme is not feasible due to the high capital intensity and the lack of a sufficient number of operating storages that could provide some benefits from supply flexibility.
Three main CO
2 storage options are currently being considered: injection into oil reservoirs for EOR, into saline formations and into coal beds to enhance methane recovery (ECBM). However, the use of saline formations does not allow to obtain any commercial effect from CCS, therefore, these projects can be implemented only with the significant state support, examples of which exist in Norway [
45].
CO
2 injection into coal deposits has great prospects, especially in countries such as the US, China and Russia. However, the storage potential of CO
2 in coal beds is not as large as in salt formations or oil reservoirs, moreover, the CO
2-ECBM technology is still at the pilot projects stage [
46]. For example, some issues related to the behavior of methane and CO
2 at ultra-high pressures are not well studied yet [
47]. These factors are a barrier to the implementation of the ECBM technology chain.
2.2. Basic Principles of the Study
The prospects for extensive CO2 injection into Russian oil-fields are determined on the one hand by potential supply: i.e., the number, output and geographic location of CO2 sources and, on the other hand, by potential demand from depleted oil-fields that are suitable for CO2 injection.
In this article, from a number of technogenic CO2 sources, such as coal chemical, hydrogen production, fertilizer production, power plants, cement plants, spirt production etc., we chose coal- and gas—fired power plants as main sources of CO2. The first reason behind such a decision is a wide network of such energy plants in the vicinity of the main regions of oil extraction. Secondly, the share of these plants in Russia’s total CO2 emissions exceeds 40%. Thirdly, carbon capture is a group of capital-intensive technologies, which could be implemented only in highly-profitable industries, such as energy sector.
Each source of CO
2 (coal- and gas-fired power plants) is characterized by annual emission, calculated using the Integrated Environmental Control Model (IECM), a publicly available and widely used modeling tool developed by the Carnegie Mellon University for the US Department of Energy’s National Energy Technology Laboratory [
48]. Every sink has its individual potential demand during EOR and total storage capacity, assessed using an Interactive electronic map of subsoil resources of Russia [
49] and an industrial database that provides data on the condition of Russian oil-fields.
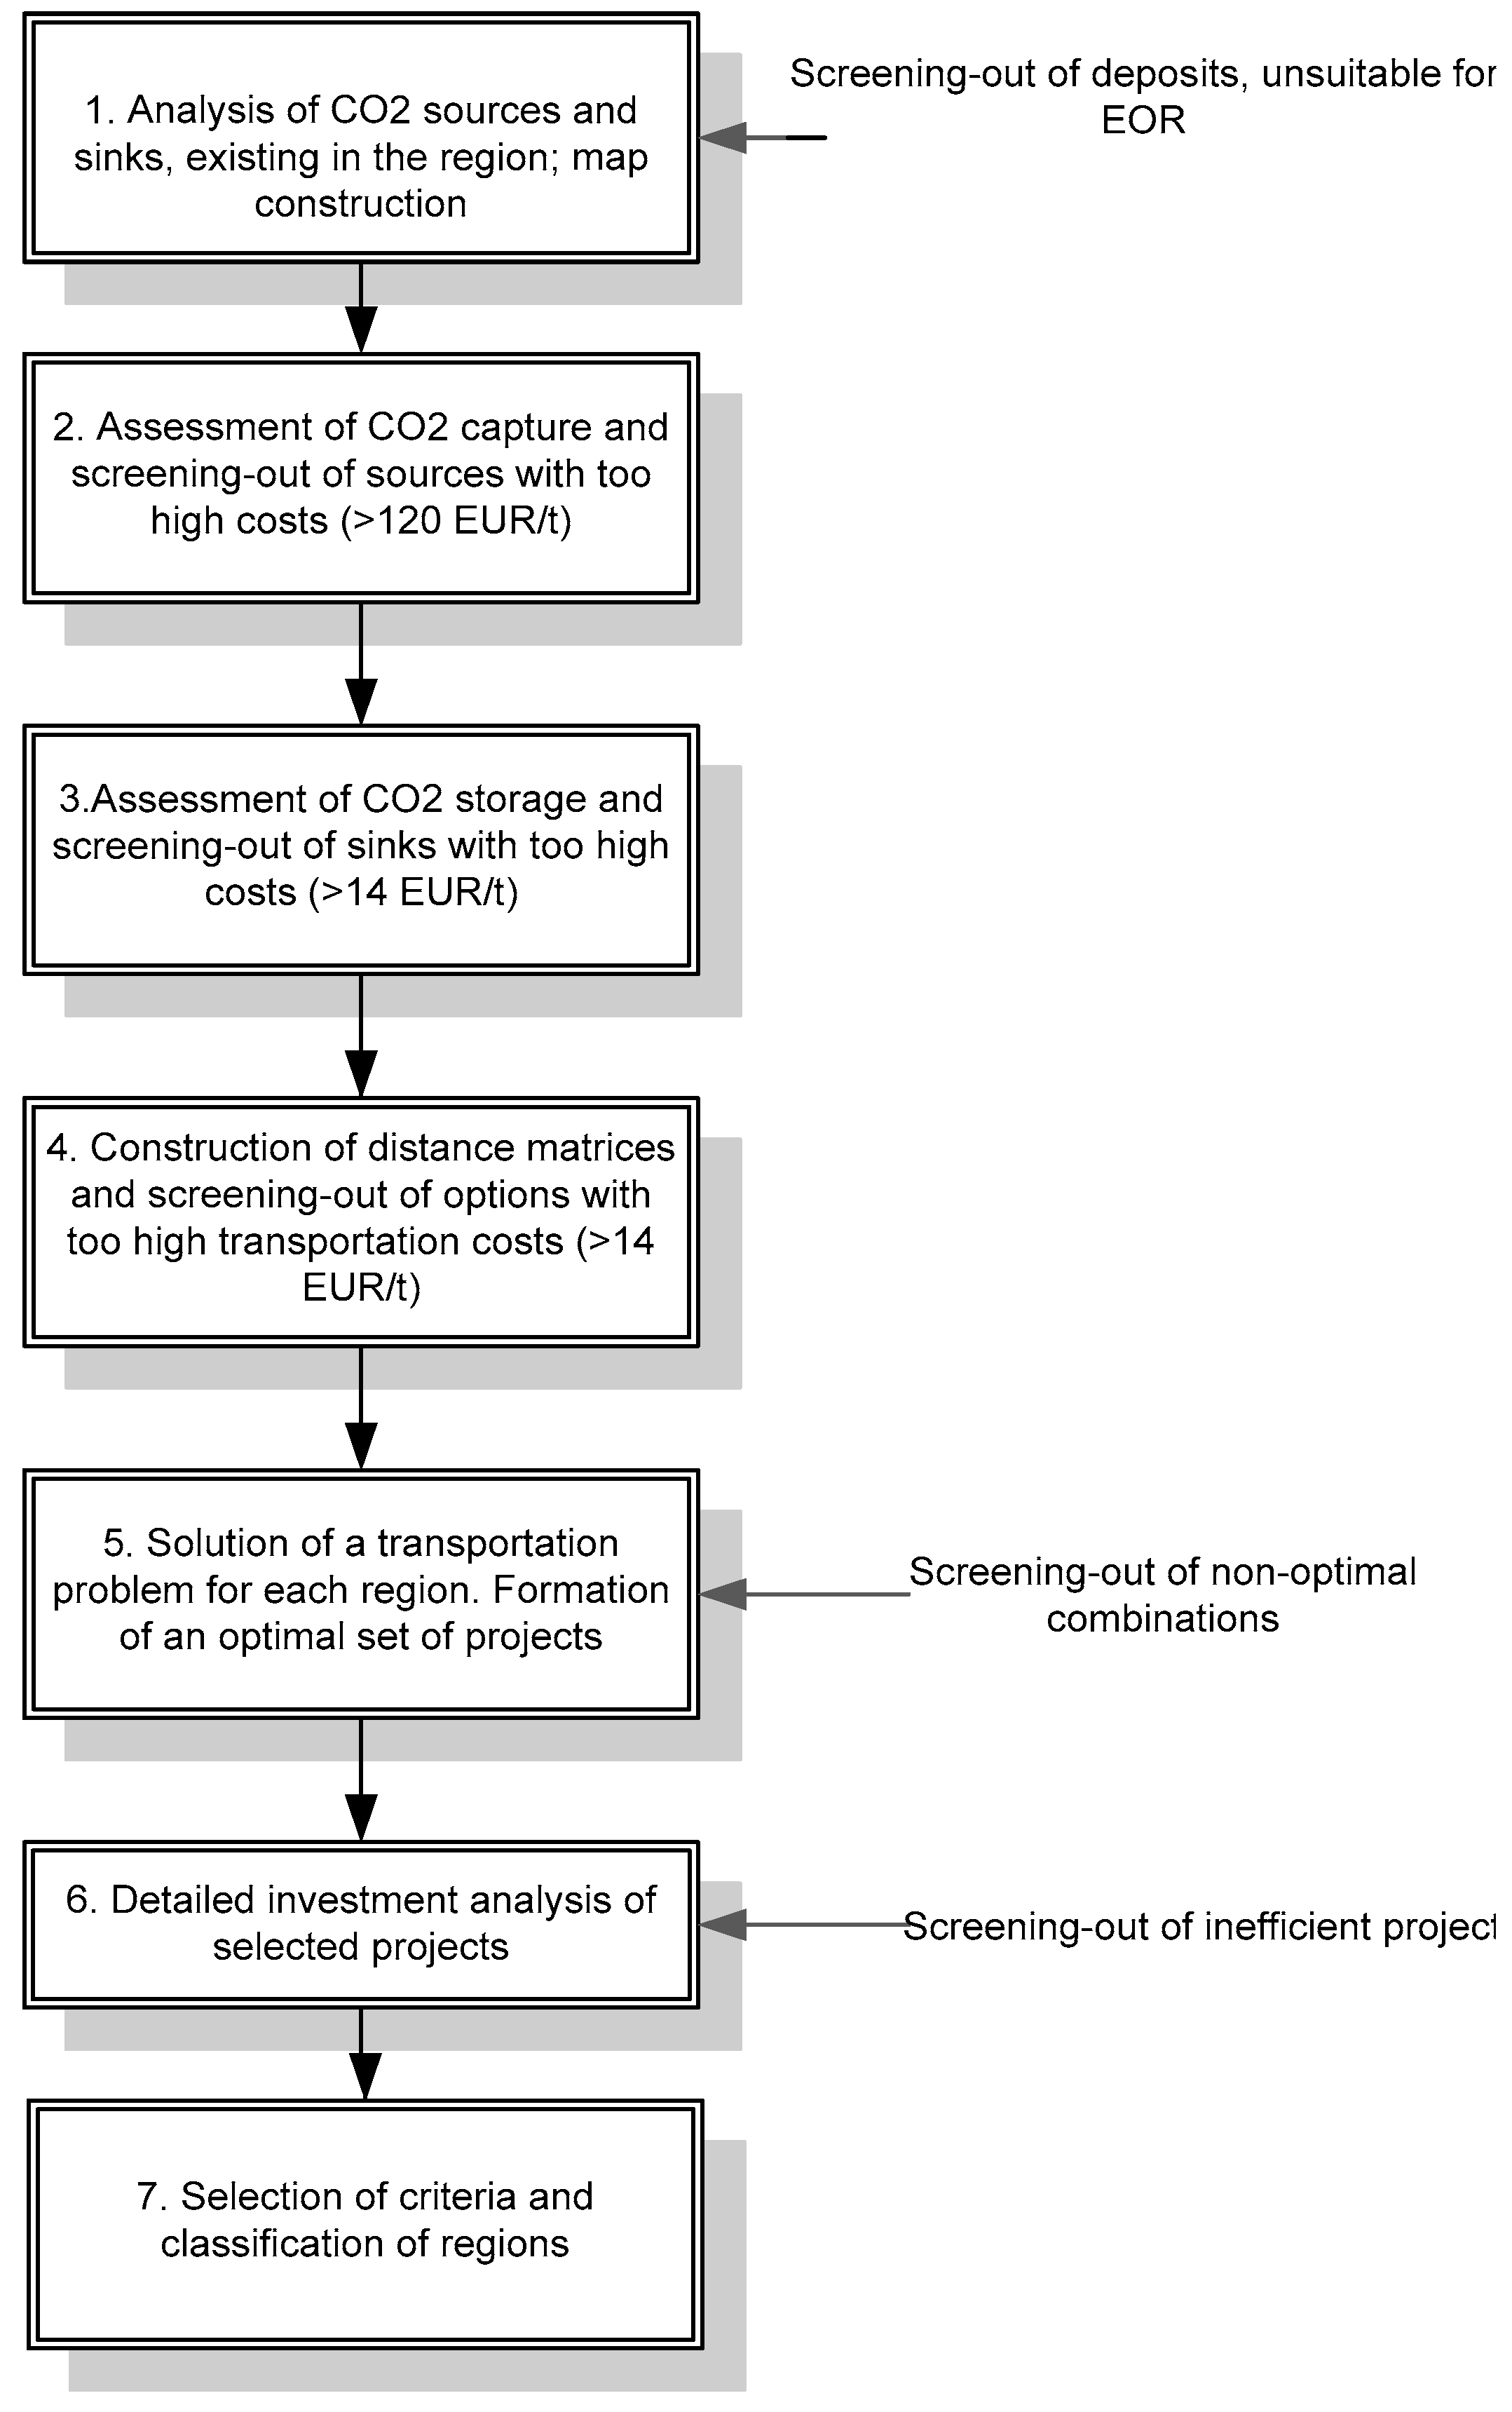
Selection of the most promising CO
2-EOR projects and classification of Russian regions according to their prospects were carried out using the algorithm in
Figure 3. Each stage from 1 to 6 involves selection of the most promising CO
2 sources and sinks. Sources and sinks are rejected for different reasons: unsuitability of the geological characteristics of the reservoir, too high costs of CO
2 capture, transportation and injection issues, economic inefficiency etc.
Finally, after the optimal projects have been selected, criteria are defined to compare the techno-economic potential of the different Russian federal districts and regions classified according to the suitability of their CO
2 sources and sinks for CO
2-EOR projects. Under the term “region” in the paper the authors mean administrative division of Russia is divided into eight federal districts, each of them includes several federal units (republics, oblasts etc.), hereinafter for the sake of simplicity referred to as “regions”. When discussing the results, separate oil-fields are attributed to oil-bearing provinces, which is a geological division.
Table 1 presents the main field-geological parameters that define the choice of oil-fields for CO
2-EOR operations. As input data, we selected 256 CO
2 sources and 322 oil-fields in all federal districts of Russian Federation.
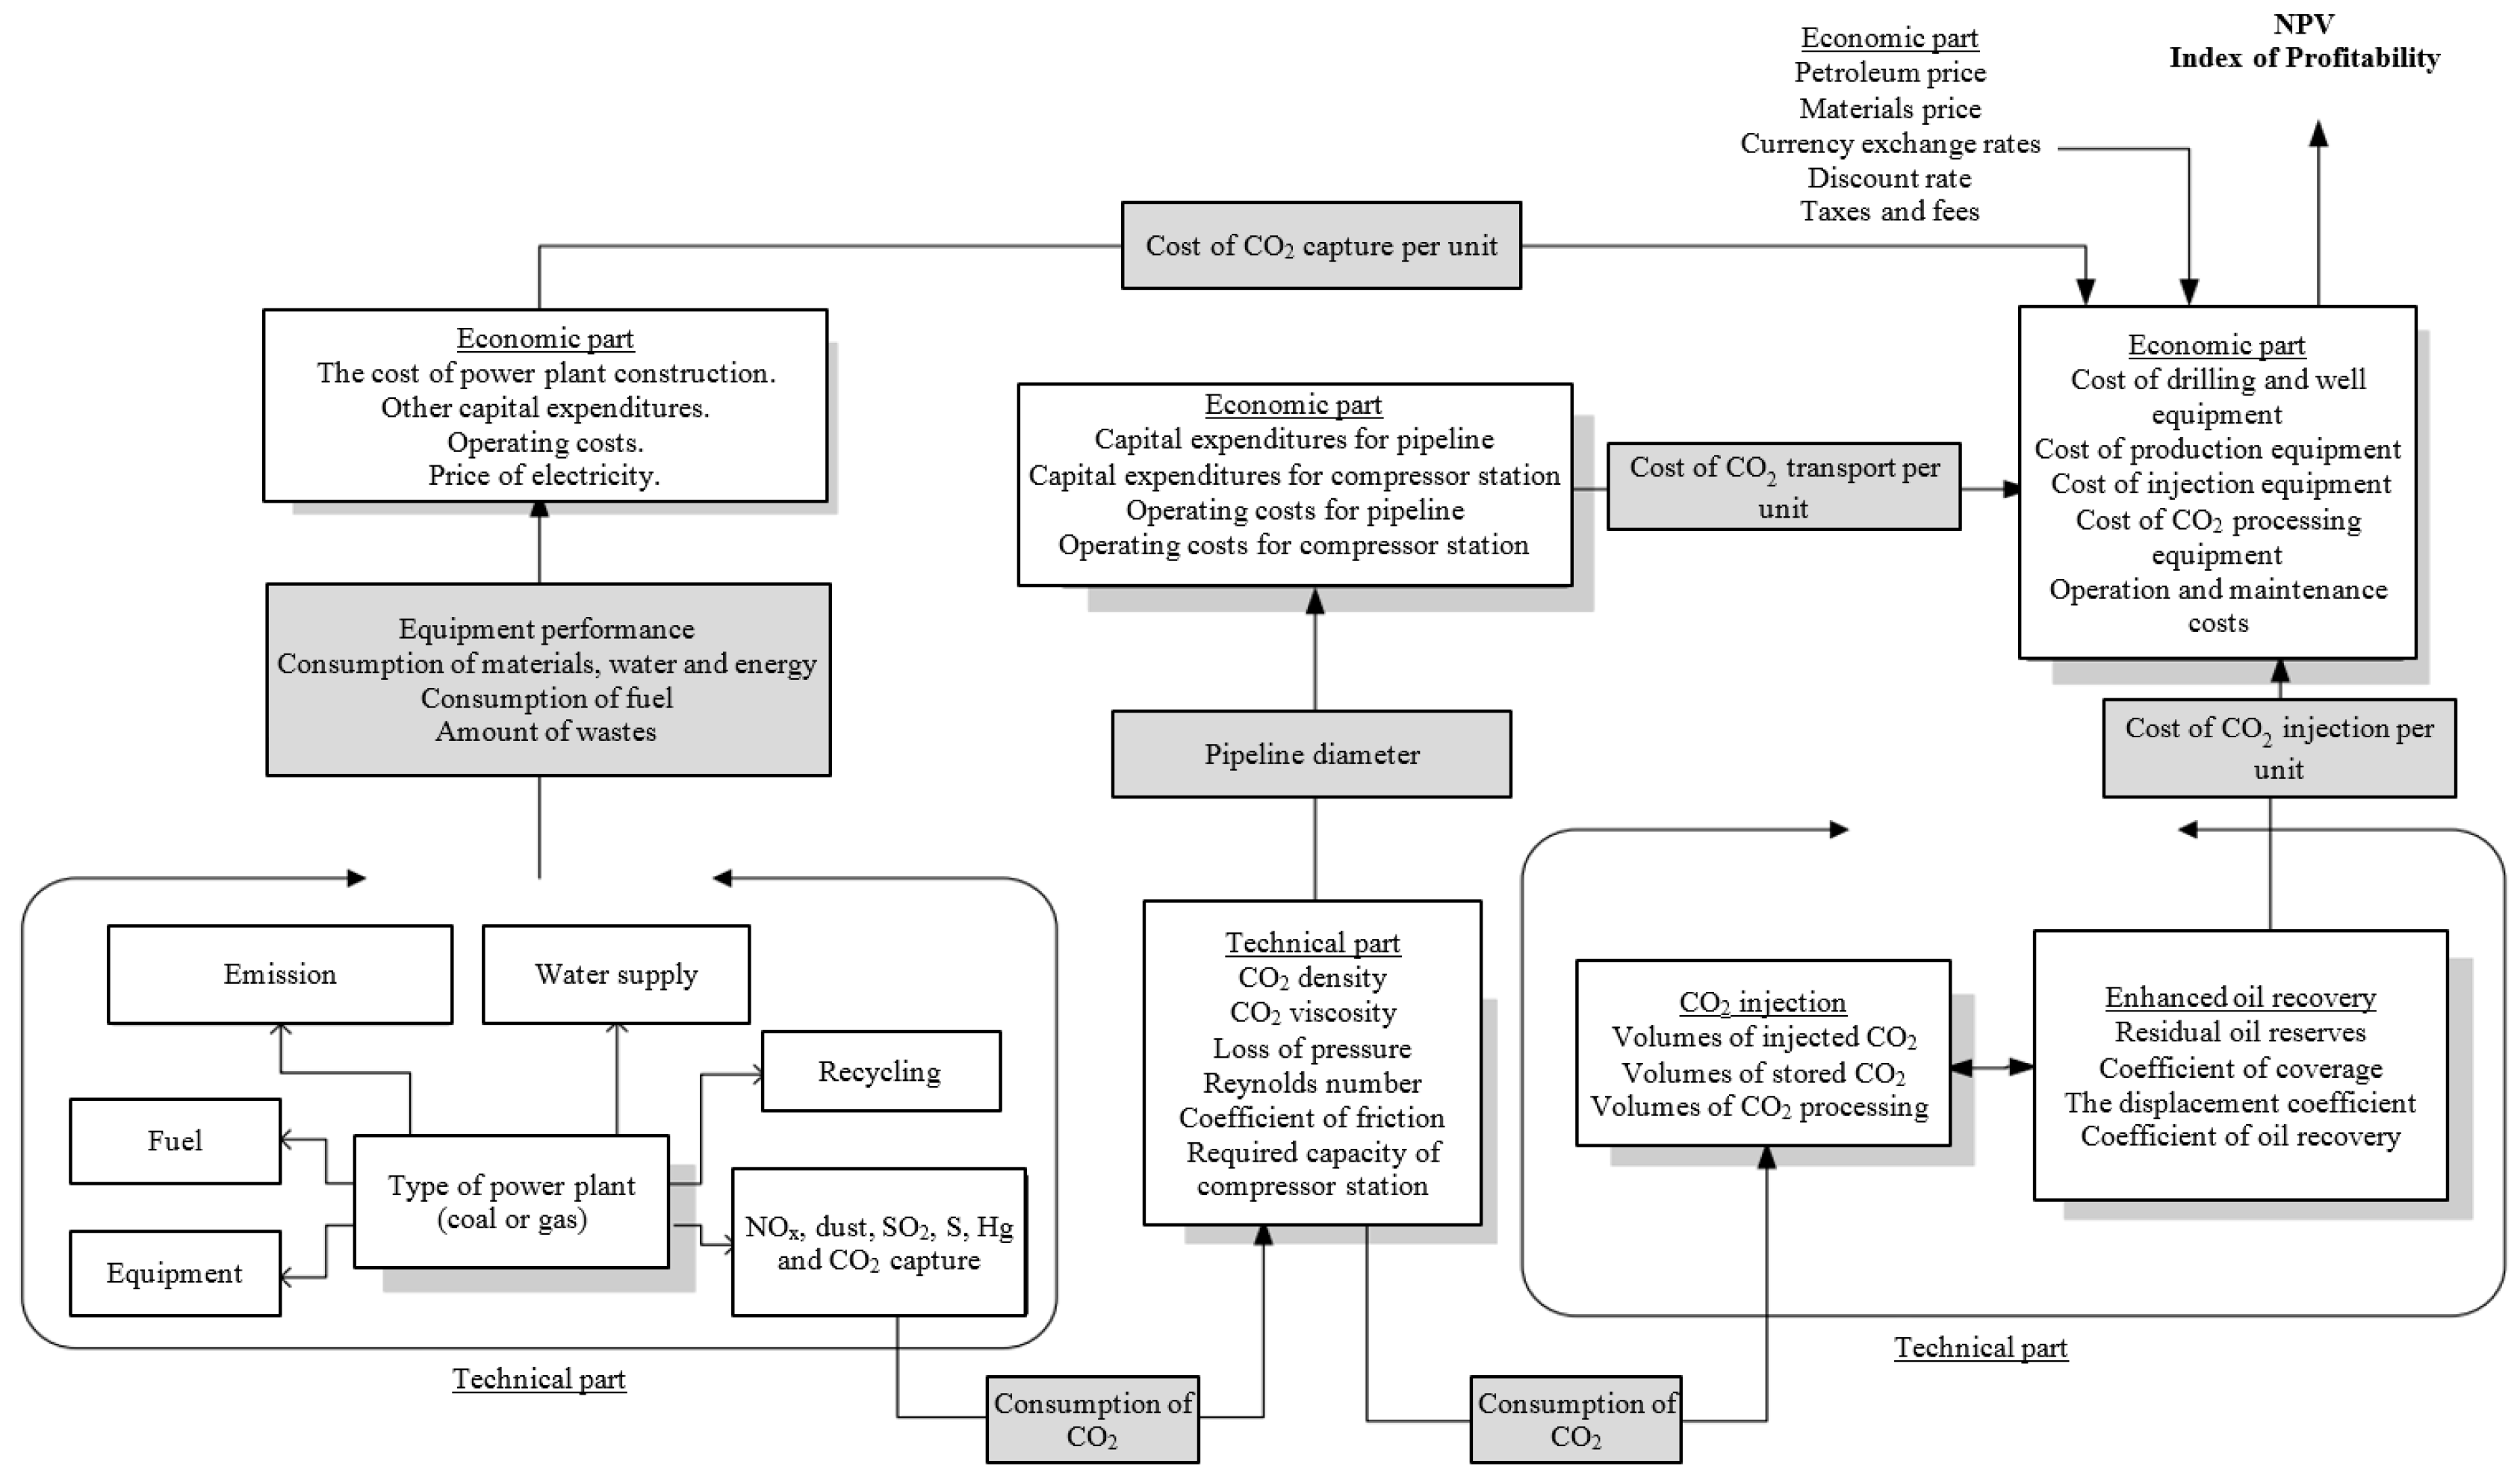
To summarize methodological principles proposed in this article,
Figure 4 shows a technical-economic model, which describes the connection between technical parameters at each stage of technological chain and economic results of projects used in the overall evaluation of a particular region. Further, three main parts of this model (cost of capture, cost of transport and cost of injection) are discussed.
2.3. CO2 Transport
Linear optimization—namely, the unbalanced transportation problem—was chosen as a tool to identify the most promising set of projects. It is a relatively simple method, but it allows for focusing on the cost of CO2 transportation, which is the only major cost unit that remains unaccounted for after the CO2 capture and injection have been assessed during the screening-out phase. The objective function and the constraints of the transportation problem for a region are presented in Formula (1).
The first constraint () indicates that the project works and CO2 is transported from the capture site to its storage site. The constraint indicates that the CO2 capture volume at facility i cannot be greater than the volume of CO2 emitted by this object. Equations and indicate that the technological chain operates without losses. As a rule, losses in such projects are insignificant due to the “closed technological cycle” principles of construction. In addition, losses are difficult to predict. They are tending to occur after a period of time due to an increase in the equipment’s wear. Simplification indicates that the injected volume of CO2 will be sufficient to increase oil recovery at a particular field. In cases where this is incorrect, the oil-field must be divided into separate oil-beds and the value of must be adjusted.
The objective function (Formula (1)) aims to minimize the total cost of transportation in the region, where unit transportation costs are a function of transportation distance and pipeline diameter, described in [
51]. The minimization of the transportation distance alone does not reflect the effect of the economies of scale, and the minimization of unit cost does not include the involvement of all available sources and sinks. The idea is to encompass the whole region to the greatest possible extent and involve the largest number of CO
2 sources and sinks in the resulting set of projects for the subsequent economic efficiency analysis of the CO
2-EOR projects.
where
—amount of CO
2 transported from
ith source to
jth sink;
—amount of CO
2 captured from
ith source;
—amount of CO
2 injected into
jth sink;
—amount of CO
2 emitted by
ith source;
—amount of CO
2 needed for CO
2-EOR at
jth sink;
—unit transportation costs from
ith source to
jth sink;
—distance from
ith source to
jth sink;
—diameter of a pipeline from
ith source to
jth sink.
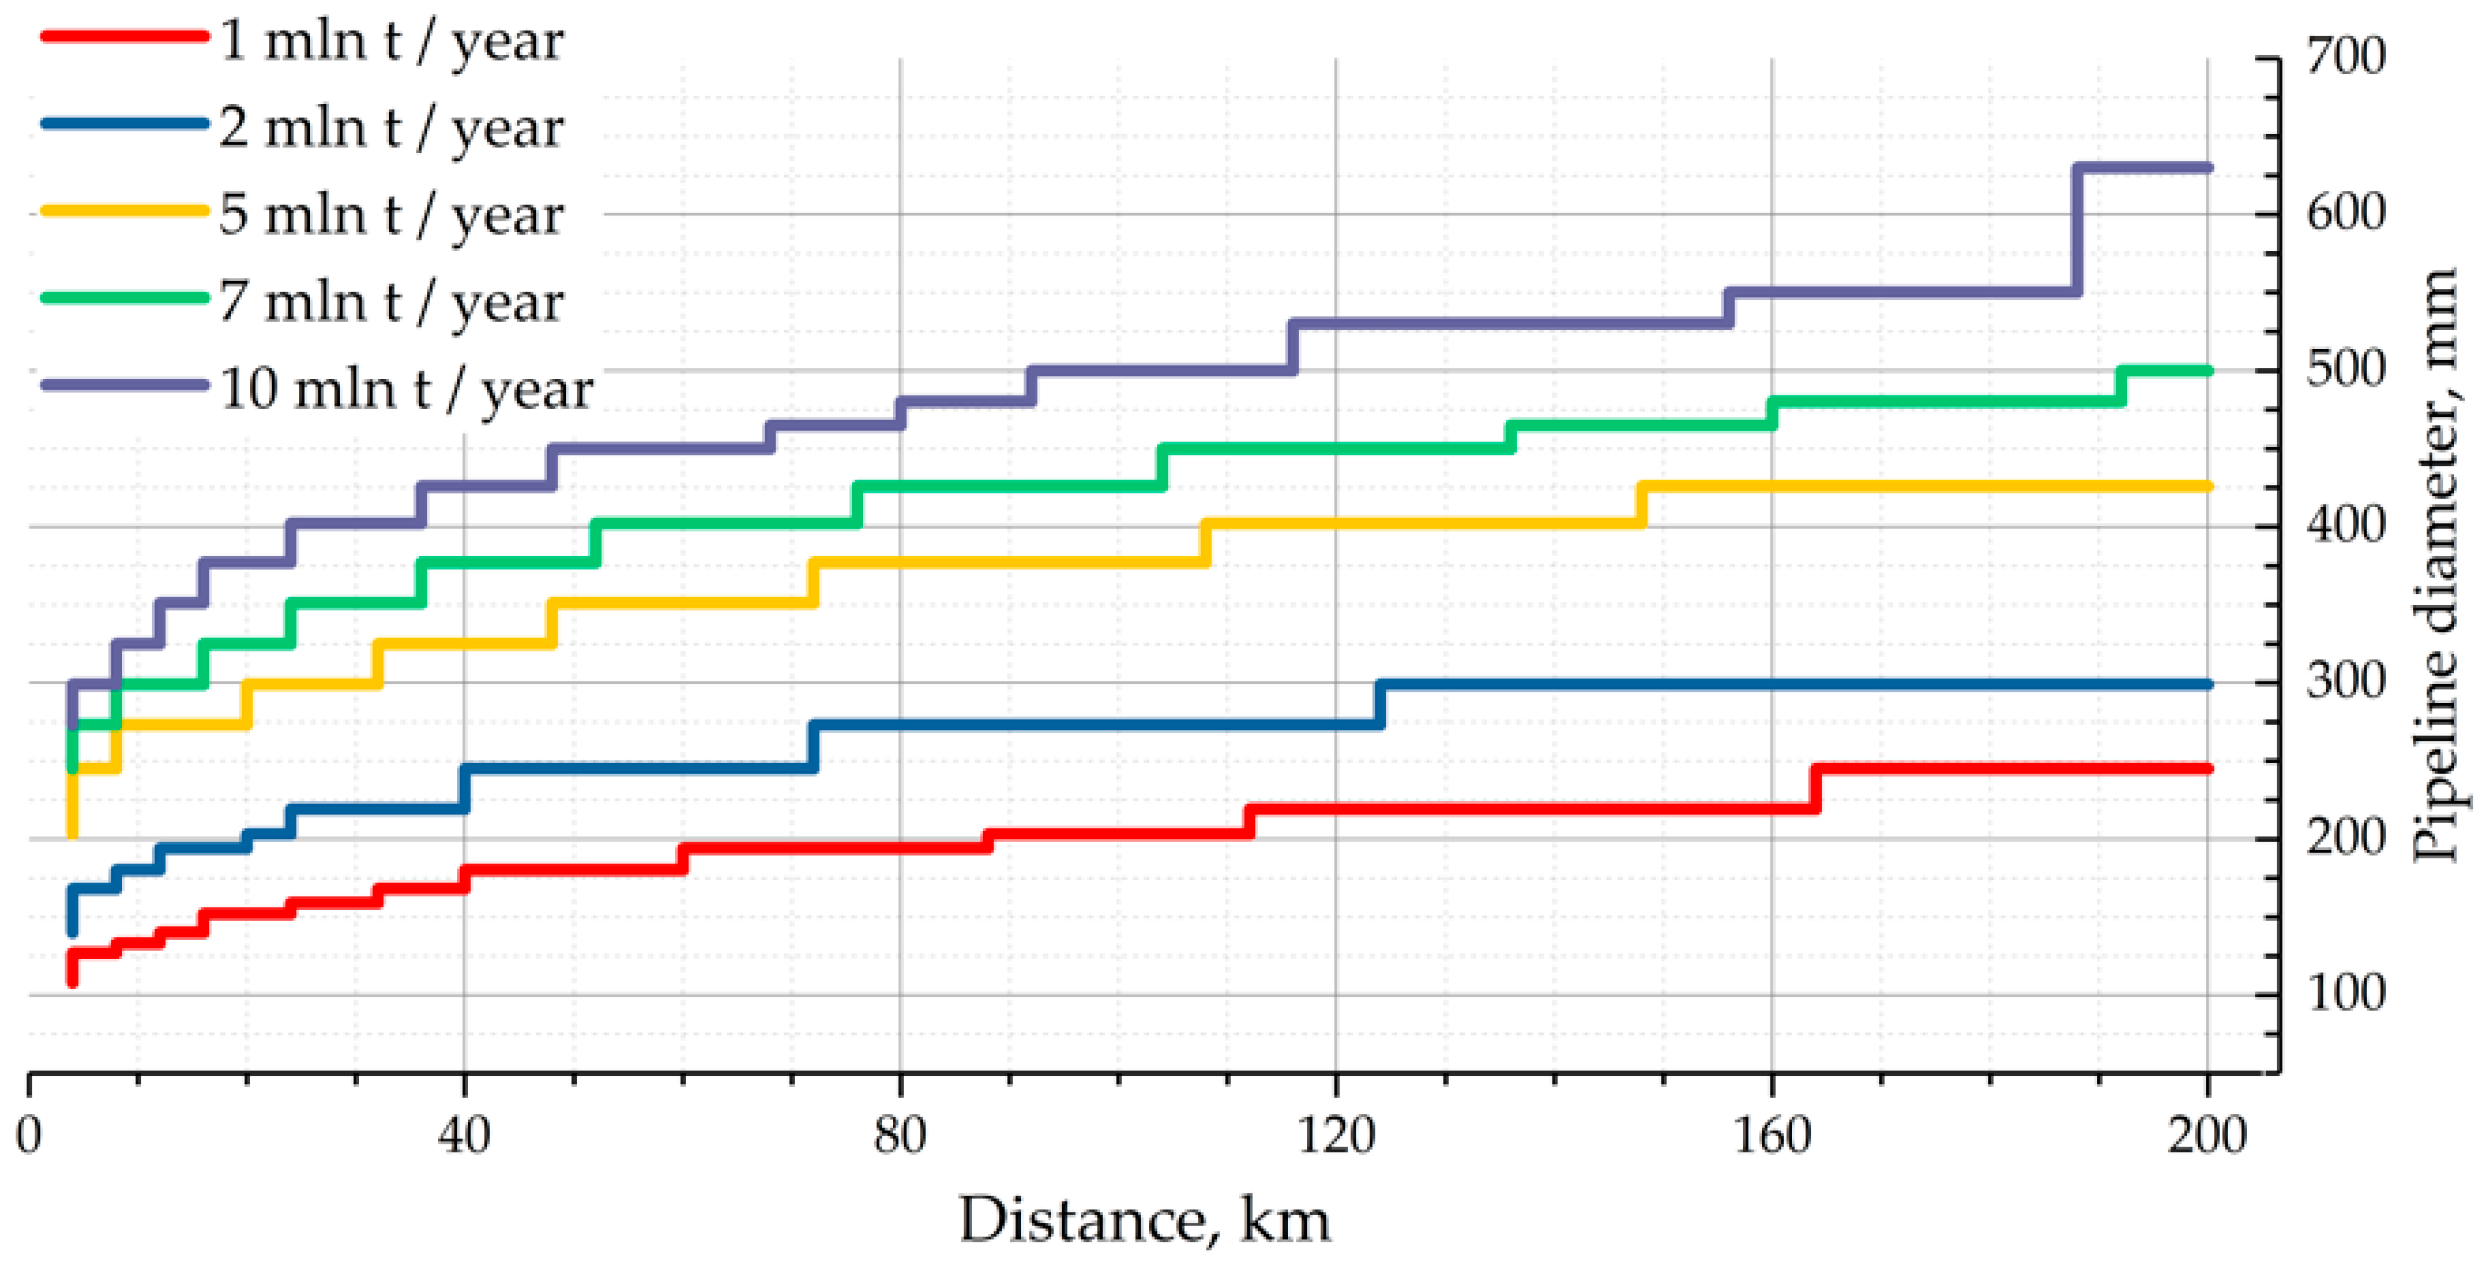
The economics of CO
2 transport largely depend on the piping distance. Other important factors include the pipeline diameter and the CO
2 flow rate. The longer the distance and the larger the amount of CO
2 transported annually, the larger the required diameter—it has to be taken into account, however, that the performance of the system has to be adjusted to a set of standard diameters, which, according to our calculations, makes the relationship stepped rather than linear (
Figure 5).
Cost assessment for CO
2 transport (
) was carried out on the basis of the compression costs [
52] and the costs of pipeline construction [
53] adjusted to 2015 prices. The analysis of statistical data from the aforementioned sources allowed us to derive the following equations:
- for
L < 100 km,
Q < 1 Mt:
- for
L > 100 km,
Q < 1 Mt or
L < 100 km,
Q > 1 Mt:
- for
L > 100 km,
Q > 1 Mt:
where
L—pipeline distance, km;
—amount of CO
2 transported through the pipeline, Mt.
In general, transport costs per ton of CO
2 range from 0.15 to 8.6 USD/t and clearly demonstrate the economies of scale: the more CO
2 is transported, the lower the transportation costs. However, capacity utilization is an important issue here: if a 414-mm pipeline, designed to transport 5–7 Mt/year, is working only at 20% capacity, the economic efficiency of such project raises doubts [
51].
2.4. CO2 Capture
The cost assessment is based on post-combustion amine capture technology, which is the most mature and relatively easy to implement in an already operating plant. The costs of construction and maintenance were obtained from the Integrated Environmental Control Model [
54]. The main technological characteristic of a CO
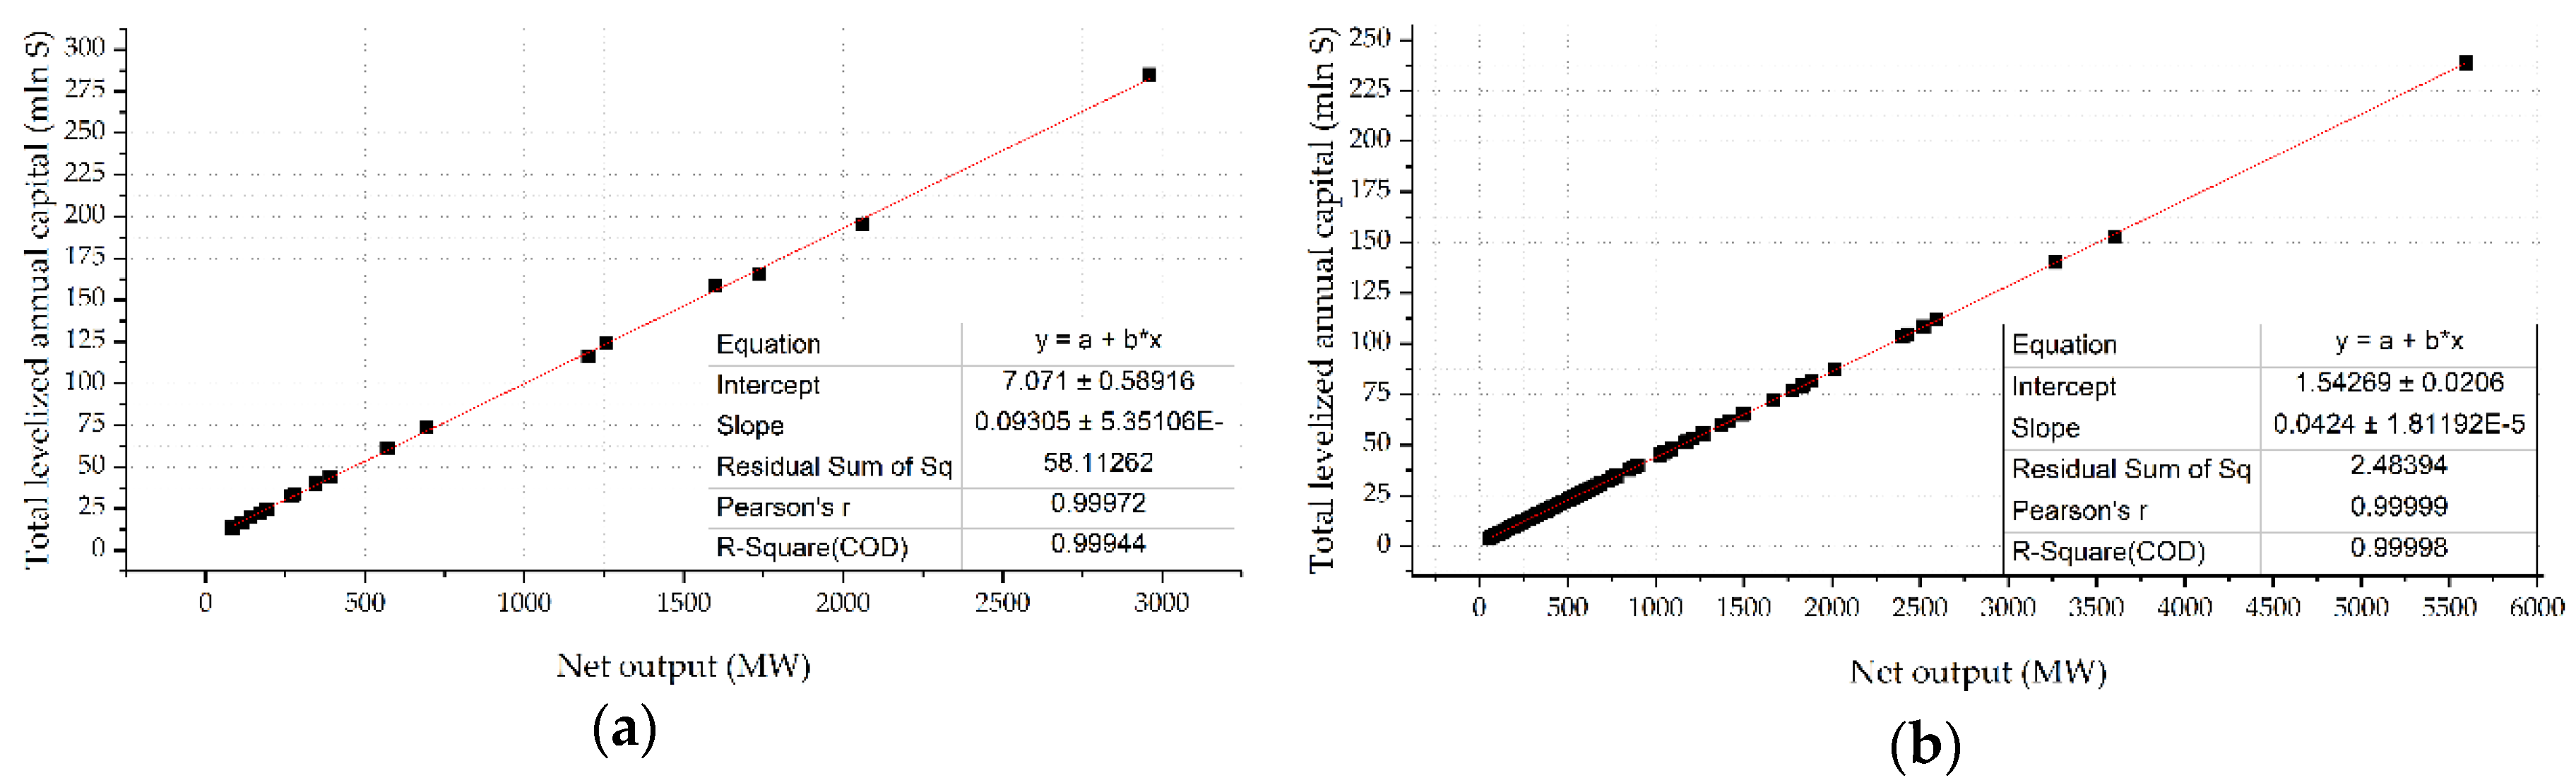
2 source (coal and gas power plants) that has to be taken into account while assessing the cost of capture is its net output.
Figure 6 demonstrates the relationship between total leveled annual capital and net output of the coal (a) and gas (b) plants [
51].
In analytical form, discounted capture costs per ton of CO2 can be presented in the following way:
- for gas-fired power plant:
where 𝑁—net output of the power plant, MW;
—amount of CO
2 emitted by the source during the discount period, Mt.
2.5. CO2 Injection
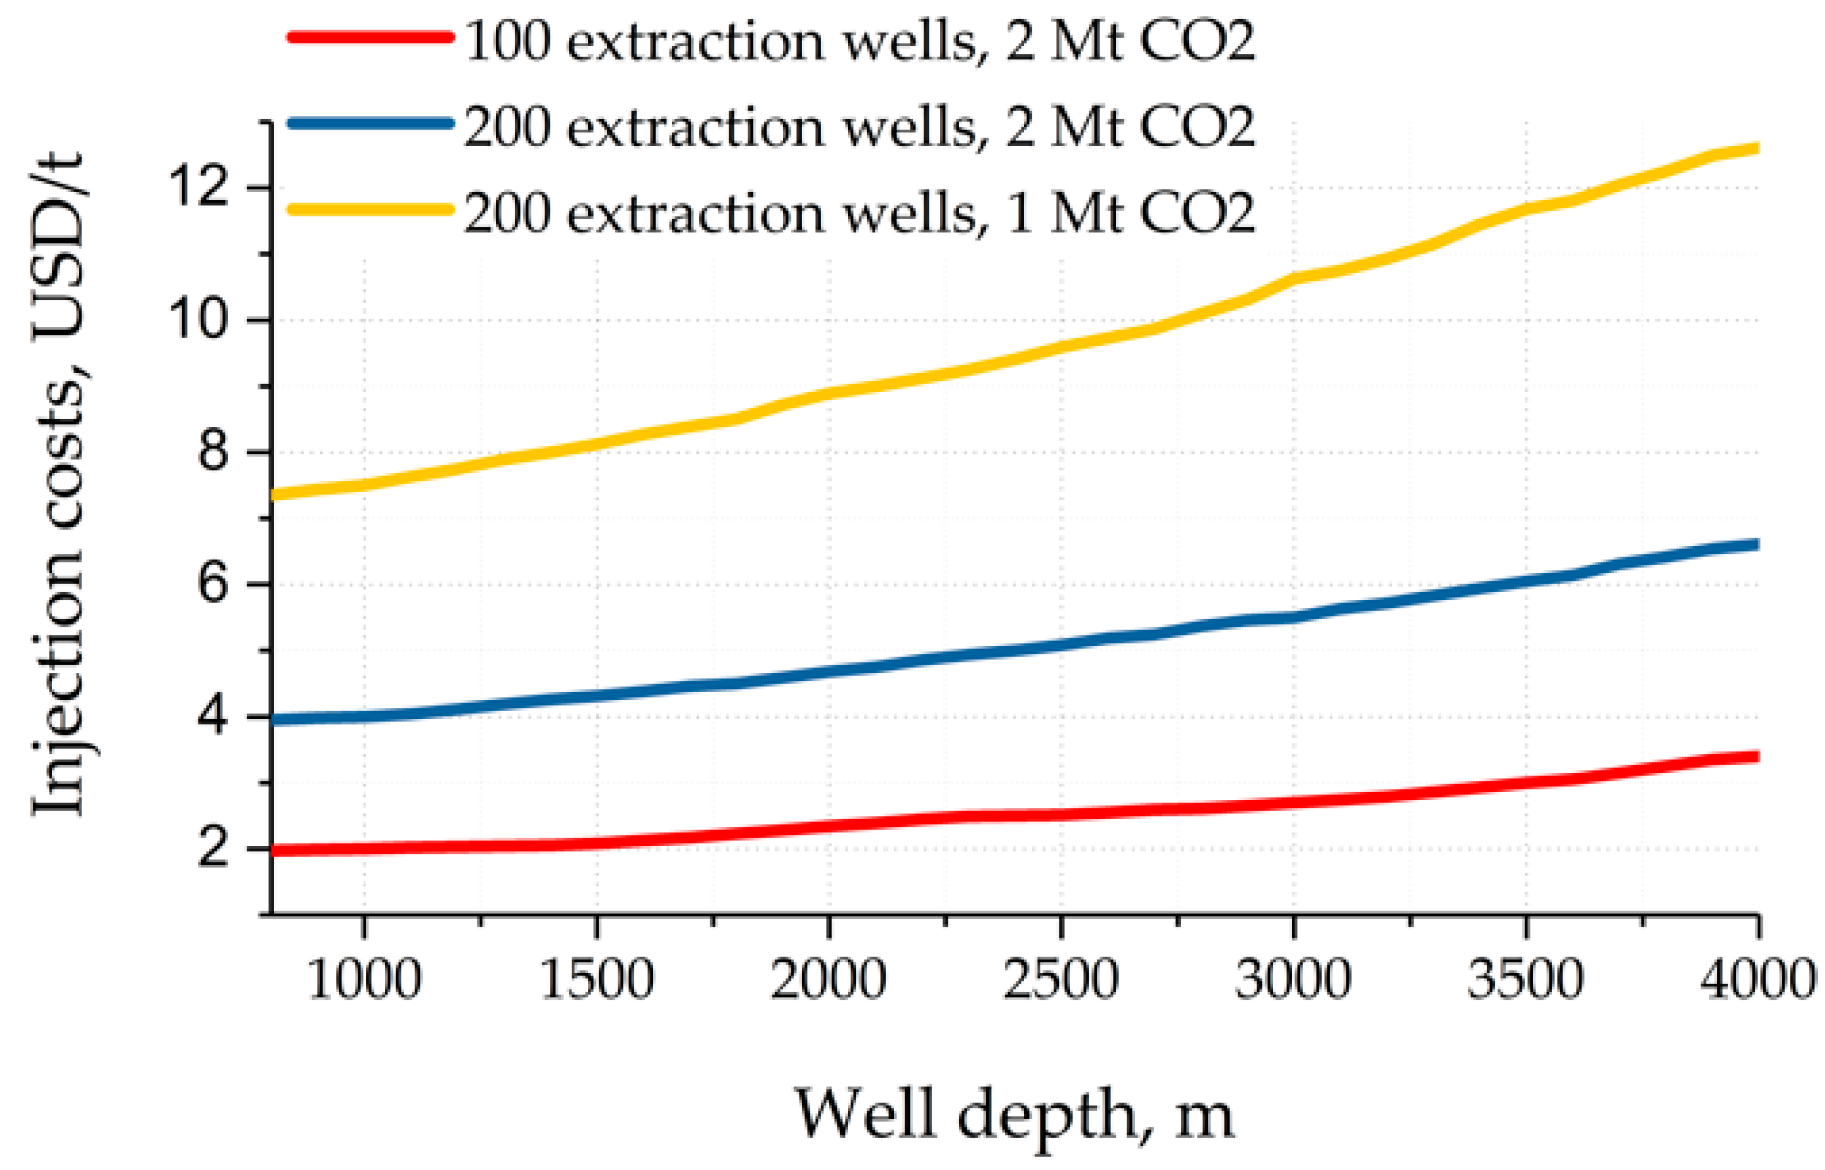
Estimates of injection costs are based on empirical data from US oil-fields [
55] adjusted to 2015 prices. The economics of CO
2 storage depend mainly on three parameters—well depth, number of wells (can be calculated as a function of oil productive area), and annual CO
2 injection rate.
Figure 7 demonstrates the effect of these factors on the specific costs of injection. As the depth increases, the costs grow exponentially, whereas the dependence on the number of wells is linear [
51].
The costs of monitoring also have to be taken into account at this stage. Analysts estimate them in the range of 0.1–0.28 €/t [
56], which accounts only for a minor share in the overall costs of CO
2 injection and storage (1–2%). The discounted injection costs can be calculated as follows:
where
—oil productive area, thousand m
2;
d—well depth, m;
—amount of CO
2 injected into the reservoir during the discount period, Mt.
It must be noted that, if a project involves the injection of CO
2 from various power plants, the costs of the total injected amount, as a sum of individual amounts, is computed as a sum of the costs of each amount according to
Figure 7. In any case,
should not exceed the maximum possible amount of CO
2 to be injected and must be sufficient to facilitate EOR at one or more oil beds of the field.
2.6. Regional Evaluation
The problem of transportation was solved through the least-cost assignment with a subsequent optimization through a simplex method. For each federal district, the transportation problem was formulated separately. The power plants of Central FD, having no CO2 sinks, were assessed as potential sources for sinks of the Volga, Southern and North-Caucasian FDs.
From the viewpoint of organizational difficulty, CO
2-EOR projects have at least two involved parties: the CO
2 emitter and the oil-field operator. For the sake of simplicity, it is assumed that all the costs, including CO
2 capture and transportation, are borne by the oil company, who is the main beneficiary; the power plant, in exchange for the operator’s investments, is obliged to provide all captured CO
2 free of charge [
51].
The construction and preparation period is estimated at three years, and starting from the fourth year the company receives profit from the CO
2-EOR operations. Calculations were conducted for a period of 22 years after the first extraction of additional oil, as this is the average lifespan of such projects in the literature [
57,
58]. The discount rate was set at a standard level of 10%.
Based on the data on potential CO2-EOR projects, calculated earlier, two properties of the Russian regions can be evaluated: potential of their power plants to serve as CO2 sources, potential of their oil-fields to serve as CO2 sinks.
In the former case, the following criteria were used in the evaluation: number of power plants, total amount of CO2 emissions, average distance between the region’s CO2 sources and nearest sinks, number of projects in the optimal set, number of economically efficient projects, and average CO2 capture and transportation costs.
For each of the above-mentioned criteria, an interval scale (
Table 2) was developed according to which points were assigned to the regions. The points were added up, and the total value served as the foundation for drawing conclusions on the potential of power plants of the region as sources in CO
2-EOR projects.
Depending on the total sum of points (according to column 1,
Table 2)—Σp, the regions were divided into five classes:
Very high prospects (Σp > 2.8): developed industrial regions with high CO2 emissions and relatively low transportation costs; at least five economically efficient CO2-EOR projects.
Good prospects (2.8 ≤ Σp < 1.9): developed industrial regions with high CO2 emissions, relatively close to oil-bearing provinces; presence of economically efficient CO2-EOR projects.
Limited prospects (1.9 ≤ Σp < 1.2): there is one economically efficient CO2-EOR project and/or several inefficient projects in the optimal set.
Currently not promising (1.2 ≤ Σp < 0.6): regions with large CO2 sources, located at a significant distance from oil-bearing provinces, or regions with medium and small CO2 sources; there are projects in the optimal set but none of them is economically efficient.
Not promising (Σp ≤ 0.6): as a rule, regions with small CO2 sources located far from oil-fields.
The following criteria were used to rank regions by their CO
2 sink potential: number of oil-fields, annual CO
2 demand for EOR purposes, average distance to nearest CO
2 sources, number of projects in the optimal set, number of economically efficient projects, and average transportation and injection costs (
Table 3). According to these criteria, oil-bearing regions were divided into four groups (Σp—sum of points from column 1,
Table 3):
Very high prospects (Σp > 2.4): regions with significant demand for CO2 (more than 30 Mt/year) and relatively low transportation and injection costs; at least eight economically efficient CO2-EOR projects.
Good prospects (2.4 ≤ Σp < 1.9): regions with medium and small oil-fields and relatively low transportation and injection costs; several economically efficient CO2-EOR projects.
Limited prospects (1.9 ≤ Σp < 1.5): there is at least one economically efficient CO2-EOR project and/or several inefficient projects in the optimal set.
Not promising (Σp ≤ 1.5): regions where oil-fields are not included in the optimal set or are not economically efficient; as a rule, regions with small oil-fields with no close CO2 sources.
3. Results and Discussion
A regional analysis of the relative positions of CO2 sources and sinks leads to the following results:
1. The Northwestern Federal District is characterized by significant distances between large power plants (North-Western part—Leningrad, Vologda, Kaliningrad provinces) and oil-fields (Northern part—Komi Republic and Nenets Autonomous Area).
Deposits in the Timan-Pechora oil-bearing province have difficult geographic and economic conditions, a large share of hard-to-recover oil, and weak transport infrastructure. The most developed area is in the south (Komi Republic), while the Nenets oil-fields are only at the initial stages of development.
The Kaliningrad province has numerous small oil-fields with a high level of depletion, but their cumulative storage potential is quite small. Due to the limited implementation scale, significant economic profits cannot be expected in the region, but the oil-fields of the province can serve as a good option for small-scale pilot projects demonstrating the safety and technological maturity of CO2-EOR.
2. The Central Federal District does not have its own oil deposits; however, it is characterized by significant emissions of anthropogenic CO2. The transportation of CO2 captured from large power plants to the oil-fields of the Volga Federal District may be economically feasible.
3. The Volga Federal District is the oldest oil-producing region of the country; its deposits have been under exploitation since the 1940s. Consequently, the area has large CO2 storage potential in its depleted oil-fields.
From the viewpoint of EOR, the most promising are the Orenburg, Tatarstan, and Perm Regions. CO2 storage potential is greatest in Tatarstan, Bashkortostan and the Samara oblast (more than 80% of total storage potential of the federal district).
In Tatarstan and the oblasts of Orenburg and Samara, from 50 to 76% of the extracted oil is classified as light (with density below 870 kg/m
3), which is very favorable for CO
2-EOR [
59].
The attractiveness of the Volga Federal District as a location for implementation of CO2-EOR technologies is increased by the fact that its oil-fields are situated relatively close (15–30 km) to large industrial cities such as Ufa, Kazan, Samara, Izhevsk, and Perm.
4. The total storage potential of the Southern Federal District and the North-Caucasian Federal District is quite high, but it comprises numerous small deposits. For each separate case the unit growth in oil production is rather moderate, whereas the costs of construction and equipment are high. Therefore, the prospects of the regions are considered limited; most oil-fields in these areas are better suited for demonstration projects rather than full-scale commercial operations.
5. Currently, the oil-bearing province of West Siberia is the largest region of hydrocarbon extraction in Russia. The region accounts for 64% of extracted oil and 91% of natural gas. In this paper, the estimations of the CO2-EOR potential of the Ural Federal District have been limited to the Yamal-Nenets Autonomous Area only. Oil-fields of West Siberia have significant CO2 storage potential. A distinctive feature is the size of the individual fields, which means that profits from CO2 injection can be obtained through economies of scale.
The main problem of the Ural Federal District is the great average distance between CO2 sources and oil deposits. The major share of emissions is attributed to the Chelyabinsk and Sverdlovsk provinces, while the biggest storage potential is found in the Yamal-Nenets and Khanti-Mansi Autonomous Areas.
6. The oil-bearing province of East Siberia is a relatively new region for oil extraction. Currently, it is more of a promising reserve for the Russian oil industry than a platform for the development of EOR techniques. The region is situated far from industrial centers, lacks the necessary infrastructure, and is characterized by a low density of population and severe weather conditions, which complicates its industrial development. The greatest storage potential is found in the Tomsk province; however, the sinks are situated very far from the power plants (more than 500 km), which is very typical for the region as a whole.
7. Similar to the Siberian Federal District, most oil-fields of the Far Eastern Federal District are currently at initial stages of development and have very modest cumulative oil production, therefore the values of total CO2 storage are almost equal to those of potential storage during EOR.
One more negative feature is that most power plants of the region are situated far from the oil-fields, which makes CO
2-EOR projects economically inefficient due to the enormous transportation costs. The most promising region is Sakhalin province, where the transportation distances are significantly lower (below 300 km), and CO
2 supply and demand are evenly balanced. Separate estimations for the federal districts of Russia are presented in
Table 4.
Thus, total CO
2 emissions from the energy sector amount to 607 Mt/year; annual demand for CO
2 from the oil industry is no less than 553 Mt; CO
2 storage potential during EOR operations and after their completion is 1700 Mt, and 7400 Mt respectively [
51]. However, storage potential is a rough estimation, because there is a difference between theoretical, effective, and actual storage capacities [
60,
61,
62].
The former usually includes many options that are either technologically impossible or economically inefficient, and special measures have to be taken to screen them out. For example, in the algorithm in
Figure 3, power plants with too high capture costs (Stage 2), oil-fields with too high injection costs (Stage 3) and too distant facilities (Stage 4) are screened out of further considerations. The transportation problem is then formulated and solved on the basis of annual emissions from each remaining CO
2 source, potential storage capacity of the remaining sinks, and the distance between the sources and sinks.
All in all, 183 projects were selected as promising from the CO
2-EOR perspective. An overview of these projects is also presented in
Table 4. Half of the promising projects are found in Volga and the Central Federal Districts, which have high CO
2 emissions, and relatively small distances between industrial centers and depleted oil-fields. Oil recovery efficiency increases by 4–20% depending on the project, but the average values remain between 11% and 13%; notably, the value is quite similar in all regions.
Table 5 presents economic analysis of selected projects, grouped by regions. Average profits, costs and payback period were calculated only for economically efficient projects. Based on the selected projects, conclusions can be drawn about the optimal cost structure of the CO
2-EOR projects: capture costs must cover approximately 62% of the total costs, 16% of transportation costs, and for 22% injection costs. An analysis of inefficient combinations shows that one of the most frequent reasons of economic infeasibility is the unreasonably high transportation or injection cost (due to the huge distance, unfavorable geological conditions of the reservoir, large productive area, and deep oil bed position etc.). For optimal structure, both these cost units should not exceed the capture costs.
Despite the significant number of efficient projects, the average Internal Rate of Return is relatively low. The calculation in
Table 5 was used as the discount rate equal to 10%. With its increasing by 5% the number of efficient projects will decrease by 19.2% (
Figure 8). However, decreasing the discount rate by 5% gives only a 12% increase in the number of projects. This situation shows the relevance of governmental support of such strategic initiatives.
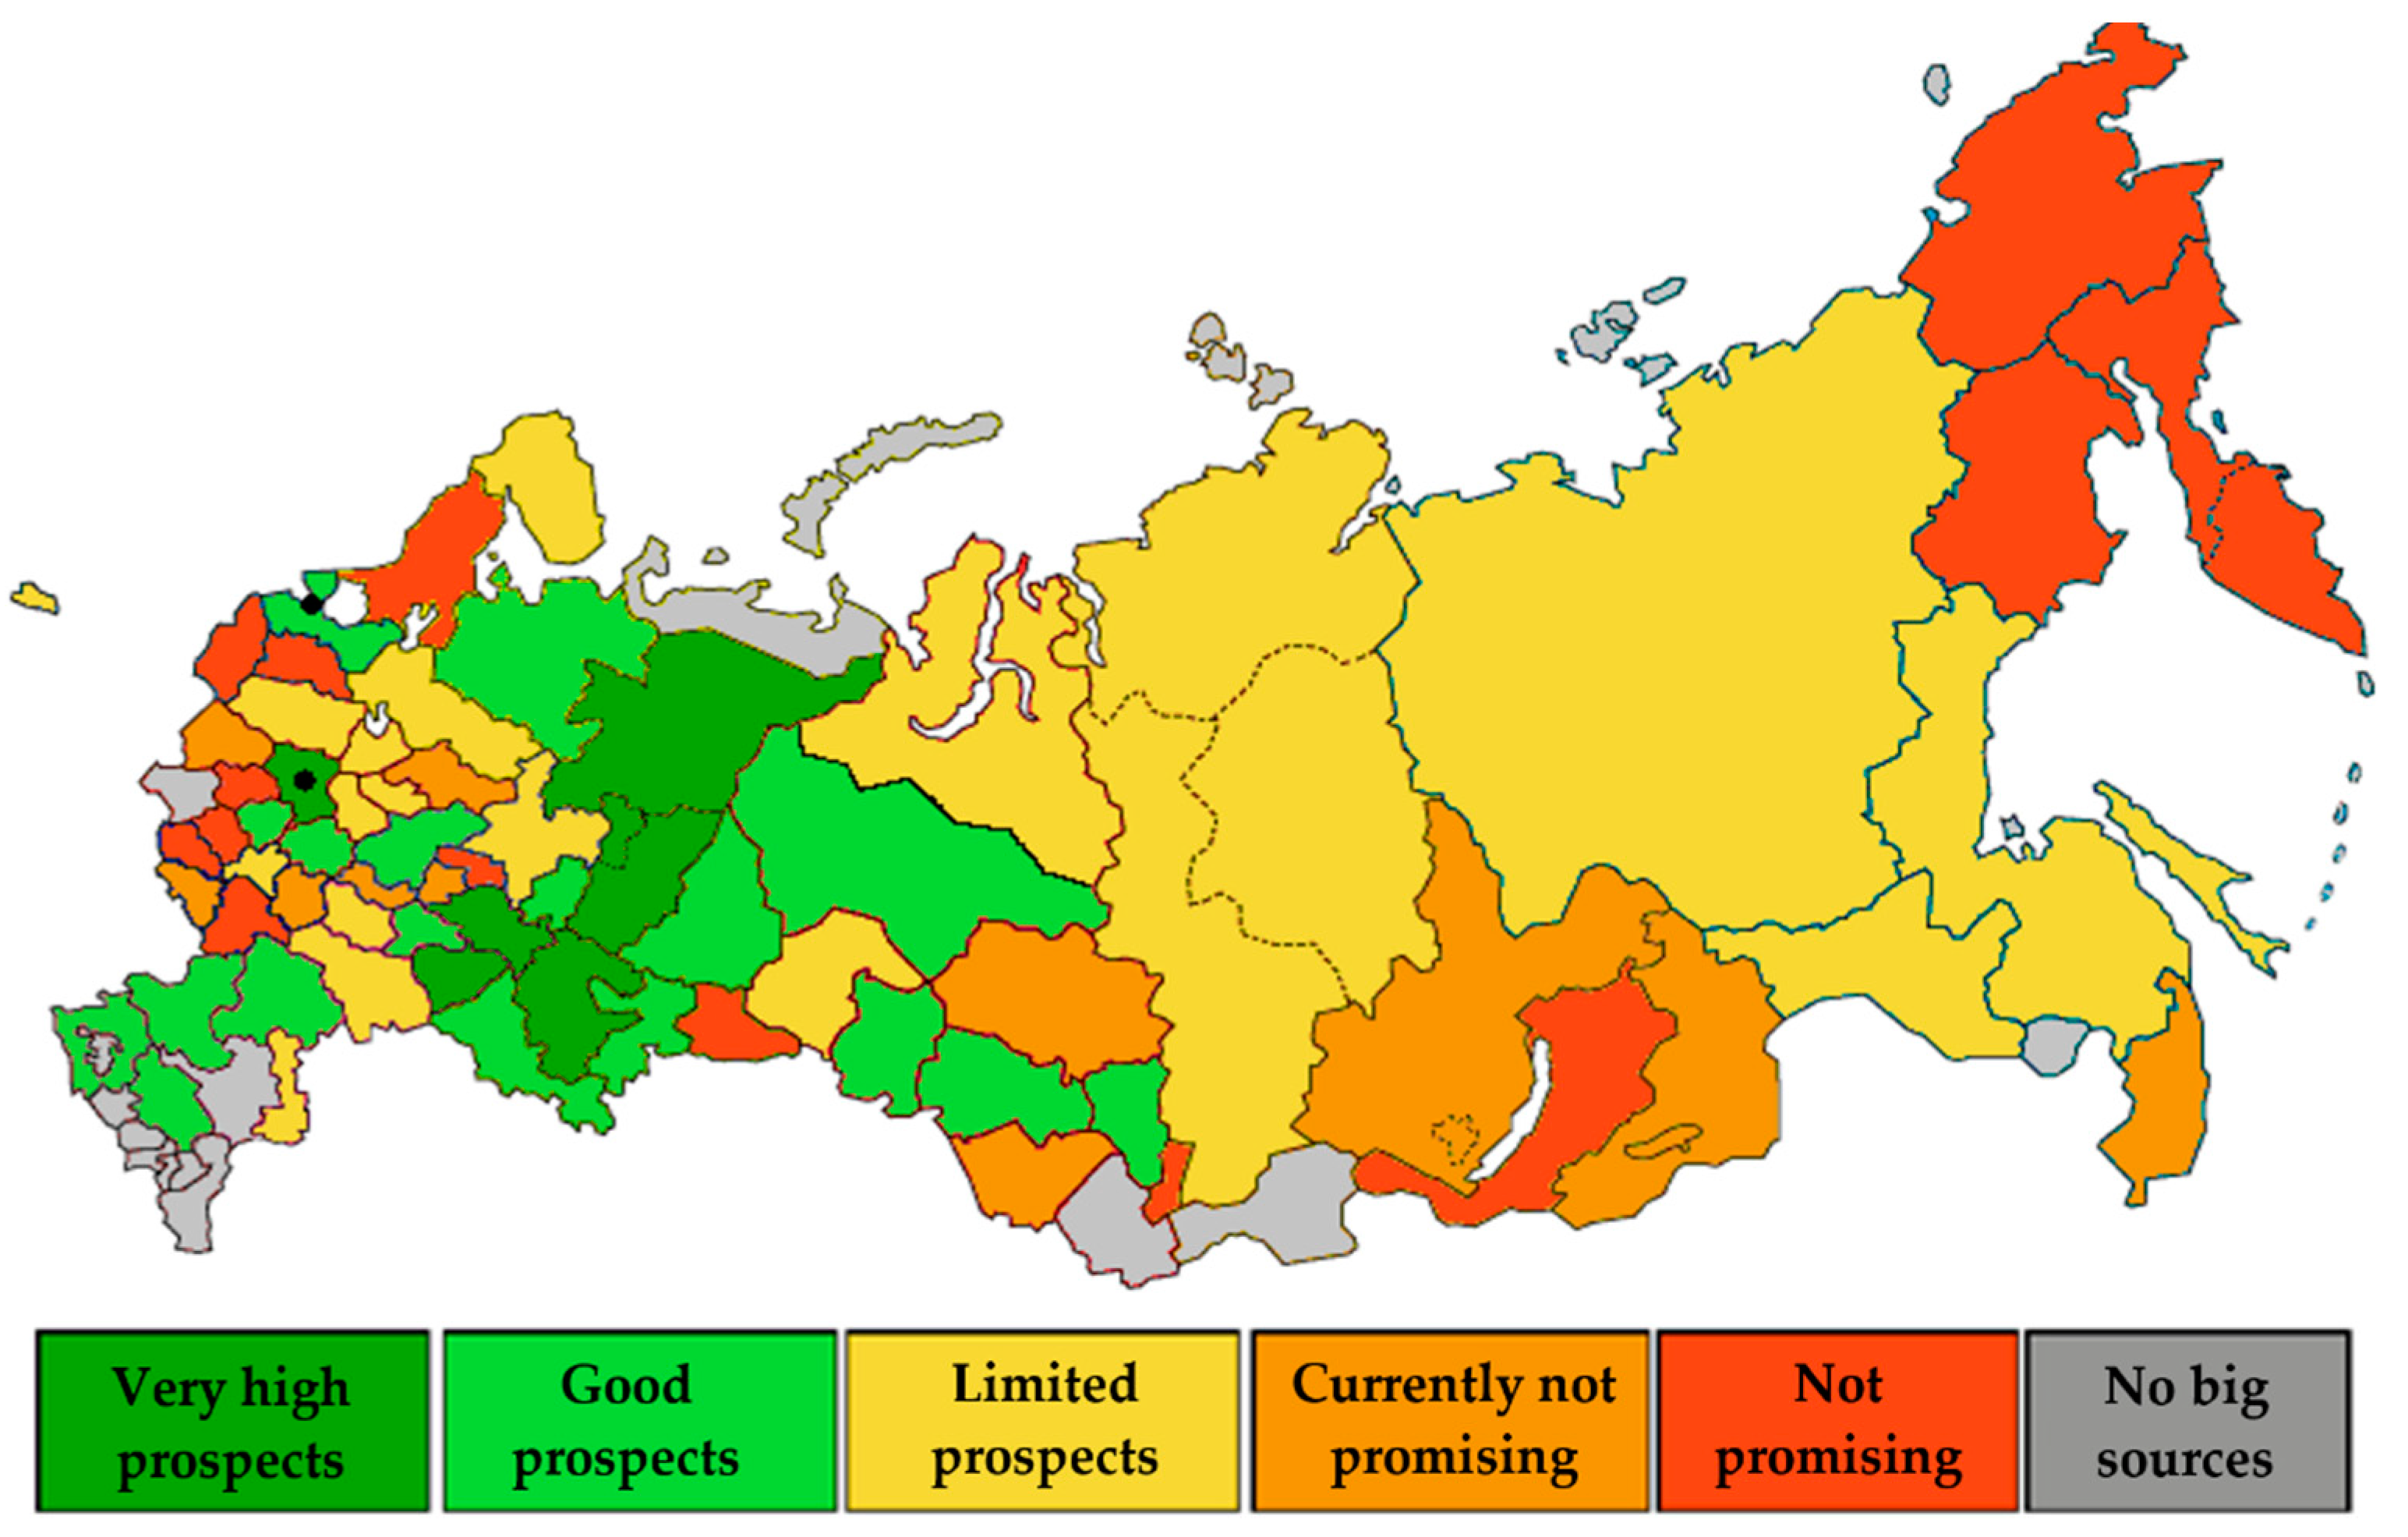
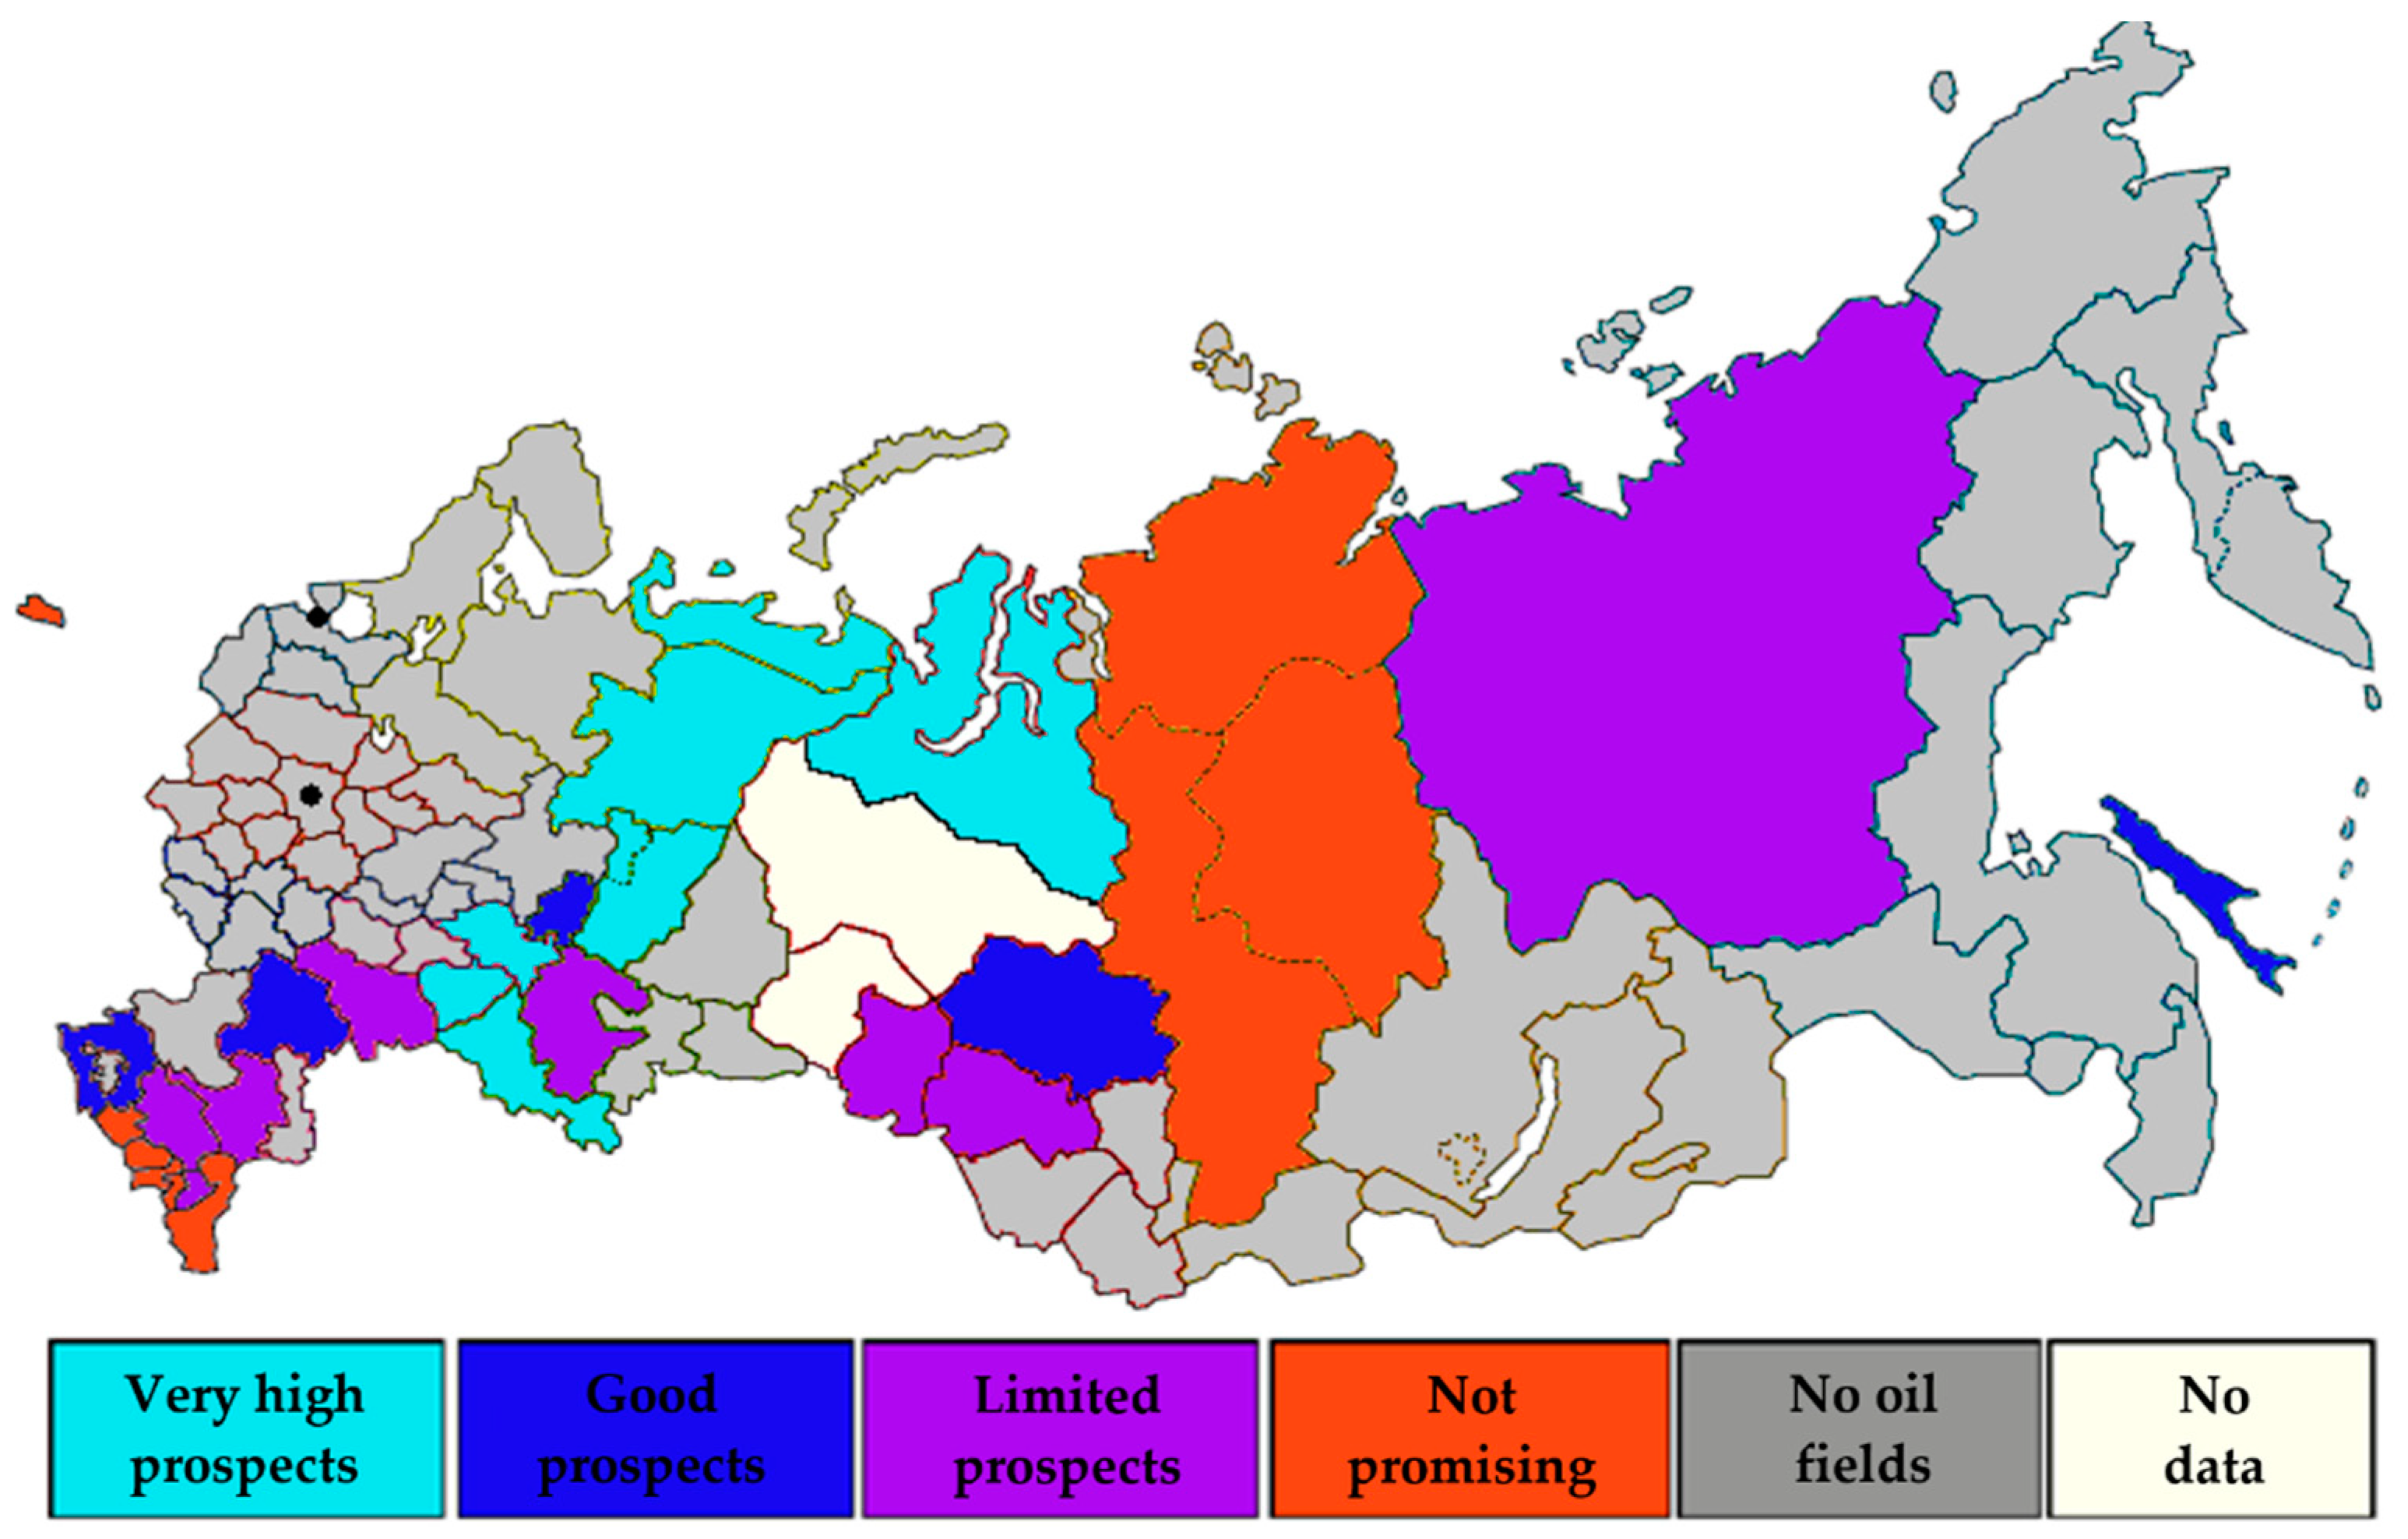
Based on the technical and economic analysis of the projects, a map was drawn to illustrate the potential of the Russian regions from the viewpoint of CO
2 capture (
Figure 9 and
Figure 10). We can see in
Figure 9 and
Figure 10 that the most promising regions are located in the European part of Russia, mainly in the Volga Federal District (Tatarstan, Bashkortostan, Perm and Samara regions).
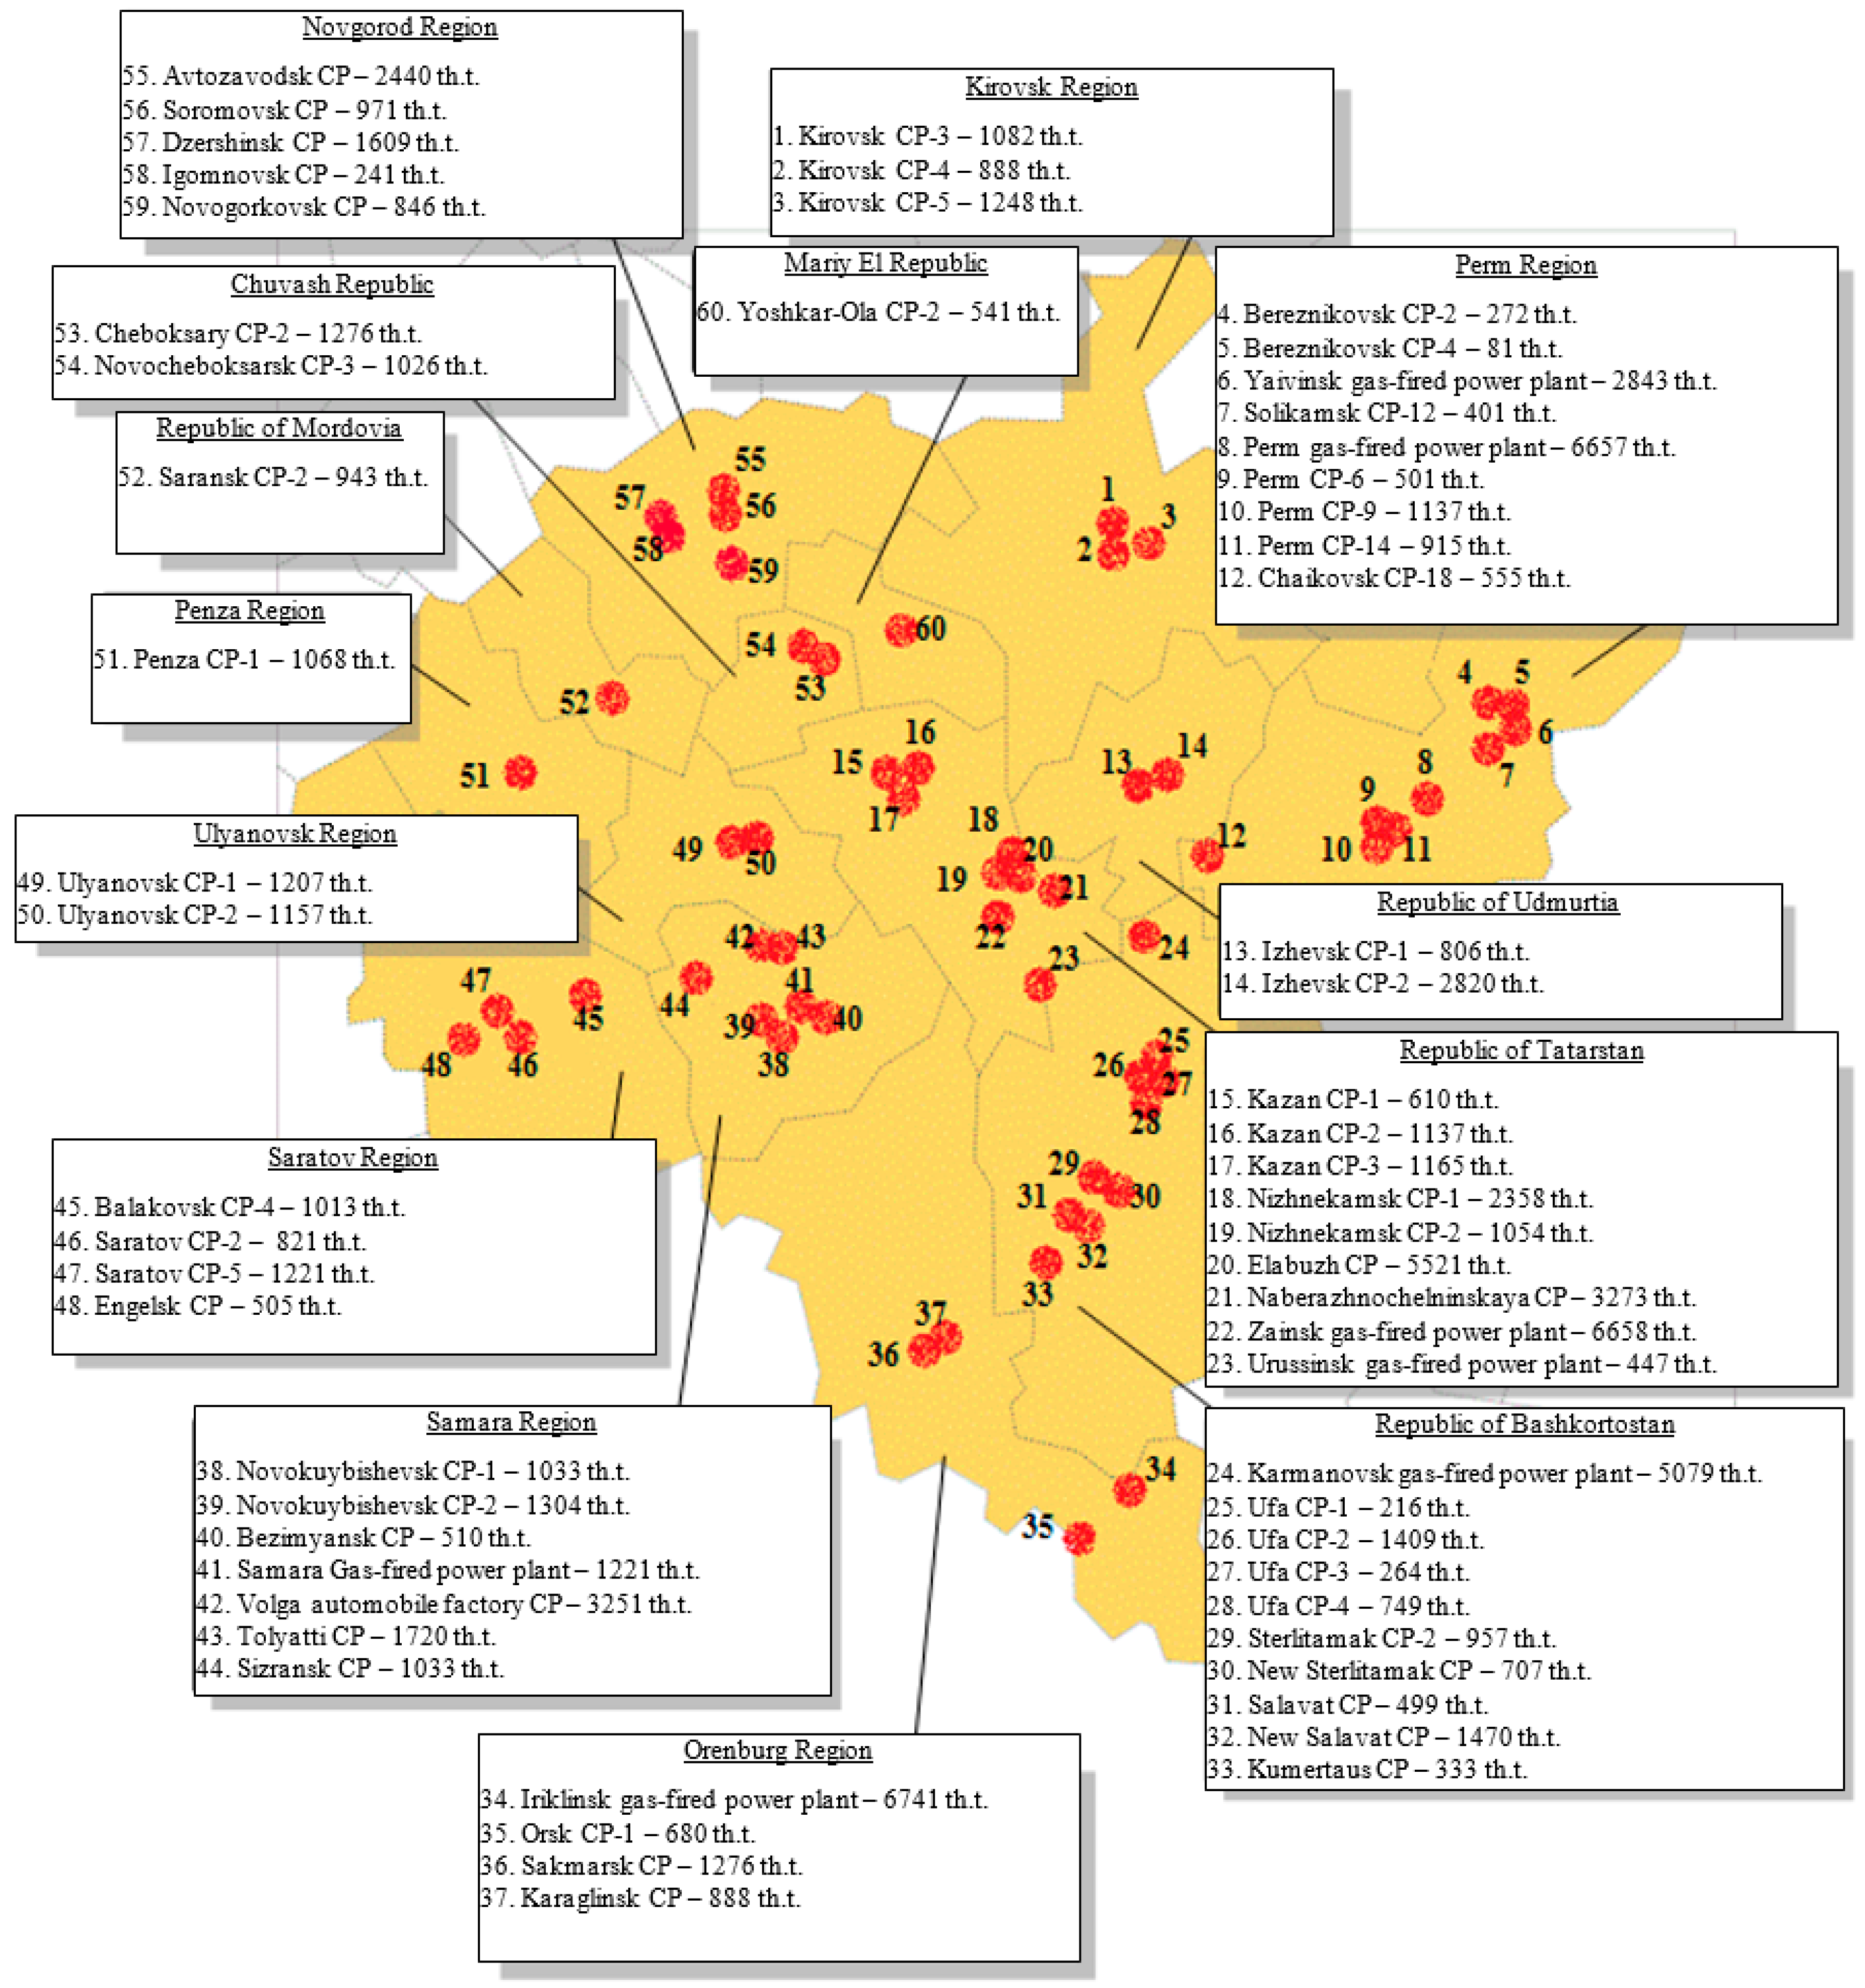
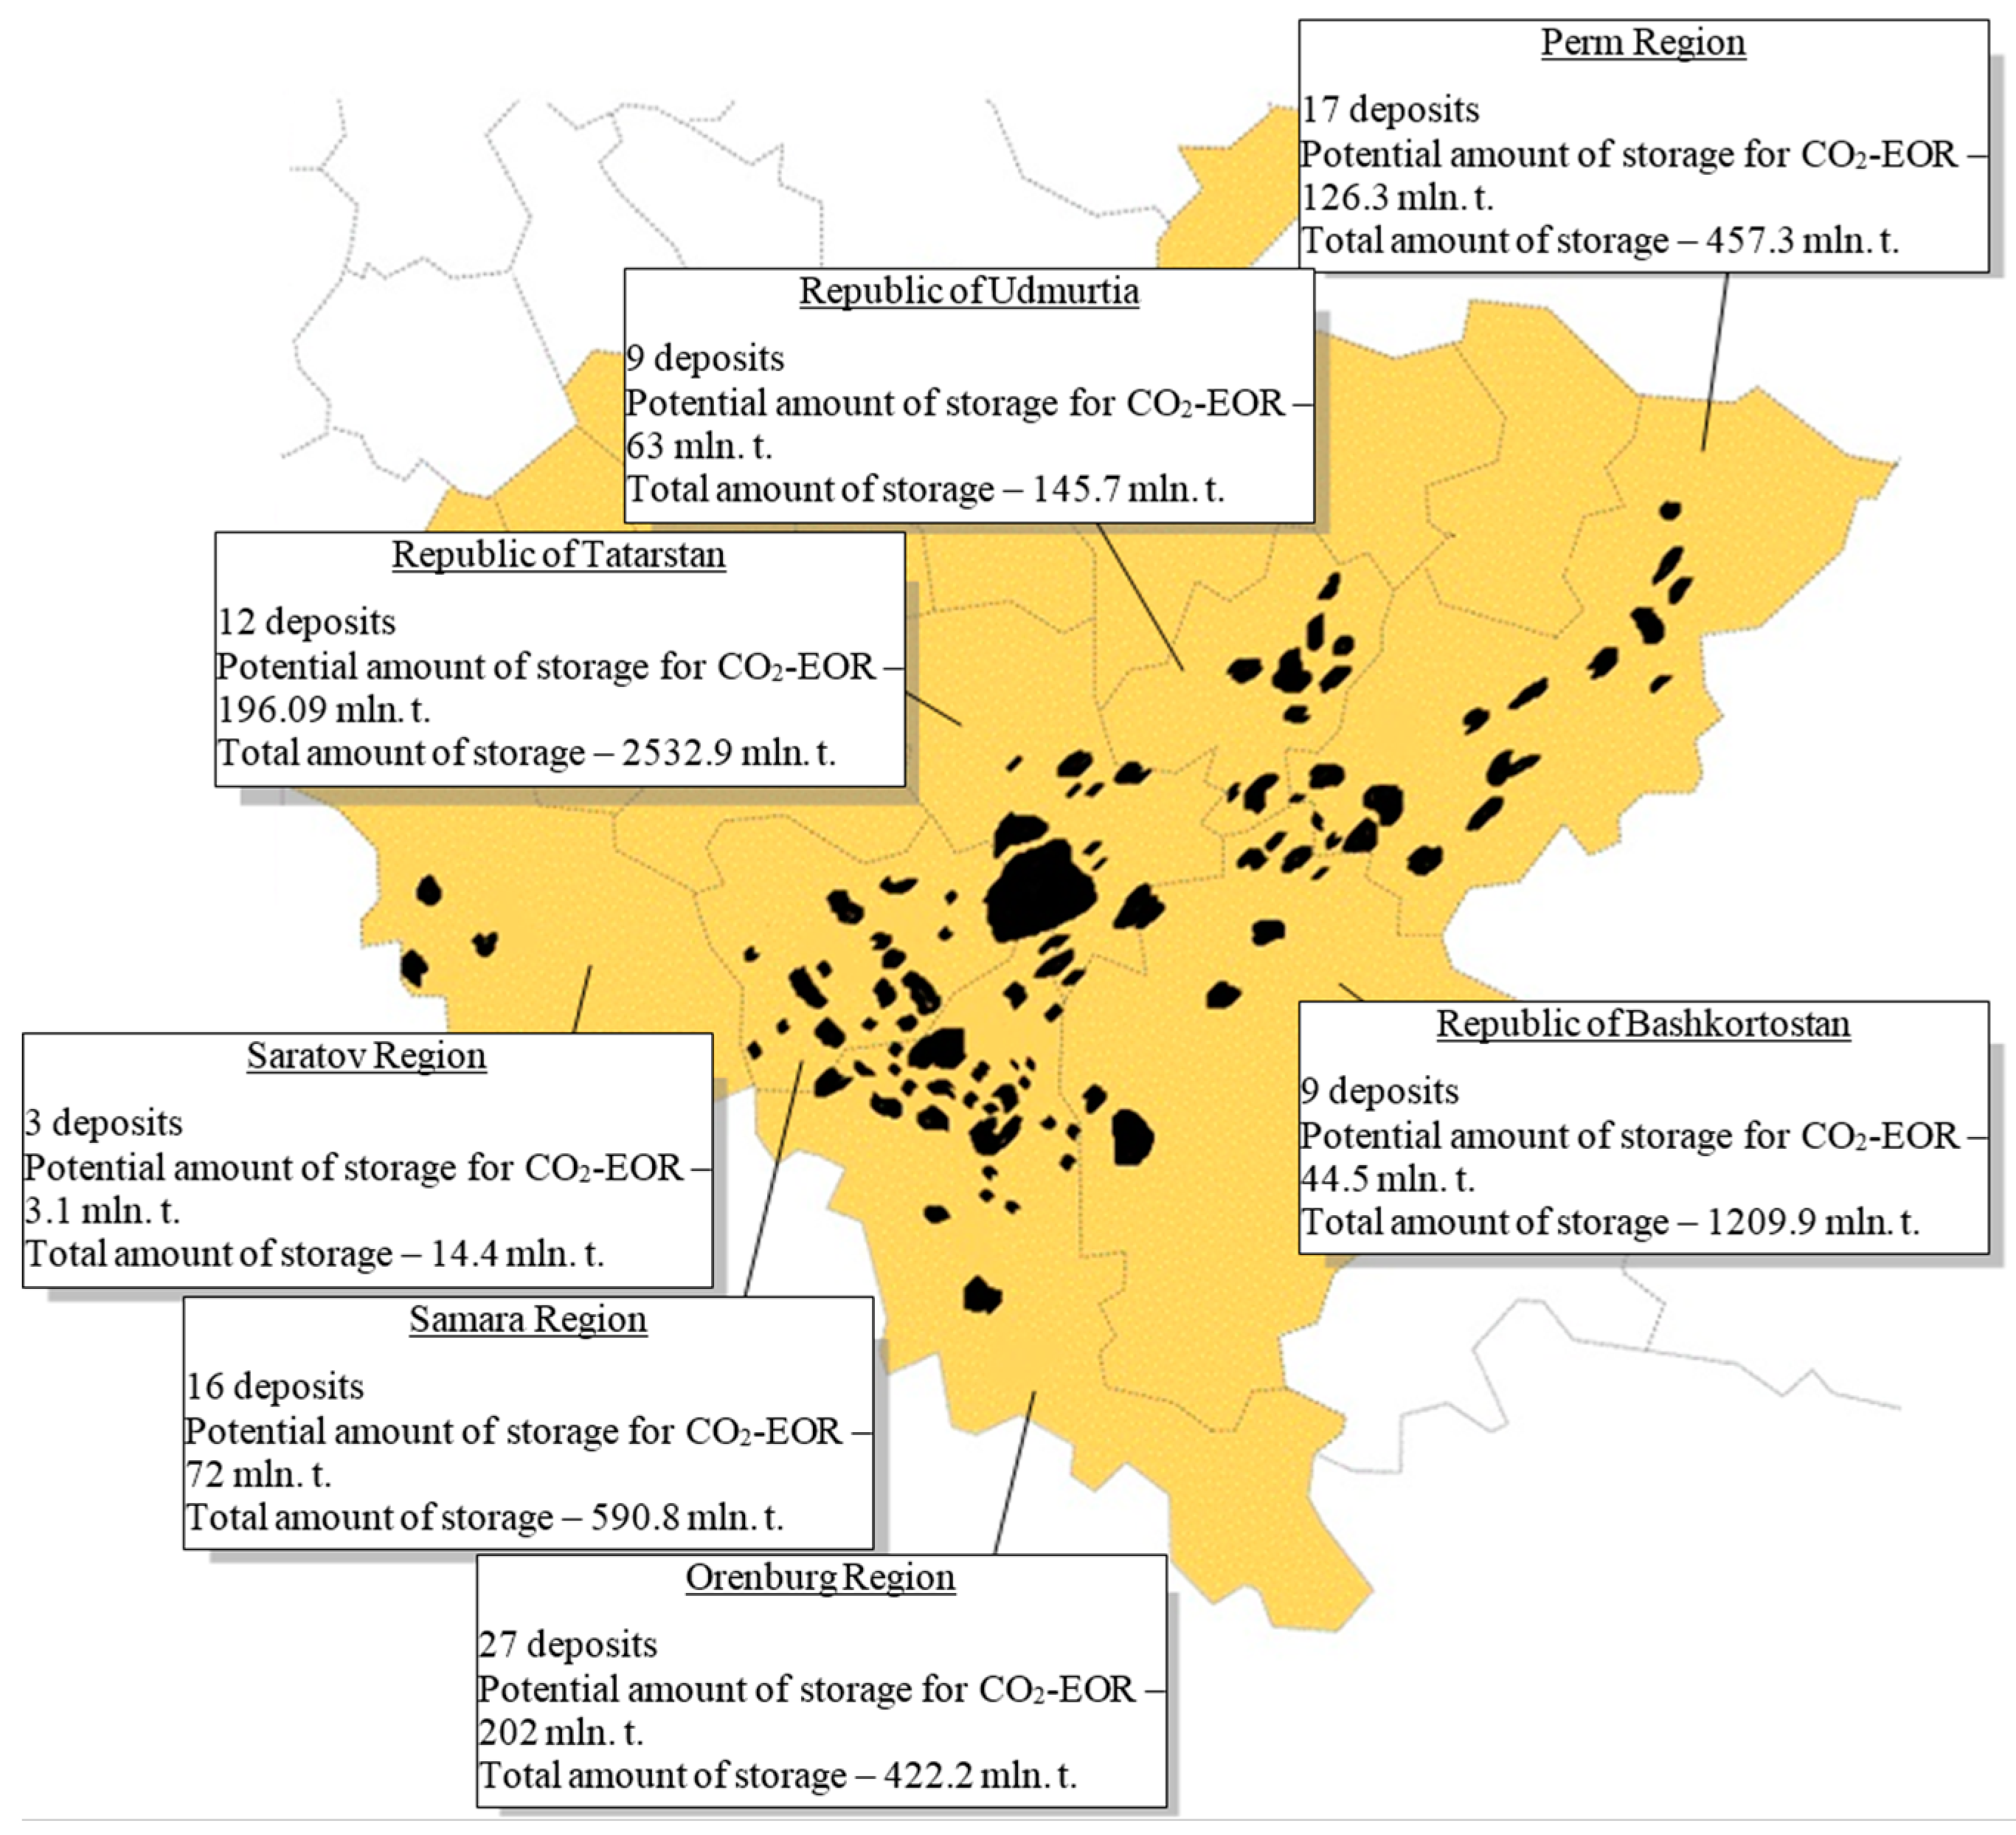
The potential of the Russian regions from the viewpoint of CO
2 injection is also presented in
Figure 10. The most promising regions are found in the Volga-Ural (Tatarstan, Perm Region, Orenburg, and Samara Region—
Figure 11 and
Figure 12), Timan-Pechora (Nenets Autonomous Area, Komi Republic) and West-Siberian (Yamal-Nenets Autonomous Area) oil-bearing provinces. It should, however, be noted that the storage potential of the Khanti-Mansi Autonomous Area and Tyumen province has not been assessed in this paper.
The Komi Republic is also an attractive region; as large power plants lie close to depleted oil-fields. Another promising region is the Moscow province. Although there are no close CO2 sinks in the Central Federal District, the emissions of industrial plants located in the area are so large that the economies of scale can make CO2-EOR projects feasible.
4. Conclusions
The assessment of the technical potential for CO2-EOR projects implementation in Russia, as well as the analysis of power plants (coal and gas) activity, showed that:
1. The number of gas power plants (185 plants) in Russia is 2.6 times higher than coal (71 plants), however, in some regions, due to the closeness of coal deposits, the number of coal power plants exceeds the number of gas plants, for example, in the Siberian (42 coal and 6 gas plants) and the Far Eastern (14 coal and 12 gas plants) Federal districts. This fact influences the total emission of CO2 in these districts.
2. The largest number of power plants (109) is in Volga & Central Federal district, as a result, this region forms 35% of the total Russian CO2 emission (606.7 Mt CO2), the second place is taken by the Siberian federal district with 28.9%, while other Federal districts have between 5% and 17% of the share. At the same time, taking into account the number of fields, their size, and geo-technical conditions, only 65.8% of total CO2 emissions could be used for injection, including 192.043 Mt in the Volga & Central Federal district, 100.792 Mt in the Ural Federal district, and around 100 Mt in all other districts.
3. In total, there are 322 oil fields in Russia, 142 of which are located in the Southern & North-Caucasian Federal district; however, there are numerous small deposits, and therefore the annual possible CO2 demand is only 27.6 Mt (5% of total) and total CO2 storage potential is 561.5 Mt (7.6% of total). In contrast, Volga & Central Federal district has 93 oil fields, but the highest potential of annual CO2 demand (40.7% of total) and CO2 storage potential (around 75.2% of total). The total storage potential of the Russian oil-fields is no less than 7400 Mt.
4. Taking into account the size, rate of deployment, and geo-technical conditions of the Russian oil fields, Volga & Central Federal district has the highest technical potential to store carbon dioxide during CO2-EOR projects, which is estimated at 720.6 Mt (43.2% of total). Second place is taken by the Ural Federal district with 475.5 Mt (28.5%). The third is the North-Western Federal district with 263.1 Mt (15.8 %). Other districts have around 200 Mt of CO2-EOR storage potential. The total amount of CO2 that could be stored during EOR operations is 1700 Mt.
5. It was found that there are 183 possible CO2-EOR projects that can be implemented in Russia from a technical point of view. A significant portion of these projects is located in the Volga & Central Federal district (92 projects), due to the relatively good geo-technical conditions and low average transportation distance, which is 313 km (36% lower than the average for all districts). The second place is taken by the Southern & North-Caucasian Federal district with 33 potential projects and the lowest average transportation distance (289 km). The North-Western and Ural Federal districts have 22 and 21 projects, but the average transportation distances are 655 and 858 km, respectively. Other regions have around 9 potential projects.
6. According to the carried out assessment, oil recovery efficiency could be increased by 4–20% depending on the project features. However, the average growth of oil recovery efficiency is between 13.02% and 13.64% in the North-Western, Volga & Central and Ural Federal districts, and 11.42–11.7% in other regions.
Thus, Russia has significant technical potential for the implementation of upwards of 183 CO2-EOR projects. However, to assess the feasibility of such strategic projects it is necessary to take into account the financial aspects, such as costs of capture, transportation, and injection.
Carrying out an economic assessment of Russia’s CO2-EOR prospects, including the clarification of the respectful position and a balance of CO2 supply and demand for each of the eight federal districts, demonstrates the vast potential of this technology for the country’s depleted oil-fields. Having solved the transportation problems for each federal district, we ended up with an optimal set of 183 projects, 99 of which are considered economically efficient based on an investment analysis. In the economic analysis of the selected projects the average costs of CO2 capture, transportation, and injection were calculated and an optimal cost structure for such projects was defined. On the basis of this economic assessment, we can summarize that:
1. Most of the efficient projects are located in the North-Western Federal district: 72.73% (16 of 22 projects). The Siberian and Far Eastern Federal districts have similar rates: 66.67% (6 of 9 and 4 of 6, respectively). In the Volga & Central Federal district, 53 out of 92 projects were selected (57.61%). In the remaining regions, only 20 effective projects out of 54 were found. Such a decrease in the number of projects is connected with factors reflected on the costs, such as significant transportation distance, unfavorable geological conditions of the reservoirs, large productive area, and deep oil bed position, etc.
2. According to calculations, the total average costs of CO2-EOR operations in the Siberian Federal district is equal to 16.8 EUR/t (11.9% lower than average in all districts). As a result, the average payback period is 7.4 years—the lowest value through all districts. The North-Western, Volga & Central, and Southern & North Caucasian Federal districts have average total costs between 18.11 and 20.65 EUR/t and payback periods from 7.73 to 8.92 years. The average payback period in other districts is higher than 9 years.
3. An analysis of ineffective potential projects shows that the most frequent reasons for economic infeasibility are high transportation or injection costs. It was found that the optimal total cost structure of CO2-EOR projects should be 62% for capture costs, 16% for transportation costs, and 22% for injection costs.
4. The average discount rate of the assessed projects is relatively low and equal to 10%. By increasing it by 5%, the number of effective projects will decrease by 19.2% (down to 80 projects). However, decreasing the discount rate by 5% gives only a 12% increase in the number of projects (up to 111 projects).
During a detailed regional analysis the construction of source and sink maps was carried out. The regions of Russia were ranked in two different ways: the potential of their power plants to serve as CO2 sources and the potential of their oil-fields to serve as CO2 sinks. Based on the former, CO2 sources with the greatest potential are located in the Volga Federal Districts (Tatarstan, Bashkortstan, Perm, and Samara regions), Moscow province, and Komi Republic. The second classification revealed that the best oil-fields for CO2-EOR operations are located in the Volga-Ural, Timan-Pechora, and West-Siberian oil-bearing province.
It should also be noted that despite the extensive prospects of the CO2-EOR projects, there are two key problems that complicate the process of their implementation in Russia:
1. Significant distances between large power plants and oil-fields. These problem exist in the Northwestern, Ural, Far Eastern, and Siberian Federal districts. Moreover, the major part of these regions, including the Ural, Far Eastern, and Siberian Federal districts, lack necessary infrastructure, are characterized by low density of population, and suffer from severe weather conditions, which complicate their industrial development. These factors have an extremely negative influence on the total cost of a project.
2. Despite the fact that the problem of CO2 emission increase is raised periodically in various government strategic programs, there is no state support for such projects in Russia. In this regard, given project risks, capital intensity, and the need to attract various stakeholders, the largest Russian companies consider the opportunity of such CO2-EOR projects only in the long term, or reject them outright due to the availability of not depleted light oil deposits.
It can be concluded that the geological, mining, geographical, and economic conditions of some regions in Russia show a very good potential for the technologically feasible and economically efficient implementation of CO2-EOR technologies in depleted oil-fields. This work is the first study of this scale for Russia, that integrates the technical and economic aspects of a CO2-EOR project assessment. Generally, the results obtained are in line with other assessments of EOR potential, although the results tend to be less optimistic due to a more detailed focus on Russian oil-fields and the inclusion of not only the technological but also the economic parameters to screen out inefficient options.
The results presented herein provide a rather generalized evaluation and many factors (CO2 retention, CO2/oil ratio, grid density) have been taken as the industrial average. Additionally, the economic conditions (oil price, currency exchange rate, discount rate) were kept constant in the analysis. While the results provide an overview of promising regions in which to implement CO2-EOR, for specific investment decisions further research is needed, preferably in close cooperation with actors associated with the selected CO2 sources and injection sites.
In summary, it should be noted that the use of CO2 to increase oil recovery is the most attractive option of CCS for Russia. With the development of storing technologies and the reduction of capture costs, some technical and economic potential of CCS can be formed on the basis of coal enterprises. The undeveloped beds of the giant coal basins of the Kuzbass, Krasnoyarsk region and the Komi Republic can be used for CO2-ECBM, however there will be a number of limiting factors, such as the lack of technogenic CO2 sources and not enough developed industry and infrastructure of these regions, which reduce the potential economic efficiency of such projects. The use of saline formations at the present time seems unlikely, due to the lack of strategic programs of state support for CCS. However, with the development of state incentives in the field of climate change, CO2 storage in saline formations can be claimed, since the capacity potential of such geological structures is huge.

 ,
, 


