Article

Influence of Water Immersion on Pore System and Methane Desorption of Shales: A Case Study of Batu Gajah and Kroh Shale Formations in Malaysia

by
Ahmed Al-Mutarreb
,
Shiferaw Regassa Jufar
*,
Hesham Abdulelah
and
Eswaran Padmanabhan
Shale Gas Research Group (SGRG), Institute of Hydrocarbon Recovery, Faculty of Petroleum & Geoscience, Universiti Teknologi PETRONAS, Seri Iskandar 32610, Malaysia
*
Author to whom correspondence should be addressed.
Energies 2018, 11(6), 1511; https://doi.org/10.3390/en11061511
Submission received: 10 April 2018 / Revised: 20 May 2018 / Accepted: 5 June 2018 / Published: 11 June 2018
(This article belongs to the Section L: Energy Sources)

Abstract

:
The influence of water on the pore system and gas desorption in shale remains an open question that is not yet fully understood. In this study, we present the effect of water on the shale pore system and recovered desorbed gas through a series of measurements on shale samples. We utilized the Brunauer-Emmett-Teller (BET) low pressure N2 adsorption and Field Emission Scanning Electron Microscopy (FE-SEM) to observe and analyze the effects of water immersion and moisture on the pore system of shale samples from Batu Gajah (BG) and Kroh shale formations in Malaysia. The impact of water on desorption was then measured using the United States former Bureau of Mines (USBM) modified method. The results showed that the micropore and mesopore volumes of the Batu Gajah (BG) and Kroh (KH) shale samples were reduced by 64.84% and 44.12%, respectively, after the samples were immersed in water. The BET-specific surface area declined by 88.34% and 59.63% for the BG and KH sample, respectively. Desorption results showed that the methane desorbed volume was (KH: 1.22 cc/g, BG: 0.94 cc/g) for the water immersed sample, and (KH: 0.72 cc/g, BG: 0.60) for the equilibrated sample. The difference can be attributed to the proportion of the organic (total organic carbon) and inorganic (clay) content found in the two shale samples. The total organic carbon (TOC) existing in the KH sample was 12.1 wt %, which was greater than the organic carbon content of the BG sample (2.1 wt %). The clay content was found to be more dominant in the BG shale when compared to the KH shale.

1. Introduction

The growing energy demand and the recent advances in stimulation techniques including horizontal well drilling and hydraulic fracturing have made shale gas a significant source of energy around the world [1,2]. Shale gas has been in the spotlight as a new unconventional fossil-fuel energy source. For example, according to EIA Annual Energy Outlook 2016, shale gas contributed about 25% of the natural gas of the supply in the USA in 2016 and is projected to increase to about 40% by 2040 [3]. Shale gas is mainly methane, which is extracted from organic rich fine grained sedimentary rocks. Shale gas reservoirs generally have extremely low permeability and contain high total organic carbon contents [4]. They are also known to be highly heterogeneous in terms of pore structure and mineralogical composition. As such, the evaluation and characterization of the pore system and the mineralogical composition of shales are crucial in understanding gas storage and resource estimation.
The complexity and heterogeneity of shale gas systems makes the natural gas storage mechanisms in shale reservoirs different from that in conventional reservoirs. In shales, the natural gas can be stored by two mechanisms: as free gas and as adsorbed gas [5]. The presence of nanopores in the organic and nonorganic materials store the desorbed phase in a dense form which enhances the original gas in place compared to if there was free gas alone [6]. Therefore, it has been reported that the adsorbed gas constitutes a significant proportion of the Original Gas in Place (OGIP) and could reach up to 40–50% [7,8]. Furthermore, when a reservoir is depleted, the adsorbed gas can be freed, not only contributing to the total gas production, but may also sustain the pressure at a high level, and may allow fluid flow by opening pore throats [9]. The amount of adsorbed gas in a shale system depends on many variables including the pore system characteristics, mineralogical compositions, organic matter, and moisture contents [4]. These factors are critical in evaluating shale gas content, and subsequently to natural gas production. The micro- and mesopore volumes in the organic and inorganic materials are the main sites for the adsorption phenomenon to occur in shale gas reservoirs [10]. The associated micro- and mesopores with the organic proportion have positive correlation to the large surface area providing methane adsorption potential sites [11,12]. Similarly, clay minerals have the capacity to adsorb methane to their pores. The amount adsorbed depends on the surface area of each mineral and its proportion in the shale compositions [9].
However, clays have a higher affinity to adsorb water than methane [10,13]. Water is omnipresent in shale gas reservoirs. As a result, the methane adsorption mechanism is a gas-liquid-solid interaction when taking into account the initial water saturation in actual conditions [14]. Water molecules compete to occupy adsorption sites in the complex unimodal pore system in shales [13,14,15]. Thus, employing other than fully moisturized shales data might yield unrealistic methane adsorption capacity. Therefore, in this study, we simulated the water presence in shale gas reservoirs conditions adopting The Standard Test Method for Equilibrium Moisture of Coal at 96 to 97 Percent Relative Humidity and 30C (ASTM D 1412-93) [13,14,16].
To enable commercial production from shale gas reservoirs, fracking operation is conducted to create interconnected fractures which result in increased gas recovery [4]. Fracking operations involve pumping a large amount of fracturing fluid into the formations, where typically slickwater is used in the case of shale gas reservoirs. Slickwater comprises about 99.8% water and less than 0.2% chemical additives [17]. After completing the fracturing job, the injected fluid is allowed to flow back from the well prior to the shut-in period which is followed by gas production. In most cases, less than 50% of the fracking fluid flows back to the surface. The influence of the remaining water on gas production and shale characteristics is still an open question [18,19]. Some studies have observed that water is trapped in the pores, which decreases gas relative permeability and blocks fractures and pores that subsequently degrades the gas productivity [20]. However, some investigators have suggested that the imbibed water can enhance the gas productivity. When gas flows through the pore networks, it tends to remove water blocks through viscous displacement and gas evaporation caused by gas expansion. This process facilitates easier gas flow [21,22]. Similar observations were reported from field experience which shows the low water flow back is associated with high gas productivity [19,23]. Despite all efforts to understand the effect of lost water, some key elements on gas recovery such as pore system and gas desorption in Malaysian shale formations have barely been evaluated. In this paper, we investigated the impact of water on the pore system and desorption behavior on shale samples. The investigation was conducted through a comparative analysis of two shale samples under two conditions, i.e., water immersed, and moisture equilibrated shale samples. The two cases were evaluated and a comparative study was conducted through experimental measurements, which included low pressure N2 adsorption, field scanning electron microscopy, and desorption measurements.

2. Materials and Methods

2.1. Shale Sample Preparation

2.1.1. Shale Samples Collection

Shale samples were collected from two organic rich shale formations. The first formation, the Kroh formation, is located in the Kedah district (ID-KH) and is from the Ordovician-Devonian age of Palaeozoic black shales. The second sample was collected from the Batu Gaja formation from the Devonian age (ID-BG) [24]. Some characteristics of the samples were reported in our work published previously [1]. The shale samples were collected from outcrops located at the latitude and longitude shown in Table 1.
These outcrops might have been affected by some degree of weathering. However, it is reported that collecting a newly exposed outcrop from an excavated engineering site is recommended to reduce the weathering effect [25]. Therefore, the upper layer of the outcrop, around 60 cm, was removed during the collection. The degree of weathering was determined through physical observation of the colour and lamination of the shale. When we carried out the experimental work, we prepared four representative samples from each shale sample (BG and KH). The four representative samples were used for X-ray Differaction (XRD), Field Emission Scanning Electron Microscopy (FE-SEM), Brunauer-Emmett-Teller (BET) N2 adsorption, and United States former Bureau of Mines (USBM) modified method.
The BG shale sample was collected from the Batu Gajah area. Shale in this area are from the Carboniferous age and mainly contains black gray flaggy shale. The other shale sample (KH) is from the Ordovician-Devonian age, which occurred in the Kroh formation. The Kroh formation is comprised of layers of mudstone and black carbonaceous shale [24].

2.1.2. Shale Samples Preparations

Water is omnipresent in shale gas reservoir systems. Consequently, it is highly advisable to consider the initial water content when evaluating a shale gas system [13]. The Standard Test Method for Equilibrium Moisture of Coal at 96 to 97 Percent Relative Humidity and 30C—ASTM D 1412-93—is the recommended and most commonly used procedure to simulate the water presence under unconventional reservoirs conditions [13,14,15,26]. The procedure includes placing a pre-weighted shale sample in a desiccator with a moisturizing agent that provides 97% to 98% Relative Humidity (K2SO4), and the weight difference over the time was observed. After about 30 days, no change in the weight was noticed, therefore the equilibrium was achieved. The moisture water uptake for the two samples were then calculated (in wt %) using Equation (1):
M % ( RH ) = ( m m o i s t ( RH ) m d r y ) m d r y
where M% is the moisture weight content (water uptake); mmoist is the mass of the moisture sample when the sample’s weight reaches equilibrium; and mdry is the weight of the dry sample.
We tested the effect of immersed water in the pore system and gas recovery during desorption. To prepare the sample, 200 g of each sample was crushed and sieved to a size between 2–2.38 mm. One hundred grams was treated using the moisturizing procedure above-mentioned, while another 100 g was immersed in fresh water for two days to ensure the samples were fully saturated. The immersed samples were then filtered through a strainer to remove any excess water, and the water uptake was then measured using Equation (1) for the immersed mass instead of moist mass.

2.2. Pore System Characteristics

In this study, the pore systems were evaluated and assessed carefully under both conditions: initial water saturation in shale gas reservoir (moisture case), and water immersion. When assessing pore systems in shale gas reservoirs, the International Union of Pure and Applied Chemistry (IUPAC) classification is adopted. This classification is based on three groups: micropores, which are less than 2 nm in diameter; mesopores that have a pore diameter between 2 to 50 nm; and macropores that comprise pores with a diameter larger than 50 nm [27]. There are several methods that have been used previously to study the pore system in shales such as the mercury intrusion method, FE-SEM, and low pressure gas adsorption [28]. It has been reported that low pressure adsorption analysis is one of the most suitable methods to characterize the micro- and mesopore system in shale reservoirs [5]. We employed low pressure N2 adsorption (ASAP, model ASAP 2020, Micrometrics, Seri Iskandar, Perak, Malaysia) to evaluate the pore size distribution (PSD) and specific surface area (SSA) alteration of raw moisture equilibrated and treated immersed samples in crushed samples whose grain size <0.2 mm. The samples were pretreated by conducting outgassing at 25 °C room temperature for 10 minutes, only to remove any adsorbed gases while maintaining the moisture and water in the pores [14]. Then, the samples were immersed in liquid nitrogen to perform the low pressure N2 adsorption at −196 °C temperature. The adsorption isotherm data were then used to compute the pore size distribution and specific surface area by the Barrett-Joyner-Halenda (BJH) and BET methods; respectively. The BJH method is based on the gas condensation pressure in the pores [29]. The surface area acquired by the BET was determined based on the number of molecules deposited as a monolayer [30]. In this analysis, the effect of ice-water expansion and the evaporation of bound water can be neglected according to previous study [14]. In addition to that, a FE-SEM (model, Supra 55VP, Zeiss, Seri Iskandar Perak, Malaysia) was used to evaluate the pore samples for an untreated sample and a sample which had been treated in water for two days.

2.3. Total Organic Carbon wt % Measurement

Total organic carbon in weight percentage wt % represents the organic richness in the sedimentary rocks. The quantity of total organic carbon was measured experimentally by removing inorganic carbon in the matrix of rocks [31].We determined the TOC wt % content of the collected samples based on the GB/T 19145-2003 standard [32]. Two grams crushed and dried samples were measured and placed in beakers. The samples were acidified with diluted HCL to remove inorganic carbon friction from the samples. About 0.63 g of each sample was then left in the fume chamber combustion at over 650 °C to convert organic carbon to carbon dioxide which was measured using an infrared detector using an analyzer model Multi n/c 3100 TOC (Seri Iskandar, Perak, Malaysia). The measurements were run multiple times, and the average was taken.

2.4. Mineral Content

The X-ray powder diffraction (XRD) technique was used to determine the mineralogical composition in the samples. This process involves an analysis of the diffraction patterns that are produced when X-rays are passed through the sample to reveal the structural properties of crystalline solids. We scanned the samples in crushed and dried form twice using an XRD-XPert3 model (PAN-analytical, Seri Iskandar, Perak, Malaysia) with step size 0.026° at 3° to 65° angles. The procedure produces 2ϴ versus intensity XRD curves. Each mineral has characteristic diffraction peaks that can be identified in the sample diffractograms based on standard patterns [33,34]. In addition to peak analysis, previous studies have used the (USGS) US Geological Survey’s Rock-Jock software to quantify mineral content in shales [35,36], so a quantitative analysis of the mineralogical composition of the two samples was also estimated [37].

2.5. Desorption Measurement

In this study, the experimental set-up used is shown in Figure 1, which was also used in our previously published work [1]. The basic principle of desorption measurement is based on mass balance’s law, and we used an adsorption-desorption unit to perform the measurement. The technique is based on the former U.S. Bureau of Mines (USBM), direct method of measuring gas desorption. Previous studies have conducted similar measurements to evaluate the desorption characteristics on shales [38,39,40].
The leak test was conducted by injecting nitrogen for at least an hour to ensure there were no leaks during the measurement. Helium was used to determine the volume of the free gas as it is inert and does not get adsorbed onto the shale samples. When other gases are used, the amount of adsorbed gas can be easily determined since the volume of the free gas is known from the measurement with helium [40] (from Figure 1). The desorption measurement commenced by dosing methane (opening valve 6a and closing valve 6b) into the adsorption cell by gradually increasing the pressure up to 20 bar. The pressure dropped when the gas molecules penetrated and got adsorbed into the sample surface. We monitored the pressure reading in the computer versus time until no pressure drop was observed and the equilibrium was achieved after about two days.
After ensuring the equilibrium had been achieved, we closed valve 6a and opened valve 6b for the desorption process. As soon as 6b valve was opened, the free gas bled out from the outlet hose, and subsequently the pressure dropped rapidly until it reached atmospheric pressure (1 bar). The hose was then inserted into the inverted tube filled with water to measure the desorption. The decrease of water level in the inverted level was associated to the desorption rate. The accumulated desorbed volume was then observed.

3. Results and Discussion

3.1. Total Organic Carbon wt % Content

Total organic content of the two samples is shown in Figure 2. The measurements were performed using a TC analyzer (TC Analyzer, model Multi N/C 3100, Analytik Jena, Seri Iskandar, Perak, Malaysia). The results showed that the KH contained 12.1 wt % TOC, which was higher in organic carbon than the BG 2.1 wt % TOC. The BG sample and KH shale samples were obtained from the Batu Gajah and Kroh shale, respectively. A previous study by Baioumy et al. found that shales in these two Malaysian formations are over-matured [24]. According to the exploration and development of shale gas in the USA, shale gas potentiality can be classified based on their TOC wt % level, provided other conditions are fulfilled (i.e., kerogen type, thermal maturity, formation thickness) into three levels: the prospective zone 0.3% < TOC < 1.5% (A), the favorable zone 1.5 < TOC < 2.0% (B), and the target zone TOC > 2.0% (C) [41,42]. Based on our TOC wt % measurement results, the samples lay within the target zone classification.

3.2. Mineralogy

We used X-ray powder diffraction to identify the mineral contents of the samples. The Bragg equation determines the D-spacing, with the help of the D-spacing and angle values, some minerals were identified [33,34]. The description of possible minerals that are interpreted from count 2 theta versus peaks intensity angles is shown in Figure 3a,b for the KH and BG samples, respectively. Both samples contain a high quantity of quartz and clay with few peaks of kspar, and calcite. Quantitative mineralogical composition was also determined using the (USGS) US Geological Survey’s ROCK-JOCK software-program.
The quantitative results were in good agreement with the peaks’ interpretation, which we have previously published in a separate article (Table 2) [1].

3.3. Water Uptake

To simulate a more realistic condition of a shale gas reservoir in terms of initial water content, we adapted The Standard Test Method for Equilibrium Moisture of Coal at 96 to 97 Percent Relative Humidity and 30C (ASTM D 1412-93), which has commonly been used in previous studies [13,14,15]. After placing the shale samples in a desiccator with a humidifier agent until equilibrium was achieved, the moist sample was then measured and moisture uptake was calculated in weight percentage. The second condition was to immerse the samples in water for two days. The water uptake was then measured by calculating the weight difference. The results in Figure 4 show the BG sample adsorbed water almost double of the KH sample in case of the moisturizing condition. In the case of water immersion, the BG sample water uptake was higher than the KH sample. Such differences in the water uptake of the samples were related to the hydrophilic and hydrophobic nature of the clay minerals and organic matter, respectively [16,43,44]. In addition to that, in our previously published work on the same samples, the BG sample was more water wet than the KH sample [1]. Therefore, we can correlate the high moisture and immersed water uptake of BG when compared to KH due to the large amount of clay in the BG and of organic carbon in the KH samples.

3.4. Pore System

In this study, we evaluated the alteration of the pore system when the shale samples were immersed in water and compared them to raw moisture samples. We used low pressure N2 adsorption, which provided an aid to analyze the micro- and mesopore systems.

3.4.1. Low N2 Pressure Adsorption Results

The percentage differences of surface area, pore volume, and average pore size for the micro- and mesopore systems using low pressure N2 adsorption are presented in Table 3.
Table 3 demonstrates that the water immersion into the shale samples negatively influenced the BET surface area and the BJH pore volume of the samples. The BG sample was more affected than the KH sample. The KH surface area and pore volume decreased by about 60% and 44%, and the BG decreased by about 88% and 65%, respectively. As shown in Figure 5, the average pore size dimeter in the samples deteriorated significantly by 96% in the BG while in the KH, it was by 54%. The reason of this significant difference between the samples was due to the samples’ clay and organic matter compositions. Figure 6 suggests that the influence of the water immersion effect was more significant on the pore system of a clay rich sample than the organic carbon rich sample using low pressure N2 adsorption analysis. This may be attributed to the strong electrostatic force between the clay and water. Clay has more affinity to attract and adsorb water than nitrogen molecules, so it is also difficult to replace clay bond water by N2 [14,45,46]. In contrast, organic matter has low attractive force to water due to the carbon and graphite surface chemistry that comprises organic matter, and the weak carbon/water dispersive attraction and strong water/water associated interactions. Therefore, water molecules can hardly access the micro- and mesopore networks of simulated organic matter [47,48,49]. This resulted into the difference in pore system between the KH organic rich shale and BG clay rich shale. The effective pore volume for the water immersed sample was between 0 to 0–0.0003 cm3/g·nm of all pore width for both samples. This was a very low volume when compared to the moist samples. The moist samples’ effective pore volume was between 0.0001 cm3/g·nm to about 0.0012 cm3/g·nm for the BG sample, and to about 0.0018 for the KH sample. Most of the effective pore volume was between 3–10 nm pore width in both samples.

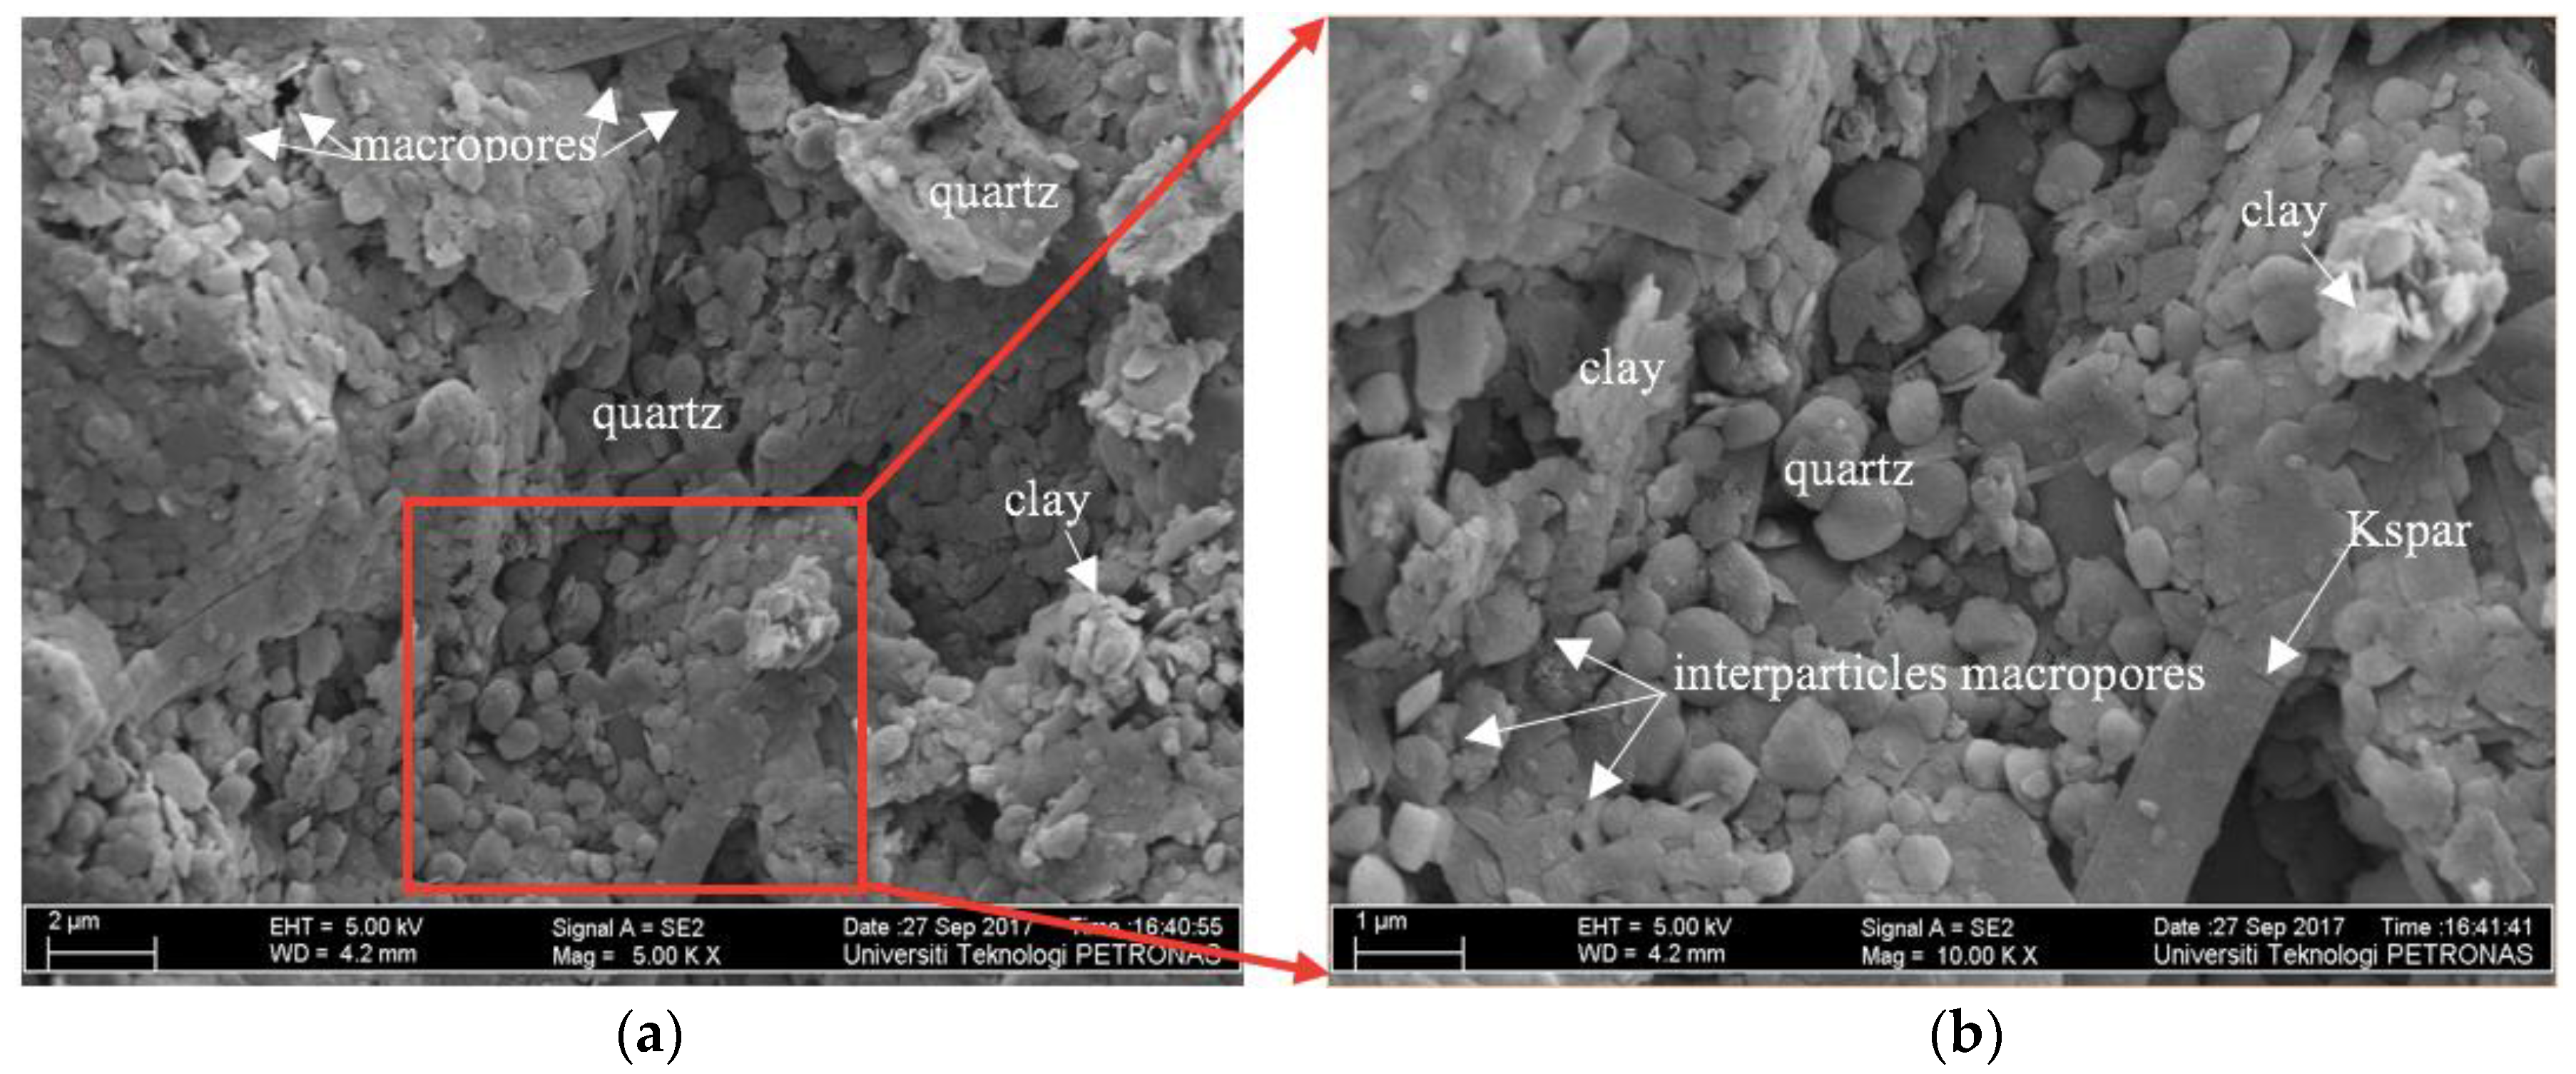
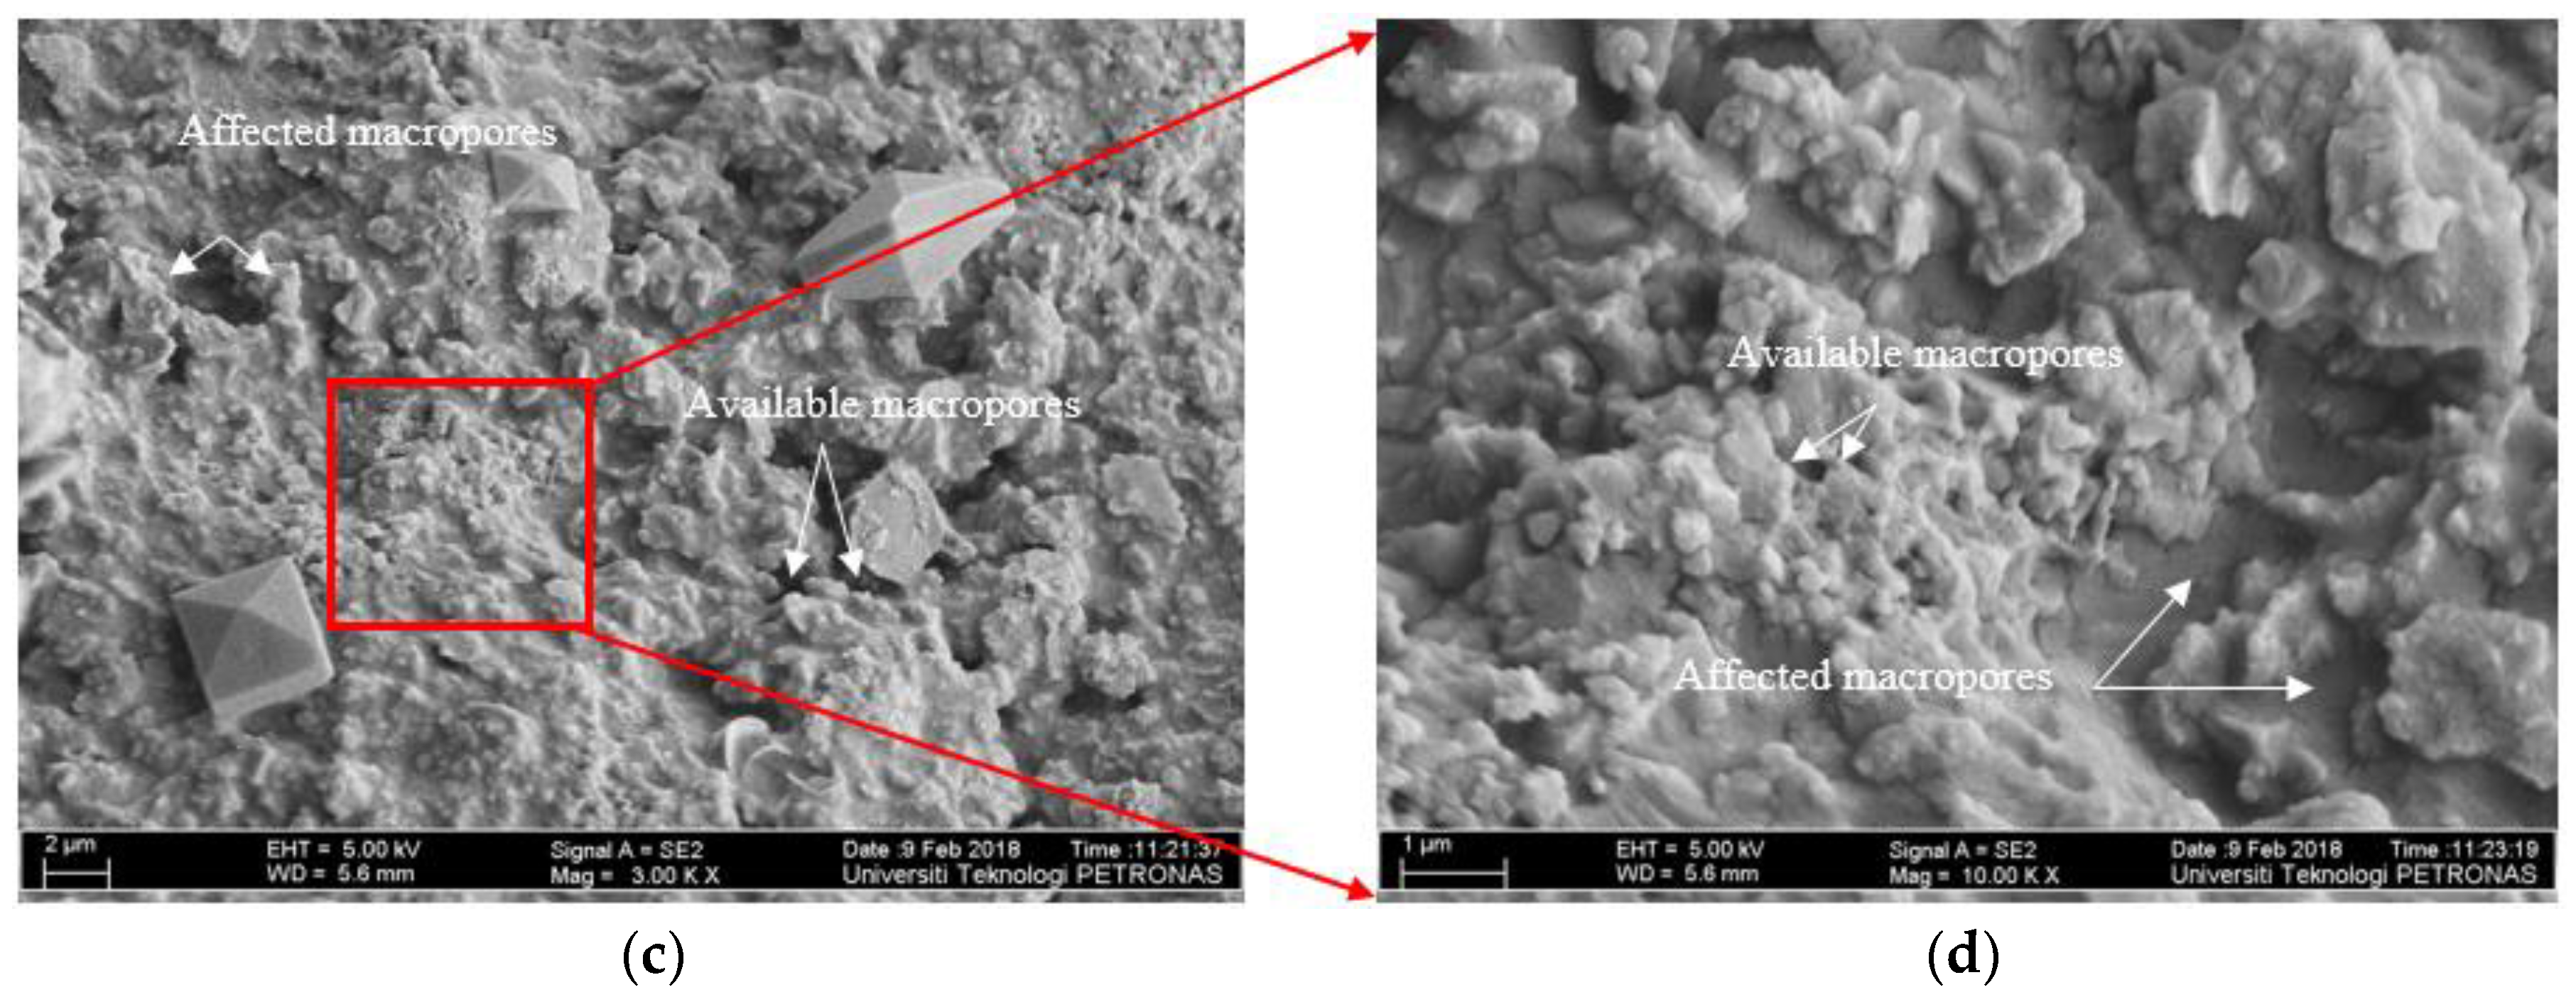
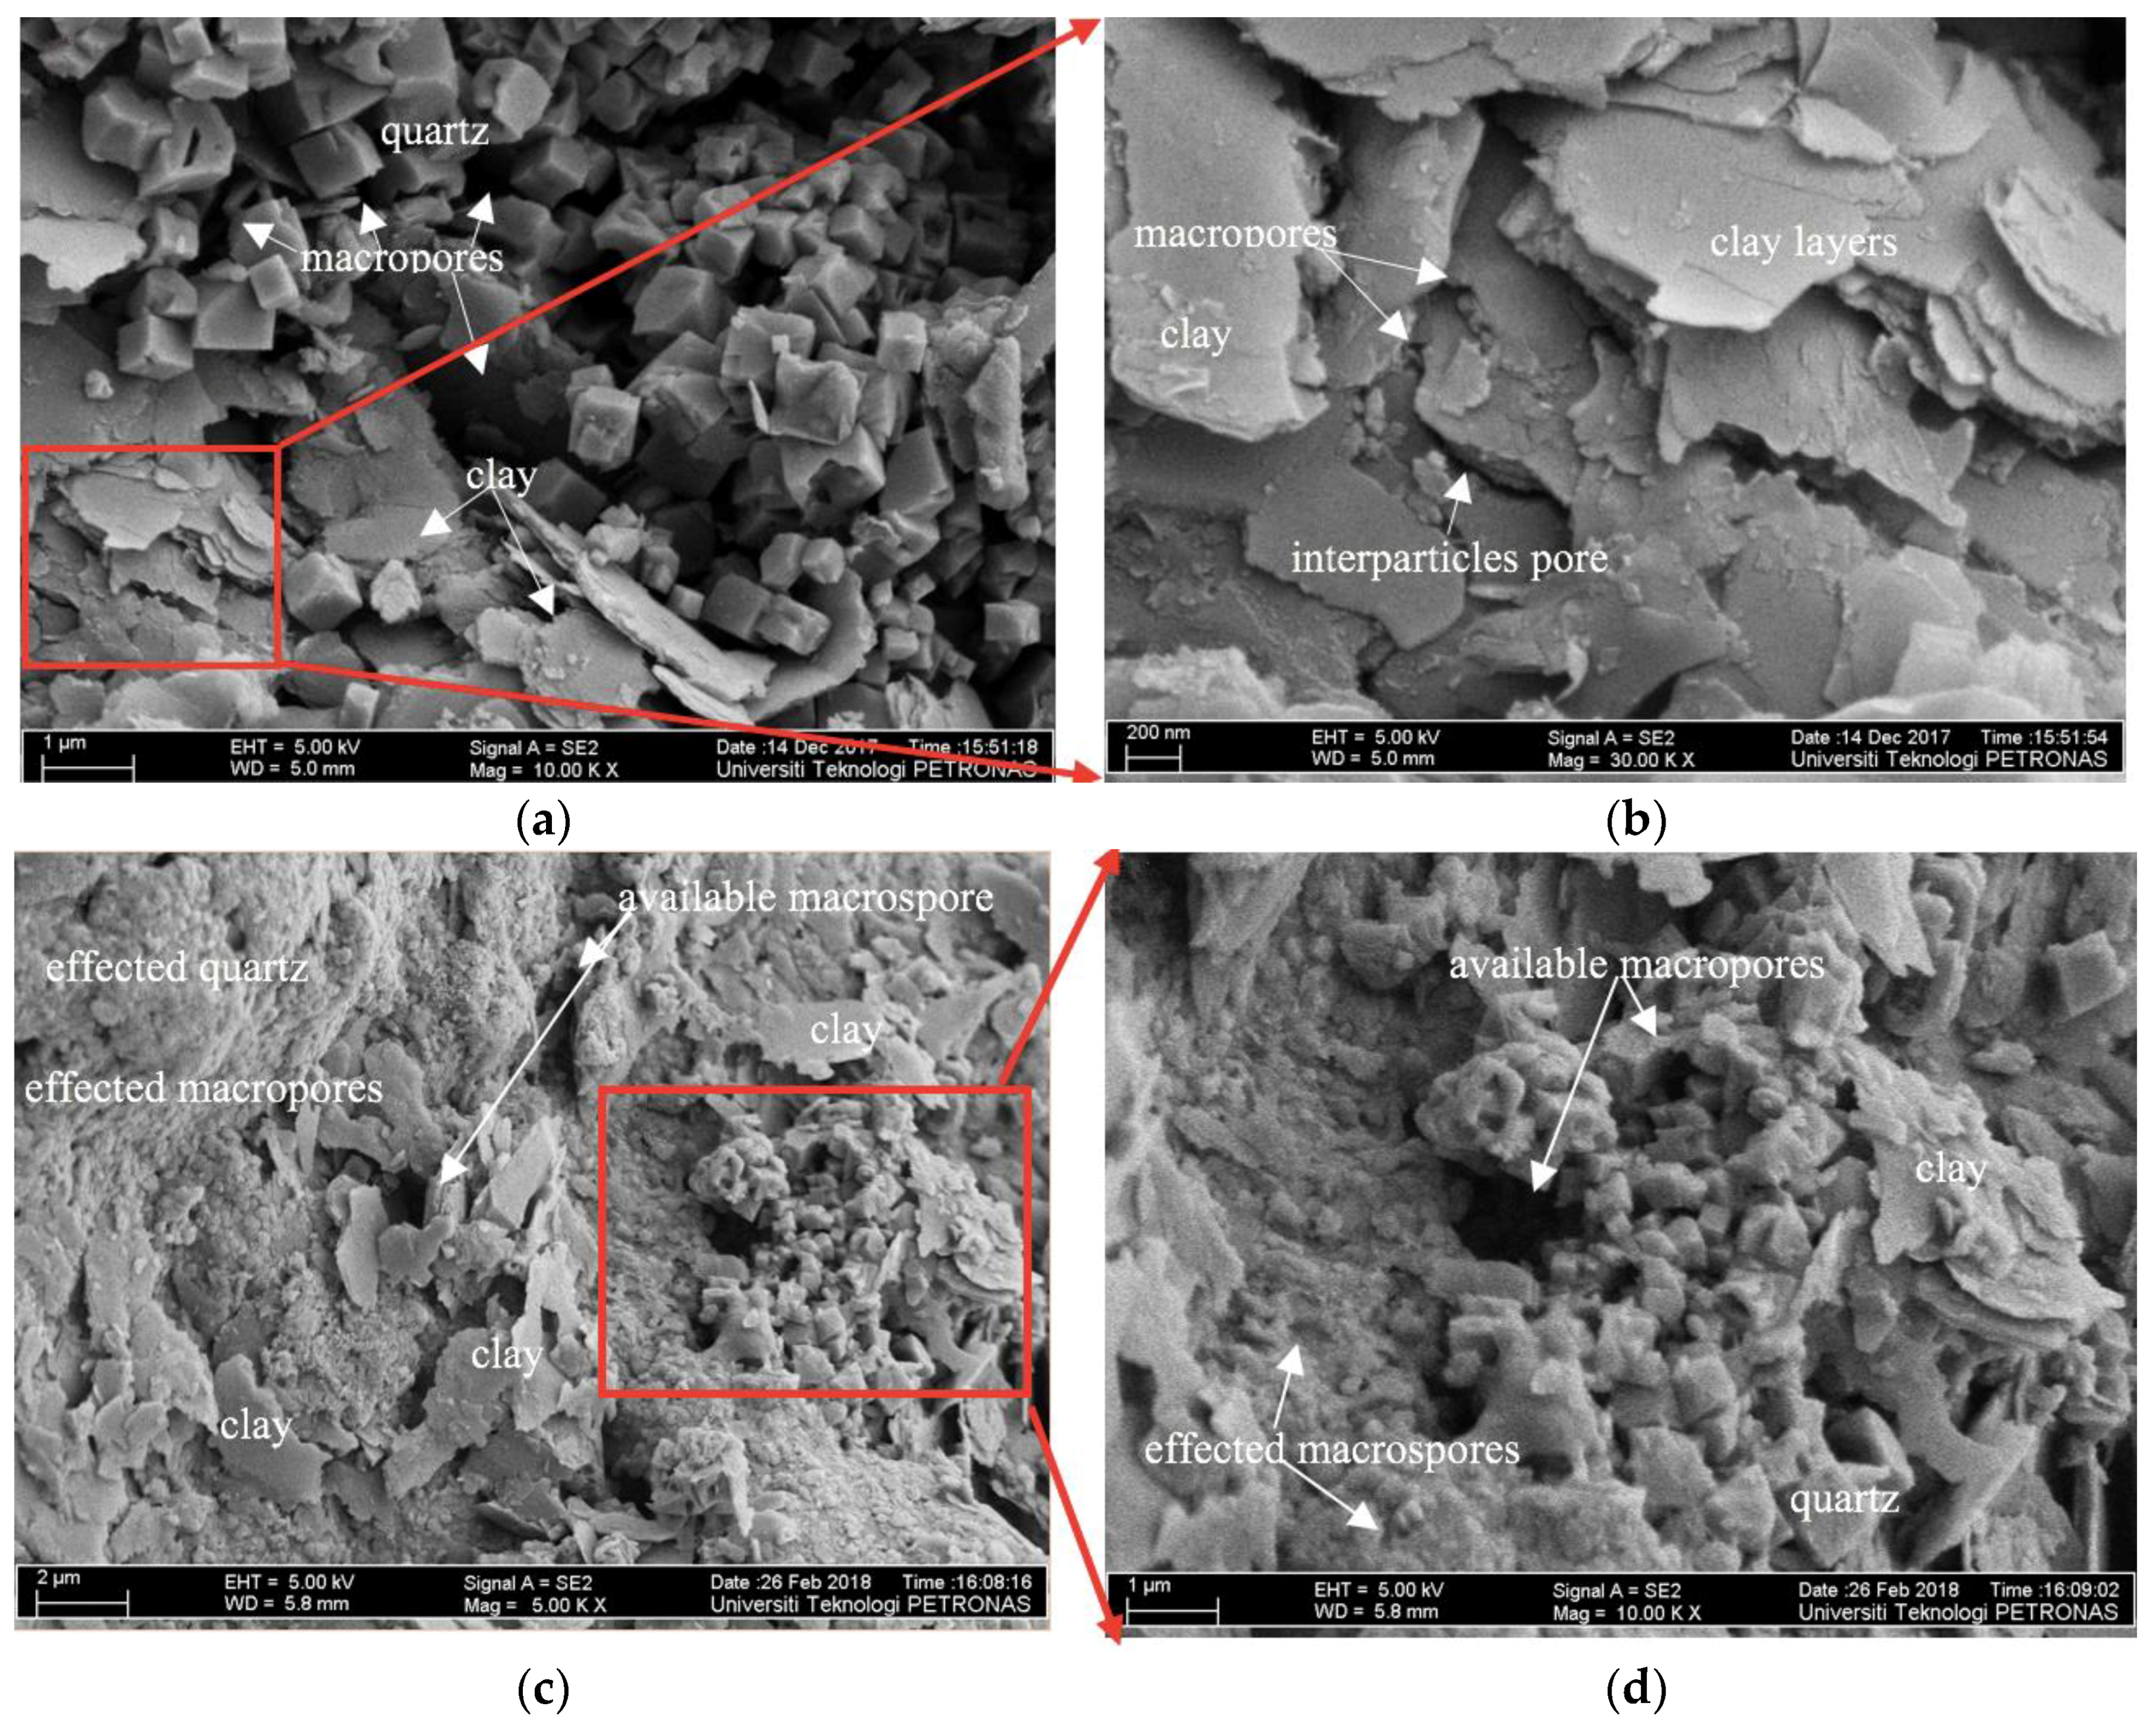
3.4.2. FE-SEM Images

We used FE-SEM to evaluate the surface structure of fresh chips from dry samples, and on samples that had been immersed in water for two days. Figure 7 and Figure 8 show the mineralogy and pore system of the KH and BG samples for both cases. A qualitative comparison of the images demonstrated the changes on pore structure and surface morphology that happened during the water immersion in the shale samples. For example, Figure 7a,b show the KH un-immersed sample. The minerals could be clearly identified, and macropores exist between the particles. Figure 7c,d are the KH samples after water immersion. Most of the macropores were influenced by the water immersion and disappeared. The minerals including clays and quartz were also distorts. Similarly, Figure 8a,b are the BG un-immersed sample, where a clear structure of quartz and clay layers were sorted. Figure 8c,d are the BG sample after immersion in water for two days. The quartz structure changed and some macropores that were present diminished. Overall, water distorted the pore system and changed the shale structure of the samples. As reported earlier, the water adsorption could greatly influence the physical characteristics, bulk volume, and total weight of shales [50]. Subsequently, we observed an alteration in the appearance and pore structure of our samples. In addition to that, as both samples contained a significant content of clay, it was reasonable that we observed drastic changes in pore structure and shale characteristics when the sample was immersed in water due to the clay swelling and clay hydration [14,18,50].

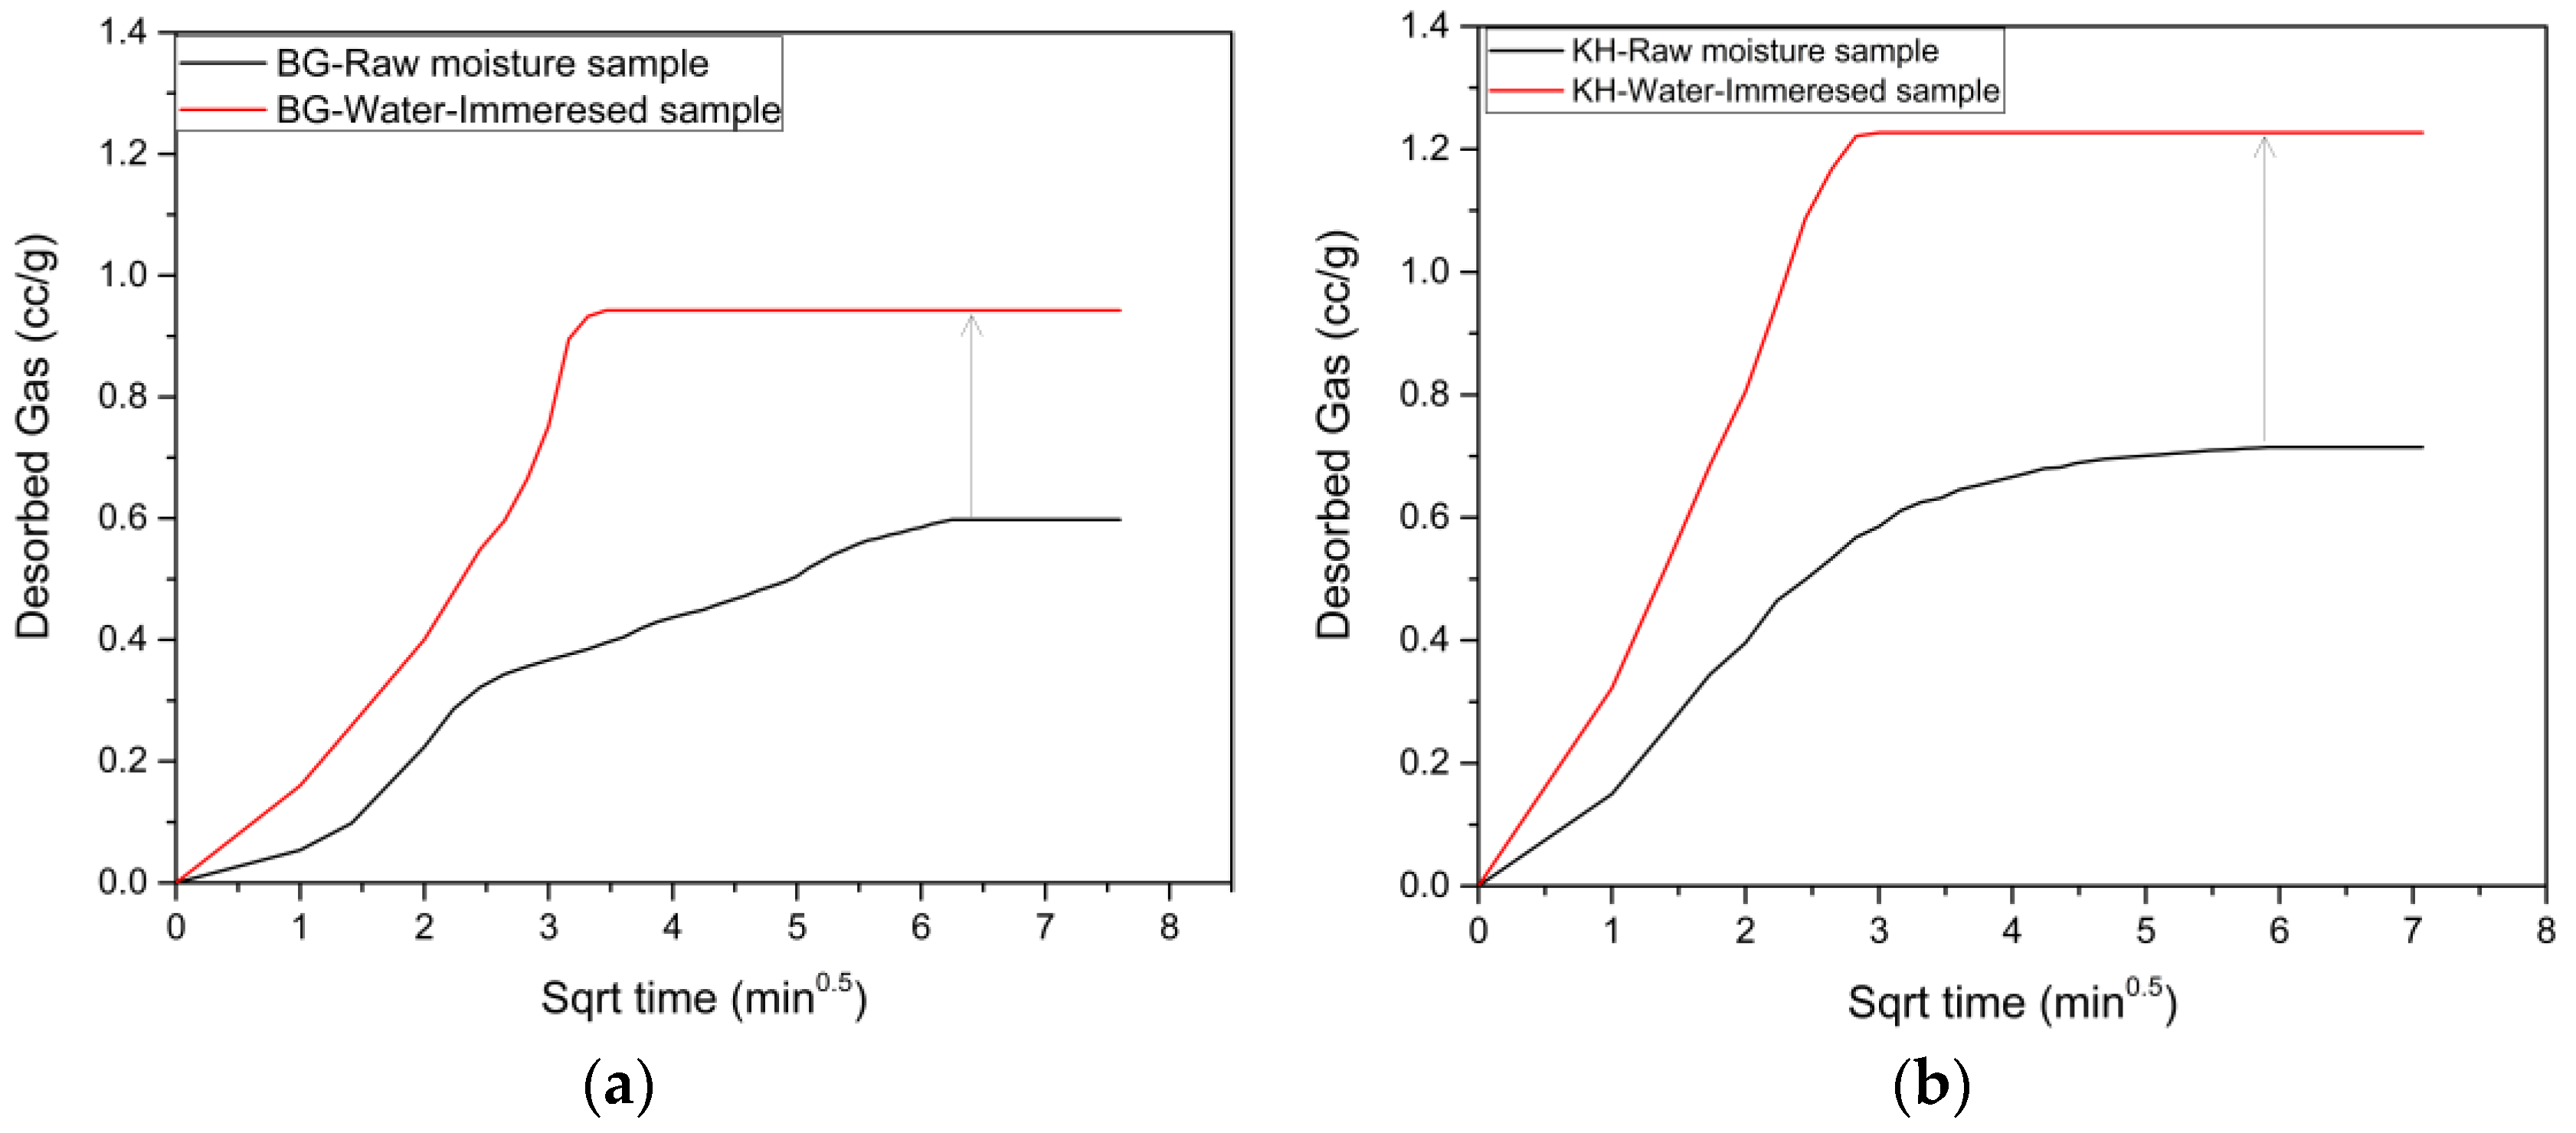
3.5. Desorption Results

In this study, we measured the specific desorption volume (cc/g) versus time (sqrt time) using the USBM direct method [38,39,40]. The objective of this test was to evaluate the influence of water immersion on shale’s desorption characteristics and compare it with the moist conditions. The results of the water immersed samples have been reported in our previous work, and utilized in this work for the sake of analysis [1]. Based on Figure 9a, the desorption volume in the BG sample was 0.94 cc/g and 0.60 cc/g for the immersed and moist samples, respectively. The rate of desorption was also noticeably higher in the immersed than moisturized sample. A similar trend was noticed for the KH sample as shown in Figure 10a. Methane volume and rate desorbed from immersed into water sample (1.22 cc/g) was higher than that in the raw moisture sample (0.72 cc/g). We also noticed from Figure 10, that in both scenarios of the moisture and immersed samples, the methane recovered during desorption for the KH was higher than that for the BG, this could possibly be related to the higher affinity of the KH sample to adsorb hydrocarbons due to its higher organic content [4,12].
The results showed that the amount of desorbed/produced gas from the shale samples that were immersed in water was higher than the desorbed gas from the shale samples that were moisturized. In other words, the amount of gas produced increased with the quantity of water present in the two shale samples. These findings are in-line with field experiences that have shown a higher gas production rate from shale gas reservoirs when a higher volume of fracking water was lost into shales [19,23]. Although a few possible mechanisms have been suggested, the working mechanisms of this observation is not fully understood. The possible mechanisms include strong capillary force when the gas starts flowing, which redistributes the water within the rock. Without the capillary suction, the gas relative permeability would remain very low [22]. The high diffusion ability of fluids through the shale matrix could also contribute to free pore blockage in the main pathway of gas, which facilitates easier gas flow. In addition, micro-fracks might be induced due to water imbibition during the gas flow [51]. The free gas that was produced before the desorption process may have removed the blockage and provided an easier path for a higher volume of methane to desorb in the water immersion condition.

4. Conclusions

Since water is the major component of fracturing fluid which stimulates shale gas reservoirs, we conducted an experimental study to investigate the influence of water on the pore system and desorption in two Malaysian shale samples (BG and KH shales).
A preliminary characterization of mineralogy and total organic carbon (TOC) of the two subject shale samples was first carried out to correlate with the findings. It was observed from the XRD patterns that clay content was more dominant in the BG shale than in the KH shale. The TOC percentage in the KH sample was found to be 12.1 wt % when compared to only 2.1 wt % in the BG shale.
Brunauer-Emmett-Teller (BET) measurements and field scanning electronic microscopy (FE-SEM) were utilized to analyze the pore system and to decipher the implication of water on the pore system of the two shale samples. The findings revealed that the BG shale sample had a greater affinity than the KH sample towards water. This was presumably due to the higher clay content (hydrophilic) and lower TOC (hydrophobic) present in the BG shale as opposed to the KH shale which had a lower clay content and higher TOC. The difference in affinity towards water between the BG shale and KH shale correlated well with the implication of water on their pore systems. The impact of water on the pore system of the BG sample was more significant where its pore volume dropped by 65%. Less pronounced reduction (44%) in the pore volume was noticed in the KH sample.
The United States former Bureau of Mines (USBM) modified method measures the desorption under two conditions: shale samples that were immersed in water for two days, and moisturized samples which simulated the condition of initial water in the shale gas formations. The desorbed gas recovered for the water immersed samples was higher than the moist samples for both shale samples. These observations were in-line with the literature where water has been reported to create microfractures, hence establishing new sites for gas and increasing the gas capacity of shale.

Author Contributions

Conceptualization, A.A.-M. and S.R.J.; Methodology, A.A.-M. and H.A.; Software, A.A.-M., S.R.J. and H.A.; Validation, A.A.-M., S.R.J. and H.A.; Formal Analysis, S.R.J. and A.A.-M. .; Investigation, A.A.-M. and H.A.; Resources, A.A.-M., S.R.J. and H.A.; Data Curation, A.A.-M. and H.A.; Writing-Original Draft Preparation, A.A.-M.; Writing-Review & Editing, Ahmed S.R.J., H.A. and A.A.-M.; Visualization, A.A.-M., S.R.J. and H.A.; Supervision, S.R.J.; Project Administration, E.P.; Funding Acquisition, E.P.

Acknowledgments

The authors would like to acknowledge the PRF-fund, Shale Gas Group cost center: 0153AB-A33, for the financial support. We would also like to thank the Chemical Engineering Department at Universiti Teknologi PETRONAS for providing the facilities and the required training to conduct the experiments.

Conflicts of Interest

The authors declare no conflict of interest.

References

  1. Abdulelah, H.; Mahmood, S.M.; Al-Mutarreb, A. The Effect of Anionic Surfactant on The Wettability of Shale and its Implication on Gas Adsorption/Desorption Behavior. Energy Fuels 2018, 32, 1423–1432. [Google Scholar] [CrossRef]
  2. Xu, M.; Dehghanpour, H. Advances in understanding wettability of gas shales. Energy Fuels 2014, 28, 4362–4375. [Google Scholar] [CrossRef]
  3. Newell, R.G.; Qian, Y.; Raimi, D. Global energy outlook 2015. Natl. Bureau Econ. Res. 2016. [Google Scholar] [CrossRef]
  4. Rezaee, R. Fundamentals of Gas Shale Reservoirs; John Wiley & Sons: Hoboken, NJ, USA, 2015. [Google Scholar]
  5. Kuila, U.; Prasad, M. Specific surface area and pore-size distribution in clays and shales. Geophys. Prospect. 2013, 61, 341–362. [Google Scholar] [CrossRef]
  6. Hao, F.; Zou, H.; Lu, Y. Mechanisms of shale gas storage: Implications for shale gas exploration in China. AAPG Bull. 2013, 97, 1325–1346. [Google Scholar] [CrossRef]
  7. Lu, X.-C.; Li, F.-C.; Watson, A.T. Adsorption measurements in Devonian shales. Fuel 1995, 74, 599–603. [Google Scholar] [CrossRef]
  8. Das, M.; Jonk, R.; Schelble, R. Effect of multicomponent adsorption/desorption behavior on Gas-In-Place (GIP) and Estimated Ultimate Recovery (EUR) in shale gas systems. In Proceedings of the SPE Annual Technical Conference and Exhibition, San Antonio, TX, USA, 8–10 October 2012. [Google Scholar]
  9. Heller, R.; Zoback, M. Adsorption of methane and carbon dioxide on gas shale and pure mineral samples. J. Unconv. Oil Gas Resour. 2014, 8, 14–24. [Google Scholar] [CrossRef]
  10. Ross, D.J.; Bustin, R.M. The importance of shale composition and pore structure upon gas storage potential of shale gas reservoirs. Mar. Pet. Geol. 2009, 26, 916–927. [Google Scholar] [CrossRef]
  11. Chalmers, G.R.; Bustin, R.M. The organic matter distribution and methane capacity of the Lower Cretaceous strata of Northeastern British Columbia, Canada. Int. J. Coal Geol. 2007, 70, 223–239. [Google Scholar] [CrossRef]
  12. Zhang, T.; Ellis, G.S.; Ruppel, S.C.; Milliken, K.; Yang, R. Effect of organic-matter type and thermal maturity on methane adsorption in shale-gas systems. Org. Geochem. 2012, 47, 120–131. [Google Scholar] [CrossRef]
  13. Merkel, A.; Fink, R.; Littke, R. The role of pre-adsorbed water on methane sorption capacity of Bossier and Haynesville shales. Int. J. Coal Geol. 2015, 147, 1–8. [Google Scholar] [CrossRef]
  14. Li, J.; Li, X.; Wang, X.; Li, Y.; Wu, K.; Shi, J.; Yang, L.; Feng, D.; Zhang, T.; Yu, P. Water distribution characteristic and effect on methane adsorption capacity in shale clay. Int. J. Coal Geol. 2016, 159, 135–154. [Google Scholar] [CrossRef]
  15. Wang, L.; Yu, Q. The effect of moisture on the methane adsorption capacity of shales: A study case in the eastern Qaidam Basin in China. J. Hydrol. 2016, 542, 487–505. [Google Scholar] [CrossRef]
  16. Jin, Z.; Firoozabadi, A. Effect of water on methane and carbon dioxide sorption in clay minerals by Monte Carlo simulations. Fluid Phase Equilib. 2014, 382, 10–20. [Google Scholar] [CrossRef]
  17. Schlumberger. Available online: https://www.slb.com/~/media/Files/stimulation/product_sheets/unconventionalgas/openfrac_ps.pdf (accessed on 23 December 2010).
  18. Singh, H. A critical review of water uptake by shales. J. Nat. Gas Sci. Eng. 2016, 34, 751–766. [Google Scholar] [CrossRef] [Green Version]
  19. Cheng, Y. Impact of water dynamics in fractures on the performance of hydraulically fractured wells in gas-shale reservoirs. J. Can. Pet. Technol. 2012, 51, 143–151. [Google Scholar] [CrossRef]
  20. Bennion, D.B.; Bietz, R.F.; Thomas, F.B.; Cimolai, M.P. Reductions in the productivity of oil and low permeability gas reservoirs due to aqueous phase trapping. J. Can. Pet. Technol. 1994, 33. [Google Scholar] [CrossRef]
  21. Mahadevan, J.; Sharma, M.M. Factors affecting clean-up of water-blocks: A laboratory investigation. Spe J. 2005, 10, 238–246. [Google Scholar] [CrossRef]
  22. Le, D.H.; Hoang, H.N.; Mahadevan, J. Gas recovery from tight sands: Impact of capillarity. Spe J. 2012, 17, 981–991. [Google Scholar] [CrossRef]
  23. Fan, L.; Thompson, J.W.; Robinson, J.R. Understanding gas production mechanism and effectiveness of well stimulation in the Haynesville Shale through reservoir simulation. In Proceedings of the Canadian Unconventional Resources and International Petroleum Conference, Calgary, AB, Canada, 19–21 October 2010. [Google Scholar]
  24. Baioumy, H.; Ulfa, Y.; Nawawi, M.; Padmanabhan, E.; Anuar, M.N.A. Mineralogy and geochemistry of Palaeozoic black shales from Peninsular Malaysia: Implications for their origin and maturation. Int. J. Coal Geol. 2016, 165, 90–105. [Google Scholar] [CrossRef]
  25. Chen, S.; Han, Y.; Fu, C.; Zhu, Y.; Zuo, Z. Micro and nano-size pores of clay minerals in shale reservoirs: Implication for the accumulation of shale gas. Sediment. Geol. 2016, 342, 180–190. [Google Scholar] [CrossRef]
  26. Mavor, M.; Owen, L.; Pratt, T. Measurement and evaluation of coal sorption isotherm data. In Proceedings of the SPE Annual Technical Conference and Exhibition, New Orleans, LA, USA, 23–26 September 1990. [Google Scholar]
  27. Rouquerol, J.; Avnir, D.; Fairbridge, C.; Everett, D.; Haynes, J.; Pernicone, N.; Ramsay, J.D.F.; Sing, K.S.W.; Unger, K.K. Recommendations for the characterization of porous solids (Technical Report). Pure Appl. Chem. 1994, 66, 1739–1758. [Google Scholar] [CrossRef] [Green Version]
  28. Chalmers, G.R.; Bustin, R.M.; Power, I.M. Characterization of gas shale pore systems by porosimetry, pycnometry, surface area, and field emission scanning electron microscopy/transmission electron microscopy image analyses: Examples from the Barnett, Woodford, Haynesville, Marcellus, and Doig units. AAPG Bull. 2012, 96, 1099–1119. [Google Scholar]
  29. Barrett, E.P.; Joyner, L.G.; Halenda, P.P. The determination of pore volume and area distributions in porous substances. I. Computations from nitrogen isotherms. J. Am. Chem. Soc. 1951, 73, 373–380. [Google Scholar] [CrossRef]
  30. Brunauer, S.; Emmett, P.H.; Teller, E. Adsorption of gases in multimolecular layers. J. Am. Chem. Soc. 1938, 60, 309–319. [Google Scholar] [CrossRef]
  31. Jarvie, D.M. Total Organic Carbon (TOC) Analysis: Chapter 11: Geochemical Methods and Exploration; American Association of Petroleum Geologists: Tulsa, OK, USA, 1991. [Google Scholar]
  32. Xu, G.; Gao, Y.; Dong, S.; Wang, D. GB/T 19145-2003, Determination of Total Organic Carbon in Sedimentary Rock; Standards Press of China: Beijing, China, 2003. [Google Scholar]
  33. McMurdie, H.F.; Morris, M.C.; Evans, E.H.; Paretzkin, B.; Wong-Ng, W.; Ettlinger, L.; Hubbard, C.R. Standard X-ray diffraction powder patterns from the JCPDS research associateship. Powder Diffr. 1986, 1, 64–77. [Google Scholar] [CrossRef]
  34. Zektser, I.S.; Marker, B.; Ridgway, J.; Rogachevskaya, L.; Vartanyan, G. Geology and Ecosystems; Springer Science & Business Media: Berlin, Germany, 2007. [Google Scholar]
  35. Tuttle, M.L.; Breit, G.N. Weathering of the New Albany Shale, Kentucky, USA: I. Weathering zones defined by mineralogy and major-element composition. Appl. Geochem. 2009, 24, 1549–1564. [Google Scholar] [CrossRef]
  36. Dosen, A. Mineralogical Analysis of Upper Devonian Black Shales in Western New York; Geological Society of America Abstracts with Programs: New York, NY, USA, 2005. [Google Scholar]
  37. Eberl, D. User Guide to RockJock—A Program for Determining Quantitative Mineralogy from X-Ray Diffraction Data; US Geological Survey: Reston, VA, USA, 2003.
  38. Tang, X.; Jiang, Z.; Jiang, S.; Cheng, L.; Zhang, Y. Characteristics and origin of in-situ gas desorption of the Cambrian Shuijingtuo Formation shale gas reservoir in the Sichuan Basin, China. Fuel 2017, 187, 285–295. [Google Scholar] [CrossRef]
  39. Mingqing, Y.; Jie, L.; Shoumai, R.; Zijian, H.; Fanyang, M.; Fei, W.; Guangyu, S. Application of rock desorbed gas determinator in shale gas exploration. China Pet. Explor. 2016, 21, 120–124. [Google Scholar]
  40. Matta, J.E.; LaScola, J.C.; Kissell, F.N. Methane Absorption in Oil Shale and Its Potential Mine Hazard; United States Department of Interior, Bureau of Mines: Washington D.C., WA, USA, 1977.
  41. Jinchuan, Z. Favorable Zone Optimization Standard of Shale Gas. In Proceedings of the Guizhou: Symposium on Investigation and Evaluation of National Shale Gas Resources Potential and Favorable Zone Optimization. Guizhou, China. 2011. Available online: http://www.mlr.gov.cn/xwdt/jrxw/201203/t20120302_1069466.htm (accessed on 8 June 2018).
  42. Shuangfang, L.; Huang, W.; Chen, F.; Li, J.; Wang, M.; Xue, H.; Wang, W.; Cai, X. Classification and evaluation criteria of shale oil and gas resources: Discussion and application. Pet. Explor. Dev. 2012, 39, 268–276. [Google Scholar]
  43. Passey, Q.R.; Bohacs, K.; Esch, W.L.; Klimentidis, R.; Sinha, S. From oil-prone source rock to gas-producing shale reservoir-geologic and petrophysical characterization of unconventional shale gas reservoirs. In Proceedings of the International oil and Gas Conference and Exhibition in China, Beijing, China, 8–10 June 2010. [Google Scholar]
  44. Lan, Q.; Dehghanpour, H.; Wood, J.; Sanei, H. Wettability of the Montney tight gas formation. SPE Reserv. Eval. Eng. 2015, 18, 417–431. [Google Scholar] [CrossRef]
  45. Zolfaghari, A.; Dehghanpour, H. Pore size distribution from water adsorption isotherm. In Proceedings of the SPE Annual Technical Conference and Exhibition, Houston, TX, USA, 28–30 September 2015. [Google Scholar]
  46. Zolfaghari, A.; Dehghanpour, H.; Holyk, J. Water sorption behaviour of gas shales: I. Role of clays. Int. J. Coal Geol. 2017, 179, 130–138. [Google Scholar] [CrossRef]
  47. Prinz, D.; Littke, R. Development of the micro-and ultramicroporous structure of coals with rank as deduced from the accessibility to water. Fuel 2005, 84, 1645–1652. [Google Scholar] [CrossRef]
  48. Firouzi, M.; Rupp, E.C.; Liu, C.W.; Wilcox, J. Molecular simulation and experimental characterization of the nanoporous structures of coal and gas shale. Int. J. Coal Geol. 2014, 121, 123–128. [Google Scholar] [CrossRef]
  49. Yassin, M.R.; Begum, M.; Dehghanpour, H. Organic shale wettability and its relationship to other petrophysical properties: A Duvernay case study. Int. J. Coal Geol. 2017, 169, 74–91. [Google Scholar] [CrossRef]
  50. Chenevert, M.E. Shale alteration by water adsorption. J. Pet. Technol. 1970, 22, 1141–1148. [Google Scholar] [CrossRef]
  51. Shen, Y.; Ge, H.; Li, C.; Yang, X.; Ren, K.; Yang, Z.; Su, S. Water imbibition of shale and its potential influence on shale gas recovery—A comparative study of marine and continental shale formations. J. Nat. Gas Sci. Eng. 2016, 35, 1121–1128. [Google Scholar] [CrossRef]
Figure 1. Experimental set-up for the desorption measurement, the labeled components: (1) methane gas cylinder, (2) adsorption cell, (3) 1000 mL inverted graduated tube, (4) water container, (5) thermostat, (6) controlling valves, (7) pressure gauge, and (8) computer.
Energies 11 01511 g001
Figure 2. Total organic carbon content for the shale samples.
Energies 11 01511 g002
Figure 3. XRD pattern 2theta vs. intensity: (a) BG sample XRD pattern shows the content of several peaks of clays and quartz; (b) KH sample XRD pattern shows the peaks of quartz calcite and some clays.
Energies 11 01511 g003
Figure 4. Water uptake results for the samples.
Energies 11 01511 g004
Figure 5. Pore size distribution defined by differential pore volume by low pressure gas N2 adsorption analysis. (a) BG sample; (b) KH sample.
Energies 11 01511 g005
Figure 6. Pore size distribution defined by differential pore volume by low pressure gas N2 adsorption analysis. (a) Moisture case; (b) Immersed water case.
Energies 11 01511 g006
Figure 7. FE-SEM images of the KH shale sample. (a) KH untreated sample at 5K magnification shows several macropores clays and quartz; (b) KH untreated sample at 10K magnification shows interparticle macropores and confirms the presence of kspar, quartz, and clay; (c) KH treated sample by water immersion for two days at 3K magnification shows the water block effect on the pores and physical properties in the changes of shales, only a few macropores remained unblocked; (d) KH treated sample under water immersion at 10K magnification showed totally blocked macropores and only a few remained unblocked.
Energies 11 01511 g007aEnergies 11 01511 g007b
Figure 8. FE-SEM images of BG shale sample. (a) BG untreated sample at 10K magnification shows several macropores clays layers and quartz; (b) BG untreated shale sample at 30K magnification shows interparticle and intraparticle pores mesopores and confirmed the presence of clay layers; (c) BG water immersed sample at 5K magnification showed a water block effect on pores and change in the physical properties of shales, some interparticle macropores remained unblocked; (d) BG treated sample at 10K magnification showed blocked macropores and a few remained unblocked.
Energies 11 01511 g008
Figure 9. Desorbed gas rate and volume (cc/g) versus (min0.5). (a) BG shale sample; (b) KH shale sample.
Energies 11 01511 g009
Figure 10. Desorbed gas rate and volume (cc/g) versus (min0.5). (a) immersed case; (b) moist case.
Energies 11 01511 g010
Table 1. Sample ID and coordinates.
Sample IDLongitudeLatitudeFormation
BG101°0′7.32″4°47′36.27″Batu Gajah
KH05°36′50″101°01′ 49″Kroh
Table 2. Quantitative XRD results.
Sample IDNon-clay Minerals (wt %)Clay Minerals (wt %)
QuartzKpsarClaciteTotal (%)KaoliniteSmectiteIlliteChloriteMuscoviteBiotiteDickiteTotal (%)
BG29.312.81.343.46.312.723.159.30.1NA56.6
KH667.20.874.52.89.79.71.9NA0.90.525.5
Table 3. Comparative pore system parameters of the raw moisture and water immersed samples.
Sample IDSSA BET m²/gReduction in SSA %Pore Volume BJH cm3/gReduction in Pore Volume %Avg. Pore Diameter nmIncrease in Pore Diameter Size %
BG-immersed0.794588.340.00901164.8329.89695.76
BG-raw moisture6.81470.02562515.271
KH-immersed2.946859.630.01644944.1219.85154.41
KH-raw moisture7.29990.02944112.856
SSA: Specific surface area; BET: Brunauer-Emmett-Teller; and BJH: Barrett-Joyner-Halenda.

