Article

Feasibility Study of Self-Sufficient Solar Cooling Façade Applications in Different Warm Regions

1
Façade Research Group, Department of Architectural, Faculty of Architecture and the Built Environment, Engineering + Technology, Delft University of Technology, Julianalaan 134, 2628BL Delft, The Netherlands
2
Department of Architecture, Technical University of Munich, Arcisstraße 21, 80333 Munich, Germany
*
Author to whom correspondence should be addressed.
Energies 2018, 11(6), 1475; https://doi.org/10.3390/en11061475
Submission received: 18 May 2018 / Revised: 2 June 2018 / Accepted: 4 June 2018 / Published: 6 June 2018
(This article belongs to the Special Issue Building renewable energy and thermal energy storage system 2018)

Abstract

:
Small-scale systems and integrated concepts are currently being explored to promote the widespread application of solar cooling technologies in buildings. This article seeks to expand application possibilities by exploring the feasibility of solar cooling integrated façades, as decentralized self-sufficient cooling modules on different warm regions. The climate feasibility of solar electric and solar thermal concepts is evaluated based on solar availability and local cooling demands to be met by current technical possibilities. Numerical calculations are employed for the evaluation, considering statistical climate data; cooling demands per orientation from several simulated scenarios; and state-of-the-art efficiency values of solar cooling technologies, from the specialized literature. The main results show that, in general, warm-dry climates and east/west orientations are better suited for solar cooling façade applications, compared to humid regions and north/south orientations. Results from the base scenario show promising potential for solar thermal technologies, reaching a theoretical solar fraction of 100% in several cases. Application possibilities expand when higher solar array area and lower tilt angle on panels are considered, but these imply aesthetical and constructional constraints for façade design. Finally, recommendations are drafted considering prospects for the exploration of suitable technologies for each location, and façade design considerations for the optimization of the solar input per orientation.

1. Introduction

Solar cooling technologies have gained increasing attention in the last decades, being explored as potential alternatives to conventional systems, in order to cope with rising cooling requirements in the built environment [1,2]. Global cooling demands are growing due to several factors, such as higher standards of living, temperature in the urban environment, and climate change [3], so there is a pressing need for environmentally friendly technologies, driven by renewable energy sources. Solar cooling technologies are driven by solar radiation, throughout thermal or electric processes, using no refrigerants, or working materials with low global warming potential [4,5]. Common vapour-compression systems commercially available are highly efficient, compared to current solar cooling systems, but rely on the use of hydrofluorocarbons (HFCs), with global warming potential 1430 times that of CO2 [6]. Thus, even though they could be driven by solar-generated electricity, they are not considered within the range of environmentally friendly alternatives addressed under solar cooling systems.
These systems have been researched and developed, mostly focusing on their performance, but their application in the built environment remains mostly limited to large demonstration projects and pilot experiences [7]. In that regard, several small-scale designs and prototypes are being developed by researchers, in order to promote widespread architectural application of these technologies in buildings, under the concept of solar cooling façades [5]. These integrated concepts seize the economic and functional benefits derived from the integration of decentralised components in the façade, while using the available exposed area for direct and diffuse solar collection. Economic benefits from façade integration refer to the construction cost savings and extra leasable space from avoiding complex distribution systems and large equipment [8,9], and functional advantages range from efficient energy usage by identifying local demands, to increased comfort due to personal control [10]. On the other hand, the façade not only comprises available external surface, but also directly influences indoor comfort. In warm climates, peak solar irradiance in façades usually match peak cooling demands in the adjacent offices, so it makes sense to harvest that radiation to drive a cooling system, while blocking solar heat gains under a climate responsive façade design.
Solar cooling façade concepts found in the literature are based either on solar electric processes, using thermoelectric modules [11,12], or solar thermal processes, integrating sorption [13,14] or desiccant cooling [15] technologies. Nonetheless, although they are regarded as relevant experiences, pushing current technical boundaries; they are standalone concepts or prototypes developed in a specific climate. This, on a best case scenario, allows for proof of concept under similar climatic conditions; but does not directly allow for replicability on other climates; nor give information about the overall suitability of said climate, for the development and application of particular solar cooling technologies in the first place.
In broad terms, the application of a decentralised solar cooling system depends on two main factors, heavily dependent of the climate context where the system operates: (a) solar availability; and (b) cooling demands. The solar availability determines the potential energy input of the system, which, combined with the overall efficiency of the particular cooling process, provides the theoretical cooling output of the unit. While the efficiency of the process is given by the technical maturity and operational limits of the equipment associated with a cooling principle, solar availability depends on façade orientation, relative position to the equator, and climate conditions of any given location. On the other hand, cooling demands largely depend on the climate, and secondarily on the design of the building and, particularly, its façade. Thus, cooling requirements may be greatly reduced under a climate-responsive design through the application of passive strategies. Whilst solar availability is beneficial for power and heat generation, passive cooling design strategies aim to protect the interior space from solar radiation and dissipate heat generated indoors, thus avoiding overheating.
This paper explores the potential for the application of solar cooling integrated façades, as decentralised self-sustaining cooling modules, on different climate contexts, based on solar availability and cooling requirements to be met by current technical possibilities. The climate feasibility of the integrated concepts is assessed throughout numerical calculations based on climate data and building scenarios simulated with specialised software. Technical issues to solve associated to each addressed technology are out of the scope of the present document. Hence, the evaluation focuses on identifying the climate suitability for selected solar cooling technologies, while assessing certain façade design parameters and their impact on the overall feasibility, discussing broad possibilities and constraints for the design of façade concepts for different locations and orientations.

2. Strategy and Methods: Experimental Setup and Parameters Involved in the Assessment

The paper evaluates the application feasibility of self-sustaining solar cooling façade modules on office or commercial buildings. It focuses on the current performance of selected solar cooling technologies, and their potential to cope with indoor cooling demands by themselves, hence, without the need for complementary building services. Therefore, the main unit for the analysis is the daily solar fraction of the system (SF), theoretically calculated according to Equation (1). COOLreq refers to the cooling demands of a specific interior space, while SCOOLout refers to the ‘cooling effect’ delivered indoors by the solar cooling system. Thus, a solar fraction of 100% or more means that the system is capable of handling the cooling demands of a given space by itself, provided that all evaluating parameters and conditions are met in reality. The assessment will consider then, the solar availability and cooling demands for a representative summer day as a simplified basis for the evaluation:
S F = S C O O L o u t C O O L r e q
Both the cooling demands and the cooling output of the system highly depend on the climate context, especially on temperature distribution and availability of solar radiation at any given location. Thus, the analysis is conducted in six different locations, representing several warm climate zones across the northern hemisphere. Table 1 shows the selected cities, along with the Koppen–Geiger climate zones they represent and the severity of the climate in terms of cooling degree days (CDD). The analysis considers three warm, dry and three warm, humid locations, each with one example of an extreme climate and two temperate climates of different severity, to account for a wide range of climatic scenarios.

2.1. Cooling Requirements (COOLreq) and Base Case for the Evaluation

Cooling demands were obtained though the dynamic energy simulation software DesignBuilder v4.7 (DesignBuilder Software Ltd, Gloucestershire, UK), as the graphical interface of EnergyPlus v8.3 [16]. The base case used for the assessment is a single office room of 16 m2, considered adiabatic for the purpose of the evaluation. The assessment was carried out for all orientations, with the simulation parameters depicted in Table 2. Passive design strategies, such as a reduced window-to-wall ratio, the application of sun shading, solar control glazing, and the use of ventilation for cooling purposes are judged as a necessary step to decrease cooling demands, before integrating active systems into the building envelope. The parameters defined for the simulation were derived from an earlier work on the subject [17], resulting in virtually similar base cases for all climate zones, with the only exemption being the restriction of ventilation for solely hygienic purposes in Singapore and Hong Kong, following the most favourable design solutions per climate zone.
The cooling demands for all scenarios are shown in Table 3. It is important to point out that these serve as a reference for the assessment at hand and do not claim to be fully passively optimised scenarios. Hence, while they consider important cooling savings compared to a scenario with no strategies, they could probably reach further savings under a thorough design optimisation process. Several results were obtained from the simulations. Firstly, yearly cooling demands per square meter are depicted as a reference of the overall performance of the office room under normalised units, for every orientation and selected location. Annual demands of a base case without any passive strategies (no solar control strategies, window-to-wall ratio of virtually 100%, and ventilation only for hygienic purposes) are shown in comparison to the improved base case used for the analysis as further evidence of the high impact of passive strategies on decreasing cooling loads.
The assessment considers daily cooling demands and solar availability as main input, so the average daily cooling demands were calculated for each orientation and location, based on their respective summer design week. This week consists of the most critical summer period and is defined by DesignBuilder based on the information on the weather file corresponding to each location. The average values shown above consider only the five working days of said week, when the cooling system is designed to operate. Similarly, the cooling design capacity is the highest resulting cooling load at a given amount of time, multiplied by a factor of 1.15 in order to provide a margin for sizing the cooling system. The summer design week was also considered to obtain the average solar irradiance per orientation at each selected location.

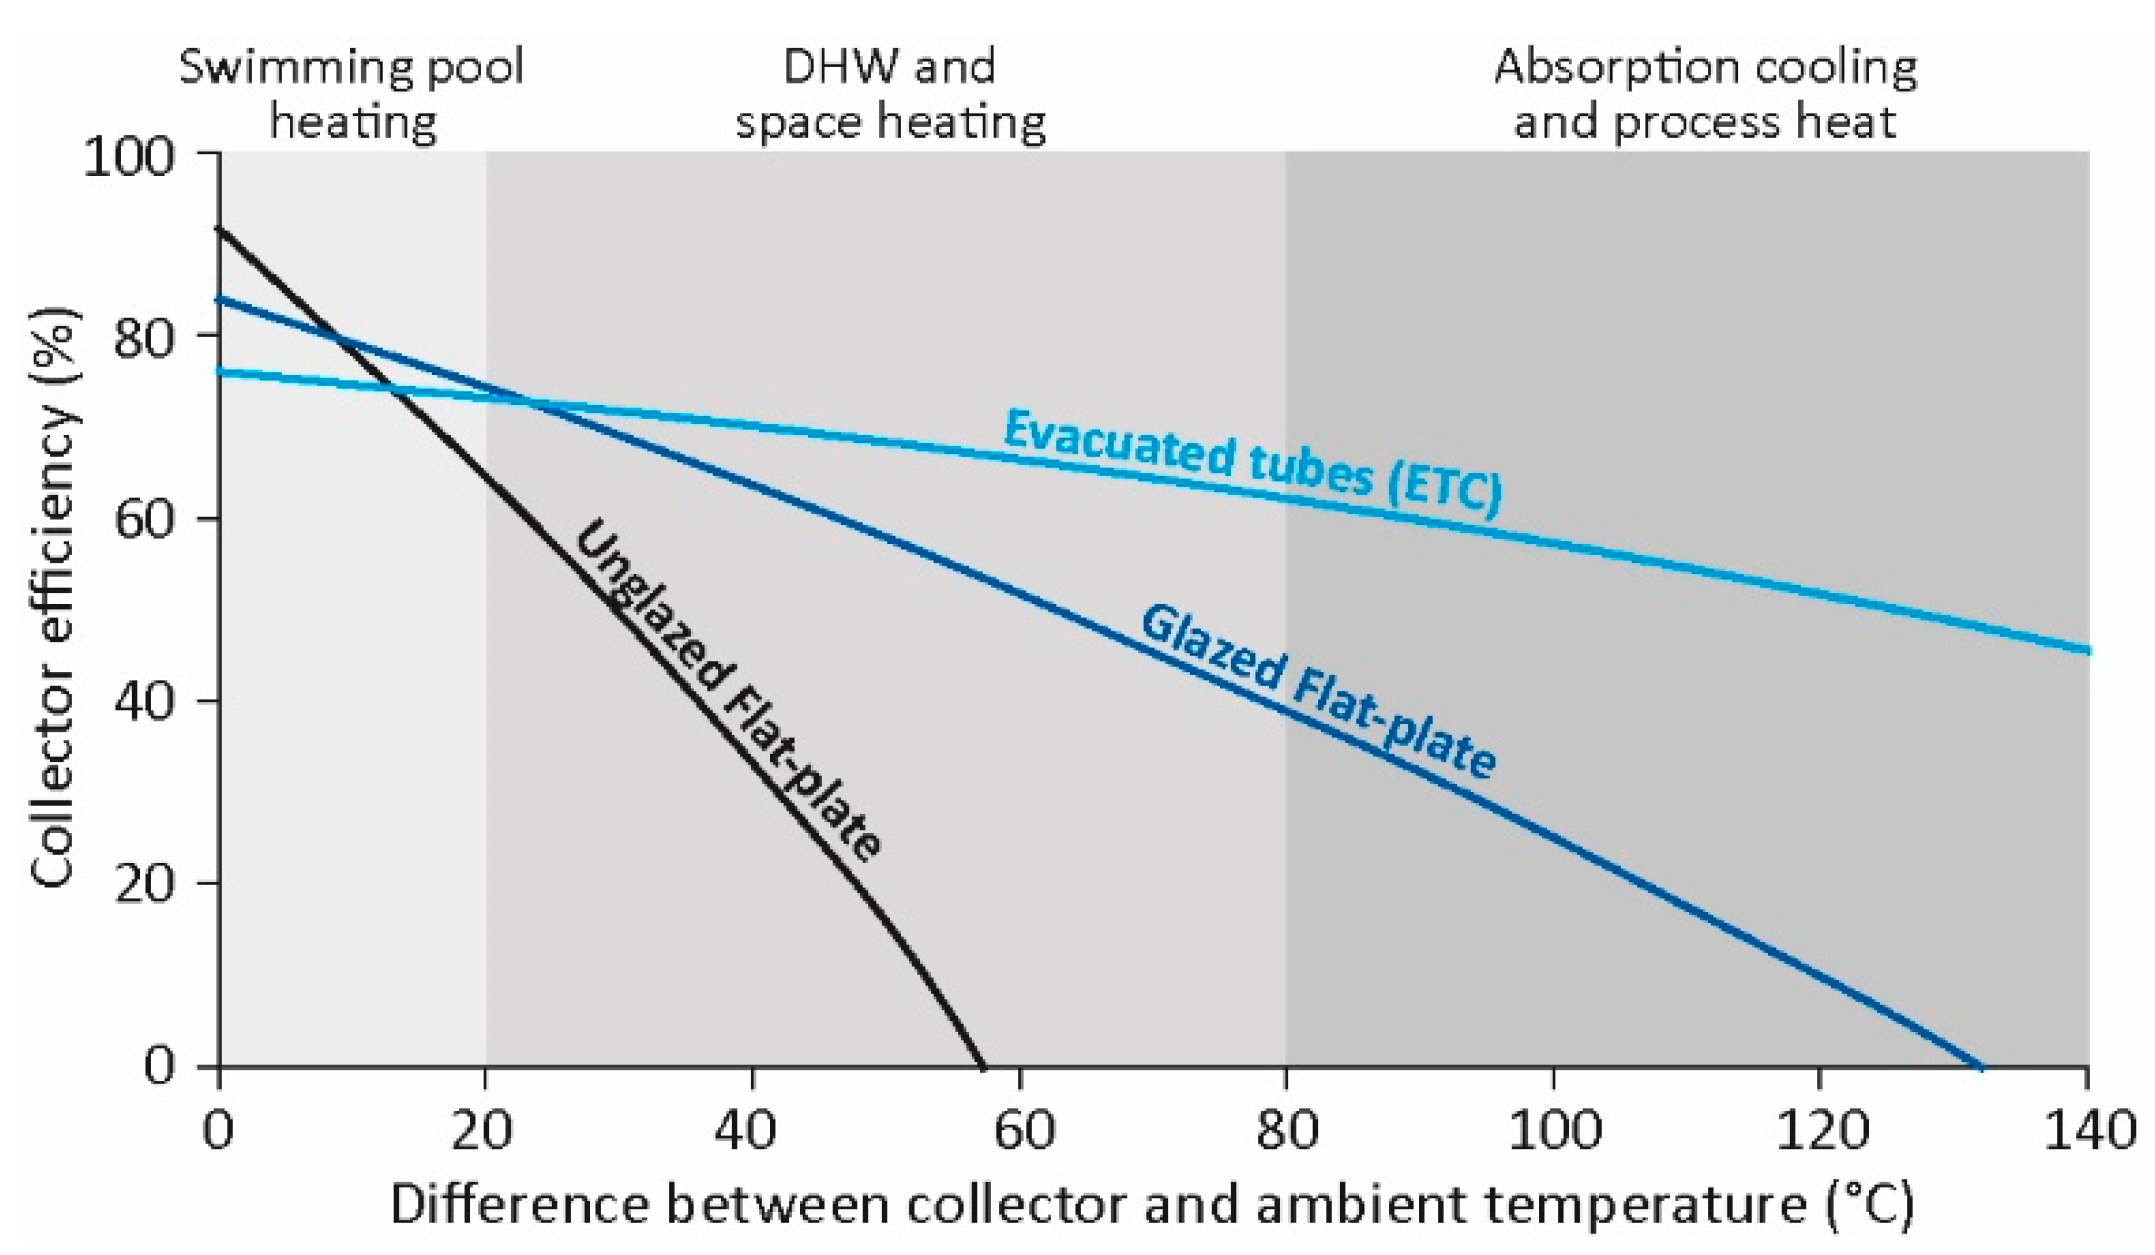
2.2. Solar Cooling Output (SCOOLout) and Boundary Conditions for the Assessment

The cooling output (heat removed by the solar cooling system) is theoretically calculated through the simplified equation below (Equation (2)), where SOLinput refers to the availability of solar radiation on a specific location/orientation, SOLarray refers to the area destined for collection, and COPsolarsys refers to the efficiency of the system implemented for said collection, either PV-panels or solar thermal collectors for electricity and heat, respectively. On the other hand, COPcoolsys refers to the coefficient of performance of the current solar cooling technologies and systems. This simplified equation does not consider transmission and parasitic losses, nor additional equipment, such as storage units, serving a comparative purpose between technical possibilities to assess the broad feasibility of self-sustaining solar cooling façades in different climate contexts. Hence, detailed calculations would be needed in order to delve into the required specifics in real life applications.
S C O O L o u t = S O L i n p u t × S O L a r r a y × C O P s o l a r s y s × C O P c o o l s y s
Daily solar irradiance values (SOLinput—kWh/m2 day) for all locations were obtained from the EnergyPlus weather files used for the cooling demand simulations, through System Advisor Model v.2017.9.5, a software developed by the National Renewable Energy Laboratory (NREL) of the US. Department of Energy [18]. Monthly average daily solar radiation was obtained for south, west, and east orientations, considering a 90° tilted plane as worst case scenario for solar collection on façades (vertical application). The values used for the assessment correspond to the months that contain the summer design week, as depicted in Table 4.
The base case for the assessment considers a solar array (SOLarray, in m2) that occupies 50% of the façade area, which equals 6.8 m2 in the defined office room. This area for solar collection may be used with PV panels or thermal collectors, to provide input for solar electric or thermal-driven cooling systems, respectively. For purposes of the assessment, this is represented by the coefficient of performance associated with each technology type (COPsolarsys). For photovoltaics, current performance values were obtained from the 8th edition of the International Technology Roadmap for Photovoltaic (ITRPV), developed by over 50 research institutions and companies in the field. Crystalline silicon modules largely dominate the market, with a share of about 90%, over thin film and organic PV cells, which also consider lower efficiencies. The stabilised efficiency values for (single and poly-crystalline) silicon solar cells are currently between 18.5% and 23%, considered for the assessment, with prospect ranges for 2027 of around 20–26% [19]. Current values also comply with the predictions stipulated at the last Technology Roadmap elaborated by the International Energy Agency [20], evidencing systematic and continuous technological improvements.
Regarding solar thermal collectors, their nominal efficiency follows the curves shown in Figure 1, being highly dependent of the temperature differential between ambient and working temperatures in the collector. For solar cooling applications, driving temperatures are in the range of 50–90 °C (desiccant), 65–90 °C (adsorption), and 80–110 °C (absorption) [21], resulting in a temperature differential range of approx. 20–80 °C considering a base ambient temperature of 30 °C. Using this range as a reference, resulting nominal efficiencies are around 40–75% and 60–75% for flat plate and evacuated tube collectors, respectively, according to the graph below [1]. On the other hand, experimental measurements of solar collectors coupled to solar cooling systems have shown slightly lower efficiencies in practice. For evacuated tube collectors (ETC), values around 55–60% have been consistently obtained [22,23], with peaks up to 78% [24]. In the case of flat plate collectors, there are cases with relatively high efficiencies, around 50–65% [25,26,27], and others with low reported values around 20–30% [28,29]. Considering all of the above, it was decided to use thermal efficiencies in the range of 55–65% for the purpose of the assessment.
The last parameter refers to the coefficient of performance of the solar cooling system (COPcoolsys). The solar cooling technologies considered in the assessment are depicted in Table 5, along with their generally-expected performance ranges, based on the specialised literature [2,21,30]. Additionally, efficiencies for solar cooling concepts and prototypes over 0.5 kW and under 5 kW are shown, based on an unpublished state-of-the-art review conducted by the authors [31]. The specific performance of these experiences is highly relevant due to the low capacities to be met by the façade integrated systems, ranging from 0.8 to 1.8 kW in the assessed scenarios. The highest registered values [24,32,33,34,35] are used as a reference of the current limits of the technology for small-scale applications but, evidently, further research is needed to ensure these values under real continuous operation.
Each coefficient of performance refers to the main energy input, so they correspond to the thermal and electrical efficiency for solar thermal and solar electric, respectively. In the case of thermoelectric cooling, space cooling application is in early R and D stages, so further developments are needed to come up with general COP values. Also, as mentioned before, these values account for the main cooling process, providing a simplified assessment without considering other types of energy to power up additional equipment, such as pumps for absorption heat pumps, or evaporative cooling units for desiccant systems. On the other hand, thermoelectric cooling is driven by direct current, so an inverter and the subsequent derived losses do not need to be considered in the calculations [5].
The assessment is carried out in two stages. Firstly, electrical and thermal solar fractions for all orientations and locations are shown and described, discussing the climate related application feasibility of the selected cooling technologies. Secondly, further optimisation of the results is carried out, exploring the impact on the solar fraction following higher exposed collector area, and a lower tilt angle on PV panels and thermal collectors. The discussion then will revolve around certain design constraints for façade integration, along with application possibilities in other climates not fully covered under the first assessed scenario.

3. Results and Discussion

3.1. Climate Feasibility for the Application of Solar Cooling Integrated Façades

As explained before, the first stage of the evaluation sought to explore the climatic potential of different locations for the application of solar cooling integrated façade concepts. Local solar availability and cooling demands were considered as the differentiating parameters between the addressed climate contexts for the evaluation. The results are depicted in graphs under Figure 2 and Figure 3 for warm, dry and warm, humid climates, respectively, are presented in terms of the resulting solar fraction (SF) compared to the coefficient of performance of any given solar cooling system (COPcoolsys). This allowed for the exploration of the local circumstances and climatic potential of all addressed locations, in general, before discussing the applicability of specific solar cooling systems. Furthermore, the graphs serve as charts to check how efficient a system should be in order to reach a solar fraction of 100% in the defined scenarios.
The graphs consider thermal COP and electric COP separately, based on the efficiencies of solar thermal collectors (STC) and photovoltaic panels (PV), respectively. Moreover, each one is depicted by two trend lines, representing the maximum and minimum efficiencies considered in the evaluation for STC (55–65%) and PV (18.5–23%). Consequentially, from a performance standpoint, solar electric cooling systems start with a disadvantage, needing higher COPs to account for the lesser efficiencies of PV panels compared to STCs.
Taking a general look at the results, there is a clear trend in favour of warm, dry climates, making them more generally suited for solar cooling applications. This is not surprising, considering the overall higher solar availability and relative lower cooling demands compared to humid climate contexts. Evidence of this is the fact that Lisbon comprises the best results in all orientations, while the worst results are reported in either Singapore or Hong Kong, due to less solar availability and the highest calculated cooling demands for the simulated scenario.
This fact is especially clear in west and east orientations, where an arrangement of best to worst results puts Lisbon, Athens, and Riyadh (warm, dry climates), ahead of Trieste, Hong Kong, and Singapore (warm, humid climates). Within each climate group, locations are also neatly arranged following the severity of the context, from mild to extremes. Hence, for these orientations, temperate climates are better suited for solar cooling façade applications than extreme climates, although extreme dry contexts (desert) are more suited than temperate, humid ones. In the case of south applications, locations between the equator and the Tropic of Cancer (Singapore, Hong Kong, and Riyadh) have the worst results, due to the severity of the climate and less solar radiation being harvested by a 90° tilted south-facing plane because of the high solar irradiance incidence angle. At the same time, Singapore has the second best results for north orientations (only after Lisbon), benefiting from direct irradiance on north-facing façades by being virtually at the equator.
Discussing the applicability potential on each specific context and orientation, four distinct trends were found in the evaluation of the six locations. In the cases of Riyadh and Hong Kong (a), results for east and west applications are the best, and very similar to each other. Then north applications, and finally south ones. This is explained by the low latitudes of these locations, as argued before. Secondly, in the cases of Athens and Trieste (b), east, south, and west applications have very close results, being virtually tied with a minor advantage for east façades, while north applications are markedly underwhelming in comparison.
Façade applications in Lisbon (c) favour an east orientation with a difference, steadily declining for west, south, and north (best to worst). Finally, Singapore (d) is regarded as a special case due to its particularities already discussed, showing the best results for north applications, with east/west following, and south far behind. Interestingly, with the sole exemption of Singapore, an east orientation seems to be the most suitable for the general application of façade-integrated solar cooling systems. This is explained by the good solar availability on a 90° tilted plane on both east and west orientations, plus the lower cooling demands on east-facing rooms, compared to west offices.
The next step after assessing the climatic and solar potential of each selected location, was to evaluate the feasibility of the application of self-sufficient solar cooling façade modules in their different orientations, based on reported performance values associated to currently available technologies. Based on the graphs above, Table 6 shows the COP values that a solar cooling system (COPcoolsys) should meet, in order to reach a solar fraction of 100% at every location and orientation. These values are calculated assuming maximum efficiencies for STC and PVs (65% and 23%, respectively), to draw the line at the minimum COPcoolsys required for every scenario.
The required minimum COPcoolsys values were then compared to the COP ranges registered in Table 5, for small-scale application of current solar cooling technologies. The cases that meet the calculated requirements for a solar fraction of 100% are highlighted in Table 6, showing the theoretical feasibility of solar electric or solar thermal integrated façade units, based on the assumed scenarios.
As mentioned before, discussing the performance limits, solar electric systems have a disadvantage due to the lower conversion efficiencies of PV panels compared to STCs. This is evident by looking at Table 6, showing that thermoelectric cooling technologies are only capable to meet the cooling requirements in an east-oriented room in Lisbon, while the required COP values in south and west orientations are above the 1.15 maximum reported for the technology. The lower efficiencies of PV panels demand very high efficiencies from the solar cooling system to compensate in most locations. This drawback remains even considering the hypothetical use of vapour compression cooling systems coupled to PV panels for energy input, with markedly higher COP compared to thermoelectric cooling units. Nominal energy efficiency ratios (EER) of commercial small residential units are around values of 12–13, which translate to electric COP values of 3.5–3.8 [36], or 3.15–3.4 for the entire system considering an inverter (90% efficiency) to change the current from DC to AC for the operation of the cooling unit. These COP values mean that small-scale vapour compression heat pumps could deliver sufficient cooling in all orientations for Lisbon and Trieste; west and east in Riyadh; west, east, and south in Athens; and only north in Singapore (bold without background colour in Table 6). This shows that even the most efficient cooling technology currently available in the market cannot meet cooling demands in challenging climates by means of purely solar energy input. Hence, besides on-going explorations in the field of thermoelectrics, further development of PV technologies is needed in order to promote general solar electric façade integrated concepts.
On the other hand, thermal technologies have higher potential for application, judged solely by their reported efficiencies. Firstly, adsorption cooling systems, with maximum reported COP values around 0.65, only seem to cope with cooling requirements in south, east, and west orientations in Lisbon, being the most constrained solar thermal technology. Nonetheless, the maximum thermal COP around 0.8 reported for small-scale absorption heat pumps would be enough to back their application in south, west, and east orientations in Trieste and Athens, east/west orientations in Riyadh, and all orientations in Lisbon. Finally, desiccant cooling technologies (solid and liquid), with higher reported COP values up to 1.25, may also meet the cooling demands of north-facing rooms in Singapore and Trieste, besides being close to the required COP for east and west orientations in Hong Kong. It is worth mentioning that the orientations and locations where the cooling demands are potentially covered entirely by solar thermal systems, are the same cases that could be potentially covered with integrated small-scale vapour compression heat pumps. Hence, even though the latter technologies have higher COP values, regarded as more efficient, solar thermal systems may potentially achieve the same goal, through environmentally friendly cooling processes with low global warming potential (GWP) refrigerants.

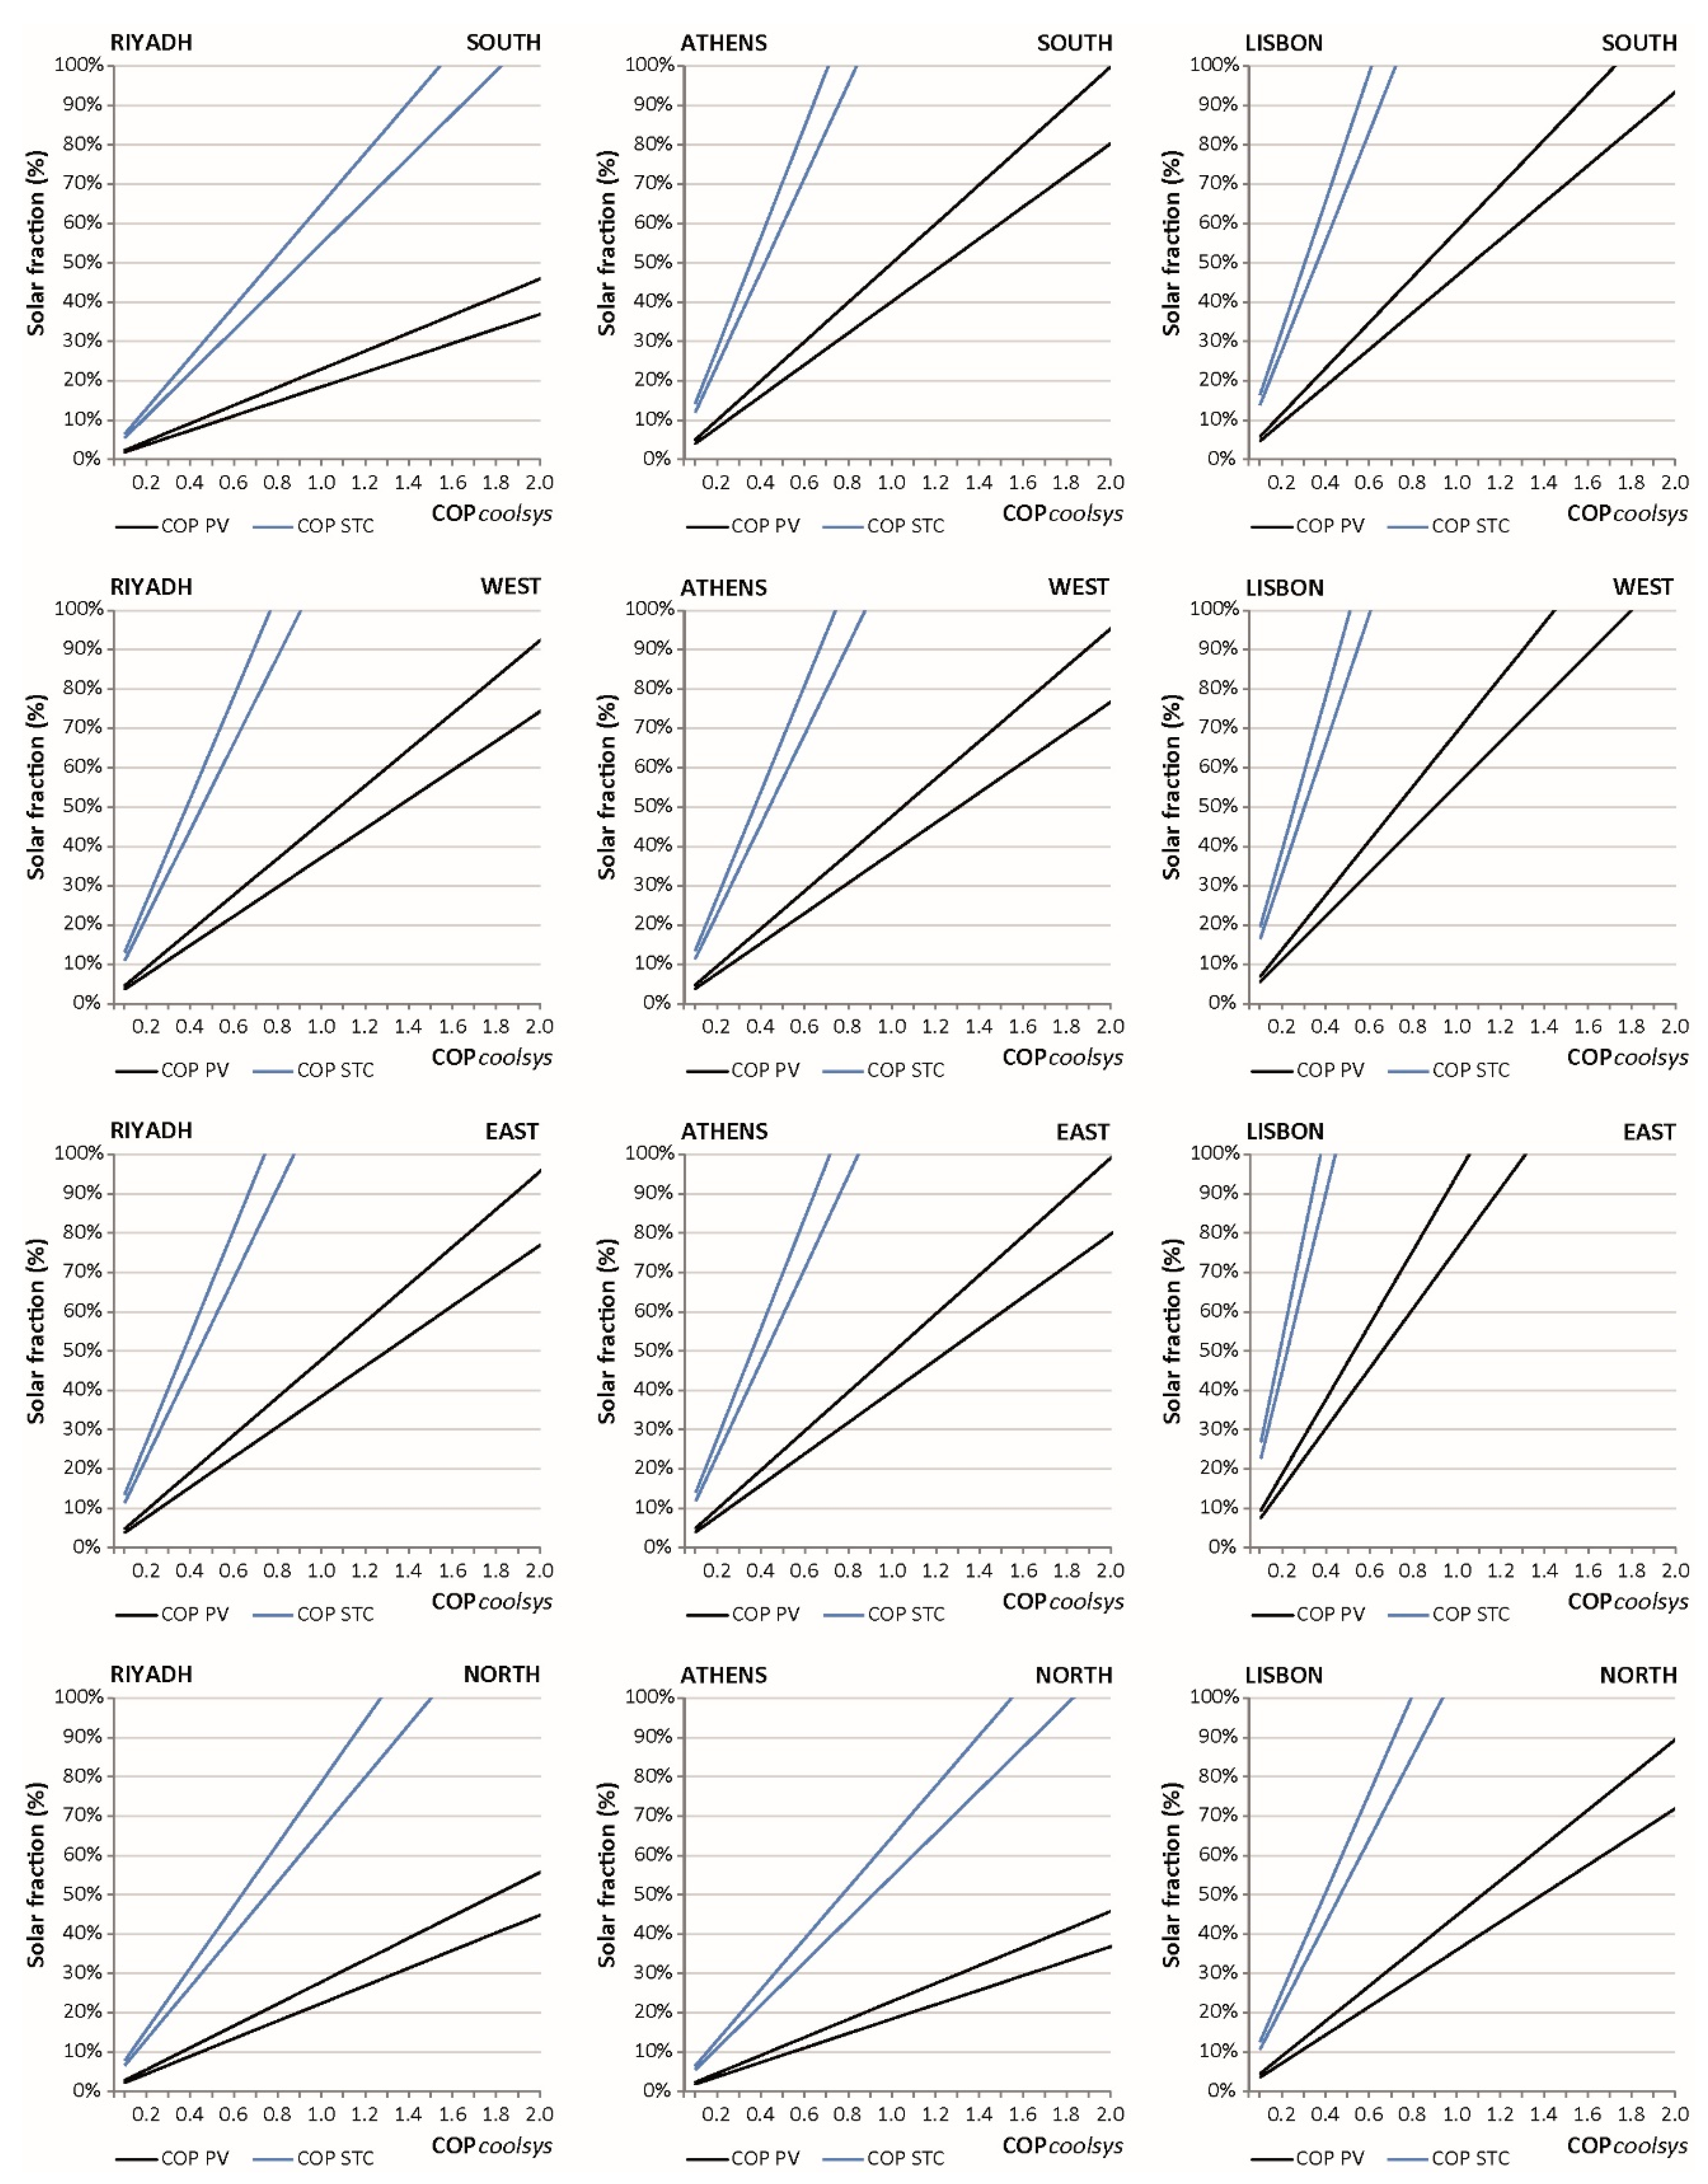
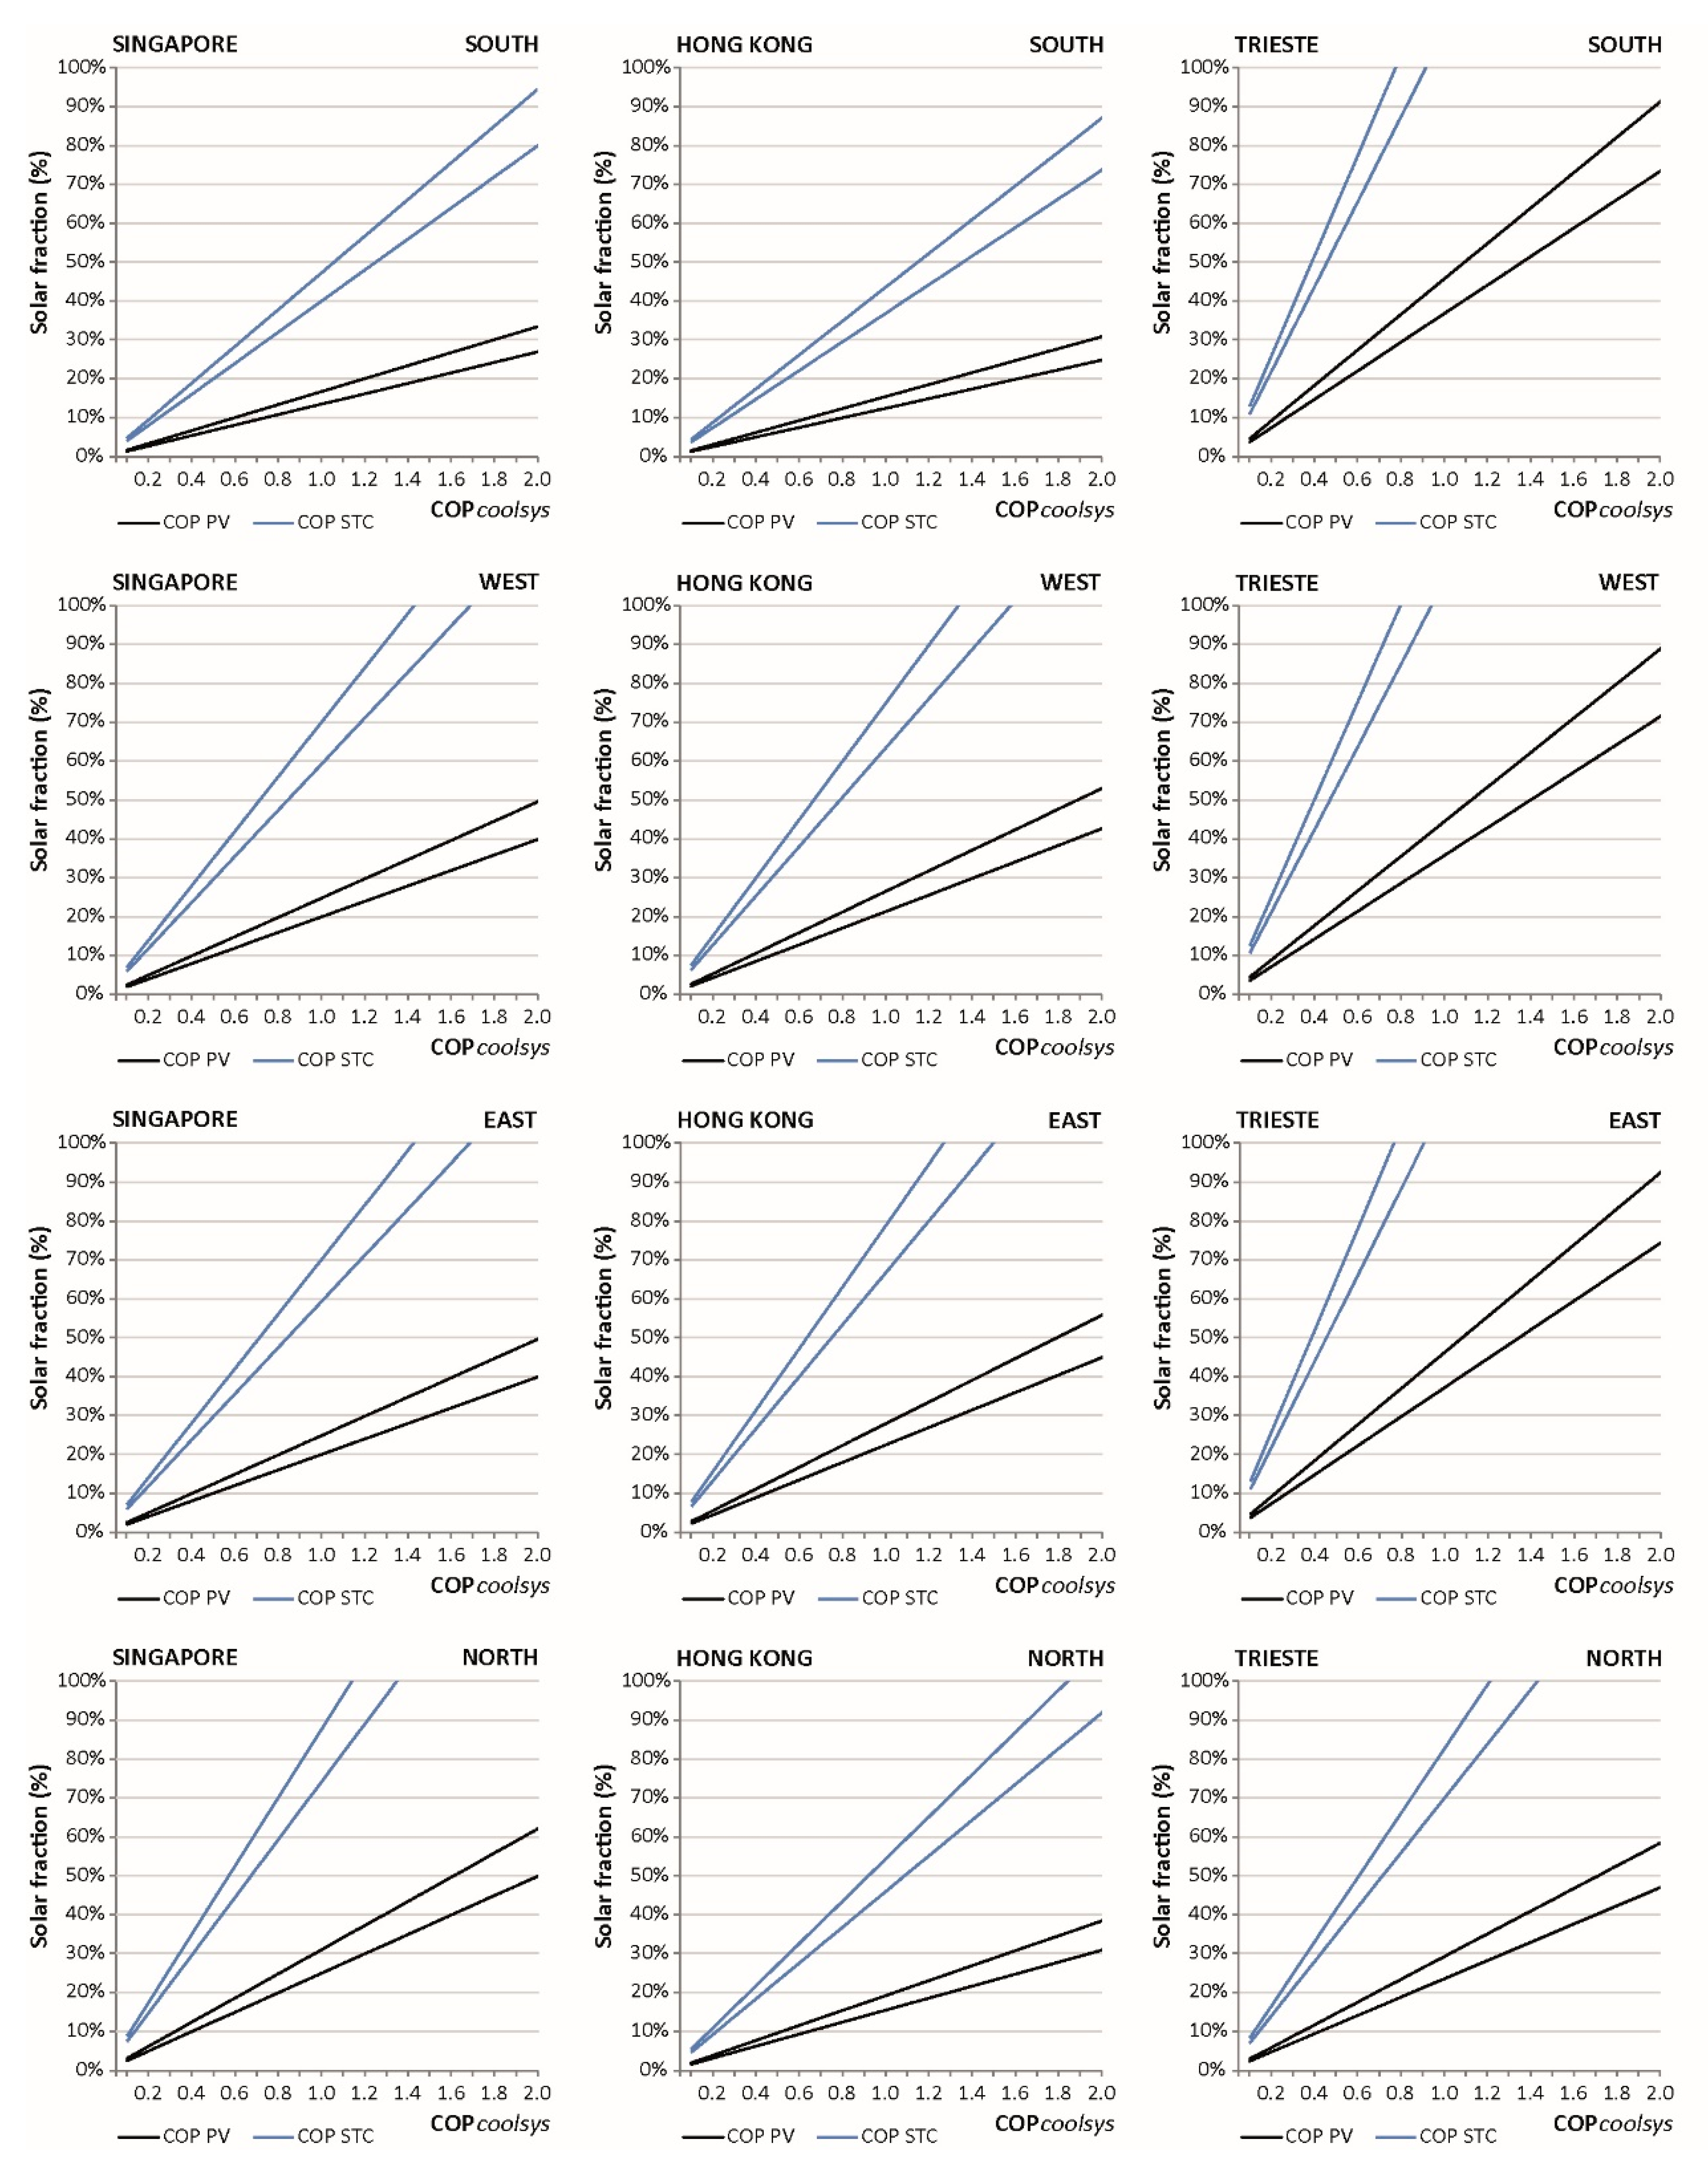
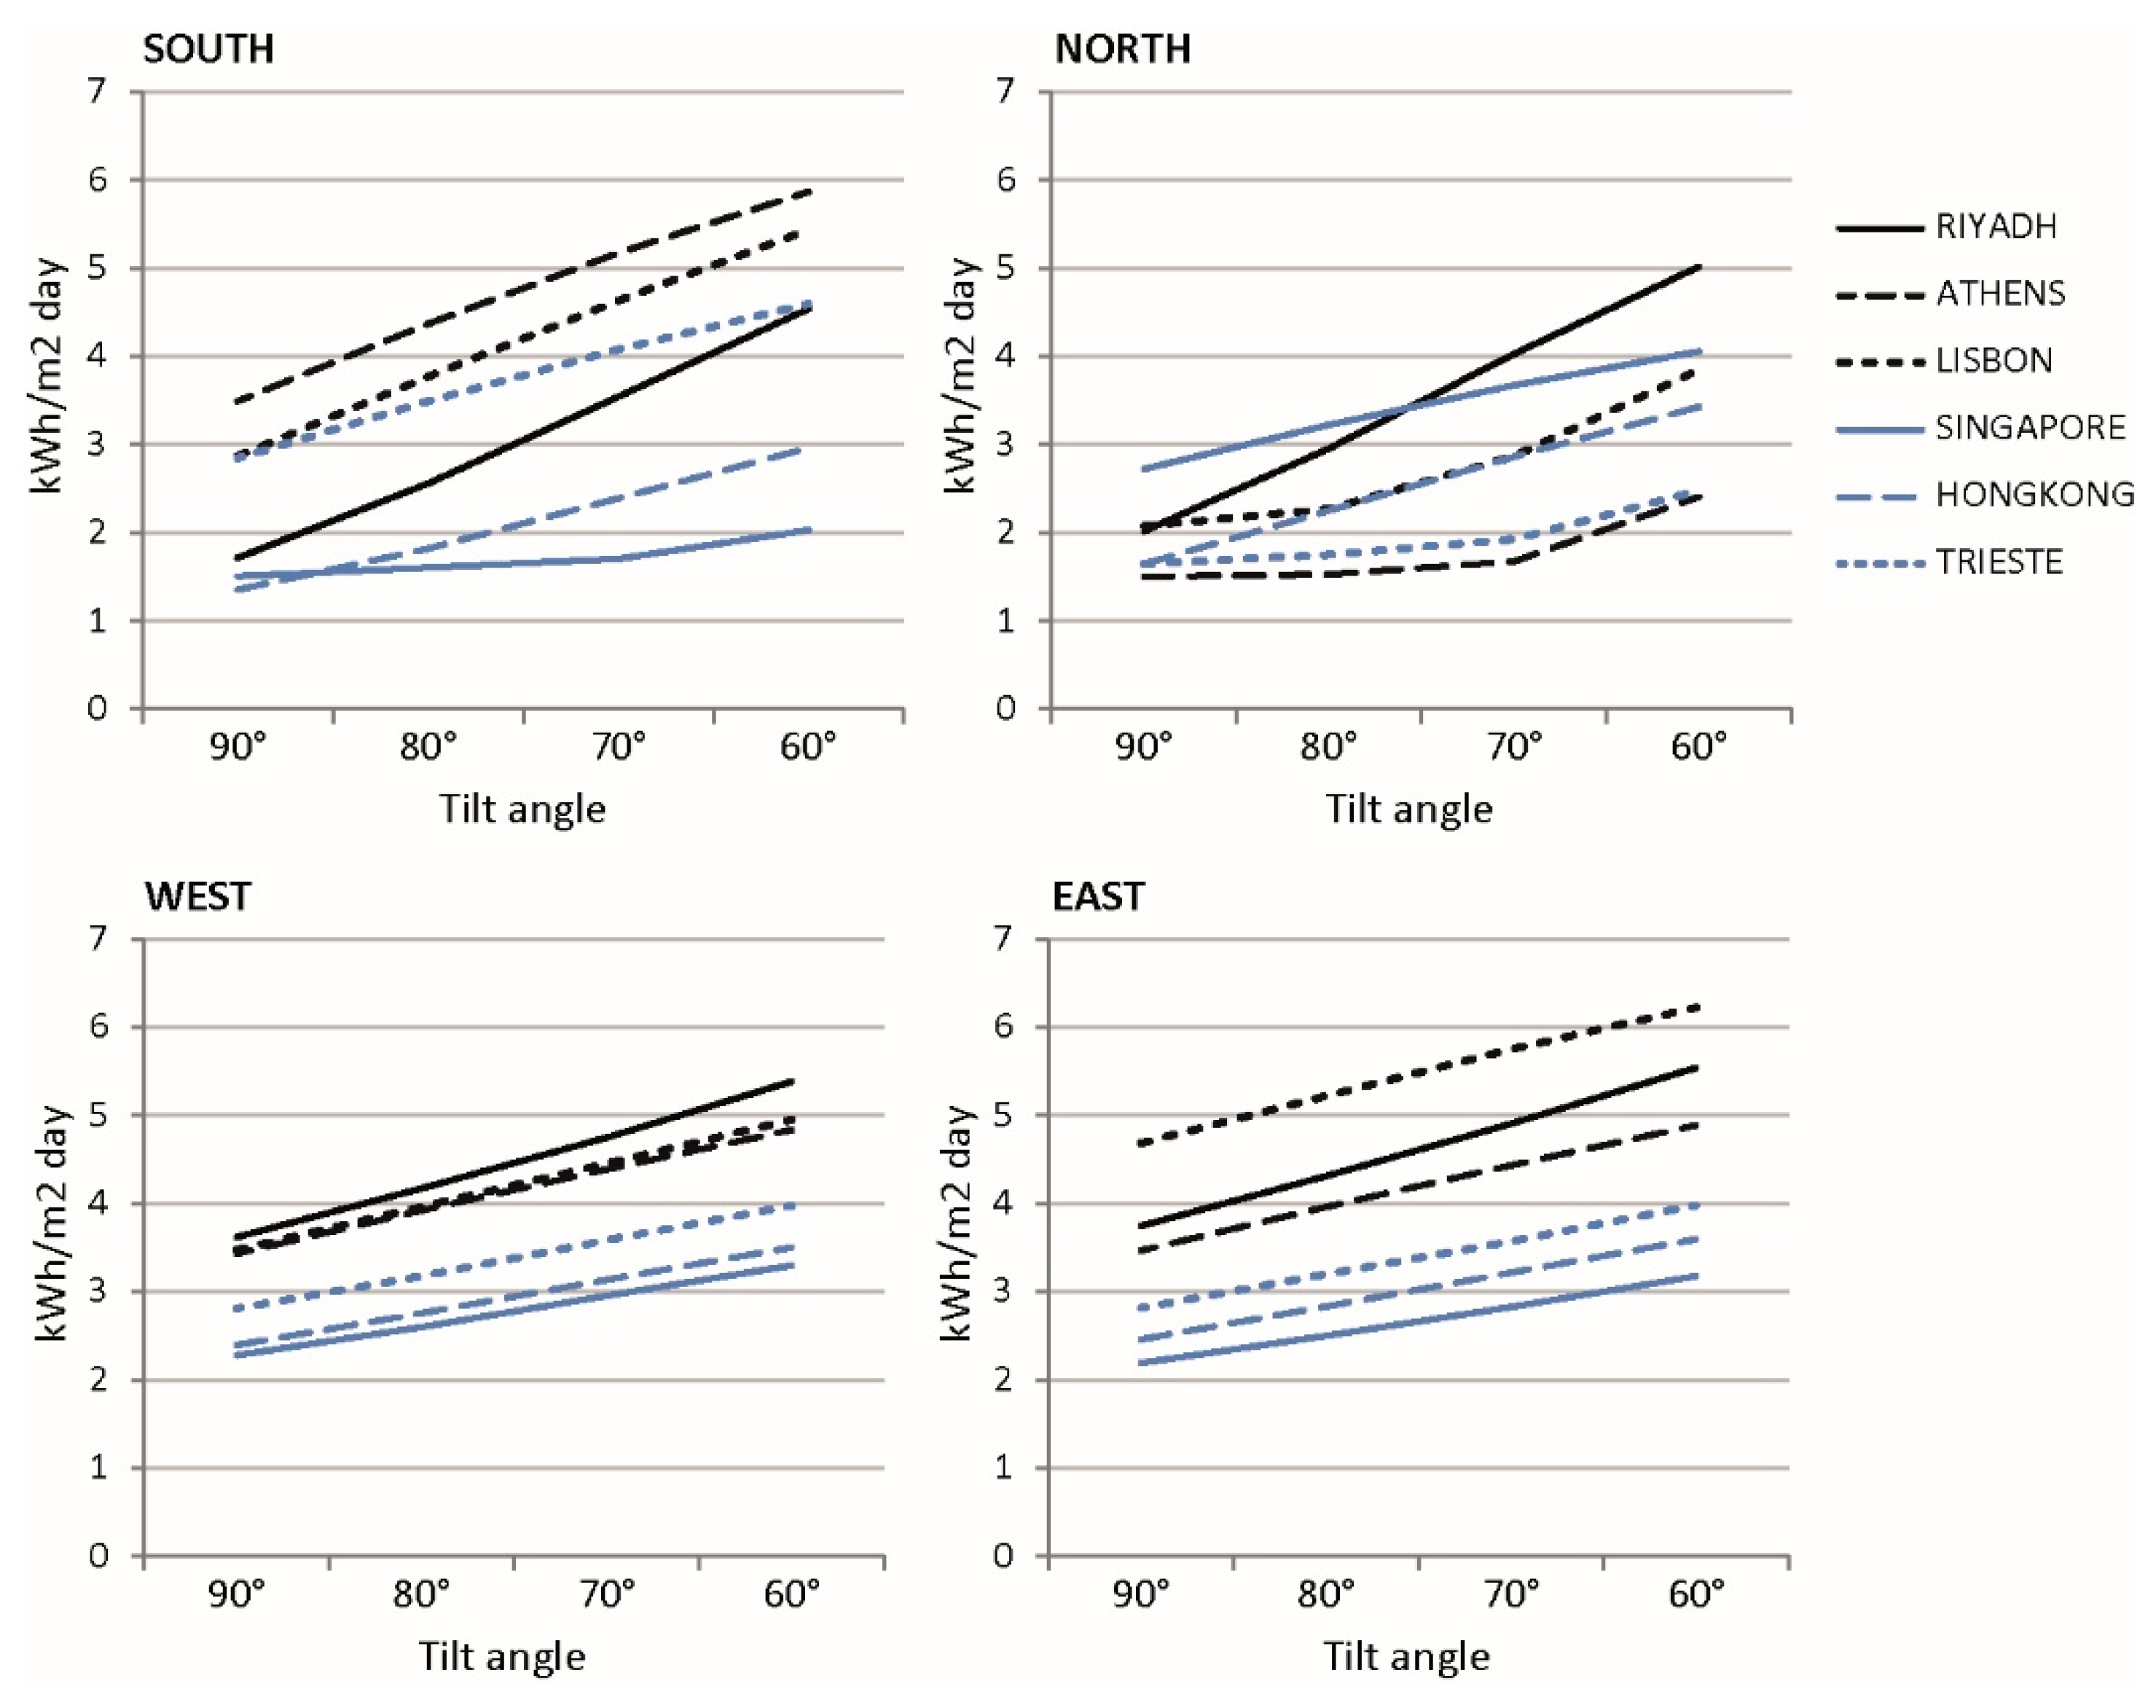
3.2. Impact of Façade Design on Solar Collection and Resulting Solar Fraction

Undoubtedly, improvements on the performance of solar cooling systems and solar energy conversion technologies would increase the applicability of integrated façade concepts. However, the design of the façade system itself may improve its potential for solar collection, providing higher energy input to the cooling system and, therefore, higher cooling output, even if current COP values are maintained. Therefore, the second evaluation stage explored the impact of the solar array on the overall performance, discussing constraints and possibilities for façade design.
Further optimisation of the solar fraction per location/orientation was sought by exploring two parameters: dimension of the solar array, and tilt of the PV or STC panels. The impact of a larger solar array is evident, with a direct correlation between its dimensions and the solar radiation harvested by it. The impact of panel tilt on the other hand, largely depends on each orientation and location. The graphs in Figure 4 show the relation between solar irradiance on an exposed plane facing all orientations, and the tilt of said plane referring to the horizontal, on every addressed location. The graphs start with a 90° tilt, corresponding to a vertical wall, reaching an inclination of 60° to establish a trend. It is clear that the effect of the tilt is particularly relevant in south-oriented façades, as well as some north orientations.
Higher solar yields certainly increase the application possibilities of self-sustaining solar cooling façade concepts. However, larger sizes and panel tilt potentially required for the solar array also imply design constraints for façade composition. These design implications and potential improvements in the performance of the systems are discussed by means of different scenarios for the evaluation, showcasing broad formal solutions derived by performance-based decisions. Four scenarios were considered, based on the combination of array size and panel tilt, shown in Figure 5. Scenario A is the base case used in the first evaluation stage, comprising 50% of the façade area for a vertical solar array (90° panel tilt). Scenario B maintains the tilt, but increases the size of the solar array up to 75% of the total façade area. Oppositely, under scenario C, the tilt angle is lowered to 60° while the initial array size is maintained. Finally, scenario D’s solar array spans 75% or the total façade area, with a slight tilt of 80°. This minor tilt allows its use as façade cladding virtually without self-shading, while this issue is prevented in scenario C by having the solar array in the sill (the potential effect of increased heating demands by overshadowing the window should be considered in temperate regions, if a design following this concept is pursued). These selected scenarios are presented for discussion purposes as possible variations within an infinite amount of combinations and design choices. Nonetheless, their level of abstraction means that detailed analyses are required in order to move forward for hypothetical real applications under a finalised façade design concept.
Reference COP values for the solar array and solar cooling systems were defined for the purpose of the evaluation, considering thermoelectric, sorption, and desiccant technologies (Table 7). The last two groups combine absorption and adsorption, and solid and liquid desiccants, respectively, due to the closeness of their performance, to simplify the assessment. Moreover, maximum efficiencies of PV and STCs are assumed for thermoelectric and desiccant systems, respectively. The fact that sorption technologies require higher input temperatures to properly operate [5] was considered by assuming a lower COPsolarsys in the calculations.
The results are presented in Table 8 and Table 9 in terms of the calculated solar fraction (SF) for every scenario, in each location and orientation. Evidently, scenarios with tilted panels generate higher solar fractions compared to scenarios with same solar array dimensions, in a fully-vertical position; thus, regarding the solar fraction, scenario C will always be better than scenario A (50% façade area), and results from scenario D will always surpass the results from scenario B (75% façade area). However, the optimal case varies from C to D, depending on the orientation, with general improvements in the range of 133–265% compared to the results from the base case (A).
For east and west applications, scenario D is always the best. Moreover, in these cases, scenario B has also better (Lisbon, Athens, and Trieste) or equal (Riyadh, Hong Kong, and Singapore) results than scenario C. Hence, in east and west orientations, more panel area is preferable to tilted applications. In the cases of north and south orientations, results differ according to each location. In Riyadh and Hong Kong, both orientations have better results by scenario C, thus less tilt angle is preferable than more panel area. On the contrary, scenario D is the best for both orientations in Singapore and Trieste, benefiting from more exposed surface. Finally, in Athens and Lisbon, higher solar fractions for south applications are obtained with scenario D, while scenario C is better for north orientations.
For all cases, the best results are obtained either under scenario C or D, with the sole exemption of Singapore, where the best scenarios are either D or B. In this case, lower panel tilt is not rewarded, possibly due to the higher percentage of diffuse radiation in the global solar irradiance, in a location characterised by high cloud coverage along the year.
The identification and discussion of the best results is useful to understand the impact of panel tilt and solar array size on the selected locations, establishing priorities for the design of optimal solar integrated façades per orientation, based on the resulting solar fraction of the overall system. However, the feasibility of a self-sufficient solar cooling façade, based on a specific technology, depends on said technology being able to provide a solar fraction of 100%. The cases that result in solar fractions over 100% are highlighted in blue in Table 8, and cases over 90% are marked in bold.
Thermoelectric systems reach a solar fraction of 100% in Lisbon for south, east, and west orientations under scenarios B, C, and D and, in Athens, only for south application in scenario D (east/west showing 94–98%). Maximum values for north orientation in Lisbon reach 95% in scenario C. Results for other locations show maximum values of 87–95% for east/west and 70–97% for south orientations in Riyadh and Trieste. In Singapore and Hong Kong, east/west applications are around 49–56%, while south results are in the range 31–39%. Maximum results for north-oriented façades, excluding Lisbon, are around 42% and 80% (Athens and Riyadh, respectively).
Sorption-based cooling achieves a SF over 100% in all orientations in Riyadh (C), and Lisbon (B, C, D). Application in south-, east-, and west-oriented façades is possible in Athens (B, C, D), Lisbon (A), and Trieste (B, C, D). In addition to Riyadh and Lisbon, north application is only barely possible in Singapore (D), where SF reaches 99%. Apart from this, solar fractions in Hong Kong and Singapore reach 60% and 48%, respectively, for south orientations, while east/west applications reach up to 87% and 76%.
Finally, the higher COP of desiccant cooling systems increases their chances of application in different contexts. Riyadh was exempted due to the operational inapplicability of desiccant cooling in its climate. These systems work by enhancing the operation of evaporative coolers by taking care of the latent loads, through dehumidification of incoming fresh air. Riyadh experiences only sensible cooling loads, so the application of solar-based dehumidification does not apply (although evaporative cooling is advised). Based on the assumed COP for desiccant technologies, these systems could reach a SF of 100% at all orientations in Athens (B, C, D), Lisbon (all scenarios), Trieste (all scenarios), and Hong Kong (C, D). In Singapore, only east, west, and north orientations are entirely covered, with a maximum south solar fraction of 94% (scenario D).
Based on the assessment, some recommendations for the development of integrated façade concepts are drafted and depicted in Table 10, considering prospects for the assessed technologies in all selected locations, and design considerations for the optimisation of the solar radiation input. It is worth pointing out that applications on all orientations on virtually every addressed location are possible, under current performance values assumed in the evaluation. Hence, this is regarded as evidence of current opportunities for the development of integrated façade concepts, even considering important design constraints. Further improvements on the performance and efficiency of compact solar cooling systems, especially designed for façade integration, will undoubtedly increase façade design variety and flexibility. Nevertheless, the numerical feasibility obtained by the assessment shows that solar driven cooling systems do not necessarily need to reach the same COP values of vapour compression heat pumps in order to be a competitive alternative in specific locations.

4. Conclusions

This paper sought to assess the potential for the application of self-sufficient solar cooling façades in several warm climates across the northern hemisphere. The assessment focused on numerical calculations of the general efficiencies required by solar cooling technologies to meet cooling demands in several locations, exploring prospects in different climate contexts and orientations, while discussing certain design constraints for façade composition. The calculations were mainly based on solar availability, from statistical climate data; cooling requirements per orientation/location, from dynamic simulations; and reported efficiencies of state-of-the-art solar cooling concepts as a reference of current limits of the technology. Different scenarios were explored to discuss the impact of certain design parameters (panel tilt and panel/façade area ratio) on the performance of the façade configurations, per orientation and location.
Unsurprisingly, warm-dry climates were found to be more suited for solar cooling façade applications, due to their higher solar availability and relative lower cooling demands, compared to humid climates. Regarding orientations, the use of vertical solar panels as a base case shows that, with minor exemptions, east/west applications are the best suited, favouring dry over humid climates, and temperate climates over extreme environments. For south applications, locations between the tropics have the worst results, due to both climate severity and low solar incidence angle in façades. Contrarily, locations near the equator present better opportunities for north façade applications.
Regarding the feasibility of particular solar cooling technologies, solar electric processes are more constrained due to the lower efficiencies of PV panels compared to solar thermal collectors, and limited efficiencies of thermoelectric modules. Hence, self-sufficient façade modules are only theoretically feasible on east orientations in Lisbon. Based purely on performance values, solar thermal technologies have a wider range for application, reaching a solar fraction of 100% in all orientations in Lisbon and Trieste, and in some orientations in Riyadh, Athens, and Singapore. Application possibilities expand when considering more area for the solar array and lower tilt angle on the panels, but they imply aesthetical and constructional constraints for façade design. Based on this, recommendations for the development for integrated façade concepts were drafted, considering prospects for the exploration of suitable technologies for specific locations, and façade design considerations for the optimisation of the solar input per orientation.
Further development of thermoelectric façade concepts is recommended for application on the temperate dry climates of Lisbon and Athens. The former allows for greater design flexibility, but either panel tilt or a solar array over 50% are required to fully cover the cooling demands in most orientations. Results showed that application in Athens is potentially feasible, but the design is heavily constrained. In any case, the simplicity associated with the technology makes it worth exploring for clear feasibility on mild dry locations.
Discussing solar thermal, sorption cooling systems are recommended for application in Riyadh, Trieste, and Athens. All orientations on temperate climates are potentially covered with minor extra design constraints, compared to the base scenario, which also extends to the east/west application in Riyadh. Application on north/south façades in Riyadh requires lower panel tilt to reach a solar fraction of 100%. The higher reported performances of desiccant cooling technologies and their particular handling of latent loads make them especially suited for humid environments. Thus, the development of desiccant- integrated façade units is recommended for Trieste, Hong Kong, and Singapore. In temperate environments, reported COP values are theoretically enough to allow for application at all orientations with minor design constraints. In Hong Kong and Singapore, west, east, and north applications are feasible with either lower panel tilt or higher panel area, but south applications are heavily constrained, particularly in tropical contexts.
The numerical assessment has shown that the application of solar cooling integrated façade concepts is theoretically feasible in virtually all climate contexts and orientations, although based on the upper limits of performance reported for the involved technologies and components, and important design constraints in some cases. Hence, further research on the performance of integrated and compact units is needed in order to ensure reliable efficiencies and hopefully increase them to provide more flexibility for the design of façade systems. The fact that not every climate was found suitable for the application of every addressed solar cooling technology is not seen as a limitation, but rather as an opportunity to explore distinct integrated concepts with technology that responds better to the particularities of each climate context. In any case, regardless of future developments on the performance of the systems, the application of integrated façade concepts heavily relies on the optimisation of the solar input, and the reduction of cooling demands through passive cooling strategies. Hence, a climate-responsive approach to façade design is a basic condition; allowing for the integration of cooling systems only if still needed. Finally, it is important to reiterate that this assessment focused purely on numerical calculations and broad climate data to discuss application potential, but detailed calculations and dynamic performance simulations would be needed for the design of a façade unit for a particular building in a specific context. Moreover, extensive research is still needed to solve technical issues for the operation of compact units, and to cope with architectural requirements for façade integration of the required components and systems.

Author Contributions

Being part of a PhD dissertation, the work was carried out by the lead author (Alejandro Prieto) under the supervision of Ulrich Knaack, Tillmann Klein, and Thomas Auer. The strategy and structure was decided in consultation with Ulrich Knaack and Tillmann Klein, while Thomas Auer acted as the main consultant for the technical aspects of the experimental setup. The results from the simulations were discussed among all authors, redacting conclusions in agreement.

Acknowledgments

This paper is part of the ongoing PhD research project titled COOLFACADE: Architectural integration of solar cooling technologies in the building envelope, developed within the Façade Research Group (FRG) of the Department of Architectural Engineering + Technology, Delft University of Technology (TU Delft). The research project is being funded through a scholarship granted by CONICYT, the National Commission for Scientific and Technological Research of Chile (resolution No. 7484/2013).

Conflicts of Interest

The authors declare no conflict of interest. The founding sponsors had no role in the design of the study; in the collection, analyses, or interpretation of data; in the writing of the manuscript; or in the decision to publish the results.

References

  1. OECD/IEA. Technology Roadmap—Solar Heating and Cooling; OECD/IEA: Paris, France, 2012. [Google Scholar]
  2. Prieto, A.; Knaack, U.; Klein, T.; Auer, T. 25 years of cooling research in office buildings: Review for the integration of cooling strategies into the building façade (1990–2014). Renew. Sustain. Energy Rev. 2017, 71, 89–102. [Google Scholar] [CrossRef]
  3. Santamouris, M. Cooling the buildings—Past, present and future. Energy Build. 2016, 128, 617–638. [Google Scholar] [CrossRef]
  4. Henning, H.-M. Solar assisted air conditioning of buildings—An overview. Appl. Therm. Eng. 2007, 27, 1734–1749. [Google Scholar] [CrossRef]
  5. Prieto, A.; Knaack, U.; Auer, T.; Klein, T. Solar coolfacades framework for the integration of solar cooling technologies in the building envelope. Energy 2017, 137, 353–368. [Google Scholar] [CrossRef]
  6. IPCC/TEAP. Special Report: Safeguarding the Ozone Layer and the Global Climate System; IPCC/TEAP: Geneva, Switzerland, 2005. [Google Scholar]
  7. Balaras, C.A.; Grossman, G.; Henning, H.-M.; Infante Ferreira, C.A.; Podesser, E.; Wang, L.; Wiemken, E. Solar air conditioning in europe—An overview. Renew. Sustain. Energy Rev. 2007, 11, 299–314. [Google Scholar] [CrossRef]
  8. Franzke, U.; Heidenreich, R.; Ehle, A.; Ziller, F. Comparison between Decentralised and Centralised Air Conditioning Systems; ILK Dresden: Dresden, Germany, 2003. [Google Scholar]
  9. Prieto, A.; Klein, T.; Knaack, U.; Auer, T. Main perceived barriers for the development of building service integrated facades: Results from an exploratory expert survey. J. Build. Eng. 2017, 13, 96–106. [Google Scholar] [CrossRef]
  10. Mahler, B.; Himmler, R. Results of the evaluation study deal—Decentralized facade integrated ventilation systems. In Proceedings of the 8th International Conference for Enhanced Building Operations, Berlin, Germany, 20–22 October 2008. [Google Scholar]
  11. Ibañez-Puy, M.; Martín-Gómez, C.; Bermejo-Busto, J.; Sacristán, J.A.; Ibañez-Puy, E. Ventilated active thermoelectric envelope (vate): Analysis of its energy performance when integrated in a building. Energy Build. 2018, 158, 1586–1592. [Google Scholar] [CrossRef]
  12. Liu, Z.; Zhang, L.; Gong, G.; Han, T. Experimental evaluation of an active solar thermoelectric radiant wall system. Energy Convers. Manag. 2015, 94, 253–260. [Google Scholar] [CrossRef]
  13. Avesani, S. Design of a Solar Façade Solution with an Integrated Sorption Collector for the Systemic Retrofit of the Existing Office Buildings; Leopold-Franzens-Universität Innsbruck: Innsbruck, Austria, 2016. [Google Scholar]
  14. Bonato, P.; D’Antoni, M.; Fedrizzi, R. Integration of a sorption collector coupled with a decentralized mechanical ventilation unit in curtain wall module. In Proceedings of the 11th Conference on Advanced Building Skins, Bern, Switzerland, 10–11 October 2016. [Google Scholar]
  15. SolarInvent. Freescoo/solarinvent s.R.L. Available online: http://www.Freescoo.Com. (accessed on 22 February 2018).
  16. NREL. Energyplus. Available online: https://energyplus.Net/ (accessed on 6 February 2018).
  17. Prieto, A.; Knaack, U.; Klein, T.; Auer, T. Passive cooling & climate responsive facade design—Exploring the limits of passive cooling strategies to improve the performance of commercial buildings in warm climates. Energy Build. 2018. under review. [Google Scholar]
  18. NREL. System Advisor Model (sam). Available online: https://sam.Nrel.Gov/ (accessed on 6 February 2018).
  19. VDMA. International Technology Roadmap for Photovoltaic (Itrpv): 2016 Results Including Maturity Report; VDMA: Frankfurt am Main, Germany, 2017. [Google Scholar]
  20. OECD/IEA. Technology Roadmap—Solar Photovoltaic Energy; OECD/IEA: Paris, France, 2014. [Google Scholar]
  21. SOLAIR. Solair Project: Increasing the Market Implementation of Solar Air-Conditioning Systems for Small and Medium Applications in Residential and Commercial Buildings. Available online: http://www.solair-project.eu/ (accessed on 14 September 2014).
  22. Reda, A.M.; Ali, A.H.H.; Morsy, M.G.; Taha, I.S. Design optimization of a residential scale solar driven adsorption cooling system in upper Egypt based. Energy Build. 2016, 130, 843–856. [Google Scholar] [CrossRef]
  23. Crofoot, L.; Harrison, S. Performance evaluation of a liquid desiccant solar air conditioning system. Energy Procedia 2012, 30, 542–550. [Google Scholar] [CrossRef]
  24. Reda, A.M.; Ali, A.H.H.; Taha, I.S.; Morsy, M.G. Performance of a small-scale solar-powered adsorption cooling system. Int. J. Green Energy 2017, 14, 75–85. [Google Scholar] [CrossRef]
  25. Enteria, N.; Mizutani, K. The role of the thermally activated desiccant cooling technologies in the issue of energy and environment. Renew. Sustain. Energy Rev. 2011, 15, 2095–2122. [Google Scholar] [CrossRef]
  26. Abdel-Salam, A.H.; Ge, G.; Simonson, C.J. Thermo-economic performance of a solar membrane liquid desiccant air conditioning system. Sol. Energy 2014, 102, 56–73. [Google Scholar] [CrossRef]
  27. Henning, H.M.; Erpenbeck, T.; Hindenburg, C.; Santamaria, I.S. The potential of solar energy use in desiccant cooling cycles. Int. J. Refrig. 2001, 24, 220–229. [Google Scholar] [CrossRef]
  28. Selke, T.; Frein, A.; Muscherà, M.; Sethuvenkatraman, S.; Hands, S.; White, S. Shc task 48 b2—Three good practice examples of solar heat driven desiccant evaporative cooling systems. Energy Procedia 2016, 91, 832–843. [Google Scholar] [CrossRef]
  29. Chang, W.S.; Wang, C.C.; Shieh, C.C. Design and performance of a solar-powered heating and cooling system using silica gel/water adsorption chiller. Appl. Therm. Eng. 2009, 29, 2100–2105. [Google Scholar] [CrossRef]
  30. Kohlenbach, P.; Jakob, U. Solar Cooling: The Earthscan Expert Guide to Solar Cooling Systems; Taylor & Francis: London, UK, 2014. [Google Scholar]
  31. Prieto, A.; Knaack, U.; Auer, T.; Klein, T. Coolfacade: State-of-the-art review and evaluation of solar cooling technologies on their potential for façade integration. Renew. Sustain. Energy Rev. 2018. under review. [Google Scholar]
  32. Irshad, K.; Habib, K.; Basrawi, F.; Saha, B.B. Study of a thermoelectric air duct system assisted by photovoltaic wall for space cooling in tropical climate. Energy 2017, 119, 504–522. [Google Scholar] [CrossRef]
  33. Jaehnig, D. D-a1: Market Available Components for Systems for Solar Heating and Cooling with a Cooling Capacity <20 kw/a Technical Report of Subtask a of Iea Shc Task 38: Solar Air-Conditioning and Refrigeration; AEE Intec: Gleisdorf, Austria, 2009. [Google Scholar]
  34. Finocchiaro, P.; Beccali, M.; Brano, V.L.; Gentile, V. Monitoring results and energy performances evaluation of freescoo solar dec systems. Energy Procedia 2016, 91, 752–758. [Google Scholar] [CrossRef]
  35. Elmer, T.; Worall, M.; Wu, S.; Riffat, S. An experimental study of a novel integrated desiccant air conditioning system for building applications. Energy Build. 2016, 111, 434–445. [Google Scholar] [CrossRef] [Green Version]
  36. Goetzler, W.; Zogg, R.; Young, J.; Johnson, C. Energy Savings Potential and rd&d Opportunities for Non-Vapor-Compression Hvac Technologies; U.S. Department of Energy, Office of Energy Efficiency and Renewable Energy, Building Technologies Office: Washington, DC, USA, 2014.
Figure 1. Graph of thermal collector efficiency vs. temperature.
Energies 11 01475 g001
Figure 2. Comparison between solar fraction and COP (electric and thermal) of a given solar cooling system in warm, dry climates.
Energies 11 01475 g002
Figure 3. Comparison between solar fraction and COP (electric and thermal) of a given solar cooling system in warm, humid climates.
Energies 11 01475 g003
Figure 4. Relation between solar irradiance and the tilt of the receiving surface, for every orientation and location.
Energies 11 01475 g004
Figure 5. Scenarios considered in the assessment, combining array size and panel tilt possibilities.
Energies 11 01475 g005
Table 1. Cities selected for the assessment, representing several warm climate zones.
CityLatitude/LongitudeClimate ZonesCDD (26 °C)
Riyadh24.70/46.73Hot desert (BWh)1583
Athens37.90/23.73Hot-summer Mediterranean (Csa)212
Lisbon38.72/−9.15Hot-summer Mediterranean (Csa)69
Singapore1.37/103.98Tropical rainforest (Af)992
Hong Kong22.30/114.17Humid Subtropical (Cwa)602
Trieste45.65/13.75Humid Subtropical (Cfa)88
Table 2. Design and operational parameters for the dynamic energy simulation of the base case defined for the assessment.
Simulation ParametersAll Other LocationsSingapore and Hong Kong
Office dimensions4.0 × 4.0 × 2.7 m (width × depth × height) + plenum of 0.7 m
Thermal comfort rangeMaximum temp. of 26 °C and relative humidity between 25–55%
Occupant loads0.1 people/m2
Equipment loads11.77 W/m2
Lighting loads(on demand) 12 W/m2 for a target illuminance of 400 lux
Ventilation
(hygienic purposes)
10 L/s per person
Ventilation
(cooling purposes)
5 ACH max when it’s thermodynamically feasible (external temperature below internal temperature)NO
Window-to-wall ratio25% (Wall U-value: 0.26 W/m2 K)
Sun shading systemDynamic exterior shading on operation over 100 W/m2 of solar irradiance on facades.
Glazing typeDouble clear glass (6/13/6 mm with air in cavity)
U-value: 2.7 W/m2 K/SHGC: 0.7
Table 3. Simulated cooling demands for all orientations and locations considered in the assessment.
LocationSummer Design WeekOrient.Base Case
(No Passive Strategies)
Improved Base Case
(With Passive Strategies)
Cooling Yearly Demands
(kWh/m2 year)
Cooling Yearly Demands
(kWh/m2 year)
Cooling Design Capacity (kW)AVG Daily Cooling in Summer Design Week (kWh day)
Riyadh20–26 JulySouth298.9292.671.1911.69
West336.4395.111.2312.26
East342.1491.561.2112.26
North175.9384.361.1611.34
Athens3–9 AugustSouth231.2856.001.1010.95
West190.6957.021.1011.27
East210.5754.701.0810.94
North94.4450.211.0310.25
Lisbon15–21 JulySouth224.3733.010.927.73
West148.2533.130.917.86
East227.4733.560.907.72
North72.7227.650.857.27
Singapore4–10 JuneSouth334.30223.961.5914.11
West385.16228.491.6414.38
East398.33219.721.5913.82
North349.13215.121.5713.72
Hong Kong22–28 JulySouth246.53143.991.6113.76
West255.69144.341.6714.15
East247.97135.871.6213.77
North186.29130.871.5713.38
Trieste20–26 JulySouth140.6840.741.269.75
West110.3841.121.269.88
East115.2837.871.229.51
North66.7436.131.188.80
Table 4. Daily average solar irradiance in facades in all orientations and locations for the summer design month.
LocationLatitude/LongitudeMonthDaily AVG Solar Irradiance in 90° Tilted Plane (kWh/m2/day)
SouthWestEastNorth
Riyadh24.70/46.73July1.713.623.752.02
Athens37.90/23.73August3.493.433.471.50
Lisbon38.72/−9.15July2.873.474.682.08
Singapore1.37/103.98June1.512.282.192.72
Hong Kong22.30/114.17July1.352.402.461.64
Trieste45.65/13.75July2.842.812.811.64
Table 5. Solar cooling technologies considered in the assessment and performance ranges reported in the literature.
Energy InputCooling TechnologiesGral.
COPcoolsys
COPcoolsys 0.5–5 kW
Solar ElectricThermoelectric cooling-0.66–1.15
Solar ThermalAbsorption cooling0.50–0.750.23–0.78
Adsorption cooling0.50–0.700.12–0.63
Solid desiccant ccoling0.50–1.000.20–1.25
Liquid desiccant cooling≈1.000.40–1.26
Table 6. Minimum COP values are required for a solar cooling system (COPcoolsys) in order to reach a solar fraction of 100% per orientation and location.
Solar CoolingLocationRequired Minimum COPcoolsys for SF = 100%
SouthWestEastNorth
Electric
COPsolarsys
= 0.23
Riyadh4.362.172.093.59
Athens2.012.102.024.37
Lisbon1.721.451.052.24
Singapore5.994.044.043.23
Hong Kong6.503.783.585.21
Trieste2.192.252.163.43
Thermal
COPsolarsys
= 0.65
Riyadh1.540.770.741.27
Athens0.710.740.711.55
Lisbon0.610.510.370.79
Singapore2.121.431.431.14
Hong Kong2.301.341.271.84
Trieste0.780.800.761.21
Table 7. Reference COP values for solar array and solar cooling systems used in the assessment.
Solar Cooling TechCOPsolarsysCOPcoolsys
Thermoelectric (TE)0.231.15
Sorption (ABS-ADS)0.550.75
Desiccant (SDEC-LDEC)0.651.25
Table 8. Solar fraction for scenarios A and B in all locations and orientations.
LocationSolar CoolingA (%)B (%)
SouthWestEastNorthSouthWestEastNorth
RiyadhTE2653553240808248
ABS/ADS418386506212412975
SDEC/LDEC--------
AthensTE5755572686828539
ABS/ADS8985894113412813362
SDEC/LDEC17616817581264252263121
LisbonTE67801095110011916477
ABS/ADS10412417080156186255120
SDEC/LDEC205244335158307366503237
SingaporeTE1928283629434353
ABS/ADS3044445645676783
SDEC/LDEC59878811088131131164
Hong KongTE1830322227464833
ABS/ADS2847503441717552
SDEC/LDEC5494996882140148102
TriesteTE5251533479778050
ABS/ADS8280835212312012479
SDEC/LDEC161157163103242235245155
Table 9. Solar fraction for scenarios C and D in all locations and orientations.
LocationSolar CoolingC (%)D (%)
SouthWestEastNorthSouthWestEastNorth
RiyadhTE7079818059929570
ABS/ADS10912312712492143148110
SDEC/LDEC--------
AthensTE96778042108949840
ABS/ADS1501201256616814615263
SDEC/LDEC296237247130331288300124
LisbonTE1261131459513213618284
ABS/ADS197177226148205212284131
SDEC/LDEC388348445292404418560259
SingaporeTE2641415331494963
ABS/ADS4064648348767699
SDEC/LDEC8012712716394150150195
Hong KongTE3945474636535645
ABS/ADS6069737256828771
SDEC/LDEC119137144141109162171139
TriesteTE8572755197879154
ABS/ADS1321131177915113514184
SDEC/LDEC260222231155297267279165
Table 10. Recommendations for further development of integrated façade concepts in each assessed location/climate context.
Climate ZonesLocationRecommended Solar Cooling TechnologyRecommendations for Integrated Façade Design
Hot desert (BWh)RiyadhSorption cooling
(ABS/ADS)
Application in all orientations is potentially feasible. North and south applications depend on tilt, while east/west ones have more flexibility, being solved by either panel tilt or higher panel area.
Hot summer mediterr.
(Csa)
AthensSorption cooling (ABS/ADS) and
Thermoelectric cooling (TE)
South, east, and west orientations are potentially suitable for TE application, reaching SF values close to 100% under high design constraints (panel tilt and high panel/façade ratio are required). The same orientations may be covered by sorption systems by means of either panel tilt or higher panel area.
LisbonThermoelectric cooling (TE)South, east, and west orientations are suitable for TE application, using either tilted panels or higher panel/façade ratio. For north applications, SF values close to 100% are reached through lower tilts.
Tropical rainforest (Af)SingaporeDesiccant cooling
(DEC)
Suitable for north application in all scenarios. East and west application feasible, by lower panel tilt or higher panel/façade ratio. South application highly constrained, requiring optimisation of both parameters to reach SF = 94%.
Humid Subtropical (Cwa/Cfa)Hong KongDesiccant cooling
(DEC)
Desiccant cooling can provide sufficient SF for west and east orientations in virtually all scenarios (base case: 94–99%). South orientation requires panel tilt and north applications may be solved by either panel tilt or higher panel area.
TriesteSorption cooling (ABS/ADS) and
Desiccant cooling
(DEC)
Desiccant cooling application is feasible for all orientations in all scenarios. Sorption cooling is feasible for south, east, and west application, by means of either panel tilt or higher panel/façade ratio.

