Article

Optimal Planning Method of On-load Capacity Regulating Distribution Transformers in Urban Distribution Networks after Electric Energy Replacement Considering Uncertainties

1
State Key Laboratory of Power Transmission Equipment & System Security and New Technology; Chongqing University, Chongqing 400044, China
2
State Grid Sichuan Electric Power Company Tianfu Power Supply Company, Chengdu 610000, China
3
China Southern Power Grid Guangzhou Power Supply Co., Ltd., Guangzhou 510000, China
*
Author to whom correspondence should be addressed.
Energies 2018, 11(6), 1457; https://doi.org/10.3390/en11061457
Submission received: 2 May 2018 / Revised: 30 May 2018 / Accepted: 3 June 2018 / Published: 5 June 2018

Abstract

:
Electric energy replacement is the umbrella term for the use of electric energy to replace oil (e.g., electric automobiles), coal (e.g., electric heating), and gas (e.g., electric cooking appliances), which increases the electrical load peak, causing greater valley/peak differences. On-load capacity regulating distribution transformers have been used to deal with loads with great valley/peak differences, so reasonably replacing conventional distribution transformers with on-load capacity regulating distribution transformers can effectively cope with load changes after electric energy replacement and reduce the no-load losses of distribution transformers. Before planning for on-load capacity regulating distribution transformers, the nodal effective load considering uncertainties within the life cycle after electric energy replacement was obtained by a Monte Carlo method. Then, according to the loss relation between on-load capacity regulating distribution transformers and conventional distribution transformers, three characteristic indexes of annual continuous apparent power curve and replacement criteria for on-load capacity regulating distribution transformers were put forward in this paper, and a set of distribution transformer replaceable points was obtained. Next, based on cost benefit analysis, a planning model of on-load capacity regulating distribution transformers which consists of investment profitability index within the life cycle, investment cost recouping index and capacity regulating cost index was put forward. The branch and bound method was used to solve the planning model within replaceable point set to obtain upgrading and reconstruction scheme of distribution transformers under a certain investment. Finally, planning analysis of on-load capacity regulating distribution transformers was carried out for electric energy replacement points in one urban distribution network under three scenes: certain load, uncertain load and nodal effective load considering uncertainties. Results showed that the planning method of on-load capacity regulating distribution transformers proposed in this paper was very feasible and is of great guiding significance to distribution transformer planning after electric energy replacement and the popularization of on-load capacity regulating distribution transformers.

1. Introduction

The heavy use of fossil fuels such as oil, coal, and gas in urban distribution networks can lead to haze [1,2,3] and other air pollution, which may cause diseases, allergies and also human deaths. In order to reduce the emission of pollutants like pure carbon dust, carbon dioxide, sulfur dioxide and nitrogen oxide [4,5] and construct an urban air environment with green development, replacing oil, coal, and gas with electric energy on the load side, called electric energy replacement, is promoted by the national energy department in China. In recent years, northern residents have gradually used electric heating to replace fire coal; industry has vigorously promoted electric boilers and electric furnaces as power sources of production, electric vehicles and electric buses have been introduced into the transportation field, and in the power supply and consumption field, there are energy storage equipment, port power supply, electric cooking appliances, etc.
Against the background of electric energy replacement, the valley/peak differences of electrical loads in distribution networks continuously increase, significantly increasing the no-load losses of distribution transformers, which is adverse to the economical operation of distribution networks. On-load capacity regulating distribution transformers have two capacities, which has been used to deal with loads with great valley/peak differences in rural areas. 
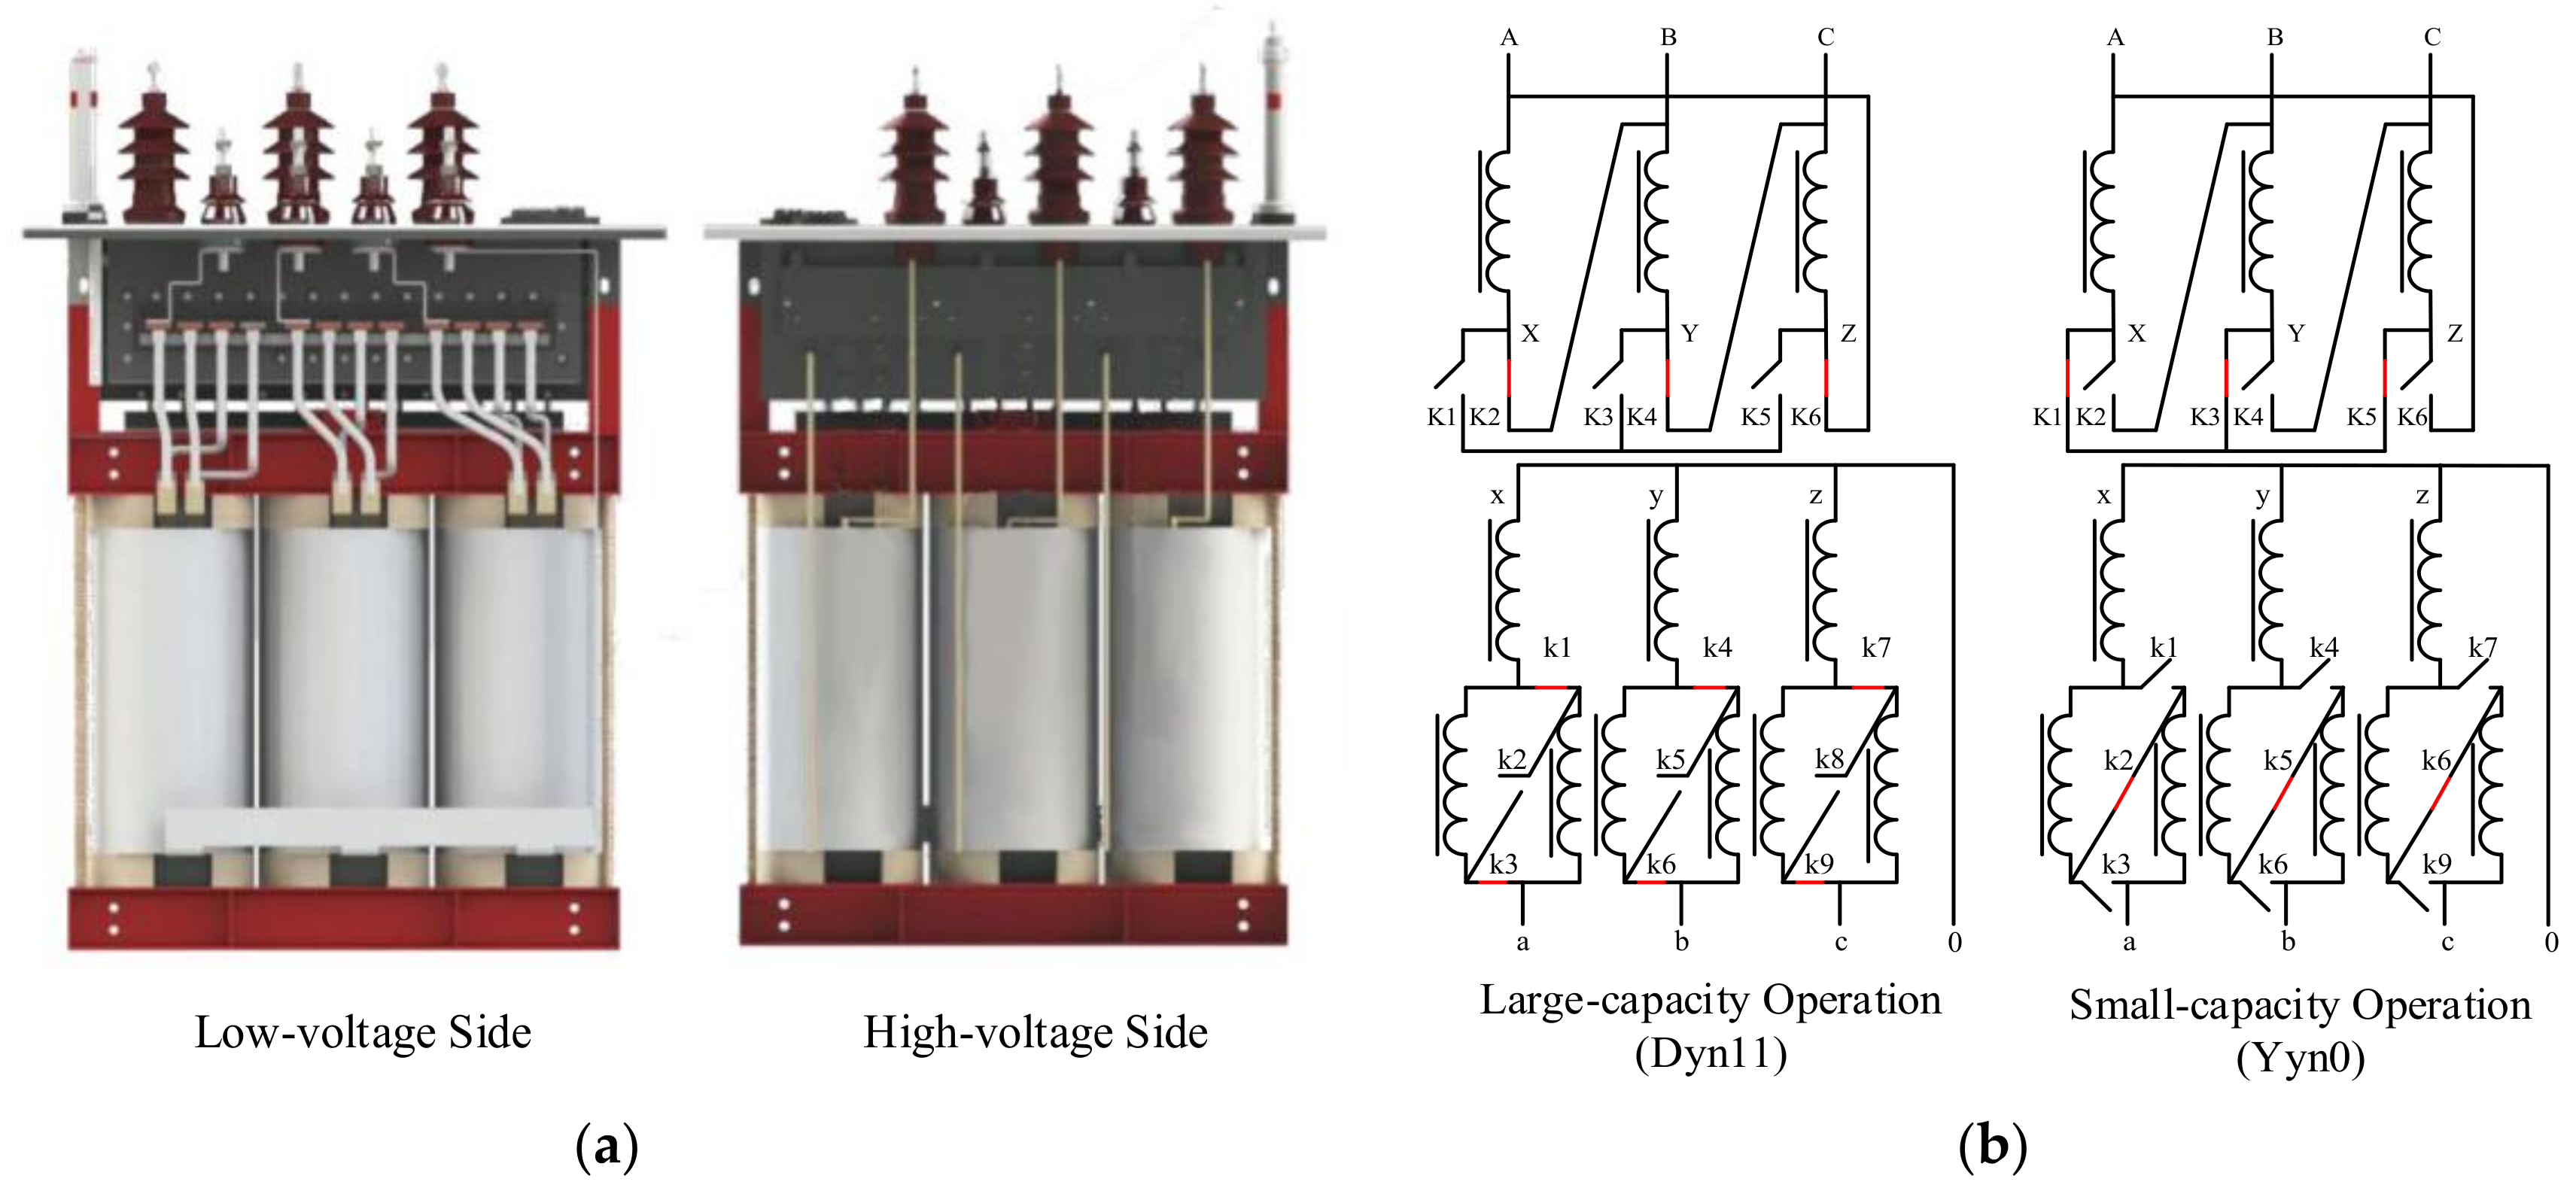
Figure 1a shows actual pictures of an on- load capacity regulating distribution transformer, while Figure 1b shows the circuit structure, where the red line represents a closed switch. When the on-load capacity regulating distribution transformer is adjusted from high-capacity operation to low-capacity operation, the high-voltage winding is changed from triangle connection to star connection, and the phase voltage reduces to 1/ 3 of the original phase voltage. The parallel part of the low-voltage winding is changed to a series connection, and the winding turns increases to 3 times the original winding turns. Due to the fact the ratio of voltage reduction is equal to the ratio of winding turns increase, the output voltage is stable, but by the reason that the low-voltage winding turns increases, the magnetic flux density of the iron core is greatly reduced, so as to greatly reduce the no-load loss of the transformer. What’s more, as on-load capacity regulating distribution transformer manufacturing technology gradually becomes mature, it’s possible to popularize on-load capacity regulating distribution transformers at low cost [6], so transforming conventional distribution transformers into on-load capacity regulating distribution transformers can effectively solve the power loss problems caused by electric energy replacement.
Because the on-load capacity regulating distribution transformer is a new type of energy-saving transformer, there are not many studies on it at this stage. Previous studies proposed an intelligent design scheme [7] and control strategy [8] for on-load capacity regulating distribution transformers, verifying that the on-load capacity regulating distribution transformers are appropriate for long-term light-load areas. With the development of power electronic switches, researchers have designed new on-load capacity regulating distribution transformer structures with anti-parallel thyristor valves [9] and solid state relays [10] as capacity regulating switches. To plan on-load capacity regulating distribution transformers reasonably, [11] discussed the impact of the electricity load characteristics on the distribution transformer economic operation, and gives the annual average load rate range for configuration with on-load capacity regulating distribution transformers. Then, for the safety of the power system, the voltage fluctuation of on-load capacity regulating distribution transformers while switching capacity is discussed in [12], the various faults occurring in on-load capacity regulating distribution transformers are analyzed and effective detection and control technology is put forward in [13]. Existing studies on on-load capacity regulating distribution transformers are mainly specific to rural distribution networks, and no literatures have studied planning methods for on-load capacity regulating distribution transformers in urban distribution networks after electric energy replacement. Compared with rural distribution networks, the load characteristics of urban distribution networks after electric energy replacement are different. Therefore, studying a planning method of on-load capacity regulating distribution transformers in an urban distribution network after electric energy replacement is of great theoretical and practical significance to the upgrading and reconstruction of distribution transformers after electric energy replacement.
Distribution transformer upgrading and reconstruction was combined with electric energy replacement to study optimal planning method of on-load capacity regulating distribution transformers in an urban distribution network in this paper. Firstly, the nodal effective load considering uncertainties within the life cycle after electric energy replacement was obtained by a Monte Carlo method. Secondly, a replacement criterion for on-load capacity regulating distribution transformers was proposed according to the loss relation between on-load capacity regulating distribution transformers and conventional distribution transformers, and a set of distribution transformer replaceable points considering electric energy loss was obtained. Then a planning model of on-load capacity regulating distribution transformers was established according to a cost benefit analysis of the replacement with on-load capacity regulating distribution transformers. Based on the distribution transformer replaceable point set, a branch and bound method was used to obtain a planning scheme of on-load capacity regulating distribution transformers in urban distribution networks after electric energy replacement, and this provide a theoretical basis for upgrading and reconstruction of distribution transformers matching electric energy replacement needs.

2. Nodal Effective Load Prediction Considering Uncertainties in Distribution Network after Electric Energy Replacement

2.1. Load Analysis in Distribution Network after Electric Energy Replacement

In recent years, the Chengdu Power Supply Company had energetically popularized electric energy replacement within the whole city and incorporated popularization of electric energy replacement like electric boilers and electric energy storage into the Chengdu 2016 Implementation Plan for Action Program on Atmospheric Pollution Prevention and Control. At present 30 electric energy replacement projects have been completed and the replaced electric energy has reached 80,300,000 kWh. In order to analyze the influence of electric energy replacement on load in the distribution network, taking hot pot load in the Chengdu distribution network as an example, a comparative analysis of loads before and after electric energy replacement was carried out. Figure 2a shows the annual maximum load curves of the hot pot loads, where the blue curve represents the annual maximum load curve before electric energy replacement and the red curve is the annual maximum load curve after electric energy replacement. It can be seen that before electric energy replacement, hot pot load is mainly a lighting load, but after electric energy replacement, a large quantity of electric load used to replace hot pot fuel gas are added besides lighting loads, and the newly added load in the hot pot peak season is greater than that in the hot pot slack season.
In order to further compare the loads before and after electric energy replacement, Figure 2b gives annual continuous load curves corresponding to the hot pot load, where the blue curve represents the annual continuous load curve before electric energy replacement and the red one is that after electric energy replacement. It can be obtained by comparing the two curves that electric energy replacement will elevate the peak load while the valley load nearly remains unchanged after replacement. In other electric energy replacement scenes, like electric heating, electric boilers and electric buses, when the original energy is replaced the electrical load has similar characteristics as hot pot loads, so electric energy replacement will increase the valley/peak differences of the electrical load.
Moreover, with continuous popularization of electric energy replacement, the peak load of distribution transformers continues to increase and some electric energy replacement points need to replace distribution transformers to ensure safe and stable operation of the distribution network. As the valley/peak difference of electrical loads after electric energy replacement is large, configuring conventional distribution transformers according to load peak will significantly increase the no-load losses of distribution transformers in low-load periods, while on-load capacity regulating distribution transformers can be switched to small-capacity operation in low-load periods, which can effectively reduce the no-load losses of distribution transformers. Therefore, replacing conventional distribution transformers with on-load capacity regulating distribution transformers can effectively solve the power loss problems caused by electric energy replacement.

2.2. Nodal Effective Load Prediction Considering Uncertainties after Electric Energy Replacement

Before planning on-load capacity regulating distribution transformers, the nodal effective load considering uncertainties in the life cycle of distribution transformers, which is set as 20 years [14,15], should be predicted first.

2.2.1. Probability Model of Load after Electric Energy Replacement

After electric energy replacement, the load consists of two parts, one is the conventional load, the other is the electric energy replacement load. Annual apparent power S0(t) (t = 1, 2, …, 8760) of the conventional load can be obtained by Supervisory Control and Data Acquisition (SCADA) and the annual apparent power ∆S(t) (t = 1, 2, …, 8760) of the electric energy replacement load in the first year of electric energy replacement is estimated by the annual consumption curve of the primary energy at electric energy replacement points and the transformational relation between this energy and electric energy. As it’s usually difficult to obtain all monitoring data of annual energy consumption at electric energy replacement points, we assume that the daily apparent power distribution of the electric energy replacement load in the same season is identical. Based on typical daily apparent power ∆Sc(t), ∆Sx(t), ∆Sq(t) and ∆Sd(t) (t = 1, 2, …, 24) of the electric energy replacement loads in four seasons (spring, summer, autumn and winter), the time periods with data missing in ∆S(t) (t = 1, 2, …, 8760) are supplied through (1) according to the relationships of typically daily turnover Rc, Rx, Rq and Rd in the four seasons with annual daily turnover R(t) (t = 1, 2, …, 365):
Δ S ( t ) = { R ( [ t 24 ] + 1 ) R d Δ S d ( t 24 × [ t 24 ] ) , [ t 24 ] [ 0 , 58 ] [ 334 , 364 ] R ( [ t 24 ] + 1 ) R c Δ S c ( t 24 × [ t 24 ] ) , [ t 24 ] [ 59 , 150 ] R ( [ t 24 ] + 1 ) R x Δ S x ( t 24 × [ t 24 ] ) , [ t 24 ] [ 151 , 242 ] R ( [ t 24 ] + 1 ) R q Δ S q ( t 24 × [ t 24 ] ) , [ t 24 ] [ 243 , 333 ] , t = 1 , 2 , , 8760
Considering the annual average growth rate g of load, apparent power S1,p(t) (t = 1, 2, …, 8760) in the first year of electric energy replacement is obtained according to (2) so as to further obtain the corresponding annual continuous apparent power curve. For electric automobile and electric bus charging stations, the charging load model in the charging station can be used to obtain annual apparent power S1,p(t) (t = 1, 2, …, 8760) in the first year of electric energy replacement [16,17]. Then the apparent powers Si,p(t) (i = 1, 2, …, 20; t = 1, 2, …, 8760) within 20 years after electric energy replacement are obtained according to (3):
S 1 , p ( t ) = ( 1 + g ) ( S 0 ( t ) + Δ S ( t ) ) , t = 1 , 2 , , 8760
S i , p ( t ) = ( 1 + g ) i 1 S 1 , p ( t ) , i = 1 , 2 , , 20 ; t = 1 , 2 , , 8760
Because the operating conditions of a distribution network are changeable, the actual apparent power within 20 years after electric energy replacement is not consistent with that predicted by (3). To describe the uncertainties, ∆Si,p(t) (i = 1, 2, …, 20; t = 1, 2, …, 8760) is used to represent the difference between the actual load and the predicted load, which is set to obey the normal distribution in this paper. Then apparent power Si,c(t) (i = 1, 2, …, 20; t = 1, 2, …, 8760) of load is obtained as follows:
{ S i , c ( t ) = S i , p ( t ) + Δ S i , p ( t ) Δ S i , p ( t ) ~ N ( μ i , σ i 2 ) , i = 1 , 2 , , 20 ; t = 1 , 2 , , 8760
where μi and σi2 are the average value and variance of the normal distribution random variable in the i(th) year.

2.2.2. Probability Models of Distributed Generations

Distributed generations (DGs) gradually connected to distribution networks will reduce the power supply pressure, but bring uncertainties to the load. To analyze the impacts of DGs on load, probability models of wind power and photovoltaic are considered in this paper.
(1) Probability model of wind power
A large amount of measured data on wind speed shows that the distribution of annual wind speed in most regions obeys a two-parameter Weibull distribution [18], and its probability density function and cumulative distribution function are:
{ f ( v ) = k c ( v c ) k 1 e ( v c ) k F ( v ) = 1 e ( v c ) k
where v is wind speed, c and k are scale and shape parameters of the Weibull distribution, respectively, reflecting the average wind speed and the skewness of the Weibull distribution. Considering the wind condition at night is different from that in the daytime, we choose Weibull distribution with parameter cd and kd to obtain the wind speed in the daytime (06:00–18:00) and that with parameter cn and kn to obtain the wind speed in the nighttime (18:00–06:00). The parameters are determined by the monitoring data of local wind speed. Then, based on the wind speed sampled and (6), the output power Pw(t) of wind power is obtained:
P w ( t ) = { 0 , 0 v ( t ) v i n o r v ( t ) v o u t P w r v r v i n ( v ( t ) v i n ) , v i n v ( t ) v r P w r , v r v ( t ) v o u t
where vin is cut-in wind speed, vr is rated wind speed, vout is cut-out wind speed, v(t) is wind speed, Pwr is rated power of wind power.
(2) Probability model of photovoltaic
The output power Pv(t) of photovoltaic is related to total area A, photoelectric conversion efficiency η and light intensity r(t) and the expression is:
P v ( t ) = r ( t ) A η
During the nighttime (18:00–06:00), there is no light, so the output power Pv(t) of photovoltaic is zero. For the daytime (06:00–18:00), a Beta distribution is used to describe the light intensity [19], and its probability density function is:
f ( r ) = Γ ( α + β ) Γ ( α ) Γ ( β ) ( r r max ) α 1 ( 1 r r max ) β 1
where r is light intensity, rmax is maximum light intensity, α and β are shape parameters of Beta distribution. Then from (7) and (8), the probability density function and cumulative distribution function of output power Pv(t) in the daytime are obtained, shown in (9), where Pvmax is the output power of maximum light intensity:
{ f ( P v ( t ) ) = Γ ( α + β ) Γ ( α ) Γ ( β ) ( P v ( t ) P v max ) α 1 ( 1 P v ( t ) P v max ) β 1 F ( P v ( t ) ) = Γ ( α + β ) Γ ( α ) Γ ( β ) 0 P v ( t ) P v max t α 1 ( 1 t ) β 1 d t
Considering the development of DGs during the planning cycle, the rated power Pwr and Pvmax of wind power and photovoltaic are set to increase by year at rates of mw and mv until the penetration rate reaches dmax.

2.2.3. Nodal Effective Load Prediction Considering Uncertainties

According to the probability models given above, the apparent power Si,c(t) of load, output power Pi,w(t) of wind power and Pi,v(t) of photovoltaic in time period t of the i(th) year can be obtained by a Monte Carlo method. The power factors of wind power and photovoltaic are set to be a constant qw and qv. Then the apparent power Si,t(t) (i = 1, 2, …, 20; t = 1, 2, …, 8760) of nodal effective load considering uncertainties after electric energy replacement is obtained:
S i , t ( t ) = S i , c ( t ) d = 1 n w P i , w d ( t ) q w d = 1 n v P i , v d ( t ) q v , i = 1 , 2 , , 20 ; t = 1 , 2 , , 8760
where the superscript d represents the d(th) wind power or photovoltaic, nw and nv are the total numbers of wind power and photovoltaic within the power supply range of the distribution transformer, respectively. In consideration of distribution network’s development, when the predicted load Si,t(t) exceeds the capacity SN of the distribution transformer after upgrading and reconstruction, it’s considered that some load is supplied by other lines or transformers, and then apparent power Si(t) (i = 1, 2, …, 20; t = 1, 2, …, 8760) of distribution transformer load after electric energy replacement is obtained as shown in (11):
S i ( t ) = { S i , t ( t ) , S i , t ( t ) < S N S N , S i , t ( t ) S N , i = 1 , 2 , , 20 ; t = 1 , 2 , , 8760

3. Replacing Criterion for On-Load Capacity Regulating Distribution Transformers

Distribution transformer planning after electric energy replacement needs to determine the replaceable points for on-load capacity regulating distribution transformers. In order to get the replacement criterion, an active loss analysis of a conventional distribution transformer and an on-load capacity regulating distribution transformer is carried out as follows.
The active loss of a distribution transformer consists of no-load losses caused by excitation conductance and load losses caused by the winding resistance and it’s the main part of the losses in the distribution network. For a conventional distribution transformer, the active loss P l o s s n ( t ) can be calculated according to the following equation:
P l o s s n ( t ) = P 0 + P k S 2 ( t ) S N 2
where SN is rated capacity of distribution transformer, P0 and Pk are the no-load loss and short-circuit loss of the distribution transformer and S(t) is the apparent power of the distribution transformer load.
An on-load capacity regulating distribution transformer has two capacities and can automatically switch capacity through an on-load capacity regulating switch according to the actual load. Then the active loss P l o s s c ( t ) of an on-load capacity regulating distribution transformer is obtained as follows:
P l o s s c ( t ) = { P 0 L + P k L S 2 ( t ) S N L 2 , S ( t ) < S c P 0 H + P k H S 2 ( t ) S N H 2 , S ( t ) S c
where SNH and SNL are the large and small rated capacities of the on-load capacity regulating distribution transformer; Sc is the critical capacity regulating load of the on-load capacity regulating distribution transformer, and its value is acquired through theoretical calculation [8]. P0H and P0L are the no-load losses of the on-load capacity regulating distribution transformer under large-capacity and small-capacity operations, respectively, and PkH and PkL are the short-circuit losses under large-capacity and small-capacity operations of the on-load capacity regulating distribution transformer, respectively.
In order to compare the loss characteristics of an on-load capacity regulating distribution transformer and a conventional distribution transformer, saved active loss ∆Ploss(t) and annual saved active loss ∆Ploss after a conventional distribution transformer is replaced by an on-load capacity regulating distribution transformer are obtained according to (12) and (13) as follows:
Δ P l o s s ( t ) = { P 0 P 0 L + ( P k S N 2 P k L S N L 2 ) S 2 ( t ) , S ( t ) < S c P 0 P 0 H + ( P k S N 2 P k H S N H 2 ) S 2 ( t ) , S ( t ) S c
Δ P l o s s = 1 8760 Δ P l o s s ( t ) τ = ( P 0 P 0 H ) t H + ( P k S N 2 P k H S N H 2 ) 1 8760 S H 2 ( t ) τ + ( P 0 P 0 L ) t L + ( P k S N 2 P k L S N L 2 ) 1 8760 S L 2 ( t ) τ
where tH is the annual operation time of an on-load capacity regulating distribution transformer under large-capacity operation, tL is the annual operation time of an on-load capacity regulating distribution transformer under small-capacity operation, τ is equal to 1 h, SH(t) and SL(t) are the apparent powers of the on-load capacity regulating distribution transformer under large-capacity and small-capacity operations, and their values are determined according to the following equation:
S H ( t ) = { 0 , S ( t ) < S c S ( t ) , S ( t ) S c ; S L ( t ) = { 0 , S ( t ) S c S ( t ) , S ( t ) < S c
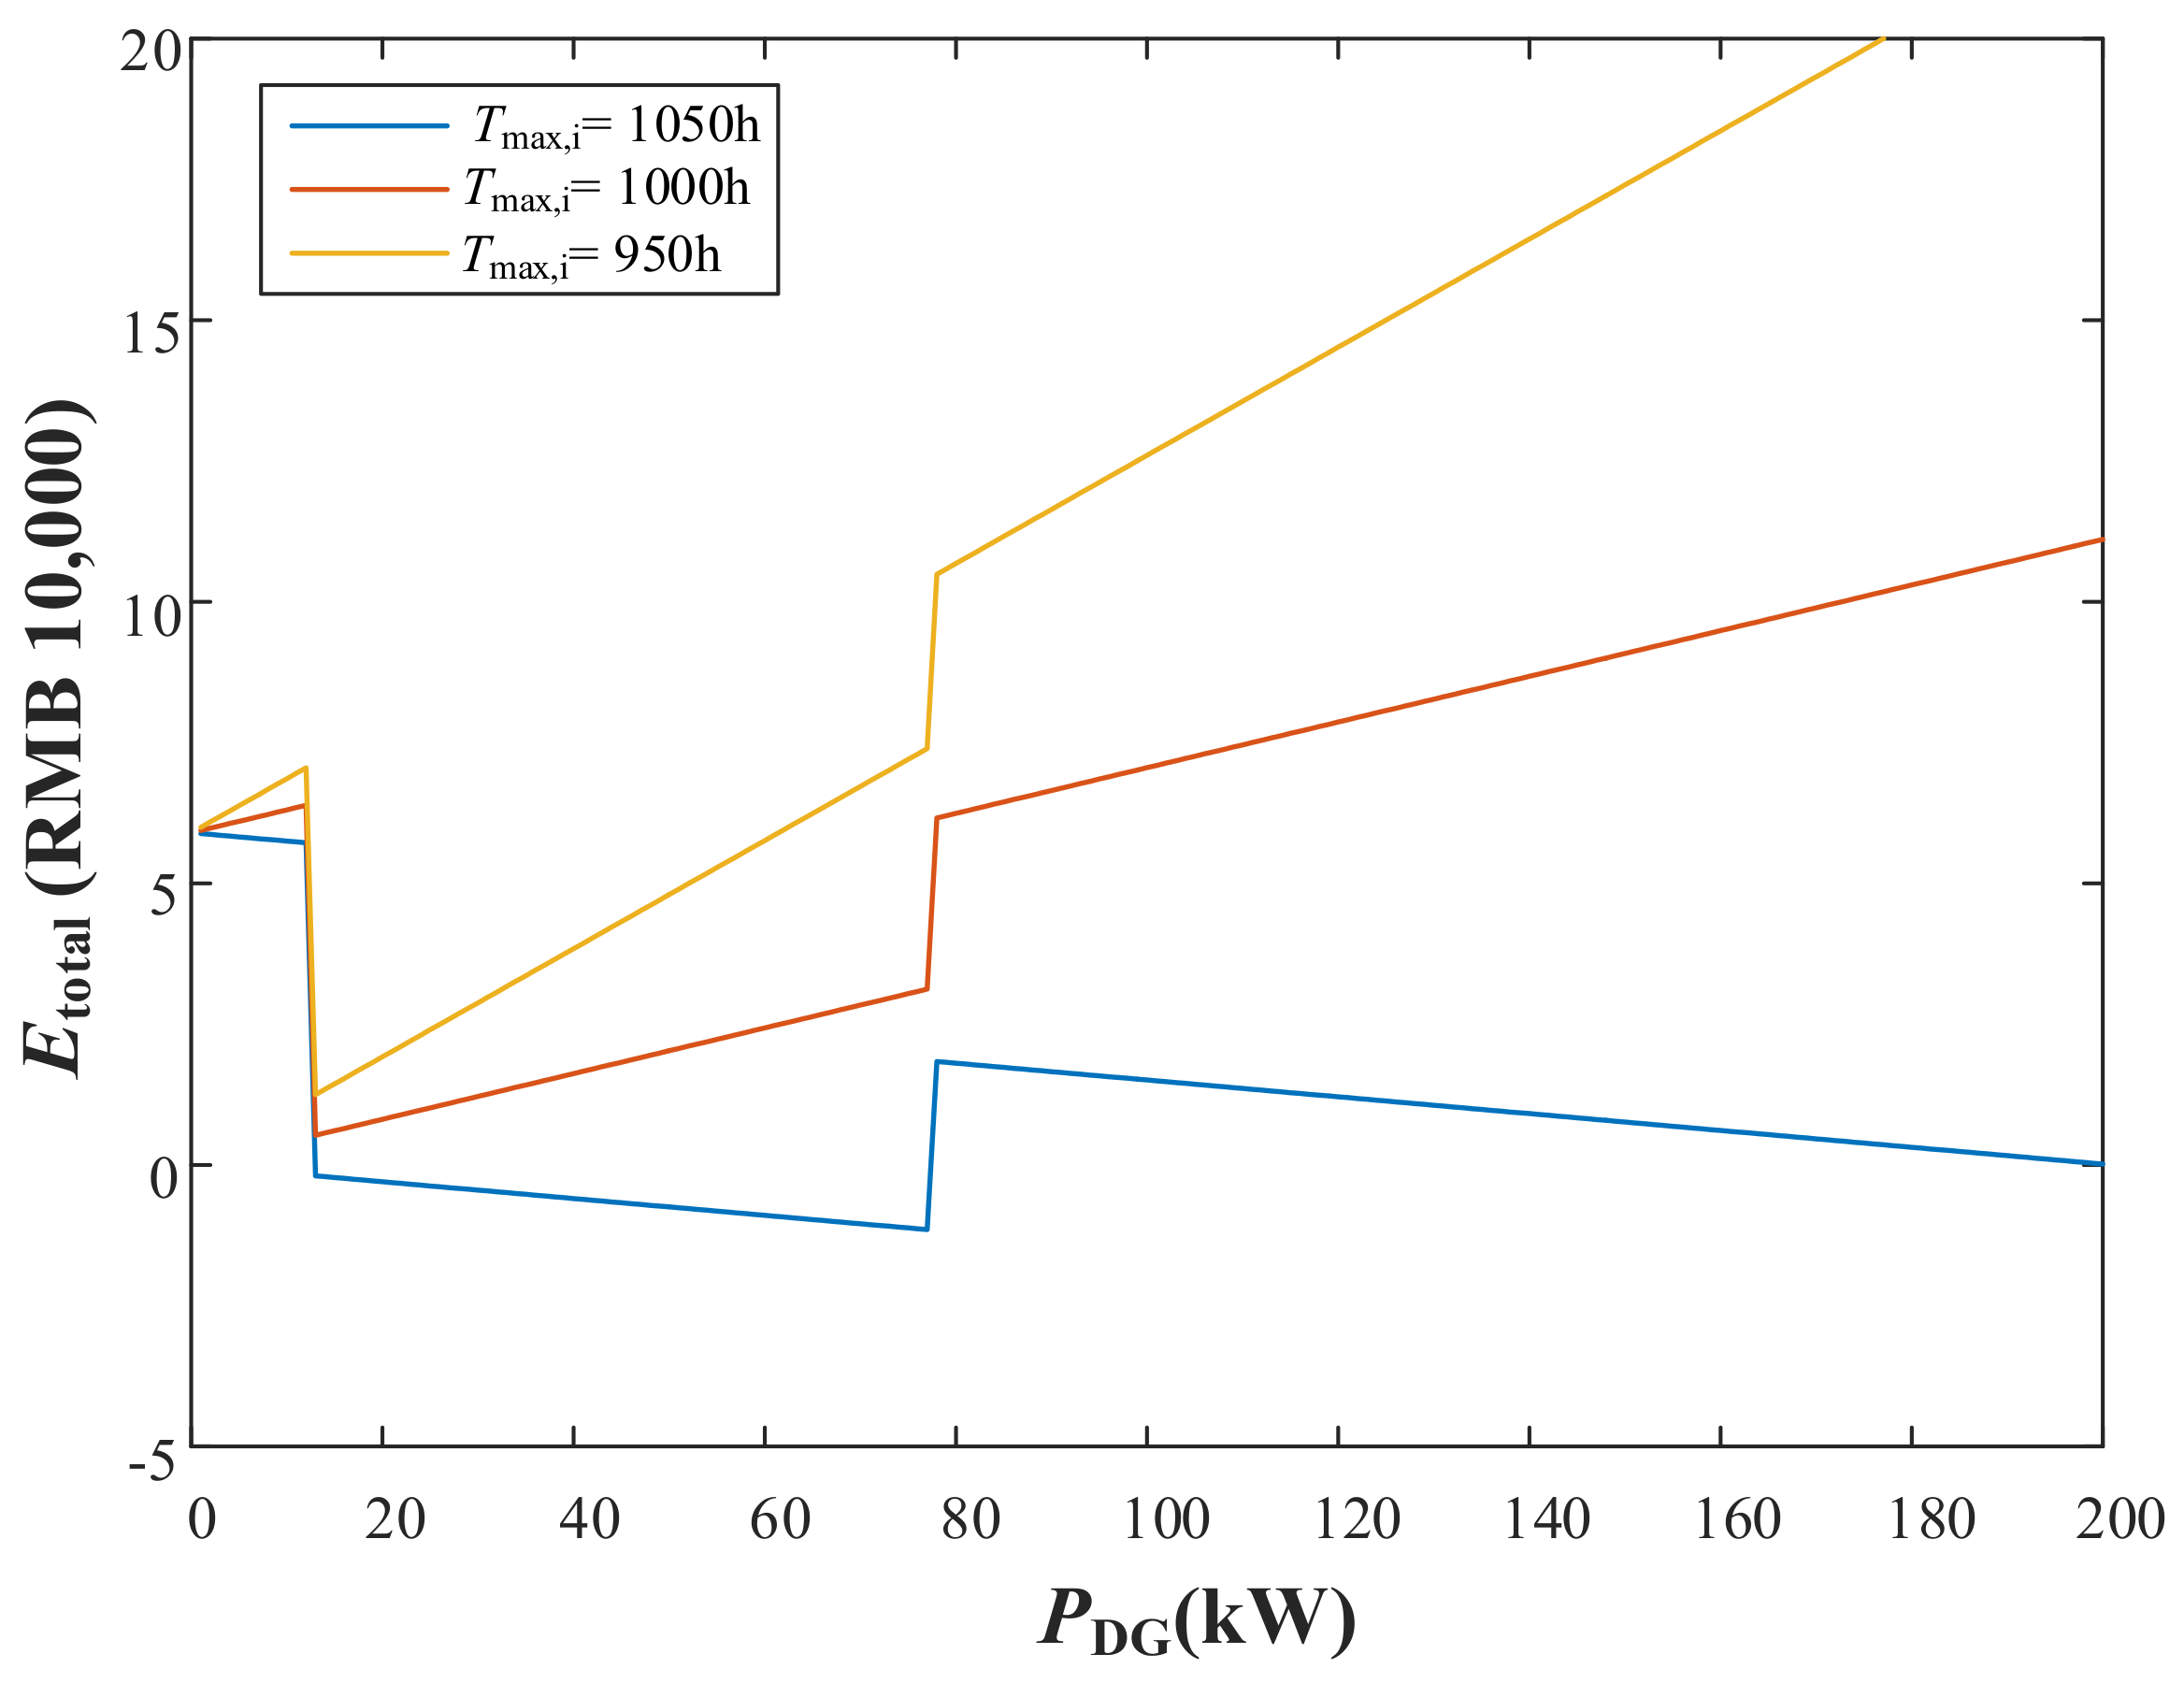
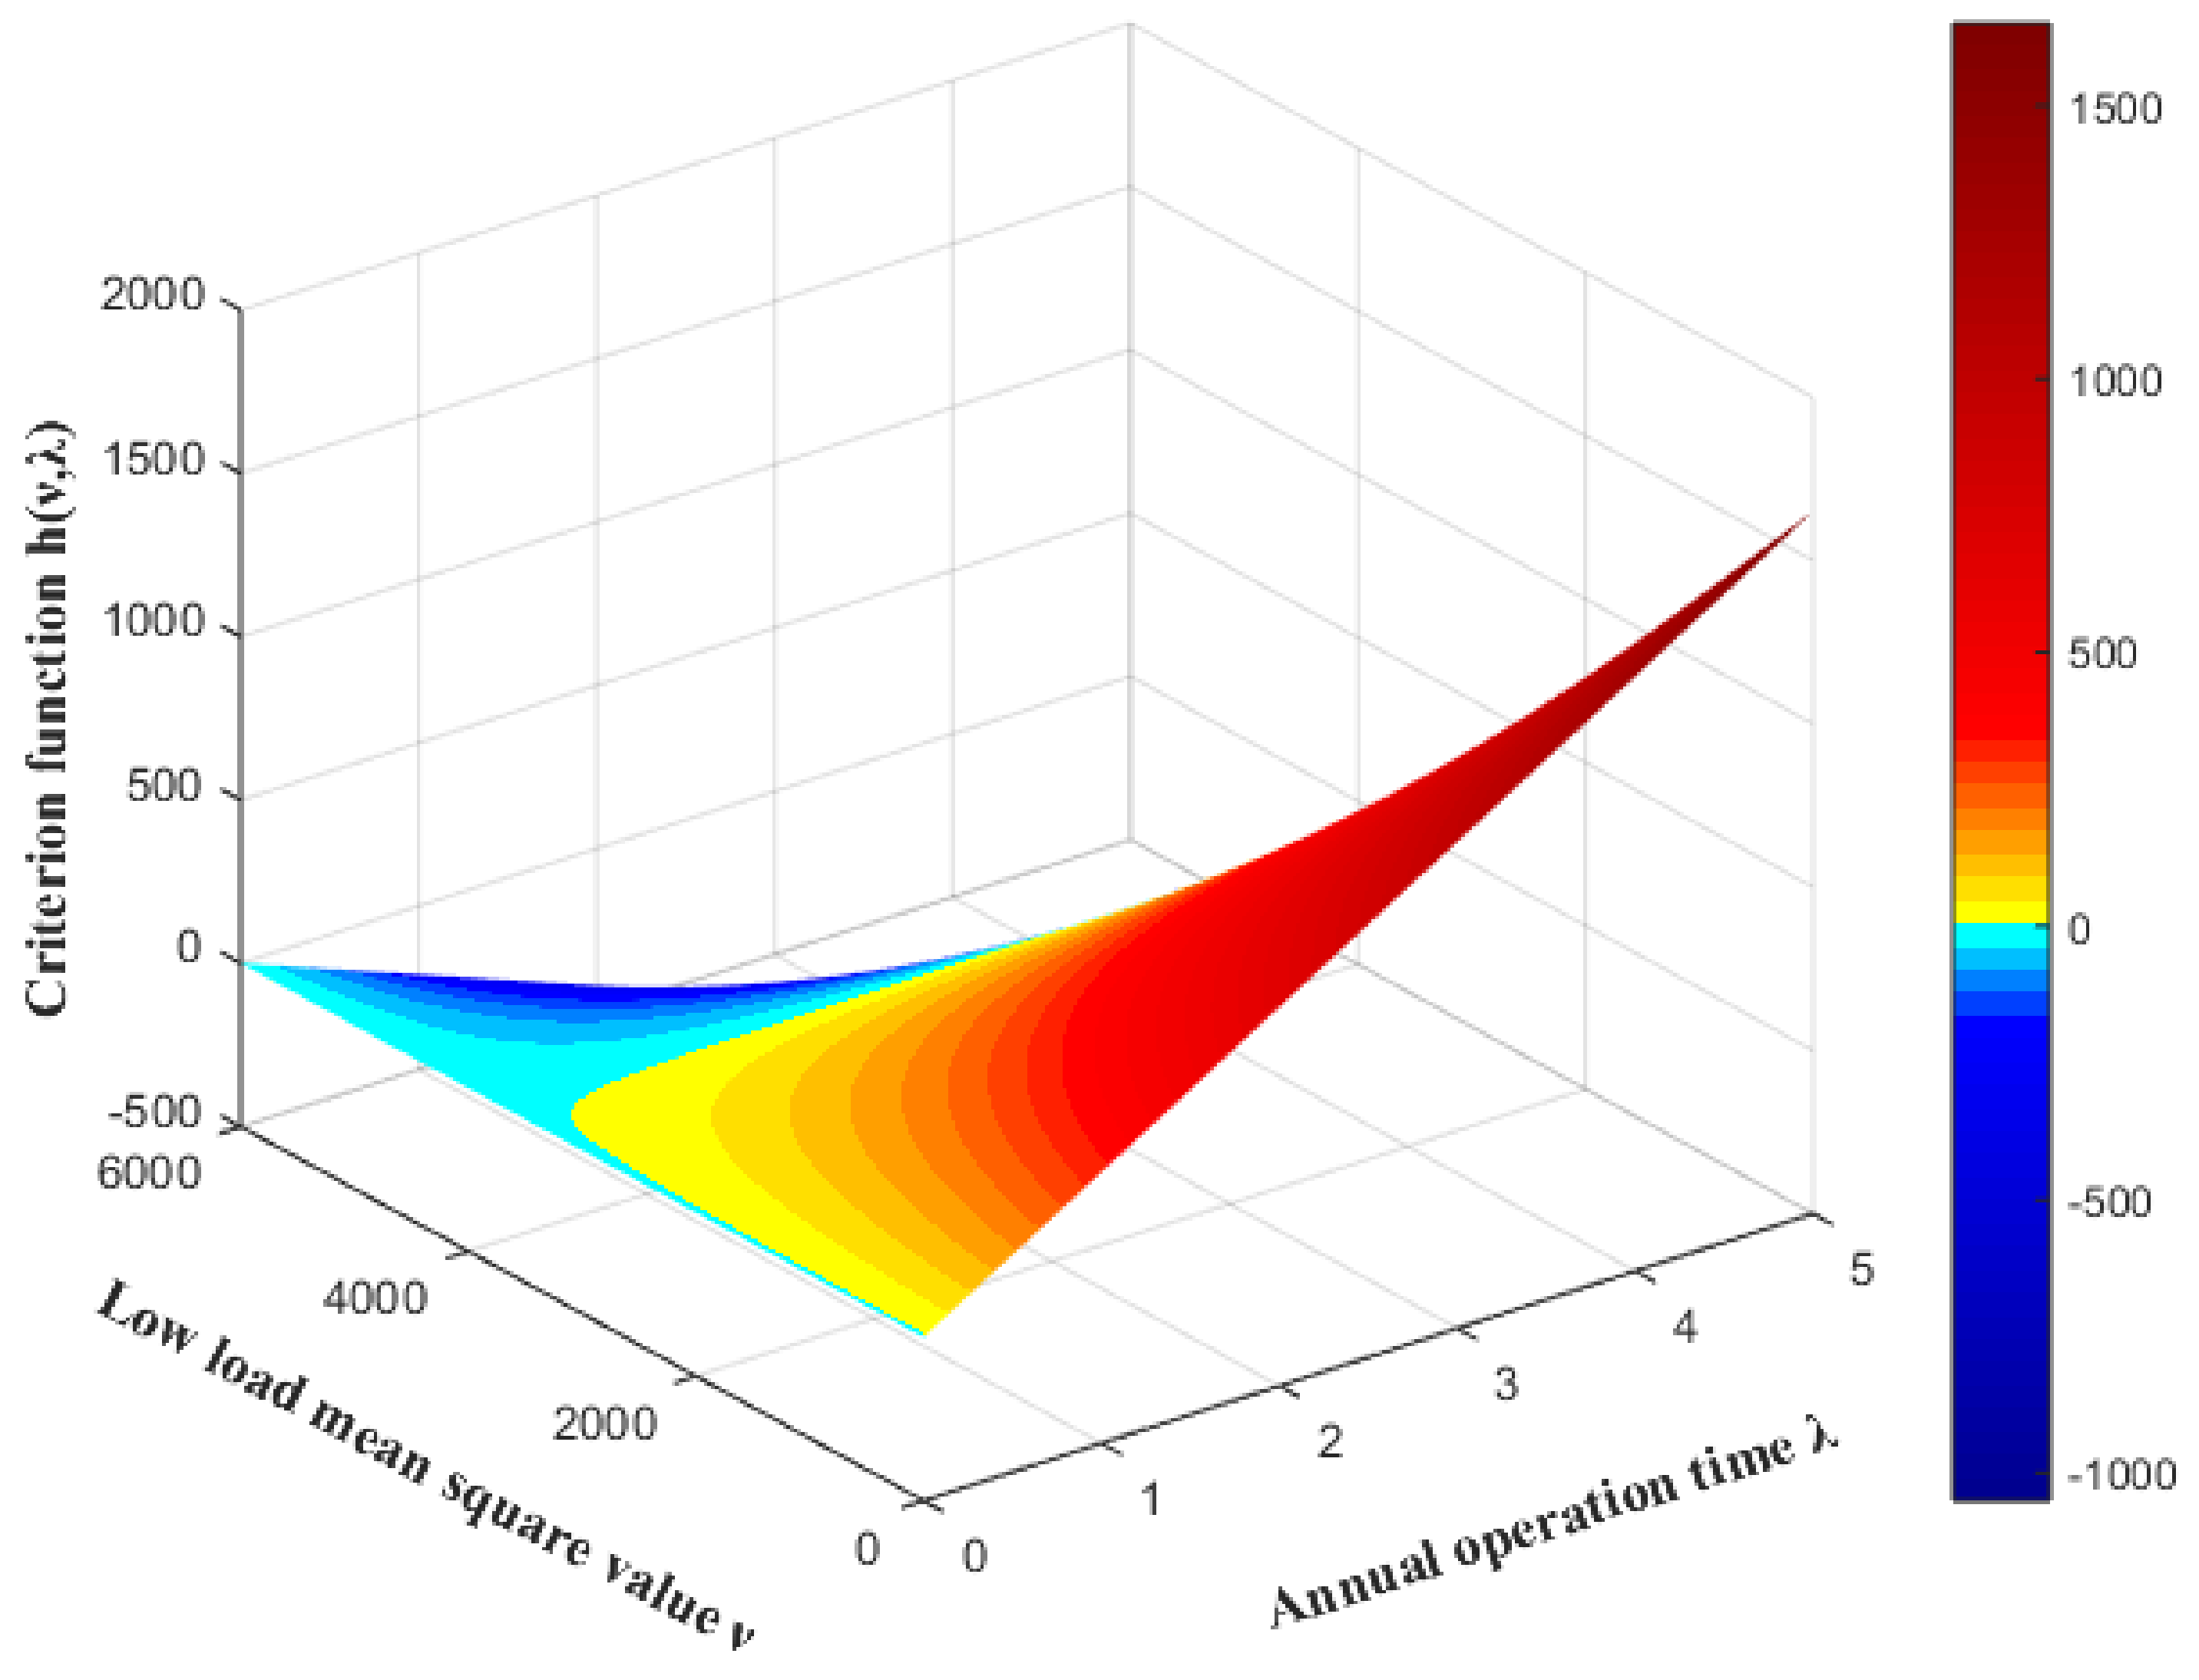
When the annual active loss of on-load capacity regulating distribution transformer is lower than that of the conventional distribution transformer, i.e., the annual saved active loss is greater than 0, an on-load capacity regulating distribution transformer is used to replace the conventional distribution transformer. From (15) the annual saved active loss is related to the annual electrical load, so whether to replace a conventional distribution transformer with an on-load capacity regulating distribution transformer is decided by the annual electrical load characteristics. In order to characterize the annual electrical load, three characteristic indexes—high load mean square value μ, low load mean square value ν and annual operation time ratio λ of annual continuous apparent power curves—were put forward in this paper.
(1) High load mean square value μ
The load higher than the critical capacity regulating load of an on-load capacity regulating distribution transformer is called high load, and an on-load capacity regulating distribution transformer operates in large-capacity status under high load. In order to measure the load level of an on-load capacity regulating distribution transformer in large-capacity operation, the high load mean square value is defined as follow according to the annual continuous apparent power curve:
μ = 1 t H 1 8760 S H 2 ( t ) τ = 1 t H 1 t H f 2 ( t ) τ = 1 f 1 ( S c ) 1 f 1 ( S c ) f 2 ( t ) τ
where f(t) is the annual continuous apparent power curve function and f−1(t) is the inverse function of f(t). In the annual continuous apparent power curve, the aggregated duration of load greater than Sc is the large-capacity operation time tH, so tH can be changed to f−1(Sc) to reduce the number of variables.
(2) Low load mean square value ν
The load lower than the critical capacity regulating load of an on-load capacity regulating distribution transformer is called low load, and an on-load capacity regulating distribution transformer operates in small-capacity status under low load. The low load operation time is equal to the time obtained by reducing the high load operation time from the annual electrification time of the distribution transformer, so a low load mean square value is obtained as:
ν = 1 t L 1 8760 S L 2 ( t ) τ = 1 t L t H t M f 2 ( t ) τ = 1 f 1 ( S min ) f 1 ( S c ) f 1 ( S c ) f 1 ( S min ) f 2 ( t ) τ
where tM is the annual electrification time of the distribution transformer, Smin is the minimum apparent power. Similarly, the aggregated duration of load greater than Smin is the annual electrification time tM, so tM can be changed to f−1(Smin) to reduce the number of variables.
(3) Annual operation time ratio λ
Annual operation time ratio represents the high/low load operation time difference, and it’s decided by the annual continuous apparent power curve and critical capacity regulating load of the on-load capacity regulating distribution transformer:
λ = t L t H = t M t H t H = f 1 ( S min ) f 1 ( S c ) f 1 ( S c )
Then, based on high load mean square value μ, low load mean square value ν and annual operation time ratio λ, the replacement criterion for on-load capacity regulating distribution transformers is obtained according to (15):
{ h ( μ , ν , λ ) = k 1 + k 2 μ + k 3 λ + k 4 λ ν > 0 k 1 = P 0 P 0 H , k 2 = P k S N 2 P k H S N H 2 , k 3 = P 0 P 0 L , k 4 = P k S N 2 P k L S N L 2
where k1, k2, k3 and k4 are the loss difference coefficients between a conventional distribution transformer and an on-load capacity regulating distribution transformer. It’s noteworthy that this criterion is a necessary but not sufficient condition for replacing conventional distribution transformers with on-load capacity regulating distribution transformers, i.e., the cost benefit of on-load capacity regulating distribution transformer replacement should be further considered to decide whether to replace the distribution transformers.
Therefore, according to the three characteristic indexes of annual continuous apparent power curve and replacement criterion for on-load capacity regulating distribution transformers, the distribution transformer replaceable points can be obtained, then a cost benefit analysis is needed to determine whether the replaceable points are configured with on-load capacity regulating distribution transformers.

4. Planning Method of on-Load Capacity Regulating Distribution Transformers in Urban Distribution Network after Electric energy Replacement

4.1. Cost Benefit Analysis of Replacing with on-Load Capacity Regulating Distribution Transformer

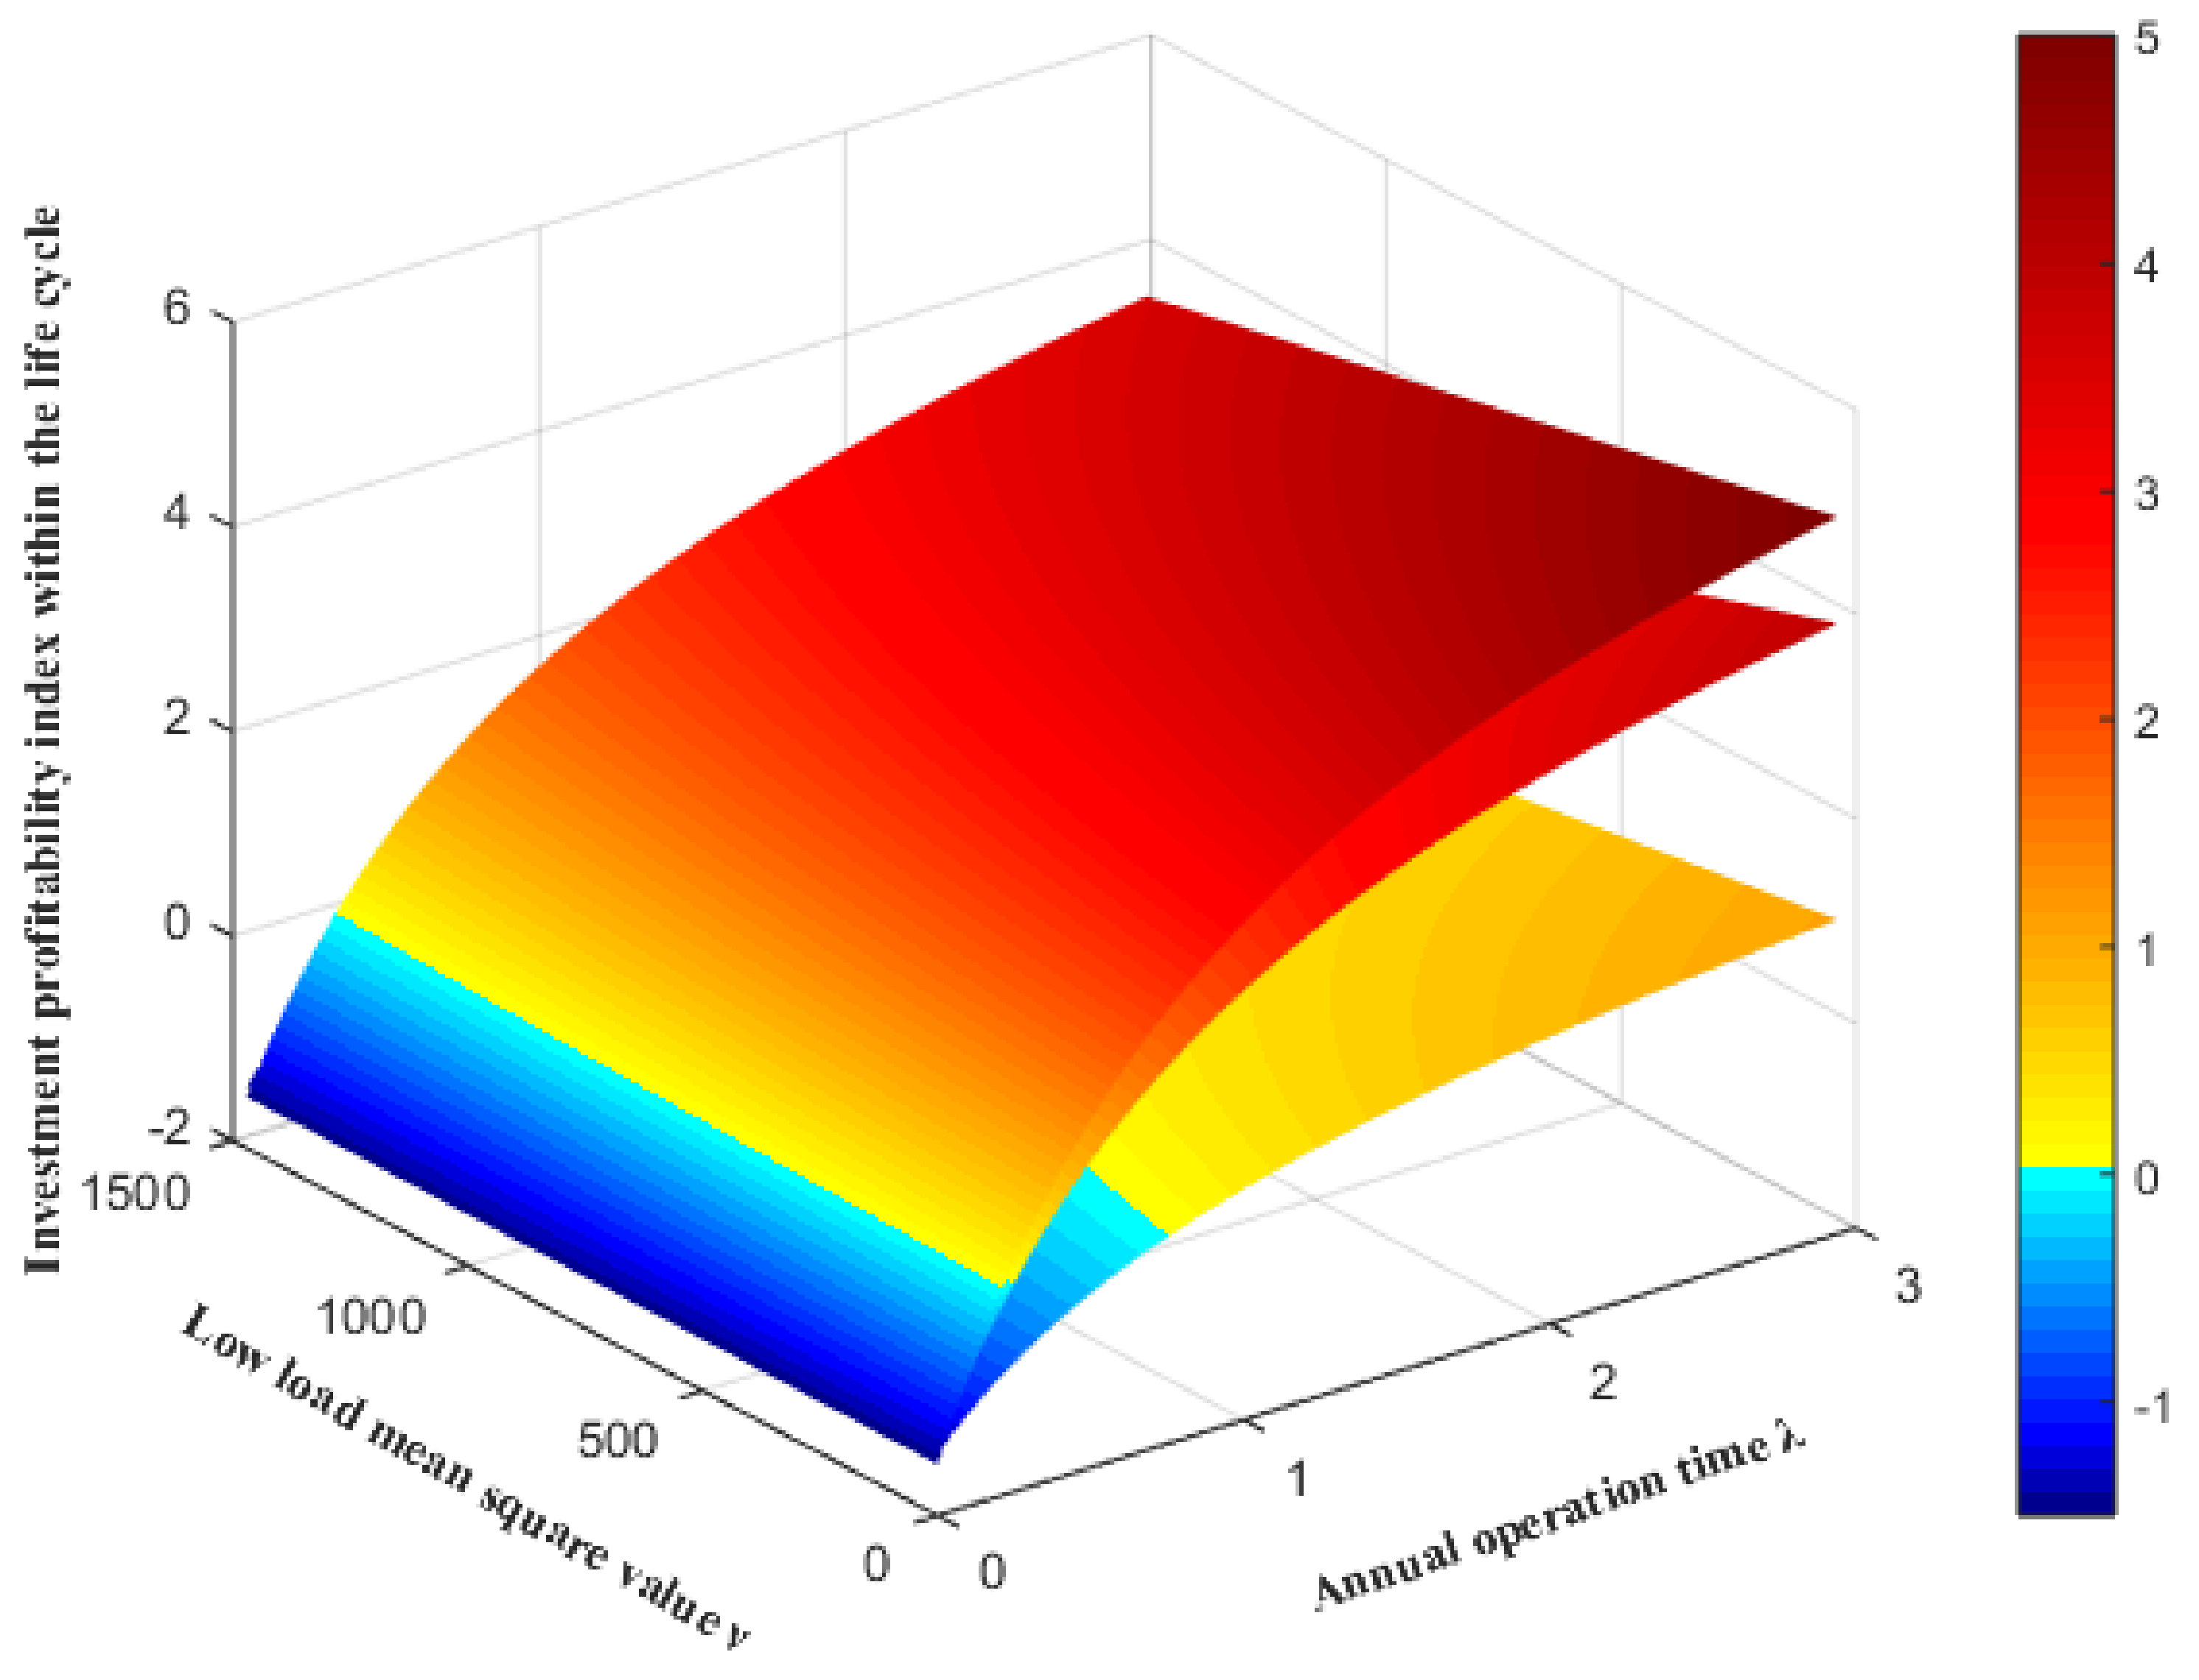
An on-load capacity regulating distribution transformer needs more investment while a conventional distribution transformer has more active losses. In order to measure the cost benefit of replacing a conventional distribution transformer with an on-load capacity regulating distribution transformer, three cost benefit indexes—investment profitability index FE within the life cycle, investment cost recouping index FT and capacity regulating cost index FC—are proposed.
(1) Investment profitability index FE within the life cycle
An on-load capacity regulating distribution transformer has a higher acquisition price and operations & maintenance cost and lower active losses when compared with a conventional distribution transformer [20]. Therefore, in order to characterize the economic benefit created by replacing a conventional distribution transformer with an on-load capacity regulating distribution transformer during the life cycle, the investment profitability index FE within the life cycle is proposed in this paper as:
F E = ϕ p r i c e i = 1 20 Δ P l o s s . i C M ( χ p r i c e θ p r i c e ) = ϕ p r i c e i = 1 20 h ( μ i , ν i , λ i ) t M i 1 + λ i C M ( χ p r i c e θ p r i c e )
where the subscript i represents the parameter in the i(th) year. χprice is the price of an on-load capacity regulating distribution transformer. When the capacity of a distribution transformer is not enough for the load, θprice is the price of a planned conventional distribution transformer, when the capacity is enough, θprice is 0. ϕprice is the hourly electric charge and CM is the increment of operations & maintenance cost after a conventional distribution transformer is replaced by an on-load capacity regulating distribution transformer. As faults of on-load capacity regulating distribution transformers not only include all faults of conventional distribution transformers but also include faults of the on-load capacity regulating switch, the increment CM of operations & maintenance cost is the sum of the operations & maintenance cost of an on-load capacity regulating switch within the life cycle and the life of distribution transformer is set as 20 years in this paper:
C M = C c a p 20
where Ccap is the average annual operations & maintenance cost of an on-load capacity regulating switch.
(2) Investment cost recouping index FT
Reconstruction investment is needed when conventional distribution transformers are replaced by on-load capacity regulating distribution transformers. The investment cost includes the acquisition cost and operations & maintenance cost of distribution transformers. When the on-load capacity regulating distribution transformer is put into operation, electric charge savings brought by the reduction of active losses will be taken as the means of recouping the reconstruction investment cost, but the reconstruction funds of distribution networks are limited and in consideration of the investment payback period of the reconstruction fund, the cost-recovery time is taken as the investment cost recouping index FT for evaluating replacement with on-load capacity regulating distribution transformers:
1 F T Δ P l o s s ( t ) τ = χ price + C M θ price ϕ price
(3) Capacity regulating cost index FC
The on-load capacity regulating switch is an important constituent part of an on-load capacity regulating distribution transformer, and its service life is related to the switching times of the transformer capacity, i.e., the greater the transformer capacity switching times, the more easily the on-load capacity regulating switch will suffer from a fault, so the load’s requirement for switching times of an on-load capacity regulating switch is incorporated into the cost benefit analysis of replacing with on-load capacity regulating distribution transformers, and capacity regulating cost index FC is defined as follows:
F C = R p r i c e n t = 1 8760 × 20 | N T , t N T , t 1 |
where NT,t is the operating state of an on-load capacity regulating distribution transformer, NT,t = 1 expresses that it operates in large-capacity status while NT,t = 0 means that it operates in small-capacity status; Rprice is the price of an on-load capacity regulating switch; n is the maximum switching times of the on-load capacity regulating switch.

4.2. Planning Model of on-Load Capacity Regulating Distribution Transformers in Urban Distribution Network after Electric Energy Replacement

Distribution transformer upgrading and reconstruction which matches electric energy replacements includes the capacity expansion of conventional distribution transformers and their replacement with on-load capacity regulating distribution transformers: (1) capacity expansion of conventional distribution transformers refers to the fact that original distribution transformer capacity must be expanded when it can’t satisfy the load after electric energy replacement, and it can be directly replaced by large-capacity on-load capacity regulating distribution transformers, or large-capacity conventional distribution transformers for capacity expansion; (2) replacement with on-load capacity regulating distribution transformers means that when the present distribution transformer capacity is enough, it should be replaced by on-load capacity regulating distribution transformers to save electric energy losses in consideration that the loss of present distribution transformers is great.
In reality, distribution transformer upgrading and reconstruction funds which match electric energy replacement are usually limited, and replacement can’t be implemented for all distribution transformer replaceable points. On the condition that only one distribution transformer is accessed at each electric energy replacement point, a distribution transformer replaceable point set Ω is obtained according to the replacement criterion for on-load capacity regulating distribution transformers as shown in (20), and the replaceable points in set Ω are taken as optimization variables to construct an on-load capacity regulating distribution transformer planning model in urban distribution networks. The optimization variable xj is the state about whether a conventional distribution transformer in position j is replaced by an on-load capacity regulating distribution transformer. If it’s equal to 1, it means that the conventional distribution transformer is replaced by an on-load capacity regulating distribution transformer; and if it’s equal to 0, it means no replacement, and then:
x j { 0 , 1 } j Ω
From the cost benefit analysis of replacement with an on-load capacity regulating distribution transformer in Section 4.1, it can be known that the optimal planning scheme of distribution transformers needs to realize the maximum investment profitability index FE within the life cycle as well as the minimum investment cost recouping index FT and capacity regulating cost index FC. A multi-objective optimization [21,22] approach is used to establish the planning model of on-load capacity regulating distribution transformers in urban distribution networks after electric energy replacement. Therefore, a normalized weighing of the above indexes is implemented to obtain a comprehensive benefit index F which is taken as objective function of the planning model:
max F = j Ω ( ( w E F E , j max { F E } w T F T , j max { F T } w C F C , j max { F C } ) x j )
where wE, wT and wC are the weighing coefficients of the three cost benefit indexes, respectively, and they are constants within 0~1. The pecking-order comparison method is used to determine the weighing coefficients wE, wT and wC, according to the importance of the three cost benefit indexes. Xij (i = 1, 2, 3; j = 1, 2, 3; ij), satisfying (27), is used to measure the importance of index i relative to index j. The larger the number is, the greater the importance is. After comparison, the values in one row are summed up, and the final weight is calculated by dividing the total value of row by the total sum, shown in Table 1. Then wE, wT and wC are successively equal to the weight from up to bottom:
X i j + X j i = 5 , X i j { 0 , 1 , 2 , 3 , 4 , 5 }
Moreover, distribution transformer upgrading and reconstruction which matches electric energy replacement needs to satisfy the overall investment constraint, so the total sum of the capacity expansion cost of conventional distribution transformers, acquisition cost of on-load capacity regulating distribution transformers and incremental operations & maintenance cost within the life cycle should be smaller than the total investment E of distribution transformers:
j Ω ( ( χ p r i c e , j + C M , j θ price , j ) x j ) + j Φ θ price , j E
where subscript j represents the parameter corresponding to position j, and capacity upgrading set Φ is the set of the distribution transformers that can’t satisfy the load after electric energy replacement. To sum up, the planning model of on-load capacity regulating distribution transformer in urban distribution network after electric energy replacement is as follows:
max F = j Ω ( ( w E F E , j max { F E } w T F T , j max { F T } w C F C , j max { F C } ) x j ) s . t . { j Ω ( ( χ p r i c e , j + C M , j θ price , j ) x j ) + j Φ θ price , j E x j { 0 , 1 } j Ω

4.3. Calculation Procedure of on-Load Capacity Regulating Distribution Transformer Planning in Urban Distribution Network after Electric Energy Replacement

According to the replacement criterion for on-load capacity regulating distribution transformers and its planning model, the calculation procedure of on-load capacity regulating distribution transformer planning in an urban distribution network after electric energy replacement is obtained as follows:
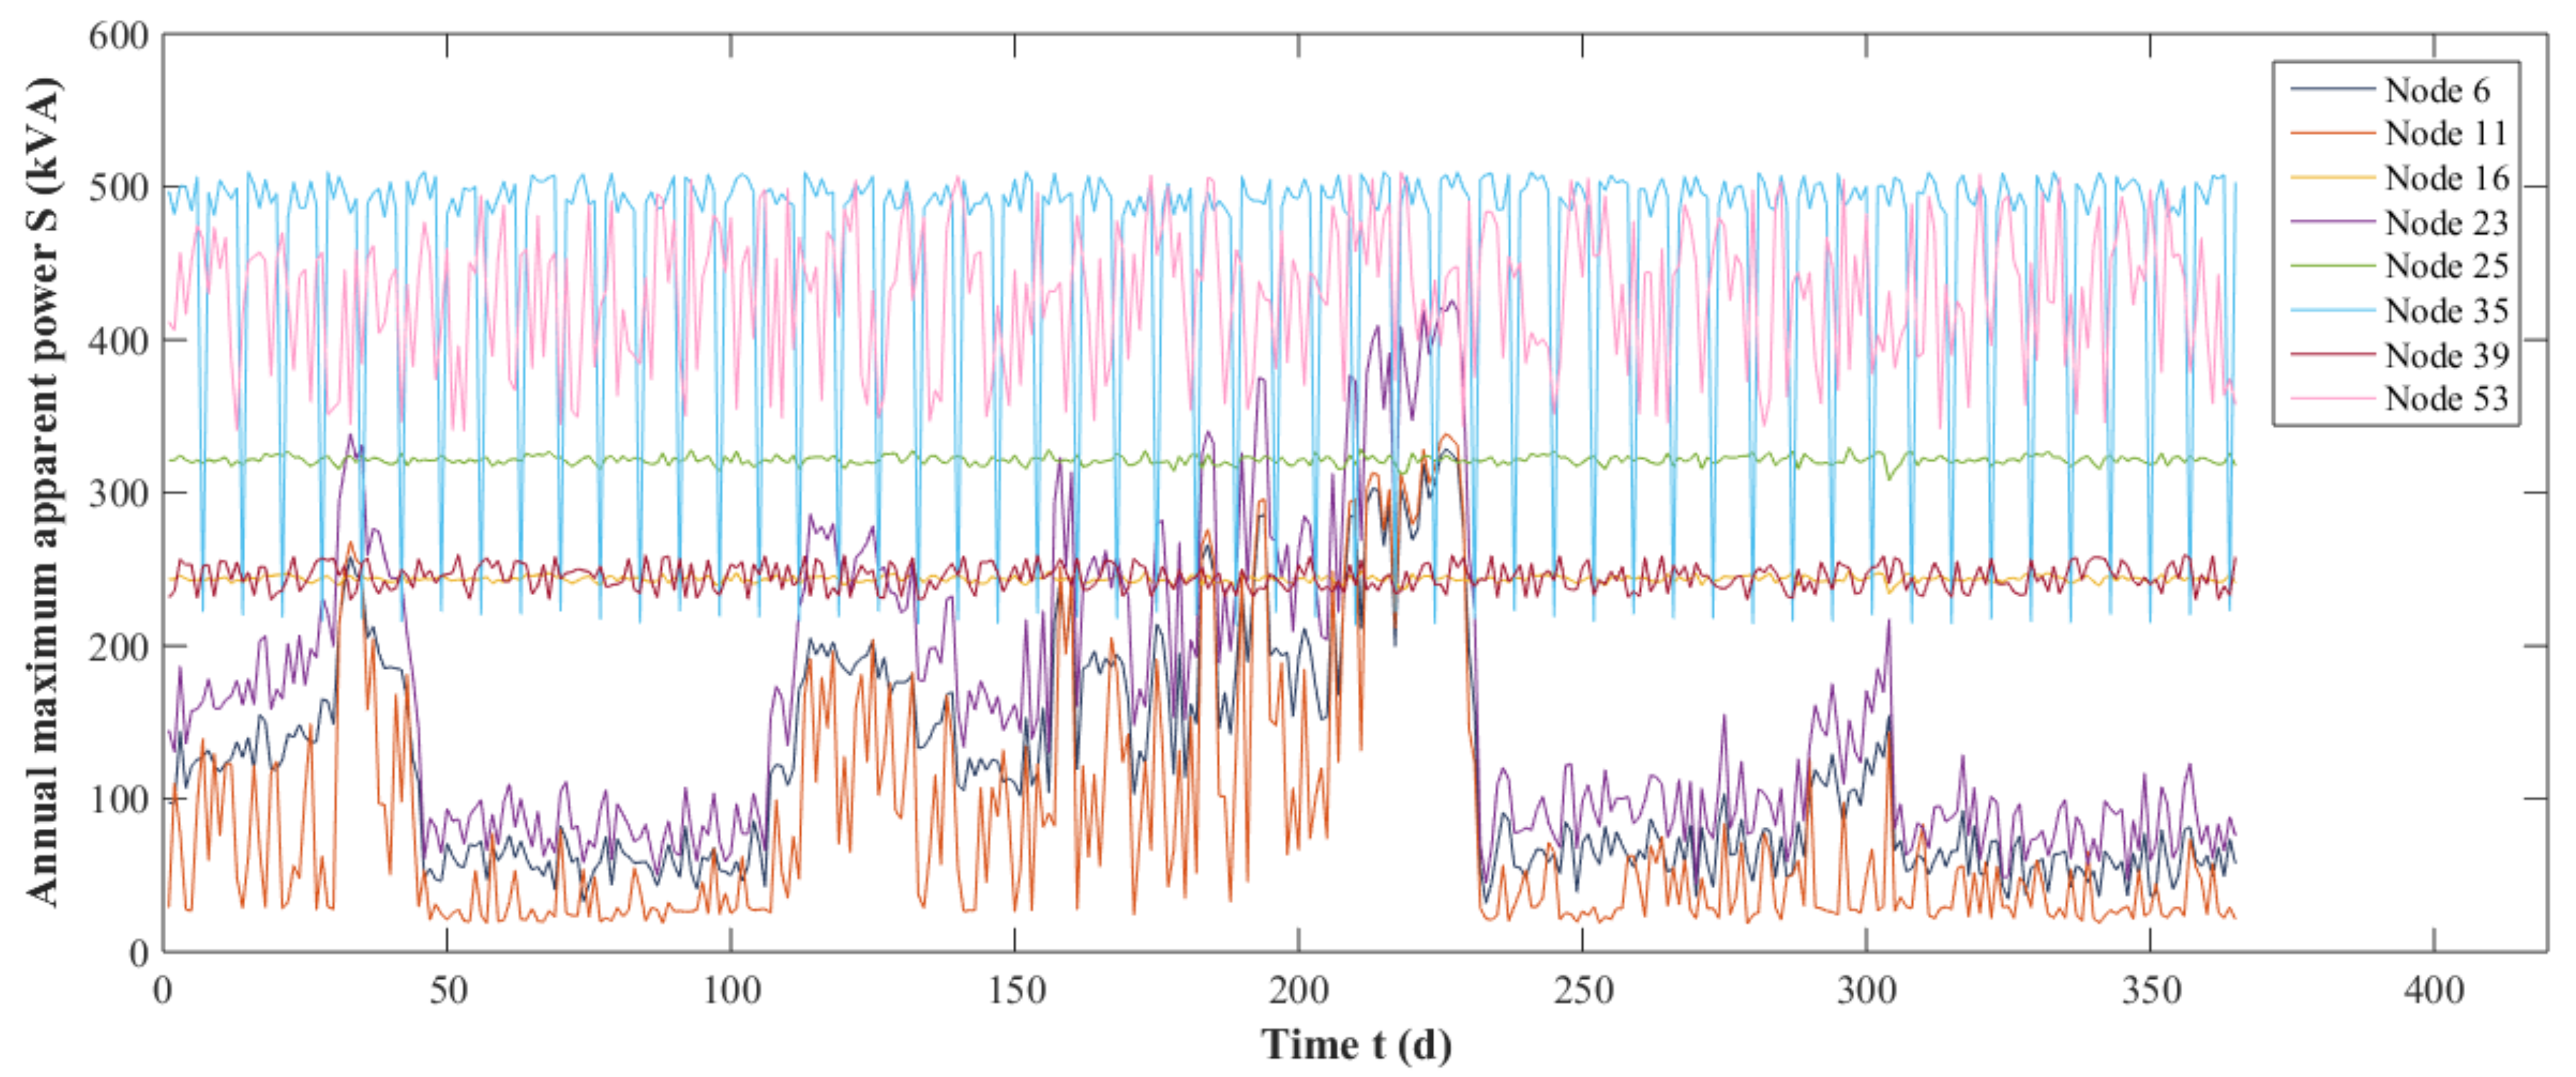
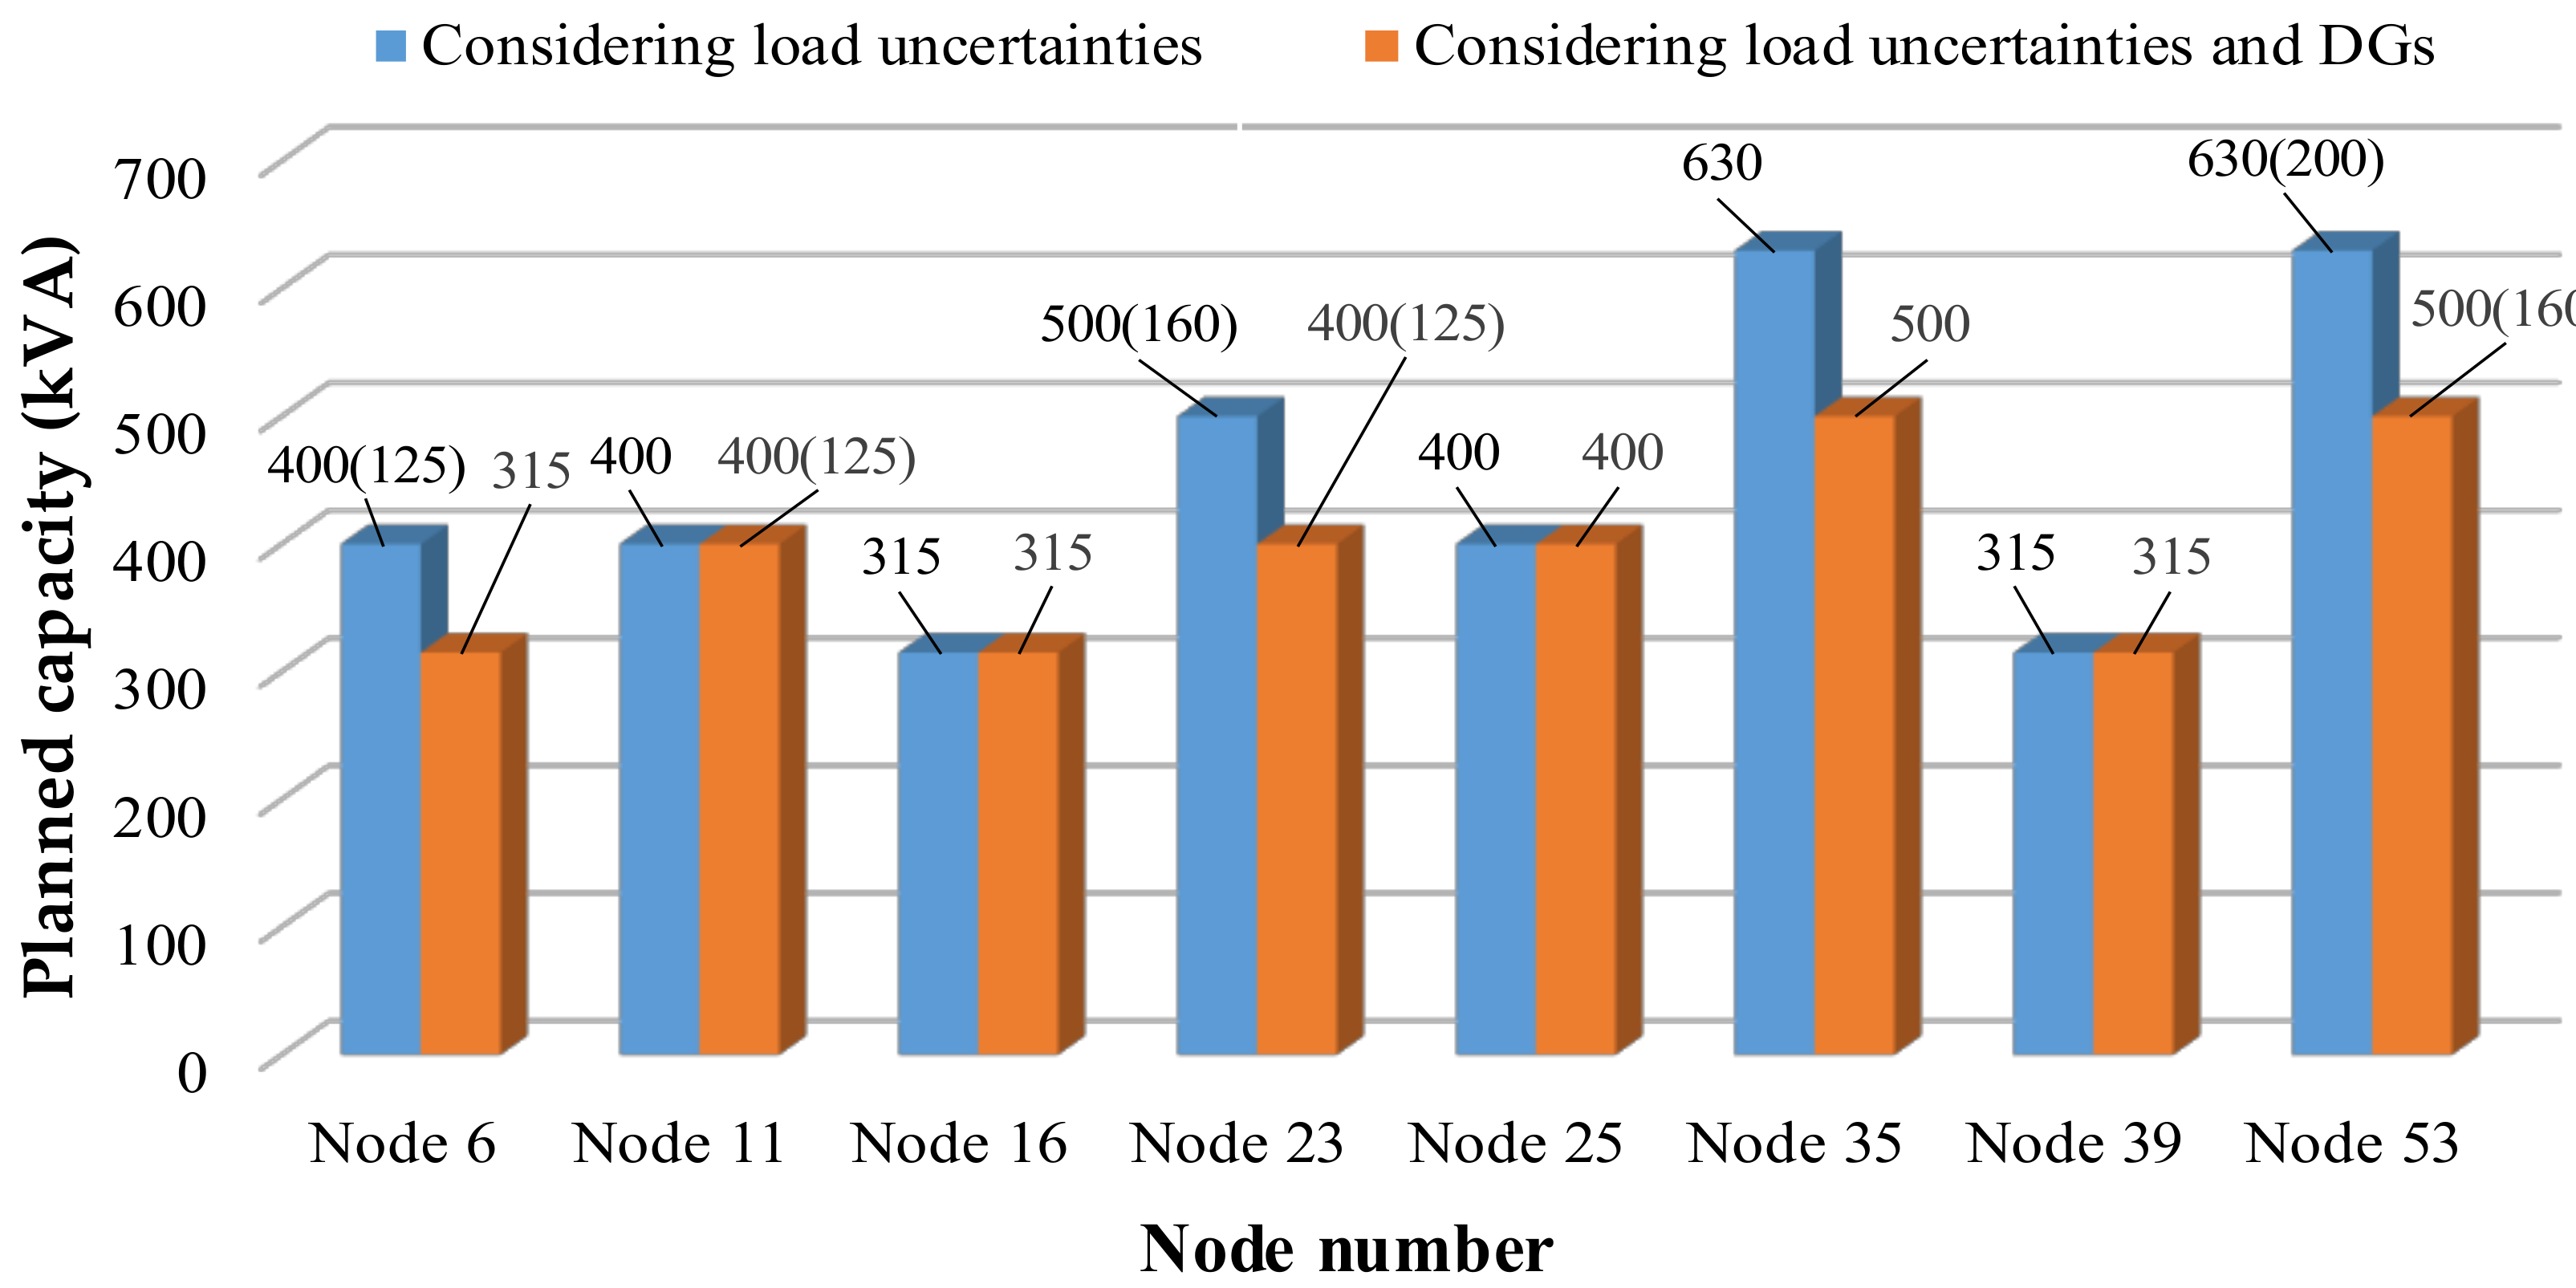
Step 1: A Monte Carlo method is used to randomly sample the apparent power of loads, output power of wind power and photovoltaic so as to obtain annual apparent power curves of the nodal effective load considering uncertainties within 20 years after electric energy replacement.
Step 2: In line with the annual apparent power curve in the first year of electric energy replacement, and the principle of distribution transformer rated capacity being greater than and closest to the maximum load, the planned capacity of distribution transformers is selected for electric energy replacement points. Then three characteristic indexes of annual continuous apparent power curve are calculated, and replaceable point set Ω and capacity upgrading set Φ are obtained.
Step 3: On the basis of the apparent power curves within 20 years after electric energy replacement, three cost benefit indexes of replacement with on-load capacity regulating distribution transformers at replaceable points are calculated, namely investment profitability index FE within the life cycle, investment cost recouping index FT and capacity regulating cost index FC.
Step 4: The branch and bound method [23] in an 0–1 integer programming method is used to solve the planning model of on-load capacity regulating distribution transformers in urban distribution networkz to obtain the planning scheme of on-load capacity regulating distribution transformers.
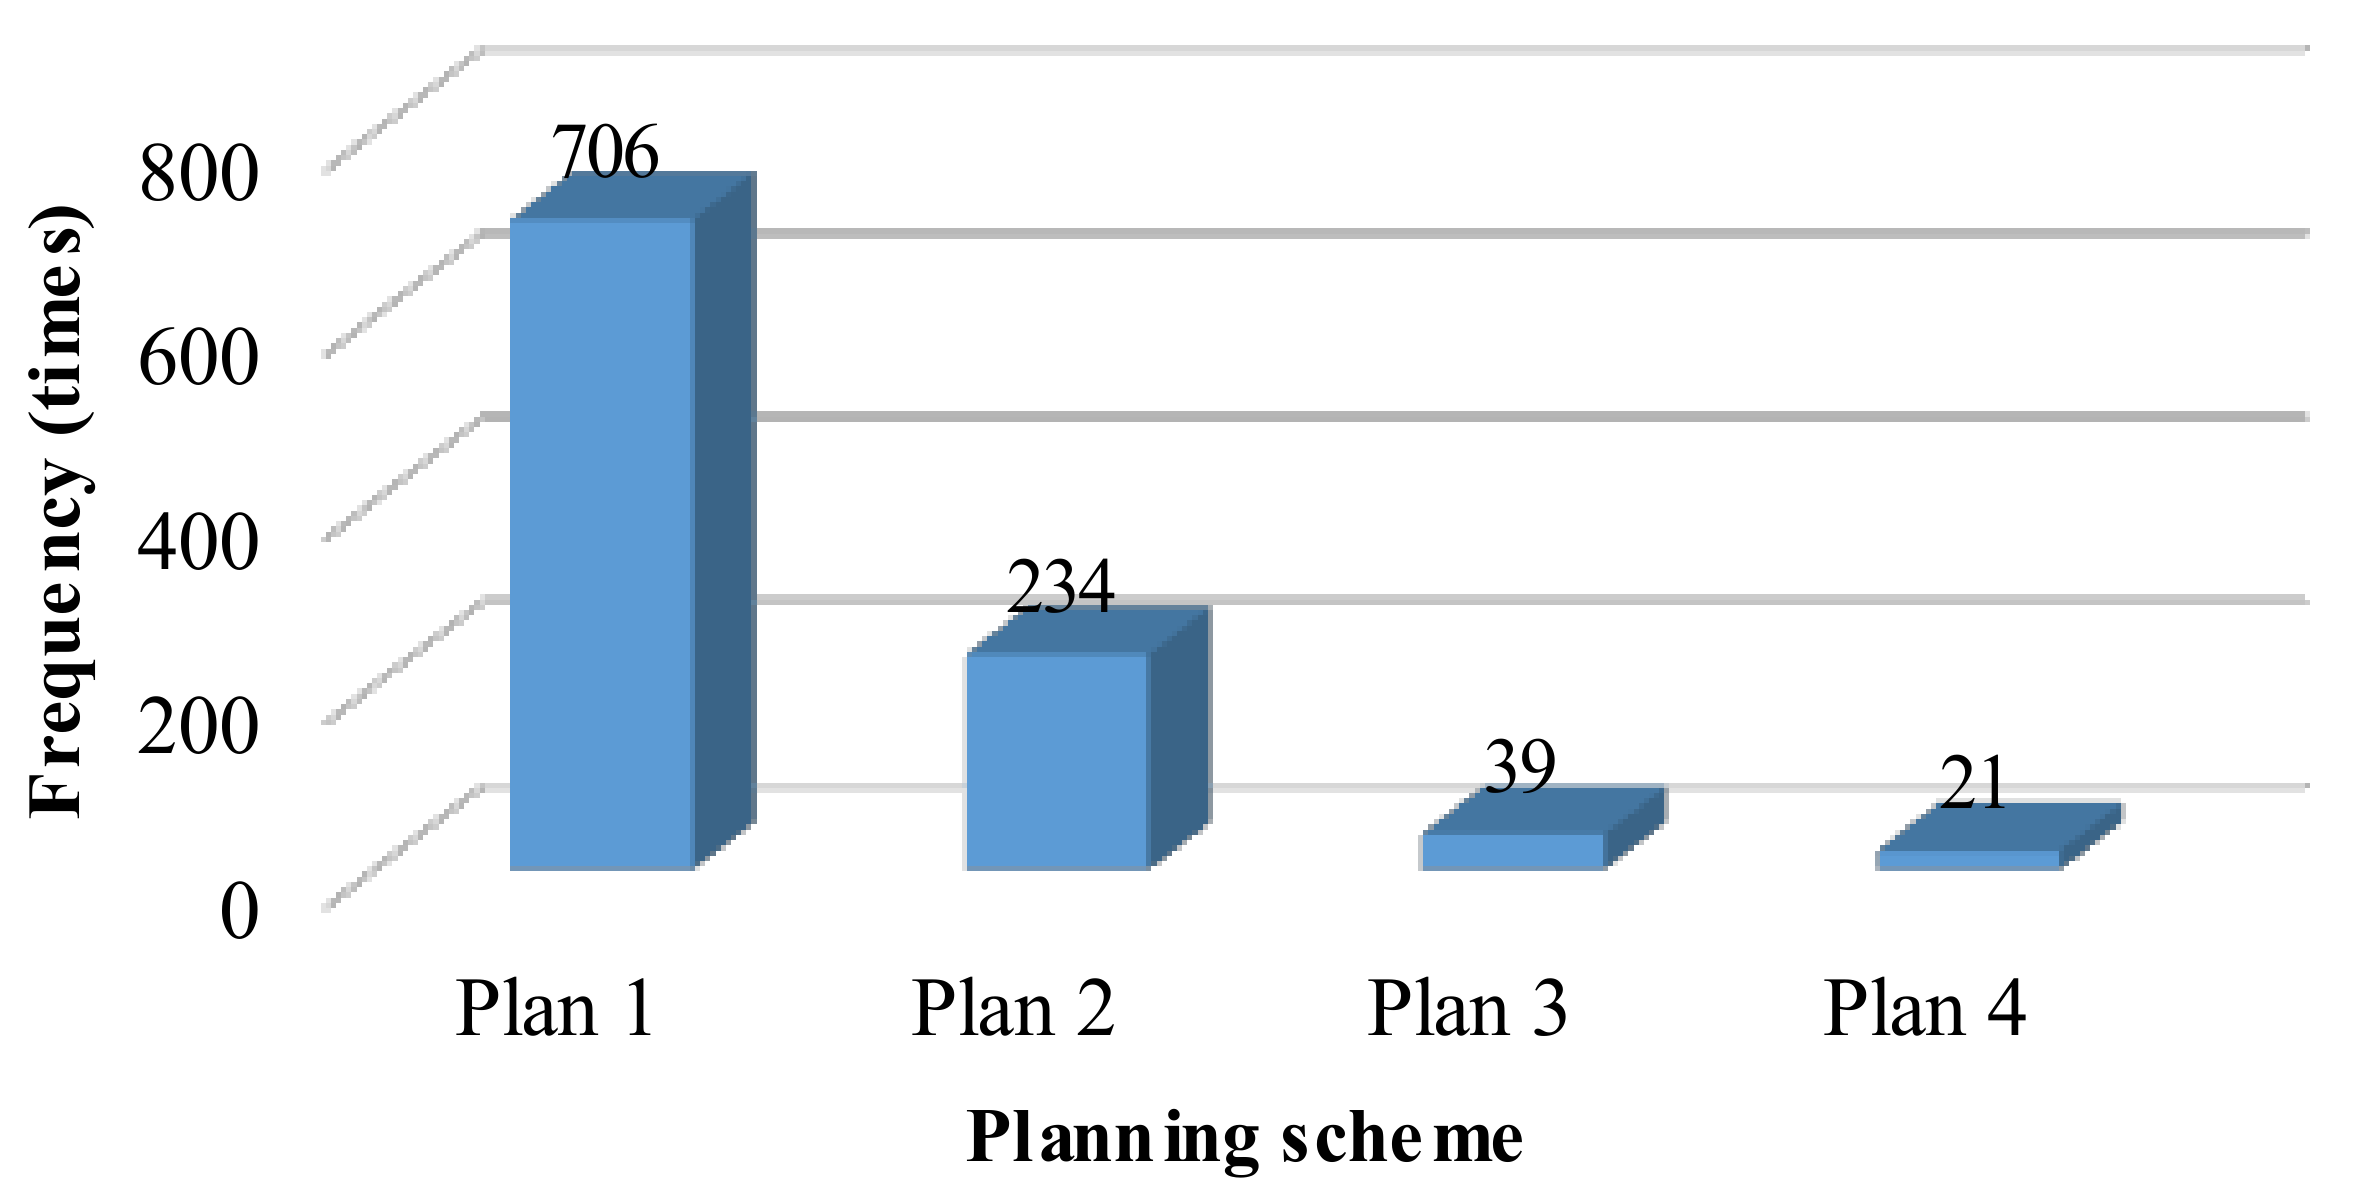
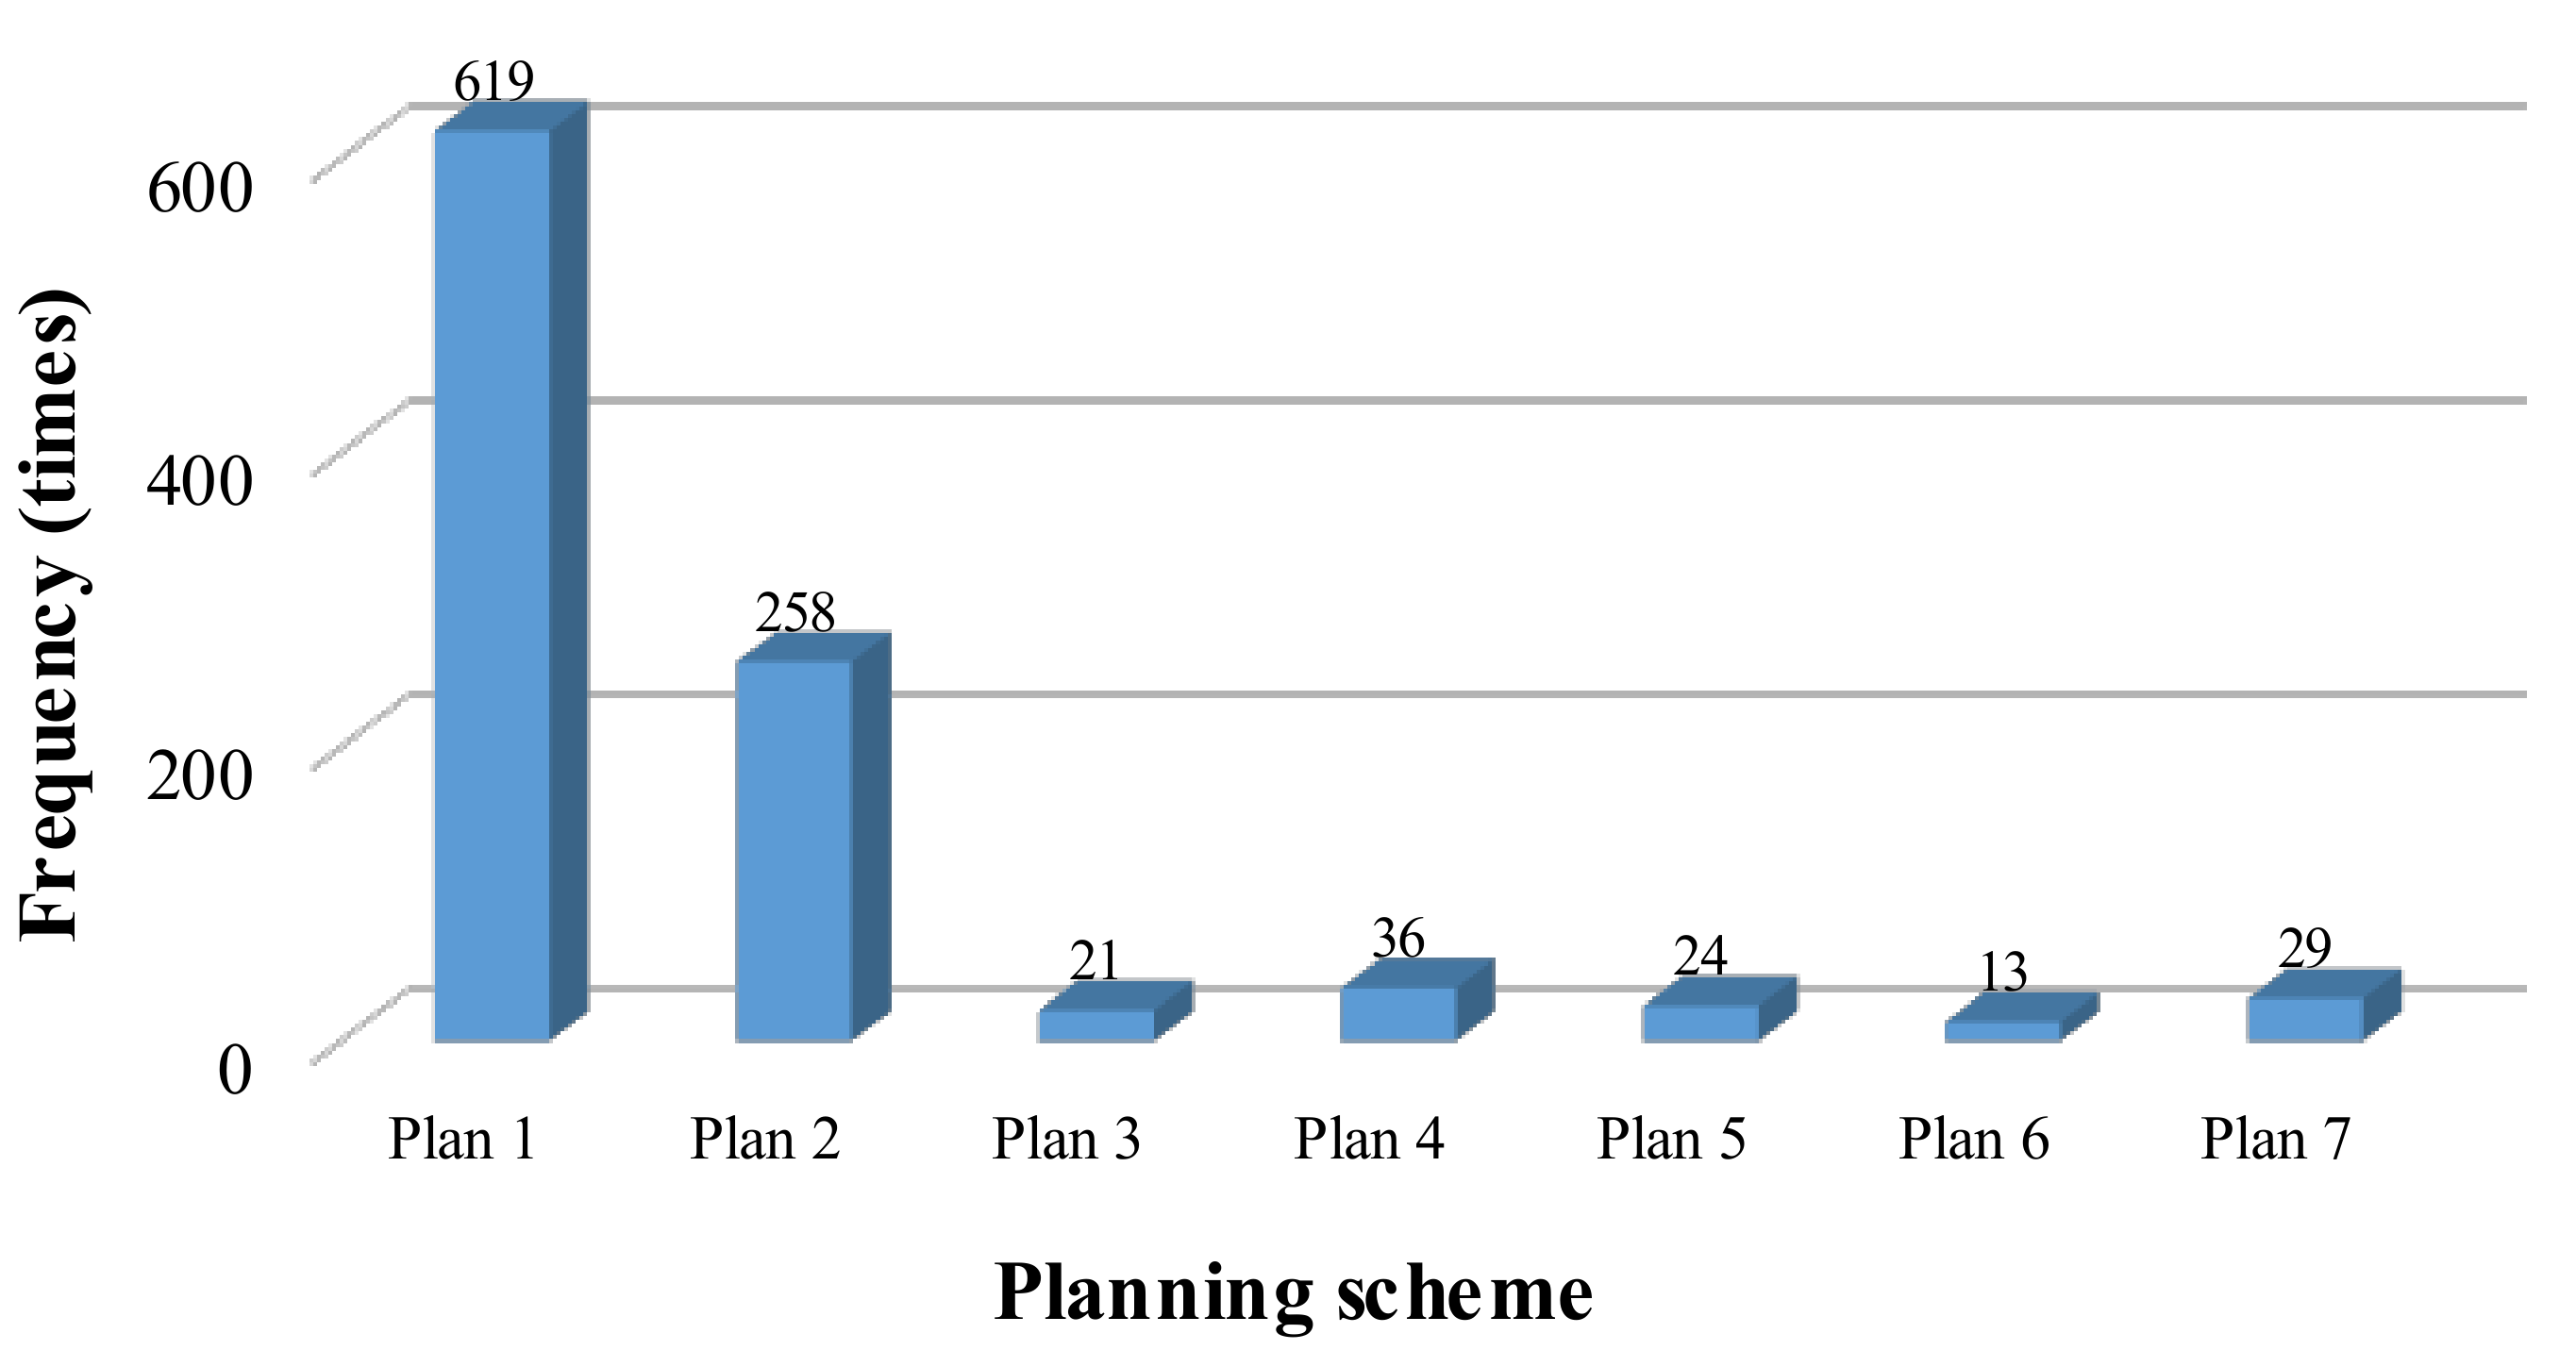
Step 5: Step 1 to step 4 are repeated to get the results of N group Monte Carlo experiments, and the most frequent planning scheme is the optimal planning scheme of on-load capacity regulating distribution transformers.

5. Case Study

5.1. System Parameters and Predicted Load

Electric energy replacement is implemented for multiple loads in a large-scale 10 kV urban distribution network in one area on MATLAB R2012a (Student Version, MathWorks, Natick, MA, USA). This 10 kV distribution network has a total of 55 nodes and eight electric energy replacement points, where nodes 6, 11, 16, 23, 25 and 39 are electric energy replacement points for hot pots, node 53 is an electric automobile and electric bus charging station and node 35 is an electric energy replacement point in a small-scale glass manufacturing industry. Node 1 at high-voltage side of the main transformer in a 110 kV substation is set as a balancing bus, and node 2 at the low-voltage side is equipped with a reactive compensating capacitor. The reference power is 100 kVA, reference voltage is 10 kV, and the concrete topology structure is seen in Figure 3.
In order to exclude the interference from the distribution transformer manufacturing technique to the results of the case, S11-M.ZT (State Grid Corporation of China, Beijing, China) on-load capacity regulating distribution transformers and S11 conventional distribution transformers are chosen as distribution transformers to be selected in this case. The basic parameters of on-load capacity regulating distribution transformers and conventional distribution transformers shown in Table 2 and Table 3 are obtained according to the technical parameter specifications of S11-M.ZT on-load capacity regulating distribution transformers in Q/GDW731-2012 (State Grid Corporation of China, Beijing, China) Selection guide for on-load capacity regulating power transformer, technical parameter specifications of S11 conventional distribution transformers in JB/T3837-2010 (China) Identification method of transformer product type as well as the quotations of distribution transformers from Jinshanmen Electrical Co., Ltd (Wenzhou, China).
It’s assumed that total investment E for distribution transformer upgrading and reconstruction under this electric energy replacement is RMB 400,000. Moreover, the annual average operations & maintenance costs Ctap of on-load capacity regulating switch of on-load capacity regulating distribution transformers with different capacities are approximates, all being set as RMB 200/year. The on-load capacity regulating switch price Rprice is set as 1/8 of on-load capacity regulating distribution transformer price χpriceand its maximum switching times n is 50,000 times. Nodes 6, 23, 25, 35 and 53 are connected with commercial loads and their electric price ϕprice is RMB 1.13/kWh; nodes 11, 16 and 39 are connected with residential loads, and their electric price ϕprice is RMB 0.52/kWh. On the basis of the internal relations among the three cost benefit indexes, the result of the pecking-order comparison shown in Table 4 is obtained, so the cost benefit index weighing coefficients wE, wT and wC are respectively taken as 0.67, 0.13 and 0.2.
According to the annual natural gas consumption curve as reported at node 6 and the transformational relation between natural gas and electric energy, an annual apparent power curve of the electric energy replacement load is predicted. The 2016 annual apparent power curve of node 6 can be obtained by Supervisory Control And Data Acquisition (SCADA) and the annual average growth rate g is taken as 0.5%, then the annual apparent power curve of node 6 in the first year of electric energy replacement without considering uncertainties is predicted through (2), as shown in Figure 4. Similarly, the annual load prediction is implemented for the above seven electric energy replacement points where node 53 uses the charging load model of the charging station and finally the annual apparent power curves of eight electric energy replacement points in the first year after electric energy replacement without considering uncertainties are obtained. In consideration that there is a large quantity of load data within 8760 h in a year and in order to intuitively describe the change of annual apparent power curves at eight electric energy replacement points in the first year of electric energy replacement, daily maximum apparent power is selected to draw the annual maximum apparent power curves as shown in Figure 5. Then the annual apparent power curves of eight electric energy replacement points within 20 years after electric energy replacement are obtained according to (3) and (11).

5.2. Results of on-Load Capacity Regulating Distribution Transformer Planning with Certain Load

In order to analyze the influence of load uncertainties on the results of on-load capacity regulating distribution transformer planning, the planning scheme with certain load is obtained. 2017 annual apparent power curves of electric energy replacement points with certain load are obtained in Section 5.1, and then according to the principle of distribution transformer rated capacity being greater than and closest to the maximum load, planned distribution transformer capacities are selected for each electric energy replacement point. It can be known from Table 2 and Table 3 that under the same manufacturing technique, the no-load loss and load loss of on-load capacity regulating distribution transformer are equal to those of a conventional distribution transformer with same capacity, i.e., the loss difference coefficients k1 and k2 are equal to 0, then the criterion function h(μ,ν,λ) in (20) can be simplified as h(ν,λ) as seen in (30). Therefore, it’s only necessary to calculate the values of parameter k3, k4, λ and ν during the judgment process of replacement with on-load capacity regulating distribution transformers, and the results are shown in Table 5.
h ( ν , λ ) = k 3 λ + k 4 λ ν
It can be seen from Table 5 that the load peak/valley differences of nodes 16 and 39 are not significant, and their minimum loads don’t reach the corresponding critical capacity regulating loads of on-load capacity regulating distribution transformers. The load peak/valley differences of nodes 25 and 35 already met the capacity regulating requirement, but as their operation time under low loads is short, the criterion function h(ν,λ) is smaller than 0, i.e., the loss of configuring an on-load capacity regulating distribution transformer is greater than that of a conventional distribution transformer, so it’s inappropriate to configure the four positions with on-load capacity regulating distribution transformers. The load peak/valley differences of nodes 6, 11, 23 and 53 are great and the loads are distributed at high and low ends, so their criterion functions h(ν,λ) are all greater than 0. This indicates that when the loads have large peak/valley differences and are distributed at high and low ends, configuration with on-load capacity regulating distribution transformers can effectively reduce the electric energy losses of a distribution network. According to the replacement criterion of on-load capacity regulating distribution transformers, the distribution transformer replaceable point set Ω is taken as {6, 11, 23, 53}. Moreover, according to the relation between original distribution transformers and planned capacities, the capacity upgrading set Φ is obtained as {6, 11, 16, 23, 25, 35, 53}.
According to (3) and (11), the apparent power curves within 20 years after electric energy replacement are predicted. Then the cost benefit indexes of replacing with on-load capacity regulating distribution transformers at all points in the replaceable point set Ω are calculated, and results are seen in Table 6.
Based on the capacity expanding requirements of distribution transformers at nodes 6, 11, 16, 23, 25, 35 and 53 in the capacity upgrading set Φ and total investment for distribution transformer upgrading and reconstruction taken as the constraint, the branch and bound method in the 0–1 integer programming method is used to solve on-load capacity regulating distribution transformer planning model according to the cost benefit indexes of replacing with on-load capacity regulating distribution transformers at all points in the replaceable point set Ω. When the comprehensive benefit index F is 0.497, the optimal planning scheme for distribution transformer upgrading and reconstruction after electric energy replacement is obtained as shown in Table 7, where M means selecting an on-load capacity regulating distribution transformer and C means selecting a conventional distribution transformer.
It can be known from Table 7 that the optimal planning scheme in this paper is the one where nodes 6, 23 and 53 select 400 (125) kVA, 500 (160) kVA and 600 (200) kVA on-load capacity regulating distribution transformers for upgrading and reconstruction, and nodes 11, 16, 25 and 35 are expanded into 400 kVA, 315 kVA, 400 kVA and 630 kVA conventional distribution transformers, respectively. This planning scheme satisfies the maximum load requirements predicted in 2017 for all points after electric energy replacement, and total planned investment is RMB 400,000 which is equal to the overall investment, namely RMB 400,000. Furthermore, on-load capacity regulating distribution transformers can effectively reduce the active losses of the distribution network after electric energy replacement and contribute to environmental pollution relief. Therefore, the construction of on-load capacity regulating distribution transformers matched with electric energy replacement projects has equal meaning to an electric energy replacement project itself.

5.3. Results of on-Load Capacity Regulating Distribution Transformer Planning Considering Load Uncertainties

To obtain the load of electric energy replacement points considering load uncertainties, the average value μi and variance σi2 of normal distribution random variable are set to be 0 and 202. Then a Monte Carlo method is used to generate 1000 load data to simulate load uncertainties, and the apparent power Si,t(t) (i = 1, 2, …, 20; t = 1, 2, …, 8760) of loads is obtained according to (4). In order to intuitively analyze the impact of uncertainties on predicted load, taking node 6 as an example, Figure 6 shows the variation range of annual maximum apparent power curve in the first year of electric energy replacement.
Here the red solid line represents the annual maximum apparent power of a certain load, and the gray dot-dashed line and dashed line are the upper and lower limits of the annual maximum apparent power considering load uncertainties. The other seven electric energy replacement points have similar characteristics. Obviously, the on-load capacity regulating distribution transformer planning considering load uncertainties has more load scenes than that with a certain load. Then in each Monte Carlo experiment, the planning schemes are calculated as described in Section 5.2. After calculation, the four planning schemes shown in Table 8 are obtained, where the comprehensive benefit index F is the minimum value of those obtained by the corresponding planning scheme.
It can be seen that node 11 has three alternative schemes, nodes 6 and 23 have two alternative schemes, while nodes 16, 25, 35, 39 and node 53 have only one scheme. This shows that nodes 6, 11 and 23 are more sensitive to the uncertainties of load, so the distribution transformer planning of those nodes should take the uncertainties of load into account.
To find the optimal planning scheme, the frequency of each planning scheme in 1000 Monte Carlo experiments is counted and the result is shown in Figure 7. Obviously, plan 1 becomes the optimal planning scheme because the frequency is 706 times. Then, the optimal planning scheme considering load uncertainties is nodes 6, 23 and 53 select 400 (125) kVA, 500 (160) kVA and 600 (200) kVA on-load capacity regulating distribution transformers for upgrading and reconstruction, while nodes 11, 16, 25 and 35 are expanded into 400 kVA, 315 kVA, 400 kVA and 630 kVA conventional distribution transformers which is same as that with a certain load, so it can be found that although the uncertainties of load will affect the planning schemes, the most probable planning scheme is the same as that with certain load.

5.4. Results of on-Load Capacity Regulating Distribution Transformer Planning with Nodal Effective Load Considering Uncertainties

On the basis of Section 5.3, DGs represented by wind power and photovoltaic are add to obtain the nodal effective load. It is assumed that there are wind power generators installed at nodes 23 and 53, and photovoltaic generators installed at nodes 6 and 35. According to the collected data of wind speed and light intensity, the parameters in the probability model of wind power and photovoltaic are obtained, shown in Table 9 and Table 10. The increase rates mw and mv are 15% and the maximum penetration rate dmax is 50%.
Then the planning method of on-load capacity regulating distribution transformers is repeated 1000 times to obtain seven planning schemes which are shown in Table 11. It is found that DGs will increase the uncertainties of load so as to obtain more planning schemes. Similarly, to find the optimal planning scheme, the frequency of each planning scheme is counted, shown in Figure 8, and plan 1 becomes the optimal planning scheme with the frequency of 619 times, so the optimal planning scheme with nodal effective load considering uncertainties is nodes 11 and 23 select 400 (125) kVA on-load capacity regulating distribution transformers, node 53 selects a 500 (160) kVA on-load capacity regulating distribution transformer and nodes 16 and 25 are expanded into 315 kVA and 400 kVA conventional distribution transformers.
To analyze the influence of different DGs on the planning results, the optimal planning scheme considering load uncertainties and that considering load uncertainties and DGs are compared in Figure 9. Since photovoltaic power has obvious day-night characteristics, installing photovoltaic at nodes 6 and 35 can effectively reduce the daytime load and relieve the influence of electric energy replacement for hot pots. After installing photovoltaics, the distribution transformer planned for node 6 changes from a 400 (125) kVA on-load capacity regulating distribution transformer to a 315 kVA conventional distribution transformer, and the capacity of the conventional distribution transformer for node 35 changes from 630 kVA to 500 kVA, so the distribution transformers at node 6 and 35 need not be changed. Photovoltaic power can decrease the daytime load so as to reduce the valley/peak differences. Although wind power does not specifically compensate the load caused by electrical energy replacement, it can reduce the overall load level, so after installing wind power at nodes 23 and node 53, the capacity of the distribution transformer planned for node 23 changes from 500 (160) kVA to 400 (125) kVA, and that for node 53 changes from 630 (200) kVA to 500 (160) kVA. What’s more, the total planned investment E considering load uncertainties and DGs is RMB 272,000, and that considering load uncertainties is RMB 400,000. It can be seen that DGs can reduce the demand and investment of distribution transformer upgrading and reconstruction.
Therefore, the uncertainties of load and DGs will affect the results of on-load capacity regulating distribution transformer planning, but load uncertainties has less influence. Photovoltaic power, which is complementary to the load curve, can be used to decrease the valley/peak differences, thus reducing the need for distribution transformer upgrading and reconstruction. Wind power is used to decrease the overall load level, reducing the capacities of planned distribution transformers. Therefore, the integration of DGs can effectively reduce the pressure of distribution transformer upgrading and reconstruction after electric energy replacement, but DGs have a cost associated with them. To analyze the cost benefit for DGs of reducing transformer capacity requirements, the total cost of distribution transformation planning and DGs is defined as follows:
E t o t a l = η P D G i = 1 t D G 1 ( 1 + a ) i ϕ p r i c e T max , i P D G + E p l a n
where η is the cost coefficient of DG, which includes the installation cost, operating and maintenance cost; PDG is the installation capacity of DG; Tmax,i is the annual maximum utilization hours of DG in the i(th) year; a is the discount rate; tDG is the planning life of DG and Eplan represents the distribution transformation replacement investment, which can be obtained by the planning method. Then the photovoltaic generator at node 6 is taken as an example to obtain the change relation of Etotal with PDG as shown in Figure 10. To simplify the calculations, we assume that the primary energy (light) is abundant for the installation capacity and yearly weather distribution is the same, so Tmax,i is set to be a constant, η is set to be 11,500 RMB/kW by the manufacturer’s quotation, tDG is set to be 20, a is set to be 8%.
The maximum load at node 6 is 328 kW, so when the capacity of DG is smaller than 13 kW, we should replace the distribution transformer at node 6 with a 400 (125) kVA on-load capacity regulating distribution transformer, so Eplan is equal to 59,000. When the capacity of DG increases from 13 kW to 78 kW, the capacity of the distribution transformer at node 6 is suitable for the nodal effective load, so that Eplan is equal to 0, but when the capacity of DG is greater than 78 kW, there is a need to replace the distribution transformer with a 250 kVA conventional distribution transformer, so Eplan is equal to 30,000. Then each line in Figure 10 can be divided into three segments according to Eplan. In each segment of the blue line, the total cost Etotal decreases with the DG capacity increases because of the energy saving provided by the DG, and when the DG capacity is equal to 78 kW, we can get the most benefits, while in the yellow and red lines, the total cost Etotal increases as the DG capacity increases in each segment, because the Tmax,i is too small to provide a profit, and the best capacity of DG is equal to 13 kW. Obviously, asTmax,i decreases, the total cost Etotal increases, so as Tmax,i continues to decrease, the cost with DGs will be higher than that without DGs. Therefore, installing DGs with reasonable capacities at electric energy replacement points with high Tmax,i can help us to reduce more cost.

5.5. Correlation Analysis of Distribution Transformer Planning Results and Load Characteristics at Electric Energy Replacement Points

The distribution transformer optimal planning scheme is related to the load characteristics at electric energy replacement points [24,25] and it’s determined jointly by the criterion function h(μ,ν,λ) and cost benefit indexes of replacing conventional transformers with on-load capacity regulating distribution transformers. Hence, to guide distribution transformer planning at electric energy replacement points, the relations of load characteristics with criterion function h(μ,ν,λ) and cost benefit indexes, namely investment profitability index FE within the life cycle, investment cost recouping index FT and capacity regulating cost index FC, are successively analyzed, based on the load data given in Section 5.2.
In distribution transformer planning, the distribution transformers to be selected normally have similar manufacturing features, i.e., the no-load loss and load loss of on-load capacity regulating distribution transformers are equal to those of conventional distribution transformers with equal capacity. According to (20), the loss difference coefficients k1 and k2 are equal to 0, so the correlation of high load mean square value μ and planning results is not discussed in this paper. Then taking a 400 kVA planned capacity of distribution transformer as an example, the criterion function h(ν,λ) is obtained as follow according to (30):
h ( ν , λ ) = 330 λ 0.09 λ ν
The change relation curves of the criterion function h(ν,λ) with low load mean square value ν and annual operation time λ are drawn in MATLAB as shown in Figure 11. The criterion function h(ν,λ) gradually increases from the blue region to the red region. When the low load mean square value ν and annual operation time λ are in the blue region, criterion function h(ν,λ) is smaller than 0. When they are in the yellow and red regions, the criterion function h(ν,λ) is greater than 0. From Figure 11, we can find that the symbol of h(ν,λ) is determined by the low load mean square value ν, and when ν is lower than the critical value, h(ν,λ) it is higher than 0. Therefore, according to the boundary between the blue region and yellow region, namely ν=3667, as well as the low load mean square value, judgments about replacing conventional transformers with on-load capacity regulating distribution transformers can be rapidly realized. The low load mean square values ν of nodes 6 and 11 are 2156 and 1509 which are lower than 3667, while the low load mean square value ν of node 25 is 3761, so h(ν,λ) of nodes 6 and 11 is greater than 0, h(ν,λ) of node 25 is smaller than 0, and this is consistent with the calculation results as stated above.
The investment profitability index FE within the life cycle is related to the annual continuous apparent power curves within 20 years. In order to discuss the influence of load characteristics in the first year of electric energy replacement on this index, based on the loads at nodes 6, 11 and 23, MATLAB is used to obtain the curves of the investment profitability indexes FE1 and FE2 within the life cycle of replacing with 400 (125) kVA on-load capacity regulating distribution transformers at nodes 6 and 11, respectively, FE3 of replacing with a 500 (160) kVA on-load capacity regulating distribution transformer at node 23 with load mean square value ν and annual operation time ratio λ changing as shown in Figure 12.
In Figure 12, FE3, FE2 and FE1 are successively ranked from top to bottom. It can be seen that under the same conditions, increasing annual operation time ratio λ and reducing low load mean square value ν can improve the investment profitability index FE within the life cycle. When λ, ν and planned capacity are the same, FE under commercial load (FE2) is greater than that under residential load (FE1), because the commercial load has higher profits with the same power savings. When λ, ν and load type are the same, and FE with larger planned capacity (FE3) is greater, because the coefficients k3 and k4 of larger planned capacity are bigger. The investment cost recouping index FT is related to the annual apparent power curve. The greater the investment profitability index FE within the life cycle, the longer the profitability time within the life cycle, and the earlier the cost can be recouped. Therefore, FE is inversely proportional to FT. The capacity regulating cost index FC is decided by the relationship between the critical capacity regulating load and the annual apparent power curve, and the more greatly the load fluctuates at the critical capacity regulating load, the greater the number of capacity regulating times, and the greater the capacity regulating cost index FC.
By analyzing the relations of load characteristics with the criterion function and cost benefit indexes of replacing conventional transformers with on-load capacity regulating distribution transformers, it can be obtained that: (1) under the same distribution transformer manufacturing technique, the cross-zero boundary of the criterion function under different planned capacities and low load mean square values of annual continuous apparent curve are used to directly realize judgments about replacing conventional transformers with on-load capacity regulating distribution transformers; (2) loads with higher λ and lower ν are more suitable for configuring on-load capacity regulating distribution transformers, and priority should be given to distribution transformers under commercial loads or with larger planned capacity when all other conditions are the same; (3) the investment cost recouping index FT is inversely proportional to the investment profitability index FE within the life cycle, and the capacity regulating cost index FC is related to the fluctuation status of the load under critical capacity regulating load conditions.

6. Conclusions

The replacement criterion for on-load capacity regulating distribution transformers was obtained in this paper according to the loss relation between on-load capacity regulating distribution transformers and conventional distribution transformers. Then an optimal planning model and method for replacing on-load capacity regulating distribution transformers in urban distribution networks after electric energy replacement was proposed through cost benefit analysis of replacing conventional transformers with on-load capacity regulating distribution transformers. Results of the case study showed that this planning method could obtain a distribution transformer optimal configuration scheme according to the predicted load, which greatly reduced the calculated amount of distribution transformer planning by obtaining a replaceable point set. The impact of load uncertainties on the planning results of on-load capacity regulating distribution transformers is smaller than that of DGs and DGs can reduce the load peaks, so configuring DGs reasonably can reduce the pressure of distribution transformer upgrading and reconstruction after electric energy replacement. Moreover, through analysis of the relation between distribution transformer optimal planning schemes and load characteristics, it’s found that using the same distribution transformer manufacturing technique, the low load mean square value of annual continuous apparent power curves could be used to directly realize judgments about replacing conventional transformers with on-load capacity regulating distribution transformers; loads with higher λ and lower ν is more suitable for configuring on-load capacity regulating distribution transformers, and priority should be given to distribution transformers under commercial loads or with larger planned capacity when all other conditions are the same.

Author Contributions

Conceptualization, Q.W.; Methodology, Y.S. and Q.W.; Software, Y.S. and C.L.; Investigation, C.L.; Data Curation, J.F.; Writing-Original Draft Preparation, Y.S.; Writing-Review & Editing, Y.S., N.Z. and Q.W.; Supervision, N.Z.

Acknowledgments

This work was supported by the National Natural Science Foundation of China (51607015) and Science and Technology Project of Chongqing (cstc2015jcyjBX0033).

Conflicts of Interest

The authors declare no conflict of interest.

References

  1. Huang, W.; Fan, H. Application of Fault Tree Approach for the Causation Mechanism of Urban Haze in Beijing—Considering The Risk Events Related with Exhausts of Coal Combustion. Sci. Total Environ. 2015, 544, 1128–1135. [Google Scholar] [CrossRef] [PubMed]
  2. Li, X.; Jiang, L. Size Distribution of Particle-phase Sugar and Nitrophenol Tracers during Severe Urban Haze Episodes in Shanghai. Atmos. Environ. 2016, 145, 115–127. [Google Scholar] [CrossRef]
  3. Tao, M.; Chen, L. A Study of Urban Pollution and Haze Clouds over Northern China during the Dusty Season Based on Satellite and Surface Observations. Atmos. Environ. 2014, 82, 183–192. [Google Scholar] [CrossRef]
  4. Zhao, B.; Wang, P. A High-resolution Emission Inventory of Primary Pollutants for the Huabei Region, China. Atmos. Chem. Phys. 2012, 11, 20331–20374. [Google Scholar] [CrossRef]
  5. Fu, X.; Wang, S. Emission Inventory of Primary Pollutants and Chemical Speciation in 2010 for the Yangtze River Delta Region, China. Atmos. Environ. 2013, 70, 39–50. [Google Scholar] [CrossRef]
  6. Liang, Z.Q.; Yang, Y.Q. The Energy Saving Research of the On-load Capacity Regulating Transformer in Practical Applications. Adv. Mater. Res. 2014, 962–965, 1504–1508. [Google Scholar] [CrossRef]
  7. Zhang, H.; Wang, F.; Fu, Y. Intelligent Design and Application of on Load Capacity-regulating Distribution Transformer. In Proceedings of the China International Conference on Electricity Distribution, Shanghai, China, 5–6 September 2012. [Google Scholar]
  8. Luo, J.; Hu, J.; Liu, X. Control Strategy Study and Discussion of On-load Capacity Regulating Transformer. In Proceedings of the 8th International Conference on Intelligent Computation Technology and Automation, Nanchang, China, 14–15 June 2015. [Google Scholar]
  9. Meng, Z.; Piao, Z.L. Design of Thyristor Valve Assembly in On-load Automatic Capacity Regulating Distribution Transformer. Appl. Mech. Mater. 2013, 325–332, 417–423. [Google Scholar] [CrossRef]
  10. Chen, H.; Liu, Z.; Tong, H. The Application of Power Electronic Switch in the Regulated Capacity Transformer. In Proceedings of the 5th International Conference on Electrical Engineering and Automatic Control, Weihai, China, 16–18 October 2015; pp. 63–69. [Google Scholar]
  11. Wang, J.; Sheng, W.; Wang, L. Study on Technical and Economical Efficiency of Amorphous Alloy Transformer and On-load Capacity Regulating Transformer in Distribution Network Application. In Proceedings of the China International Conference on Electricity Distribution, Shenzhen, China, 23–26 September 2014. [Google Scholar]
  12. Luo, W.B.; Luo, J.J.; Pan, R.B. The Study of the Voltage Fluctuation of On-load Capacity Regulating Transformer while Switching Capacity. In Proceedings of the 4th International Conference on Information Technology and Management Innovation, Shenzhen, China, 12–13 September 2015. [Google Scholar]
  13. Luo, W.; Fan, W.; Liang, S. Fault Oriented Safety Technology of On-load Capacity Regulating Transformer. In Proceedings of the 8th International Conference on Intelligent Computation Technology and Automation, Nanchang, China, 14–15 June 2015. [Google Scholar]
  14. Srinivasan, M.; Krishnan, A. Effects of Environmental Factors in Transformer’s Insulation Life. IEEE Trans. Power Syst. 2013, 8, 35–44. [Google Scholar]
  15. Chiodo, E.; Lauria, D. Lifetime Characterization via Lognormal Distribution of Transformers in Smart Grids: Design Optimization. Appl. Energy 2016, 177, 127–135. [Google Scholar] [CrossRef]
  16. Moller, F.; Meyer, J.; Schegner, P. Load Model of Electric Vehicles Chargers for Load Flow and Unbalance Studies. In Proceedings of the 9th International Conference on Electric Power Quality and Supply Reliability, Rakvere, Estonia, 11–13 June 2014. [Google Scholar]
  17. Qian, K.; Zhou, C.; Allan, M. Load Model for Prediction of Electric Vehicle Charging Demand. In Proceedings of the International Conference on Power System Technology, Hangzhou, China, 24–28 October 2010. [Google Scholar]
  18. Kaplan, Y.A. Determination of the Best Weibull Methods for Wind Power Assessment in the Southern Region of Turkey. IET Renew. Power Gener. 2017, 11, 175–182. [Google Scholar] [CrossRef]
  19. Nor, N.M.; Ali, A.; Ibrahim, T. Battery Storage for the Utility-scale Distributed Photovoltaic Generations. IEEE Access 2017, 6, 1137–1154. [Google Scholar] [CrossRef]
  20. Tong, X.; Fu, H. Economic Evaluation Methodology of New Energy-saving Power Transformers and Suggestions for Challenges. Appl. Mech. Mater. 2014, 668–669, 775–779. [Google Scholar] [CrossRef]
  21. Adly, A.A.; Abd-El-Hafiz, S.K. A Performance-oriented Power Transformer Design Methodology Using Multi-objective Evolutionary Optimization. J. Adv. Res. 2015, 6, 417–423. [Google Scholar] [CrossRef] [PubMed]
  22. Tan, K.C.; Lee, T.H. Evolutionary Algorithms for Multi-objective Optimization: Performance Assessments and Comparisons. Artif. Intell. Rev. 2002, 17, 251–290. [Google Scholar] [CrossRef]
  23. Shim, Y.; Fodstad, M. A Branch-and-bound Method for Discretely-constrained Mathematical Programs with Equilibrium Constraints. Ann. Oper. Res. 2013, 210, 5–31. [Google Scholar] [CrossRef]
  24. Takagi, M.; Yamamoto, H. An Evaluation of Amorphous Transformers Using the Load Curve Pattern Model for a Pole Transformer. Electr. Eng. Jpn. 2009, 169, 1–9. [Google Scholar] [CrossRef]
  25. Shilei, G.; Zhixin, B. The Analysis of Energy Saving Transformer with Variable Energy Saving Effect Evaluation Efficiency Considering the Typical Load Characteristic. In Proceedings of the International Conference on Power System Technology, Chengdu, China, 20–22 October 2014. [Google Scholar]
Figure 1. On-load capacity regulating distribution transformer. (a) actual pictures; (b) circuit structure.
Energies 11 01457 g001
Figure 2. Annual load curve of hot pot load. (a) annual maximum load curve; (b) annual continuous load curve.
Energies 11 01457 g002
Figure 3. A 55-bus urban distribution network of 10 kV.
Energies 11 01457 g003
Figure 4. Annual apparent power curve at node 6 in the first year of electric energy replacement.
Energies 11 01457 g004
Figure 5. Annual maximum apparent power curves at eight electric energy replacement points in the first year of electric energy replacement.
Energies 11 01457 g005
Figure 6. Variation range of annual maximum apparent power curve at node 6 in the first year of electric energy replacement.
Energies 11 01457 g006
Figure 7. Frequencies of four planning schemes considering load uncertainties.
Energies 11 01457 g007
Figure 8. Frequencies of seven planning schemes with nodal effective load considering uncertainties.
Energies 11 01457 g008
Figure 9. Comparison of the optimal planning scheme considering load uncertainties with that considering load uncertainties and DGs.
Energies 11 01457 g009
Figure 10. Change relation curve of Etotal with PDG.
Energies 11 01457 g010
Figure 11. Criterion function h(ν,λ) with the change of index ν and λ.
Energies 11 01457 g011
Figure 12. Investment profitability index FE within the life cycle with the change of index ν and λ.
Energies 11 01457 g012
Table 1. Pecking-order comparison method.
FEFTFCTotalWeight
FE X12X13X12 + X13(X12 + X13)/15
FTX21 X23X21 + X23(X21 + X23)/15
FCX31X32 X31 + X32(X31 + X32)/15
Total151
Table 2. Parameters for on-load capacity regulating distribution transformers.
Large Capacity
(Small Capacity)/kVA
Critical Capacity
Regulating Load/kVA
Price/RMB 10,000No-Load Loss/WLoad Loss/W
200(63)364340(150)2730(1040)
250(80)464.5400(180)3200(1250)
315(100)625480(200)3830(1500)
400(125)725.5570(240)4520(1800)
500(160)926.5680(280)5410(2200)
630(200)1137.5810(340)6200(2600)
Table 3. Parameters for conventional distribution transformers.
Capacity/kVAPrice/RMB 10,000No-load Loss/WLoad Loss/W
20033402730
2503.54003200
31544803830
4004.55704520
5005.46805410
6306.38106200
Table 4. Result of pecking-order comparison.
IndexFEFTFCTotalWeight
FE 55100.67
FT0 220.13
FC03 30.2
Total151
Table 5. Characteristic indexes of annual continuous apparent power curves at 8 electric energy replacement points.
NodeOriginal Capacity/kVAPlanned Capacity/kVAk3k4λνh(ν,λ)
6315400330−0.091.472156199.86
11315400330−0.093.521509683.55
16200315- 1-00-
23315500400−0.061.623448312.85
25315400330−0.090.283761−2.38
35500630470−0.050.0110700−0.65
39315315--00-
53400630470−0.050.913825253.66
1 The value need not be calculated.
Table 6. Cost benefit indexes of replacing with on-load capacity regulating distribution transformers.
NodeCapacityFE/RMB 10,000FT/yearFC/RMB 10,000
6400(125)0.18817.7120.523
11400(125)0.15717.9860.297
23500(160)0.76413.1350.510
53630(200)0.97912.2860.309
Table 7. Planning scheme of distribution transformers with certain load.
NodeMaximum Prediction Load in 2017/kVAPlanned Distribution TransformerTransformation Cost
6328400(125)-M5.9
11339400-C4.5
16257315-C4
23426500(160)-M6.9
25329400-C4.5
35510630-C6.3
39261No Change0
53525630(200)-M7.9
Table 8. Planning schemes of distribution transformers considering load uncertainties.
PlanNode6Node11Node16Node23Node25Node35Node39Node53E
Plan 1400(125)-M400-C315-C500(160)-M400-C630-CNo Change630(200)-M40
Plan 2No change400(125)-M315-C500(160)-M400-C630-CNo Change630(200)-M35.5
Plan 3400(125)-M400(125)-M315-C400(125)-M400-C630-CNo Change630(200)-M39
Plan 4400(125)-MNo change315-C500(160)-M400-C630-CNo Change630(200)-M35.5
Table 9. Parameters in probability model of wind power.
Nodecdkdcnknvin (m/s)vr (m/s)vout (m/s)Pwr (kW)
236.451.437.321.7331422100
536.951.577.881.9631422120
Table 10. Parameters in probability model of photovoltaic.
NodeαβPvmax (kW)
60.692.1280
350.781.64120
Table 11. Planning schemes of distribution transformers with nodal effective load considering uncertainties.
PlanNode6Node11Node16Node23Node25Node35Node39Node53E
Plan 1No change400(125)-M315-C400(125)-M400-CNo changeNo change500(160)-M27.2
Plan 2No changeNo change315-C400(125)-M400-CNo changeNo change500(160)-M21.3
Plan 3400(125)-M400(125)-M315-C400(125)-M400-CNo changeNo change500(160)-M33.1
Plan 4No changeNo change315-C400(125)-M400-C630-CNo change500(160)-M27.6
Plan 5No change400(125)-M315-C400(125)-M400-C630-CNo change500(160)-M33.5
Plan 6No changeNo change315-C400(125)-M400-CNo changeNo change630(200)-M22.3
Plan 7No change400(125)-M315-C400(125)-M400-CNo changeNo change630(200)-M28.2

