Article

Impact of Demand Response Programs on Optimal Operation of Multi-Microgrid System

1
Department of Electrical Engineering, Incheon National University, 12-1 Songdo-dong, Yeonsu-gu, Incheon 406840, Korea
2
Department of Electrical Engineering, Hanoi University of Science and Technology, Hanoi 112400, Vietnam
3
Research Institute for Northeast Asian Super Grid, Incheon National University, 12-1 Songdo-dong, Yeonsu-gu, Incheon 406840, Korea
*
Author to whom correspondence should be addressed.
Energies 2018, 11(6), 1452; https://doi.org/10.3390/en11061452
Submission received: 10 May 2018 / Revised: 30 May 2018 / Accepted: 4 June 2018 / Published: 4 June 2018
(This article belongs to the Special Issue Microgrids-2018)

Abstract

:
The increased penetration of renewables is beneficial for power systems but it poses several challenges, i.e., uncertainty in power supply, power quality issues, and other technical problems. Backup generators or storage system have been proposed to solve this problem but there are limitations remaining due to high installation and maintenance cost. Furthermore, peak load is also an issue in the power distribution system. Due to the adjustable characteristics of loads, strategies on demand side such as demand response (DR) are more appropriate in order to deal with these challenges. Therefore, this paper studies how DR programs influence the operation of the multi-microgrid (MMG). The implementation is executed based on a hierarchical energy management system (HiEMS) including microgrid EMSs (MG-EMSs) responsible for local optimization in each MG and community EMS (C-EMS) responsible for community optimization in the MMG. Mixed integer linear programming (MILP)-based mathematical models are built for MMG optimal operation. Five scenarios consisting of single DR programs and DR groups are tested in an MMG test system to evaluate their impact on MMG operation. Among the five scenarios, some DR programs apply curtailing strategies, resulting in a study about the influence of base load value and curtailable load percentage on the amount of curtailed load and shifted load as well as the operation cost of the MMG. Furthermore, the impact of DR programs on the amount of external and internal trading power in the MMG is also examined. In summary, each individual DR program or group could be handy in certain situations depending on the interest of the MMG such as external trading, self-sufficiency or operation cost minimization.

1. Introduction

The increasing load demand, the intermittent supply of power grid, and the elevating association of distributed generations (DGs) along with energy storage systems (ESSs) are the major problems for power systems presently. In addition, for renewable energy sources (RESs) there has been a remarkable rise in their penetration in power generation [1,2,3], resulting in the further complication of the general power supply and protection due to uncertainties [4,5]. There have been several solutions proposed in order to deal with this issue. For example, backup generators can be used to support the system on generation side [6]. However, it is clear to recognize the major drawback, that these generators costs are significantly high for installation and maintenance, while they are only used for a short time. The other way to deal with these uncertainties is the application of ESSs which can be charged or discharged in order to maintain the power balance in the system [7,8]. However, the utilization of ESS could result in additional costs. Besides, peak load, the highest demand occurring on the electricity grid for a time period, is also a problem in the power supply system [9]. That could be a risk the power system since all customers coincidentally consume a massive amount of power during peak load period.
Since the challenges about uncertainties and peak load are mentioned above, various publications have proposed solutions for demand side based on the demand side management (DSM) strategies [10]. For instance, DSM strategies can contribute to the voltage stability of distribution network [11] or the adjustment of end-use energy consuming behavior [12,13]. Electrical loads can be arranged to be turned on or off depending on how people consume. In particular, some types of load can be avoided being used in peak periods and then operate in other periods, which means loads are shiftable. Besides, some unnecessary loads can also be turned off during peak time intervals to reduce total load, which means loads are curtailable. In addition, RESs can be utilized in a more effective way by adjusting the load. During periods with low load, the generation of RES may be high compared to the demand, leading to the unused amount of RES generation, after fulfilling the load, being wasted. Therefore, a portion of the shiftable load can be shifted from other periods with high load to these periods, so the unused amount of RES generation will be used effectively. The features mentioned above enable the application of demand response (DR) programs in order to overcome the challenges of peak load and uncertainties [14,15].
DR programs are classified into two categories: price-based demand response (PBDR) and incentive-based demand response (IBDR) [16]. Customers are encouraged to adjust their electricity consumption based on the detailed price information proposed by PBDR programs. Meanwhile, IBDR programs aim to serve the same purpose by rewarding customers rather than providing specific data [17]. For extensive study on how DR programs solve the peak load problem, microgrid (MG) is used for testing their performance. MG is defined as a small-scale power distribution system including controllable distributed generators (CDGs), renewable distributed generators (RDGs), battery energy storage systems (BESSs), and loads [18]. During normal condition, the operation of MG aims to maintain power balance between supply and demand [19,20]. However, in some peak periods, the power supply cannot fulfill the high amount of load demand. In this situation, MG has to import an amount of power from the utility grid with high price in order to maintain power balance, resulting in operation cost increase. MG operation can be optimized by various strategies, such as the application of various control approaches for MG [21,22], the additional penetration of electric vehicles and distributed resources [23], or the advance of internet data centers in MG [24]. Furthermore, with the application of DR programs, the load can be shifted from peak periods to off-peak periods so that the operation cost can be decreased [25]. Further studies focus on the topic of multi-microgrid (MMG), which contains a number of MGs. The main issue in this topic is how MMG deals with the power trading with the utility grid and sharing among MGs. DR programs can be applied to adjust local load and trading power in order to enhance the performance of the MMG [26,27].
Most studies available in the literature of DR programs show the effective performance and increasing application of DR. Authors in [28] proposed a hierarchical energy management system (HiEMS) for the optimal operation of MG with multi-timescale DR to deal with the uncertainty of RESs. Authors in [29] took into account the optimal scheduling in a residential community based on real-time electricity price. Authors in [30] presented three algorithms applying load shifting strategies to optimize electricity consumption. Authors in [31] took advantage of a multi-agent system (MAS) for optimizing MG operation, including DR consideration. The MAS was also applied in [32] when the authors proposed a combination of economic dispatch (ED) and DR to benefit customers and reduce generation costs at once. However, most of these studies considered the application of only one type of DR program. Some other studies are not linked to each other, sometimes are incompatible to each other, and above all, are not entirely synthesized [33]. Therefore, this paper considers the application of multiple DR programs in one system. Besides, each of the two basic categories of DR includes a number of DR programs with different characteristics. For example, PBDR contains time-of-use (TOU), real-time pricing (RTP), and critical peak pricing (CPP), which propose different price rates. IBDR also consists of many DR types such as direct load control, demand bidding/buyback programs, emergency demand response program (EDRP), capacity market programs, interruptible/curtailable, and ancillary services market programs [16]. These types of DR can be applied in many ways to fulfill the objectives given by grid operators or customers. In particular, each DR in PBDR group can be used solely or combined with another DR from IBDR group in order to perform more effectively. This leads to the question about how the DR programs perform when they are applied solely and together.
As a result, this paper considers a number of DR programs applied in the operation of the MMG. The impacts of both PBDR and IBDR programs on the operation of the MMG will be analyzed. In addition, how the combination of PBDR and IBDR programs performs in MMG operation will also be studied. However, there are many types of DR programs, so it could be complex to consider all combination of DR programs. Therefore, only two PBDR programs and one IBDR program are chosen to implement and study. In particular, for PBDR programs, RTP and CPP are tested while EDRP represents IBDR programs to be applied in the MMG operation. Hence, there are five scenarios to be tested in the MMG system:
  • Only RTP is applied;
  • Only CPP is applied;
  • Only EDRP is applied;
  • A group of RTP-EDRP is applied;
  • A group of CPP-EDRP is applied.
The impact of DR programs on the MMG operation in these scenarios is based on the type of DR programs applied. In detail, PBDR programs use shifting load strategies, while IBDR programs use curtailing load strategies generally. Hence, how DR programs influence the amount of shifted and curtailed load is worth investigating. Furthermore, since all scenarios are tested on the MMG system, how the operation cost and the amount of trading power is affected by DR programs should also be examined.
In brief, this paper studies the impact of DR programs on optimal operation of the MMG and consists of five sections. Section 1 introduces the challenges, motivations and approaches for this study. Next, the test system model and the operation strategy for the MMG considering DR are discussed in Section 2. After that, Section 3 gives information about the mathematical models used in this study. Section 4 then describes the numerical simulations and analyzes the results. Finally, Section 5 concludes the work in this paper.

2. System Model

2.1. MMG System Configuration

Figure 1 illustrates the MMG system for the performance examination on DR programs. The algorithm proposed in this paper performs well in MMG system with three, four, or more MGs [26]. In order for simple readability, three MGs respectively named MG1, MG2, and MG3 are considered. Each of them consists of CDGs, BESS, RDGs, and electrical loads. In detail, CDG units are generators which can be controlled such as diesel generators, fuel cells, or any other type. Sets of electrochemical battery cells together build a BESS system. RDGs are commonly photovoltaic system and wind turbine system and electrical load is divided into curtailable, shiftable, and fixed loads. These local MG components operate under the supervision of a local MG energy management system (MG-EMS). The MG-EMS performs local optimization of its local components and gives decisions of CDG output power, BESS charging/discharging amount, and shortage/surplus power amount as well. After optimization the shortage, surplus, and adjustable power amount are informed to the community EMS (C-EMS) at each time interval. The time interval in this study is chosen to be one hour. The time horizon is selected for one day, however, depending upon the purpose of study it can be extended on a weekly, monthly, or yearly basis. After gathering information from all MG-EMSs and market prices, C-EMS performs community optimization with the main target to reduce the operation cost of the MMG system.

2.2. Algorithm for Multi-Microgrid System Operation

Figure 2 illustrates the flowchart for the optimal operation of the MMG, consisting of three steps. The MG-EMS performs a sequence of actions during step 1 of optimization. The day-ahead market price signals, i.e., buying and selling prices are firstly taken as the input data for each interval of time. Together with the market prices, not only generation bounds for the CDG units, RDGs, and BESSs, but also the load profiles of each MG are gathered by the MG-EMS. Then, the MG-EMS runs optimization calculations with five scenarios of DR application. Next, the amount of shortage and surplus power are calculated to trade with the utility grid or share among MGs and maintain the power balance in each MG system. The generation of CDGs can be increased or decreased, with a certain amount limited by generation bounds so that MGs can share the generated power with each other. By doing so, the amount of shortage or surplus power can be partly compensated or reduced, respectively. The amount of power being increased or decreased can be named as adjustable power. In this step, the minimum and maximum limits for the adjustable power are calculated, resulting in the range of adjustable power possibly used for CDG units of the MG. Therefore, each MG-EMS finishes step 1 with local optimization, sending internal information of its surplus, shortage power, and bounds for adjustable power along with per-unit cost to the C-EMS. On the other hand, market price signals, referred as external information, are also gathered by the C-EMS. Hence, these internal and external items are the input data for the community optimization in step 2. In this step, the amount of adjustable power to be used for CDG units is calculated. During the optimization, the amount of power trading with the utility grid and sharing among MGs are also decided. The information of these items is then sent back to MG-EMSs so that they can perform the rescheduling action in step 3. In this step, the generation amount of CDG units is updated again based on the calculated adjustable power. Finally, one phase of the MMG optimal operation with a step-by-step procedure is finished.
In this study, the optimal operation of the MMG system considered different types of DR and DR groups. As mentioned in the previous section, DR programs can enable changes in the electricity use of end-use customers or pay them incentive payments to reduce their loads. PBDR programs provide customers information about price signals, while IBDR programs given by grid operator, pay customers for their commitment to reduce load. The details of specific programs are represented in Table 1.

3. Mathematical Model

Three steps of MMG optimization in one phase were remarked upon in the previous section. Hence, the following section shows the formulation of mathematical models for each step. The proposed model is formulated for a day-ahead scheduling of 24 h with each time interval of t being assumed to be one hour.

3.1. Step 1: Local Optimization

The objective for the optimal operation in this step is to minimize the operation cost of each MG, as shown in Equation (1). The objective function consists of CDG generation and start-up cost in the first term. Following are the decision of shortage and surplus power, the incentive payment for curtailing load, and the penalty for shifting load from t to t’, respectively. Here, the penalty occurs when consumers do not allow the load shifting from t to t’. Otherwise there is no penalty for shifting load.
min i I t T ( C i C D G × P i , t C D G + y i , t × C i S U ) + t T ( C t B u y × P t S h o r t C t S e l l × P t S u r ) t T Inc t × P t C u r + t , t T t t v t , t × P t , t S h
where:
  • C i C D G is the generation cost of CDG unit i;
  • P i , t C D G is the amount of power generated by CDG unit i at t;
  • C i S U is the startup cost of CDG unit i;
  • y i , t is the startup indicator for CDG unit i;
  • C t B u y , C t S e l l are the prices for buying/selling power from/to the utility grid at t;
  • P t S h o r t , P t S u r are the amounts of shortage and surplus power at t;
  • Inc t is the incentive payment at t;
  • P t C u r is the amount of load to be cut (curtailed load) at t;
  • v t , t is the penalty of shifting load from t to t’;
  • P t , t S h is the amount of shifted load from t to t’.
Each CDG unit is constrained by Equations (2)–(4). Equation (2) represents the generation bounds for the CDG i at time t. The binary constraint in Equation (3) describes the on-off operation modes of the CDG. As a result of considering the on-off operation in CDG unit, the startup indicator is given by Equation (4).
u i , t × P i min P i , t C D G u i , t × P i max ;
u i , t = { 1      C D G   i s   o n 0      C D G   i s   o f f ;
y i , t = max { ( u i , t u i , t 1 ) , 0 } ;
where
  • P i min , P i max are the minimum and maximum generation amount of CDG unit i;
  • P i , t C D G is the amount of power generated by CDG unit i at t;
  • u i , t is the startup status identifier of CDG unit i at t.
The constraints for the BESS models are depicted in Equations (5)–(9). BESS can be considered as a source or a load when discharging or charging, respectively. The charging and discharging amounts are bounded by Equations (5) and (6). In each interval, the state-of-charge (SOC) of BESS is updated again based on the SOC of previous interval, as given by Equation (7). The SOC in the first interval is an exception, its value is based on the initial value or the SOC in the last interval of the previous day. SOC value is constrained by Equation (8). In addition, other components related to BESS, such as losses of discharging/charging, back-to-back (BTB) converter, and self-discharge rate are also included in BESS constraints.
0 P t B + P B C a p × ( 1 S O C t 1 B ) × 1 1 L B + × 1 η B B T B ;
0 P t B P B C a p × S O C t 1 B × ( 1 L B ) × η B B T B ;
S O C t B = S O C t 1 B 1 P B C a p × ( 1 1 L B × 1 η B B T B × P t B P t B + × ( 1 L B + ) × η B B T B ) ;
0 S O C t B 1 ;
S O C t 1 B = ( 1 δ B ) × S O C t 1 B ;
where
  • P t B + , P t B are the amount of energy charged/discharged to/from BESS at t;
  • P B C a p is the capacity of BESS;
  • L t B + , L t B are charging and discharging losses of BESS;
  • S O C t B , S O C t B are the states-of-charge for BESS at t before and after considering self-discharge;
  • η B B T B is the efficiency of back-to-back converters connected with BESS;
  • δ B is the self-discharge rate for BESS.
In this paper, electrical loads are divided into fixed load and adjustable load (including shiftable and curtailable loads). Curtailable load is a load partition, which can be cut down based on a pre-determined constant base load value during peak intervals. Shiftable load is different from curtailable load as it can be shifted from peak intervals to other remaining intervals where prices are lower. The customers decide the operation time of their loads (such as washing machines, HVAC system, etc.) to reduce the electricity payment. The constraints for curtailable load are given by Equations (10) and (11).
P t C u r P t L _ c u r   ;
P t C u r P t L o a d P b a s e ;
where
  • P t L _ c u r   is the amount of curtailable load at t;
  • P t L o a d is the electrical load demand of MG at t;
  • P b a s e is the value of base load.
Shiftable load is bounded by the maximum inflow and outflow power when shifting load from t to t’ interval, as represented by Equations (12) and (13). In addition, this shifting load action costs a penalty which is shown in Equation (14).
t T t t P t , t S h I F t max ;
t T t t P t , t S h O F t max = P t L _ s h ;
v t , t = { 0 i f   s h i f t i n g   i s   a l l o w e d   b y   c o n s u m e r s o t h e r w i s e ;
where P t L _ s h is the amount of shiftable load at t; and I F t max , O F t max is the maximum inflow and outflow of load to/from t.
The operation of each MG has to strictly follow the power balance rule. That means for each interval, the amount of RDG and CDG generation, BESS discharging, and shortage power must be equal to the amount of BESS charging, surplus power, and load. Furthermore, the load value can be original or modified based on the application of specific DR program. Hence, the constraint for power balancing is given by Equations (15) and (16).
P t R D G + i I P i , t C D G + P t S h o r t + P t B P t S u r P t B + = P t L _ a d j ;
P t L _ a d j = P t L _ f i x + ( P t L _ s h + t T t t P t , t S h t T t t P t , t S h ) + ( P t L _ c u r P t C u r ) ;
where
  • P t R D G is the amount of power generated by RDG at t;
  • P t L _ a d j is the amount of adjusted load at t;
  • P t L _ f i x is the amount of fixed load at t.
After the local optimization in step 1, all MG-EMSs send their information about the amount of surplus, shortage, and range of adjustable power to the C-EMS through the communication network.

3.2. Step 2: Community Optimization

The objective for the optimal operation in this step is to minimize the operation cost of the MMG system. The C-EMS collects the shortage, surplus, and adjustable power information from all MG-EMSs as well as the market price signals as input data, and runs optimization. The objective function is then formulated, consisting of cost for adjusting power and the profit from trading power with the utility grid, as represented by Equation (17):
min n N i I t T C n , i , t C D G × Δ P n , i , t A d j + n N t T ( C t B u y × P n , t B u y C t S e l l × P n , t S e l l ) ,
where
  • C n , i , t C D G is the generation cost of CDG unit i in MG n at t;
  • Δ P n , i , t A d j the amount of adjustable power used for CDG unit i in MG n at t;
  • P n , t B u y , P n , t S e l l are the amount of power for buying/selling from/to the utility grid by MG n at t.
The objective function above leads to two constraints in Equations (18) and (19). The bounds for adjustable power are given by Equation (18). In addition, to maintain power balance in MMG system, the amount of buying power from the utility grid, adjustable power, and surplus power has to be equal to the amount of shortage power and selling power for all MGs, as shown in Equation (19).
Δ P n , i , t A d j _ min Δ P n , i , t A d j Δ P n , i , t A d j _ max ;
n N P n , t B u y + n N i I Δ P n , i , t A d j + n N P n , t S u r = n N P n , t S h o r t + n N P n , t S e l l ;
where
  • Δ P n , i , t A d j _ min is the minimum adjustable power for CDG unit i in MG n at t;
  • Δ P n , i , t A d j _ max is the maximum adjustable power for CDG unit i in MG n at t;
  • P n , t S h o r t , P n , t S u r are the amounts of shortage and surplus power of MG n at t.

3.3. Step 3: Local Optimization (Rescheduling)

For gathering the information from the C-EMS about the power used for trading with the utility grid, sharing among MGs, and adjusting CDG generation, each MG-EMS runs optimization again. This action can be named rescheduling. The objective for the optimal operation in this step is to update again the operation cost of the MGs. The objective function in Equation (20) includes the cost from adjusted CDG generation amount and startup action, the profit from trading power with the utility grid, and the profit or payment for internal trading with other MGs.
min i I t T ( C i C D G × [ P i , t C D G + Δ P i , t A d j ] + y i , t × C i S U ) + t T ( C t B u y × P t B u y C t S e l l × P t S e l l ) + t T ( C t R e c × P t R e c C t S e n d × P t S e n d ) ,
where
  • C t R e c ,   C t S e n d are the prices for receiving/sending power of the MG from/to other MGs at t;
  • P t R e c ,   P t S e n d are the amounts of power in MG receiving/sending from/to other MGs at t;
  • Δ P i , t A d j is the amount of adjustable power used for CDG unit i at t.
C t S e n d × P t S e n d represents the profit for selling power to other MGs, C t R e c × P t R e c represents the payment for buying power from other MGs. In this step, each MG reschedules its components so there is no difference between the constraints in this step and those in step 1, except for the power balance constraint in Equation (21):
P t R D G + i I ( P i , t C D G + Δ P i , t A d j ) + P t B u y + P t B + P t R e c P t S e l l P t B + P t S e n d = P t L _ a d j .

4. Numerical Simulations

A mixed integer linear programming (MILP)-based mathematical model was developed for an MMG system considering the impact of several DR programs in this paper. The objective of the proposed model was to show the impact of DR programs on the internal trading, external trading, or operation cost. The developed MILP-based model was solved by using a branch-and-bound algorithm. The optimal solution was found to minimize the objective function based on bounds of variables. It was solved using IBM ILOG CPLEX Optimization Studio (CPLEX).
In this study, the test MMG system in Figure 1 was considered for implementation. Five scenarios were considered with the application of DR programs: RTP, CPP, EDRP, combined RTP-EDRP, and combined CPP-EDRP. EDRP-based programs will be studied, additionally with their impact on curtailed amount, shifted amount, and operation cost of the MGs. Finally, the impact of DR programs on the amount of power trading with the utility grid and sharing among MGs will be analyzed as well.

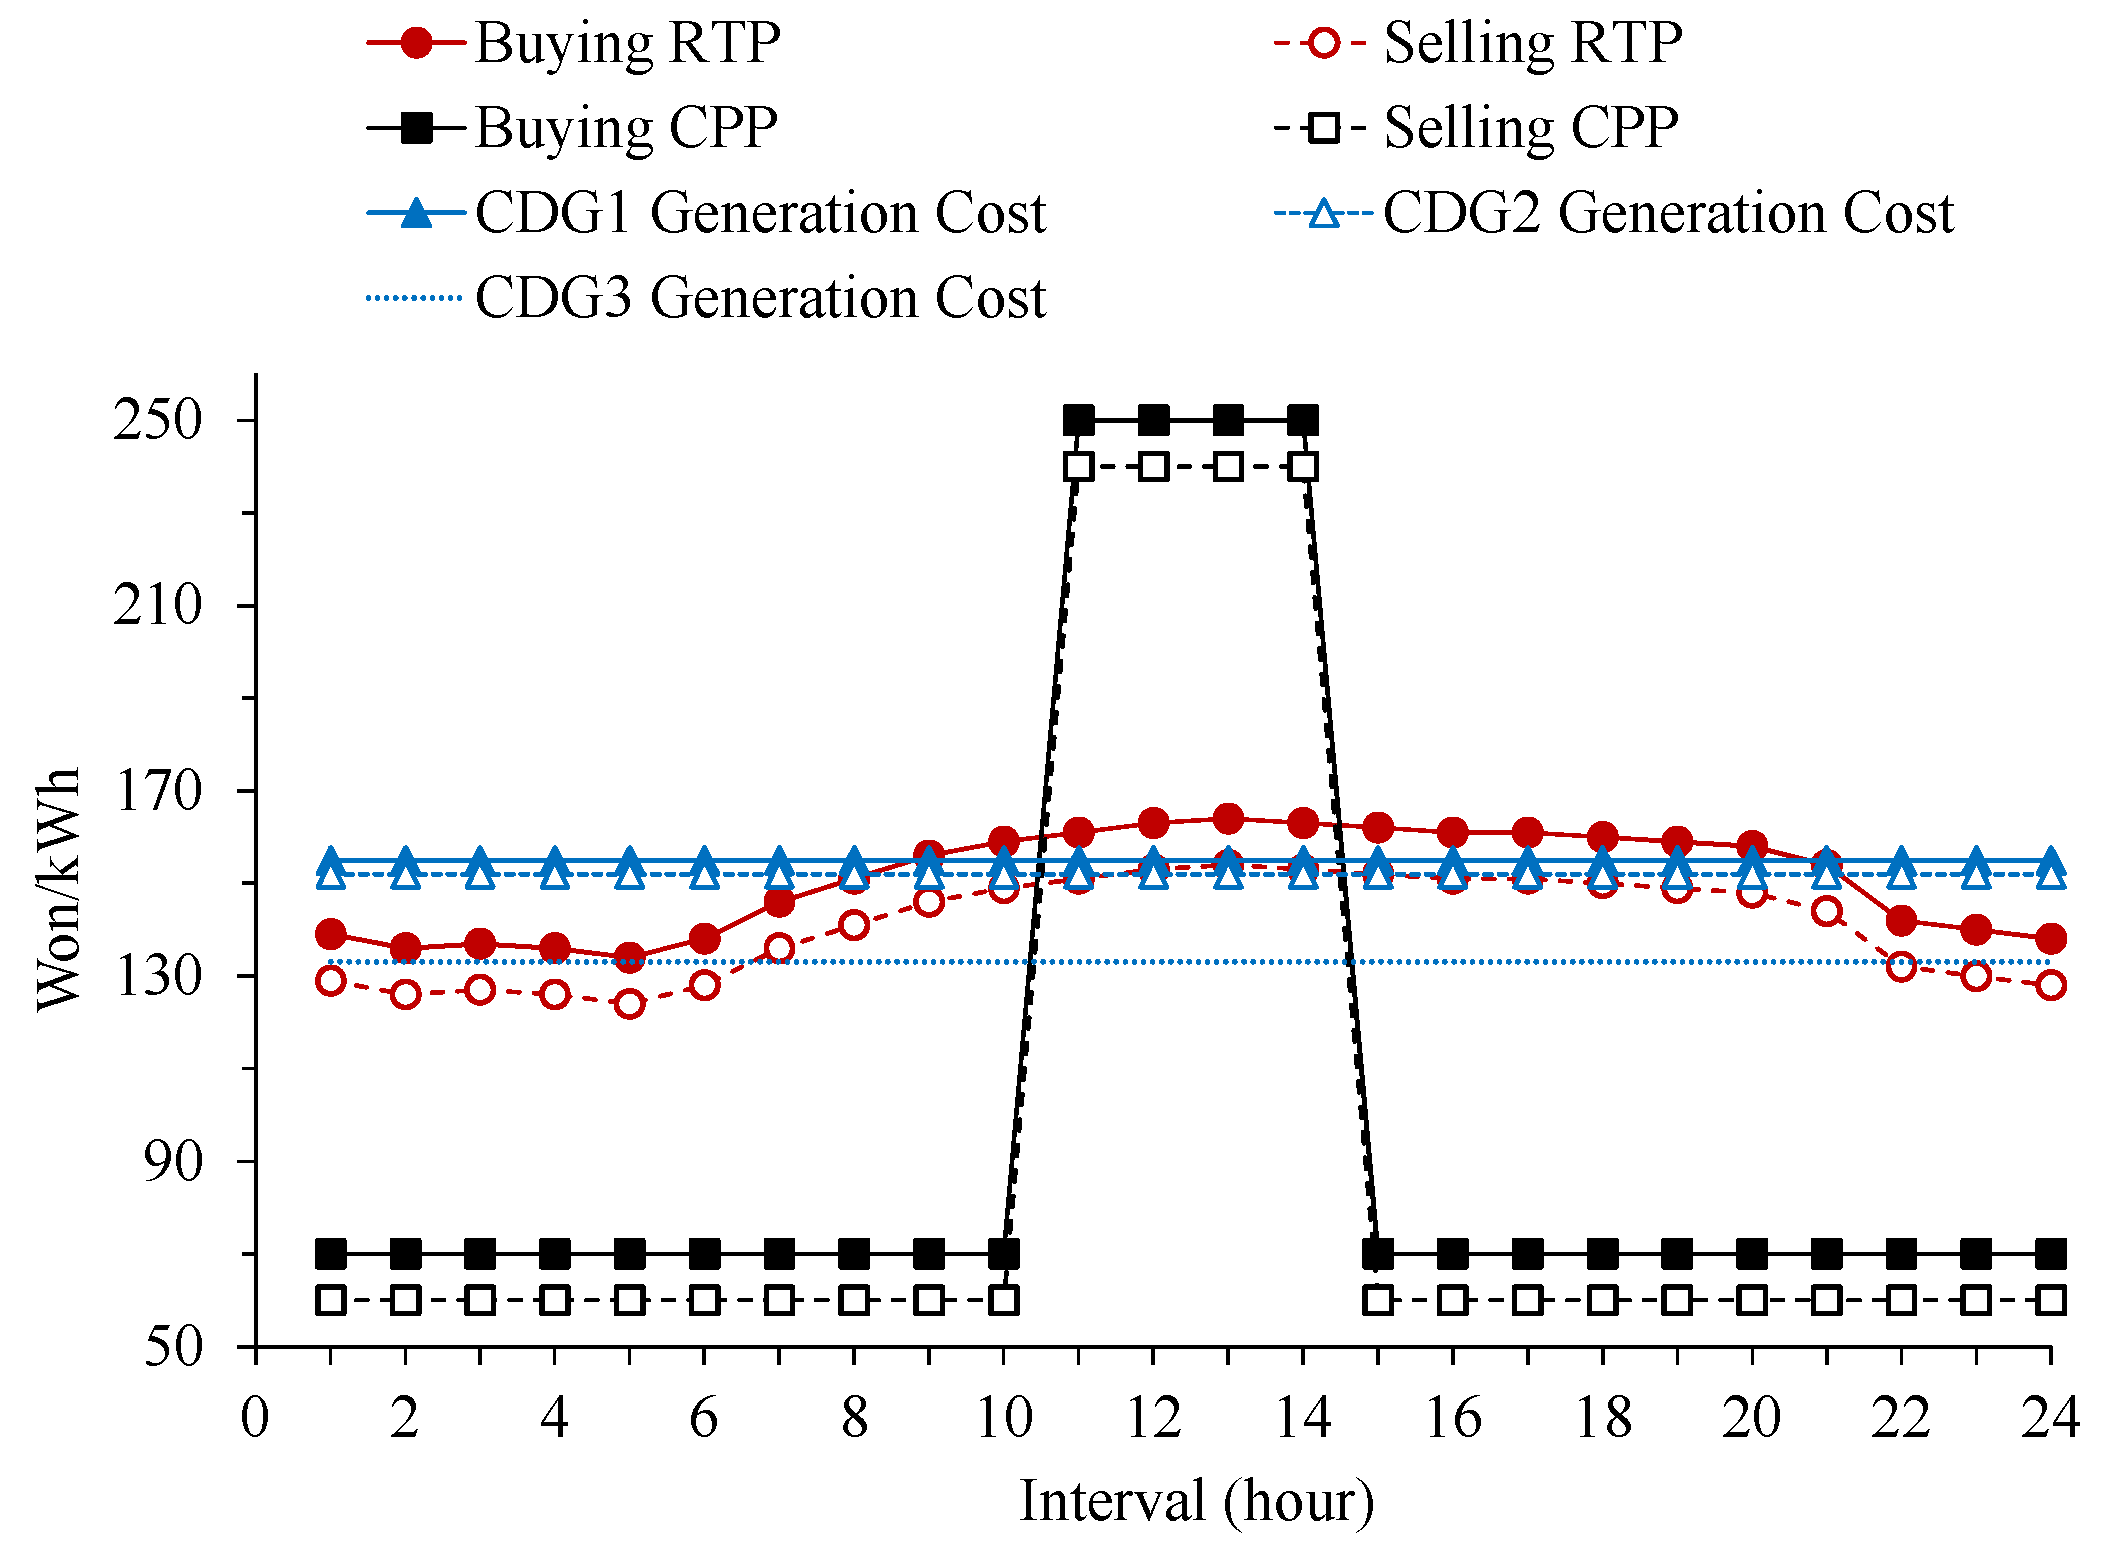
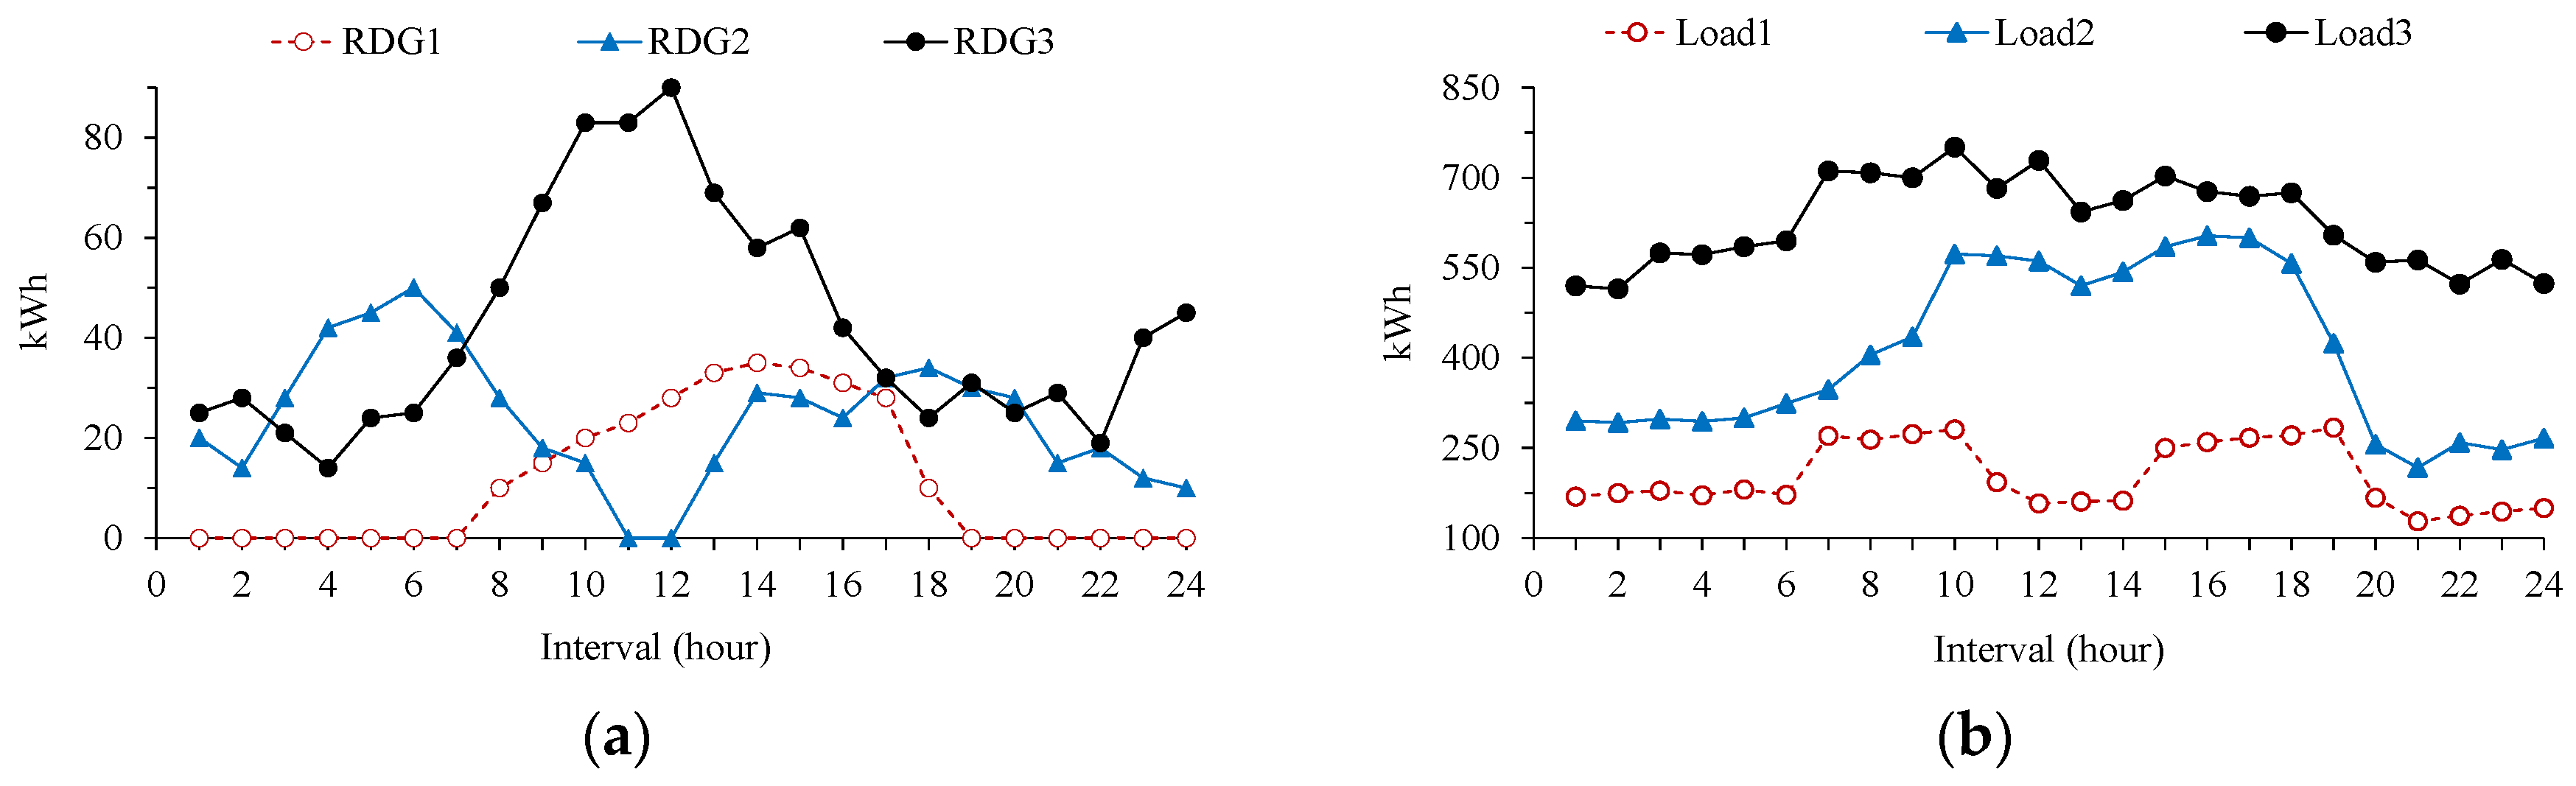
4.1. Input Parameters

The incentive value used for EDRP was determined to be higher than the buying price signals [25]. Therefore, the incentive value used for EDRP in this paper was assumed at 180 Won/kWh. RTP and CPP programs proposed their specific market price signals in Figure 3. The generation costs of the CDG units in each MG are also represented in Figure 3. In addition, CDG parameters with generation bounds, generation costs, and startup costs in each MG are given by Table 2. This table also depicts the parameters of capacity, initial amount, charging/discharging loss, and BTB efficiency of BESS. In Table 3, the prices for power trading among the MGs in MMG system are different due to the difference of generation costs of CDG units. The generation amount of RDG units and load profile of the MGs were taken from Figure 4, respectively.

4.2. Numerical Results

IBDR programs regularly use curtailing load strategies to curtail the load in specific time intervals with high prices. However, load can also be curtailed by a pre-determined constant value named base load, as mentioned with the constraints in step 1 of the MMG operation. The value of base load can be modified depending on the decision of the MMG operator, leading to questions about how the variation of base load value affects the operation of the MMG. Furthermore, the application of IBDR programs also results in the suspicion of the percentage of curtailable load that is adequate for the operation of the MMG. To evaluate these impacts, the amount of curtailed load, shifted load, and the operation cost of the MMG are chosen as the main criteria. Along with them, the main concern in MMG operation, external and internal trading power, is also investigated under the application of DR programs. Numerical results are analyzed in the following subsections.

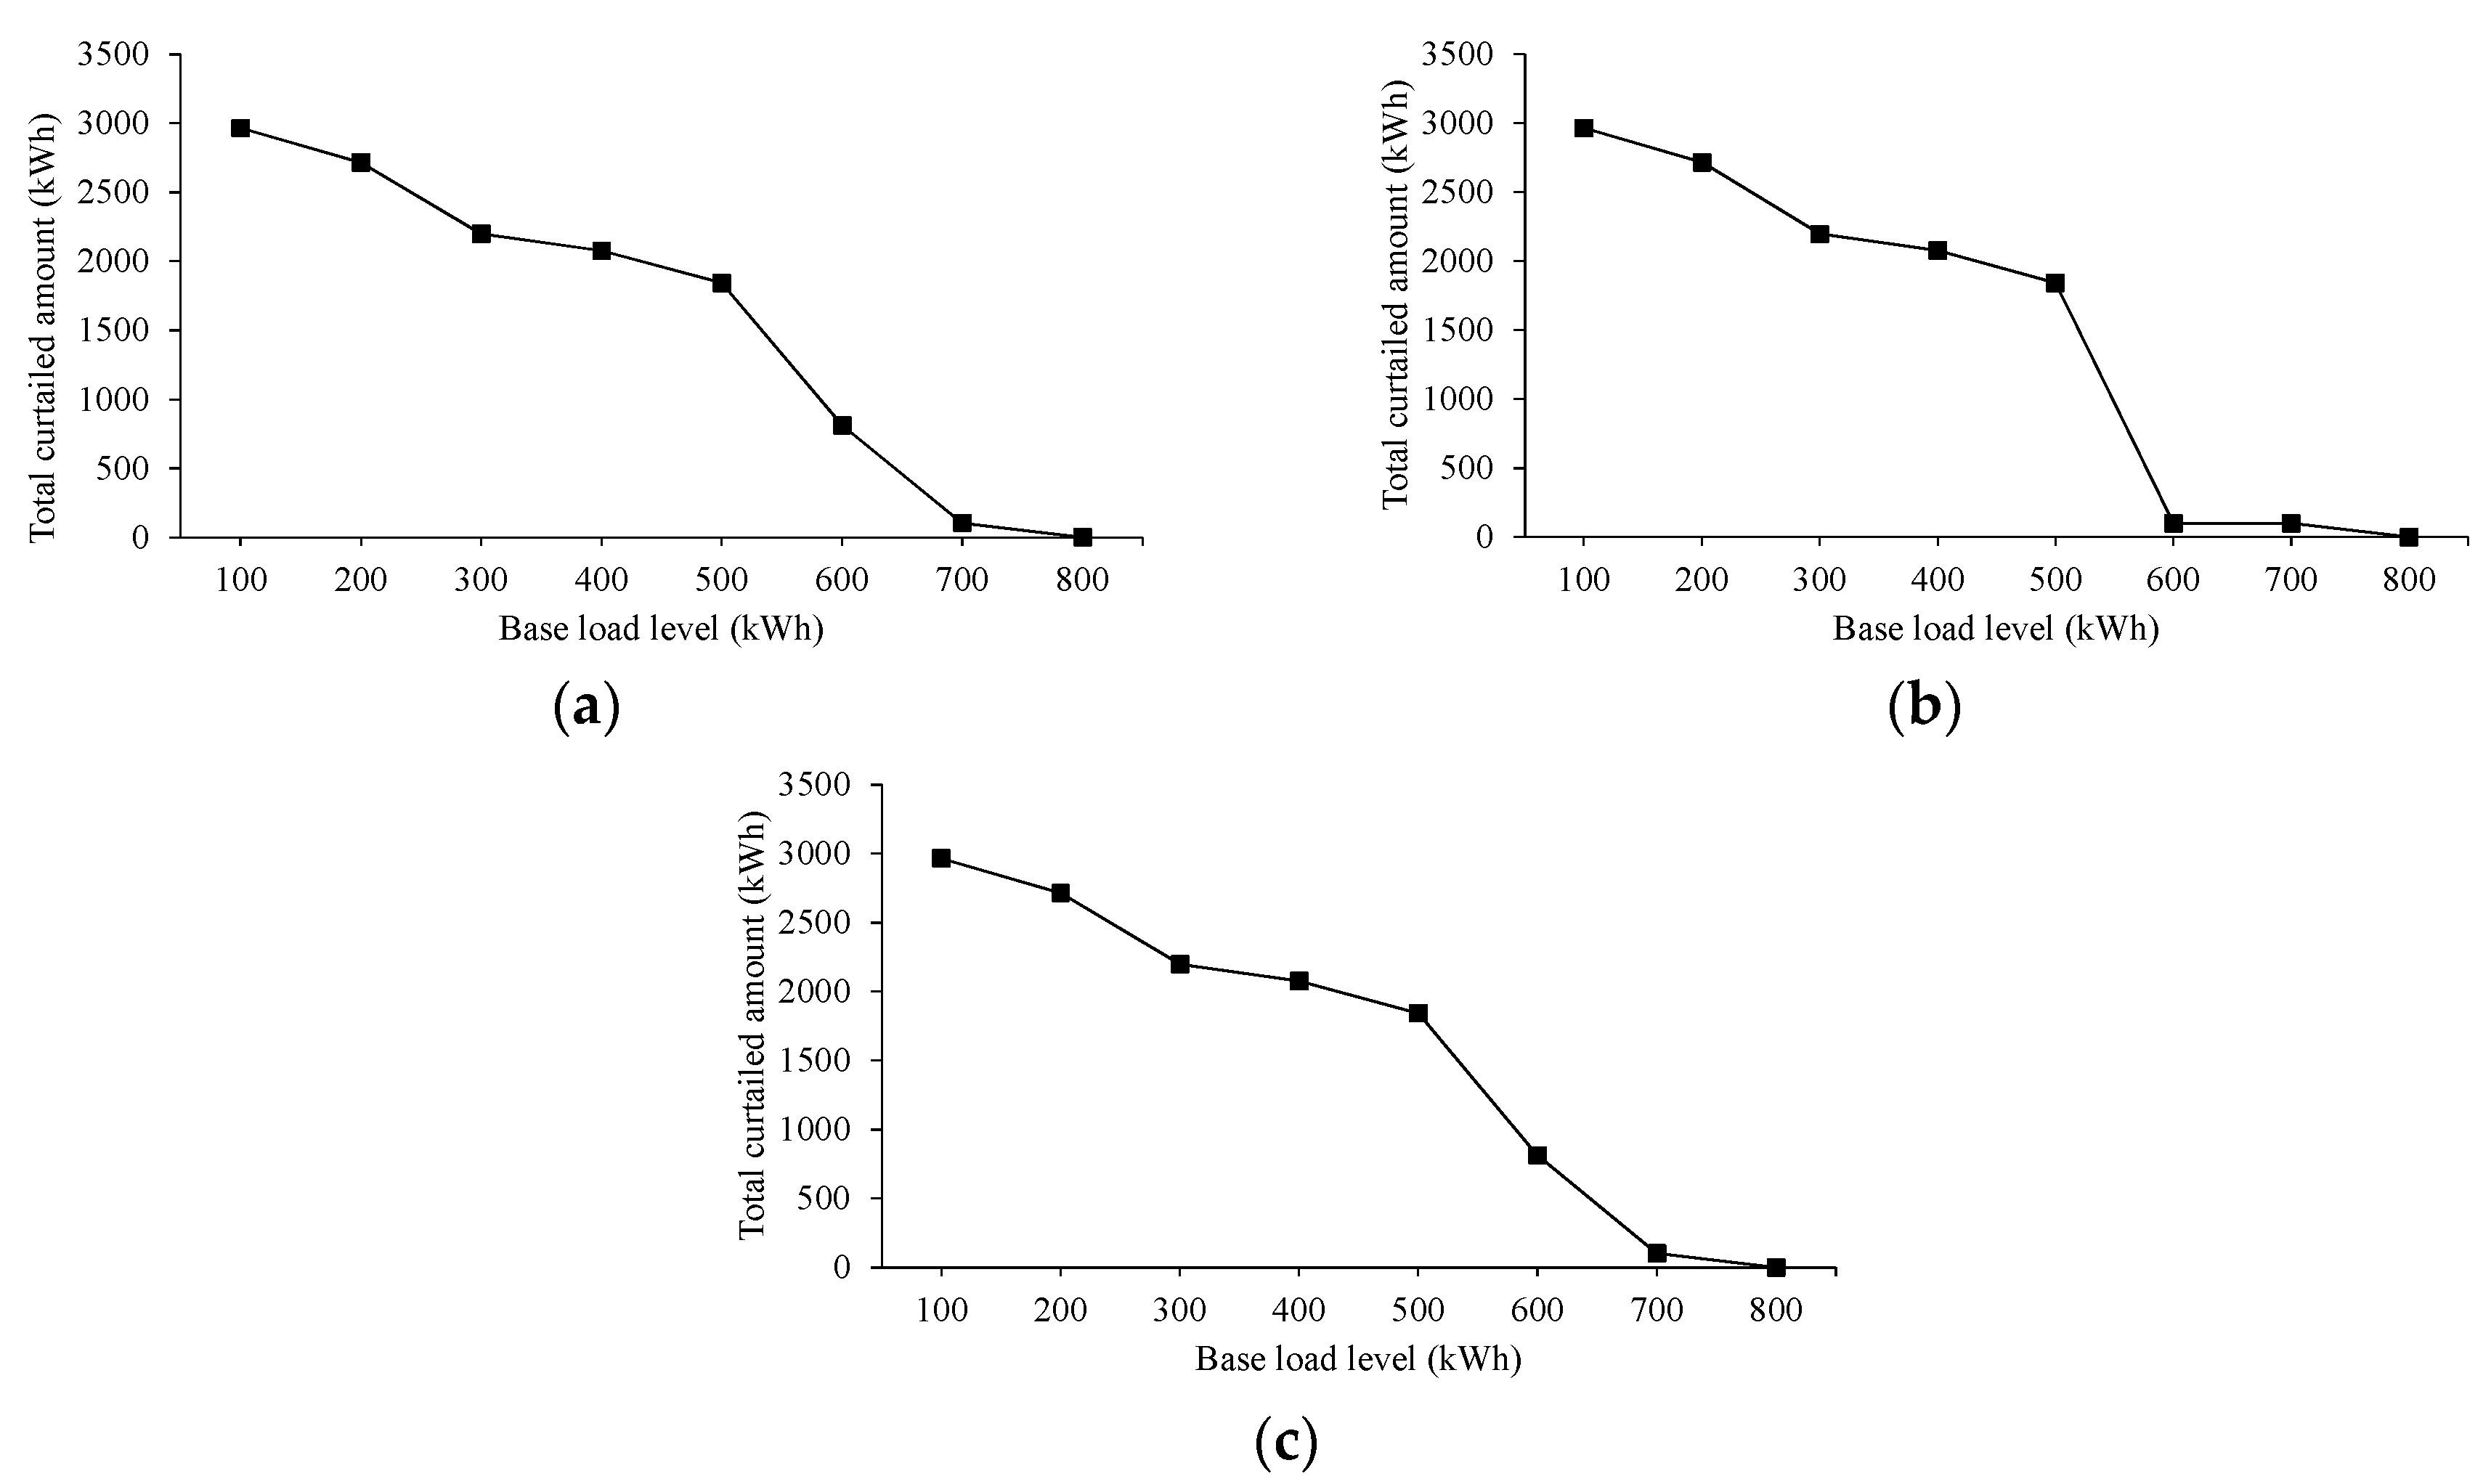
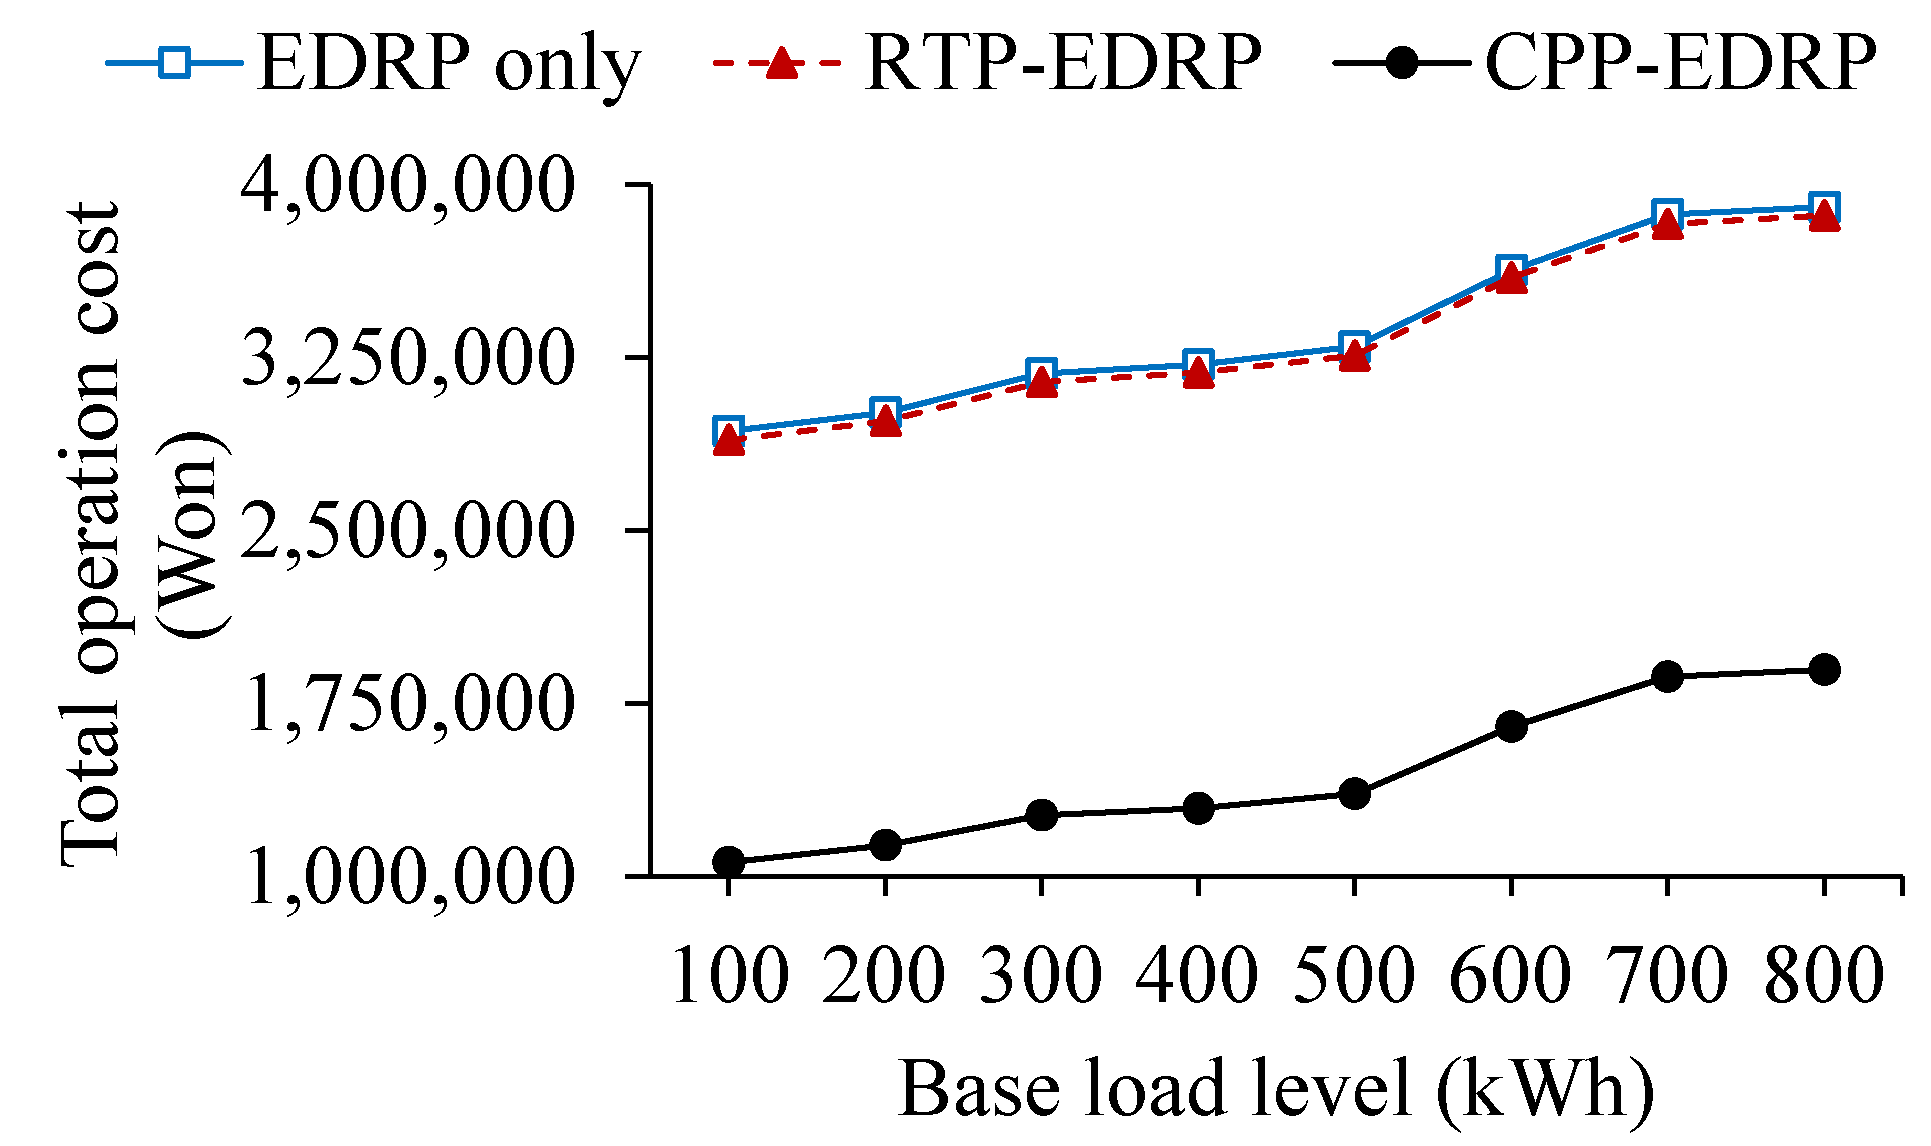
4.2.1. Impact of Base Load Level on Curtailed Amount, Shifted Amount, and Operation Cost of the MMG

To study how base load level influences the curtailed, shifted load amount, and operation cost of all MGs, only EDRP-based programs were tested since base load was only applied for curtailing the load during peak intervals. Hence, the test results when applying EDRP, RTP-EDRP, and CPP-EDRP will be analyzed. In addition, to gain a full range of test, the operation of each MG was implemented applying various base load values, from 100 kWh to 800 kWh (at 100 kWh resolution).
Firstly, the total curtailed amount in the MMG will be evaluated under three mentioned scenarios, as illustrated in Figure 5. As easily seen from the figure, there was a downward trend in total curtailed amount of the MMG in three scenarios. In other words, it can be summarized that the amount of curtailed load will decreases when the base load value increases.
Two PBDR programs, RTP and CPP, used shifting load strategies. Thus, when combining them with EDRP, there will be a load partition which was shiftable, resulting in an amount of shifted load when RTP-EDRP or CPP-EDRP was applied in the operation of MGs. Therefore, base load values only influenced the shifted amount of the MMG in these two scenarios, as given by Figure 6. The results of RTP-EDRP case provided a small reduction of 130 kWh when base load increased from 500 kWh to 700 kWh. Meanwhile, there was a fluctuation of around 50 kWh in CPP-EDRP case. These numbers were insignificant compared to the total load in the MMG. In summary, the variation of base load levels nearly had no impact on the amount of shifted load in the MMG.
Thirdly, Figure 7 shows the results of the investigation on the operation cost of the MMG when changing base load value. It is easily seen that three scenarios together showed an upward trend in the total operation cost of the MMG when base load value increased from 100 kWh to 800 kWh, which meant the operation cost of the MMG increased when base load value increased.

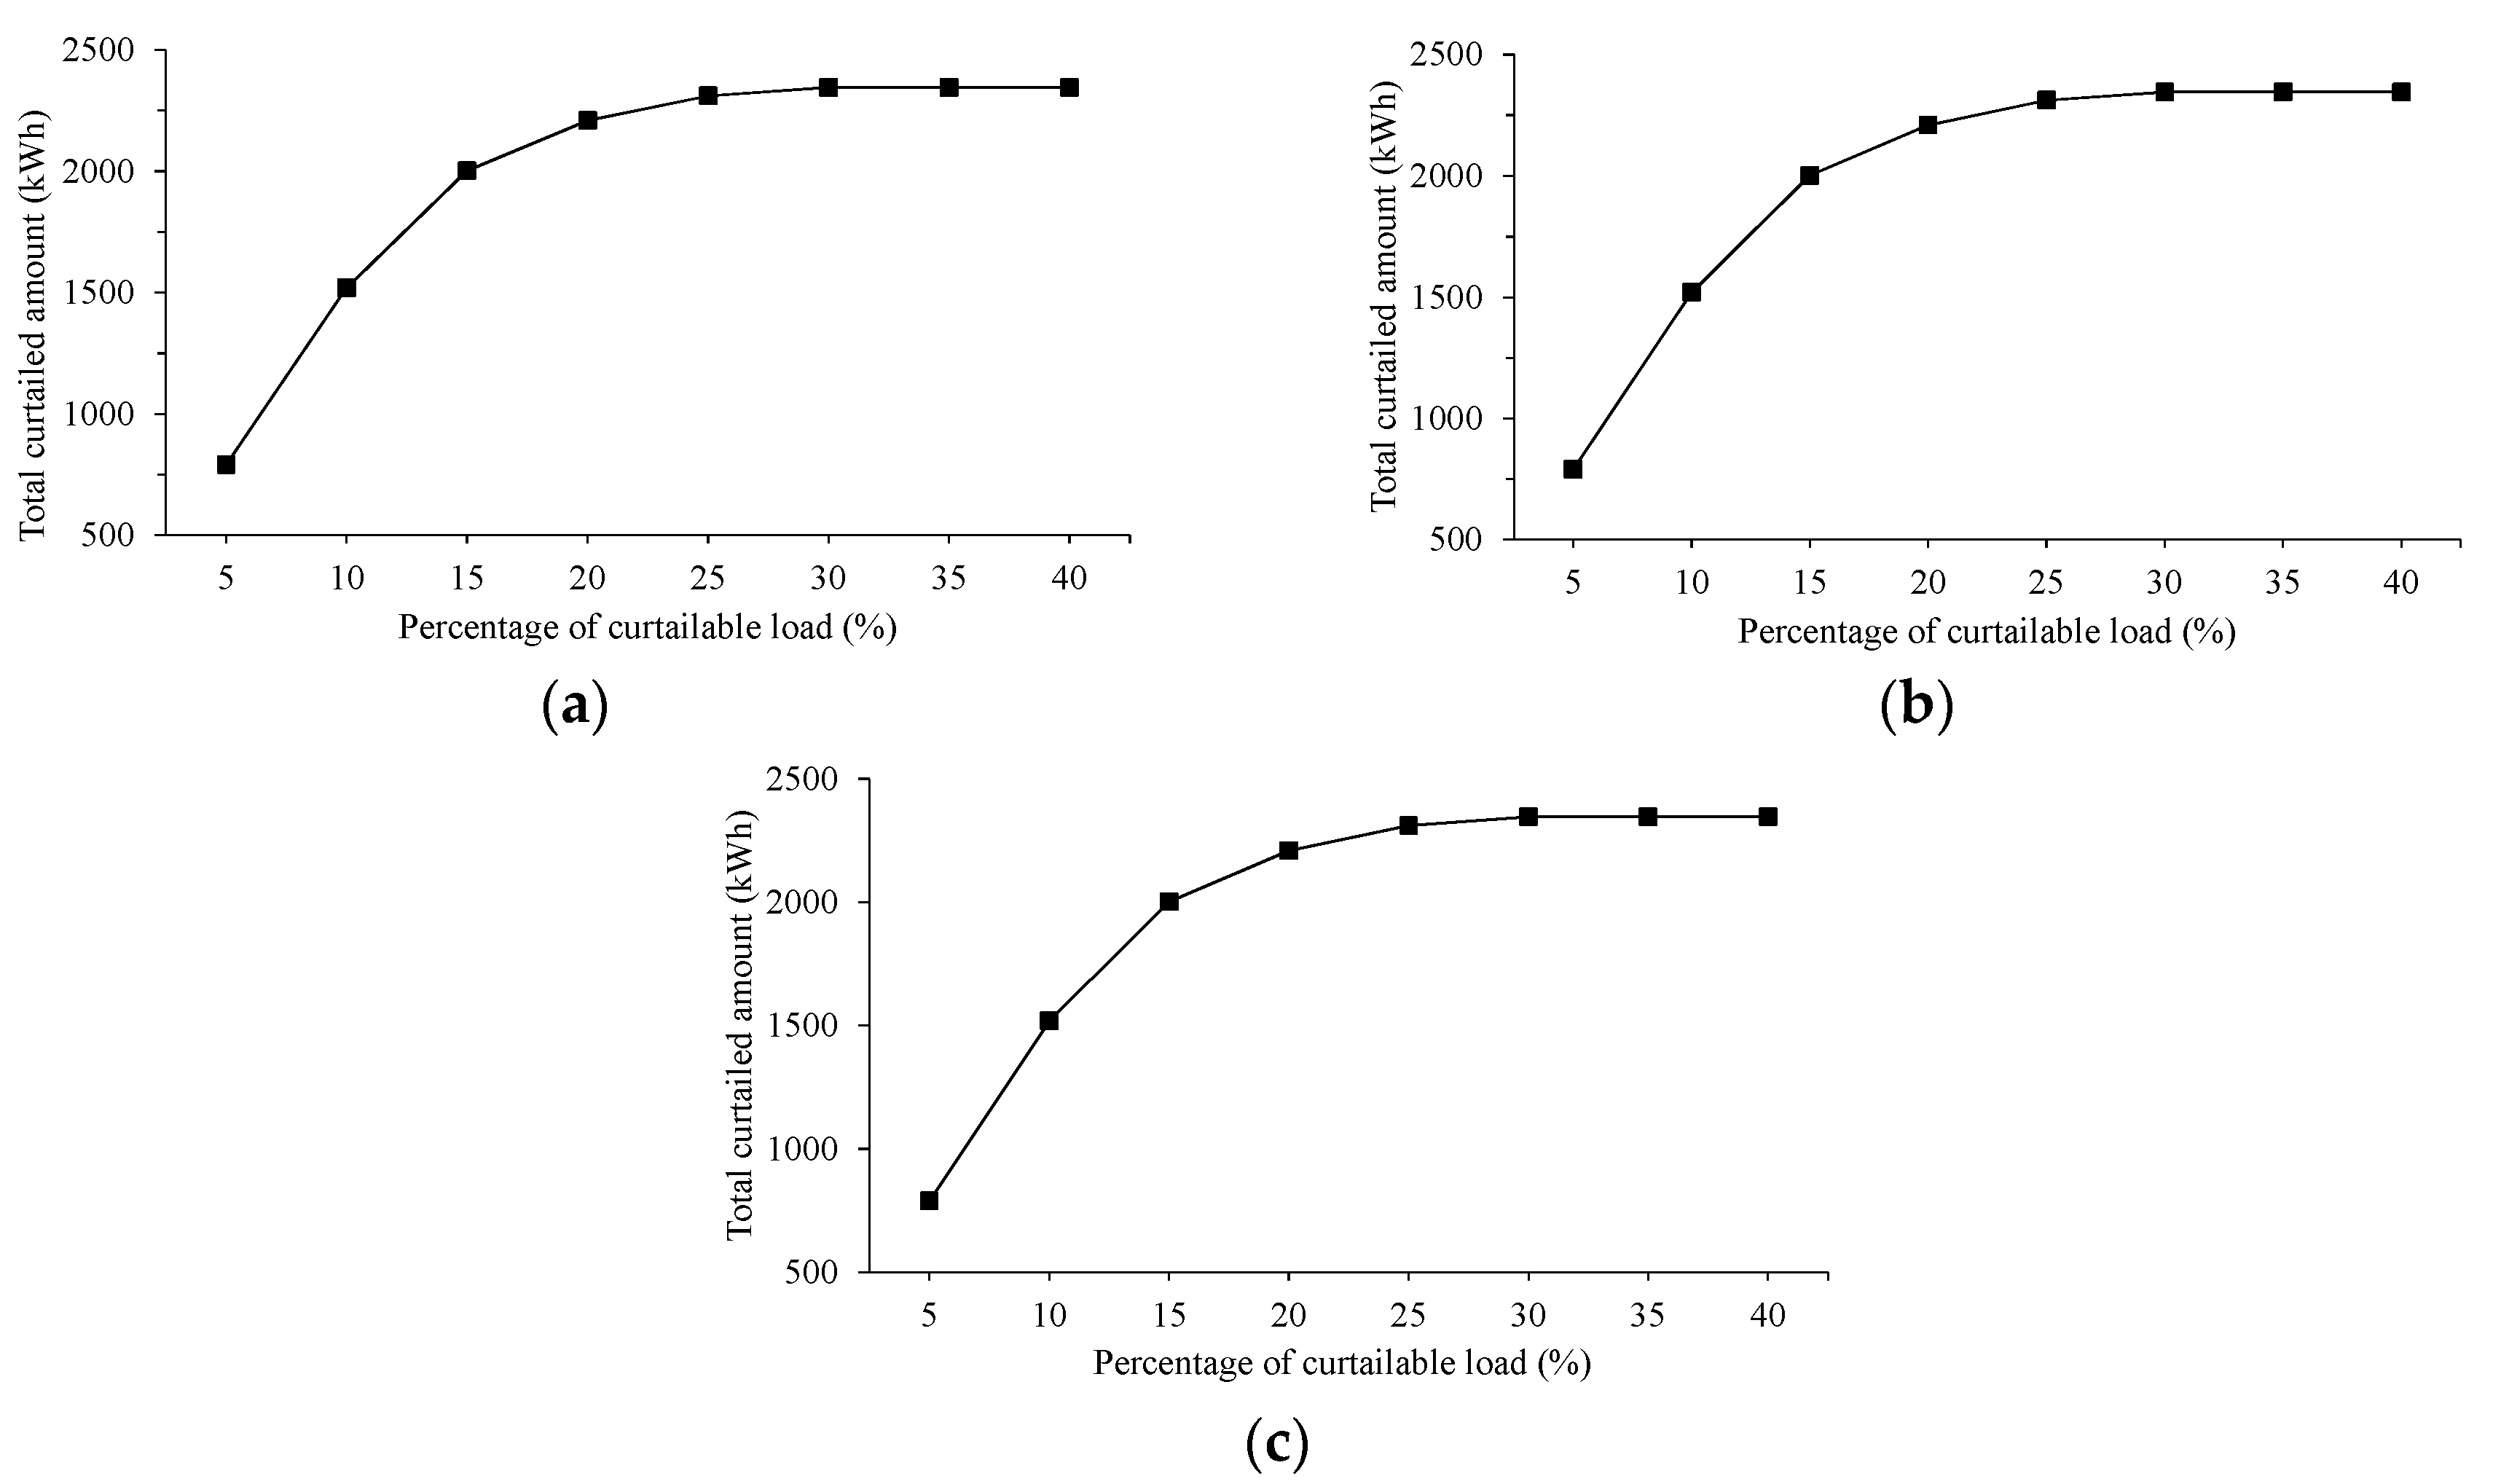
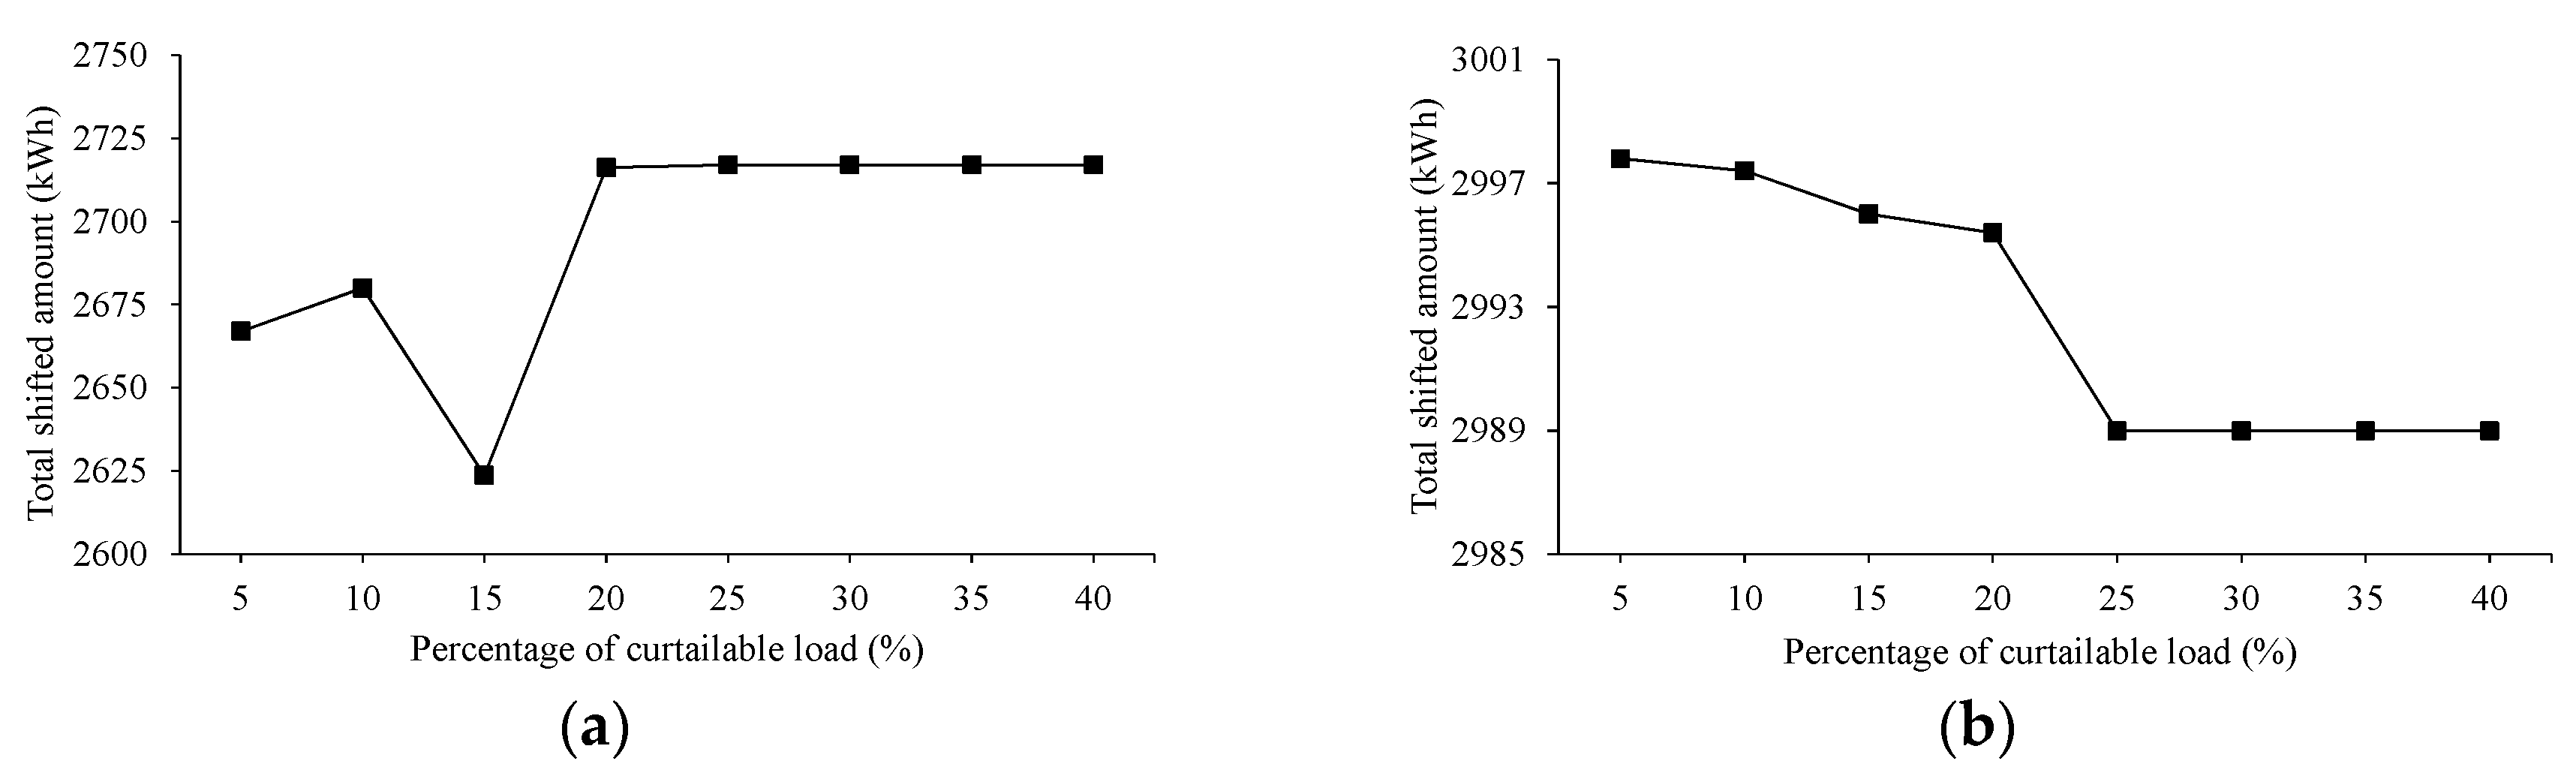
4.2.2. Impact of Curtailable Load Percentage on Curtailed Amount, Shifted Amount, and Operation Cost of the MMG

In a similar fashion to the base load level study, the influence of curtailable load percentage on curtailed amount, shifted amount, and operation cost of the MMG will be tested in scenarios applying EDRP-based programs such as EDRP, RTP-EDRP, and CPP-EDRP. The operation of the MMG in each scenario will be implemented with curtailable load percentage varied from 5% to 40% (at 5% resolution) while shiftable load percentage was fixed at 20% of total load.
The results of total curtailed amount was firstly analyzed, as depicted in Figure 8. The figure gives information that in three cases, the total curtailed amount in the MMG showed no difference and elevated when increasing the percentage of curtailable load from 5% to 40%. This similarity could be explained because in this case, RTP and CPP programs had no effect to the curtailable load amount when they were combined with EDRP when applied to the MMG operation.
Furthermore, the shifted load amount was also examined under the elevation of curtailable load percentage, as given by Figure 9. Similar to the study on base load level impact, only RTP-EDRP and CPP-EDRP were investigated because EDRP solely did not influence the shifted load by itself. In an RTP-EDRP scenario, a fluctuation of around 100 kWh occurred in the shifted load amount when the curtailable load percentage rose from 5% to 20% of total load. When CPP-EDRP was applied, there was a reduction of nearly 10 kWh when the percentage rose from 5% to 25%. To summarize, both two cases proved that there was no significant effect to the shifted load amount caused by the variation of curtailable load percentage.
Figure 10 finally shows how the curtailable load percentage impact the total operation cost of the MMG. The downward trend can be easily evaluated from the figure including three scenarios. Thus, the total operation cost of the MMG decreased when the percentage of curtailable load increased. It was also be seen that the curtailed amount in Figure 8 appeared the same while the operation costs were different in three cases. It was because the operation cost was influenced not only by curtailable load but also by shiftable load, which could be shifted from peak intervals to off-peak intervals to reduce cost. It can be elaborated that EDRP-only scenario did not apply load shifting strategies, so the operation cost was the highest. The remaining two scenarios used shifting strategies from RTP and CPP programs. Therefore, the operation cost of the MMG was lower in these cases. In particular, the prices proposed by CPP showed a big difference between peak intervals and off-peak intervals, resulting in relatively low operation cost compared to RTP. Therefore, the operation cost of the MMG in CPP-EDRP scenario was the lowest of the three cases.

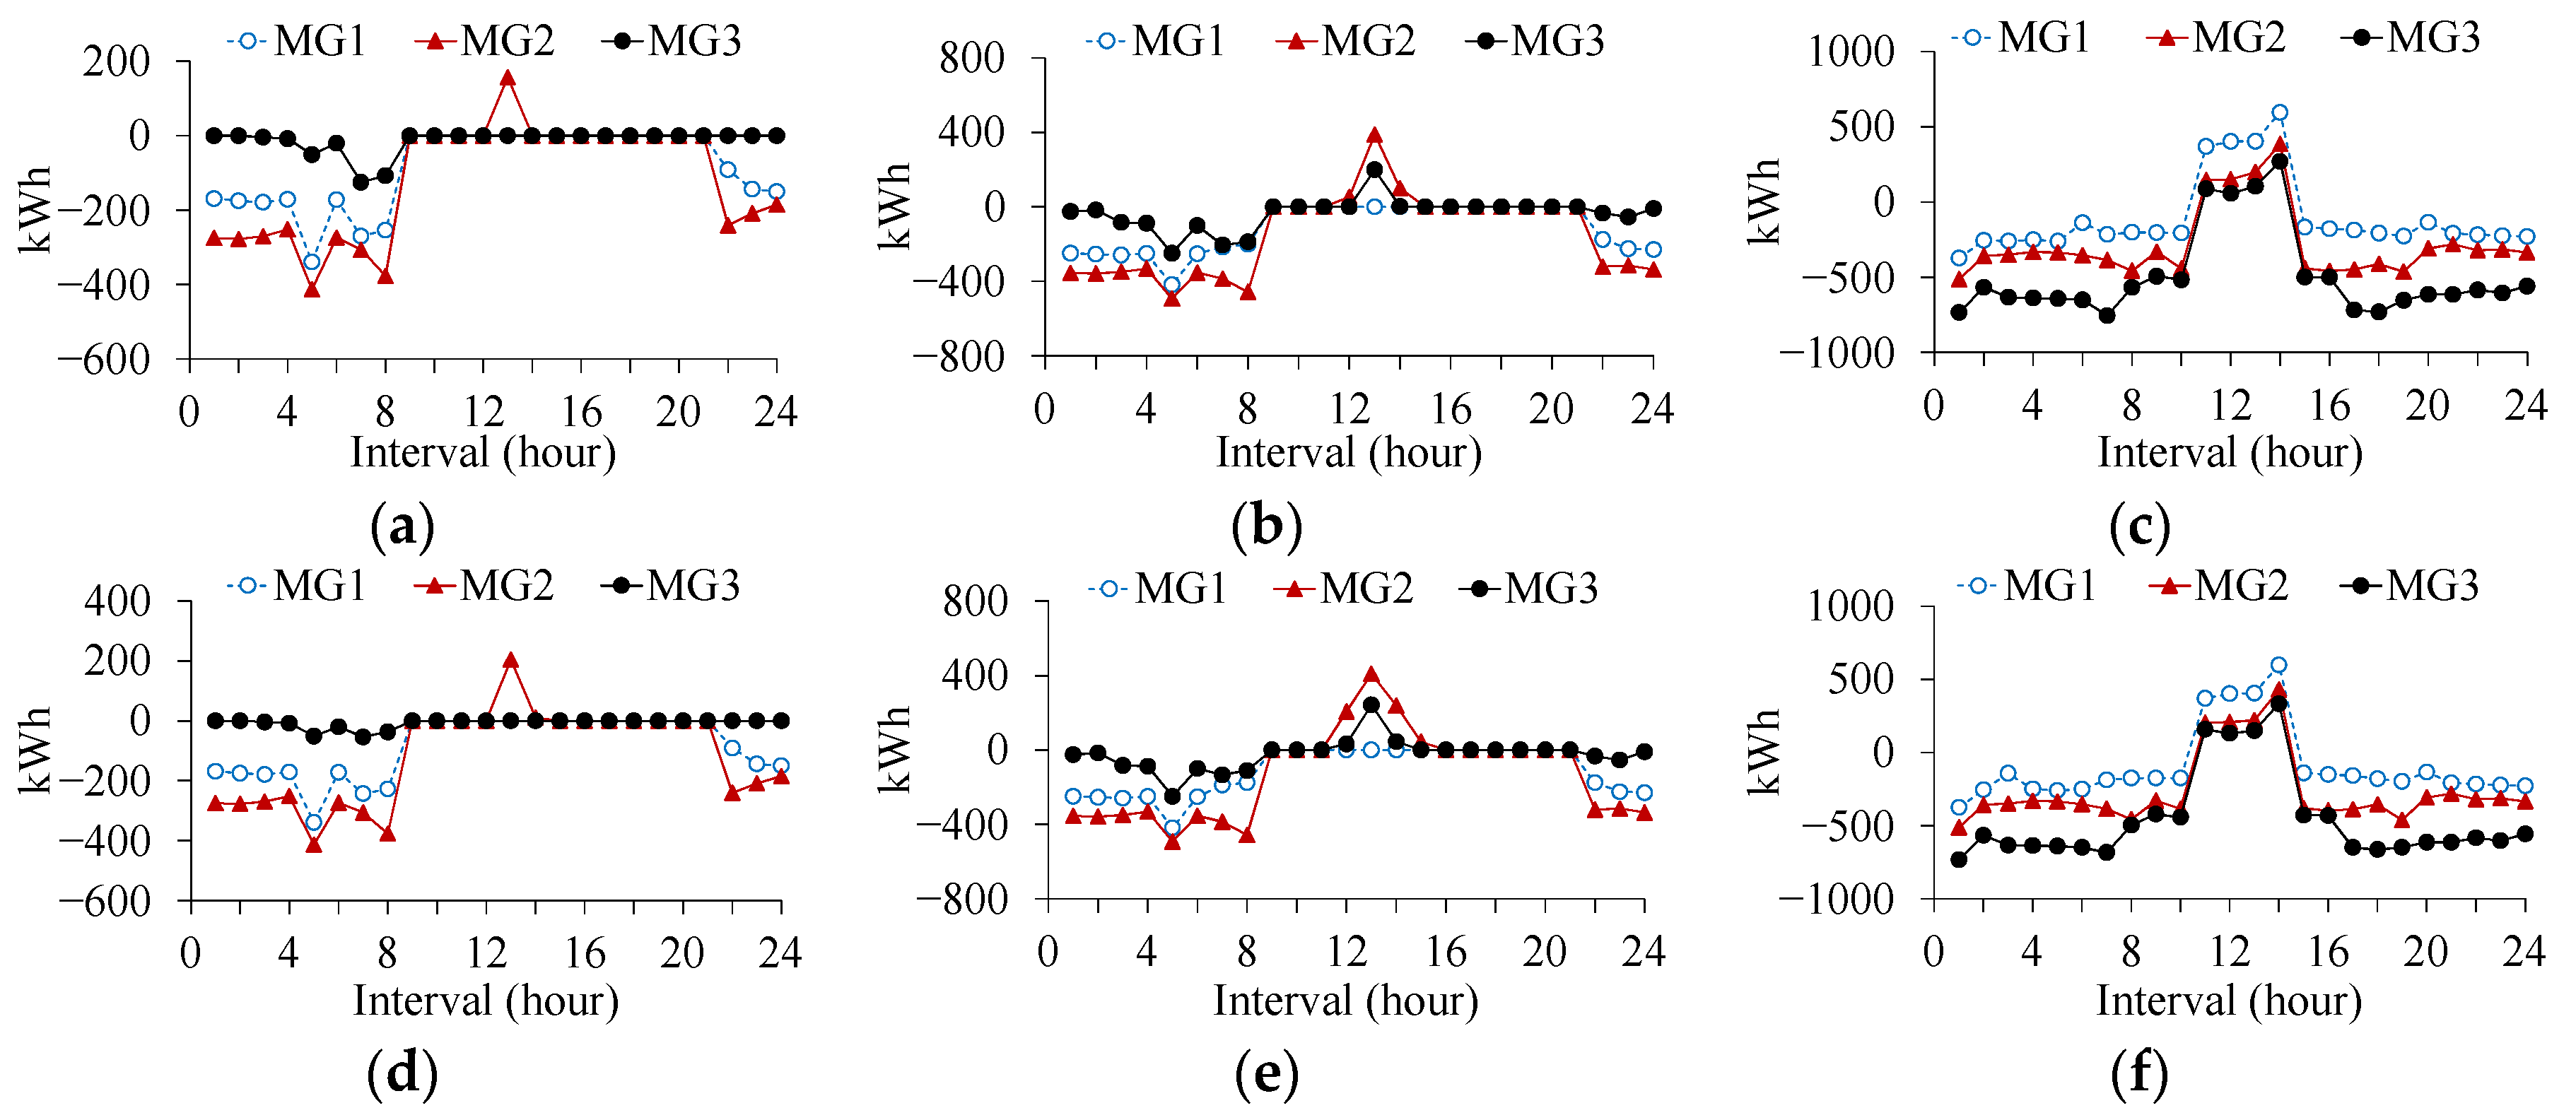
4.2.3. Impact of DR Programs on the Amount of External Trading and Internal Trading Power in the MMG

When studying the operation of the MMG, the issues around power trading among MGs and with the utility grid were mainly concentrated on. This paper will focus on the impact of DR programs on the internal and external trading power in the MMG. The external trading in this study was defined as the selling minus the buying amount, leading to its positive value when the former value was higher than the latter and vice versa.
Figure 11 summarizes the amount of external trading power in each MG in all scenarios. When no DR program was applied, only MG2 sold to the utility grid its surplus power, as given by Figure 11a. As EDRP only curtailed a load partition during peak intervals, Figure 11d illustrates that in the remaining intervals the day-ahead scheduling of EDRP-only scenario was similar to that of the without-DR scenario. Hence, the amounts of external trading in these cases were almost equal to each other. In the case of applying RTP to the MMG operation, it can be seen that not only MG2, but also MG3, sold to the utility grid its power at t = 13, the interval with the highest market price proposed by RTP program. Besides, CPP program proposed other market price signals, resulting in big differences between scenarios that applied CPP and the others, as shown in Figure 11c,f. Due to the market prices of CPP, all MGs sold to the utility grid all their surplus power during intervals from t = 11 to t = 14 and also externally bought power to compensate their shortage amount in the remaining intervals.
While Figure 11 summarizes the impact of DR programs on external trading in the MMG, Figure 12 analyzes the internal trading power among MGs in all cases of DR application. It can be deduced from Figure 12a,b,d,e that MG2 not only sold to the utility grid but also sent its surplus power to other MGs in without-DR and EDRP cases. In addition, due to the impact of RTP program, MG3 also contributed to the amount of sending power in the MMG. For scenarios applying CPP or CPP-EDRP, the market price signals proposed by CPP were higher in peak intervals and lower in other intervals than CDG generation cost. Therefore, the MGs traded all their surplus/shortage power with the utility grid instead of buying from each other. That was the reason why there was no internal trading power in these cases, as given by Figure 12c,f.
To clarify and summarize the trading amounts in the MMG, Table 4 was built. It was seen that only EDRP reduced external trading and increased internal trading amount of the MMG. That was appropriate for a typical MMG, where the preference is that all MGs share with each other rather than trade power with external sources. The application of RTP-EDRP also increased internal trading, but that coincidentally caused the rise of the external trading amount. It was because of the contribution of RTP program in this scenario. In detail, it can be seen that RTP solely led to a big increase and decrease in the amount external and internal power trading, respectively, resulting in the performance of RTP-EDRP mentioned above. Besides, with the performance of CPP-based scenarios analyzed in Figure 11 and Figure 12, there was no power sharing among MGs, so the power amount used for trading with the utility grid was enormous, about three to four times compared to other scenarios. Despite not being suitable for a typical MMG, these DR programs could be useful in specific cases, depending on how the is MMG considered In particular, CPP-based programs could be applied when MMG focuses on internal trading reduction, but that would cost an enormous amount of external trading. So if the MMG limits the rise of external trading amount to a certain value, not as large as in CPP-based scenarios, RTP could be an ideal alternative solution.
From the viewpoint of economic operation, it was seen that the CPP-EDRP outperformed the EDRP or RTP-EDRP cases due to the difference of market price signals. However, in this paper, the impact of DR programs on the power trading among MGs (internal trading) and power trading with the utility grid (external trading) was also considered. Based on the numerical results, each DR program showed its pros/cons on the economic operation, internal trading, or external trading. For example, in order to increase the amount of internal trading the performance of RTP-EDRP was much better than CPP-EDRP.

5. Conclusions

A synthesis of various DR programs and their impact on the optimal operation of MMG was analyzed in this paper. The numerical results illustrated the impact of base load level and curtailable load percentage on the amount of shifted, curtailed load, and the operation cost of the MMG. In particular, the total curtailed load amount was reduced when base load value increased but raised when the percentage of curtailable amount increased. However, the mentioned factors almost had no influence on the total shifted load amount, since this amount rose or dropped with significantly small values. Besides, total operation cost of the MMG increased and decreased when both base load value and curtailable load percentage were raised, respectively.
Furthermore, the test of DR programs on the MMG system also triggered a study about their impact on the amount of external and internal trading power in the MMG. From the results, it could be summarized that whether the application of DR programs was useful for the MMG or not depended notably on how the MMG considered. Particularly, when power sharing among MGs was required to be reduced, CPP and RTP program could be handy, but RTP was more appropriate for an MMG, which limited the raise of external trading. Meanwhile, EDRP was a typical DR program to apply in a standard MMG, which encourages internal trading prior to external trading. The findings could be implemented for some specific cases to control the amount of internal trading, external trading, or reduce the operation cost of whole system.
However, some forecasts have to be used in case of performing day-ahead scheduling, including loads, RDGs, etc. Therefore, it is necessary to consider the accuracy of forecasts and its impact on the performance of the algorithm used in MMG operation. The uncertainty of forecasting will be considered as the future work of the study in this paper.

Author Contributions

A.-D.N. conceived and designed the experiments; V.-H.B. and A.H. performed the experiments and analyzed the data; H.-M.K. and D.-H.N. revised and analyzed the results; A.-D.N. wrote the paper.

Acknowledgments

This work was supported by Incheon National University International Cooperative Research Grant in 2017.

Conflicts of Interest

The authors declare no conflicts of interest.

References

  1. Lenzen, M. Current state of development of electricity-generating technologies: A literature review. Energies 2010, 3, 462–591. [Google Scholar] [CrossRef]
  2. Mohammed, Y.S.; Mustafa, M.; Bashir, N.; Mokhtar, A.S. Renewable energy resources for distributed power generation in Nigeria: A review of the potential. Renew. Sustain. Energy Rev. 2013, 22, 257–268. [Google Scholar] [CrossRef]
  3. Shakeel, S.R.; Takala, J.; Shakeel, W. Renewable energy sources in power generation in Pakistan. Renew. Sustain. Energy Rev. 2016, 64, 421–434. [Google Scholar] [CrossRef]
  4. Rehmani, M.H.; Reisslein, M.; Rachedi, A.; Erol-Kantarci, M.; Radenkovic, M. Integrating renewable energy resources into the smart grid: Recent developments in information and communication technologies. IEEE Trans. Ind. Inform. 2018. [Google Scholar] [CrossRef]
  5. Telukunta, V.; Pradhan, J.; Agrawal, A.; Singh, M.; Srivani, S.G. Protection challenges under bulk penetration of renewable energy resources in power systems: A review. CSEE J. Power Energy Syst. 2017, 3, 365–379. [Google Scholar] [CrossRef]
  6. Gil, H.A.; Joos, G. Customer-owned back-up generators for energy management by distribution utilities. IEEE Trans. Power Syst. 2007, 22, 1044–1050. [Google Scholar] [CrossRef]
  7. Morstyn, T.; Hredzak, B.; Agelidis, V.G. Control strategies for microgrids with distributed energy storage systems: An overview. IEEE Trans. Smart Grid 2016. [Google Scholar] [CrossRef]
  8. Guo, W.; Zhang, J.; Song, N.; Gao, Z.; Ma, T.; Zhu, Z.; Xu, X.; Li, L.; Wang, Y.; Dai, S.; et al. Overview and development progress of a 1-MVA/1-MJ superconducting fault current limiter-magnetic energy storage system. IEEE Trans. Appl. Supercond. 2016, 26, 1–5. [Google Scholar] [CrossRef]
  9. Gyamfi, S.; Krumdieck, S.; Urmee, T. Residential peak electricity demand response—Highlights of some behavioural issues. Renew. Sustain. Energy Rev. 2013, 25, 71–77. [Google Scholar] [CrossRef] [Green Version]
  10. Yang, X.; Zhang, Y.; He, H.; Ren, S.; Weng, G. Real-time demand side management for a microgrid considering uncertainties. IEEE Trans. Smart Grid 2018. [Google Scholar] [CrossRef]
  11. Tang, X.; Milanović, J.V. Assessment of the impact of demand-side management on distribution network voltage stability. CIRED Open Access Proc. J. 2017, 2017, 2118–2121. [Google Scholar] [CrossRef]
  12. Faruqui, A.; George, S. Quantifying customer response to dynamic pricing. Electr. J. 2005, 18, 53–63. [Google Scholar] [CrossRef]
  13. Kessels, K.; Kraan, C.; Karg, L.; Maggiore, S.; Valkering, P.; Laes, E. Fostering residential demand response through dynamic pricing schemes: A behavioural review of smart grid pilots in Europe. Sustainability 2016, 8, 929. [Google Scholar] [CrossRef]
  14. Hussain, A.; Bui, V.H.; Kim, H.M. Impact quantification of demand response uncertainty on unit commitment of microgrids. In Proceedings of the IEEE International Conference on Frontiers of Information Technology (FIT), Islamabad, Pakistan, 19–21 December 2016; pp. 274–279. [Google Scholar]
  15. Hussain, A.; Bui, V.H.; Kim, H.M. Impact analysis of demand response intensity and energy storage size on operation of networked microgrids. Energies 2017, 10, 882. [Google Scholar] [CrossRef]
  16. O’Neill, J. Demand Response: Electricity Market Benefits and Energy Efficiency Coordination; Nova Science Publishers: New York, NY, USA, 2014; ISBN 978-1-622948-072-5. [Google Scholar]
  17. Asadinejad, A.; Rahimpour, A.; Tomsovic, K.; Qi, H.; Chen, C.F. Evaluation of residential customer elasticity for incentive based demand response programs. Electr. Power Syst. Res. 2018, 158, 23–36. [Google Scholar] [CrossRef]
  18. Hatziargyriou, N.; Asano, H.; Iravani, R.; Marnay, C. Microgrids. IEEE Power Energy Mag. 2007, 5, 78–94. [Google Scholar] [CrossRef]
  19. Kim, H.M.; Lim, Y.; Kinoshita, T. An intelligent multiagent system for autonomous microgrid operation. Energies 2012, 5, 3347–3362. [Google Scholar] [CrossRef]
  20. Sao, C.K.; Lehn, P.W. Control and power management of converter fed microgrids. IEEE Trans. Power Syst. 2008, 23, 1088–1098. [Google Scholar] [CrossRef]
  21. Tsikalakis, A.G.; Hatziargyriou, N.D. Centralized control for optimizing microgrids operation. IEEE Trans. Energy Convers. 2008, 23, 241–248. [Google Scholar] [CrossRef]
  22. Parisio, A.; Rikos, E.; Glielmo, L. A model predictive control approach to microgrid operation Optimization. IEEE Trans. Control Syst. Technol. 2014, 22, 1813–1827. [Google Scholar] [CrossRef]
  23. Panwar, L.K.; Konda, S.R.; Verma, A.; Panigrahi, B.K.; Kumar, R. Operation window constrained strategic energy management of microgrid with electric vehicle and distributed resources. IET Gener. Transm. Distrib. 2017, 11, 615–626. [Google Scholar] [CrossRef]
  24. Li, J.; Qi, W. Toward optimal operation of internet data center microgrid. IEEE Trans. Smart Grid 2018, 9, 971–979. [Google Scholar] [CrossRef]
  25. Bui, V.H.; Kim, H.M.; Song, N.O. Applying demand response based on TOU and EDRP to optimal microgrid operation. Int. J. Smart Home 2015, 9, 41–50. [Google Scholar] [CrossRef]
  26. Bui, V.H.; Hussain, A.; Kim, H.M. A multiagent-based hierarchical energy management strategy for multi-microgrids considering adjustable power and demand response. IEEE Trans. Smart Grid 2018, 9, 1323–1333. [Google Scholar] [CrossRef]
  27. Bui, V.H.; Hussain, A.; Kim, H.M. A strategy for flexible frequency operation of stand-alone multi-microgrids. IEEE Trans. Sustain. Energy 2018. [Google Scholar] [CrossRef]
  28. Fan, S.; Ai, Q.; Piao, L. Hierarchical energy management of microgrids including storage and demand response. Energies 2018, 11, 1111. [Google Scholar] [CrossRef]
  29. Khodaei, A.; Shahidehpour, M.; Choi, J. Optimal hourly scheduling of community-aggregated electricity consumption. J. Electr. Eng. Technol. 2013, 8, 1251–1260. [Google Scholar] [CrossRef]
  30. Oprea, S.V.; Bâra, A.; Reveiu, A. Informatics solution for energy efficiency improvement and consumption management of householders. Energies 2018, 11, 138. [Google Scholar] [CrossRef]
  31. Cha, H.J.; Won, D.J.; Kim, S.H.; Chung, I.Y.; Han, B.M. Multi-agent system-based microgrid operation strategy for demand response. Energies 2015, 8, 14272–14286. [Google Scholar] [CrossRef]
  32. Fioretto, F.; Yeoh, W.; Pontelli, E.; Ma, Y.; Ranade, S.J. A distributed constraint optimization (DCOP) approach to the economic dispatch with demand response. In Proceedings of the 16th Conference on Autonomous Agents and MultiAgent Systems (AAMAS ‘17), São Paulo, Brazil, 8–12 May 2017; pp. 999–1007. [Google Scholar]
  33. Srivastava, A.; Van Passel, S.; Laes, E. Assessing the success of electricity demand response programs: A meta-analysis. Energy Res. Soc. Sci. 2018, 40, 110–117. [Google Scholar] [CrossRef]
Figure 1. The configuration of a multi-microgrid system.
Energies 11 01452 g001
Figure 2. Flowchart for operation of the multi-microgrid system.
Energies 11 01452 g002
Figure 3. Market price signals and generation cost of CDG units in each MG [26].
Energies 11 01452 g003
Figure 4. Input data for each MG: (a) RDG generations; (b) load profiles [27].
Energies 11 01452 g004
Figure 5. Impact of base load level on total curtailed amount of the MMG: (a) when EDRP is applied; (b) when RTP-EDRP is applied; (c) when CPP-EDRP is applied.
Energies 11 01452 g005
Figure 6. Impact of base load level on total shifted amount of the MMG: (a) when RTP-EDRP is applied; (b) when CPP-EDRP is applied.
Energies 11 01452 g006
Figure 7. Impact of base load level on total operation cost of the MMG.
Energies 11 01452 g007
Figure 8. Impact of curtailable load percentage on total curtailed amount of the MMG: (a) when EDRP is applied; (b) when RTP-EDRP is applied; (c) when CPP-EDRP is applied.
Energies 11 01452 g008
Figure 9. Impact of curtailable load percentage on total shifted amount of the MMG: (a) when RTP-EDRP is applied; (b) when CPP-EDRP is applied.
Energies 11 01452 g009
Figure 10. Impact of curtailable load percentage on total operation cost of the MMG.
Energies 11 01452 g010
Figure 11. Impact of DR programs on the external trading amount of the MMG in all scenarios: (a) without DR; (b) RTP only; (c) CPP only; (d) EDRP only; (e) RTP-EDRP; (f) CPP-EDRP.
Energies 11 01452 g011
Figure 12. Impact of DR programs on the internal trading amount of the MMG in all scenarios: (a) without DR; (b) RTP only; (c) EDRP only; (d) RTP-EDRP.
Energies 11 01452 g012
Table 1. Types of DR programs [16].
PBDR ProgramsIBDR Programs
• TOU rates:
Rates where there are different fixed price sets during a day.
• RTP rates:
Rates that varies timely (typically hourly) in response to market prices.
• CPP rates:
Rates including a pre-defined, extra-high rate presented by the utility and is applied for a restricted period of time.
• Direct load control:
Customers receive rewards by giving the utility to right to control specific equipment directly.
• Demand bidding/buyback programs:
Customers make offers to curtail a partition of load during periods with high market prices.
• Emergency demand response program (EDRP):
Customers are rewarded for reducing the load when needed for reliability preservation.
• Capacity market programs:
Customers are rewarded for load reduction allowance instead of system capacity.
• Interruptible/curtailable:
Customers receive discounts thanks to load reduction allowance when requested.
• Ancillary services market programs:
Customers are rewarded by the grid operator for their load-curtailing commitment when requested in order to keep up grid operation.
Table 2. Parameters related to CDG units and BESS in each MG of MMG system [26].
ParametersCDG1CDG2CDG3ParametersBESS
Min. (kWh)000Capacity (kWh)200
Max. (kWh)500600550Initial (kWh)50
Gen. Cost (Won/kWh)155152133Char./Dischar. Loss (%)3
Startup Cost (Won/kWh)200200150BTB Efficiency (%)98
Table 3. Parameters related to prices for internal trading among MGs of MMG system.
Prices for internal tradingPrice (Won/kWh)
Price (MG1→MG2, MG1→MG3)155
Price (MG2→MG1, MG2→MG3)152
Price (MG3→MG1, MG3→MG2)133
Table 4. External and internal trading amount in the MMG in all scenarios.
ScenariosExternal Trading Amount (kWh)Internal Trading Amount (kWh)
Without DR53531588
RTP only70971018
CPP only21,0830
EDRP only51011700
RTP-EDRP64241648
CPP-EDRP19,5660

