An Experimental Investigation on the NO and CO Emission Characteristics of a Swirl Convergent-Divergent Nozzle at Elevated Pressure


Abstract
:1. Introduction
2. Experimental Setup
2.1. Experimental Apparatus
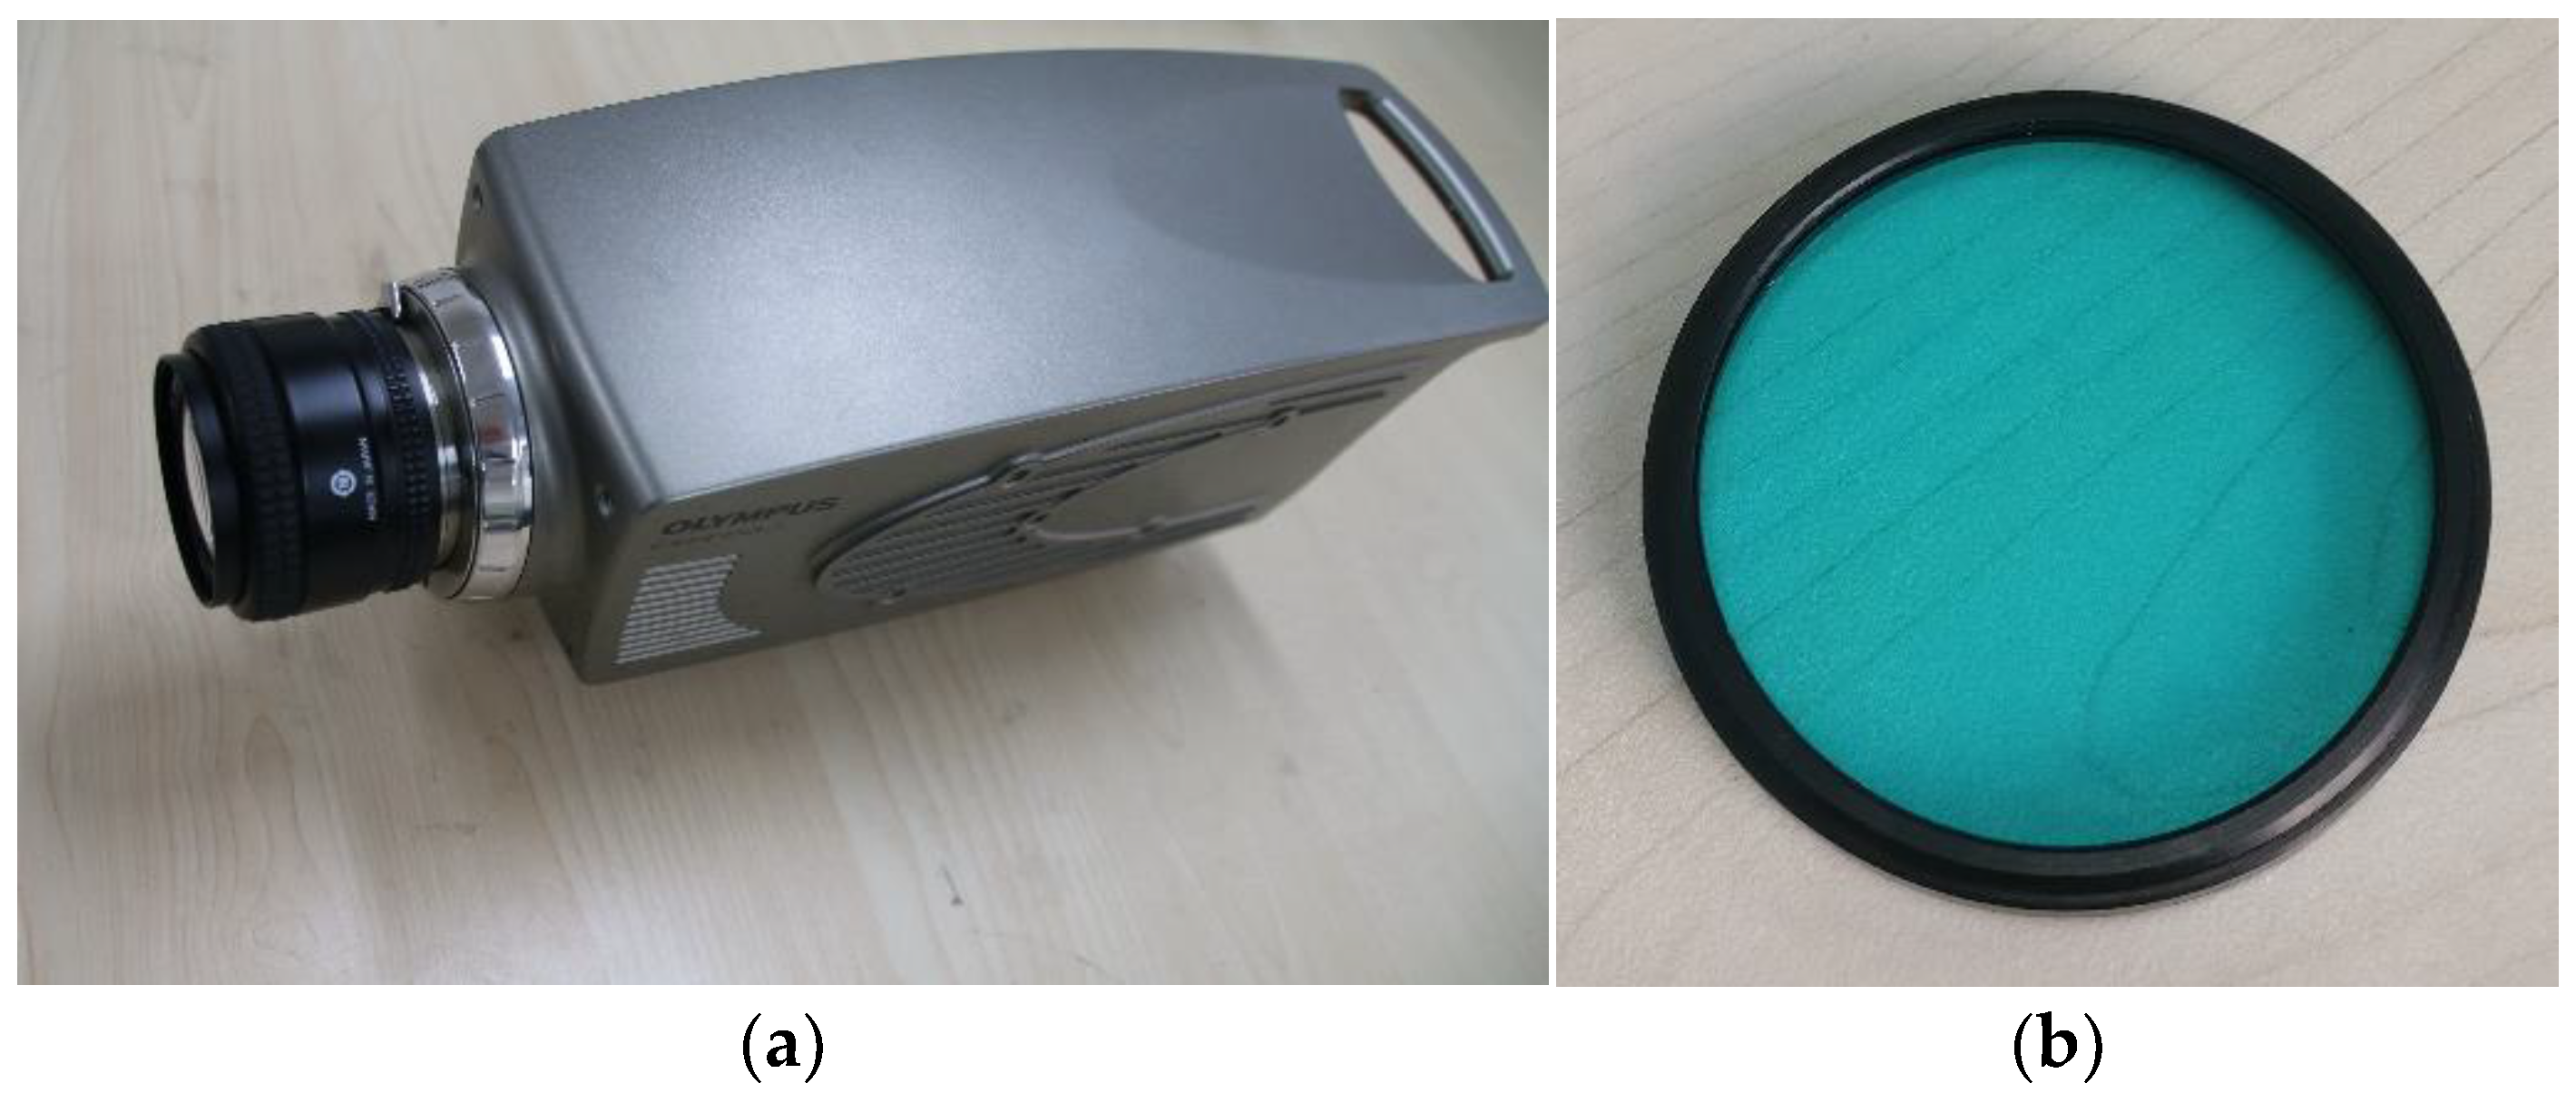
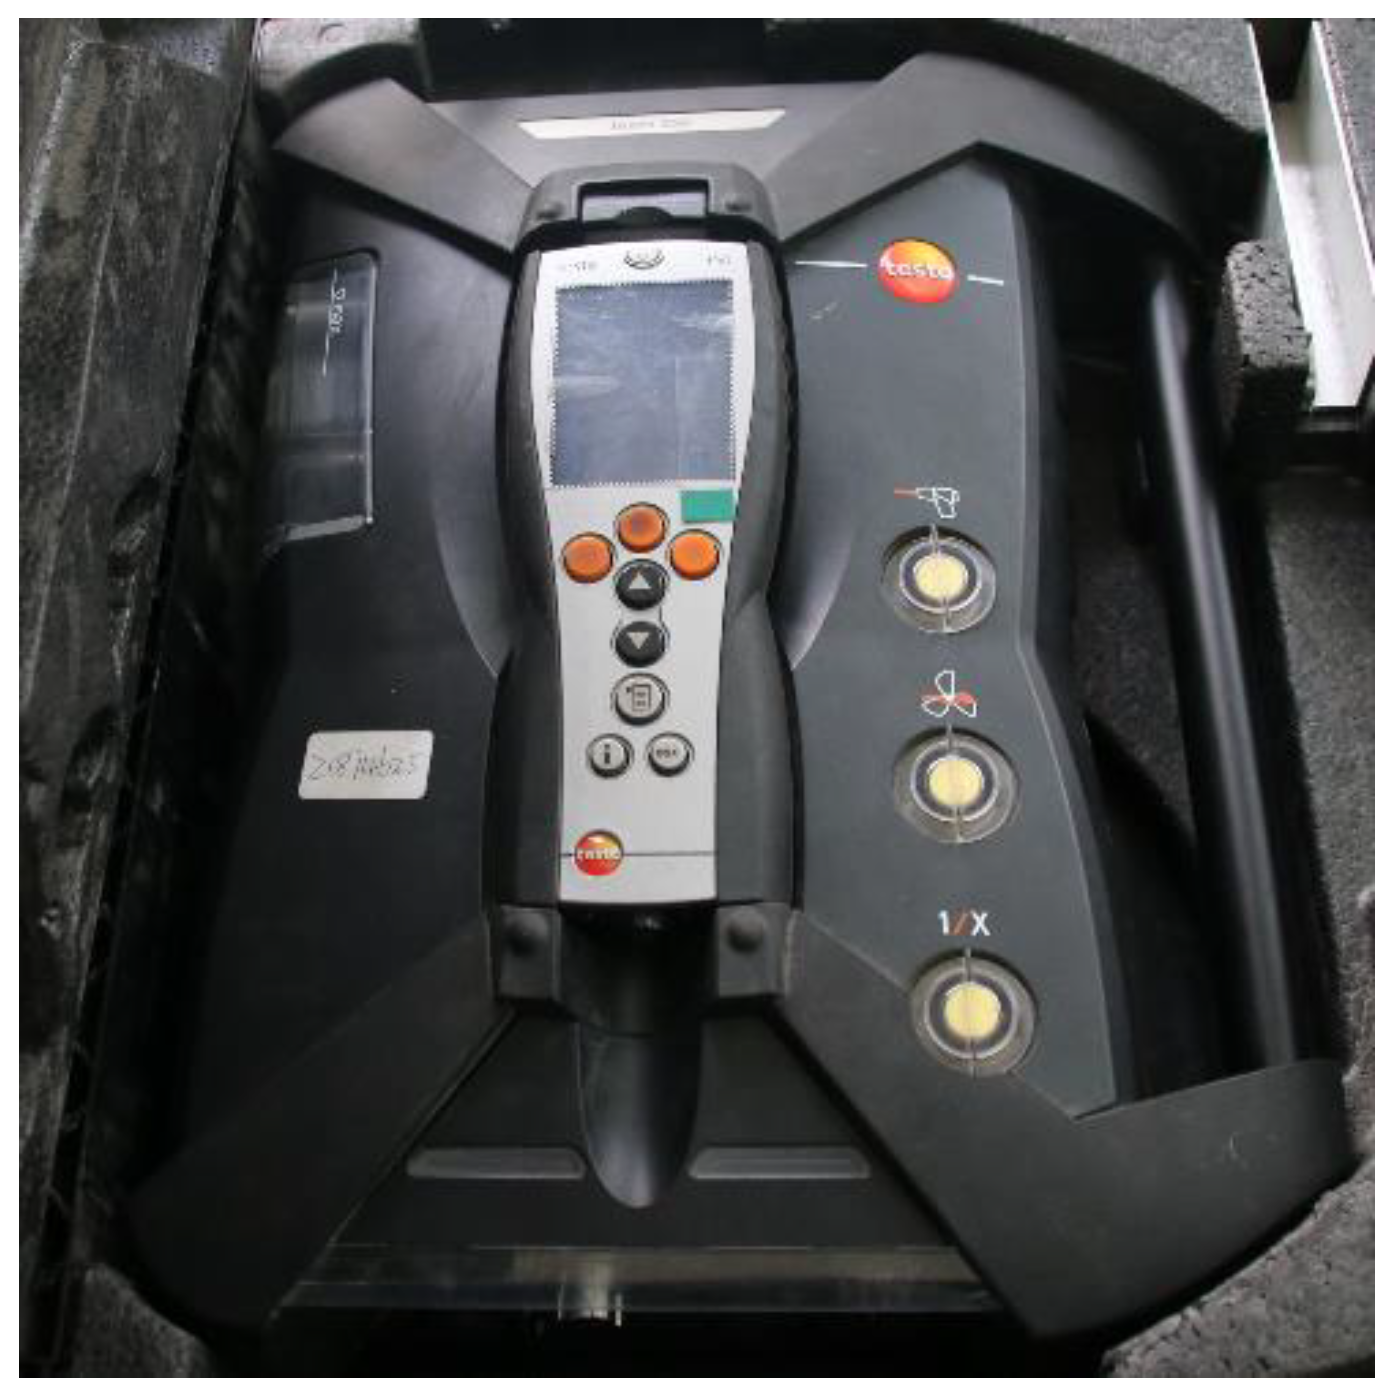
2.2. Measurement Methods
2.3. Experimental Conditions
3. Results and Discussion
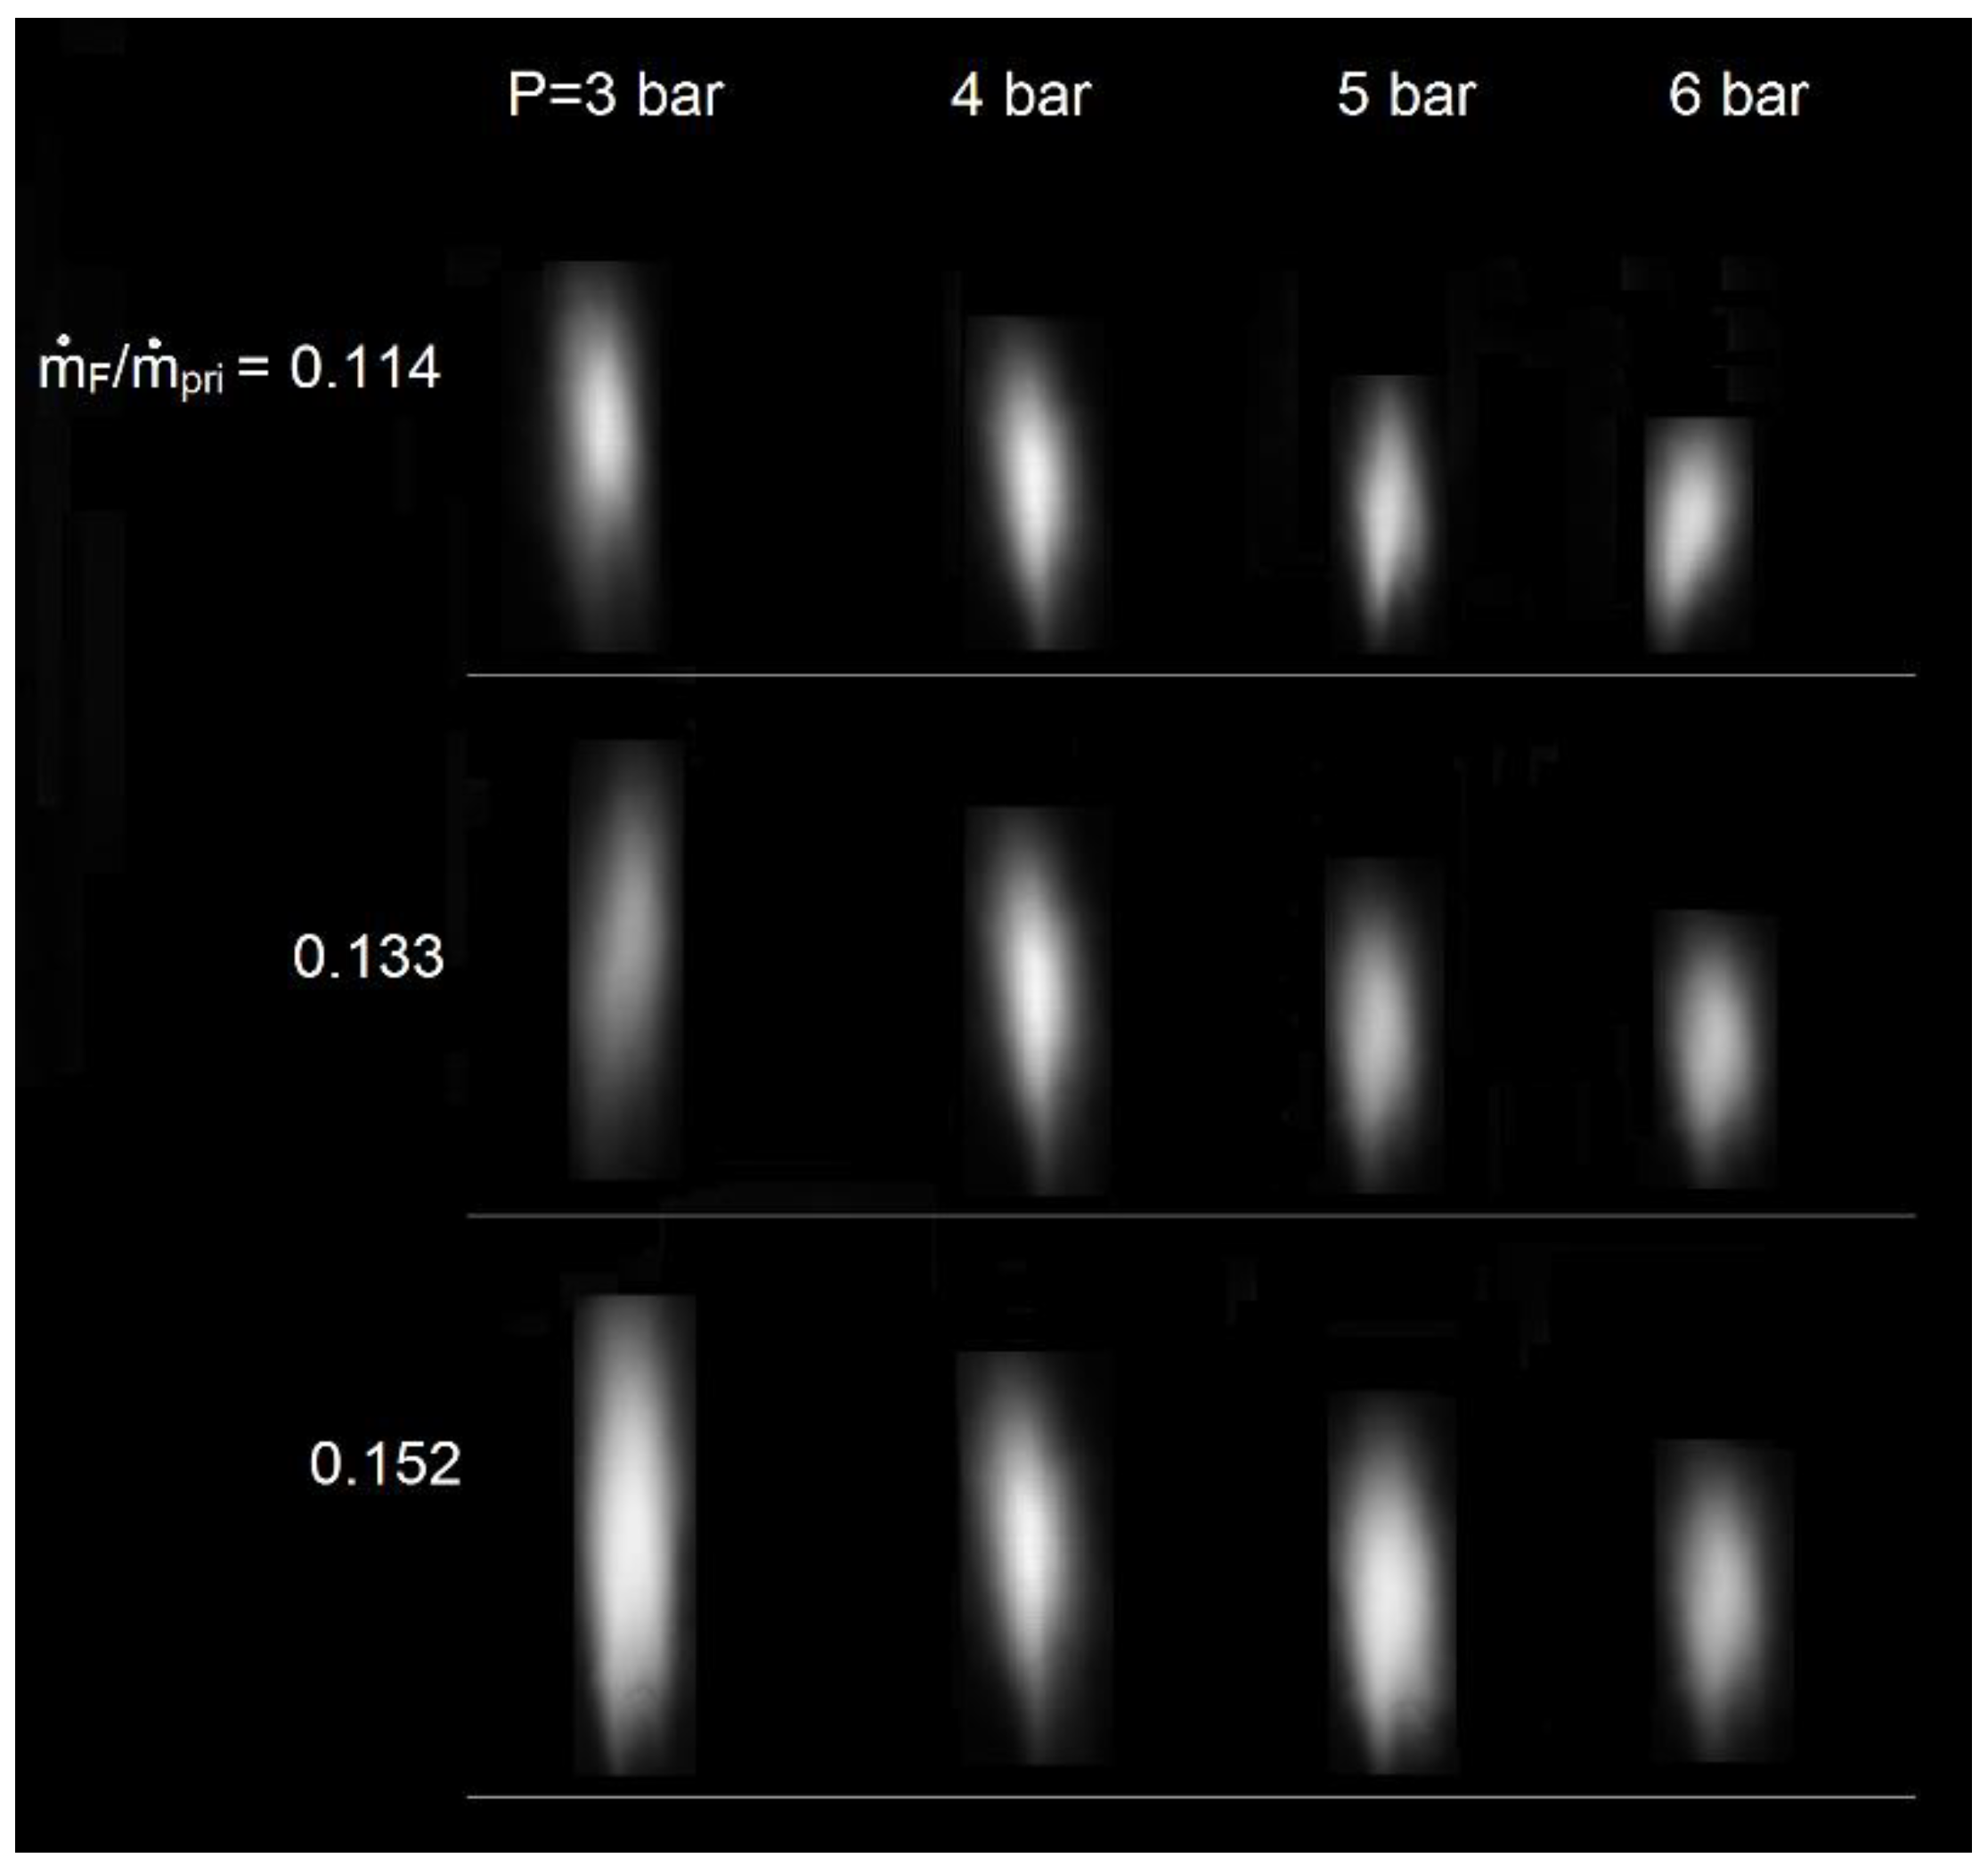
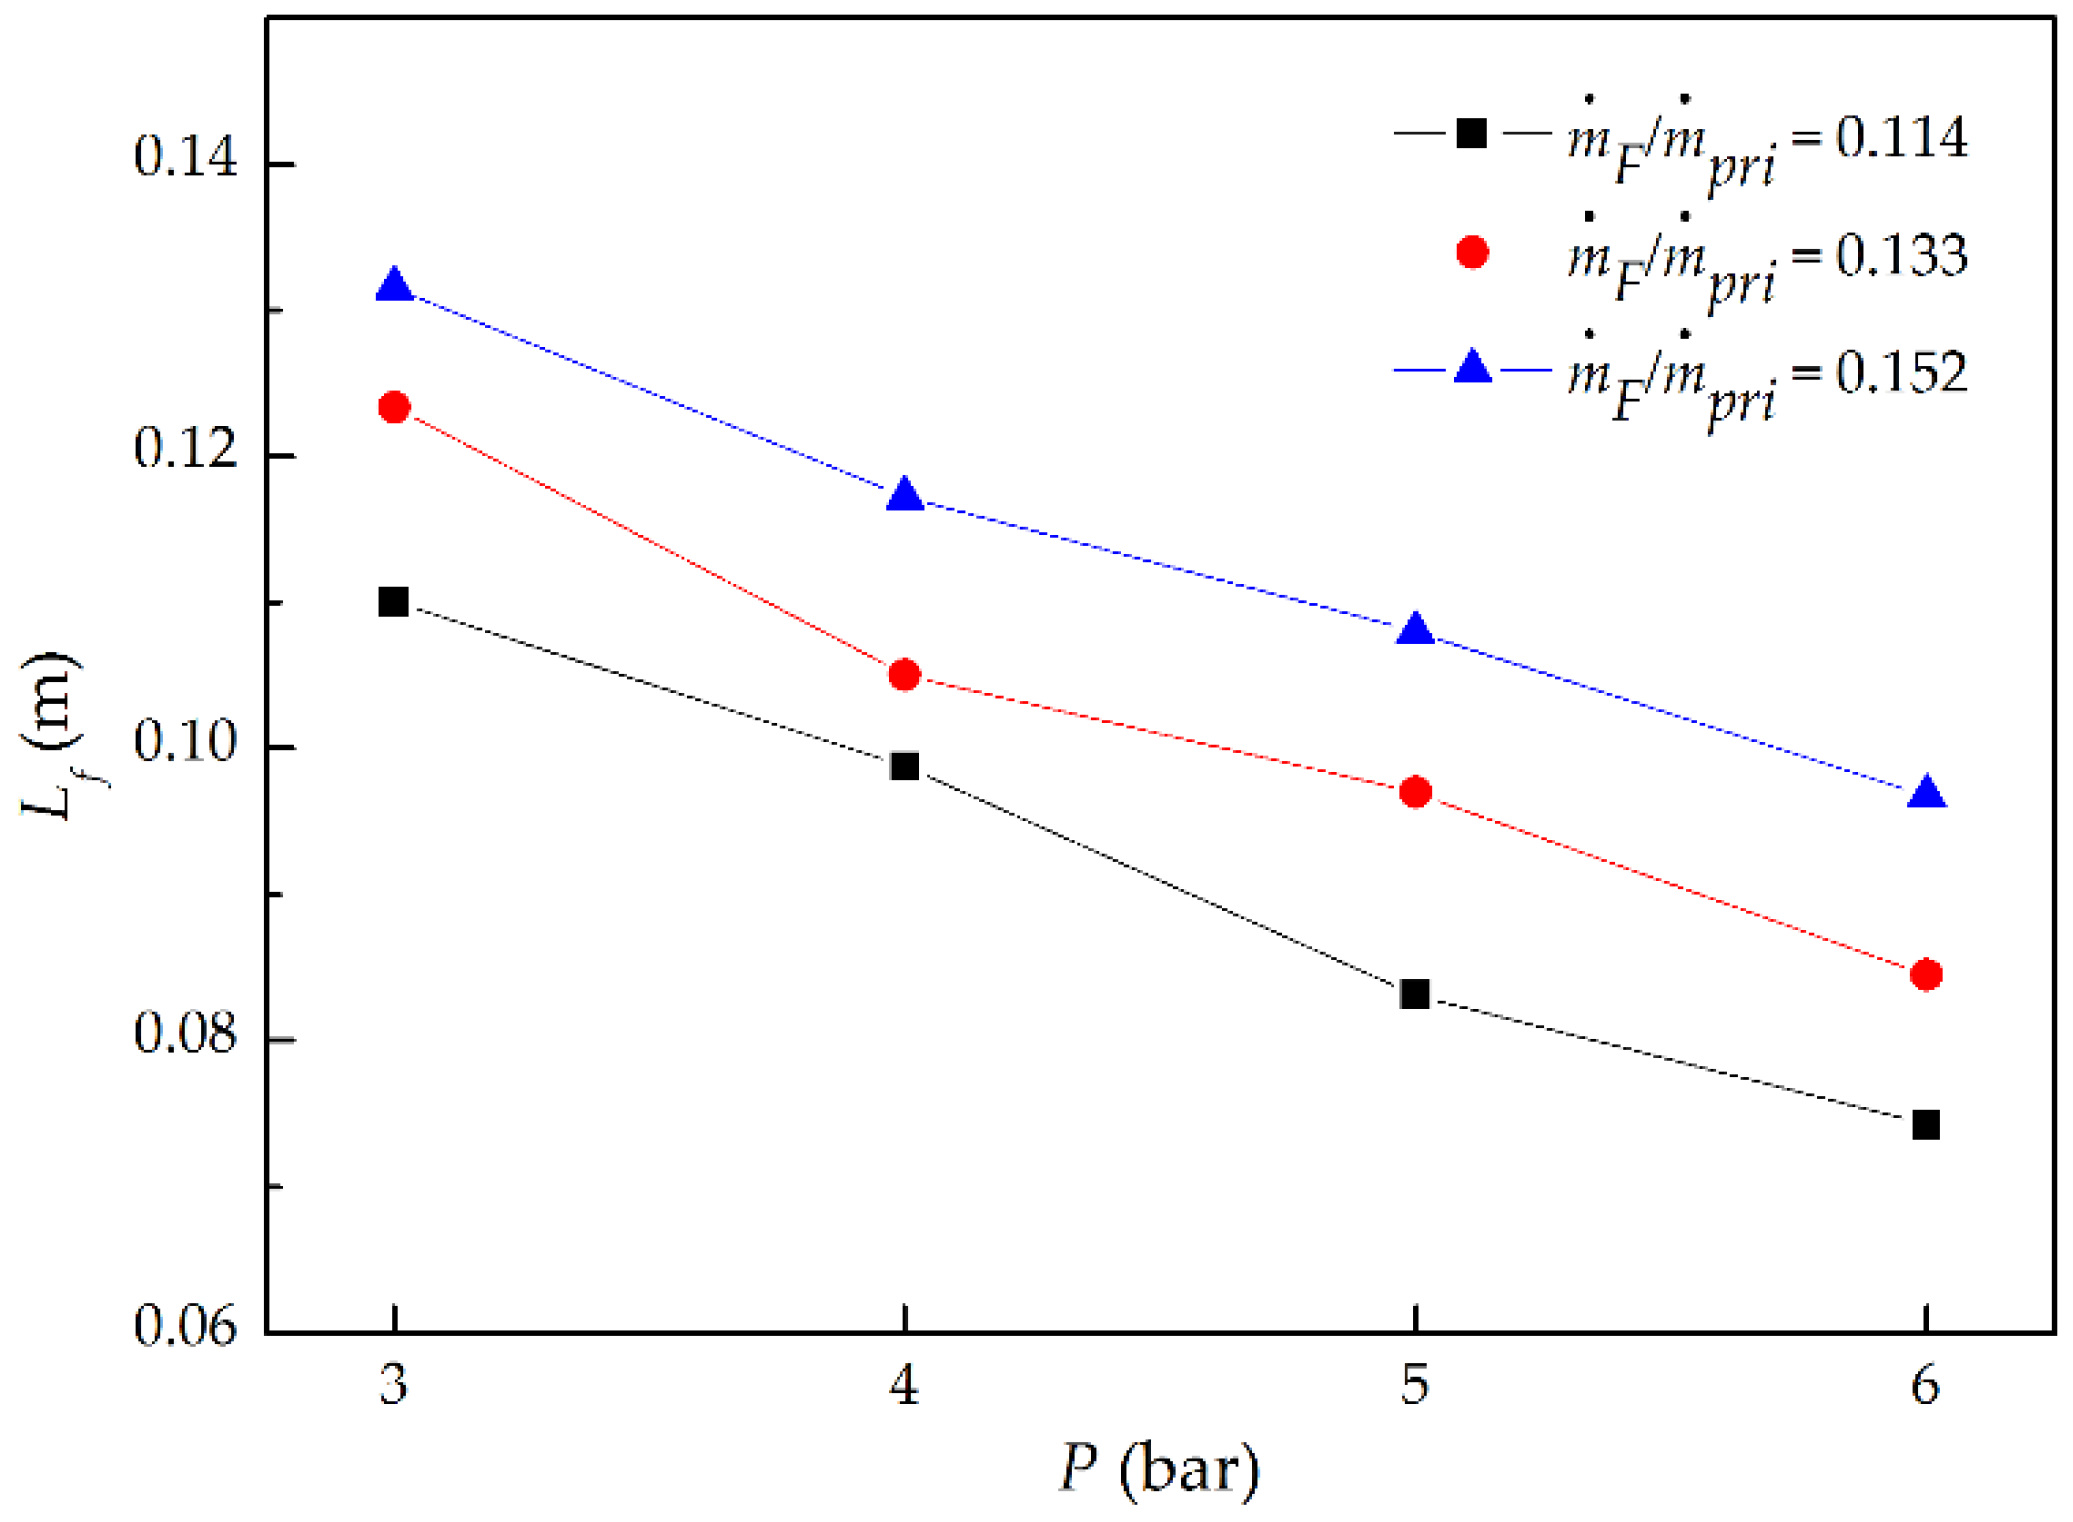
3.1. Flame Shape and Length
3.2. Exit Gas Oxygen Concentration and Temperature
3.3. Global Flame Residence Time
3.4. NO Emission
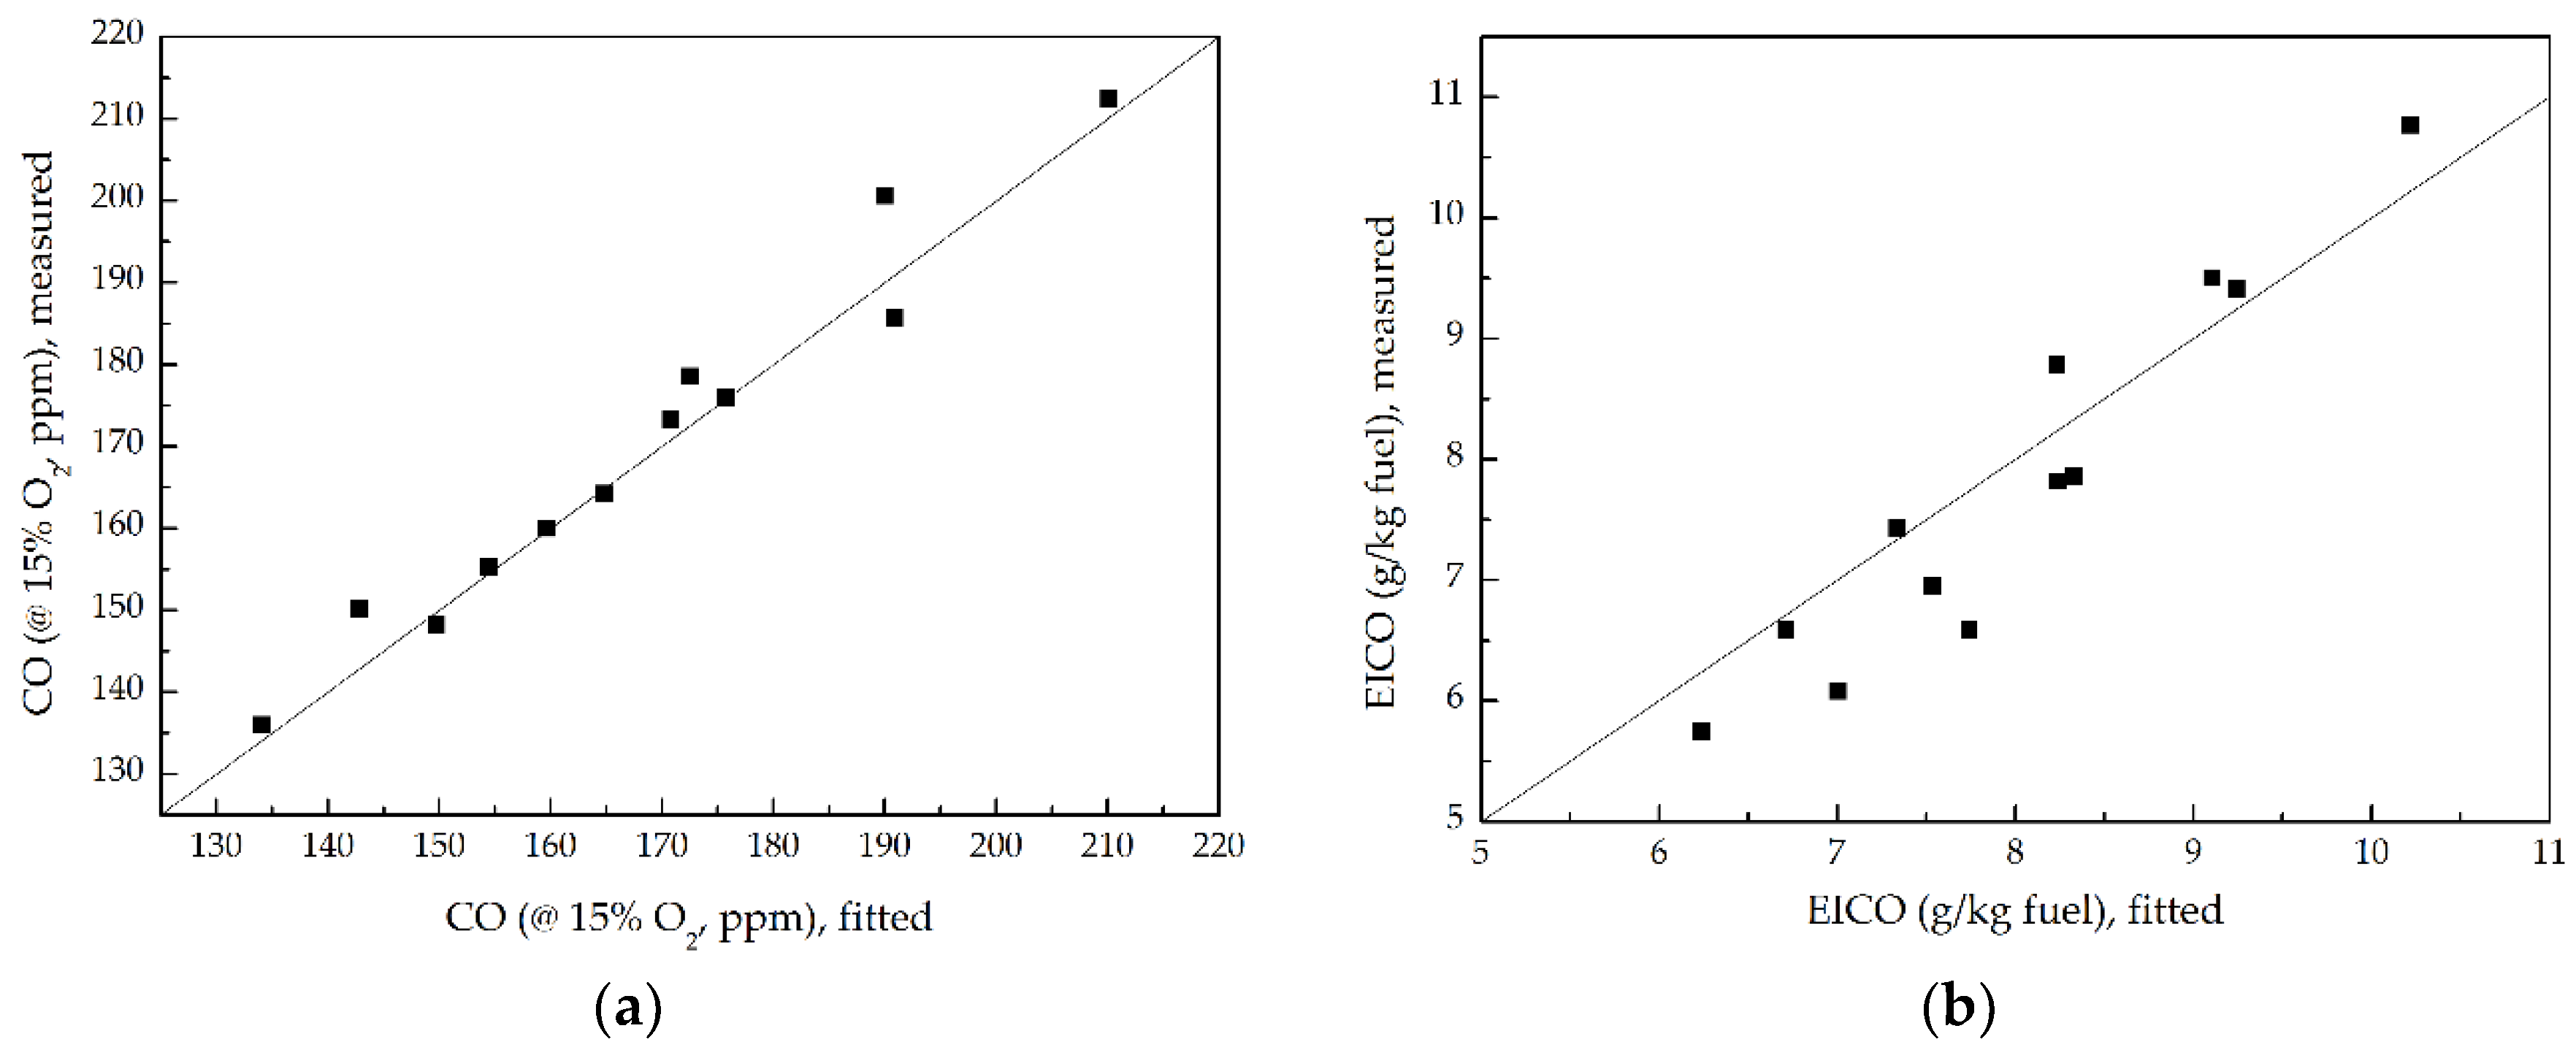
3.5. CO Emission
4. Conclusions
- (1)
- With the increment of P at a fixed ṁF/ṁpri ratio, flame volume became smaller, and flame length decreased proportionally to P−0.49; while increasing ṁF/ṁpri ratio at a given P, flame volume became larger, and flame length increased proportionally to (ṁF/ṁpri)0.73.
- (2)
- With the rise in P at a fixed ṁF/ṁpri ratio, combustor exit gas O2 volume fraction became larger, and exit temperature decreased; with the increasing of ṁF/ṁpri ratio at a given P, exit O2 volume fraction became smaller, and exit temperature increased.
- (3)
- With the increasing P at a fixed ṁF/ṁpri ratio, the global flame residence time lessened proportionally to P−0.43; with the increasing of ṁF/ṁpri ratio at a given P, the global flame residence time extended proportionally to (ṁF/ṁpri)2.07.
- (4)
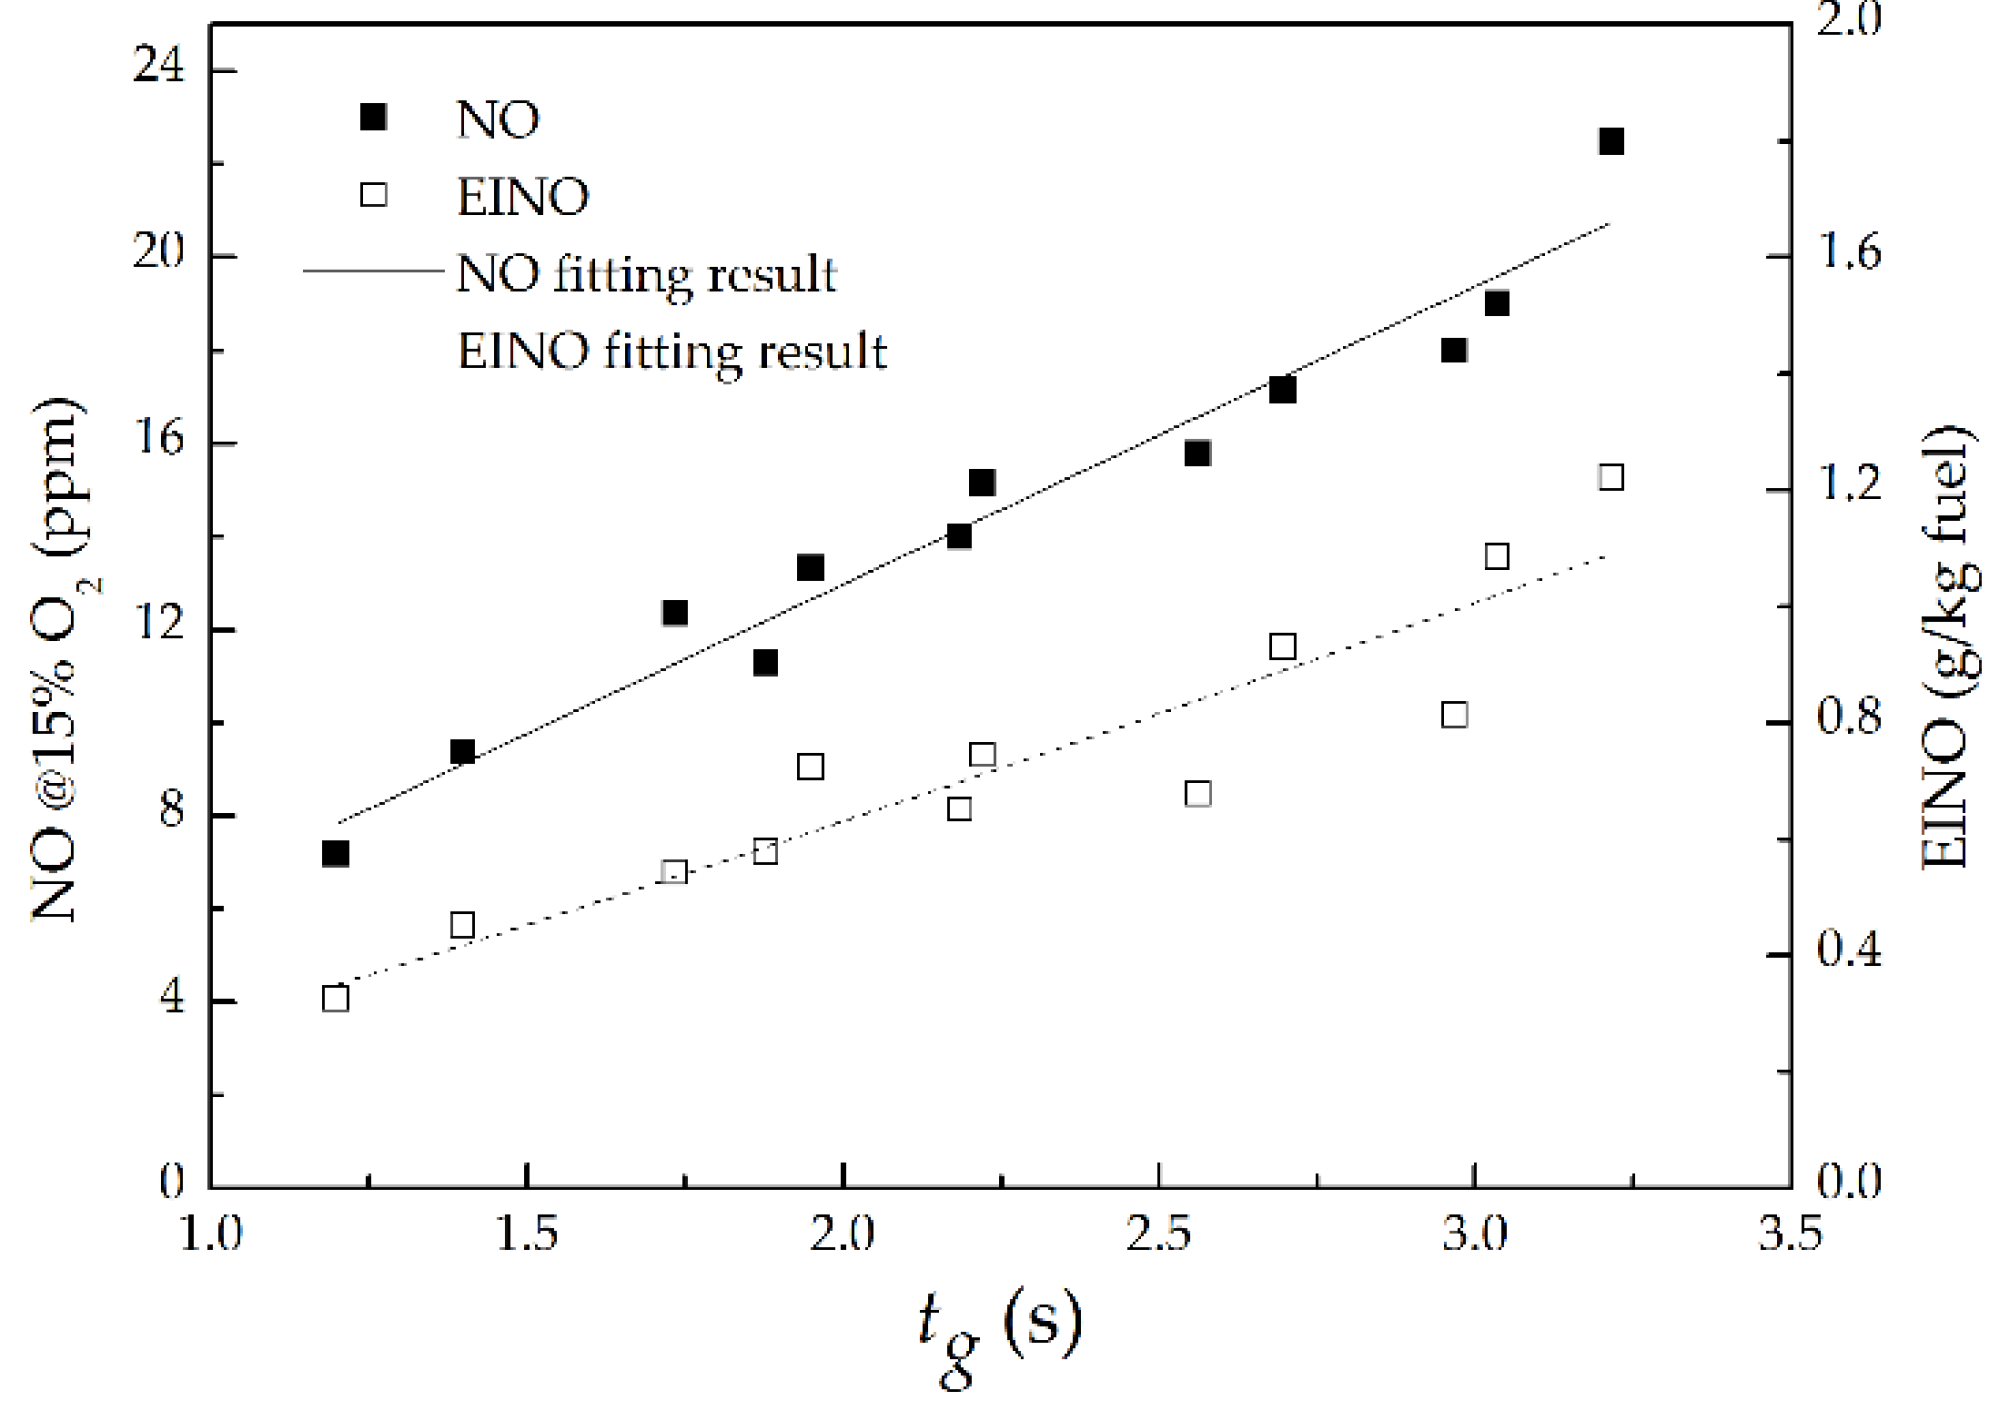
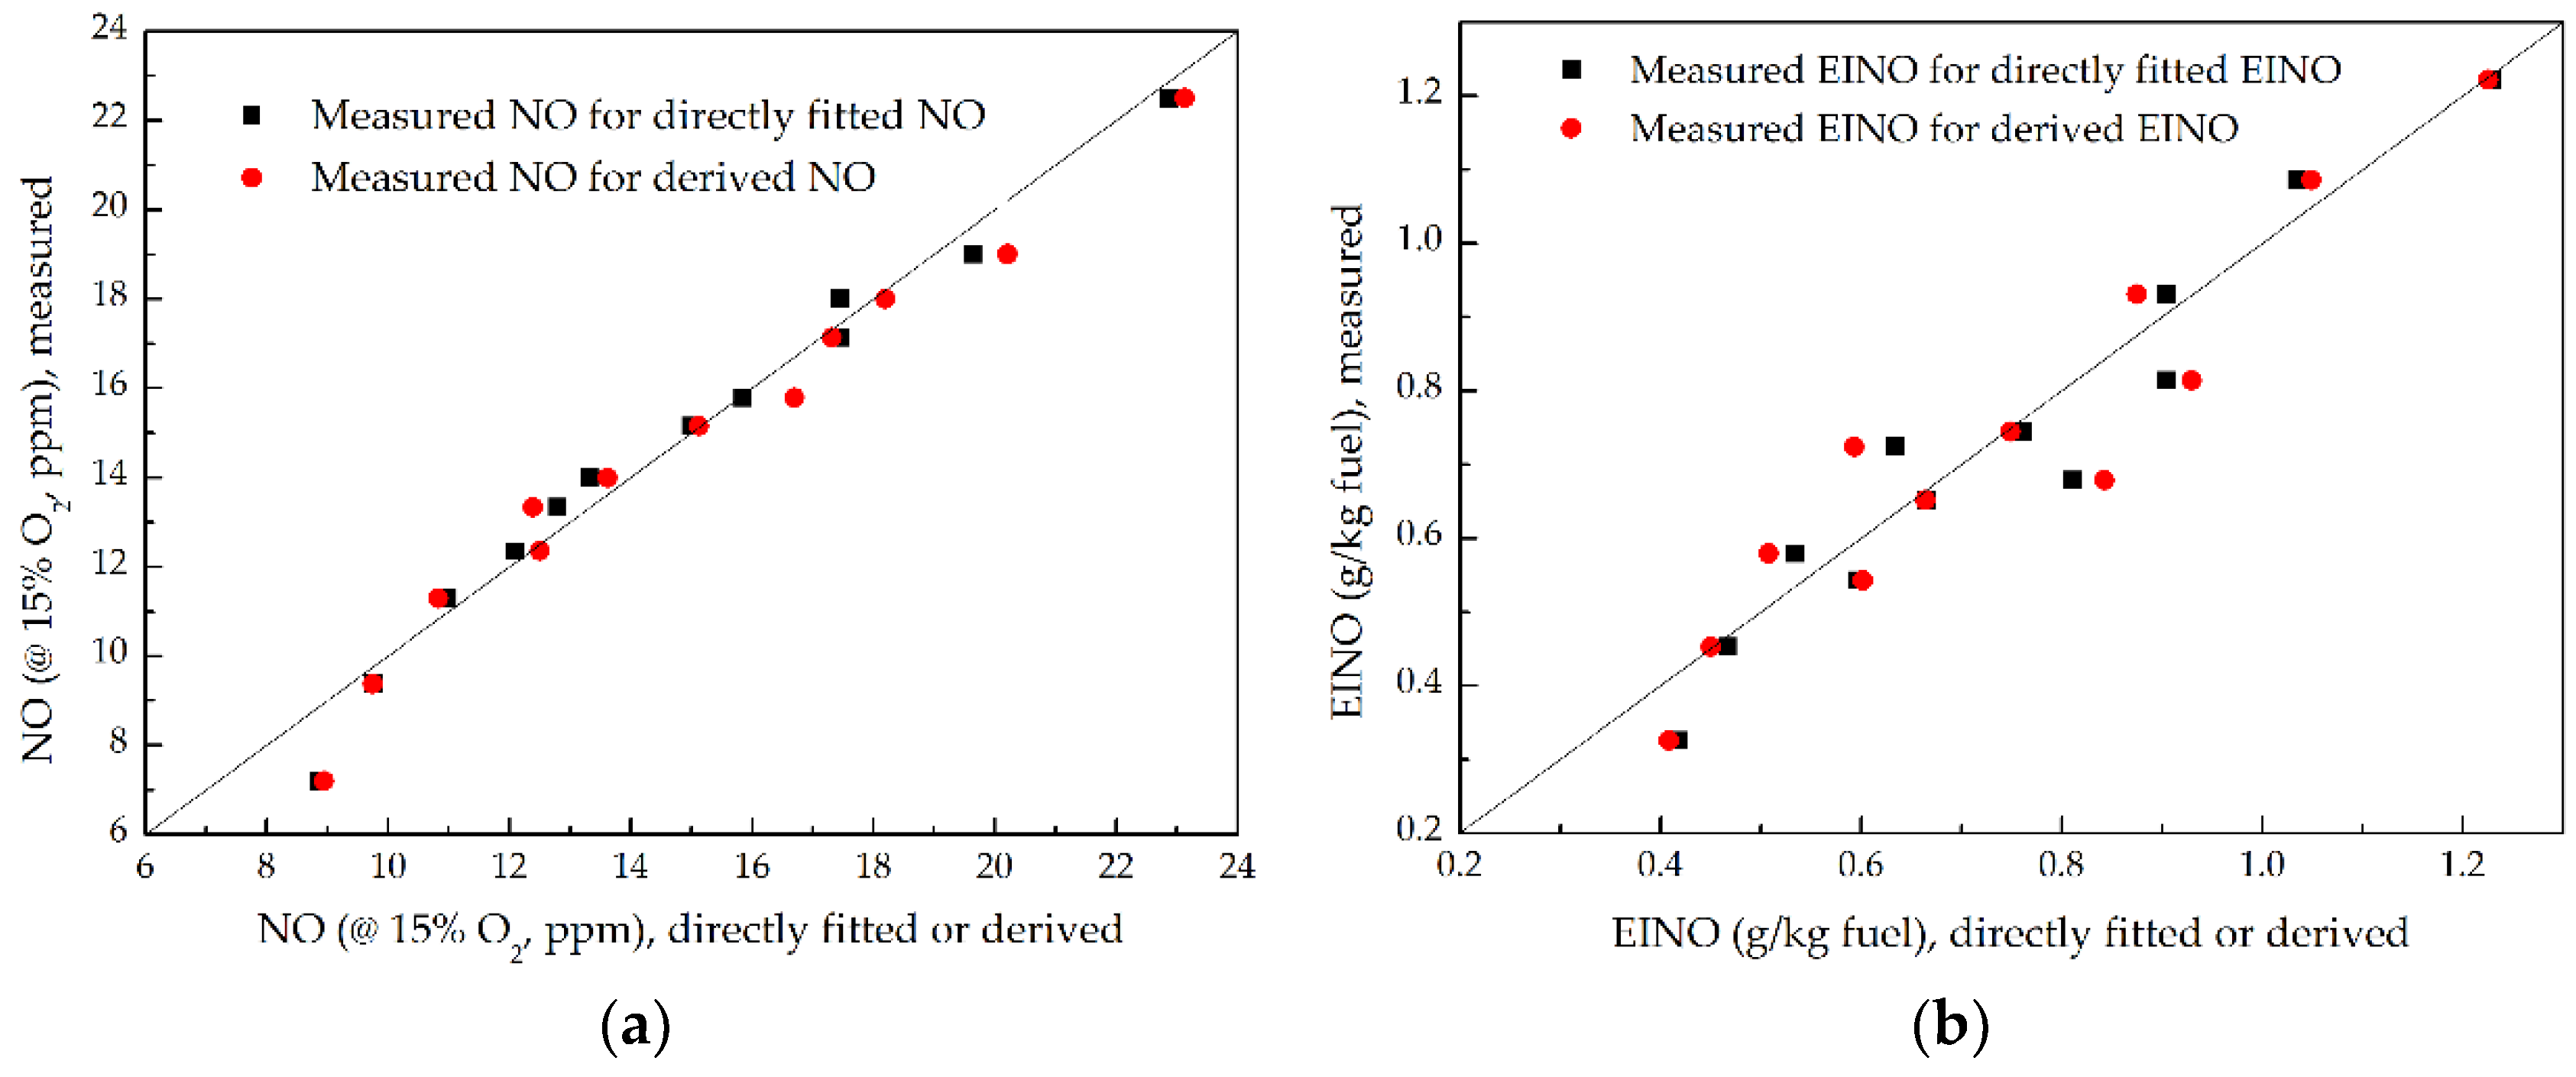
- As P increased at a fixed ṁF/ṁpri ratio, the NO and EINO decreased proportionally to P−0.53 and P−0.6, respectively, but increased proportionally to (ṁF/ṁpri)2.02 and (ṁF/ṁpri)2.3 separately as the ṁF/ṁpri ratio increased at a given P. This is mainly attributed to the influence of global flame residence time; the NO and EINO nearly increased proportionally with the increasing global flame residence time.
- (5)
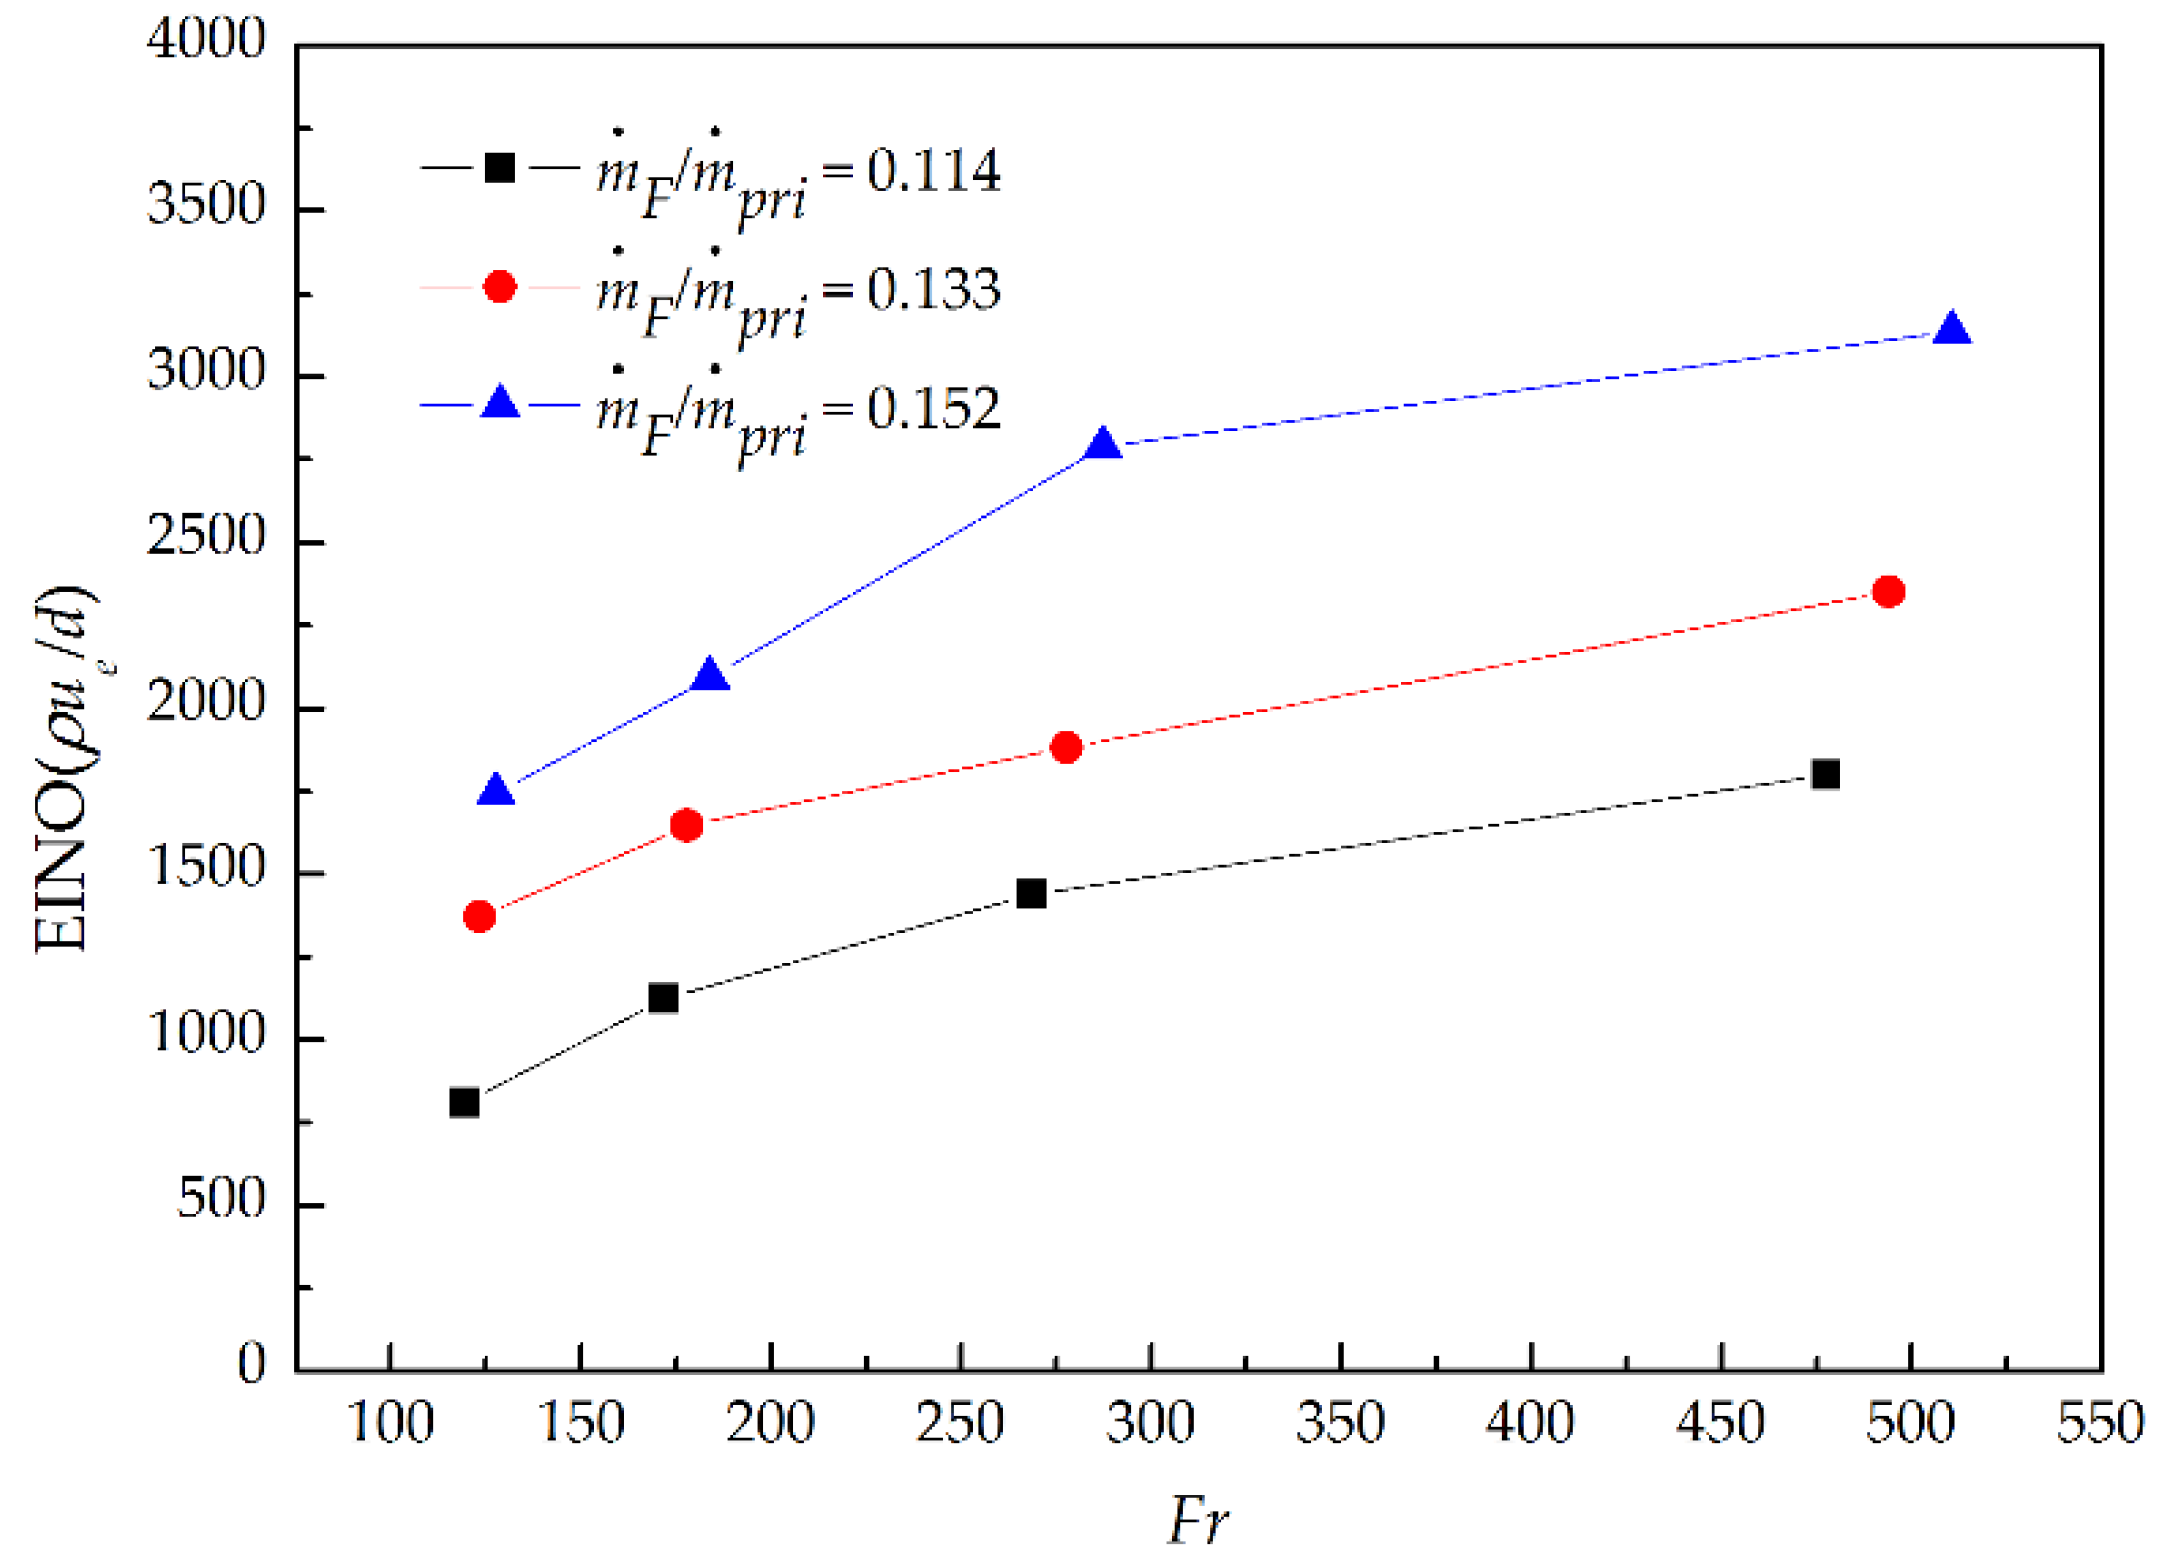
- With the addition of primary air in fuel, the EINO scaling EINO(ρue/d) was proportional to Fr0.42. Which indicated the dilution of primary air to fuel could cause a decrease in the exponent of Fr power function comparing with Fr0.6 for pure fuel.
- (6)
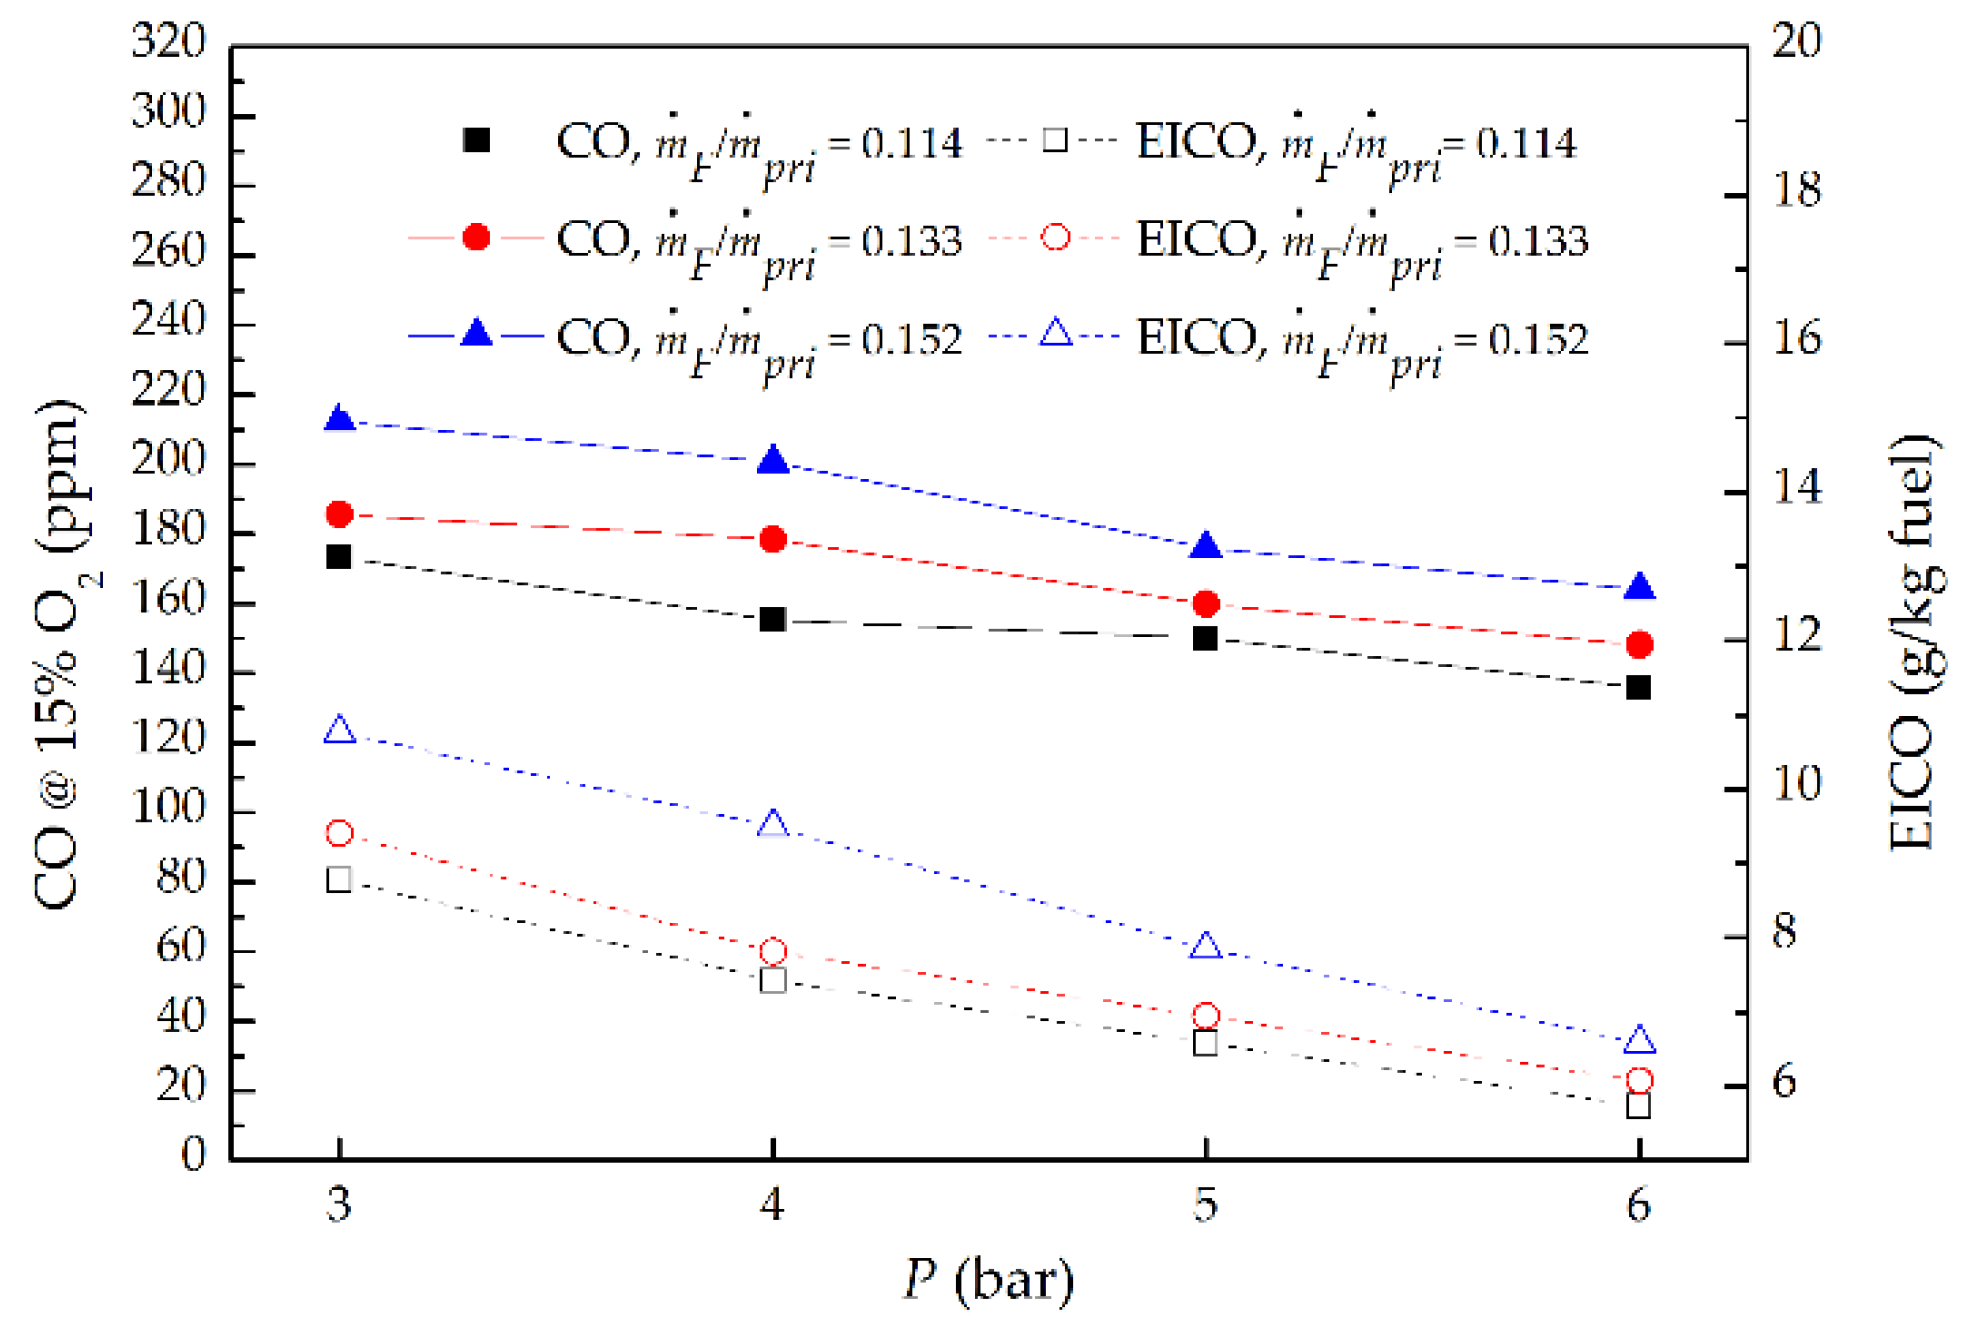
- As P increased at a fixed ṁF/ṁpri ratio, the CO and EICO decreased proportionally to P−0.35 and P−0.4 respectively, due to the increased unburned methane and high pressure which accelerated chemical reaction kinetics to promote the conversion of CO to CO2. However, the CO and EICO enlarged proportionally to (ṁF/ṁpri)0.72 and (ṁF/ṁpri)0.75 separately as ṁF/ṁpri ratio increased at a given P, due to the increased fuel participating in combustion.
Author Contributions
Acknowledgments
Conflicts of Interest
Appendix A

| Reference | Model Equation | Model Parameter |
|---|---|---|
| Rizk and Mongia [45] | Tres, Tfl, P3, ∆P3 | |
| Lipfert [46] | T3 | |
| AECMA [46] | P3, T3 | |
| Becker et al. [47] | Tfl, P3 | |
| Odgers and Kretchmer [44] | Tfl, P3, tform | |
| Lefebvre [26] | P3, F, tres, Tfl | |
| Rokke et al. [27] | mair, ffar = mfuel/mai | |
| General Electric [48] | P3,T3,hum | |
| AERONOX [48] | P3, T4, tres | |
| Levebvre [26] | Tpz, F, P3, tres, tevap, ∆P3 | |
| Rizk and Mongia [49] | TPZ, P, t, te, ∆P |
References
- Li, M.; Tong, Y.; Klingmann, J.; Thern, M. Experimental study of hydrogen addition effects on a swirl-stabilized methane-air flame. Energies 2017, 10, 1769. [Google Scholar] [CrossRef]
- Miller, J.A.; Bowman, C.T. Mechanism and modeling of nitrogen chemistry in combustion. Prog. Energy Combust. Sci. 1989, 15, 287–338. [Google Scholar] [CrossRef]
- Lefebvre, A.H.; Ballal, D.R. Emissions. In Gas Turbine Combustion: Alternative Fuels and Emissions; CRC Press: Boca Raton, FL, USA, 2010; pp. 366–382. ISBN 9781420086058. [Google Scholar]
- Boyce, M.P. Theoretical and Actual Cycle Analyses. In Gas Turbine Engineering Handbook; Elsevier Inc.: Waltham, MA, USA, 2012; p. 90. ISBN 9780123838421. [Google Scholar]
- Liakos, H.H.; Founti, M.A.; Markatos, N.C. Relative importance of combustion mechanisms in industrial premixed flames under high pressure. Appl. Therm. Eng. 2000, 20, 925–940. [Google Scholar] [CrossRef]
- Gomez-Ramirez, D.; Kedukodi, S.; Gadiraju, S.; Ekkad, S.V.; Moon, H.-K.; Kim, Y.; Srinivasan, R. Gas turbine combustor rig development and initial observations at cold and reacting flow conditions. In Proceedings of the ASME Turbo Expo 2016: Turbomachinery Technical Conference and Exposition, Seoul, Korea, 13–17 June 2016; Volume 5B. [Google Scholar]
- Han, D.S.; Kim, G.B.; Kim, H.S.; Jeon, C.H. Experimental study of NOx correlation for fuel staged combustion using lab-scale gas turbine combustor at high pressure. Exp. Therm. Fluid Sci. 2014, 58, 62–69. [Google Scholar] [CrossRef]
- Correa, S.M. A Review of NOx Formation Under Gas-Turbine Combustion Conditions. Combust. Sci. Technol. 1993, 87, 329–362. [Google Scholar] [CrossRef]
- Bhargava, A.; Kendrick, D.W.; Casleton, K.H.; Maloney, D.J.; Colket, M.B.; Sowa, W.A. Pressure effect on NOx and CO emissions in industrial gas turbines. In Proceedings of the ASME Turbo Expo 2000: Power for Land, Sea, and Air, Munich, Germany, 8–11 May 2000; Volume 2. [Google Scholar]
- Göke, S.; Schimek, S.; Terhaar, S.; Reichel, T.; Göckeler, K.; Krüger, O.; Fleck, J.; Griebel, P.; Paschereit, C.O. Influence of Pressure and Steam Dilution on NOx and CO Emissions in a Premixed Natural Gas Flame. J. Eng. Gas Turbines Power 2014, 136, 091508. [Google Scholar] [CrossRef]
- Wang, H.; Lei, F.; Shao, W.; Zhang, Z.; Liu, Y.; Xiao, Y. Experimental and numerical studies of pressure effects on syngas combustor emissions. Appl. Therm. Eng. 2016, 102, 318–328. [Google Scholar] [CrossRef]
- Pillier, L.; Idir, M.; Molet, J.; Matynia, A.; Persis, S. De Experimental study and modelling of NOx formation in high pressure counter-flow premixed CH4/air flames. Fuel 2015, 150, 394–407. [Google Scholar] [CrossRef]
- Shuman, T. NOx and CO Formation for Lean-Premixed Methane-Air Combustion in a Jet-Stirred Reactor Operated at Elevated Pressure. Ph.D. Thesis, University of Washington, Seattle, WA, USA, 2000. [Google Scholar]
- Steel, R.C.; Jarrett, A.C.; Malte, P.C.; Tonouchi, J.H.; Nicol, D.G. Variables Affecting NOx Formation in Lean-Premixed Combustion. J. Eng. Gas Turbines Power 1997, 119, 102–107. [Google Scholar] [CrossRef]
- Biagioli, F.; Güthe, F. Effect of pressure and fuel-air unmixedness on NOx emissions from industrial gas turbine burners. Combust. Flame 2007, 151, 274–288. [Google Scholar] [CrossRef]
- Leonard, G.; Stegmaier, J. Development of an Aeroderivative Gas Turbine Dry Low Emissions Combustion System. J. Eng. Gas Turbines Power 1994, 116, 542. [Google Scholar] [CrossRef]
- Røkke, N.A.; Hustad, J.E.; Sønju, O.K.; Williams, F.A. Scaling of nitric oxide emissions from buoyancy-dominated hydrocarbon turbulent-jet diffusion flames. Symp. Combust. 1992, 24, 385–393. [Google Scholar] [CrossRef]
- Turns, S.R. Understanding NOx formation in nonpremixed flames: Experiments and modeling. Prog. Energy Combust. Sci. 1995, 21, 361–385. [Google Scholar] [CrossRef]
- Newbold, G.J.R.; Nathan, G.J.; Nobes, D.S.; Turns, S.R. Measurement and prediction of NOxemissions from unconfined propane flames from turbulent-jet, bluff-body, swirl, and precessing jet burners. Proc. Combust. Inst. 2000, 28, 481–487. [Google Scholar] [CrossRef]
- Kiran, D.Y.; Mishra, D.P. Experimental studies of flame stability and emission characteristics of simple LPG jet diffusion flame. Fuel 2007, 86, 1545–1551. [Google Scholar] [CrossRef]
- Santos, A.; Costa, M. Reexamination of the scaling laws for NOx emissions from hydrocarbon turbulent jet diffusion flames. Combust. Flame 2005, 142, 160–169. [Google Scholar] [CrossRef]
- Costa, M.; Parente, C.; Santos, A. Nitrogen oxides emissions from buoyancy and momentum controlled turbulent methane jet diffusion flames. Exp. Therm. Fluid Sci. 2004, 28, 729–734. [Google Scholar] [CrossRef]
- Szegö, G.G.; Dally, B.B.; Nathan, G.J. Scaling of NOx emissions from a laboratory-scale mild combustion furnace. Combust. Flame 2008, 154, 281–295. [Google Scholar] [CrossRef]
- Tsalavoutas, A.; Kelaidis, M.; Thoma, N. Correlations adaptation for optimal emissions prediction. In Proceedings of the ASME Turbo Expo 2007: Power for Land, Sea, and Air, Montreal, QC, Canada, 14–17 May 2007; pp. 545–555. [Google Scholar]
- Chandrasekaran, N.; Guha, A. Study of Prediction Methods for NOx Emission from Turbofan Engines. J. Propuls. Power 2012, 28, 170–180. [Google Scholar] [CrossRef]
- Rizk, N.K.; Mongia, H.C. Semianalytical Correlations for NOx, CO, and UHC Emissions. J. Eng. Gas Turbines Power 1993, 115, 612. [Google Scholar] [CrossRef]
- Røkke, N.A.; Hustad, J.E.; Bergs, B. Pollutant Emissions From Gas Fired Turbine Engines in Offshore Practice: Measurements and Scaling. In Proceedings of the ASME 1993 International Gas Turbine and Aeroengine Congress and Exposition, Cincinnati, OH, USA, 24–27 May 1993; p. V03AT15A021. [Google Scholar]
- Li, L.; Lin, Y.; Fu, Z.; Zhang, C. Emission characteristics of a model combustor for aero gas turbine application. Exp. Therm. Fluid Sci. 2016, 72, 235–248. [Google Scholar] [CrossRef]
- Kroniger, D.; Wirsum, M.; Horikawa, A.; Okada, K.; Kazari, M. NOx Correlation for an Industrial 10 MW Non-Premixed Gas Turbine Combustor for High Hydrogen Fuels. In Proceedings of the ASME Turbo Expo 2016: Turbomachinery Technical Conference and Exposition, Seoul, Korea, 13–17 June 2016; Volume 4A, p. V04AT04A012. [Google Scholar]
- Domkundwar, V.M.; Sriramulu, V.; Gupta, M.C. Analysis of swirling recirculating reacting turbulent jets passing through diffusers. Combust. Flame 1978, 33, 241–249. [Google Scholar] [CrossRef]
- Cheng, T.S.; Chao, Y.C.; Wu, D.C.; Yuan, T.; Lu, C.C.; Cheng, C.K.; Chang, J.M. Effects of fuel-air mixing on flame structures and NOxemissions in swirling methane jet flames. Symp. (Int.) Combust. 1998, 27, 1229–1237. [Google Scholar] [CrossRef]
- Terasaki, T.; Hayashi, S. The effects of fuel-air mixing on NOxformation in non-premixed swirl burners. Symp. Combust. 1996, 26, 2733–2739. [Google Scholar] [CrossRef]
- Mansour, M.S. A Concentric Flow Conical Nozzle Burner for Highly Stabilized Partially Premixed Flames. Combust. Sci. Technol. 2000, 152, 115–145. [Google Scholar] [CrossRef]
- El-Mahallawy, F.; Abdelhafez, A.; Mansour, M.S. Mixing and nozzle geometry effects on flame structure and stability. Combust. Sci. Technol. 2007, 179, 249–263. [Google Scholar] [CrossRef]
- Mansour, M.S.; Elbaz, A.M.; Samy, M. The stabilization mechanism of highly stabilized partially premixed flames in a concentric flow conical nozzle burner. Exp. Therm. Fluid Sci. 2012, 43, 55–62. [Google Scholar] [CrossRef]
- Liu, X.; Elbaz, A.M.; Gong, C.; Bai, X.S.; Zheng, H.T.; Roberts, W.L. Effect of burner geometry on swirl stabilized methane/air flames: A joint LES/OH-PLIF/PIV study. Fuel 2017, 207, 533–546. [Google Scholar] [CrossRef]
- Samaniego, J.-M.; Egolfopoulos, F.N.; Bowman, C.T. CO2* Chemiluminescence in Premixed Flames. Combust. Sci. Technol. 1995, 109, 183–203. [Google Scholar] [CrossRef]
- Hu, L.; Wang, Q.; Delichatsios, M.; Tang, F.; Zhang, X.; Lu, S. Flame height and lift-off of turbulent buoyant jet diffusion flames in a reduced pressure atmosphere. Fuel 2013, 109, 234–240. [Google Scholar] [CrossRef]
- Most, J.M.; Mandin, P.; Chen, J.; Joulain, P.; Durox, D.; Fernande-Pello, A.C. Influence of gravity and pressure on pool fire-type diffusion flames. Symp. Combust. 1996, 26, 1311–1317. [Google Scholar] [CrossRef]
- Kim, S.-H.; Yoon, Y.; Jeung, I.-S. Nitrogen oxides emissions in turbulent hydrogen jet non-premixed flames: Effects of coaxial air and flame radiation. Proc. Combust. Inst. 2000, 28, 463–471. [Google Scholar] [CrossRef]
- Driscoll, J.F.; Chen, R.-H.; Yoon, Y. Nitric oxide levels of turbulent jet diffusion flames: Effects of residence time and damkohler number. Combust. Flame 1992, 88, 37–49. [Google Scholar] [CrossRef]
- Zeldovitch, J. The oxidation of nitrogen in combustion and explosions. Eur. Phys. J. A Hadrons Nucl. 1946, 21, 577–628. [Google Scholar]
- Turns, S.R.; Myhr, F.H.; Bandaru, R.V.; Maund, E.R. Oxides of nitrogen emissions from turbulent jet flames: Part II-Fuel dilution and partial premixing effects. Combust. Flame 1993, 93, 255–269. [Google Scholar] [CrossRef]
- Lefebvre, A.H. The Role of Fuel Preparation in Low-Emission Combustion. J. Eng. Gas Turbines Power 1995, 117, 617–654. [Google Scholar] [CrossRef]
- Mongia, H.C.; Dodds, W. Low emissions propulsion engine combustor technology evolution past, present and future. In Proceedings of the 24th Congress of International Council of the Aeronautical Sciences, Yokohama, Japan, 29 August–3 September 2004; pp. 2004–2609. [Google Scholar]
- Green, J.E. Greener by design—The technology challenge. Aeronaut. J. 2002, 106. [Google Scholar] [CrossRef]
- Becker, T.; Perkavec, M.A. The Capability of Different Semianalytical Equations for Estimation of NOx Emissions of Gas Turbines. In Proceedings of the ASME 1994 International Gas Turbine and Aeroengine Congress and Exposition, The Hague, The Netherlands, 13–16 June 1994; p. V003T06A020. [Google Scholar]
- Tilston, J.; Larkman, J.; Plohr, M.; Doepelheuer, A.; Lischer, T.; Zarzalis, N. Future Engine Cycle Prediction and Emissions Study; EU FP5 CYPRESS, Final Publishable Report, Contract; European Commission: Brussels, Belgium, 2003; G4RD-CT: 2000-00383. [Google Scholar]
- Rizk, N.; Mongia, H. Emissions predictions of different gas turbine combustors. In Proceedings of the 32nd Aerospace Sciences Meeting and Exhibit, Reno, NV, USA, 10–13 January 1994; p. 118. [Google Scholar]


| Measurement | Instrument | Range | Accuracy | Uncertainty |
|---|---|---|---|---|
| Temperature | K-type thermocouple | 273–1273 K | ±1 K | ± 1 K |
| O2 | Testo 350 gas analyzer | 0–25 vol % | ±0.8% FSR | 0.01 vol % |
| CO | Testo 350 gas analyzer | 0–500 ppm | ±2 ppm (0–39.9 ppm) ±5% (40–500 ppm) | 0.1 ppm |
| NO | Testo 350 gas analyzer | 0–300 ppm | ±2 ppm (0–39.9 ppm), ±5% (40–300 ppm) | ± 0.1 ppm |
| Case | Combustor Pressure, P (bar) | Methane Mass Flow Rate, ṁF (g/min) | Air Mass Flow Rate, ṁA (kg/min) | Primary Air, ṁpri (g/min) | ṁF/ṁpri |
|---|---|---|---|---|---|
| 1 | 3 | 12 | 2.1 | 105 | 0.114 |
| 2 | 3 | 14 | 2.1 | 105 | 0.133 |
| 3 | 3 | 16 | 2.1 | 105 | 0.152 |
| 4 | 4 | 12 | 2.1 | 105 | 0.114 |
| 5 | 4 | 14 | 2.1 | 105 | 0.133 |
| 6 | 4 | 16 | 2.1 | 105 | 0.152 |
| 7 | 5 | 12 | 2.1 | 105 | 0.114 |
| 8 | 5 | 14 | 2.1 | 105 | 0.133 |
| 9 | 5 | 16 | 2.1 | 105 | 0.152 |
| 10 | 6 | 12 | 2.1 | 105 | 0.114 |
| 11 | 6 | 14 | 2.1 | 105 | 0.133 |
| 12 | 6 | 16 | 2.1 | 105 | 0.152 |
© 2018 by the authors. Licensee MDPI, Basel, Switzerland. This article is an open access article distributed under the terms and conditions of the Creative Commons Attribution (CC BY) license (http://creativecommons.org/licenses/by/4.0/).
Share and Cite
Xi, Z.; Fu, Z.; Hu, X.; Sabir, S.W.; Jiang, Y. An Experimental Investigation on the NO and CO Emission Characteristics of a Swirl Convergent-Divergent Nozzle at Elevated Pressure. Energies 2018, 11, 1410. https://doi.org/10.3390/en11061410
Xi Z, Fu Z, Hu X, Sabir SW, Jiang Y. An Experimental Investigation on the NO and CO Emission Characteristics of a Swirl Convergent-Divergent Nozzle at Elevated Pressure. Energies. 2018; 11(6):1410. https://doi.org/10.3390/en11061410
Chicago/Turabian StyleXi, Zhongya, Zhongguang Fu, Xiaotian Hu, Syed Waqas Sabir, and Yibo Jiang. 2018. "An Experimental Investigation on the NO and CO Emission Characteristics of a Swirl Convergent-Divergent Nozzle at Elevated Pressure" Energies 11, no. 6: 1410. https://doi.org/10.3390/en11061410
APA StyleXi, Z., Fu, Z., Hu, X., Sabir, S. W., & Jiang, Y. (2018). An Experimental Investigation on the NO and CO Emission Characteristics of a Swirl Convergent-Divergent Nozzle at Elevated Pressure. Energies, 11(6), 1410. https://doi.org/10.3390/en11061410