Article

Evaluating Molecular Evolution of Kerogen by Raman Spectroscopy: Correlation with Optical Microscopy and Rock-Eval Pyrolysis

by
Seyedalireza Khatibi
1,*,
Mehdi Ostadhassan
1,
David Tuschel
2,
Thomas Gentzis
3 and
Humberto Carvajal-Ortiz
3
1
Department of Petroleum Engineering, University of North Dakota, Grand Forks, ND 58203, USA
2
Raman Application Department, HORIBA Scientific, Edison, NJ 08820, USA
3
Geology and Petrology department, Core Laboratories, Houston, TX 77040, USA
*
Author to whom correspondence should be addressed.
Energies 2018, 11(6), 1406; https://doi.org/10.3390/en11061406
Submission received: 5 May 2018 / Revised: 28 May 2018 / Accepted: 28 May 2018 / Published: 31 May 2018
(This article belongs to the Section L: Energy Sources)

Abstract

:
Vitrinite maturity and programmed pyrolysis are conventional methods to evaluate organic matter (OM) regarding its thermal maturity. Moreover, vitrinite reflectance analysis can be difficult if prepared samples have no primary vitrinite or dispersed widely. Raman spectroscopy is a nondestructive method that has been used in the last decade for maturity evaluation of organic matter by detecting structural transformations, however, it might suffer from fluorescence background in low mature samples. In this study, four samples of different maturities from both shale formations of Bakken (the upper and lower members) Formation were collected and analyzed with Rock-Eval (RE) and Raman spectroscopy. In the next step, portions of the same samples were then used for the isolation of kerogen and analyzed by Raman spectroscopy. Results showed that Raman spectroscopy, by detecting structural information of OM, could reflect thermal maturity parameters that were derived from programmed pyrolysis. Moreover, isolating kerogen will reduce the background noise (fluorescence) in the samples dramatically and yield a better spectrum. The study showed that thermal properties of OM could be precisely reflected in Raman signals.

1. Introduction

Organic matter (OM), usually known as kerogen, is derived from the animals, plants, and micro-organisms burial and preservation within the rock matrix [1]. Organic-rich intervals are usually found in shale reservoirs, including solid bitumen, kerogen, and moveable hydrocarbons. Understanding kerogen properties regarding maturity has a key role in the development of unconventional resources. It is well understood that the quantities of hydrocarbon generation are a function of kerogen content and type in the formation, its maturity [2], and the diffusion and permeability of the hydrocarbons [3]. Thermal maturity of kerogen is usually understood by the reflectance measurement of vitrinite. This method can be difficult if the samples have no primary vitrinite or it is dispersed widely in the sample [4,5]. The second method to evaluate the maturity of organic matter is programmed pyrolysis [6,7]. The most widely used pyrolysis technique is Rock-Eval, in which a sample is subjected to a programmed heating from 300 °C to 650 °C in an inert gas atmosphere [8,9,10,11]. The results are reported in various parameters characterizing the kerogen type, quality, and its potential to produce hydrocarbons. All of these properties reflect the molecular structure of kerogen and the chemical compounds that exist in the organic matter.
Raman spectroscopy is a method based on molecular vibrations and can provide direct information about the organic matter’s molecular compounds. During thermal maturation, the aromaticity of kerogen structure increases and heteroatom content (N, O, S, and H) decreases [12]. This process results in a more-ordered molecular structure of kerogen [13,14]. Raman spectroscopy is shown to be a promising, rapid, and non-destructive method for OM evaluation regarding its thermal maturity [15,16,17,18,19,20,21,22,23,24,25,26], and also predicting elastic modulus (Young’s modulus) [27].
In this study, four samples from Bakken Formation in Williston Basin in North Dakota were collected. Then, Raman signals were related to the %VRo, and maturity parameters from Rock-Eval pyrolysis (Tmax, S1, S2, and production index). The conclusions are then confirmed with the Fourier Transform Infrared Spectroscopy (FTIR) spectrum of two samples with the highest and lowest maturities to provide us with a better insight of molecular transformation of kerogen. In order to avoid the errors that may exist in the Raman spectrum when samples are mechanically polished or when carbonaceous minerals are present [5,23,28] and fluorescent background, kerogen was isolated from the mineral matrix. The Raman spectra of both the in-situ and pure kerogen were compared and the discrepancies in the data were presented.
It should be noted in this study that, for the first time, we are proposing the process in which Raman signals can be correlated to Rock-Eval results. However, due to the lack of Raman and pyrolysis data that are necessary for a strong conclusion, to better support our hypothesis, additional data from published literature has been also utilized.

2. Geological Setting

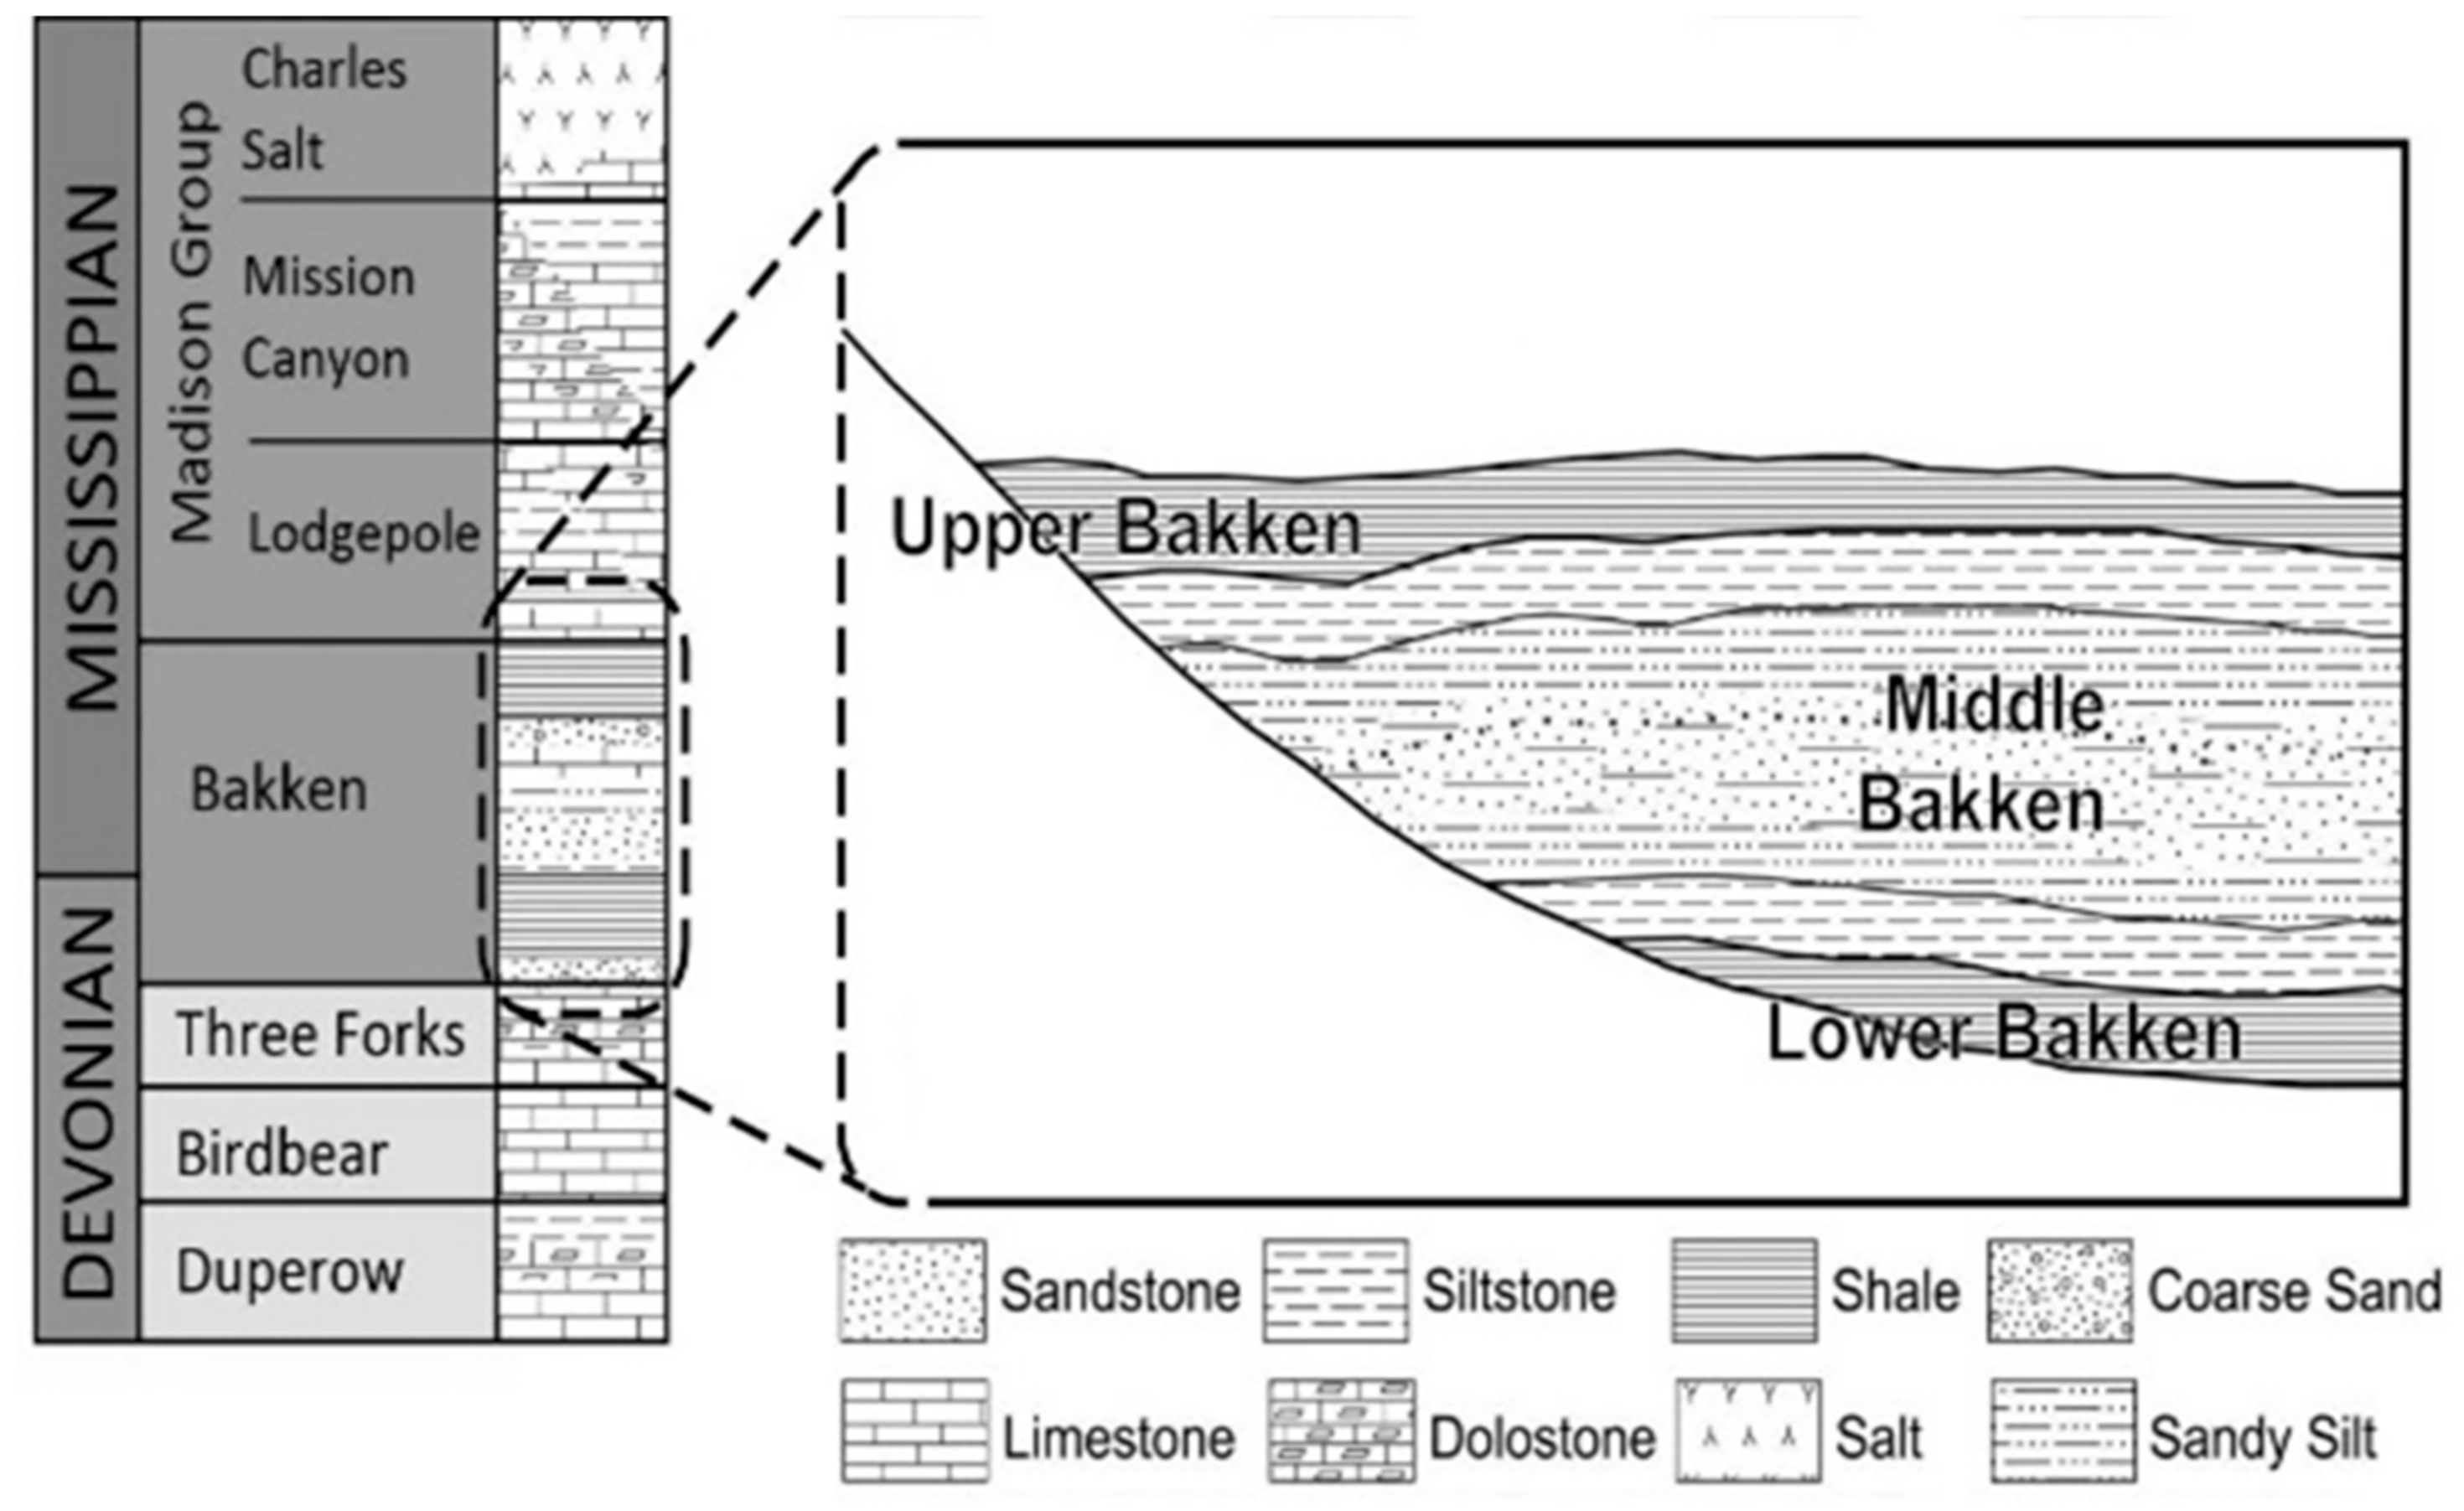
The late Devonian-Early Mississippian Bakken Formation is one of the main source rocks of the Williston Basin [29,30,31]. The Williston Basin is covers the southern portion of Canada (Manitoba and Saskatchewan) and the northern part of the United States (Montana and North Dakota), Figure 1. The Bakken Formation is underlain by the Three Forks Formation and is overlain by the Lodgepole Formation. The Bakken as an organic rich formation consists upper and lower members serving as source rocks and middle member as the reservoir with low porosity and permeability. Thickness of the Bakken Formation is about 150 ft and has no surface outcrop. The Bakken Formation has high TOC (Total Organic Carbon) content, which ranges from 5 to 20 wt % with an average of 11.33 wt % across the basin [32,33,34]. Different literature showed that most abundant kerogen type in the Bakken Formation are types I and II [35,36,37].

3. Sample Preparation and Experiments

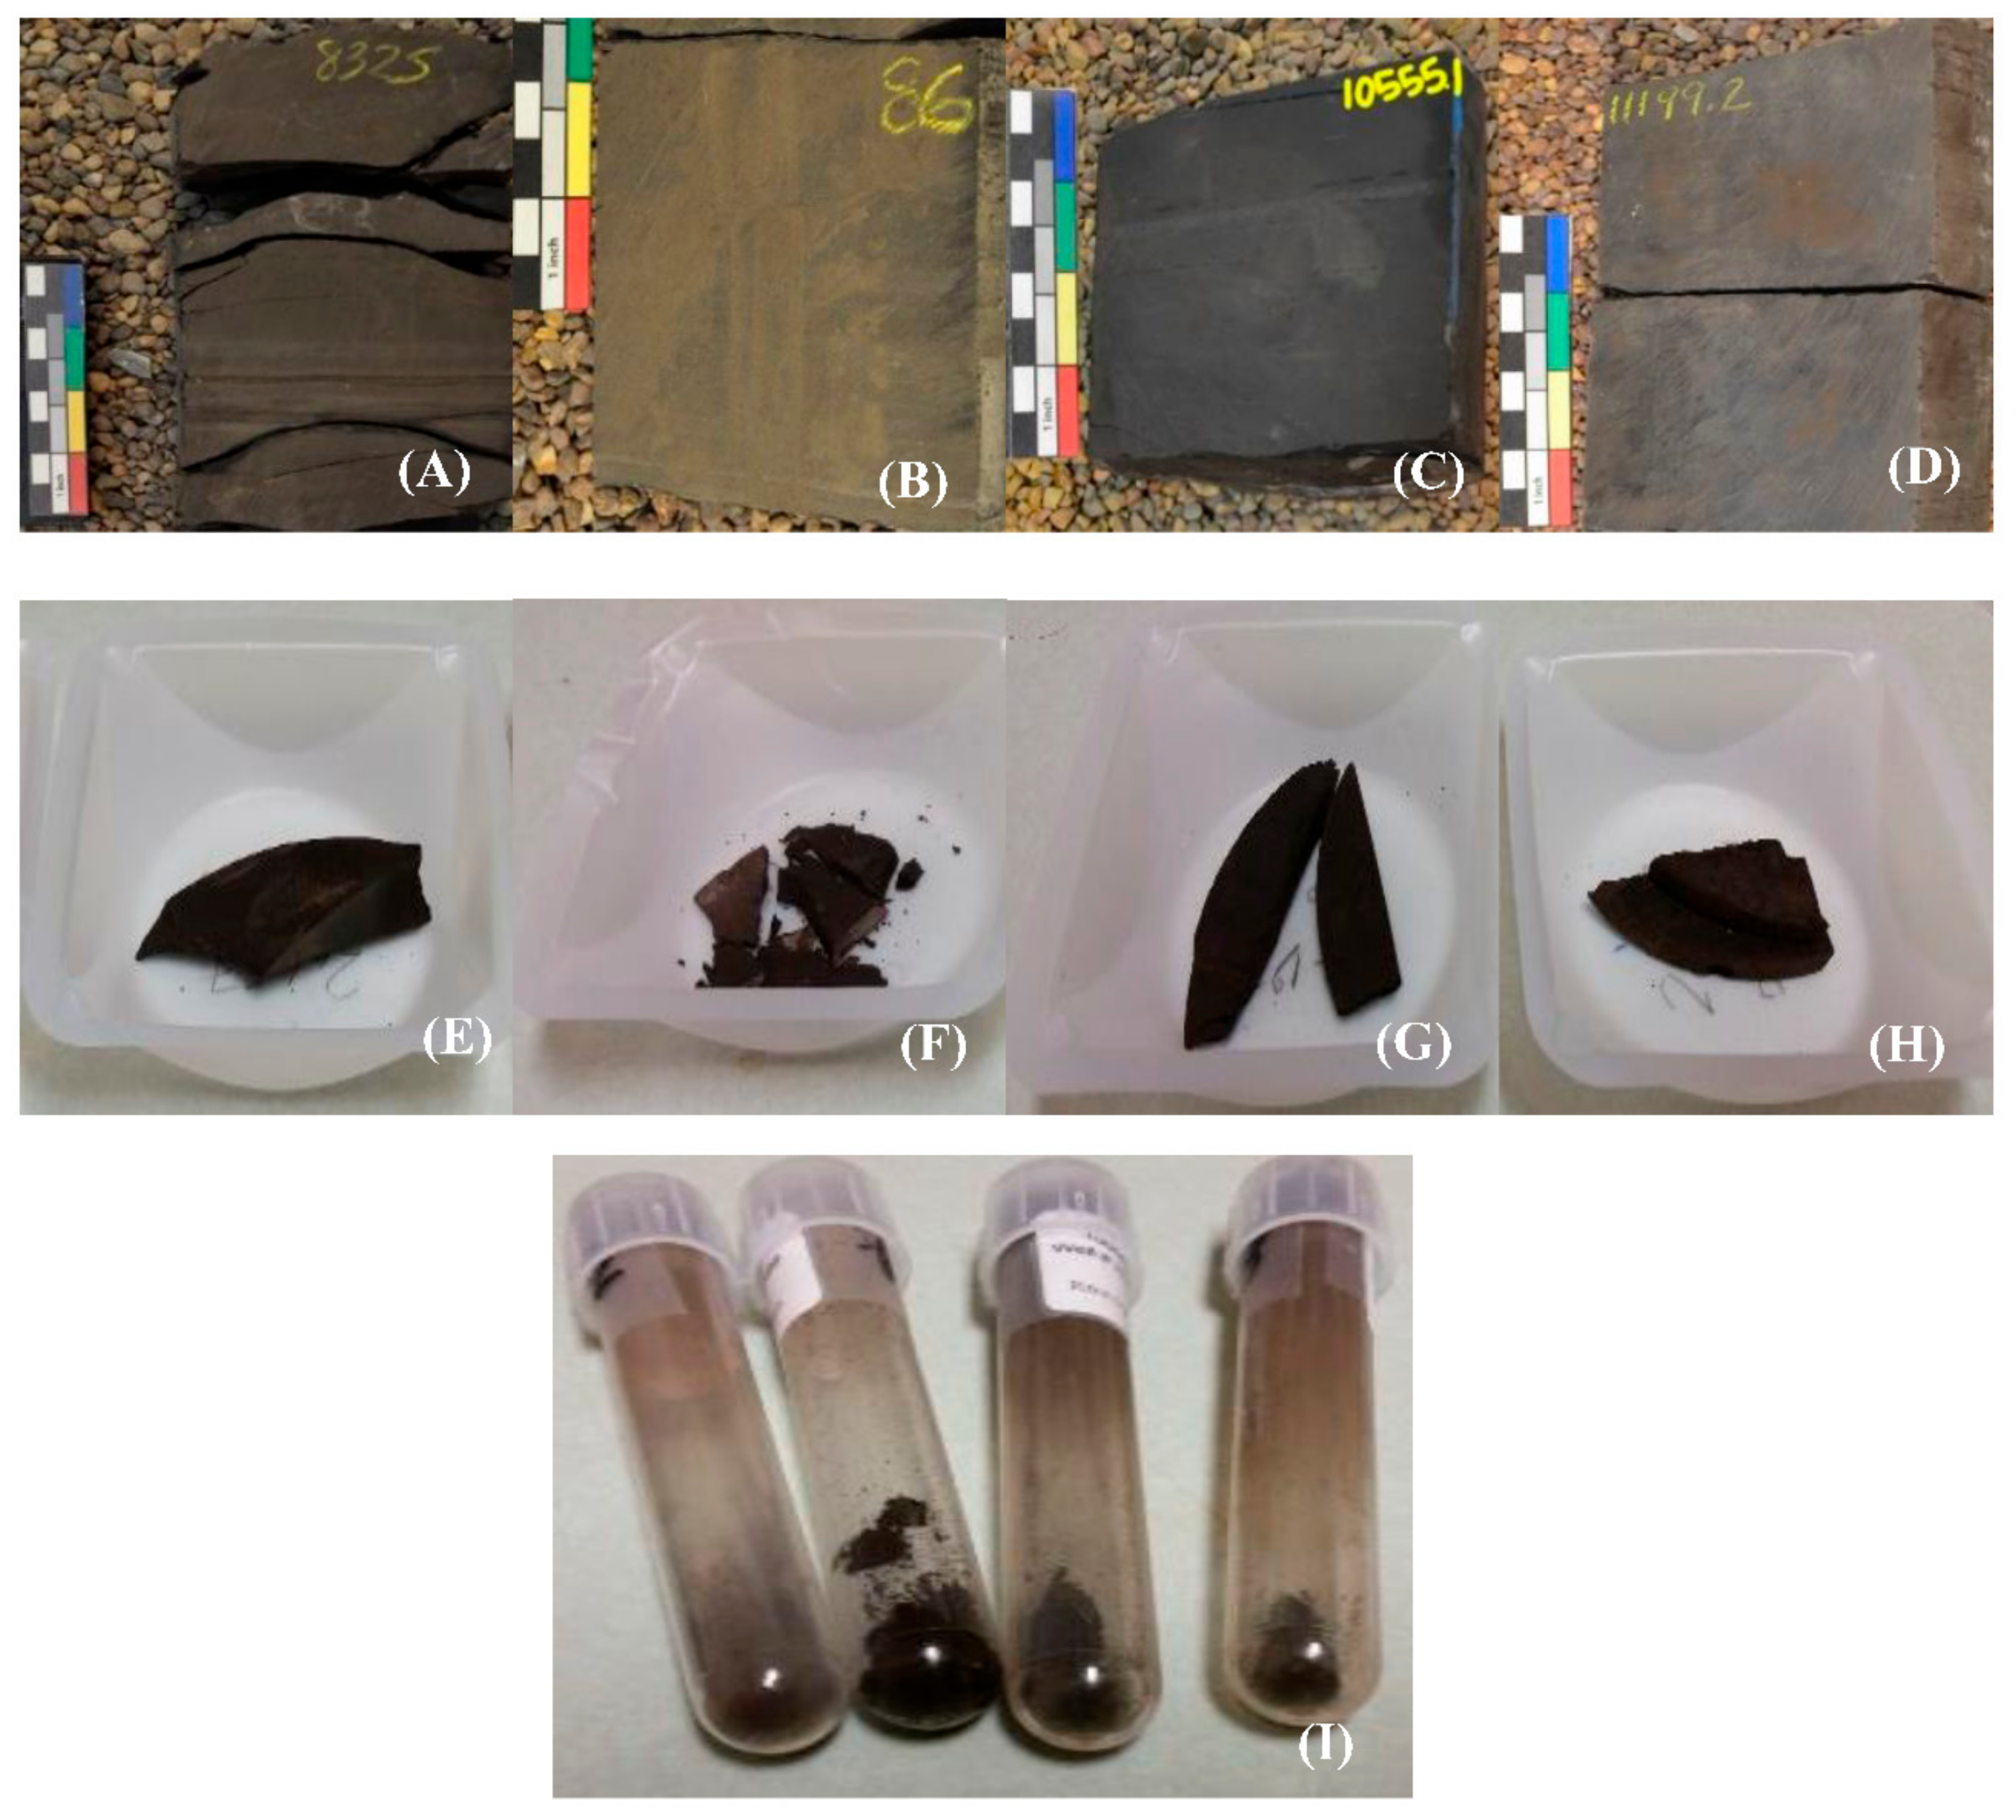
The samples are taken from four different Wells (A, B, C, and D) and they vary in depth and maturity, core images are shown in Figure 2. Small pieces of samples were homogenized and divided into three parts to be used for Raman spectroscopy, vitrinite reflectance (%VRo), and Rock-Eval analysis. The same portions of the samples that were tested for Raman measurement were then gone through the kerogen isolation process by acid to separate the organic matter from mineral matrix.
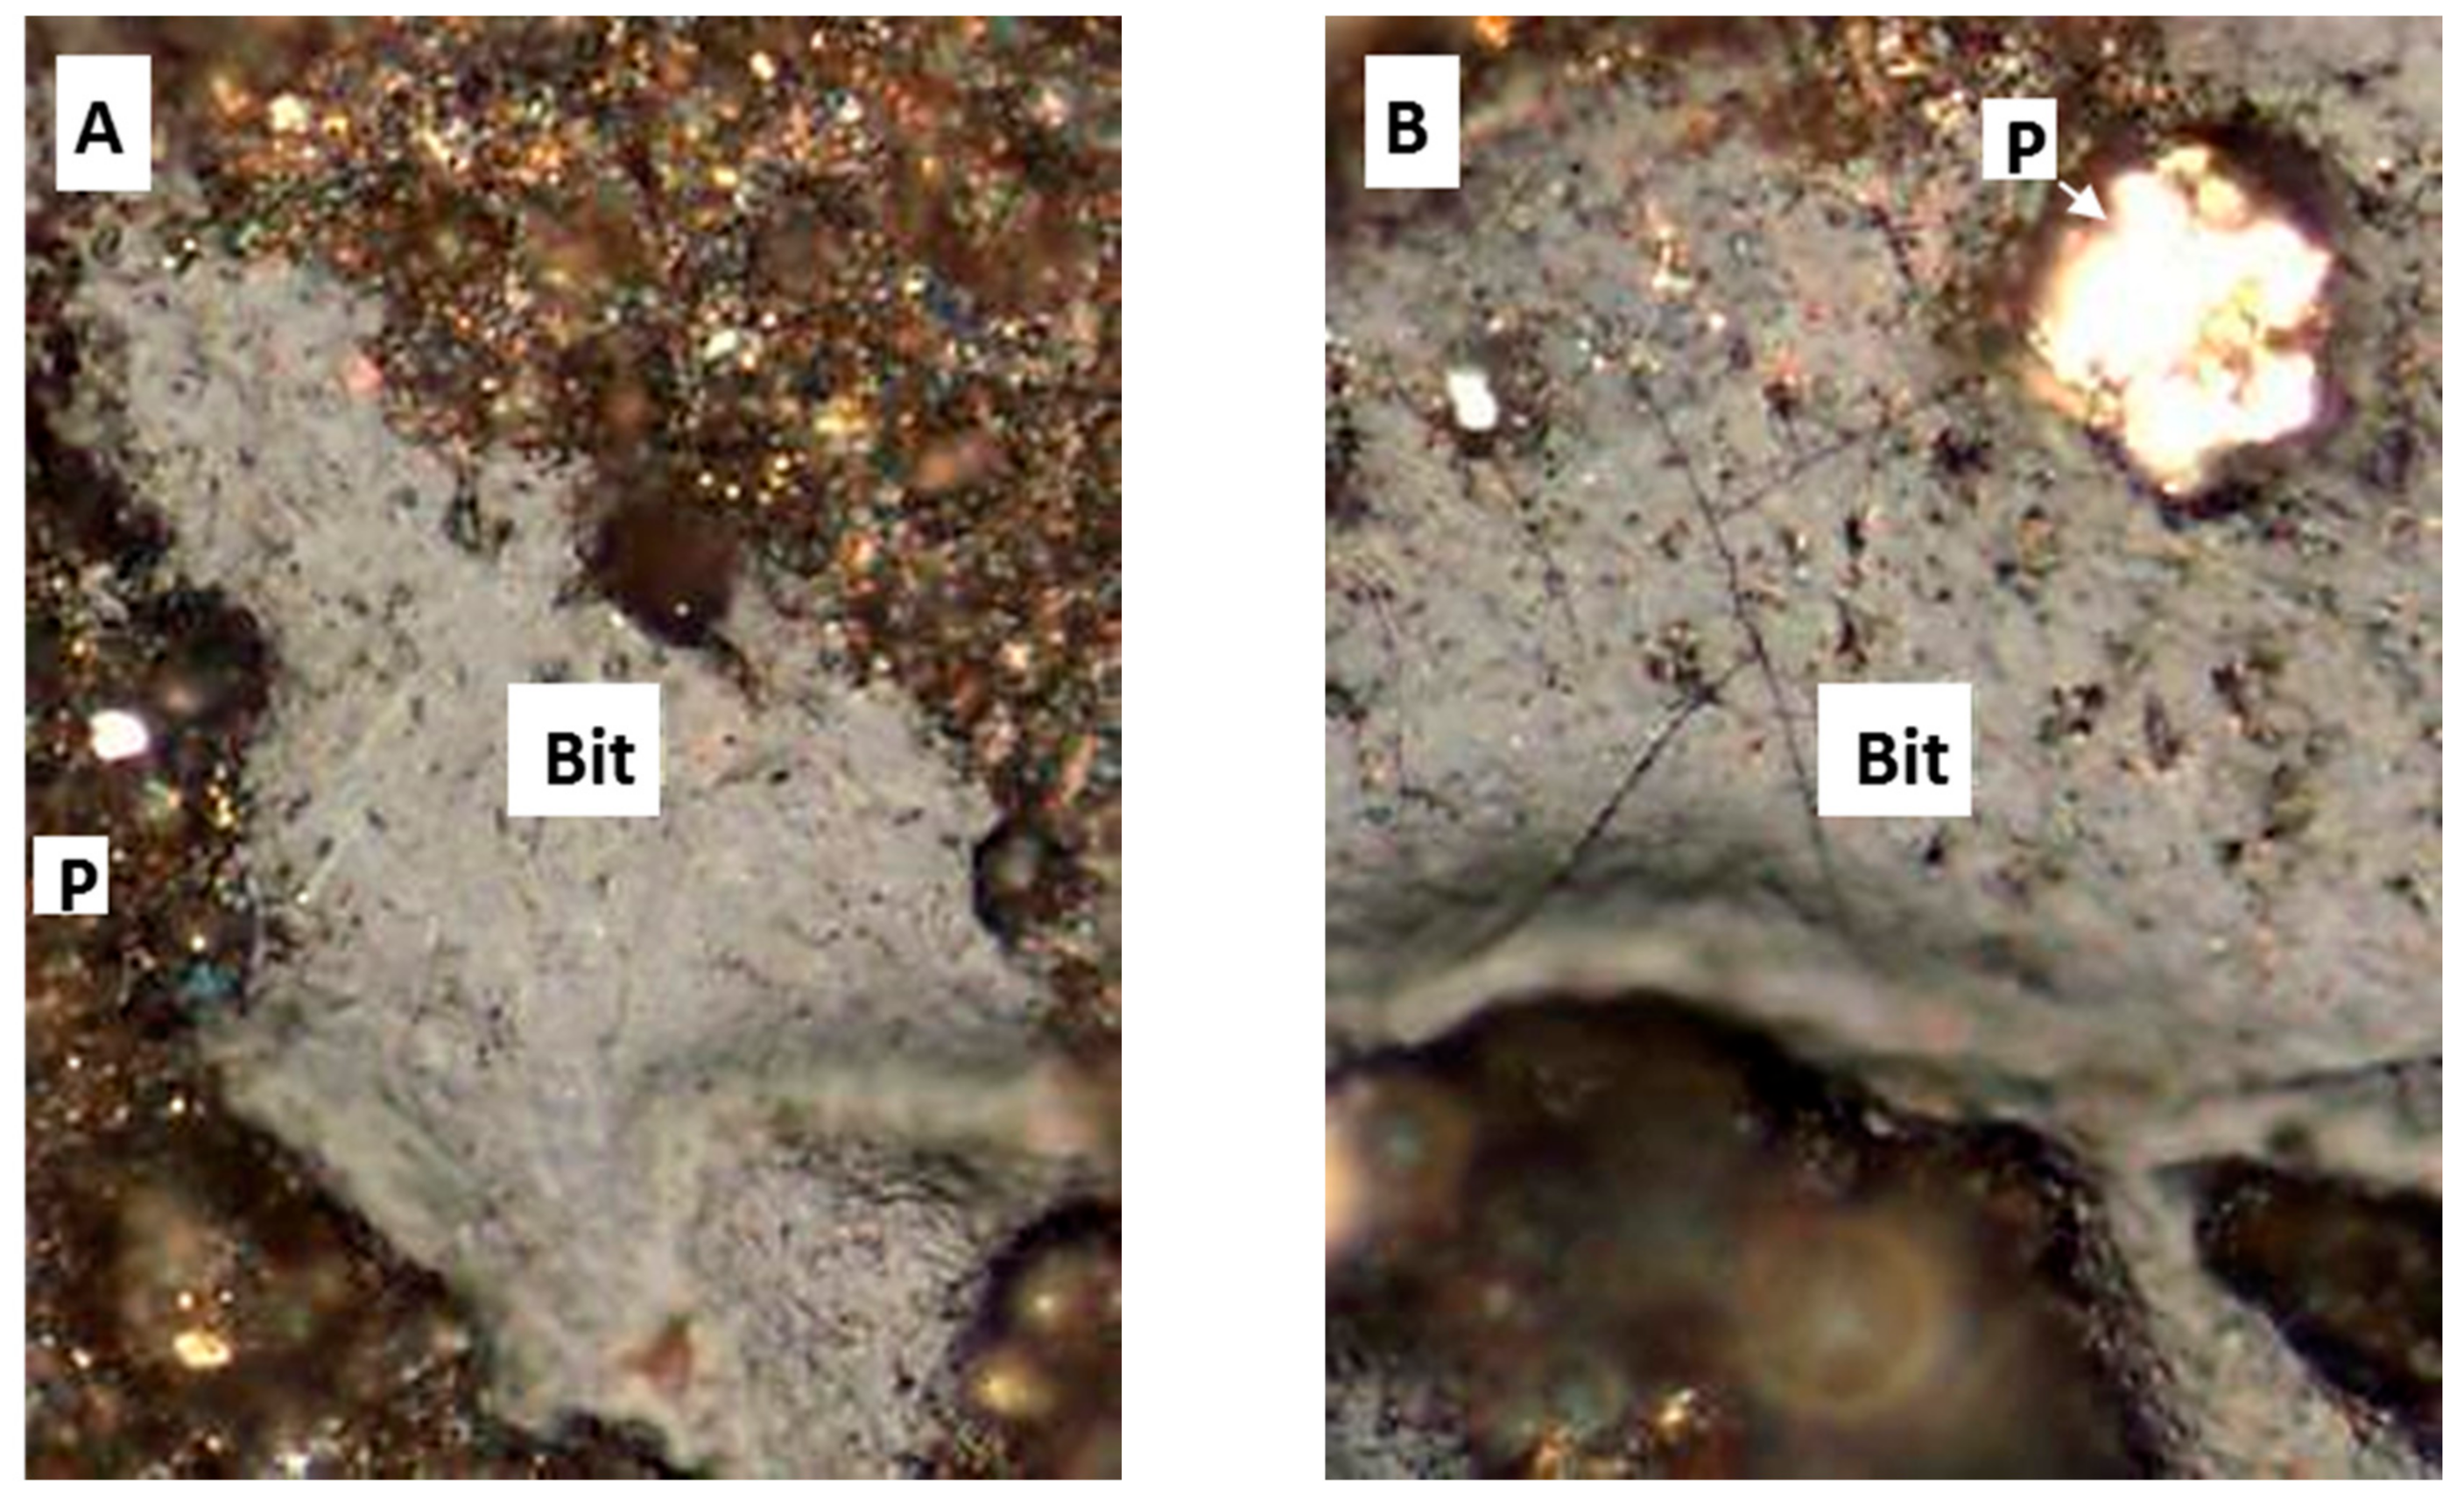
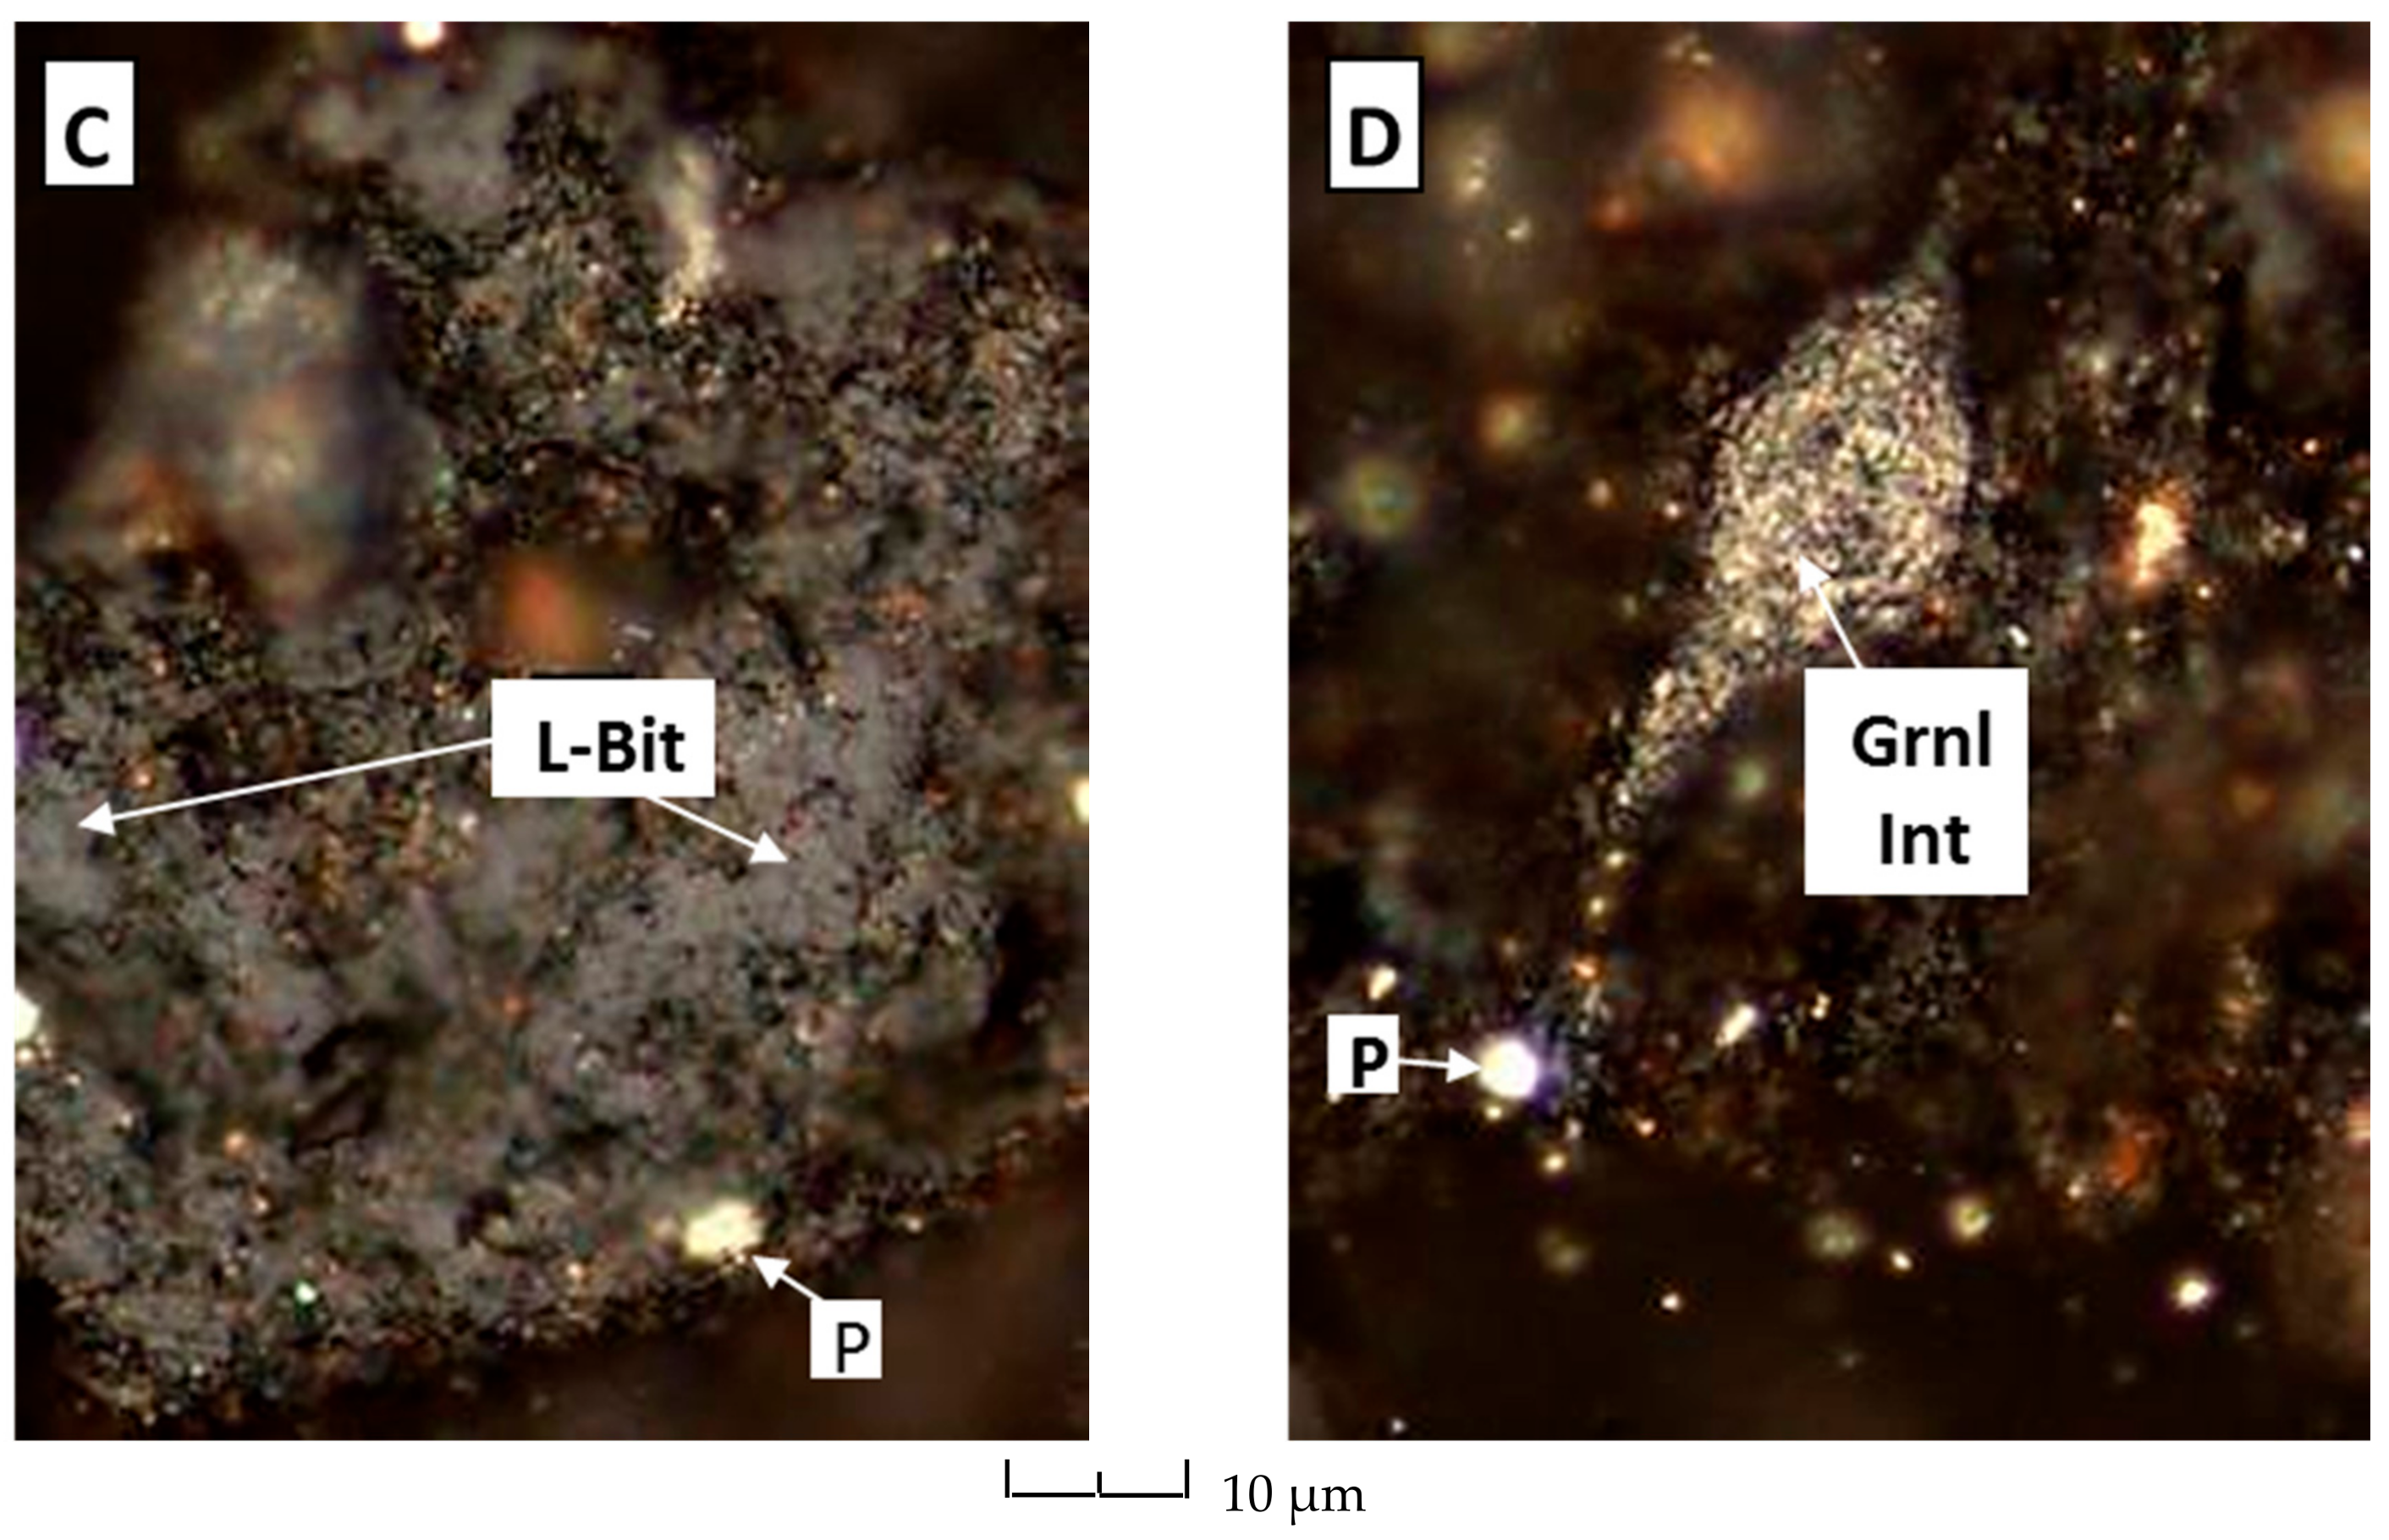
To evaluate the maturity of samples, they were crushed (850 µm) and hardened by mixing with the epoxy resin [4]. In the next step, to ensure the surfaces are scratch, samples were polished by polishing equipment. The random reflectance (%VRo) and qualitative fluorescence were then analyzed with a Carl Zeiss Axio imager A2m microscope. As primary vitrinite is absent in sedimentary formations that are older than the Devonian, the same as in four samples from Bakken Formation (Figure 3), bitumen reflectance (%BRo) was used to obtain an equivalent vitrinite maturity (%VRo-eq) using the Jacob equation (Equation (1)) [38], which is one of numerous such equations available. In addition, VRo-eq was calculated by converting Tmax from Rock-Eval pyrolysis through Equation (2) [39]. Equation (2) was used because it is derived from the Mississippian-age Barnett Shale in Texas, which contains type II marine kerogen, similar to that found in the Bakken Shale.
%VRo-eq = %BRo × 0.618 + 0.4
%VRo-eq = 0.0180 × Tmax − 7.16
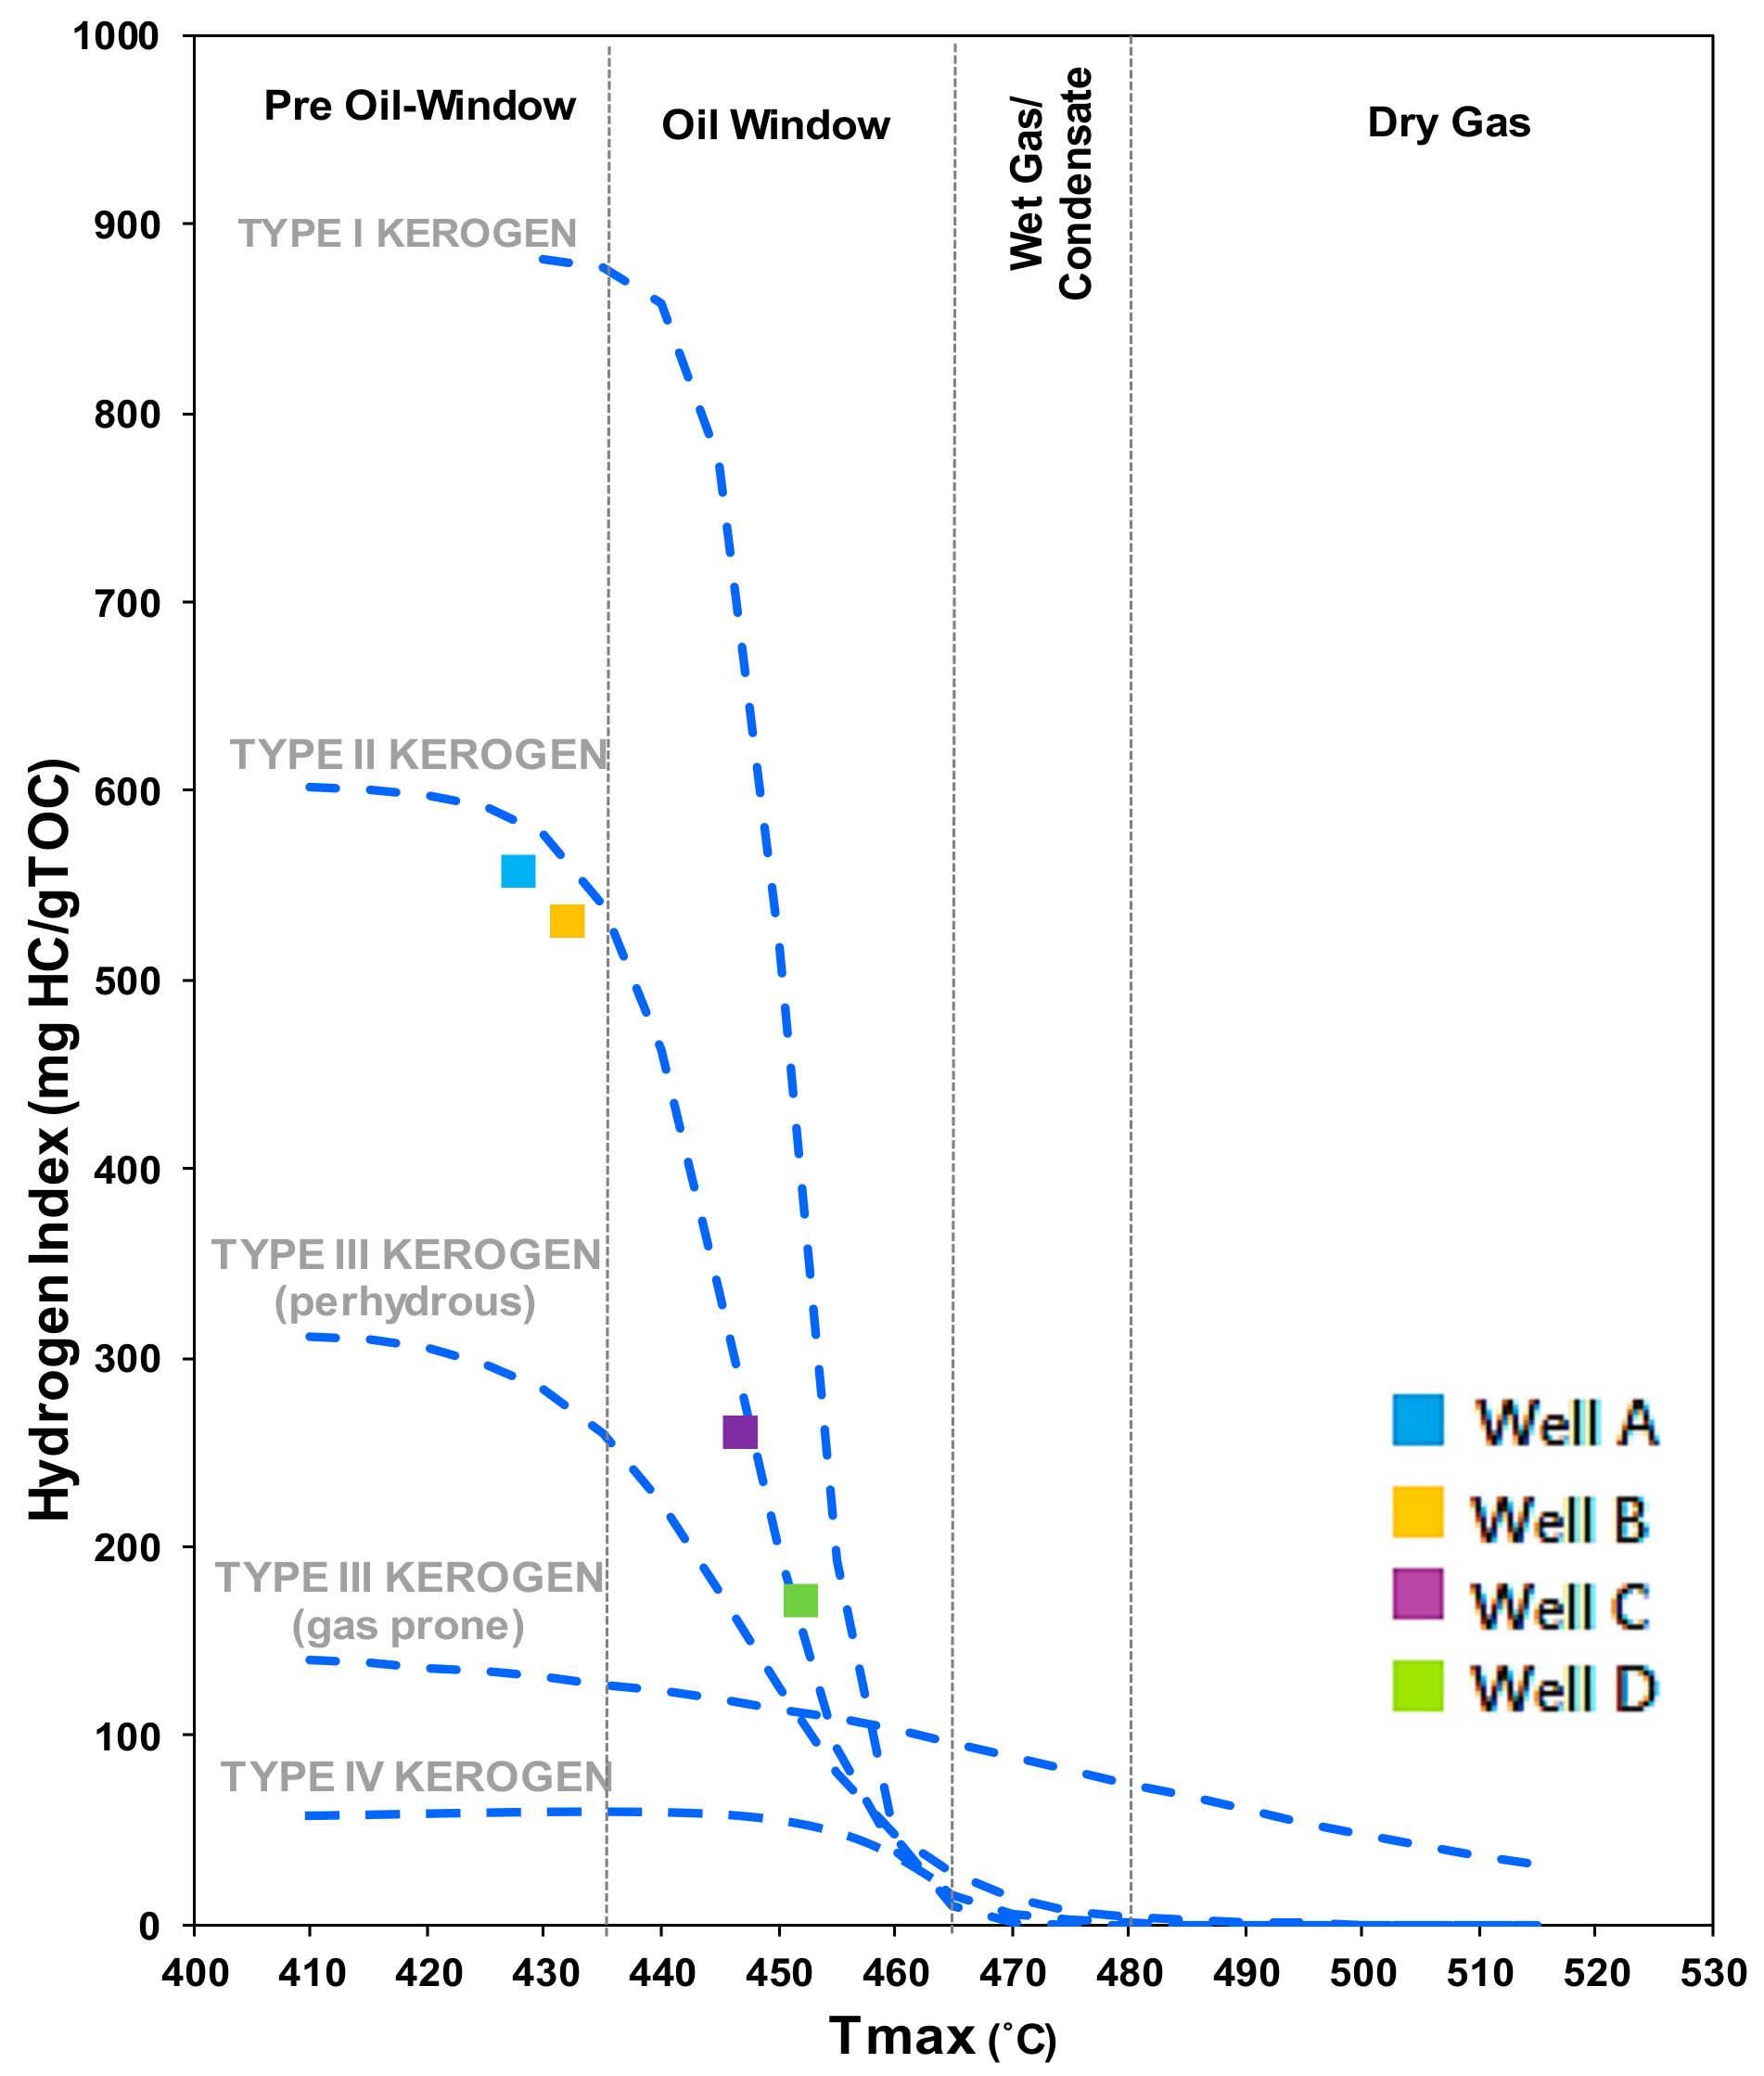
In the next step, programmed Pyrolysis was performed on samples by Rock-Eval 6. Table 1 summarizes the properties that were derived from the Rock-Eval analysis of four samples. As in Figure 4 Type II is the main type of Kerogen of our samples, TOC values vary from 12.69 wt % to 16.36 wt %, and %VRo-eq maturity fluctuates from 0.53 to 0.99. S1 is the free hydrocarbons that are present in the rock, while S2 is the amount of hydrocarbon generated through pyrolysis and is used to derive hydrogen index (HI) [10]. S3 is the CO2 that will be released during pyrolysis and is in relationship to the oxygen in the kerogen structure that is used to derive oxygen index (OI) [10]. Production index (PI) can also be a maturity indicator [10]. More description of Rock-Eval pyrolysis can be found in [11].

3.1. Isolation of Kerogen

Polishing rocks will create dislocation of constituent components within the samples that will affect their Raman response. Moreover, fluorescent background noise due to presence of bitumen and sulfur in lower maturity samples masks the signal [15,23,40]. In order to avoid these two issues, kerogen was isolated from the samples, according to [41,42].
The process can be summarized as below:
  • Pre-acid preparation of the samples: sample quality needs to be evaluated to ensure they are properly washed and are brought to the appropriate mesh size (crushed if necessary). Typical starting sample size is 20–30 g of material, depending on organic richness.
  • The sample is then placed into concentrated 37% HCl (small increments should be added to prevent excessive foaming, while timing is dependent on sample reaction).
  • Samples are placed into concentrated 48% HF (HF is for digestion of remaining silicates).
  • The samples are placed into concentrated HCl for the second time.
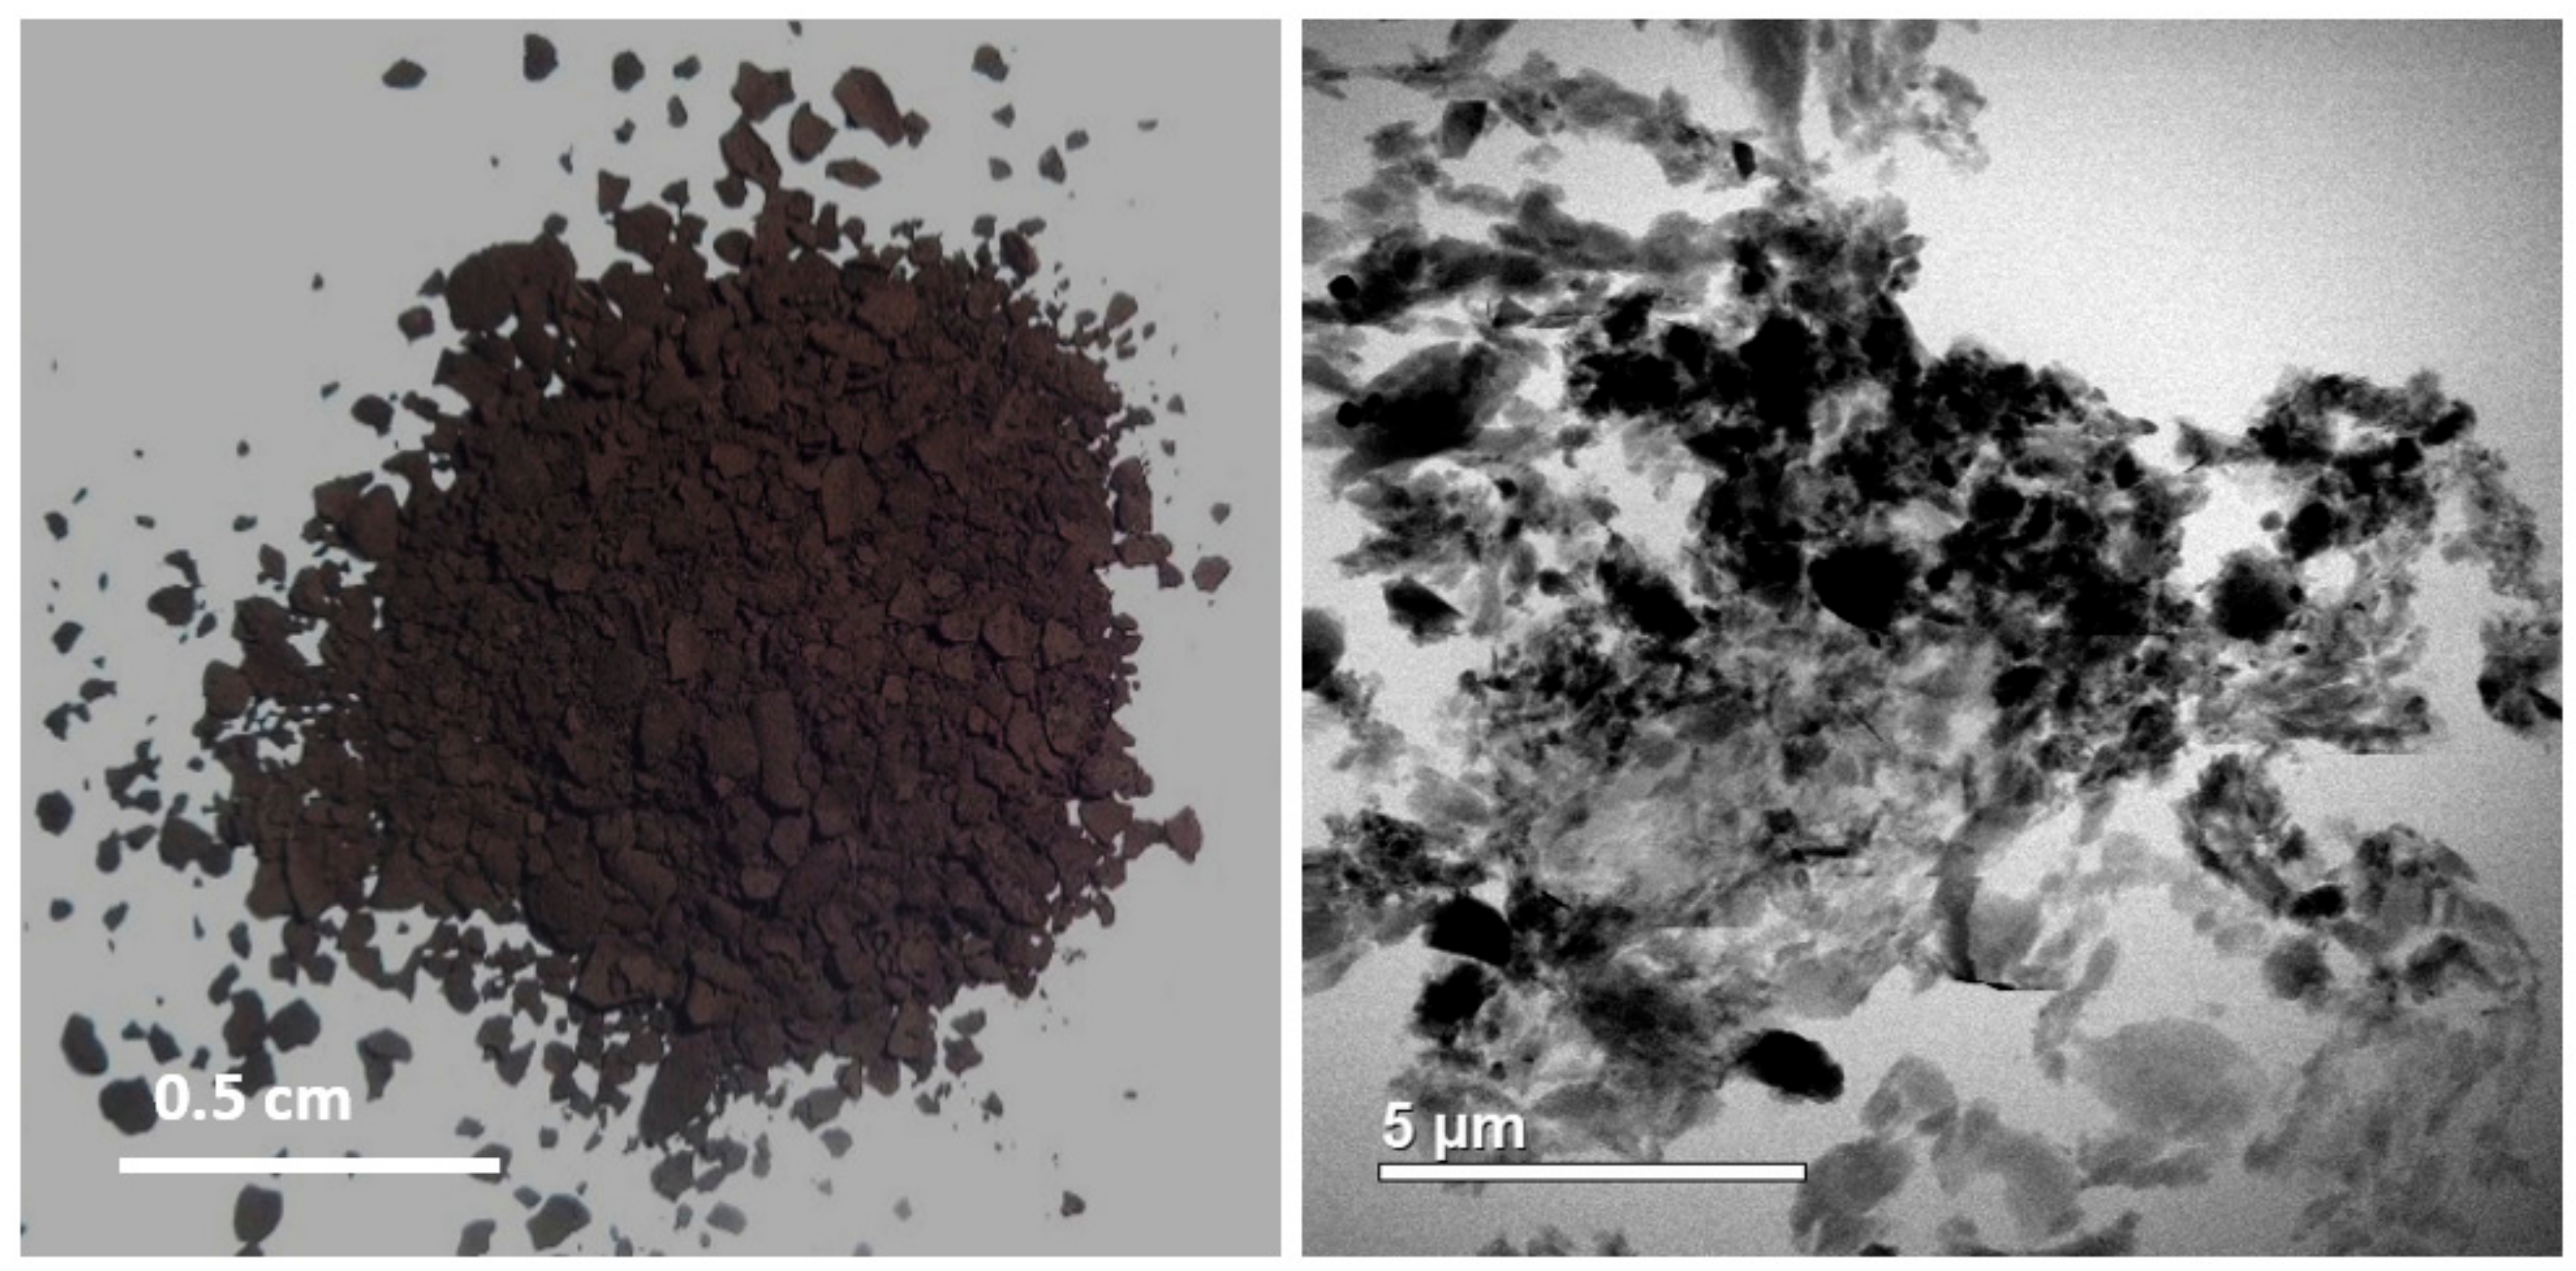
  • Centrifugation: this is done essentially by taking a portion of the remnant of the sample and placing it into a centrifuge tube to create the kerogen slide. This process will separate the solid kerogen from remaining liquids, Figure 5.

3.2. Raman Spectroscopy

Inelastic scattering of monochromatic light in Raman spectroscopy, such as a laser beam, from the surface of the sample, interacts with molecular vibrations [43]. The interaction causes an exchange of energy in which the energy of laser photons will either shift up or down [44,45,46]. Based on the frequency of vibration of the molecule(s), change in energy varies, which leads to unique spectral patterns for each molecule.
Kerogen depicts two main peaks in the spectrum known as G and D bands [16,47,48,49,50]. The G band, which refers to graphite appears around 1600 cm−1, indicating well-ordered, graphite-like carbon [27]. The D band appearing around 1350 cm−1 depicts disorder in the atoms [5].
Raman spectra were acquired using 532 nm excitation energy by focusing the laser beam on the surface of four samples (both in situ and extracted), Figure 6.
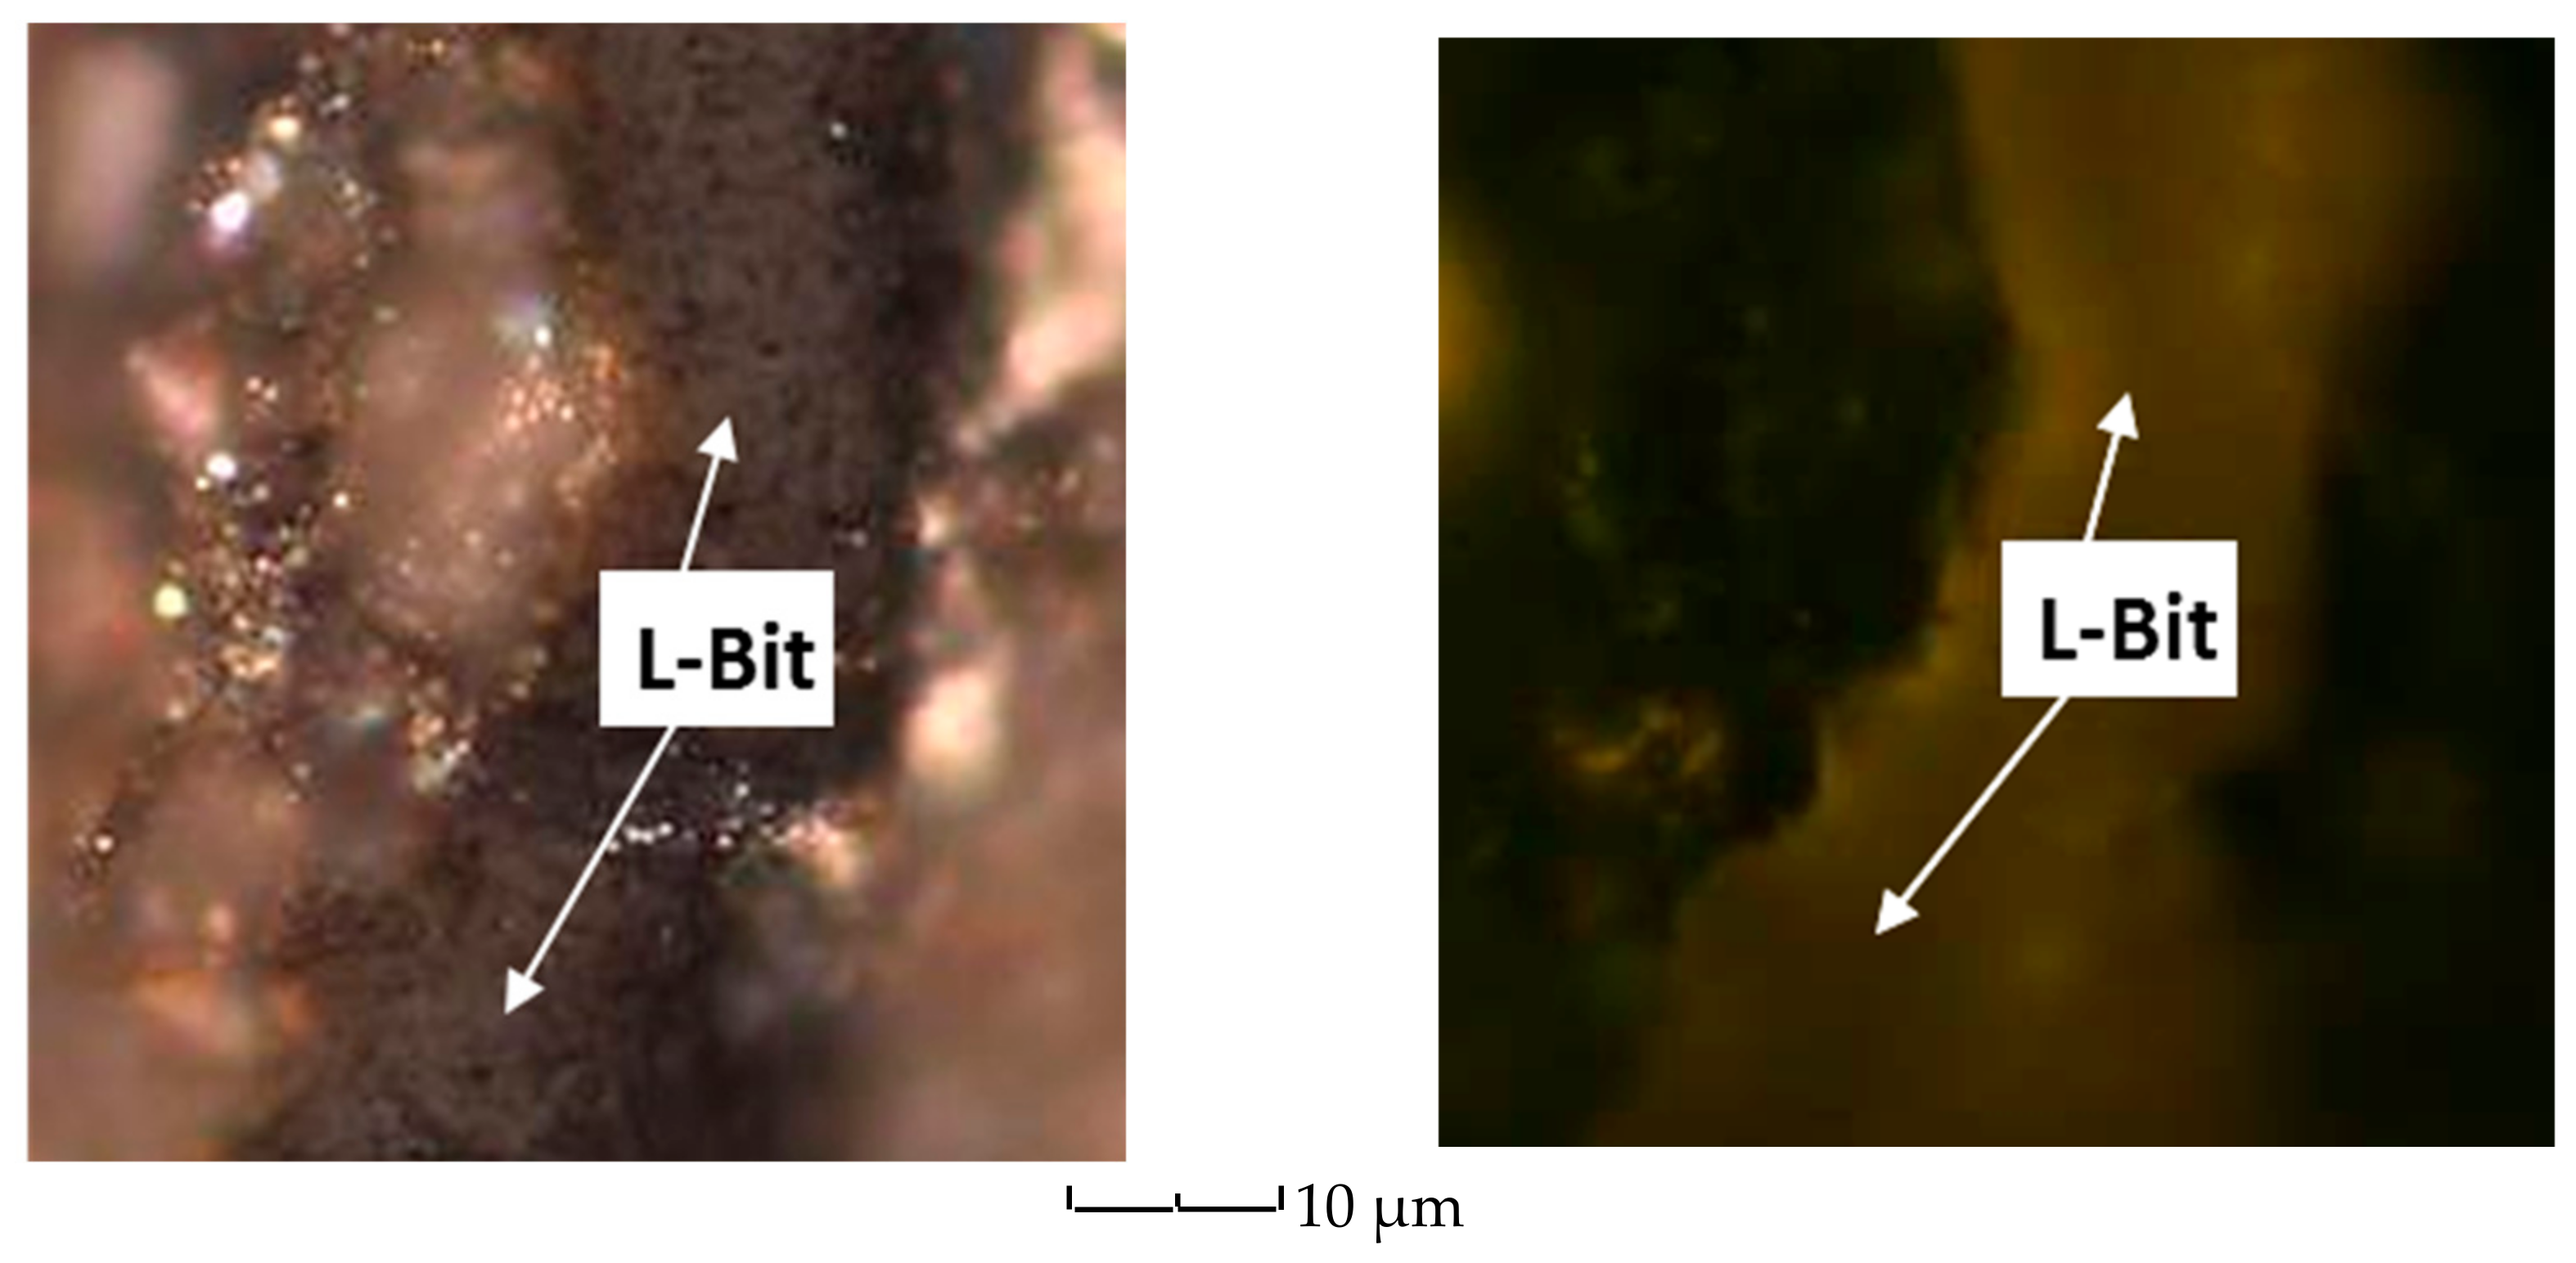
It should be noted that Raman signals might interfere with fluorescence noise in generally low thermal maturity samples. Figure 7 shows solid bitumen under white reflected light and under UV light (fluorescent). Removing bitumen and sulfur content in the matrix by the isolation of kerogen from the rest of the constituent components in the sample has led to the attenuation of background noise. Note the change in the intensity and fluorescence of samples before and after extraction, in Figure 6.

4. Results and Discussion

4.1. Raman Signals on Pure Kerogen

As mentioned before, bitumen and sulfur content in mud rocks tend to express high fluorescent background noise in Raman spectrum. As shown in Figure 6, the isolation of kerogen removes this issue by eliminating the effects of bitumen. Comparing spectra before and after kerogen isolation in Figure 6 indicates high background fluorescent levels in in-situ samples which have been reduced, specifically for Well A with lower maturity.
Table 2 contains the details of the Raman spectroscopy data for both isolated and shale kerogen. It can be concluded from the table that standard deviations of D and G bands for isolated kerogen are less than the in-situ (non-isolated) samples. The higher deviation of D bands when compared to G bands can be attributed to the fact that depending on the orientation of the crystallites to the exciting laser beam, spectral features of disordered sp2 carbons (D band) may vary notably [51].
Moreover, it has shown by [52] that polishing the samples to 0.05 μm roughness influences the Raman spectra. This originates from carbonaceous matters that are very sensitive to the polishing process, thus isolation will circumvent this problem. Furthermore, bitumen and sulfur content in mud rocks tend to express high fluorescent background noise in Raman spectrum. As shown in Figure 6, isolation also removes this issue by eliminating the effects of bitumen. Comparing spectra before and after kerogen isolation in Figure 6 indicates high background fluorescent levels in in-situ samples that have been reduced, specifically for Well A with lower maturity.

4.2. Raman Spectroscopy for Evaluating Production Potential of OM

Previous studies have documented that thermal maturity reflects a systematic change in the positions, separations, and other important parameters of the bands in the Raman spectra for carbonaceous materials. As kerogen matures, it starts to make clusters of aromatic bands and also loses its heteroatoms [12,13,14]. Such evolution is perceived by Raman spectroscopy at different levels of maturation, reflecting molecular structural transformations.
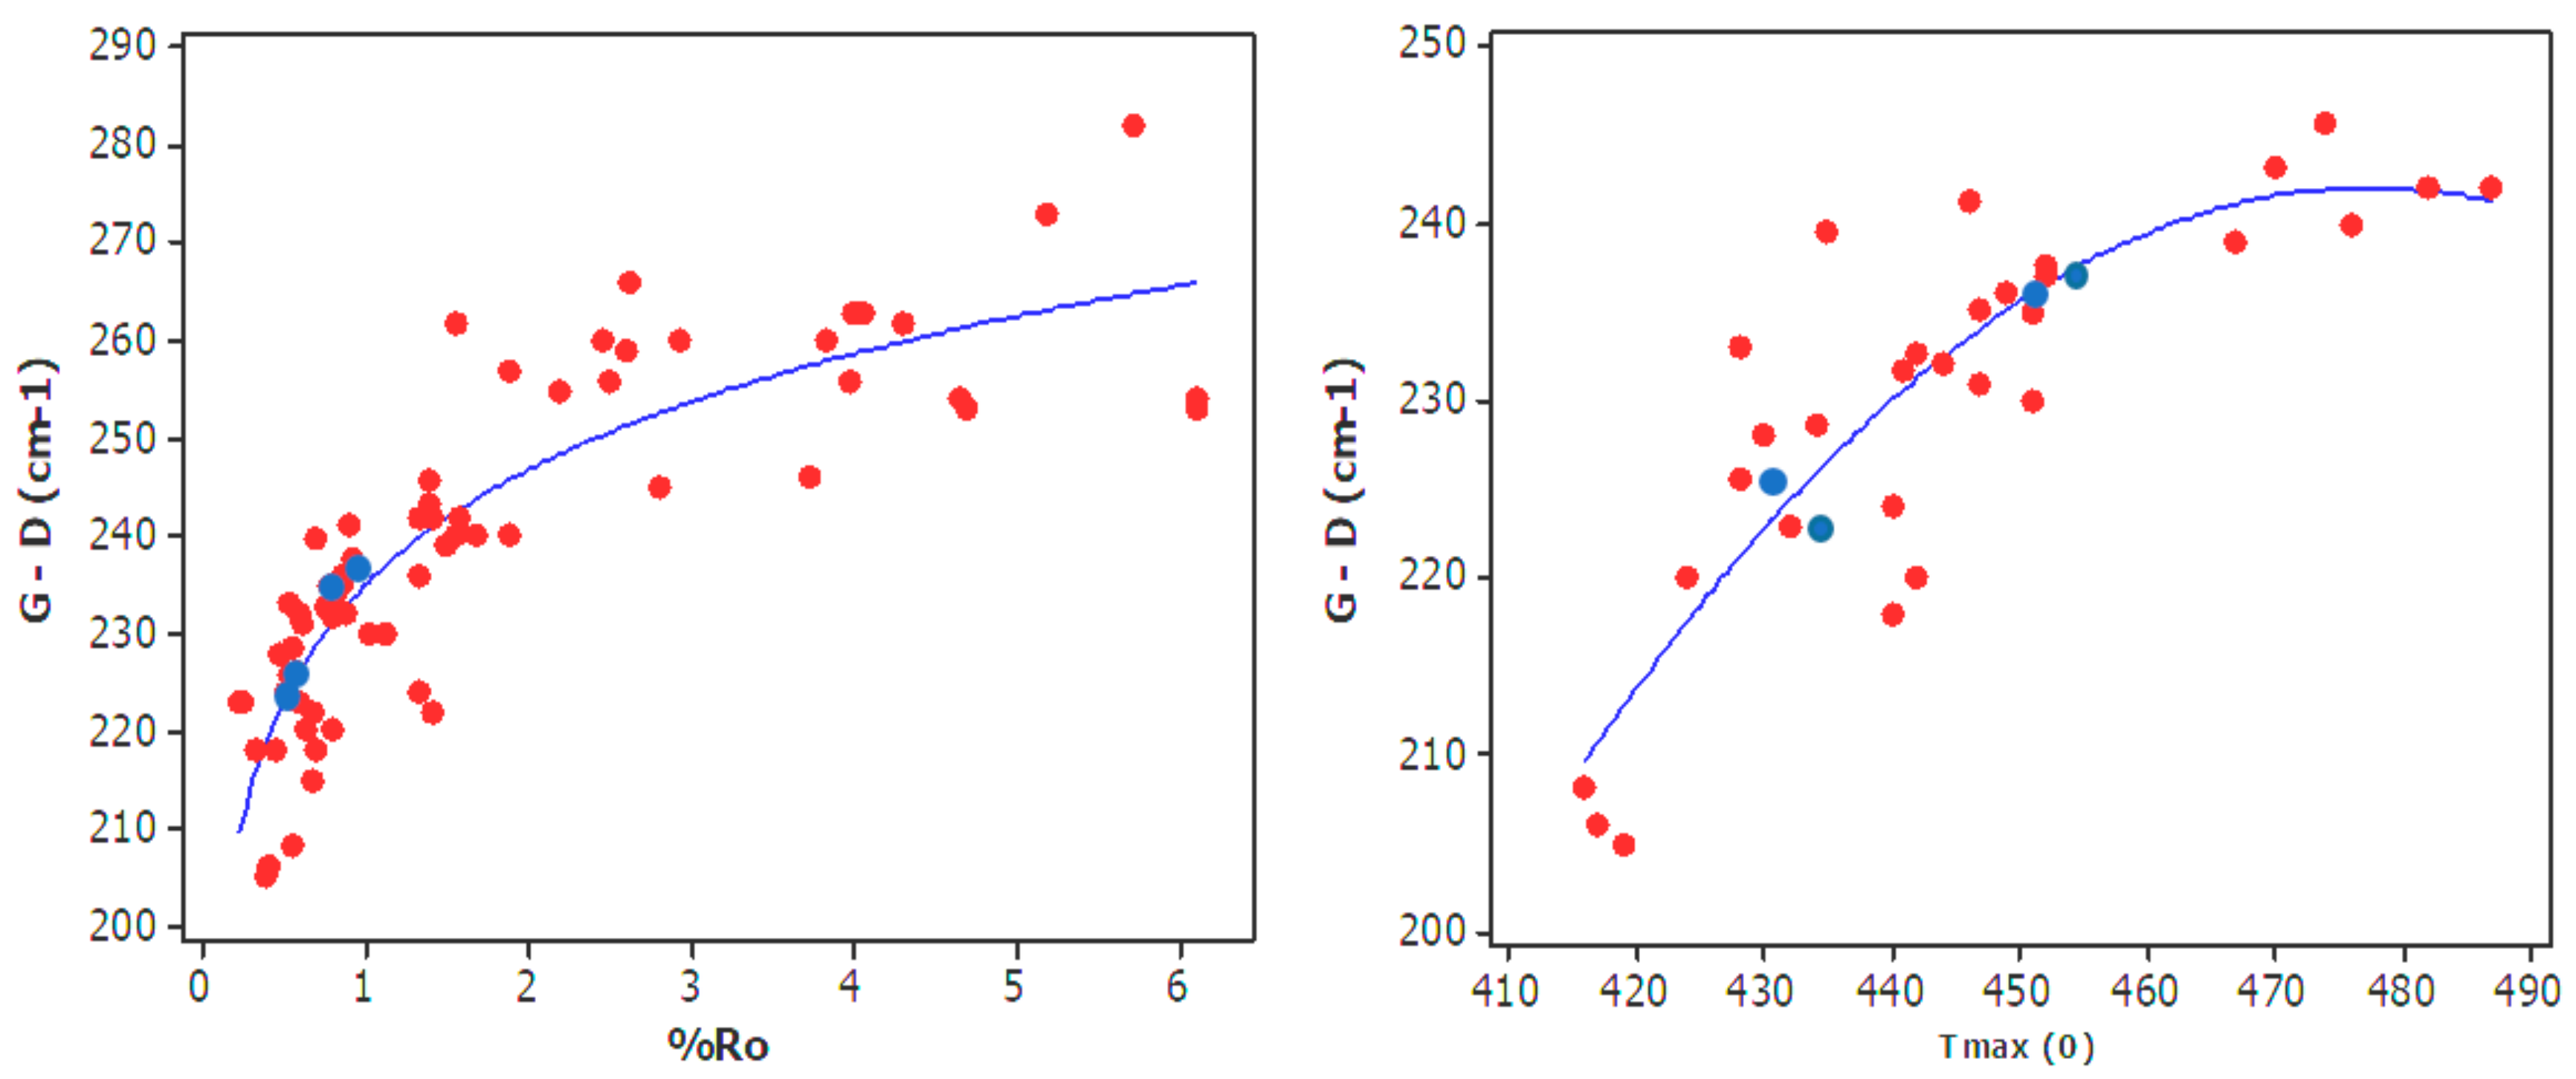
Figure 8 displays a non-linear correlation between band separation (G-D) versus maturity (%VRo) for samples that are taken from 12 different fields from [5,15,53], and including samples from this study. Tmax, which is also a major parameter representing the thermal maturity of the samples and is obtained from Rock-Eval analysis, shows correlation with band separation, as in earlier studies [15,17,26,27,40,54,55,56].
It should be noted that band separation increases with a higher rate at lower maturities. This has been explained by the fact that organic matter cracks with different rate before and after the peak oil window which is now reflected in Raman signals as well [15,27,56,57].
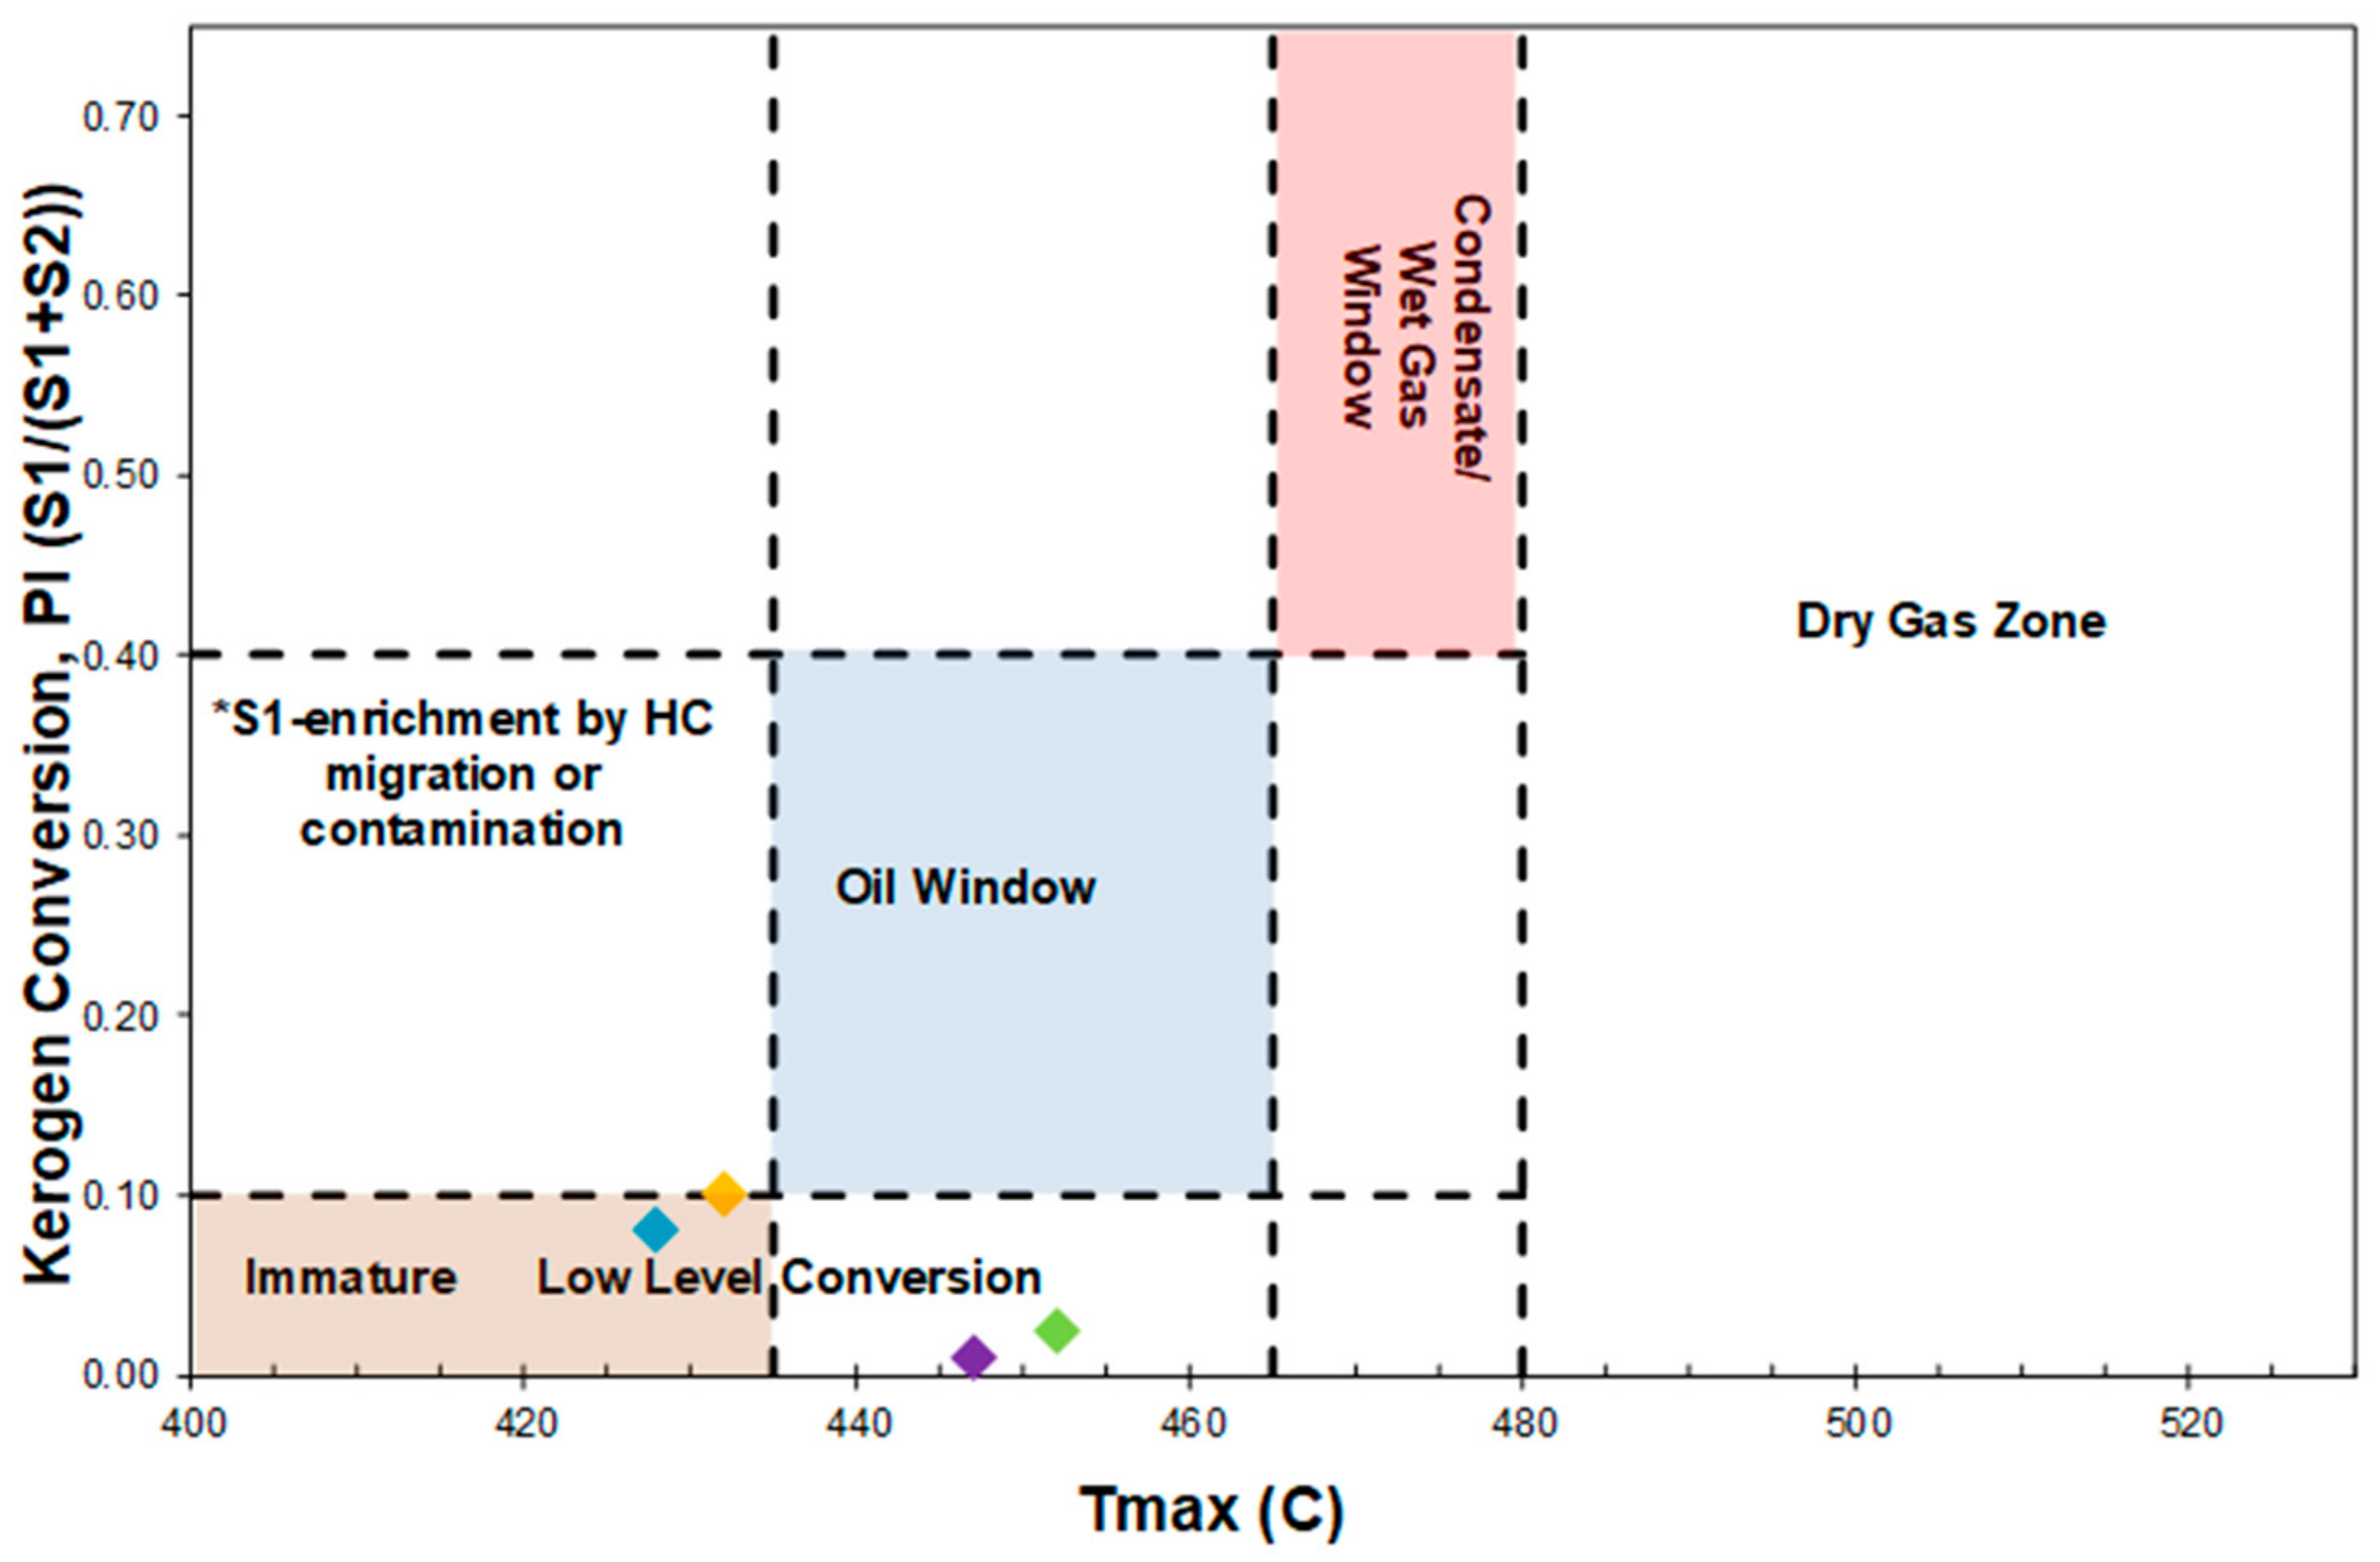
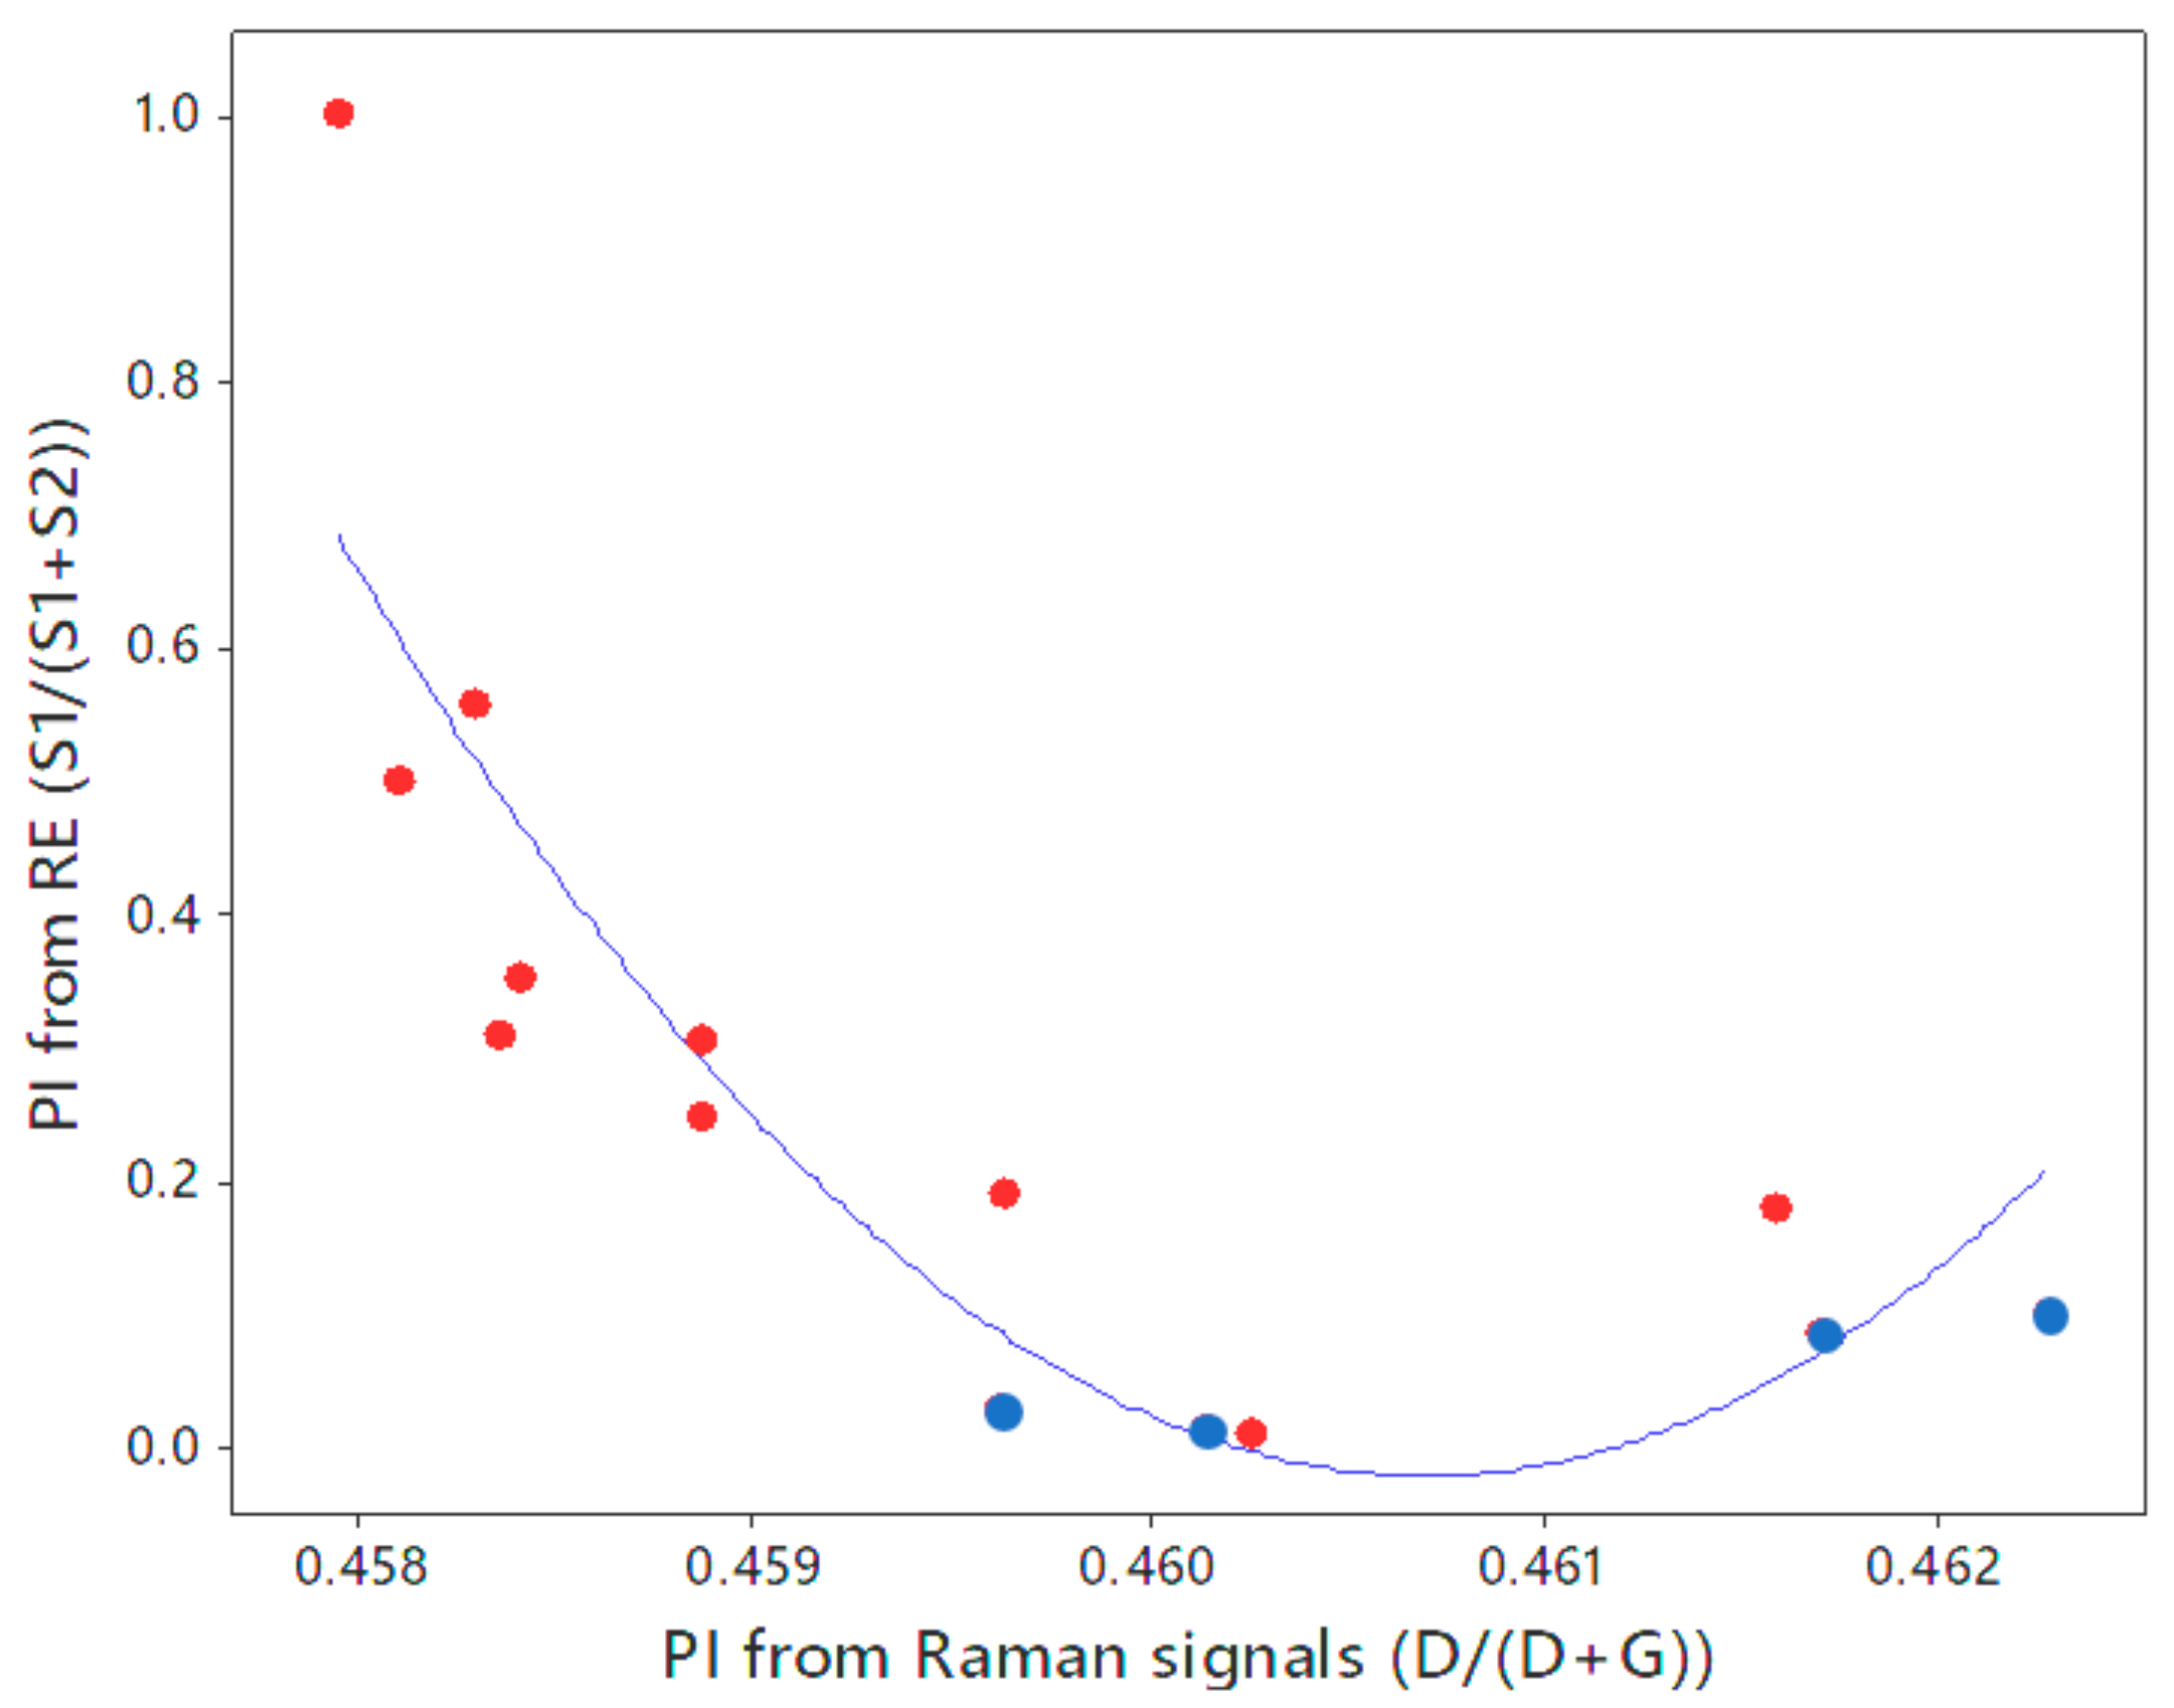
In addition to understanding the thermal maturity of organic matter, its production potential regarding Rock-Eval parameters, such as S1, S2, and production index (PI) is also important in evaluating productive intervals. As mentioned before, S1 is the amount of free hydrocarbons (oil) already in the sample (in milligrams of hydrocarbon per gram of rock), which can be detected at 350 °C (initial heating stage) [10,58]. S2 is the quantity of hydrocarbons that will be generated through pyrolysis (550 °C). Production index is the ratio of generated hydrocarbons to potential hydrocarbons that can be produced, Equation (3) [59,60], which can give an insight about the kerogen conversion level when is plotted vs. Tmax. Figure 9 shows that our samples are in a low level of conversion stage.
P I   =   S 1   ( m g   H C g   r o c k ) /   ( S 1 ( m g   H C g   r o c k )   +   S 2 ( m g   H C g   r o c k ) )
In the kerogen structure, aromatics that are linked by aliphatic and heteroatoms [15], in which solid bitumen can be trapped [61,62]. The increase in carbon aromaticity that takes place during maturation has been also detected during natural maturation that is caused by igneous intrusions [63,64,65,66,67,68], or by the increase in depth of burial [69,70,71].
Fortunately, the complex structure of kerogen correlates strongly with its maturity. As hydrocarbon is being generated, aliphatic carbon linkages are lost (reduction in HI is a good indication of the reduction in aliphatic carbon). The main contributor in the process of hydrocarbon generation is aliphatic [57,72,73,74,75,76], which can be attributed to S2, since they are both representing kerogen potential hydrocarbon production. Such structural evolution can be monitored by different spectroscopy methods [17,51].
For instance, Infrared Spectroscopy (IR) showed the decrease in that aliphatic concentrations with maturity [72]. In another study, quantitative 13C DP MAS NMR spectrum was used on samples that were exposed to the hydrous pyrolysis, the results showed aliphatic groups are the important compound that are contributing to the hydrocarbon generation [56,57].
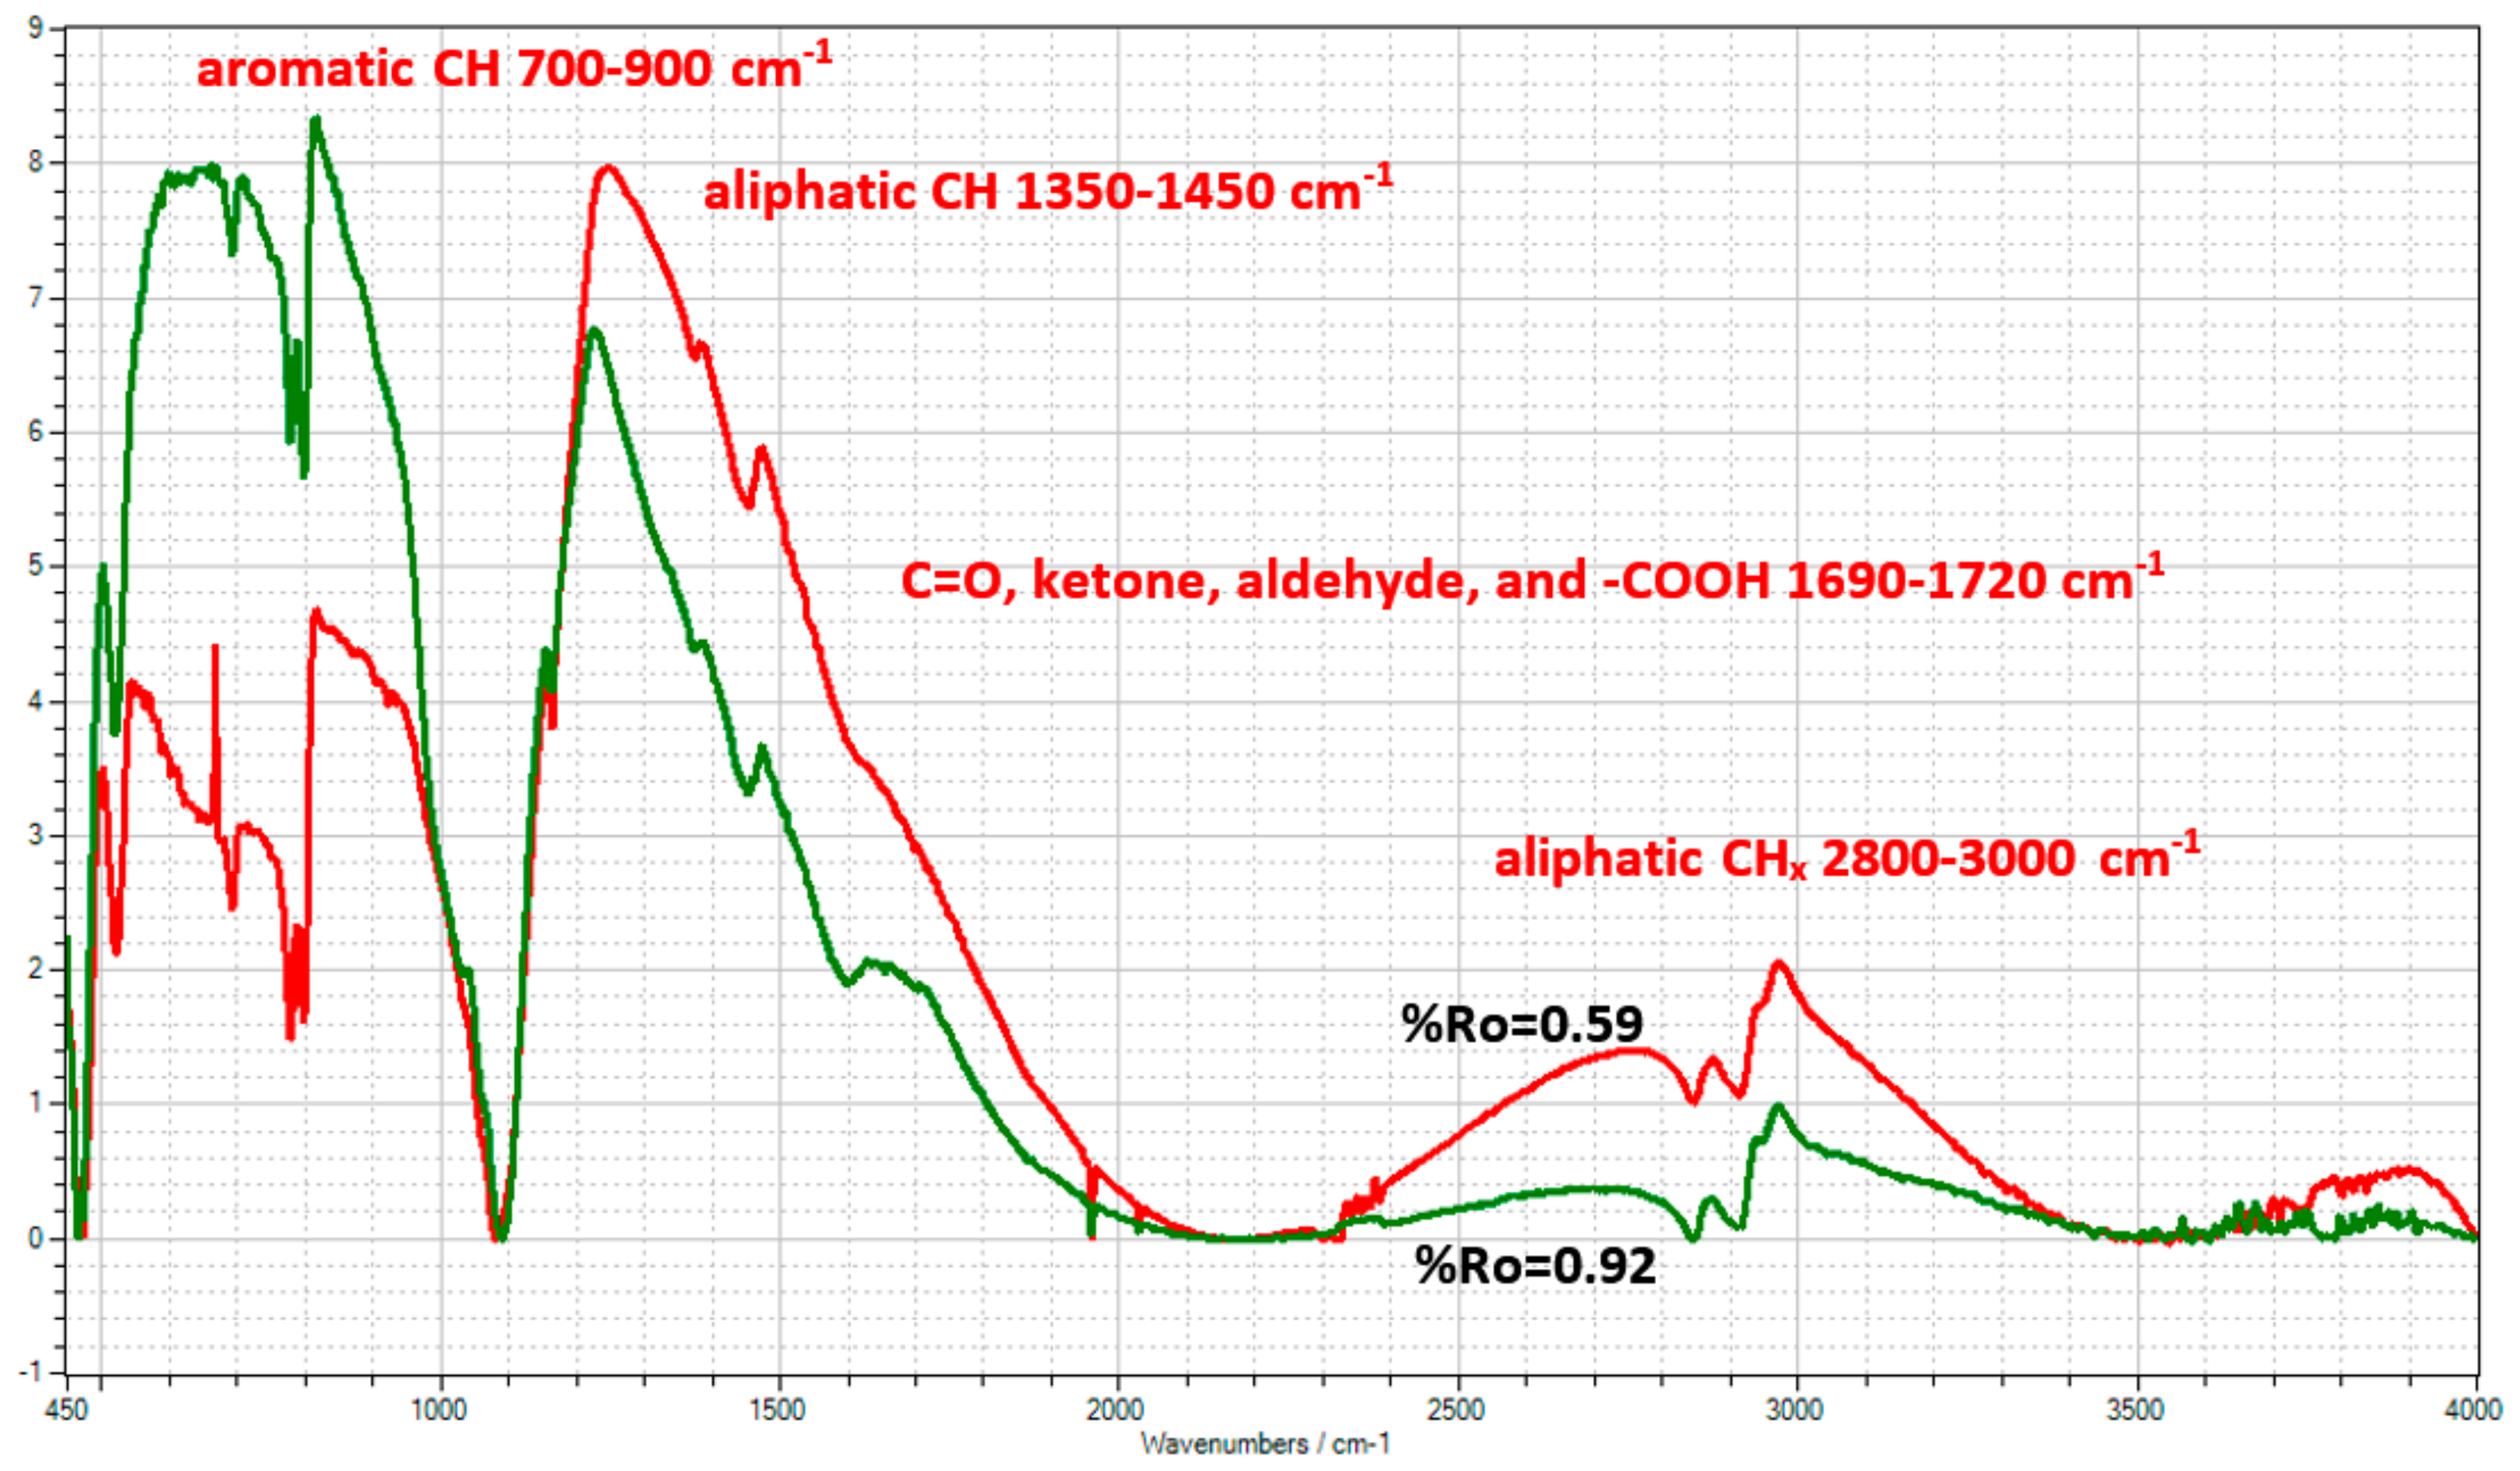
FTIR is an analytical technique to identify chemical compounds in organic materials as a complimentary tool to Raman spectroscopy by measuring the absorption of infrared (IR) light due to the molecular vibrations of the sample. The spectrum of IR absorption is used as a fingerprint of a chemical substance and reports the existing functional groups. The peaks correspond to the frequencies of vibrations and the amplitude is a direct indication of the amount that is present in the material. In our study, Fourier Transform Infrared Spectroscopy (FTIR) was performed on pure kerogen (to avoid the influence of the inorganic mineral matter) from Well B and Well D, which illustrated a qualitative and quantitative change in aromatic and aliphatic content with respect to the maturity. It is important to remember that these two samples have %VRo of 0.59 and %VRo of 0.92, respectively, reflecting lower and higher maturity levels.
In Figure 10, it can be found that sample with %VRo of 0.59 has a higher peak for aliphatic groups, while a sample with %VRo of 0.92 has higher peaks for aromatic carbons.
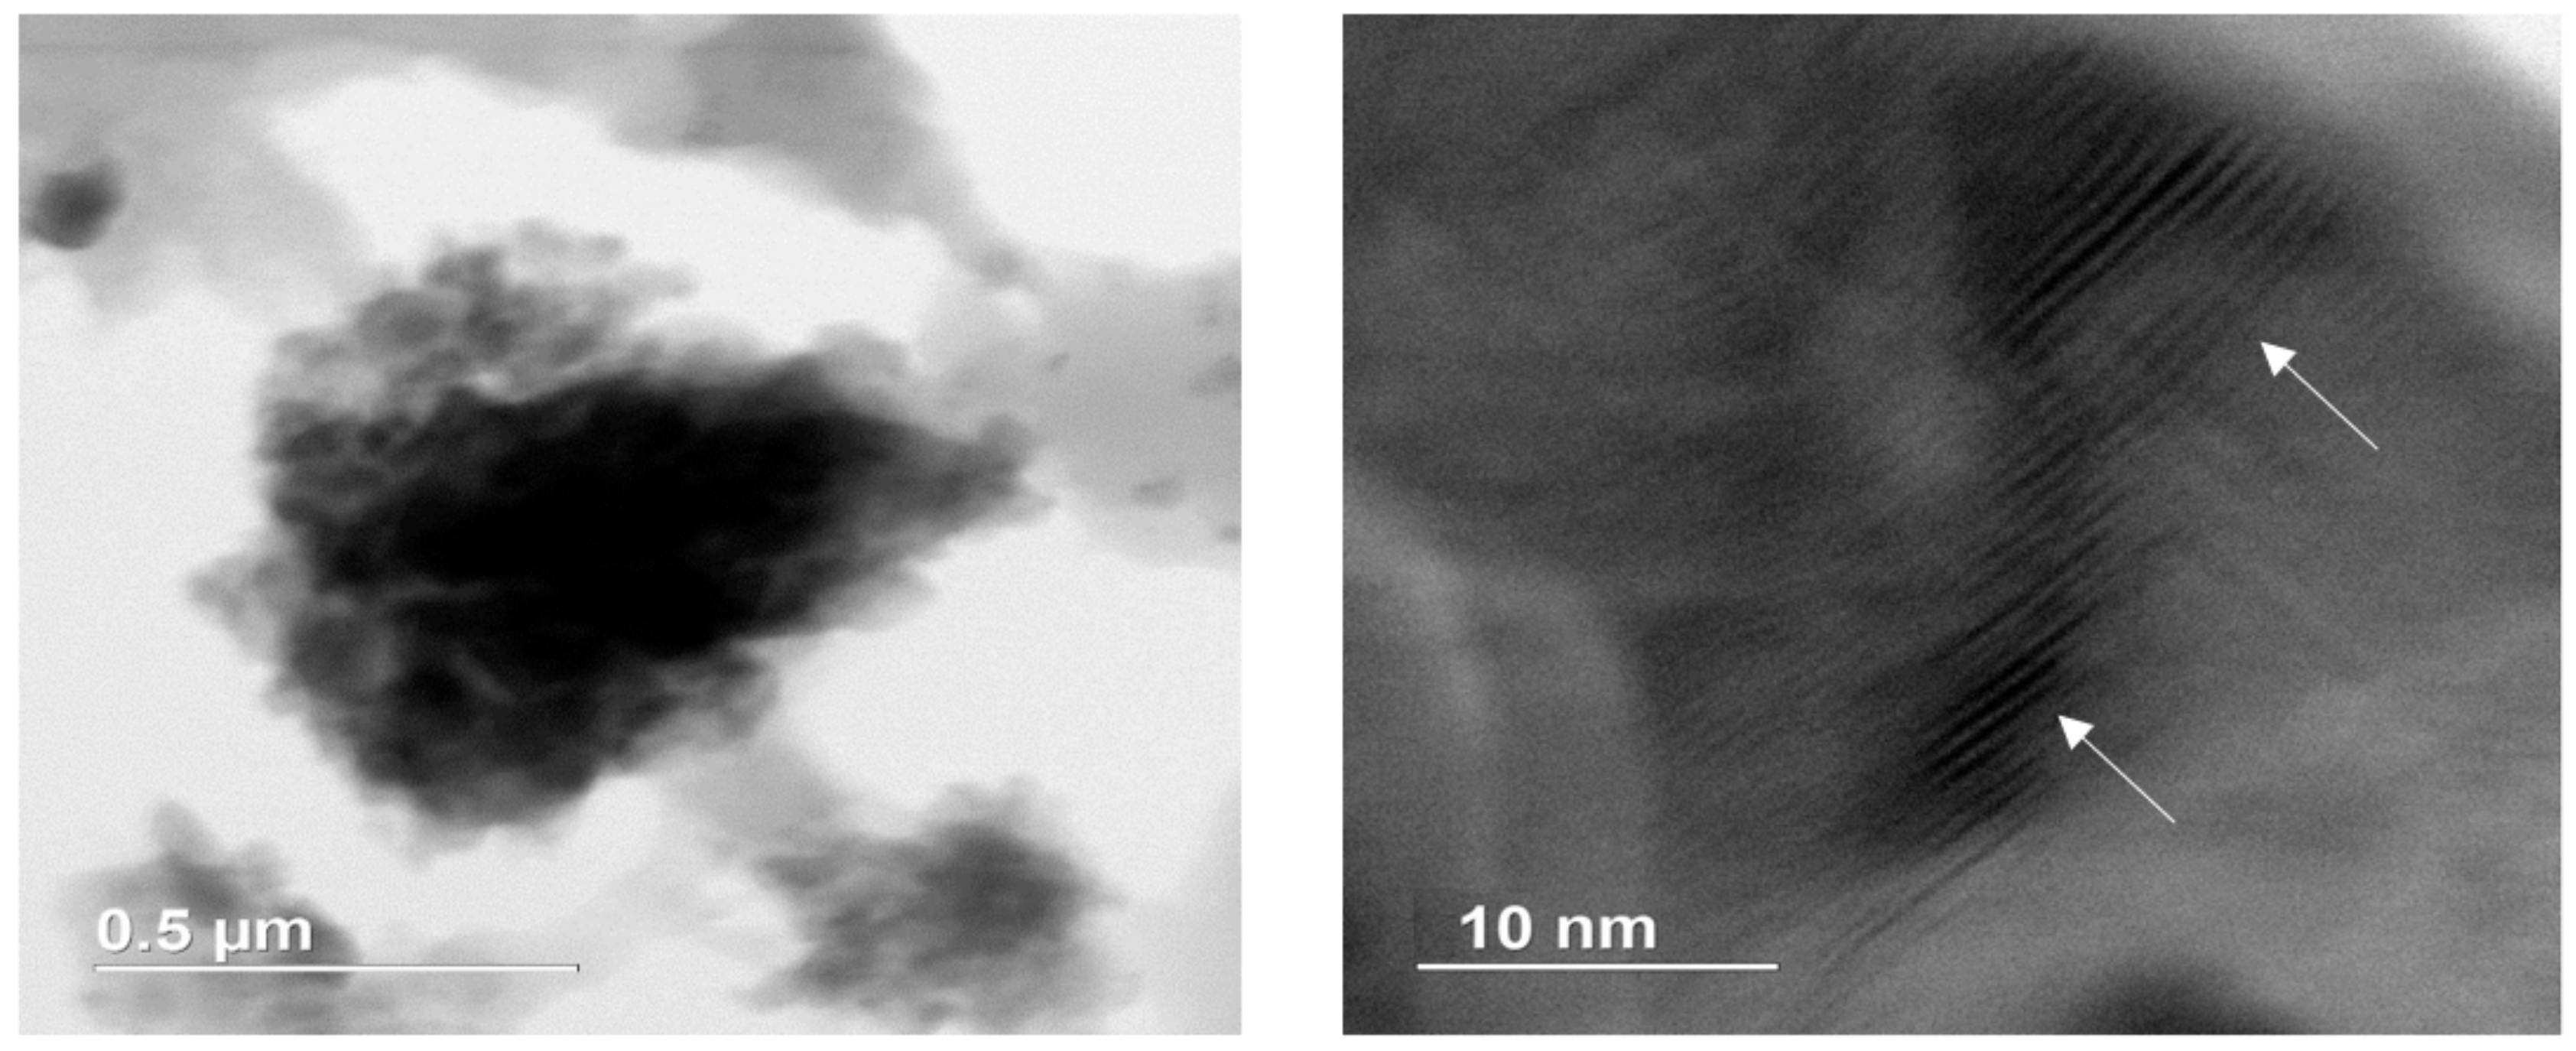
Using high-resolution transmission electronic microscope (TEM) also showed such change in kerogen molecular structure specifically clustering of aromatics [17,77]. Kerogen that was isolated from the sample of Well D, which has the highest maturity, was imaged in a novel approach under Hitachi HD-2300A Dual EDS Cryo STEM (scanning transmission electron microscope), Figure 11. The image revealed the imperfect stacked aromatic layers in the sample with higher maturity. We were not able to capture the same image for lower maturity samples.
Raman spectroscopy can detect such structural change as well, which might have the potential to replace with conventional and bulk methods approaches that are usually exhaustive and time consuming for sample preparation and performing the measurement.
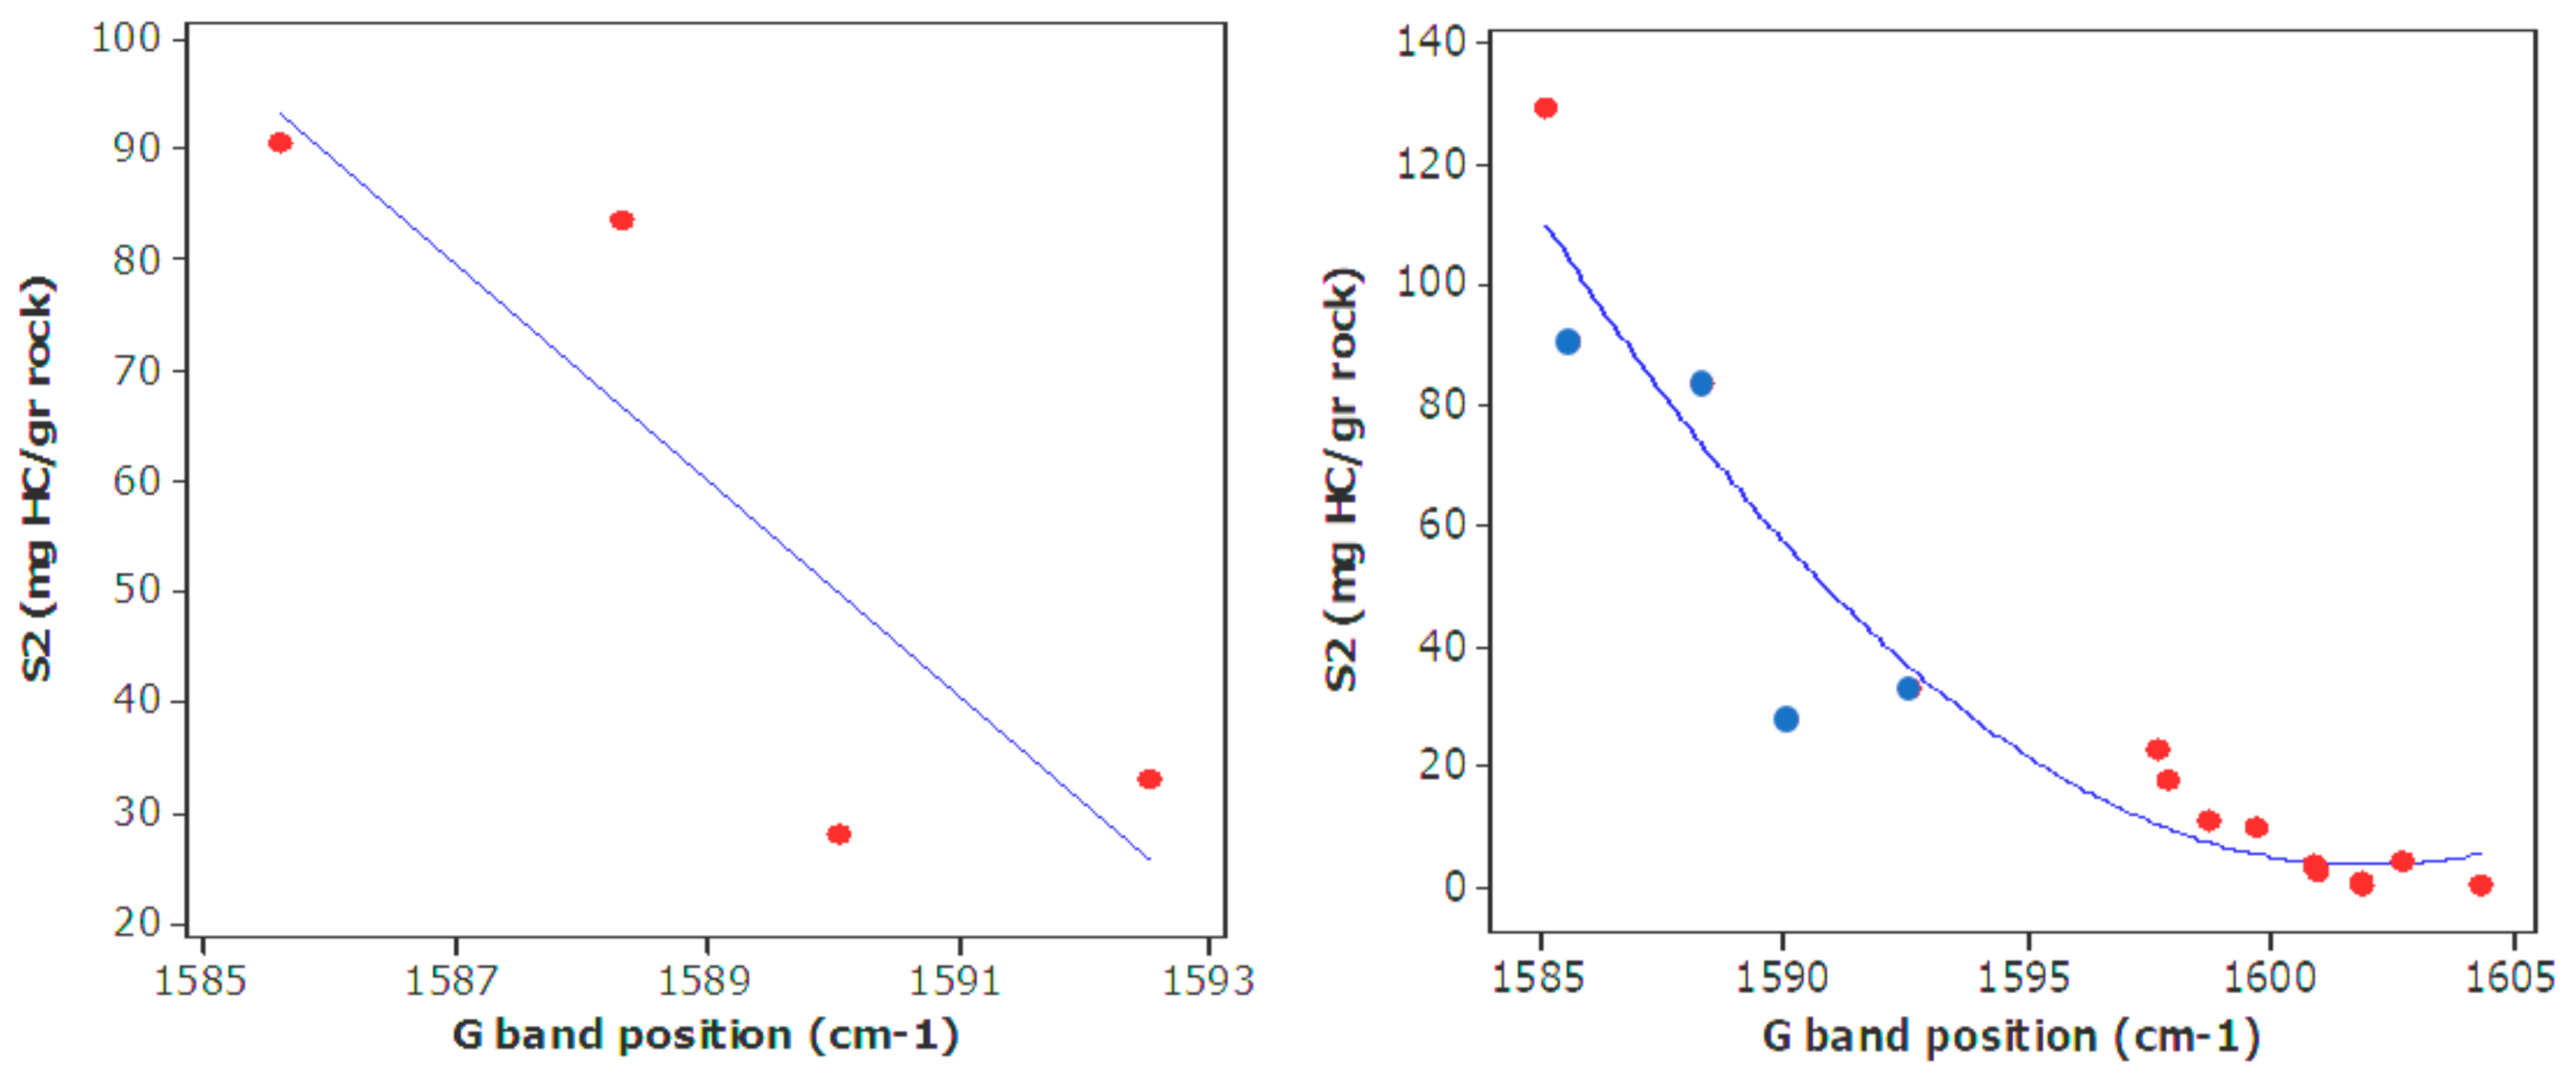
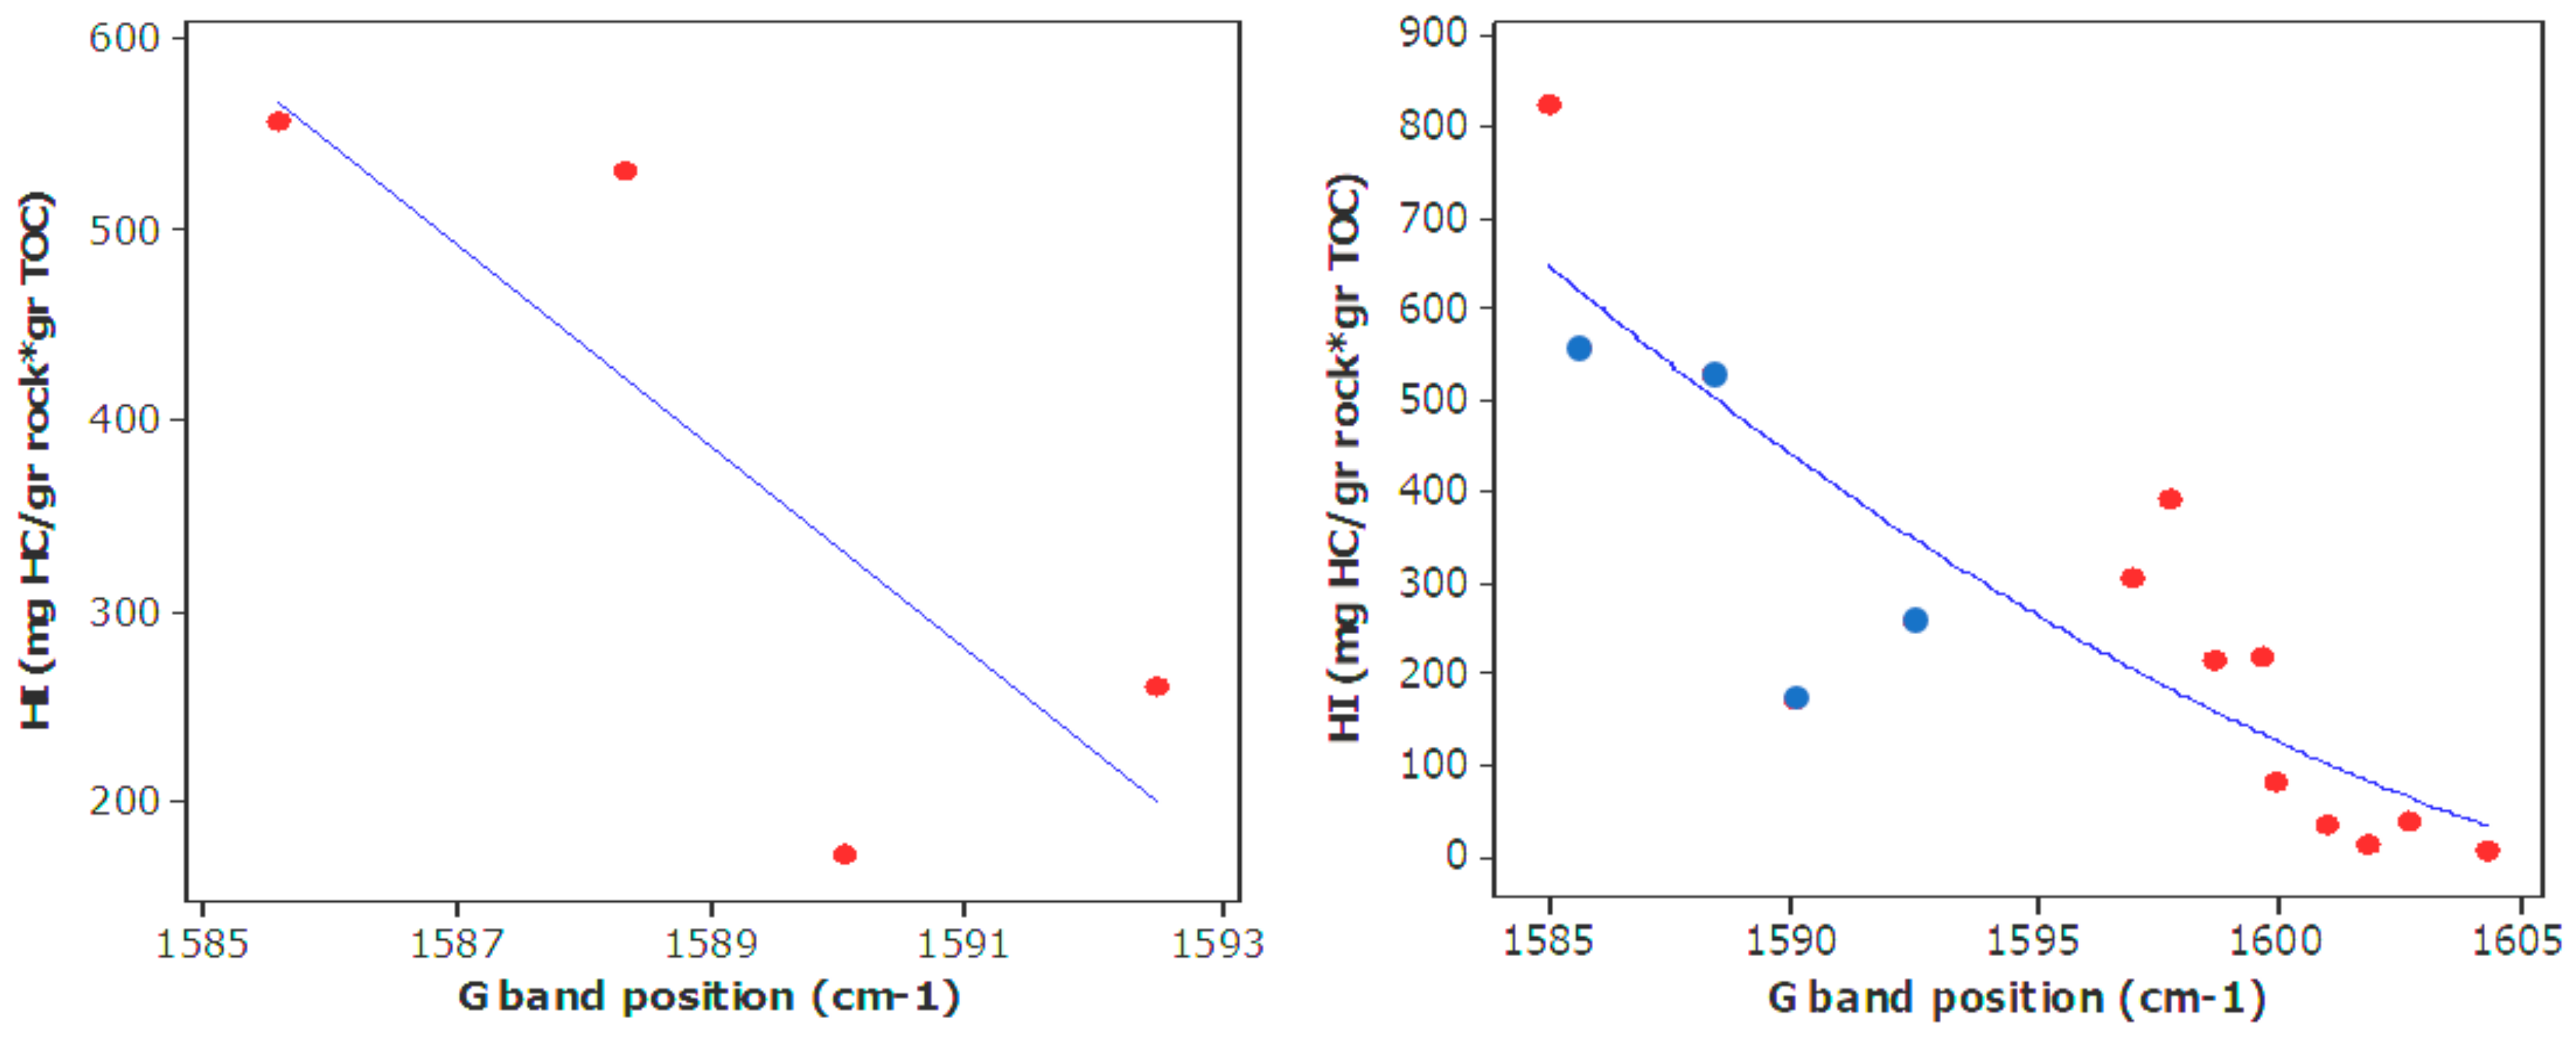
The origin of the G is due to the in-plane E2g vibrational modes of the carbon atoms in aromatic ring structures [5,26,27,28,77]. If the structure of organic matter has high aromatic content, it is corresponding to less potential of hydrocarbon production, thus, S2 can be correlated to the G band as aromatic indicator, Figure 12. As mentioned earlier, it has been shown G band shifts slightly toward higher shifts by increasing maturity concurrent with the increase in aromaticity [15]. The negative correlation between S2 and the G band is a result of this matter.
Furthermore, the abundance of aromatic structures in conjunction with high maturity corresponds to lower hydrogen content [84], Figure 13. Therefore, HI (Hydrogen Index) could be correlated with G band position, Figure 13.
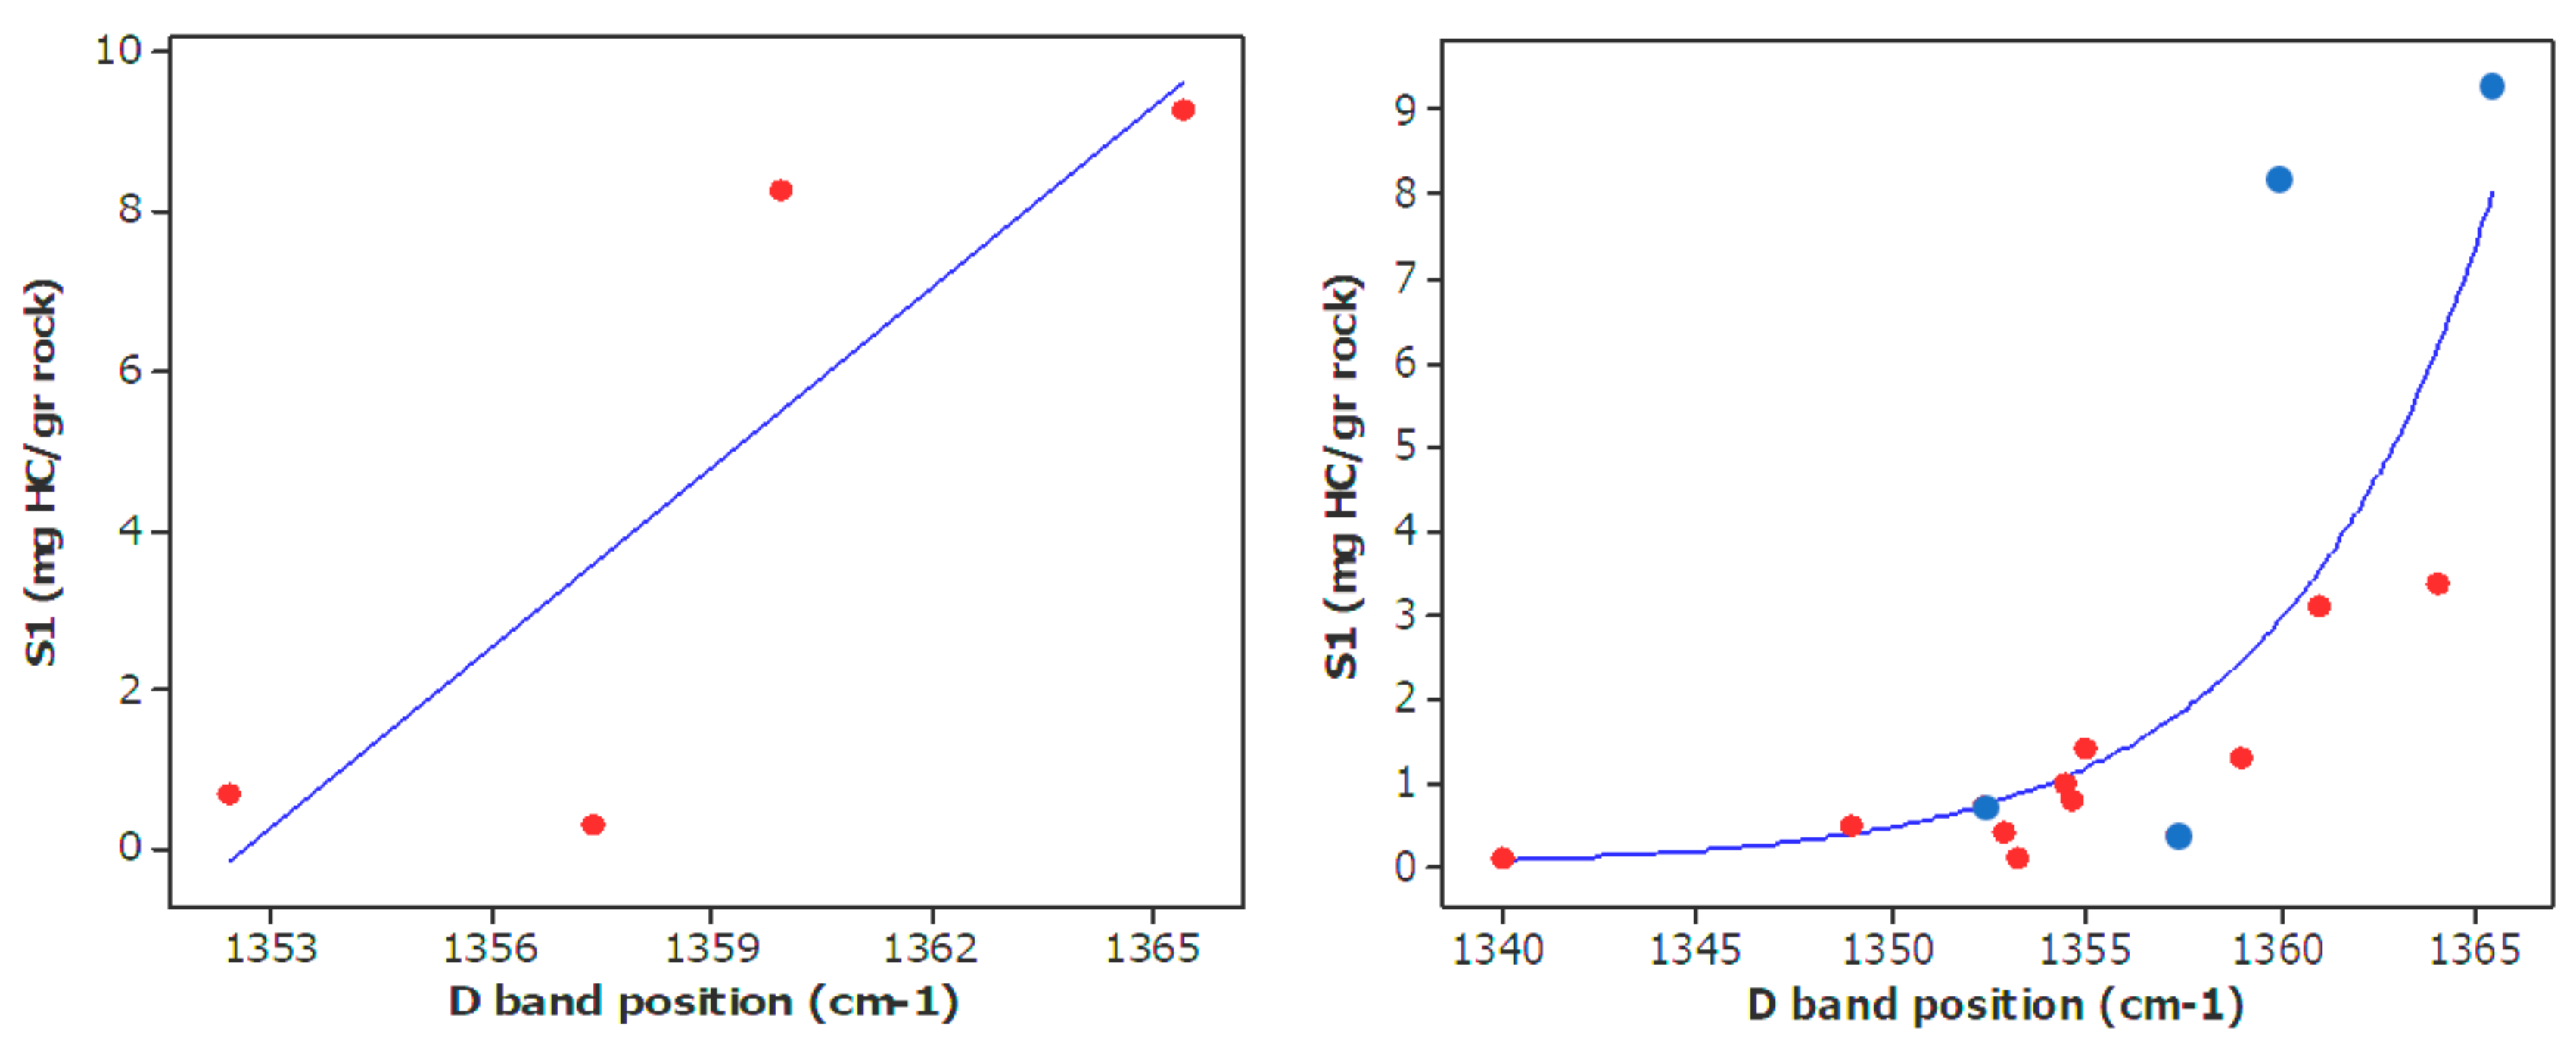
By increasing maturation and consequently hydrocarbon production, the heteroatom-rich OM lose their oxygenated/hydrogenated groups [87,88,89], as a consequence attachment that separate from aromatic carbons increase [27,90]. The D band signals (~1350 cm−1) refers to a disorder in the atoms representing discontinuities and defects of the sp2 carbon network, for instance, as in heteroatoms [5,27]. Consequently, D band can be utilized as an indicator of attachments separated from OM, which is happening throughout hydrocarbon generation. Thus, already generated hydrocarbon (S1) can be correlated with D band, Figure 14. According to previous studies [40,54], when maturity increases, the D band shifts towards lower wavenumber (1370 to 1330 cm−1) and displays lower intensities. This is related to the increase of separating attachments from aromatic groups and transforming the organic matter from disordered state to more ordered molecule [91]. The disappearance of the D band in the uppermost stage of maturity also verifies this phenomenon.
Correlating S1 and S2 with G and D band positions, provides us with a path to correlate the PI from Rock-Eval with PI derived from Raman signals based on the definition of PI (Equation (3)), Figure 15.
Results from this study indicated that the maturation process of organic matter can be described as a nonlinear growth of aromatic clusters thus a disappearance of disordered molecules. Moreover, Raman spectroscopy is directly dependent to the presence of various organic compounds with different structures in the organic matter. This makes it suitable and a good instrument that has the potential to yield significant information about the maturity levels of the organic matter. Having a good insight into the thermal maturity can lead to a better realization of the production potential of the organic matter. Additionally, integration of different analytical methods can assist researchers to study the molecular changes that kerogen will suffer during the maturation process. The results from these studies will improve the efforts to build kerogen models when considering fractions of various carbons at different maturities. Finally, it should be mentioned that Rock-Eval pyrolysis is usually suggested to be done on the samples that were approximately taken every 30 ft. (~10 m) in each well [9]. Certainly, when it comes to the assessment of unconventional targets, closer sample spacing of 3 ft. (~1 m) is suggested to properly identify sweet spots. When considering the huge amount of analysis that is required to study this number of samples, Raman spectroscopy, can be replaced by pyrolysis. Raman spectroscopy is a fast and nondestructive equipment to create the profile of maturity, S1, S2, and PI, and accelerate the analysis with good precision. Moreover, it has been shown that organic matter has a non-negligible effect on hydraulic fracturing of organic rich unconventional reservoirs [91,92,93,94,95,96,97,98], therefore such fast methods to characterize organic matter can be useful in the geomechanical simulation of hydraulic fracturing operations.
This study was a preliminary effort and it was done on a limited number of samples. Specifically, the STEM imaging was done based on a trial and error operation since there are no similar studies or known procedures to follow. We will continue this research by adding more number of samples for pyrolysis, Raman and FTIR. Creating a good database of Gas Chromatograph data is highly recommended and underway in the next project.

5. Conclusions

Samples from four wells in the Bakken Formation were studied using a series of analytical techniques, including Raman spectroscopy, RE pyrolysis, %VRo, and FTIR. Then, we captured aromatic molecules under STEM to confirm our conclusions from these analytical tools. This was done in order to complete a set of information that can provide a precise and fast method to relate molecular structure of kerogen to its maturity and production potential.
Since this study was mainly focused on the applications of Raman spectroscopy to give a better insight into molecular structure of organic matter, thus to avoid possible erroneous Raman signals and to reduce the background noise, the study was performed on isolated kerogen material. This resulted in a better visible signal and more accurate results. Based on this study, we proposed that Raman spectroscopy has a good potential to predict the kerogen maturity, S1, S2, and Productivity index that is normally extracted from Rock-Eval pyrolysis, and give us a better insight about the molecular structure of organic matter. This method suggests a quick but precise approach to understand kerogen production potential, which is necessary to be evaluated for unconventional reservoirs. This study is underway on higher maturity samples with different kerogen types to support our methodology of integrating STEM imaging techniques and Raman spectroscopy.

Author Contributions

Conceptualization, S.K., and M.O.; Methodology, S.K.; Software, D.T.; Validation, M.O.; Formal Analysis, T.G., and H.C.-O.; Investigation, T.G., H.C.-O., and D.T.; Writing-Original Draft Preparation, S.K.; Writing-Review & Editing, S.K., M.O., T.G.; Visualization, H.C.-O.; Supervision, M.O.; Project Administration, M.O.

Conflicts of Interest

This research received no external funding and the authors declare no conflict of interest.

References

  1. Hutton, A.; Bharati, S.; Robl, T. Chemical and petrographic classification of kerogen/macerals. Energy Fuels 1994, 8, 1478–1488. [Google Scholar] [CrossRef]
  2. McCarthy, K.; Rojas, K.; Niemann, M.; Palmowski, D.; Peters, K.; Stankiewicz, A. Basic petroleum geochemistry for source rock evaluation. Oilfield Rev. 2011, 23, 32–43. [Google Scholar]
  3. Wang, Z.; Li, Y.; Liu, H.; Zeng, F.; Guo, P.; Jiang, W. Study on the Adsorption, Diffusion and Permeation Selectivity of Shale Gas in Organics. Energies 2017, 10, 142. [Google Scholar] [CrossRef]
  4. Hackley, P.C.; Araujo, C.V.; Borrego, A.G.; Bouzinos, A.; Cardott, B.J.; Cook, A.C.; Eble, C.; Flores, D.; Gentzis, T.; Gonçalves, P.A. Standardization of reflectance measurements in dispersed organic matter: Results of an exercise to improve interlaboratory agreement. Mar. Pet. Geol. 2015, 59, 22–34. [Google Scholar] [CrossRef]
  5. Sauerer, B.; Craddock, P.R.; AlJohani, M.D.; Alsamadony, K.L.; Abdallah, W. Fast and accurate shale maturity determination by Raman spectroscopy measurement with minimal sample preparation. Int. J. Coal Geol. 2017, 173, 150–157. [Google Scholar] [CrossRef]
  6. Clementz, D.M. Effect of oil and bitumen saturation on source-rock pyrolysis: GEOLOGIC NOTES. AAPG Bull. 1979, 63, 2227–2232. [Google Scholar]
  7. Larter, S.; Douglas, A. A pyrolysis-gas chromatographic method for kerogen typing. Phys. Chem. Earth 1980, 12, 579–583. [Google Scholar] [CrossRef]
  8. Peters, K. Guidelines for evaluating petroleum source rock using programmed pyrolysis. AAPG Bull. 1986, 70, 318–329. [Google Scholar]
  9. Lafargue, E.; Marquis, F.; Pillot, D. Rock-Eval 6 applications in hydrocarbon exploration, production, and soil contamination studies. Rev. L'inst. Fr. Pét. 1998, 53, 421–437. [Google Scholar] [CrossRef]
  10. Behar, F.; Beaumont, V.; Penteado, H.D.B. Rock-Eval 6 technology: Performances and developments. Oil Gas Sci. Technol. 2001, 56, 111–134. [Google Scholar] [CrossRef]
  11. Espitalie, J.; Deroo, G.; Marquis, F. Rock-Eval pyrolysis and its applications. Rev. L'inst. Fr. Pét. 1985, 40, 563–579. [Google Scholar] [CrossRef]
  12. Tissot, B.P.; Welte, D.H. Diagenesis, Catagenesis and Metagenesis of Organic Matter, Petroleum Formation and Occurrence; Springer: Berlin, Germany, 1984; pp. 69–73. [Google Scholar]
  13. Waples, D.W. Organic Geochemistry for Exploration Geologists; Burgess Pub. Co.: Minneapolis, MN, USA, 1981. [Google Scholar]
  14. Tyson, R.V. Abundance of Organic Matter in Sediments: TOC, Hydrodynamic Equivalence, Dilution and Flux Effects, Sedimentary Organic Matter; Springer: Berlin, Germany, 1995; pp. 81–118. [Google Scholar]
  15. Kelemen, S.; Fang, H. Maturity trends in Raman spectra from kerogen and coal. Energy Fuels 2001, 15, 653–658. [Google Scholar] [CrossRef]
  16. Beyssac, O.; Goffé, B.; Chopin, C.; Rouzaud, J. Raman spectra of carbonaceous material in metasediments: A new geothermometer. J. Metamorph. Geol. 2002, 20, 859–871. [Google Scholar] [CrossRef]
  17. Quirico, E.; Rouzaud, J.-N.; Bonal, L.; Montagnac, G. Maturation grade of coals as revealed by Raman spectroscopy: Progress and problems. Spectrochim. Acta Part A Mol. Biomol. Spectrosc. 2005, 61, 2368–2377. [Google Scholar] [CrossRef] [PubMed]
  18. Lahfid, A.; Beyssac, O.; Deville, E.; Negro, F.; Chopin, C.; Goffé, B. Evolution of the Raman spectrum of carbonaceous material in low-grade metasediments of the Glarus Alps (Switzerland). Terra Nova 2010, 22, 354–360. [Google Scholar] [CrossRef]
  19. Guedes, A.; Valentim, B.; Prieto, A.; Noronha, F. Raman spectroscopy of coal macerals and fluidized bed char morphotypes. Fuel 2012, 97, 443–449. [Google Scholar] [CrossRef]
  20. Hinrichs, R.; Brown, M.T.; Vasconcellos, M.A.; Abrashev, M.V.; Kalkreuth, W. Simple procedure for an estimation of the coal rank using micro-Raman spectroscopy. Int. J. Coal Geol. 2014, 136, 52–58. [Google Scholar] [CrossRef]
  21. Wilkins, R.W.; Boudou, R.; Sherwood, N.; Xiao, X. Thermal maturity evaluation from inertinites by Raman spectroscopy: The ‘RaMM’technique. Int. J. Coal Geol. 2014, 128, 143–152. [Google Scholar] [CrossRef]
  22. Zhou, Q.; Xiao, X.; Pan, L.; Tian, H. The relationship between micro-Raman spectral parameters and reflectance of solid bitumen. Int. J. Coal Geol. 2014, 121, 19–25. [Google Scholar] [CrossRef]
  23. Lünsdorf, N.K. Raman spectroscopy of dispersed vitrinite—Methodical aspects and correlation with reflectance. Int. J. Coal Geol. 2016, 153, 75–86. [Google Scholar] [CrossRef]
  24. Mumm, A.S.; İnan, S. Microscale organic maturity determination of graptolites using Raman spectroscopy. Int. J. Coal Geol. 2016, 162, 96–107. [Google Scholar] [CrossRef]
  25. Ferralis, N.; Matys, E.D.; Knoll, A.H.; Hallmann, C.; Summons, R.E. Rapid, direct and non-destructive assessment of fossil organic matter via microRaman spectroscopy. Carbon 2016, 108, 440–449. [Google Scholar] [CrossRef]
  26. Khatibi, S.; Ostadhassan, M.; Tuschel, D.; Gentzis, T.; Bubach, B.; Carvajal-Ortiz, H. Raman spectroscopy to study thermal maturity and elastic modulus of kerogen. Int. J. Coal Geol. 2018, 185, 103–118. [Google Scholar] [CrossRef]
  27. Khatibi, S.; Ostadhassan, M.; Aghajanpour, A. Raman spectroscopy: An analytical tool for evaluating organic matter. J. Oil Gas Petrochem. Sci. 2018, 1, 28–33. [Google Scholar]
  28. Beyssac, O.; Goffé, B.; Petitet, J.-P.; Froigneux, E.; Moreau, M.; Rouzaud, J.-N. On the characterization of disordered and heterogeneous carbonaceous materials by Raman spectroscopy. Spectrochim. Acta Part A Mol. Biomol. Spectrosc. 2003, 59, 2267–2276. [Google Scholar] [CrossRef]
  29. LeFever, J.A. History of Oil Production from the Bakken Formation, North Dakota. 1991. Available online: http://archives.datapages.com/data/mgs/mt/data/0045/0003/0003.html (accessed on 30 May 2018).
  30. Smith, M.G.; Bustin, R.M. Late Devonian and Early Mississippian Bakken and Exshaw black shale source rocks, Western Canada Sedimentary Basin: A sequence stratigraphic interpretation. AAPG Bull. 2000, 84, 940–960. [Google Scholar]
  31. Parapuram, G.; Mokhtari, M.; Ben Hmida, J. An Artificially Intelligent Technique to Generate Synthetic Geomechanical Well Logs for the Bakken Formation. Energies 2018, 11, 680. [Google Scholar] [CrossRef]
  32. Webster, R.L. Petroleum Source Rocks and Stratigraphy of the Bakken Formation in North Dakota; AAPG/Datapages: Tulsa, OK, USA, 1984. [Google Scholar]
  33. Smith, M.G.; Bustin, R.M. Sedimentology of the Late Devonian and Early Mississippian Bakken Formation, Williston Basin; Williston Basin Symposium; AAPG/Datapages: Tulsa, OK, USA, 1995. [Google Scholar]
  34. Liu, K.; Ostadhassan, M.; Gentzis, T.; Carvajal-Ortiz, H.; Bubach, B. Characterization of geochemical properties and microstructures of the Bakken Shale in North Dakota. Int. J. Coal Geol. 2018, 190, 84–98. [Google Scholar] [CrossRef]
  35. Sonnenberg, S.A.; Pramudito, A. Petroleum geology of the giant Elm Coulee field, Williston Basin. AAPG Bull. 2009, 93, 1127–1153. [Google Scholar] [CrossRef]
  36. Jin, H.; Sonnenbergy, S.A. Characterization for source rock potential of the Bakken Shales in the Williston Basin, North Dakota and Montana. In Proceedings of the Unconventional Resources Technology Conference (URTEC), Denver, CO, USA, 12–14 August 2013. [Google Scholar]
  37. Gaswirth, S.B.; Marra, K.R.; Cook, T.A.; Charpentier, R.R.; Gautier, D.L.; Higley, D.K.; Klett, T.R.; Lewan, M.D.; Lillis, P.G.; Schenk, C.J. Assessment of Undiscovered Oil Resources in the Bakken and Three Forks Formations, Williston Basin Province, Montana, North Dakota, and South Dakota, 2013; US Geological Survey: Reston, VA, USA, 2013. [Google Scholar]
  38. Jacob, H. Classification, structure, genesis and practical importance of natural solid oil bitumen (“migrabitumen”). Int. J. Coal Geol. 1989, 11, 65–79. [Google Scholar] [CrossRef]
  39. Jarvie, D.; Claxton, B.; Henk, B.; Breyer, J. Oil and shale gas from Barnett shale, Ft. Worth Basin, TX. In Proceedings of the AAPG National Convention, Denver, CO, USA, 3–6 June 2001. [Google Scholar]
  40. Schito, A.; Romano, C.; Corrado, S.; Grigo, D.; Poe, B. Diagenetic thermal evolution of organic matter by Raman spectroscopy. Org. Geochem. 2017, 106, 57–67. [Google Scholar] [CrossRef]
  41. Robl, T.L.; Davis, B.H. Comparison of the HF-HCl and HF-BF3 maceration techniques and the chemistry of resultant organic concentrates. Org. Geochem. 1993, 20, 249–255. [Google Scholar] [CrossRef]
  42. Schimmelmann, A.; Lewan, M.D.; Wintsch, R.P. D/H isotope ratios of kerogen, bitumen, oil, and water in hydrous pyrolysis of source rocks containing kerogen types I, II, IIS, and III. Geochim. Cosmochim. Acta 1999, 63, 3751–3766. [Google Scholar] [CrossRef]
  43. Amer, M. Raman Spectroscopy for Soft Matter Applications; John Wiley & Sons: Hoboken, NJ, USA, 2009. [Google Scholar]
  44. Tuinstra, F.; Koenig, J.L. Raman spectrum of graphite. J. Chem. Phys. 1970, 53, 1126–1130. [Google Scholar] [CrossRef]
  45. Wang, Y.; Alsmeyer, D.C.; McCreery, R.L. Raman spectroscopy of carbon materials: Structural basis of observed spectra. Chem. Mater. 1990, 2, 557–563. [Google Scholar] [CrossRef]
  46. Reich, S.; Thomsen, C. Raman spectroscopy of graphite. Philos. Trans. R. Soc. Lond. A: Math. Phys. Eng. Sci. 2004, 362, 2271–2288. [Google Scholar] [CrossRef] [PubMed]
  47. Cesare, B.; Maineri, C. Fluid-present anatexis of metapelites at El Joyazo (SE Spain): Constraints from Raman spectroscopy of graphite. Contrib. Mineral. Petrol. 1999, 135, 41–52. [Google Scholar] [CrossRef]
  48. Marshall, C.P.; Edwards, H.G.; Jehlicka, J. Understanding the application of Raman spectroscopy to the detection of traces of life. Astrobiology 2010, 10, 229–243. [Google Scholar] [CrossRef] [PubMed]
  49. Tuschel, D. Raman spectroscopy of oil shale. Spectroscopy 2013, 28, 5. [Google Scholar]
  50. Huang, E.-P.; Huang, E.; Yu, S.-C.; Chen, Y.-H.; Lee, J.-S.; Fang, J.-N. In situ Raman spectroscopy on kerogen at high temperatures and high pressures. Phys. Chem. Miner. 2010, 37, 593–600. [Google Scholar] [CrossRef]
  51. Marshall, C.P.; Love, G.D.; Snape, C.E.; Hill, A.C.; Allwood, A.C.; Walter, M.R.; Van Kranendonk, M.J.; Bowden, S.A.; Sylva, S.P.; Summons, R.E. Structural characterization of kerogen in 3.4 Ga Archaean cherts from the Pilbara Craton, Western Australia. Precambrian Res. 2007, 155, 1–23. [Google Scholar] [CrossRef]
  52. Lünsdorf, N.K.; Dunkl, I.; Schmidt, B.C.; Rantitsch, G.; Eynatten, H. Towards a higher comparability of geothermometric data obtained by Raman spectroscopy of carbonaceous material. Part I: Evaluation of biasing factors. Geostand. Geoanal. Res. 2014, 38, 73–94. [Google Scholar] [CrossRef]
  53. Spötl, C.; Houseknecht, D.W.; Jaques, R.C. Kerogen maturation and incipient graphitization of hydrocarbon source rocks in the Arkoma Basin, Oklahoma and Arkansas: A combined petrographic and Raman spectrometric study. Org. Geochem. 1998, 28, 535–542. [Google Scholar] [CrossRef]
  54. Ferrari, A.C.; Robertson, J. Interpretation of Raman spectra of disordered and amorphous carbon. Phys. Rev. B 2000, 61, 14095. [Google Scholar] [CrossRef]
  55. Guedes, A.; Valentim, B.; Prieto, A.; Rodrigues, S.; Noronha, F. Micro-Raman spectroscopy of collotelinite, fusinite and macrinite. Int. J. Coal Geol. 2010, 83, 415–422. [Google Scholar] [CrossRef]
  56. Ostadhassan, M.; Liu, K.; Li, C.; Khatibi, S. Fine Scale Characterization of Shale Reservoirs: Methods and Challenges; Springer: Berlin, Germany, 2018. [Google Scholar]
  57. Gao, Y.; Zou, Y.-R.; Liang, T.; Peng, P.A. Jump in the structure of Type I kerogen revealed from pyrolysis and 13C DP MAS NMR. Org. Geochem. 2017, 112, 105–118. [Google Scholar] [CrossRef]
  58. Baudin, F.; Disnar, J.-R.; Aboussou, A.; Savignac, F. Guidelines for Rock–Eval analysis of recent marine sediments. Org. Geochem. 2015, 86, 71–80. [Google Scholar] [CrossRef] [Green Version]
  59. Laughrey, C.; Kostelnik, J.; Harper, J.; Carter, K. The Pennsylvania Petroleum Source Rock Geochemistry Database. 2013. Available online: https://edx.netl.doe.gov/dataset/the-pennsylvania-petroleum-source-rock-geochemistry-database (accessed on 30 May 2018).
  60. Ma, Y.Z.; Holditch, S. Unconventional Oil and Gas Resources Handbook: Evaluation and Development; Gulf Professional Publishing: Houston, TX, USA, 2015. [Google Scholar]
  61. Wopenka, B.; Pasteris, J.D. Structural characterization of kerogens to granulite-facies graphite: Applicability of Raman microprobe spectroscopy. Am. Mineral. 1993, 78, 533–557. [Google Scholar]
  62. Jehlicka, J.; Urban, O.; Pokorný, J. Raman spectroscopy of carbon and solid bitumens in sedimentary and metamorphic rocks. Spectrochim. Acta Part A Mol. Biomol. Spectrosc. 2003, 59, 2341–2352. [Google Scholar] [CrossRef]
  63. Dennis, L.W.; Maciel, G.E.; Hatcher, P.G.; Simoneit, B.R. 13 C Nuclear magnetic resonance studies of kerogen from Cretaceous black shales thermally altered by basaltic intrusions and laboratory simulations. Geochim. Cosmochim. Acta 1982, 46, 901–907. [Google Scholar] [CrossRef]
  64. Saxby, J.; Stephenson, L. Effect of anigneous intrusion on oil shale at Rundle (Australia). Chem. Geol. 1987, 63, 1–16. [Google Scholar] [CrossRef]
  65. Kuangzong, Q.; Deyu, C.; Zhanguang, L. A new method to estimate the oil and gas potentials of coals and kerogens by solid state 13C NMR spectroscopy. Org. Geochem. 1991, 17, 865–872. [Google Scholar] [CrossRef]
  66. Patience, R.; Mann, A.; Poplett, I. Determination of molecular structure of kerogens using 13C NMR spectroscopy: II. The effects of thermal maturation on kerogens from marine sediments. Geochim. Cosmochim. Acta 1992, 56, 2725–2742. [Google Scholar] [CrossRef]
  67. Wei, Z.; Gao, X.; Zhang, D.; Da, J. Assessment of thermal evolution of kerogen geopolymers with their structural parameters measured by solid-state 13C NMR spectroscopy. Energy Fuels 2005, 19, 240–250. [Google Scholar] [CrossRef]
  68. Clough, A.; Sigle, J.L.; Jacobi, D.; Sheremata, J.; White, J.L. Characterization of Kerogen and Source Rock Maturation Using Solid-State NMR Spectroscopy. Energy Fuels 2015, 29, 6370–6382. [Google Scholar] [CrossRef]
  69. Miknis, F. NMR studies of solid fossil fuels. Magn. Reson. Rev. 1982, 7, 87–121. [Google Scholar]
  70. Barwise, A.; Mann, A.; Eglinton, G.; Gowar, A.; Wardroper, A.; Gutteridge, C. Kerogen characterisation by 13C NMR spectroscopy and pyrolysis-mass spectrometry. Org. Geochem. 1984, 6, 343–349. [Google Scholar] [CrossRef]
  71. Solli, H.; Van Graas, G.; Leplat, P.; Krane, J. Analysis of kerogens of miocene shales in a homogenous sedimentary column. A study of maturation using flash pyrolysis techniques and carbon-13 CP-MAS NMR. Org. Geochem. 1984, 6, 351–358. [Google Scholar] [CrossRef]
  72. Witte, E.; Schenk, H.; Müller, P.; Schwochau, K. Structural modifications of kerogen during natural evolution as derived from 13C CP/MAS NMR, IR spectroscopy and Rock-Eval pyrolysis of Toarcian shales. Org. Geochem. 1988, 13, 1039–1044. [Google Scholar] [CrossRef]
  73. Miknis, F.P.; Smith, J.W. An NMR survey of United States oil shales. Org. Geochem. 1984, 5, 193–201. [Google Scholar] [CrossRef]
  74. Hagaman, E.W.; Cronauer, D.C.; Schell, F.M. Oil-shale analysis by CP/MAS-13C NMR spectroscopy. Fuel 1984, 63, 915–919. [Google Scholar] [CrossRef]
  75. Schenk, H.; Witte, E.; Müller, P.; Schwochau, K. Infrared estimates of aliphatic kerogen carbon in sedimentary rocks. Org. Geochem. 1986, 10, 1099–1104. [Google Scholar] [CrossRef]
  76. Orr, W. Comments on pyrolytic hydrocarbon yields in source-rock evaluation. Adv. Org. Geochem. 1981, 1981, 775–787. [Google Scholar]
  77. Beyssac, O.; Rouzaud, J.-N.; Goffé, B.; Brunet, F.; Chopin, C. Graphitization in a high-pressure, low-temperature metamorphic gradient: A Raman microspectroscopy and HRTEM study. Contrib. Miner. Petrol. 2002, 143, 19–31. [Google Scholar] [CrossRef]
  78. Painter, P.C.; Snyder, R.W.; Starsinic, M.; Coleman, M.M.; Kuehn, D.W.; Davis, A. Concerning the application of FT-IR to the study of coal: A critical assessment of band assignments and the application of spectral analysis programs. Appl. Spectrosc. 1981, 35, 475–485. [Google Scholar] [CrossRef]
  79. Solomon, P.R.; Carangelo, R.M. FT-ir analysis of coal: 2. Aliphatic and aromatic hydrogen concentration. Fuel 1988, 67, 949–959. [Google Scholar] [CrossRef]
  80. Chen, J.; Luo, P.; Li, J. Using kerogen FTIR parameters for determination of organic facies. Chin. Sci. Bull. 1998, 43, 681–684. [Google Scholar] [CrossRef]
  81. Painter, P.; Starsinic, M.; Coleman, M. Determination of functional groups in coal by Fourier transform interferometry. Fourier Transform Infrared Spectrosc. 2012, 4, 169–240. [Google Scholar]
  82. Chen, Y.; Zou, C.; Mastalerz, M.; Hu, S.; Gasaway, C.; Tao, X. Applications of micro-Fourier transform infrared spectroscopy (FTIR) in the geological sciences—A review. Int. J. Mol. Sci. 2015, 16, 30223–30250. [Google Scholar] [CrossRef] [PubMed]
  83. Craddock, P.R.; Le Doan, T.V.; Bake, K.; Polyakov, M.; Charsky, A.M.; Pomerantz, A.E. Evolution of kerogen and bitumen during thermal maturation via semi-open pyrolysis investigated by infrared spectroscopy. Energy Fuels 2015, 29, 2197–2210. [Google Scholar] [CrossRef]
  84. Van Krevelen, D. Coal: Typology-Physics-Chemistry-Composition; Elsevier: Amsterdam, The Netherlands, 1993. [Google Scholar]
  85. Cheshire, S.; Craddock, P.R.R.; Xu, G.; Sauerer, B.; Pomerantz, A.E.E.; McCormick, D.; Abdallah, W. Assessing thermal maturity beyond the reaches of vitrinite reflectance and Rock-Eval pyrolysis: A case study from the Silurian Qusaiba formation. Int. J. Coal Geol. 2017, 180, 29–45. [Google Scholar] [CrossRef]
  86. Craddock, P.R.R.; Prange, M.; & Pomerantz, A.E. Kerogen thermal maturity and content of organic-rich mudrocks determined using stochastic linear regression models applied to diffuse reflectance IR Fourier transform spectroscopy (DRIFTS). Org. Geochem. 2017, 110, 122–133. [Google Scholar] [CrossRef]
  87. Oberlin, A.; Boulmier, J.; Villey, M. Electron microscopic study of kerogen microtexture. Selected criteria for determining the evolution path and evolution stage of kerogen. In Kerogen: Insoluble Organic Matter from Sedimentary Rocks; Editions Technip: Paris, France, 1980; pp. 191–241. [Google Scholar]
  88. Oberlin, A. High-resolution TEM studies of carbonization and graphitization. Chem. Phys. Carbon 1989, 22, 1–143. [Google Scholar]
  89. Rouzaud, J.; Oberlin, A. Structure, microtexture, and optical properties of anthracene and saccharose-based carbons. Carbon 1989, 27, 517–529. [Google Scholar] [CrossRef]
  90. Kelemen, S.; Afeworki, M.; Gorbaty, M.; Sansone, M.; Kwiatek, P.; Walters, C.; Freund, H.; Siskin, M.; Bence, A.; Curry, D. Direct characterization of kerogen by X-ray and solid-state 13C nuclear magnetic resonance methods. Energy Fuels 2007, 21, 1548–1561. [Google Scholar] [CrossRef]
  91. Khatibi, S.; Aghajanpour, A.; Ostadhassan, M.; Ghanbari, E.; Amirian, E.; Mohammed, R. Evaluating the Impact of Mechanical Properties of Kerogen on Hydraulic Fracturing of Organic Rich Formations. In Proceedings of the SPE Canada Unconventional Resources Conference, Calgary, AB, Canada, 13–14 March 2018; Society of Petroleum Engineers: Houston, TX, USA, 2018. [Google Scholar]
  92. Zhu, W.; Chang, X.; Wang, Y.; Zhai, H.; Yao, Z. Reconstruction of Hydraulic Fractures Using Passive Ultrasonic Travel-Time Tomography. Energies 2018, 11, 1–17. [Google Scholar] [CrossRef]
  93. He, J.; Lin, C.; Li, X.; Wan, X. Experimental investigation of crack extension patterns in hydraulic fracturing with shale, sandstone and granite cores. Energies 2016, 9, 1018. [Google Scholar] [CrossRef]
  94. He, J.; Afolagboye, L.O.; Lin, C.; Wan, X. An Experimental Investigation of Hydraulic Fracturing in Shale Considering Anisotropy and Using Freshwater and Supercritical CO2. Energies 2018, 11, 557. [Google Scholar] [CrossRef]
  95. Wu, Y.; Li, X.; He, J.; Zheng, B. Mechanical properties of longmaxi black organic-rich shale samples from south china under uniaxial and triaxial compression states. Energies 2016, 9, 1088. [Google Scholar] [CrossRef]
  96. Zhao, Z.; Li, X.; Wang, Y.; Zheng, B.; Zhang, B. A Laboratory Study of the Effects of Interbeds on Hydraulic Fracture Propagation in Shale Formation. Energies 2016, 9, 556. [Google Scholar] [CrossRef]
  97. Zhai, H.; Chang, X.; Wang, Y.; Xue, Z.; Lei, X.; Zhang, Y. Sensitivity Analysis of Seismic Velocity and Attenuation Variations for Longmaxi Shale during Hydraulic Fracturing Testing in Laboratory. Energies 2017, 10, 1393. [Google Scholar] [CrossRef]
  98. Song, J.; Yang, Y.S.; Liu, Z.Q.; Li, X. Macro and Micro Properties of Organic Matter in Hydraulic Mud Consolidation. J. Mar. Sci. Eng. 2018, 6, 22. [Google Scholar] [CrossRef]
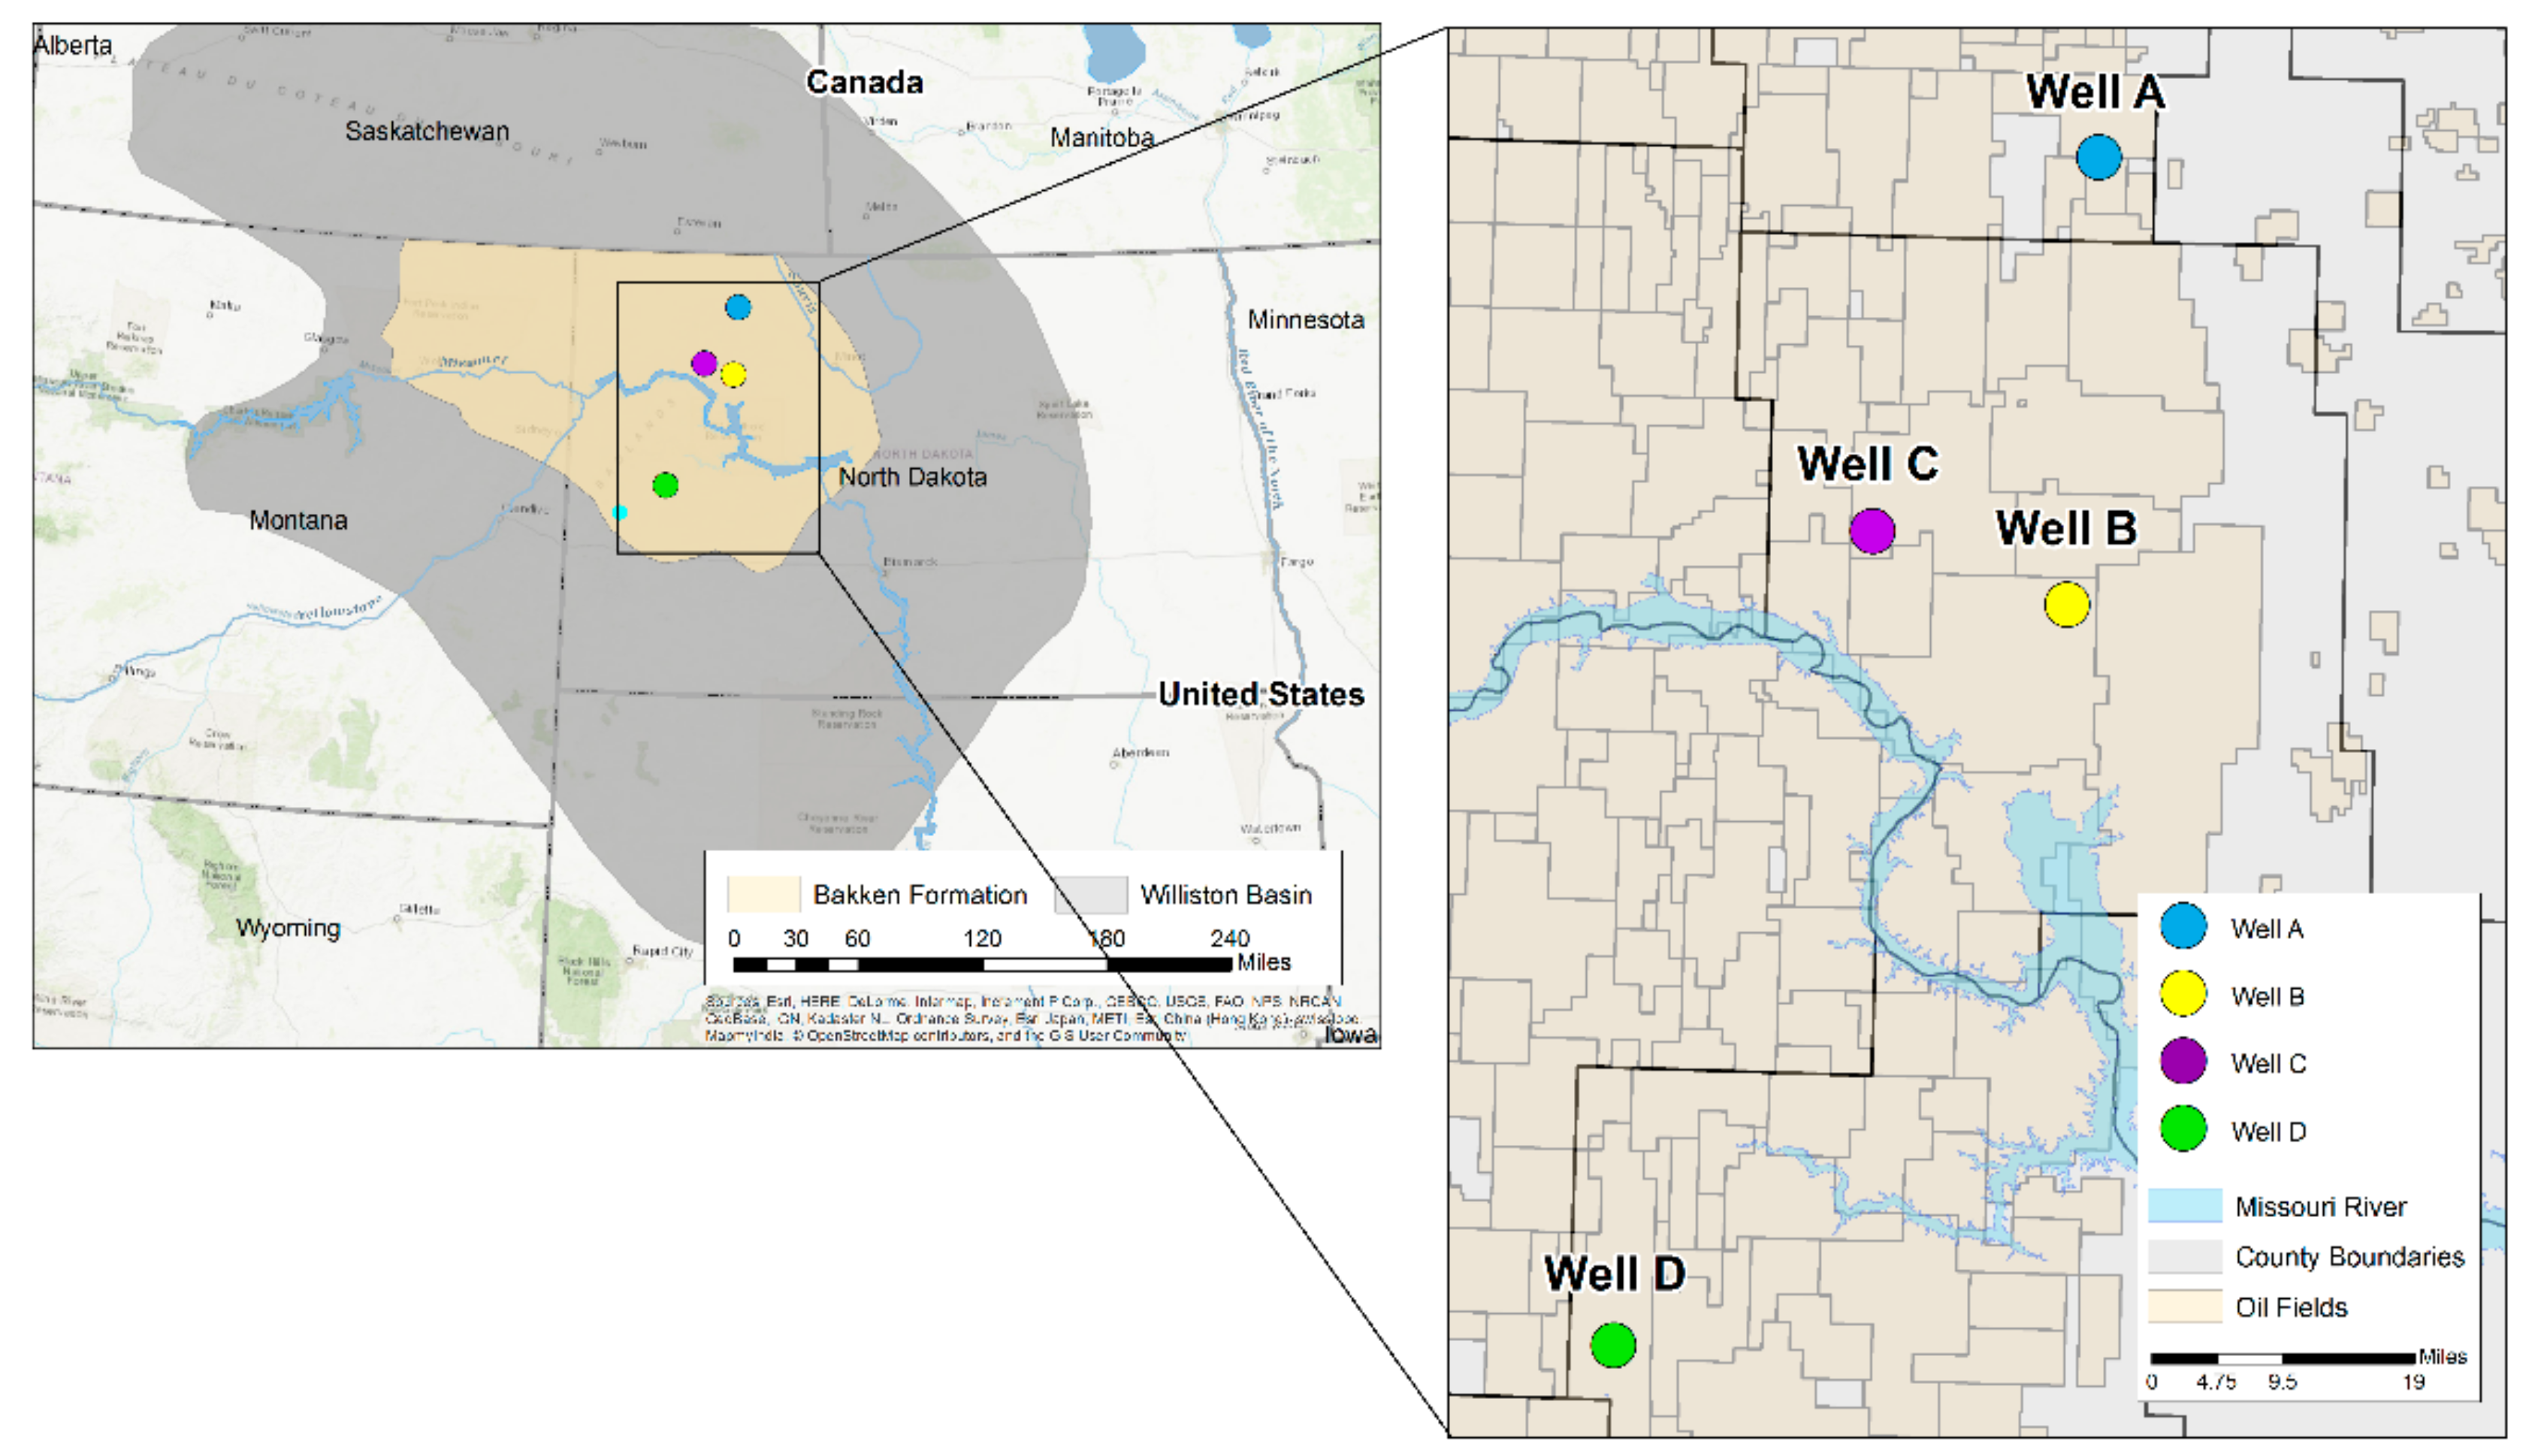
Figure 1. (Top) Wells in this study are overlaid on Bakken Formation map; (Bottom) Stratigraphic column of the Bakken Formation and the lithology of Members (Source: modified from [26]).
Energies 11 01406 g001aEnergies 11 01406 g001b
Figure 2. (AD) Core samples of Wells A–D; (EH) corresponding sample chips; and, (I) extracted kerogen.
Energies 11 01406 g002
Figure 3. (A) Blocky grain of primary bitumen (Bit); (B) Same as (A) but Pyrite (P) is also visible; (C) Low-reflecting bitumen (L-Bit); and, (D) Granular inertinite (Grnl Int); Pyrite (P) is also visible. No reliable grain of primary vitrinite can be seen.
Energies 11 01406 g003aEnergies 11 01406 g003b
Figure 4. Hydrogen index (HI) vs. Tmax as pseudo-Van Krevelen diagram for kerogen typing.
Energies 11 01406 g004
Figure 5. (Left) Isolated kerogen of Well D; and (Right) the same sample under a scanning transmission electron microscope (STEM).
Energies 11 01406 g005
Figure 6. (Top) Raman spectra for in-situ samples; and (Bottom) corresponding isolated kerogen samples. Note the lower background noise in samples, specifically Well A.
Energies 11 01406 g006
Figure 7. (Left) (L-Bit) Hydrogen-rich Solid bitumen under reflected (white) light; and (Right) The same view under fluorescence.
Energies 11 01406 g007
Figure 8. Band separation versus two common maturity indicators: (Left) %VRo and (Right) Tmax for different fields. Data are extracted from [5,15,53]. Blue circles are data from this study and red ones are from the literature.
Energies 11 01406 g008
Figure 9. PI vs. Tmax for samples in the study. Such graph helps to understand conversion level of organic matter.
Energies 11 01406 g009
Figure 10. Fourier Transform Infrared Spectroscopy (FTIR) of Well A (red) and Well D (green) as lowest and highest mature samples in this study. Note Aliphatic C–H, C–H2, and CH3 decrease, Aromatic C = C and C−H (either two neighboring or four neighboring) increase. (Band assignments for the infrared spectra were based on literature [78,79,80,81,82,83].
Energies 11 01406 g010
Figure 11. Image of isolated kerogen for Well D with two different scales of: (Left) 0.5 µm; and (Right) 10 nm captured by scanning transmission electron microscope (STEM). The image on the right shows imperfect stacked aromatic layer in the sample. By increasing maturity, aromatics stack and make larger clusters.
Energies 11 01406 g011
Figure 12. (Left) Correlation of S2 with G band from Raman spectrum of four samples in this study; (Right) The same plot using data from other sources (red circles) including samples in this study (blue circles) and [5,85] with 87% R2. Note the negative correlation that corresponds to less potential of production by increasing aromaticity.
Energies 11 01406 g012
Figure 13. (Left) Correlation of HI from Rock-Eval with G band position of four samples in this study; (A) The same plot using data from other sources (red circles) [5,85,86], including samples in this study (blue circles) with R2 75%; (Right) HI for data from other sources was calculated based on the definition, as they did not report HI directly. Note the negative correlation that corresponds to less hydrogen content of organic matter by increasing aromaticity.
Energies 11 01406 g013
Figure 14. (Left) Correlation of S1 with D band of four samples in this study; (Right) The same plot using data from other sources (red circles) [5,85,86] including samples in this study (blue circles) with 71% R2.
Energies 11 01406 g014
Figure 15. Correlation between PI from Rock-Eval and PI based on definition using Raman signals. Data from other sources (red circles) [5,85,86], including samples in this study (blue circles) with 78% R2. PI data from other sources were calculated based on the definition, as they did not report PI directly.
Energies 11 01406 g015
Table 1. Properties of the four samples used in this study.
Well No.Depth (ft)TOC (wt %)S1 (mg/g)S2 (mg/g)HI (S2 × 100/TOC)PI (S1/(S1 + S2))%BRo%VRo-eq
A832516.278.2790.69557.410.080.440.67
B988615.769.2783.7531.090.10.490.70
C10,55512.690.3133.01260.1260.0090.720.88
D11,19916.360.7128.05171.4540.0240.940.98
Table 2. Raman signals for shale and isolated kerogen samples for all wells. Mean and standard deviation (St. Dev.) for each band for all available measurements are provided. Note the lower standard deviation in kerogen samples.
Well AShale SampleKerogen SampleWell BShale SampleKerogen Sample
D BandG BandD BandG BandD BandG BandD BandG Band
1368.815911356.11587.71364.31587.71368.21587.8
1357.215891364.31581.413611590.813611590.5
1366.91593.31356.81587.71364.31590.81364.31590.8
1362.71582.51359.61583.41367.51584.51366.51587.5
1367.91593.51361.91587.71370.21587.71366.31587.7
MeanMeanMeanMeanMeanMeanMeanMean
1364.71589.91359.71585.61365.41588.31365.21588.9
St. Dev.St. Dev.St. Dev.St. Dev.St. Dev.St. Dev.St. Dev.St. Dev.
4.34.043.062.673.132.352.471.47
Well CShale SampleKerogen SampleWell DShale SampleKerogen Sample
D bandG bandD bandG bandD bandG bandD bandG band
1348.31587.71354.21591.31356.71591.313501590.1
1357.81590.81358.21591.31355.61591.31356.31590.8
13611590.81358.21594.41351.31591.313521592.4
1357.815941358.21594.41350.91594.413501589.3
1354.51597.11358.21591.31350.61597.613551587.7
MeanMeanMeanMeanMeanMeanMeanMean
1355.91592.11357.41592.513531593.21352.61590
St. Dev.St. Dev.St. Dev.St. Dev.St. Dev.St. Dev.St. Dev.St. Dev.
4.33.21.61.52.62.52.51.6