Article

NPC Based Design Optimization for a Net Zero Office Building in Hot Climates with PV Panels as Shading Device

by
Muhammad Zubair
1,*,
Ahmed Bilal Awan
1,
Abdullah Al-Ahmadi
1 and
Ahmed G. Abo-Khalil
1,2
1
Department of Electrical Engineering, College of Engineering, Majmaah University, Majmaah 11952, Saudi Arabia
2
Electrical Engineering Department, Faculty of Engineering, Assiut University, University Street, Assiut 71515, Egypt
*
Author to whom correspondence should be addressed.
Energies 2018, 11(6), 1391; https://doi.org/10.3390/en11061391
Submission received: 19 April 2018 / Revised: 24 May 2018 / Accepted: 28 May 2018 / Published: 30 May 2018

Abstract

:
Hot areas of the world receive a high amount of solar radiation. As a result, buildings in those areas consume more energy to maintain a comfortable climate for their inhabitants. In an effort to design net-zero energy building in hot climates, PV possesses the unique advantage of generating electrical energy while protecting the building from solar irradiance. In this work, to form a net-zero energy building (NZEB), renewable resources such as solar and wind available onsite for an existing building have been analyzed in a hot climate location. PV and wind turbines in various configurations are studied to form a NZEB, where PV-only systems offer better performance than Hybrid PV Wind systems, based on net present cost (NPC). The self-shading losses in PV placed on rooftop areas are analyzed by placing parallel arrays of PV modules at various distances in between them. The effect on building cooling load by rooftop PV panels as shading devices is investigated. Furthermore, self-shading losses of PV are compared by the savings in cooling loads using PV as shading. In the case study, 12.3% saving in the cooling load of the building is observed when the building rooftop is completed shaded by PV panels; annual cooling load decreased from 3.417 GWh to 2.996 GWh, while only 1.04% shaded losses are observed for fully shaded (FS) buildings compared to those with no shading (NS), as PV generation decreases from 594.39 kWh/m2 to 588.21 kWh/m2. The net present cost of the project has been decreased from US$4.77 million to US$4.41 million by simply covering the rooftop completely with PV panels, for a net-zero energy building.

1. Introduction

The modern world is facing extreme weather events every year. In the 20 years from 1996 to 2015, more than 528,000 people died in some 11,000 extreme weather events. Monetary losses add up to around 3.08 trillion US$ [1]. Crops are facing a 10% reduction in productivity because of severe weather events [2]. Global warming by greenhouse gases will melt polar ice, and some areas of the world will be underwater while other will suffer heavy rains and floods, which will cause a shortage of food, as well as desert formation, and mass migrations [3,4]. The main source of global warming is the burning of fossil fuels for electrical energy production and transportation [5].
The solution to global warming the use renewable energy resources, and eventually, completely going green. International efforts against global warming are advancing, with the Paris Accord [6], the European Directive 2020 [7], and national directives such as Vision 2030 of Saudi Arabia [8,9]. The Paris Accord seeks to limit the increase in global average temperatures to 1.5 °C in 2030, and to achieve net-zero emissions by 2070. The European Union directive focuses on buildings, targeting 20% onsite energy generation, 20% more energy efficiency, and 20% less greenhouse gas emissions from all buildings by 2020. Saudi Arabia announced a plan under Vision 2030 to create a sustainable city, Neom, by the Red Sea on the border of Jordon in Tabuk province. Saudi Arabia also plans to generate 9.5 GW of renewable energy by 2023 [10,11].
In recent years, renewable energy resources are becoming more economically feasible through the development of new technologies. In the past one year, 157 GW of renewable power systems have been installed at a cost of 279.8 billion US$, while 70 GW of fossil fuel energy systems have been decommissioned. China installed an astonishing 53 GW of solar energy systems at a cost of 86.5 billion US$ [12]. Even the Middle East countries such as UAE and Egypt have spent 2.2 and 2.6 billion US$ respectively on solar energy plants. Currently, photovoltaic systems lead the energy production of renewable energy resources in the world [12]. Saudi Arabia awarded a 300 MW project to a ACWA Power, a private investor, in February 2018, with an initial capital cost of 300 million US$ [13]; in March 2018, KSA signed a memorandum with Softbank Group Crop to develop a 200 GW solar plant in multiple phases, with an enormous investment of 200 billion US$ [14].
A lot of research is going on to increase the efficiency of renewable energy resources [15,16]. The research on PV was started analytically in 1950s. Now the dream is to print high energy efficient solar panels on flexible polyethylene terephthalate (PET) substrate, using printed electronics technologies at room temperature and in atmospheric pressure, which can last 25 years [17,18] and retain their efficiencies. The efficiencies of crystalline PV, III-V cell PV, and thin film PV cells have increased to 27.6% [19], 33.3% [20] and 21.7% [21] respectively. Since 2005, PV cell efficiencies have increased at a good rate, as presented by the NREL efficiency chart [22] and review articles [23,24].
PV and Wind energy system prices are decreasing, and producers are finding it difficult to deliver orders on time. This cost is declining as new competitors from Asia have entered this market. The price of solar panels has decreased by 77% from 2010 to 2017 [25,26,27]. The cost of solar energy systems comprises the system design, panels, inverters, and skilled labor cost. New designs in wind energy with bigger turbines are decreasing technology prices, as these machines have higher power coefficients, which means that they can convert more wind energy into electrical energy. Innovative designs have reduced the use of steel in towers, and methods for making a floating tower for off-grid turbines to place them in deep water are currently in research [12].
The Middle East has abundant renewable resources [10,28,29], and these countries should transform from fossil to renewable. The Kingdom of Saudi Arabia (KSA) is the largest oil exporting country, but huge domestic energy requirements are halting its economic growth [30]. The load profile of Saudi Arabia is unique, as peak load in summers is two times that of winter, because of huge cooling loads of buildings [31,32]. The country has very hot and dry weather [33]. The KSA government has increased electricity prices by 260% from 0.008 US$/kWh. The solution to KSA’s load problems is to curtail building load through the use of onsite renewable resources for buildings.
Net-zero energy building (NZEB) can be achieved by generating electrical energy onsite, so that the net energy bought from the grid is equal to the energy sold to the grid. Developed countries have already started to design and build net-zero buildings [34,35,36,37], in which smart techniques have been adopted to provide good insulation for buildings, reduce the load by effective use control of heating, ventilation, air conditioning (HVAC), and appliances, and to employ renewable energy systems [38,39]. Modern buildings use both AC and DC energy systems in lighting and appliances to enhance efficiencies and eliminate conversion losses from AC to DC and vice versa [40,41]. Off-grid energy systems require huge capital investment; during periods in which energy from renewable resources is unavailable, energy is taken from storage devices, whereas in net-zero energy systems, backup depends upon the grid. Off-grid systems require more installed capacity to meet the load, and store energy to use later.
The shading of the building reduces the cooling load [42,43]. The green rooftop has been investigated as a means of lowering building temperatures [44]. PV panels also provide shade and produce energy at the same time [45]. Kim et al. have detailed a net-zero energy by renewable resource system that generates electricity in 30 different projects [46] in various locations in relatively cold climates.
In this work, renewable resources for an existing building have been analyzed in a hot weather environment. PV and wind turbines in various configurations are studied to form a net-zero energy building. An area of the rooftop is designed for placement of PV arrays, and self-shading in the PV system is analyzed at various distances between the parallel arrays of the PV modules. The effect on cooling load of the building by rooftop PV panels as shading devices is investigated. Furthermore, self-shading losses of PV are compared to the savings in cooling loads. The site is analyzed for NZEB by solar and wind resources. Finally, the economics of the NZEB with and without rooftop PV arrays are discussed.

2. Methodology

The model of an existing building is developed in SketchupPro (Trimble Inc., Sunnyvale, CA, USA). EnergyPlus (National Renewable Energy Laboratory (NREL), Golden, CO, USA) and Euclid (BigLadder Software Inc., Denver, CO, USA) extension for SketchupPro are used for energy consumption analyses. EnergyPlus is a complete building simulation software for analyzing cooling, heating, ventilation, lighting, process load, and water use. The geometry of the building is designed in SketchupPro. Euclid is a toolbar of SketchupPro to run EnergyPlus.
An NZEB is achieved with the help of solar and wind resources at the location of the building using HomerPro (NREL). Homerpro is microgrid software for the optimization of the most suitable configuration out of available conventional and renewable energy systems. HomerPro optimizes for a least net present cost (NPC). The placement of PV arrays is proposed on the rooftop and parking area of the building, depending on the load and renewable energy resources of the area. The wind turbines will be placed in an open space beside the building, using a geographic information system (GIS).
The self-shading losses in PV panels mounted on the rooftop of the building are analyzed by System Advisory Models ((SAM) (NREL)). SAM uses computer models to evaluate cost and performance of renewable energy projects. The sun daily path is shifted in the winter, and originates in tilt angle variations. The parallel PV arrays are placed at various distances, and the corresponding percentage of losses is recorded.
The study of savings in cooling load of the building by shade provided by rooftop PV panels is performed in EnergyPlus (NREL) by placing parallel PV arrays at the same distances as those used for self-shading losses in SAM. The optimal distance for placing parallel PV arrays is evaluated by calculating the net energy analysis by adding energy gains of cooling load to the energy losses due to self-shading.
HomerPro (NREL) is used to analyze the renewable energy systems for the building, and achieve a net-zero energy system for various cases such as:
Off-grid hybrid energy system for building with no shading (NS) rooftop by PV arrays to show the benefit of the grid-connected system
NZEB with NS on the rooftop with only solar resources
NZEB with NS on the rooftop with only wind resources
NZEB with NS on the rooftop with solar and wind resources
NZEB with fully shaded (FS) rooftop by PV arrays without using wind resources
NZEB with FS rooftop by PV arrays using wind resources
The economic benefits of the onsite renewable energy resources by these various configurations are examined to find out the most feasible renewable energy system to attain a NZEB in hot climate areas with and without rooftop shading.

3. Case Study Analysis

KSA has set a target of generating 9.5 GW of electrical energy from renewable energy resources by 2023, and of building a sustainable city by the Red Sea [8,9] under the kingdom Vision 2030. KSA has already awarded ACWA Power, a private energy developer, a contract to develop the first 300 MW solar power plant, with an initial capital of 300 MUS$ in February 2018 [13]. KSA and Softbank Group Corp signed a memorandum to develop a 200 GW solar plant with an investment of 200 billion US$ [14]. In order to design and develop future renewable energy systems in KSA and fill thousands of jobs, Saudi students have to be well prepared to handle the huge task at hand. Universities are the ideal places to develop and understand the potential and methods of utilization of renewable energy resources and their application on loads such as buildings, to create a net-zero energy building (NZEB), and then spread the knowledge. In this work, the existing building of the College of Engineering, Majmaah University, is taken as a case study.
The building of the College of Engineering has five floors and is located at 25.890302 N and 45.35629 E in Majmaah City in Riyadh province, Kingdom of Saudi Arabia (KSA), at a height of 722 m from sea level. The covered area of this building is 4859 m2, with parking space at the front and back of the building. The satellite image and building model are shown in Figure 1. The CoE building working hours are from 8 a.m. to 8 p.m., where the electrical loads include heating and cooling systems, lighting, office equipment, and water heating systems. The annual daily average load is shown in Figure 2b, where a dip occurs at 12 p.m. for lunch break, and another at 2 p.m., when clerical staff leave the building. The annual load in Figure 2a shows the rise of the load with the rise in ambient temperature. The summer holiday months are from mid-June to mid-August; this results in a curtailment of the load. The system has been designed based on summer peak load, as a high load is observed in summer, and the designed system will work well in the winter as well. The KSA government has developed a data collection station to measure renewable resources throughout the kingdom for design and analysis of future renewable energy system projects for the targets set out in Vision 2030. The Majmaah station for renewable sources measurement is located in Majmaah University (MU). This measurement station is a Tier II station with uncertainty in data up to ±5%; the sensors are cleaned twice a week.

3.1. Renewable Resources

Solar resources are available in abundance in Majmaah, with an average of global horizontal irradiance (GHI) of 5.73 kWh/m2/day. Solar resources are high during summer from April to September, with a highest average GHI of 8.07 kWh/m2/day in June. January, February, November, and December receive lower irradiance; December receives the lowest irradiance, 3.31 kWh/m2/day, as shown in Figure 3. The solar output is dependent on the GHI and temperature, as shown in Equation (1). The PV output increases with the increase of GHI, but decreases at higher temperatures. The output Equation of PV is stated as [10].
P P V = Y P V f P V ( G ¯ T G ¯ T , S T C ) [ 1 + α P ( T c T c , S T C ) ]
The solar panels used in this work are monocrystalline 340 W Canadian Solar CS6X-340M-FG modules with an efficiency of 17.49%. These panels have a nominal operating cell temperature of 45 °C, and their temperature effect on power is −0.410 (%/°C).
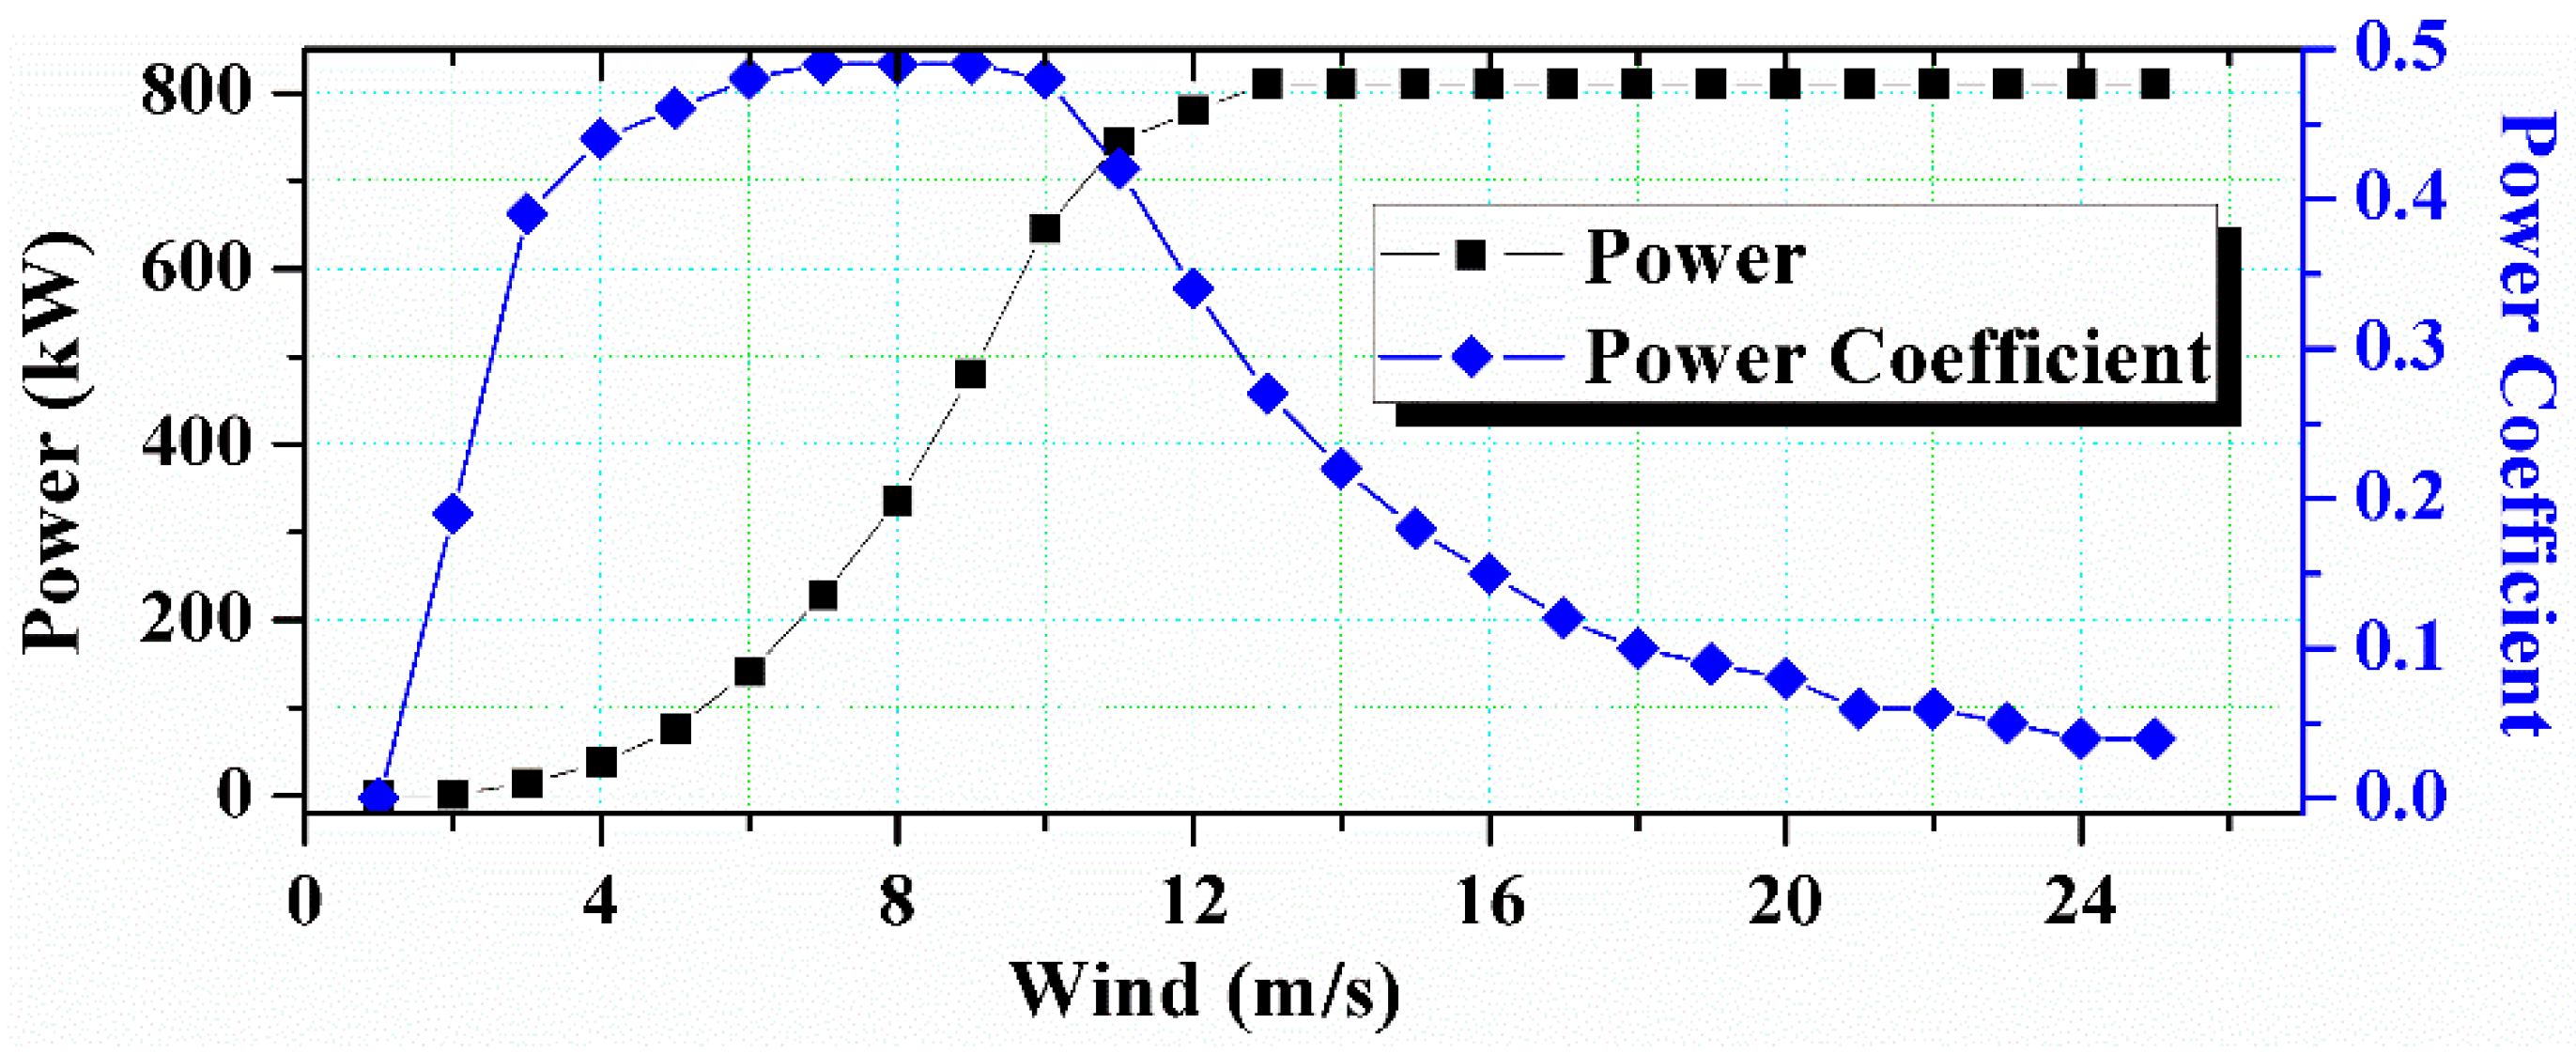
Wind resources are also available in abundance at the study location, as shown in Figure 4. The annual average wind speed is 5.11 m/s, as measured by an anemometer at a height of 50 m. The wind speed does not have significant seasonal variations, as shown in Figure 4a. The highest monthly wind speed is observed in July, at 5.75 m/s, and lowest is in October, at 4.61 m/s. The wind resources show that energy will be generated by wind throughout the year. The wind turbine selected for this project is the Enercon E-53 (800 kW). This turbine has a rotor diameter of 52.9 m, with a hub height of 73 m. The cut-in speed of this turbine is 2 m/s and a cut-off speed of 25 m/s. The power coefficient of this wind turbine shows that it can convert good portions of wind energy into electrical energy at lower speeds, as shown in Figure 5. The average daily wind speed increases during the daytime, which can help in shaving the peak load, as shown in Figure 4b. The low cut-in speed enables this turbine to produce electrical energy for 8524 h in a year at the proposed location, which can be seen from the duration curve and histogram in Figure 4c,d respectively.

3.2. PV Self-Shading Analysis

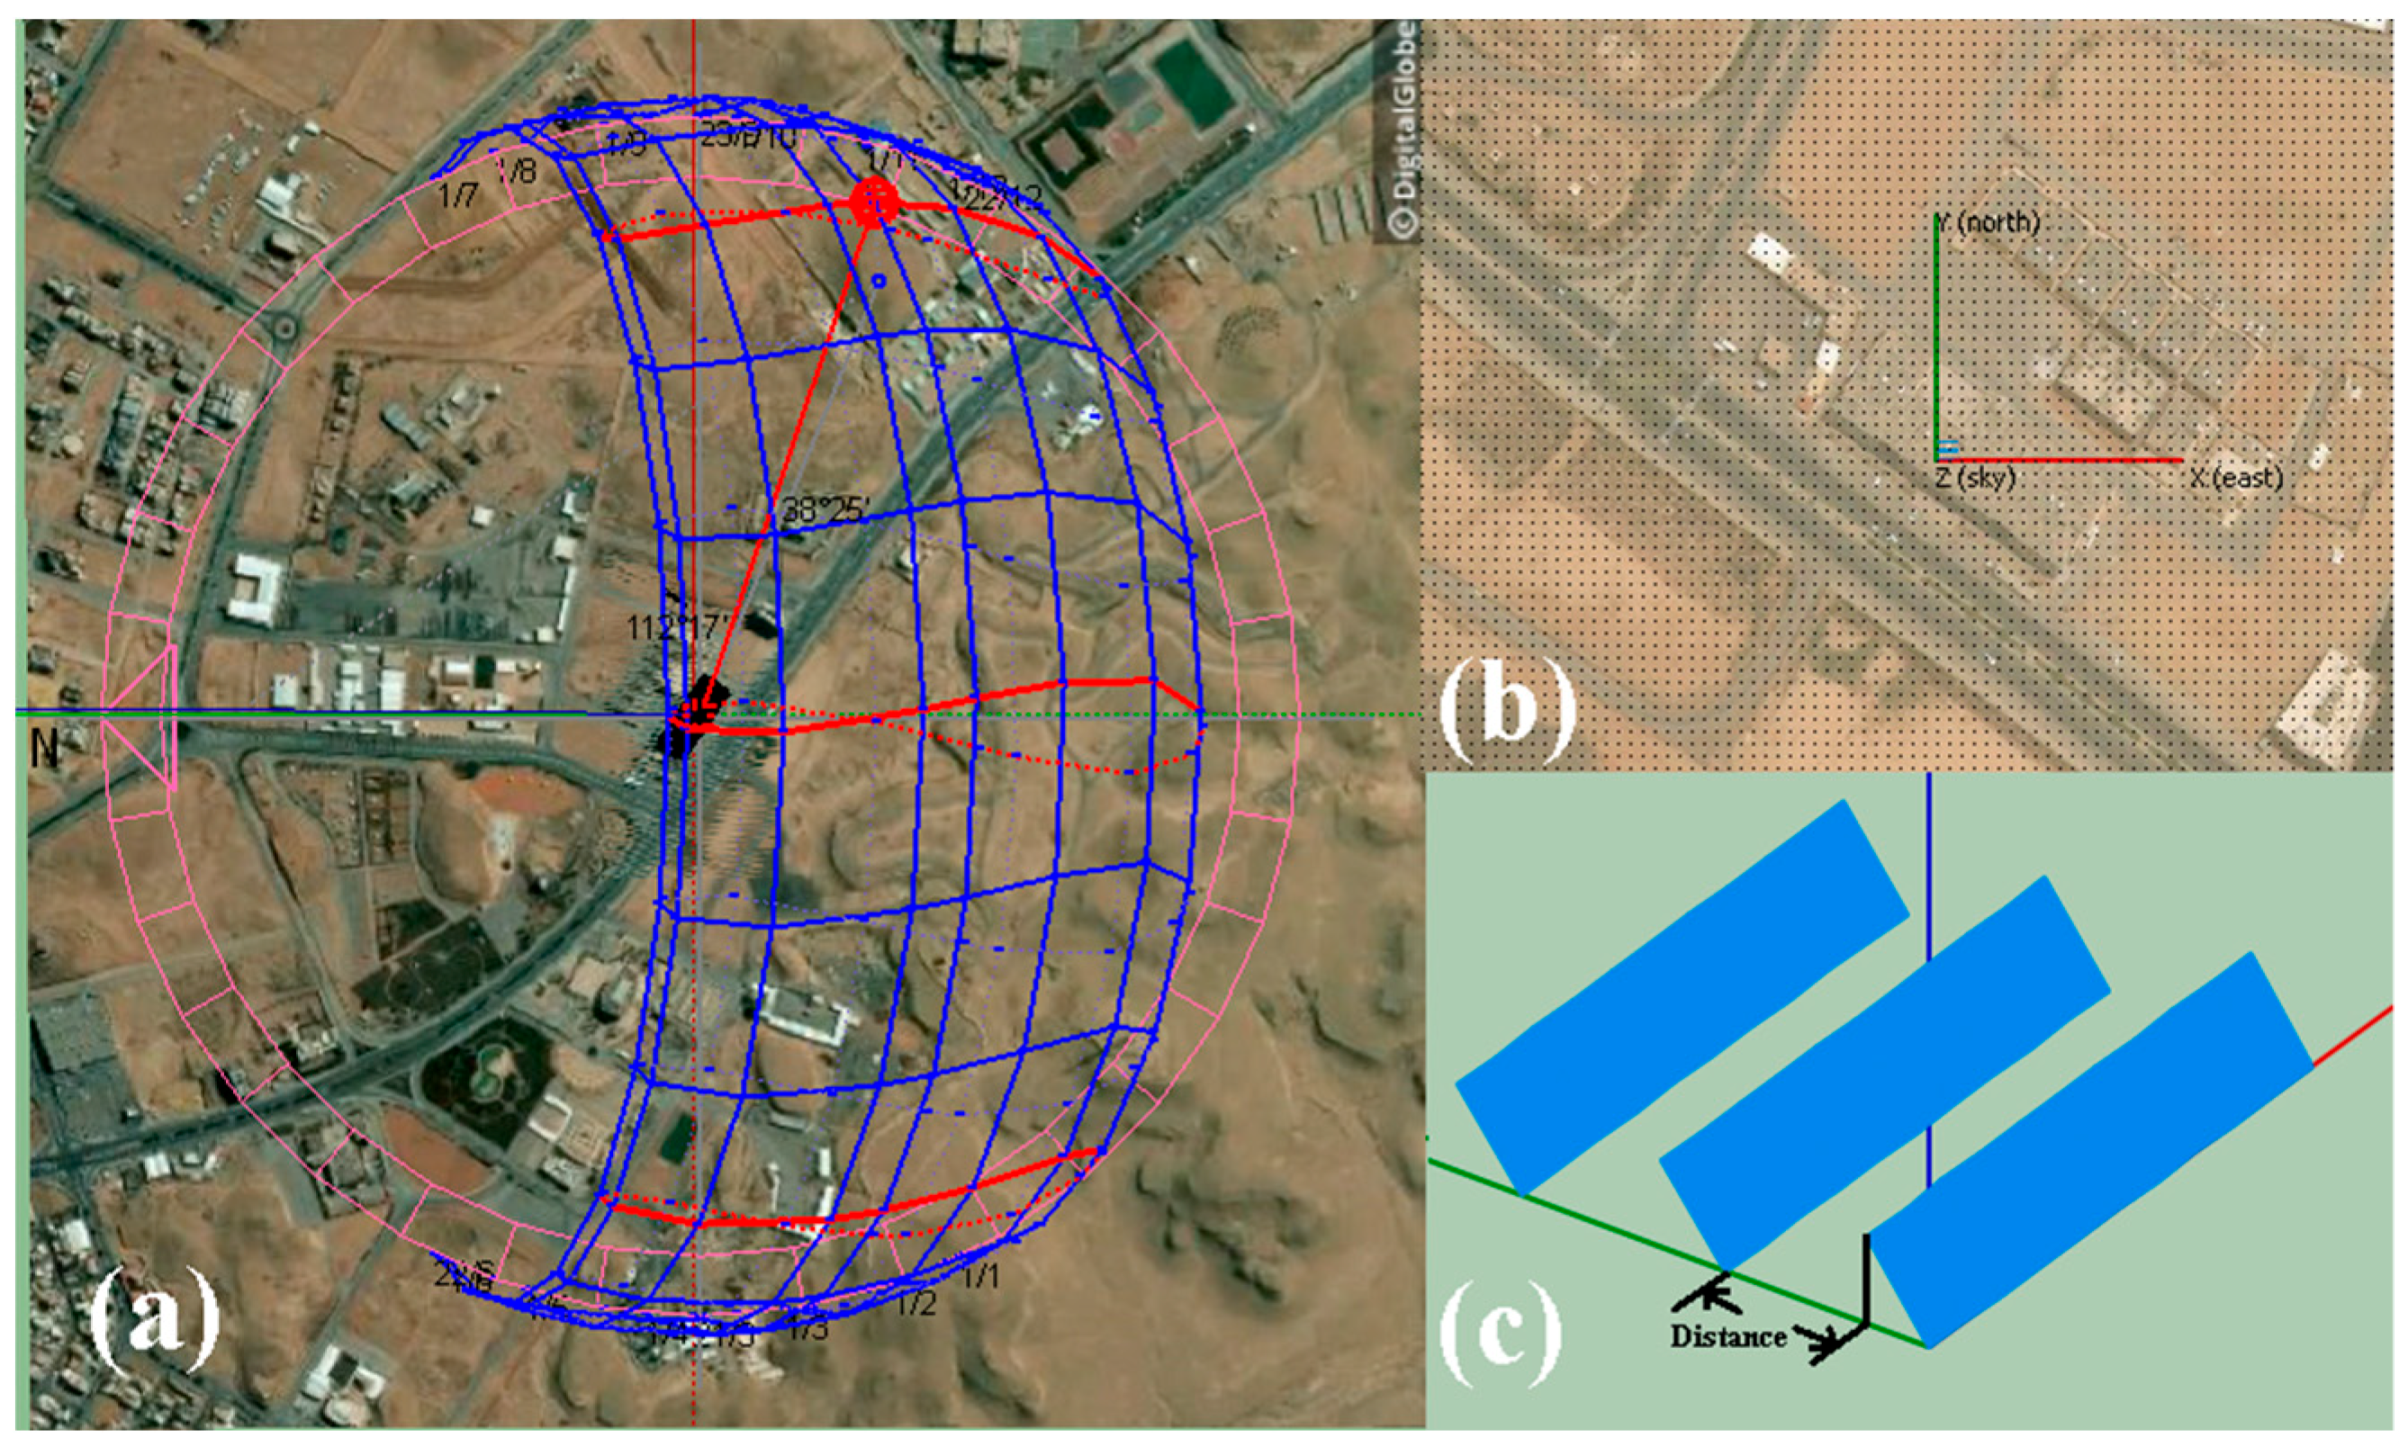
The parallel PV arrays on the rooftop are sketched in SAM 3D shading losses module. The tilt angle of PV modules is changed on a monthly routine for higher PV output generation. The tilt angle for each month is shown in Table 1. The data reveals that for May, June, and July, PV panels have to be placed at a zero tilt angle, and there is no chance of self-shading; in winter, the tilt angle will cause self-shading as the angle reaches a maximum value of 53° in December.
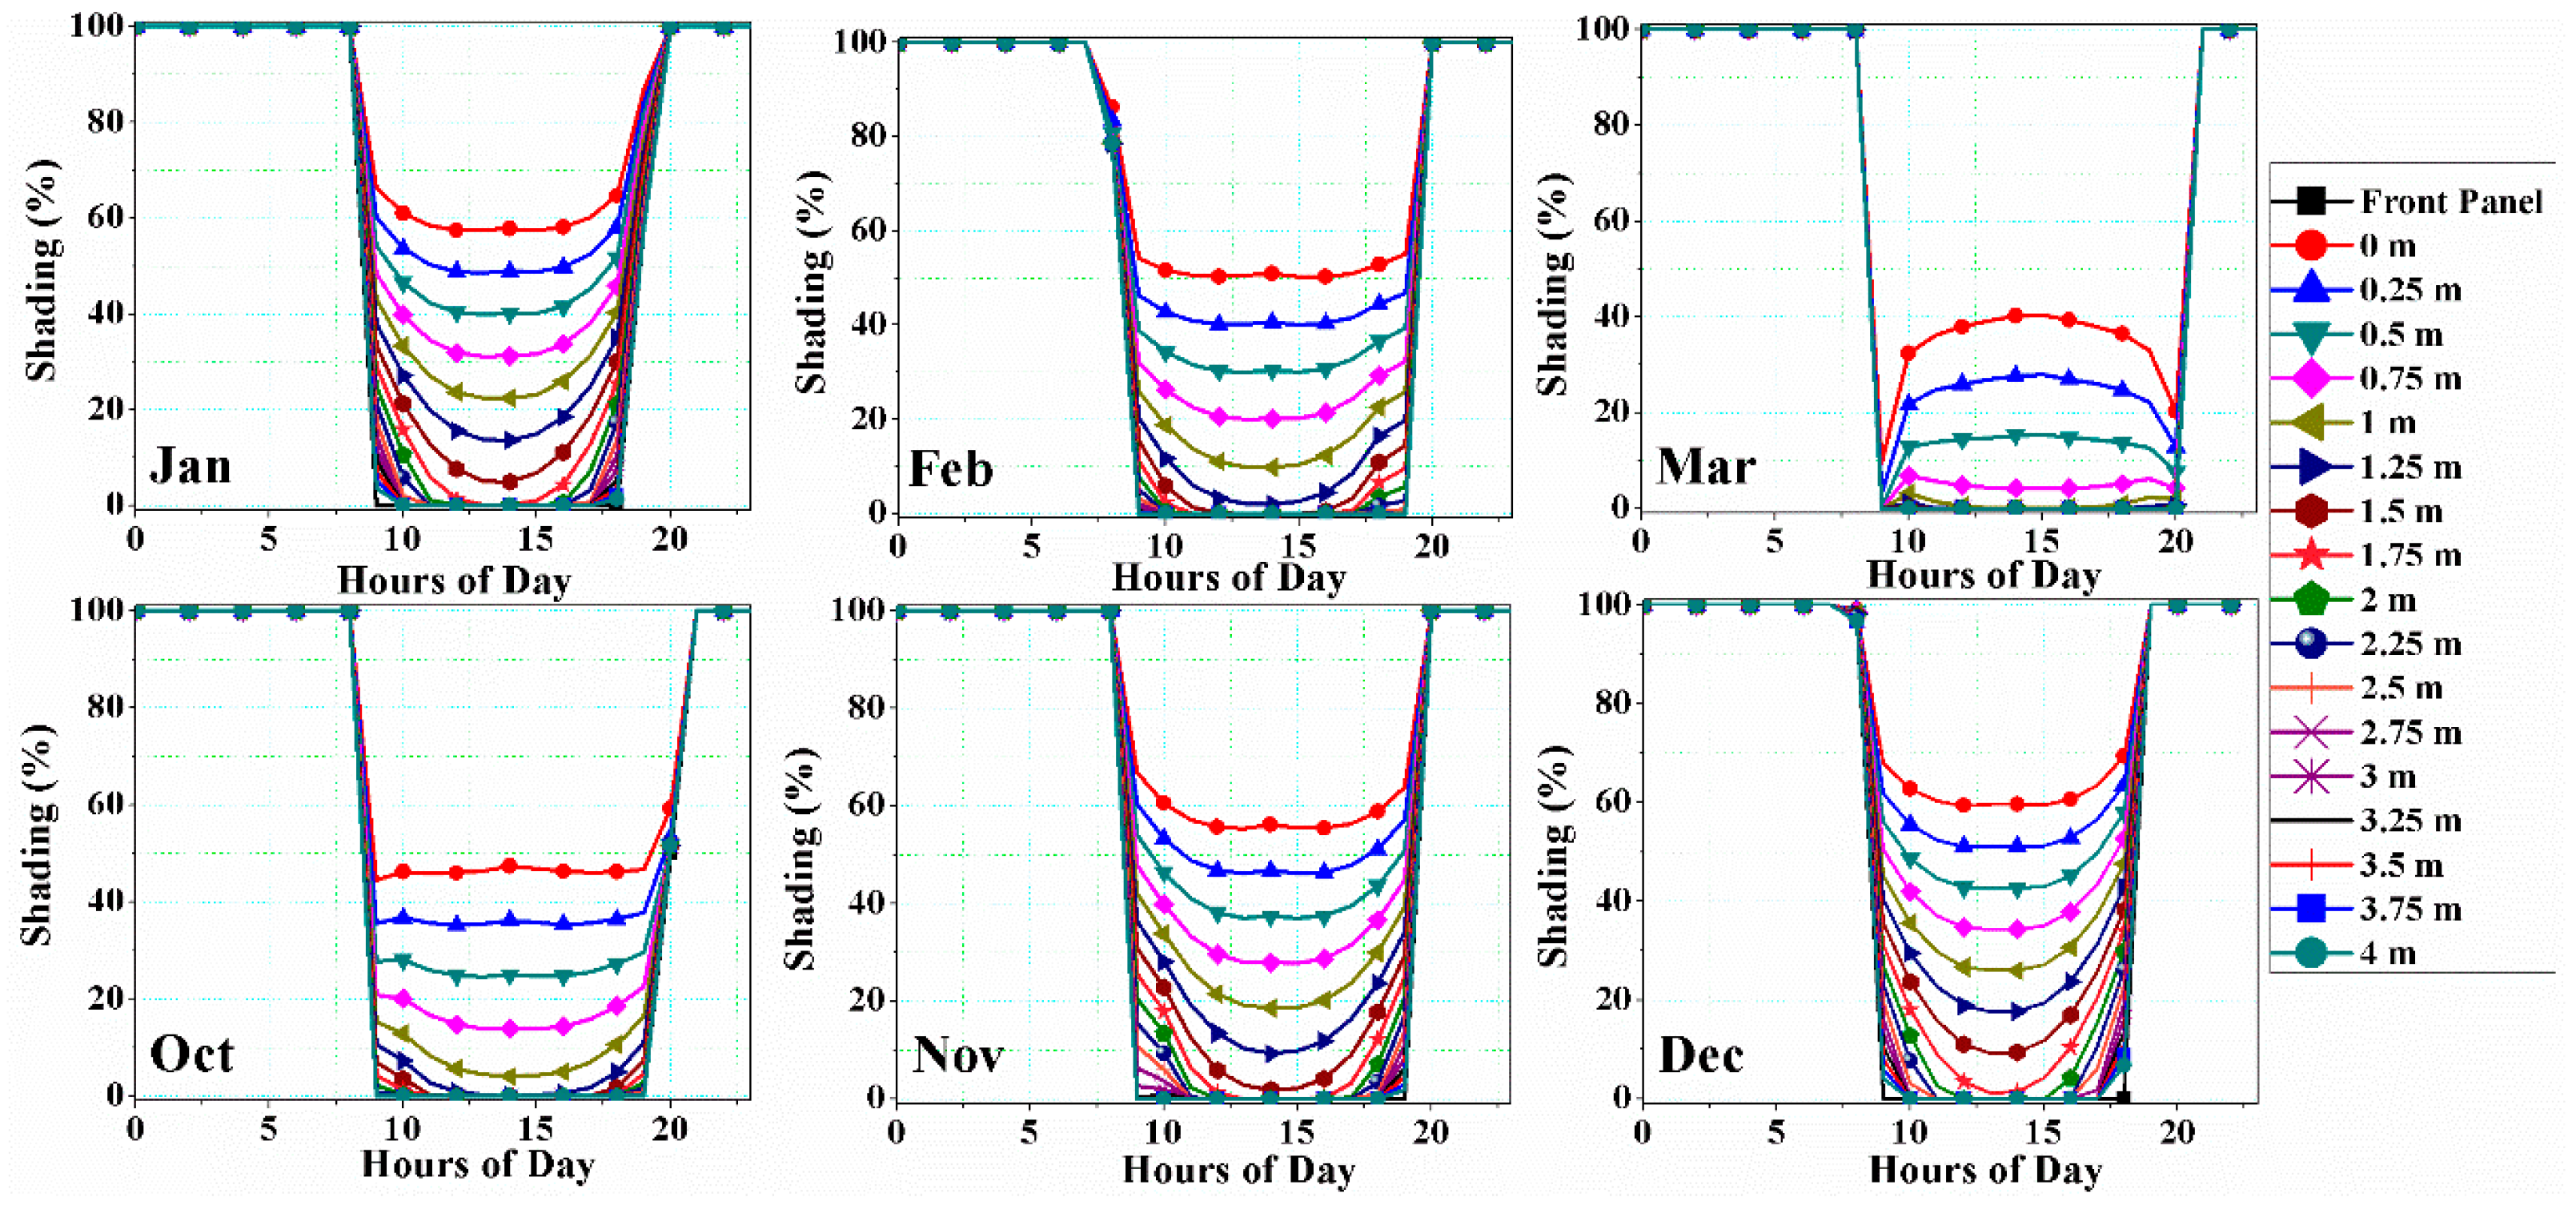
The sun daily path is shifted in the winter season which originates in tilt angle variations. The parallel PV arrays are placed at various distances and the corresponding percentage of losses is recorded as the maximum yearly output of PV panel occurring when tilt angle equals the latitude angle of the site. The distance is measured from the horizontal projection ( M o d u l e   l e n g t h × cos   ( t i l t   a n g l e ) ) of the top of PV module of the first array to the base of the next parallel array, as shown in Figure 6c. The shading losses are calculated at distances of 0 m, 0.25 m, 0.5 m, 0.75 m, 1 m, 1.25 m, 1.5 m, 1.75 m, 2 m, 2.25 m, 2.5 m, 2.75 m, 3 m, 3.25 m, 3.5 m, 3.75 m, and 4 m between the parallel PV arrays. The monthly average shading in the critical months of January, February, March, October, November, and December are shown in Figure 7. In the other six months, the PV tilt angles are near parallel to the surface of the roof, so no self-shading is observed in those months. The shading losses are negligible at a distance between the parallel PV arrays of 2 m or more, as shown in Figure 7. The number of PV panels that can be placed on the rooftop depend on its area, as well as the distance of the parallel arrays of PV panels. As the distance between the PV arrays increases, the number of PV panels that can be placed on the rooftop decreases. To study the self-shading losses and compare the output energy generated at various distances, the number of PV modules is kept constant. The energy generated by PV panels is reduced by placing PV arrays close to each other as the self-shading losses for the PV arrays increases. Figure 8 shows the relation between the number of PV panels installed on the rooftop and the distance between the PV arrays.

3.3. Shading Effect on Cooling Load of Building Analysis

The CoE building has an air conditioner in each room to cool the building in the blazing summer season. Each side of the building has small windows which remain mostly closed because of dust in the air and extreme weather throughout the year. The car park in front of the building has fabric shading, while that in the back of the building is open; this space can therefore be used to place renewable energy systems. The PV arrays placed on the rooftop protect the building from the direct impact of solar radiation. The fully shaded building rooftop during the daytime receives heat by convection instead of radiation, as radiationis blocked by PV arrays. The building model is simulated in EnergyPlus to assess the roof interior and exterior temperatures and cooling load requirements. The heat flux q into the building from the roof by convection is given by [48]:
q = h c ( T s u r f T a i r )
The heat flux into the building determines the cooling load required to maintain the temperature inside the building. The Building rooftop is heated in three ways: (a) the shortwave radiations that are directly horizontal and diffused horizontal radiations, (b) longwave radiations that are from the environment, and (c) heat exchange by convection with the outside air. This relation can be stated by Equation [49]
q s h o r t w a v e n + q l o n g w a v e n + q a i r   c o n v e c t i o n n q h e a t   f l u x n = 0
Applying the Stefan-Boltzmann law to each component produces [49]:
q h e a t   f l u x = ε σ F P V ( T P V 4 T s u r f a c e 4 ) + ε σ F s k y ( T s k y 4 T s u r f a c e 4 ) + ε σ F a i r ( T a i r 4 T s u r f a c e 4 )
In the case of PV arrays covering the rooftop, the solar radiation is absorbed by PV arrays and increases in longwave radiations, but the rooftop is saved from the shortwave radiation of the sun. The Equation for shaded rooftop is [49]:
q h e a t   f l u x = ε σ F P V ( T P V 4 T s u r f a c e 4 ) + ε σ F a i r ( T a i r 4 T s u r f a c e 4 )
Further linearized radiative heat transfer coefficient is used to make the Equations more compatible with the balanced heat transfer; the Equation for the rooftop with no shading becomes [49]:
q h e a t   f l u x = h r , P V ( T P V T s u r f a c e ) + h r , s k y ( T s k y T s u r f a c e ) + h r , a i r ( T a i r T s u r f a c e )
where [49]
h r , P V = ε σ F P V ( T s u r f a c e 4 T P V 4 ) T s u r f a c e T P V
h r , s k y = ε σ F s k y ( T s u r f a c e 4 T s k y 4 ) T s u r f a c e T s k y
h r , a i r = ε σ F a i r ( T s u r f a c e 4 T a i r 4 ) T s u r f a c e T a i r
Further including the view factor to sky, the Equations become [49]:
h r , P V = ε σ F P V ( T s u r f a c e 4 T a i r 4 ) T s u r f a c e T a i r
h r , s k y = ε σ F s k y β ( T s u r f a c e 4 T s k y 4 ) T s u r f a c e T s k y
h r , a i r = ε σ F a i r ( 1 β ) ( T s u r f a c e 4 T a i r 4 ) T s u r f a c e T a i r
where β   is the tilt angle [49]:
β = 0.5 ( 1 + cos φ )
The final Equation for fully shaded rooftop is [49]:
q h e a t   f l u x = h r , P V ( T P V T s u r f a c e ) + h r , a i r ( T a i r T s u r f a c e )
The weather file of the area was added to EnergyPlus, which has hourly data for GHI, DHI, DNI, air temperature, humidity, and wind speed. An annual energy simulation was run with the building parameters shown in Table 2. The surface temperatures and annual building utility performance summary is recorded for analysis.
The cooling load increases with the decrease in shading provided by PV panels. The FS rooftop is achieved by placing PV arrays at a distance of 0.75 m at a tilt angle of 53° in December, which will result in a fully covered rooftop in summer with the tilt angle of 0°. Here, a 12.3% saving in the cooling load of the building is observed. As the distance between the PV arrays increases, the advantage in cooling load decreases. When the PV arrays are placed apart at a distance of 4 m, a 4.4% saving in cooling load is still observed, as shown in Figure 9. The net energy for cooling is calculated by subtracting rooftop PV generation from the cooling load. The analysis of the net energy requirements for cooling by placing the PV arrays on rooftop shows that the closer the PV arrays are to one another, the more savings in cooling load are achieved. In total, 4088 PV modules can be placed on the FS rooftop, which has an area of 4891 m2. The higher number of PV panels of the FS rooftop also means that higher electrical energy generation is achieved. The energy generated by FS rooftop PV panels met 96.5% of the cooling load of the complete building. Hence, the advantages of FS rooftop with 4088 panels outweigh the disadvantages of self-shading losses of 1.039%.

4. Net-Zero Energy Analysis

NZEB can be achieved by using renewable energy resources that can be placed on the rooftop and in the parking areas of the building. The university campus has plenty of space for placing solar or wind farms for energy generation. The following main cases are simulated in HomerPro for the minimum NPC.
Scenario 1
Off-grid with NS hybrid solar and wind energy system
Scenario 2
NZEB with NS with PV only
Scenario 3
NZEB with NS with wind only
Scenario 4
NZEB with NS with hybrid solar and wind energy system
Scenario 5
NZEB with FS rooftop with PV only
Scenario 6
NZEB with FS rooftop with hybrid solar and wind energy system
In the first scenario, an off-grid system is simulated to compare the off-grid system with a grid-connected system. The next three scenarios (2, 3 and 4) present the PV only, wind only, and a hybrid PV wind system without shading on the rooftop where the annual load of the building is 5,377,307 kWh and cooling load consists of 3,416,861 kWh. The rooftop is fully exposed to solar radiation, so the building’s cooling load is the major portion of the annual load. To understand the real advantages of PV arrays on a rooftop in hot climate, scenarios 5 and 6 are simulated, where the fully shaded rooftop require a lower cooling load, i.e., 2,995,738 kWh, so the annual load for a building with fully shaded rooftop is 4,957,456 kWh.
The parameters for solar and wind energy system are shown in Table 3. The EPC, PDC, and IDC form the initial cost of projects, while O&M and insurance form the project operating costs. In this work, land cost is eliminated, as the University campus has enough space to install PVs or wind turbines. The cheaper costs of renewable resource energy systems [12,50] and increasing costs of electricity in KSA are making renewable energy systems more feasible. Government buildings such as the CoE has a flat tariff of 0.085 US$, since 1 January 2018. The utility-scale solar projects have a lower cost of energy than the standard 0.085 US$, due to the decline in prices of PV on the international market. Recently, KSA awarded AWCA energy a 300 MW solar project with an LCOE of 0.02342 US$/kWh [13]. The project in this work is much smaller than the AWCA energy awarded project; it is in an urban environment, in an area which is not in the top ten locations for solar production in KSA [10]. The cost of this project is higher than that of the utility level project of 300 MW.
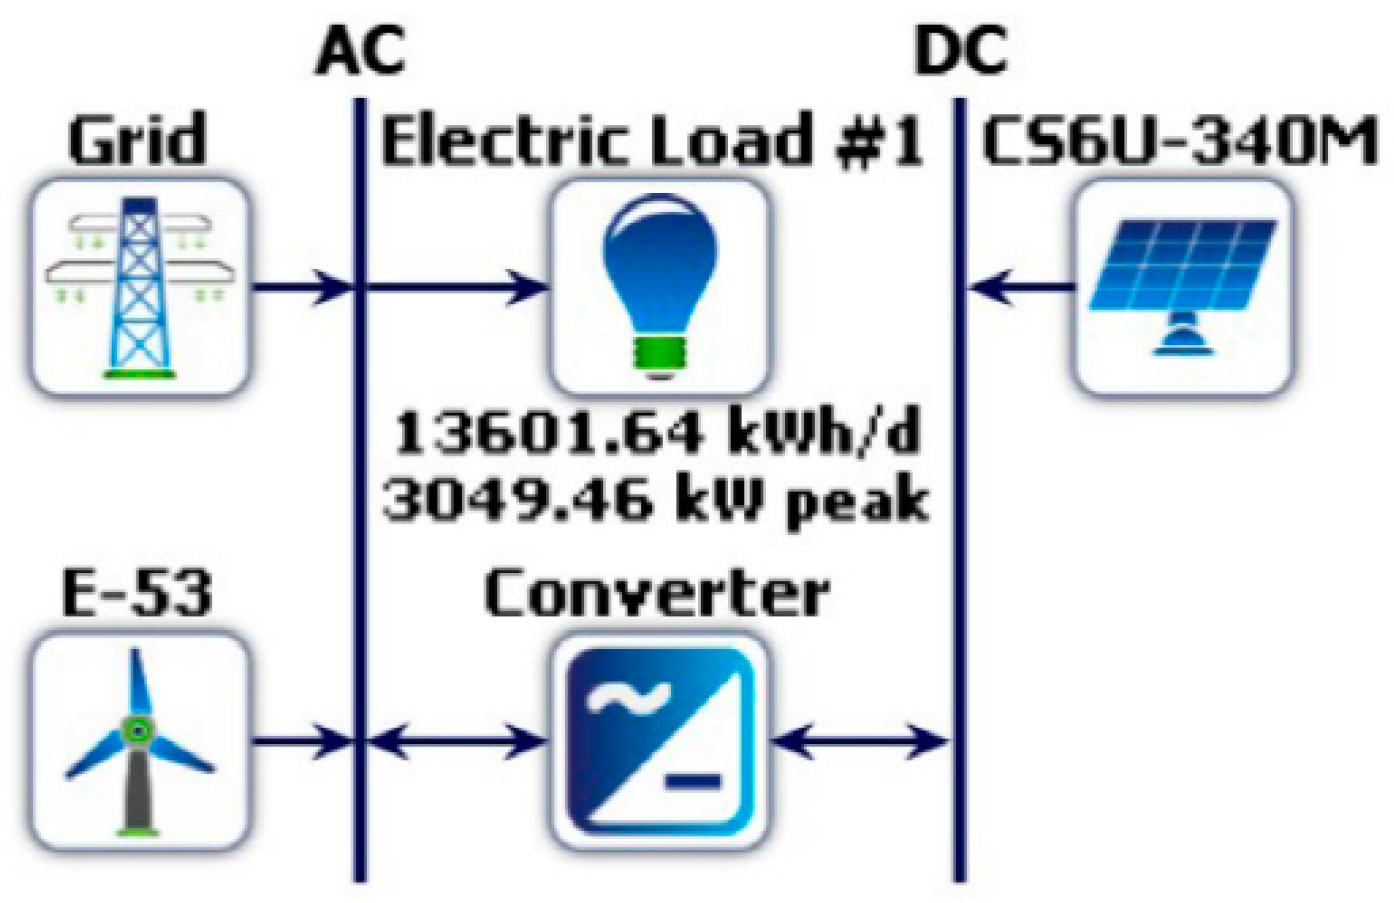
The schematic diagram of a hybrid system in HomerPro is shown in Figure 10. The results of simulations based on NPC, initial cost, and LCOE, grid sales, grid purchases, and renewable penetration are tabulated in Table 4. The scenario 5, PV only FS rooftop system, has the lowest NPC, while scenario 6, a hybrid FS system with PV and a wind turbine, has the second-lowest NPC. The LCOE is also lowest for scenario 5, the FS rooftop PV only system.
The off-grid system shows a huge capital investment of 17.5 MUS$ and NPC of 26.1 MUS$, and the LCOE of electricity is 0.375 US$/kWh. This off-grid hybrid is five times more expensive than an FS hybrid system. The initial cost of the off-grid system consists of two wind turbines, of 1.6 MW installed capacity, and a cost of 7.275 MW of installed PV modules. The cost of batteries used for the storage of electricity for the night is an astonishing 12.2 MUS$. Analysis shows that the grid-connected systems are much cheaper and more dependable.
The next three scenarios (2, 3, and 4) are of NS with PV only, wind only, and a hybrid case with PV and wind energy systems. The scenario 2, the solar only case at NS, has the lowest NPC of 4.77 MUS$, while hybrid and wind only have 5.37 MUS$ and 7.18 MUS$ respectively. The PV appears to be the most promising renewable resource in Majmaah. The price of wind is a bit more for such a small-scale project. The LCOE is 0.0472 US$/kWh, 0.0550 US$/kWh, and 0.0658 US$/kWh for PV only, and the hybrid and wind only system, respectively. The advantage of adding wind resources into the energy mix leads to more renewable energy penetration, as a wind turbine produces electrical energy throughout a day, while PV can only produce during sunlight hours.
Finally, the last two scenarios are to show the effect of PV shading on the building in a hot climate, where the annual load has decreased by installing PV on the rooftop from 5,377,307 kWh to 4,957,456 kWh, according to the EnergyPlus analysis shown in Figure 9. In scenario 5, the PV only case with FS, the NPC of the system is 4.41 MUS$ and the initial cost of 3.64 MUS$, while in scenario 6, a hybrid case with FS, the net present cost increases to 5.00 MUS$, and the initial cost is 4.14 MUS$. The LCOE by the scenario 5 of PV only is 0.0472 US$/kWh, while that of scenario 6 is 0.0556 US$/kWh. The analysis shows that the most feasible case is scenario 5, with an FS rooftop with PV only energy system. Furthermore, system energy analysis and economic analysis is performed for the most feasible system of scenario 5.

4.1. Energy Analysis

The monthly average and hourly average of energy analysis of scenario 5 is shown in Figure 11 and Figure 12 respectively. In Figure 11, the energy produced by PV is in accordance with the solar irradiance and temperature. June is the best month for PV energy generation, with high GHI, while December has the minimum energy output, with low GHI. The months of July and August have been affected by the high temperature. The load, sales, and purchases from the grid show that during summer months, more energy is bought from the grid, while in the winter months, the grid sales are higher. The hourly average PV output in Figure 12 shows that energy generation follows the GHI. The load of the building is satisfied by the PV generation during the day, and extra energy is sold to the grid, while energy is purchased during the night. The datamap in Figure 13 shows the PV generation, gird purchase, grid sales, and renewable energy penetration percentage for the complete year. The negative effect on the output of PV in the summer months at high temperatures can be seen in this Figure. There is huge grid purchase after sunset, as building office hours are up to 8 p.m., whereas most grid sales are during the weekend and winter months, when the load of the building is less than PV generation. The national energy peak of KSA occurs around 2 p.m. [52]. The digital meters record peak hours from 12 p.m. to 5 p.m. [53,54]. The energy generated during the day is at the time of the first national energy peak, so this system is shaving off the load and reducing the stress of the national grid, and also supporting the national grid by selling extra energy to it. During the off-peak hours, the system is purchasing from the grid, which will enhance the load factor. The rooftop of the building, with an area of 4859 m2, is capable of housing 4086 PV panels, with an installed capacity 1390 kW from the required 8280 panels, to meet the annual load with an installed capacity of 2815 kW. The remaining 4185 PV panels of installed capacity 1425 kW will be installed in the car parking area or in open space on the university campus.

4.2. Economics Analysis

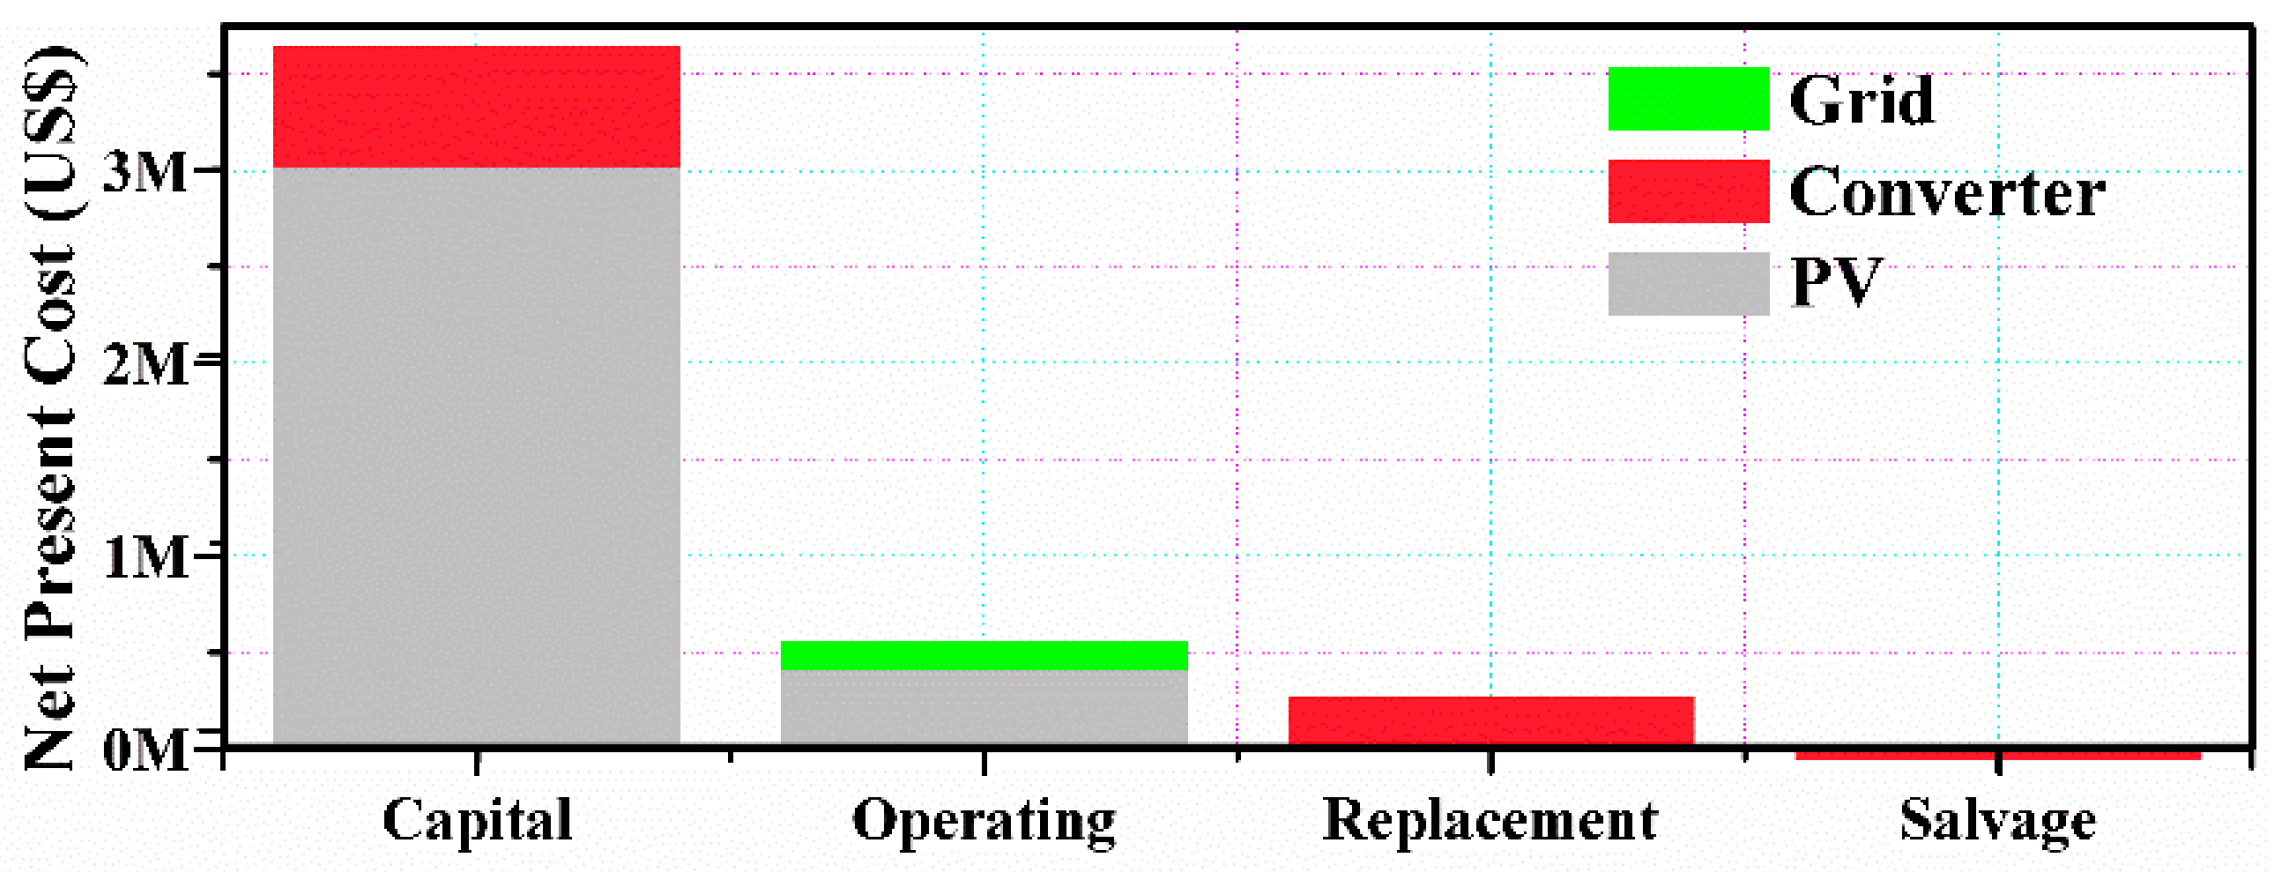
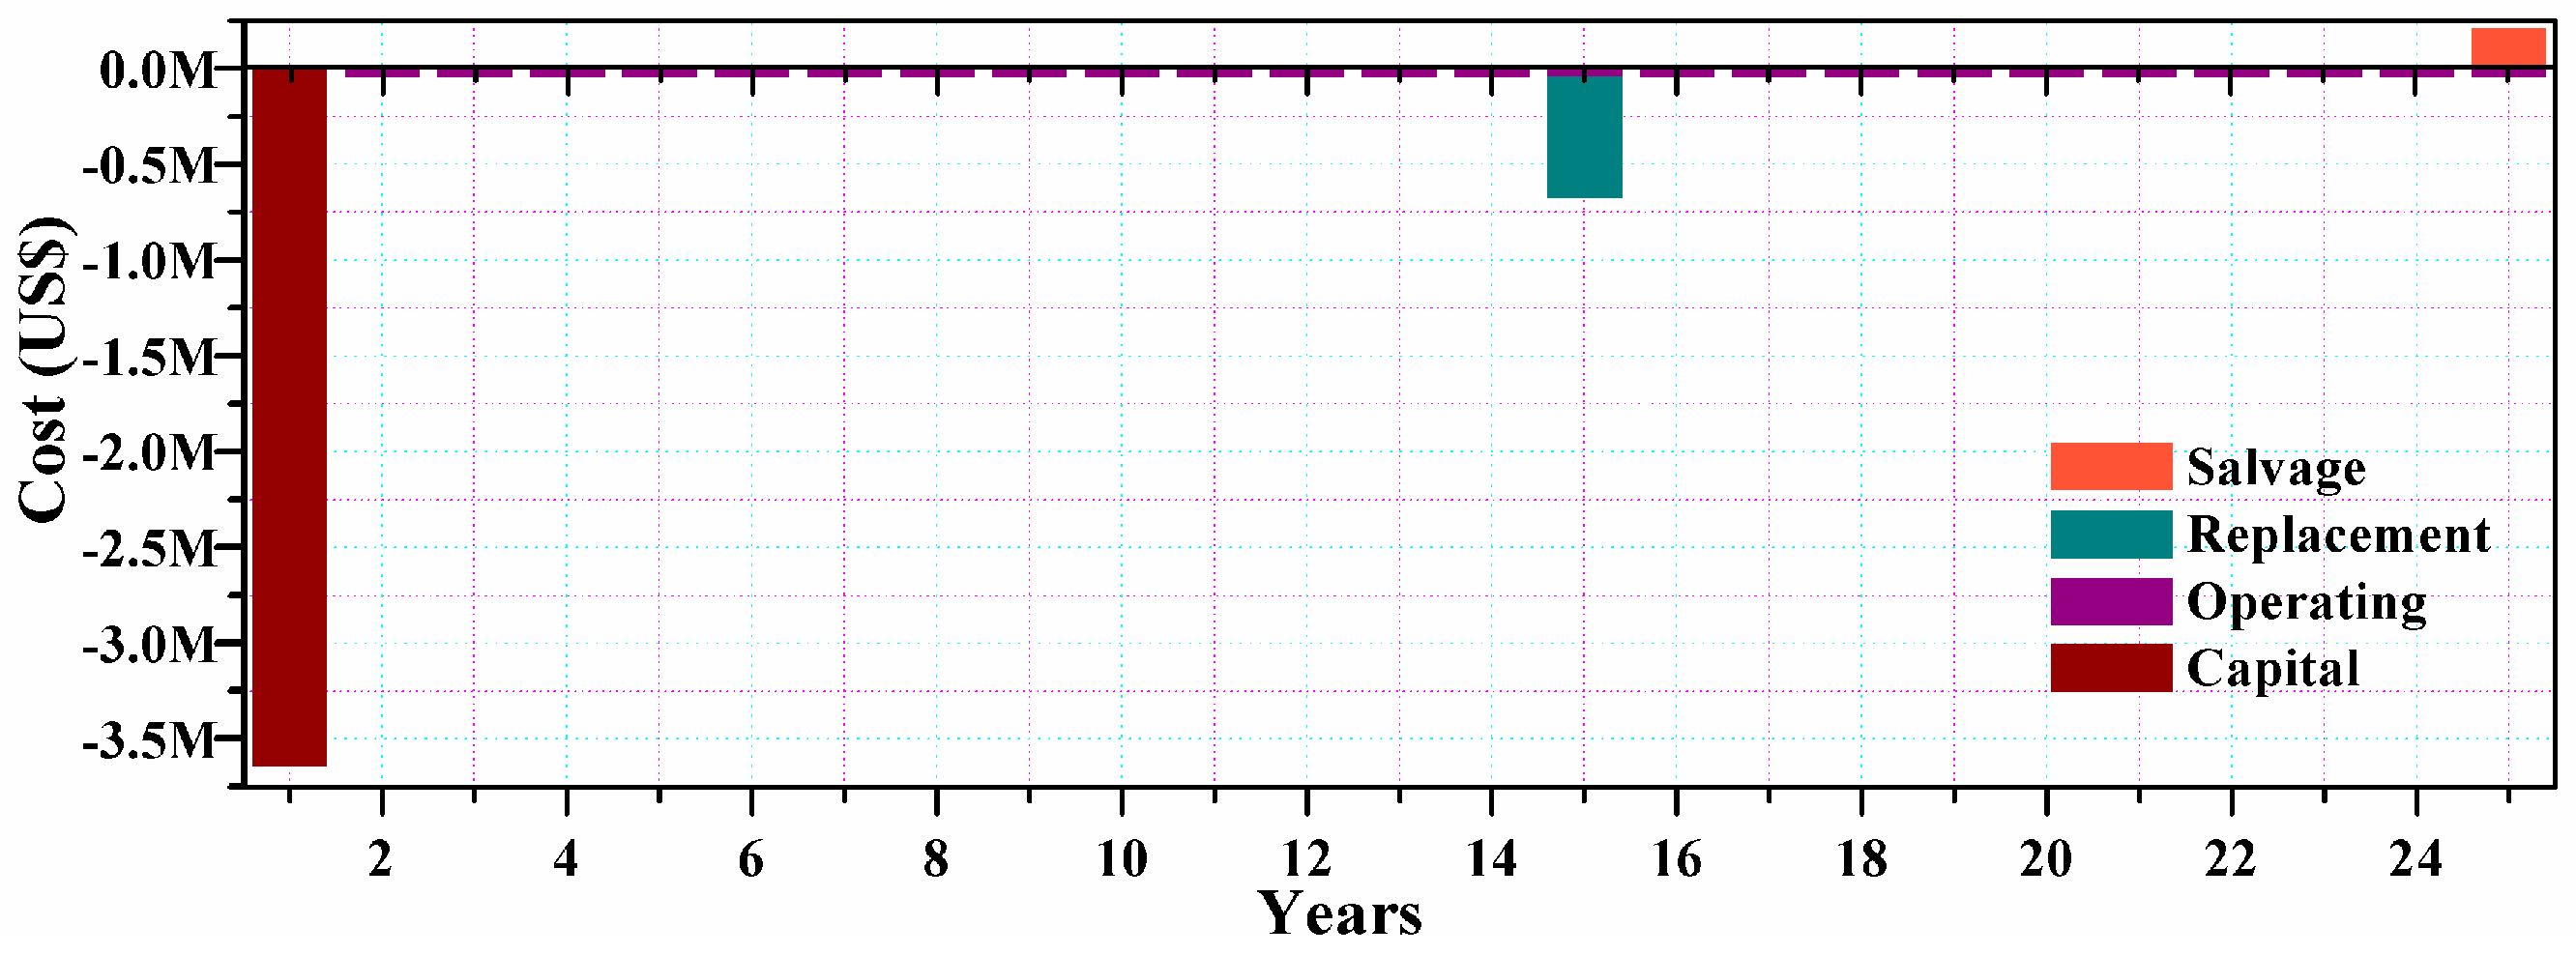
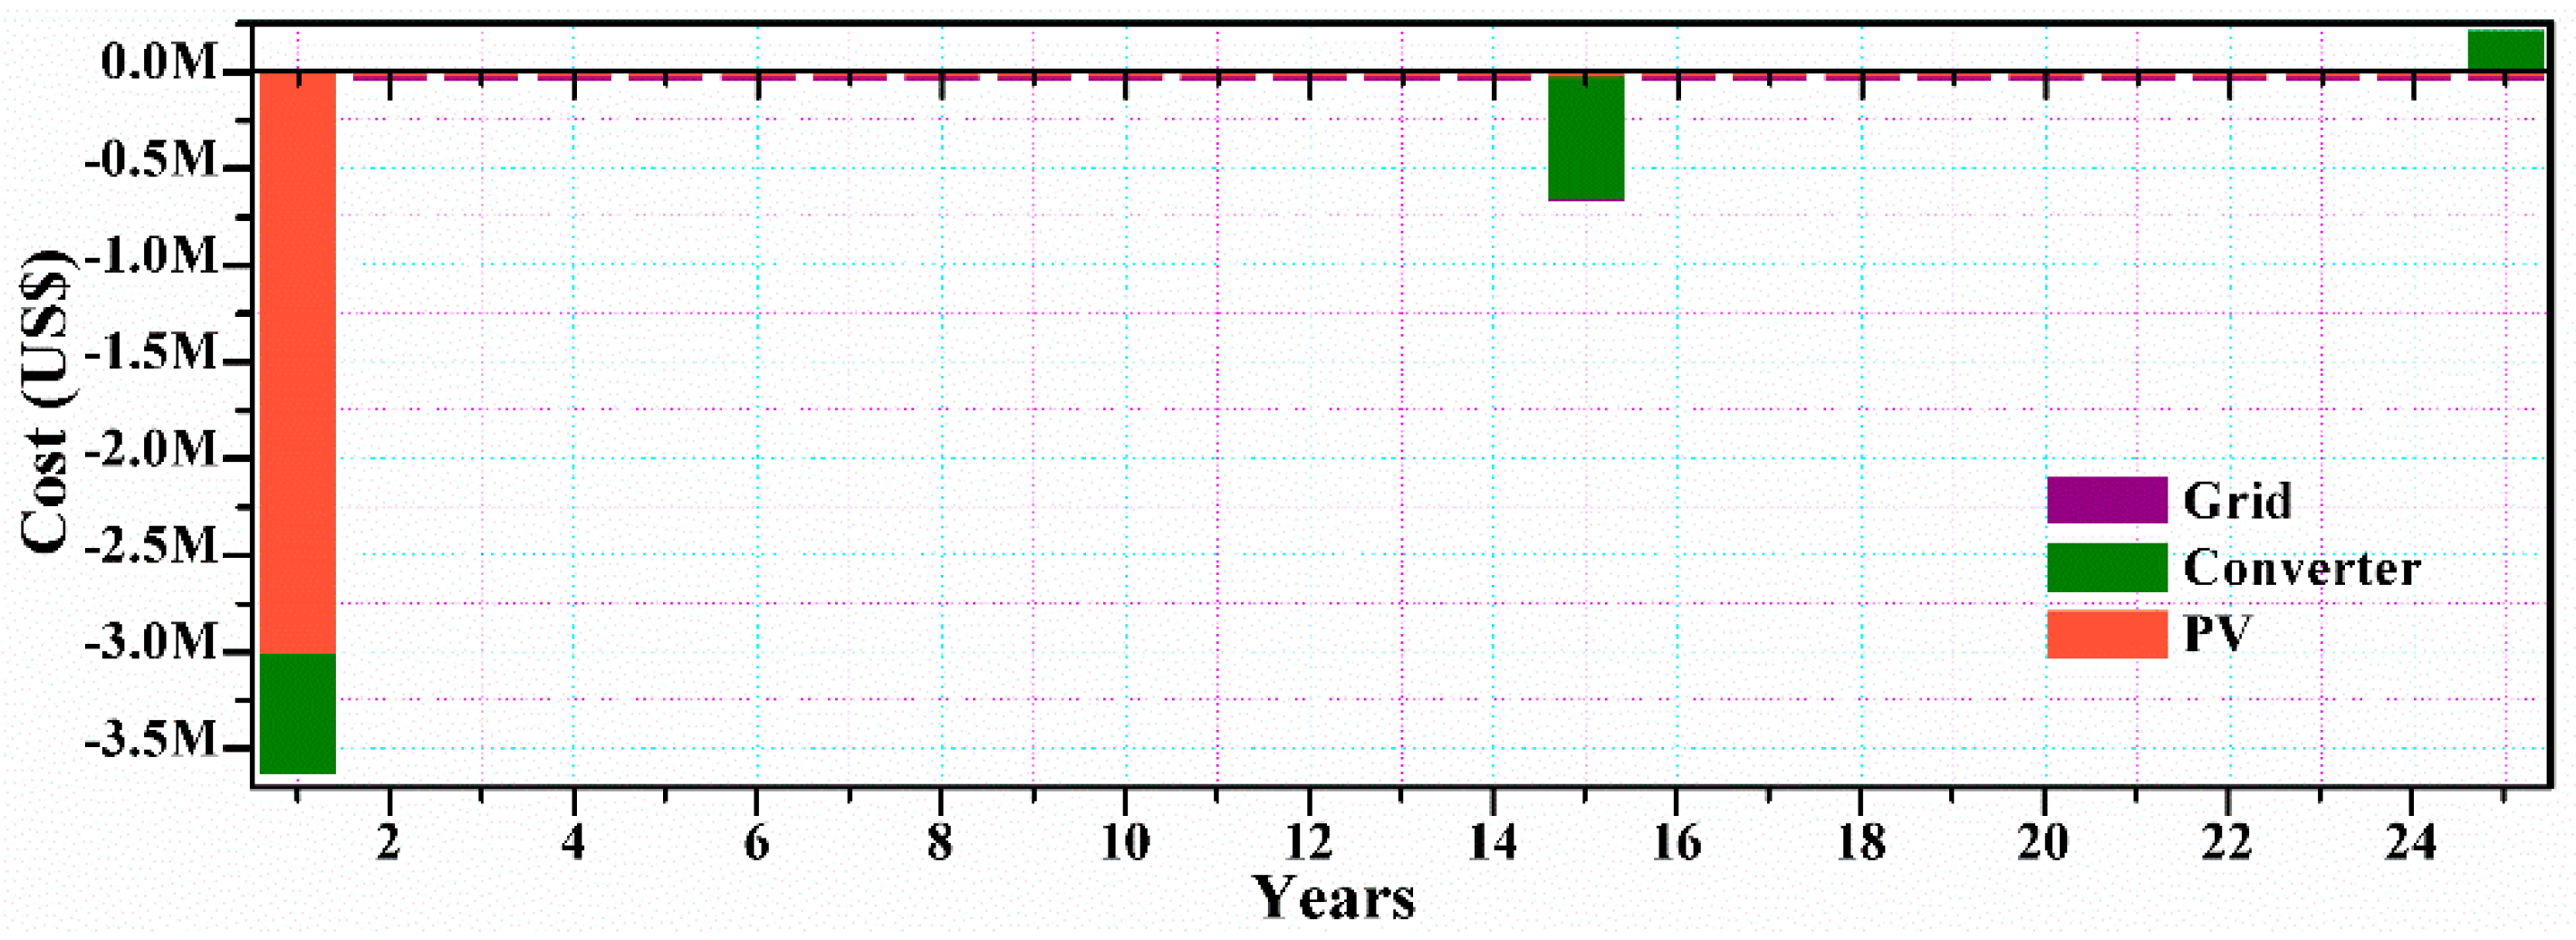
This section presents the detail economic analysis of scenario 5, FS with PV only system, due to its lowest NPC shown in Table 4. The economics of the system is presented in terms NPC with respect to the components cost and cost types in Figure 14. The capital cost of the system consists of the cost of PVs and the converters. The operational and maintenance cost includes the routine weekly cleaning of PV panels and payments to the grid. Dust in the environment can reduce the system output energy. Dust storms usually occur in Majmaah in the months of March and April, so PV modules require frequent cleaning after each such event. The lifetime of converters is 15 years, after which they must be replaced. The yearly cash flow diagrams of the system are shown in Figure 15 and Figure 16, by cost type and components, respectively. The cash flow diagrams show that the major expenditure of the project is the capital cost. The annual worth of the system is 27,406 US$, with a ROE of 19.7%. The simple payback time of the project is 3.79 years, and discounted payback time 4.42 years.
KSA is planning huge projects to harness solar energy to shift the nation dependence on fossil fuel to renewable energy. The plan of 200 GW solar energy systems in KSA, accompanied by high voltage DC transmission, can power future energy needs of European countries. The Middle East can transform energy production from fossil fuel to renewable energy. In this work, the advantages of on-site solar energy are shown where not only solar power has shaved off the building load from national grid and improved the national grid load factor without any transmission losses, but also reduced the building cooling load by providing shade to the rooftop of the building.

5. Conclusions

A net-zero energy office building design for the building of College of Engineering, Majmaah University is analyzed for the available onsite renewable resources. PV and wind turbines in various configurations are studied to form a net-zero energy building. A PV system is found to be most feasible for this location, on the basis of net present value. The rooftop and parking area is used for the placement of PV panels. The self-shading in PV system is analyzed by varying the distance between the parallel PV arrays. The self-shading losses of 1.039% have been observed at a distance of 0.75 m, fully shaded rooftop, as the mean annual PV energy generation decreases from 594.39 kWh/m2 to 588.21 kWh/m2. The effect on cooling load of building by rooftop PV panels as shading devices offers a 12.3% saving in cooling load for a fully shaded rooftop, as annual cooling load decreased from 3.416 GWh to 2.996 GWh. The 2.815 MW installed capacity of PV generates 5.3 GWh, to satisfy a load of 4.96 GWh annually, to form a net-zero energy system where the grid sales and purchase are equal to 2.25 GWh. The hours of operation for PV are 4379, with a capacity factor of 21.5%. The NPC of project has been decreased from 4.77 million US$ to 4.41 million US$ by simply covering the rooftop completely by PV panels. The annual worth of the system is 27,406 US$, with a return on investment of 19.7%. The simple payback time of the project is 3.79 years, and discounted payback time 4.42 years. The fully shaded hybrid PV Wind case for NZEB is the second best scenario, with an NPC of 5 MUS$, and capital costs of 4.14 MUS$. This case has shown more renewable penetration than a PV only case of 71.4%. The on-site solar energy generation shows not only that solar power has shaved off the building load from national grid and improved the national grid load factor without any transmission losses, but also that it has reduced the building load by providing shade to the rooftop.

Author Contributions

M.Z. conceived the idea, A.A.-A. and A.B.A. performed the simulations. A.G.A.-K. analyzed the data and reviewed the manuscript. M.Z. and A.B.A. wrote the paper.

Acknowledgments

This research was supported by the Deanship of Scientific Research, Majmaah University, Majmaah, 11952, Kingdom of Saudi Arabia (Contract No. 38/109).

Conflicts of Interest

The authors declare no conflict of interest.

Nomenclature

NZEBNet Zero Energy Building
PVPhotovoltaic
NPCNet Present Cost
FSFully Shaded
NSNo Shading
SAMSystem Advisor Model
h c The convective heat transfer coefficient
T s u r f Surface temperature of rooftop
T a i r Outside air temperature of rooftop
P P V Is the output of the PV array
Y P V The rated capacity of the PV array, meaning its power output under standard test conditions [kW]
f P V The PV derating factor [%]
G ¯ T Solar radiation incident on the PV array in the current time step [kw/m2]
G ¯ T , S T C Incident radiation at standard test conditions [1 kw/m2]
α P Temperature coefficient of power [%/°C]
T c PV cell temperature in the current time step [°C]
T c , S T C PV cell temperature under standard test conditions [25 °C]
ε Long wave emittance
σ Stefan-Boltzmann constant
F P V View factor of the rooftop surface to PV surface [Range: 0–1]
F s k y View factor of the rooftop surface to sky [Range: 0–1]
F a i r View factor of the rooftop surface to air [Range: 0–1]
T P V Temperature of PV
T a i r Temperature of air
T s k y Temperature of sky
T s u r f a c e Temperature of the rooftop
EPCEngineering procurement and construction
O&MOperation and maintenance
IDOCost, insurance during operation
IDCInsurance during construction
PDCProject development cost
ROEReturn on equity
CoECollege of Engineering
LCOELevelized cost of energy (US$/kwh)

References

  1. Kreft, S.; Eckstein, D.; Melchior, I. Global Climate Risk Index 2017 Who Suffers Most from Extreme Weather Events? Weather-Related Loss Events in 2015 and 1996 to 2015; Germanwatch e.V.: Bonn, Germany, 2017. [Google Scholar]
  2. Lesk, C.; Rowhani, P.; Ramankutty, N. Influence of extreme weather disasters on global crop production. Nature 2016, 529, 84–87. [Google Scholar] [CrossRef] [PubMed]
  3. Naumann, G.; Alfieri, L.; Wyser, K.; Mentaschi, L.; Betts, R.A.; Carrao, H.; Spinoni, J.; Vogt, J.; Feyen, L. Global Changes in Drought Conditions under Different Levels of Warming. Geophys. Res. Lett. 2018. [Google Scholar] [CrossRef]
  4. Spliethoff, H. Effect of Slag, Ash and Flue Gas on Furnace Walls and Convective Heat Transfer Surfaces (Operational Problems); Academic Press: Cambridge, MA, USA, 2010; ISBN 9780874216561. [Google Scholar]
  5. Oreskes, N. The Scientific Consensus on Climate Change: How Do We Know We’re Not Wrong? In Climate Modelling; Springer International Publishing: Cham, Switzerland, 2018; Volume 306, pp. 31–64. [Google Scholar]
  6. United Nations Paris Agreement, FCCC/CP/2015/L.9. Available online: https://unfccc.int/resource/docs/2015/cop21/eng/l09r01.pdf (accessed on 12 January 2018).
  7. Directive No. 2009/28/EC of the European Parliament and of the Council of 23 April 2009, on the Promotion of the Use of Energy from Renewable Sources and Amending and Subsequently Repealing Directives No. 2001/77/EC and No. 2003/30/EC. © European Union, 1998–2015. Available online: http://www.wipo.int/wipolex/en/details.jsp?id=15751 (accessed on 12 January 2018).
  8. Yamada, M. Vision 2030 and the Birth of Saudi Solar Energy; Middle East Institute: Washinton, DC, USA, 2016. [Google Scholar]
  9. Government of Saudi Arabia a Renewable Energy Market, Saudi Arabia Vision 2030. Available online: http://vision2030.gov.sa/en/node/87 (accessed on 12 January 2018).
  10. Awan, A.B.; Zubair, M.; Praveen, R.P.; Abokhalil, A.G. Solar Energy Resource Analysis and Evaluation of Photovoltaic System Performance in Various Regions of Saudi Arabia. Sustainability 2018, 10, 1129. [Google Scholar] [CrossRef]
  11. Khan, H.; Asif, M. Impact of Green Roof and Orientation on the Energy Performance of Buildings: A Case Study from Saudi Arabia. Sustainability 2017, 9, 640. [Google Scholar] [CrossRef]
  12. BNE Finance. Global Trends in Renewable Energy Investment; Frankfurt School: Frankfurt am Main, Germany, 2018. [Google Scholar]
  13. Power, A. ACWA Power Wins the First Ever Utility Scale Renewable Energy Project in Saudi Arabia. Available online: http://www.acwapower.com/en/news/press-releases/acwa-power-wins-the-first-ever-utility-scale-renewable-energy-project-in-saudi-arabia/ (accessed on 9 April 2018).
  14. Bloomberg Saudis, SoftBank Plan World’s Largest Solar Project. Available online: https://www.bloomberg.com/news/articles/2018-03-28/saudi-arabia-softbank-ink-deal-on-200-billion-solar-project (accessed on 9 April 2018).
  15. He, Z.; Xiao, B.; Liu, F.; Wu, H.; Yang, Y.; Xiao, S.; Wang, C.; Russell, T.P.; Cao, Y. Single-junction polymer solar cells with high efficiency and photovoltage. Nat. Photonics 2015, 9, 174–179. [Google Scholar] [CrossRef]
  16. Li, W.; Hendriks, K.H.; Furlan, A.; Wienk, M.M.; Janssen, R.A.J. High quantum efficiencies in polymer solar cells at energy losses below 0.6 eV. J. Am. Chem. Soc. 2015, 137, 2231–2234. [Google Scholar] [CrossRef] [PubMed]
  17. Green, M.A. Thin-film solar cells: Review of materials, technologies and commercial status. J. Mater. Sci. 2007. [Google Scholar] [CrossRef]
  18. Zubair, M.; Mustafa, M.; Lee, K.; Yoon, C.; Doh, Y.H.; Choi, K.H. Fabrication of CdSe/ZnS quantum dots thin film by electrohydrodynamics atomization technique for solution based flexible hybrid OLED application. Chem. Eng. J. 2014, 253, 325–331. [Google Scholar] [CrossRef]
  19. Yoshikawa, K.; Kawasaki, H.; Yoshida, W.; Irie, T.; Konishi, K.; Nakano, K.; Uto, T.; Adachi, D.; Kanematsu, M.; Uzu, H.; et al. Silicon heterojunction solar cell with interdigitated back contacts for a photoconversion efficiency over 26%. Nat. Energy 2017, 2, 17032. [Google Scholar] [CrossRef]
  20. Cariou, R.; Benick, J.; Feldmann, F.; Höhn, O.; Hauser, H.; Beutel, P.; Razek, N.; Wimplinger, M.; Bläsi, B.; Lackner, D.; et al. III–V-on-silicon solar cells reaching 33% photoconversion efficiency in two-terminal configuration. Nat. Energy 2018, 3, 326–333. [Google Scholar] [CrossRef]
  21. Kato, T.; Handa, A.; Yagioka, T.; Matsuura, T.; Yamamoto, K.; Higashi, S.; Wu, J.L.; Tai, K.F.; Hiroi, H.; Yoshiyama, T.; et al. Enhanced Efficiency of Cd-Free Cu(In,Ga)(Se,S)2Minimodule Via (Zn,Mg)O Second Buffer Layer and Alkali Metal Post-Treatment. IEEE J. Photovolta. 2017, 7, 1773–1780. [Google Scholar] [CrossRef]
  22. NREL PV Efficiency Chart. Available online: https://www.nrel.gov/pv/assets/images/efficiency-chart.png (accessed on 10 April 2018).
  23. Green, M.A.; Hishikawa, Y.; Dunlop, E.D.; Levi, D.H.; Hohl-Ebinger, J.; Ho-Baillie, A.W.Y. Solar cell efficiency tables (version 51). Prog. Photovolt. Res. Appl. 2018, 26, 3–12. [Google Scholar] [CrossRef]
  24. Kurtz, S.; Repins, I.; Metzger, W.K.; Verlinden, P.J.; Huang, S.; Bowden, S.; Tappan, I.; Emery, K.; Kazmerski, L.L.; Levi, D. Historical Analysis of Champion Photovoltaic Module Efficiencies. IEEE J. Photovolt. 2018, 8, 363–372. [Google Scholar] [CrossRef]
  25. Frankfurt School and UNEP Global Trends in Renewable Energy; Frankfurt School: Frankfurt am Main, Germany, 2016; pp. 1–84.
  26. Fu, R.; Chung, D.; Lowder, T.; Feldman, D.; Ardani, K.; Fu, R.; Chung, D.; Lowder, T.; Feldman, D.; Ardani, K.U.S. Solar Photovoltaic System Cost Benchmark: Q1 2017 U.S. Solar Photovoltaic System Cost Benchmark: Q1 2017. Nrel 2017. [Google Scholar] [CrossRef]
  27. Breyer, C.; Bogdanov, D.; Aghahosseini, A.; Gulagi, A.; Child, M.; Oyewo, A.S.; Farfan, J.; Sadovskaia, K.; Vainikka, P. Solar photovoltaics demand for the global energy transition in the power sector. Prog. Photovolta. Res. Appl. 2017, 1–19. [Google Scholar] [CrossRef]
  28. Praveen, R.P.; Baseer, M.A.; Awan, A.B.; Zubair, M. Performance Analysis and Optimization of a Parabolic Trough Solar Power Plant in the Middle East Region. Energies 2018, 11, 741. [Google Scholar] [CrossRef]
  29. Awan, A.B.; Khan, Z.A. Recent progress in renewable energy—Remedy of energy crisis in Pakistan. Renew. Sustain. Energy Rev. 2014, 33, 236–253. [Google Scholar] [CrossRef]
  30. Farnoosh, A.; Lantz, F.; Percebois, J. Electricity generation analyses in an oil-exporting country: Transition to non-fossil fuel based power units in Saudi Arabia. Energy 2014, 69, 299–308. [Google Scholar] [CrossRef]
  31. Fattouh, B. Summer Again: The Swing in Oil Demand in Saudi Bassam Fattouh; Oxford Energy Comment; The Oxford Institute for Energy Studies: Oxford, UK, 2013; pp. 1–8. [Google Scholar]
  32. Collins, R.D.; Gowharji, W.; Habib, A.; Alwajeeh, R.; Stephen, R. Evaluating scenarios of capacity expansion given high seasonal variability of electricity demand: The case of Saudi Arabia. In Proceedings of the 31st International Conference of the System Dynamics Society, Cambridge, MA, USA, 21–25 July 2013; pp. 1–15. [Google Scholar]
  33. Rafique, M.M.; Rehman, S.; Lashin, A.; Al Arifi, N. Analysis of a solar cooling system for climatic conditions of five different cities of Saudi Arabia. Energies 2016, 9, 75. [Google Scholar] [CrossRef]
  34. Cellura, M.; Campanella, L.; Ciulla, G.; Guarino, F.; Lo Brano, V.; Cesarini, D.N.; Orioli, A. The redesign of an Italian building to reach net zero energy performances: A case study of the SHC Task 40-ECBCS Annex 52. Presented at ASHRAE Transactions, Montreal, QC, Canada, 1 July 2011. [Google Scholar]
  35. Mohamed, A.; Hasan, A.; Sirén, K. Fulfillment of net-zero energy building (NZEB) with four metrics in a single family house with different heating alternatives. Appl. Energy 2014, 114, 385–399. [Google Scholar] [CrossRef]
  36. Kilkiş, Ş. Energy system analysis of a pilot net-zero exergy district. Energy Convers. Manag. 2014, 87, 1077–1092. [Google Scholar] [CrossRef]
  37. Kolokotsa, D.; Rovas, D.; Kosmatopoulos, E.; Kalaitzakis, K. A roadmap towards intelligent net zero- and positive-energy buildings. Sol. Energy 2011. [Google Scholar] [CrossRef]
  38. Wells, L.; Rismanchi, B.; Aye, L. A review of Net Zero Energy Buildings with reflections on the Australian context. Energy Build. 2018, 158, 616–628. [Google Scholar] [CrossRef]
  39. Doroudchi, E.; Alanne, K.; Okur, Ö.; Kyyrä, J.; Lehtonen, M. Approaching net zero energy housing through integrated EV. Sustain. Cities Soc. 2018, 38, 534–542. [Google Scholar] [CrossRef]
  40. Tsangrassoulis, A.; Li, D.H.W. Energy efficient lighting strategies in buildings. Energy Build. 2018, 165, 284–285. [Google Scholar] [CrossRef]
  41. Gobbato, C.; Kohler, S.V.; de Souza, I.H.; Denardin, G.W.; de Pelegrini Lopes, J. Integrated Topology of DC-DC Converter for LED Street Lighting System Based on Modular Drivers. IEEE Trans. Ind. Appl. 2018, 9994. [Google Scholar] [CrossRef]
  42. Al Dakheel, J.; Tabet Aoul, K. Building Applications, Opportunities and Challenges of Active Shading Systems: A State-of-the-Art Review. Energies 2017, 10, 1672. [Google Scholar] [CrossRef]
  43. Kirimtat, A.; Koyunbaba, B.K.; Chatzikonstantinou, I.; Sariyildiz, S. Review of simulation modeling for shading devices in buildings. Renew. Sustain. Energy Rev. 2016, 53, 23–49. [Google Scholar] [CrossRef]
  44. Peng, L.L.H.; Jim, C.Y. Green-roof effects on neighborhood microclimate and human thermal sensation. Energies 2013, 6, 598–618. [Google Scholar] [CrossRef] [Green Version]
  45. Dominguez, A.; Kleissl, J.; Luvall, J.C. Effects of solar photovoltaic panels on roof heat transfer. Sol. Energy 2011, 85, 2244–2255. [Google Scholar] [CrossRef]
  46. Kim, J.H.; Kim, H.R.; Kim, J.T. Analysis of photovoltaic applications in zero energy building cases of IEA SHC/EBC Task 40/Annex 52. Sustainability 2015, 7, 8782–8800. [Google Scholar] [CrossRef]
  47. NASA NASA Surface Meteorology and Solar Energy. Available online: https://eosweb.larc.nasa.gov/cgi-bin/sse/grid.cgi?&num=178144&lat=53&submit=Submit&hgt=100&veg=17&sitelev=&[email protected]&p=grid_id&step=2&lon=-3 (accessed on 1 April 2018).
  48. Scherba, A.; Sailor, D.J.; Rosenstiel, T.N.; Wamser, C.C. Modeling impacts of roof reflectivity, integrated photovoltaic panels and green roof systems on sensible heat flux into the urban environment. Build. Environ. 2011, 46, 2542–2551. [Google Scholar] [CrossRef]
  49. NREL. EnergyPlus Engineering Reference; NREL: Golden, CO, USA, 2018; pp. 1–1716.
  50. EnergySage. Solar Marketplace Intel Report H1 H2 2017; EnergySage: San Francisco, CA, USA, 2018. [Google Scholar]
  51. NTDC. Upfront Generation Tariff for Solar PV Power Plants and Wind Turbines; NTDC: Lahore, Pakistan, 2018; p. 63. [Google Scholar]
  52. Electricity & Cogeneration Regulatory Authority (ECRA). Annual Statistical Booklet for Electricity and Seawater Desalination Industries 2016; ECRA: Riyadh, Saudi Arabia, 2016.
  53. Almasoud, A.H.; Gandayh, H.M. Future of solar energy in Saudi Arabia. J. King Saud Univ. Eng. Sci. 2015, 27, 153–157. [Google Scholar] [CrossRef]
  54. Saudi Electric Company. Electrical Data 2000–2014; Saudi Electric Company: Cambridge, UK, 2014; Volume 1. [Google Scholar]
Figure 1. College of Engineering Majmaah (a) Model of Building; (b) Satellite Image.
Energies 11 01391 g001
Figure 2. The load curve of College of Engineering in Majmaah (a) Monthly average load; (b) Daily average load.
Energies 11 01391 g002
Figure 3. Temperature, Clearness Index and Irradiance of Majmaah University.
Energies 11 01391 g003
Figure 4. Wind Resources in Majmaah. (a) Monthly average wind speed; (b) Hourly average wind speed; (c) Wind speed duration curve; (d) Wind speed histogram.
Energies 11 01391 g004
Figure 5. Characteristics of wind turbine Enercon E53 800 kW.
Energies 11 01391 g005
Figure 6. Study of self-shading by SAM (a) Sun path diagram over College of Engineering building in SketchupPro; (b) Bird’s eye view of College of Engineering in SAM; (c) 3D scene of placing active surfaces (PV panels) in SAM, where the distance between two parallel arrays is shown.
Energies 11 01391 g006
Figure 7. Self-shading losses for critical months of January, February, March, October, November, and December.
Energies 11 01391 g007
Figure 8. Self-shading losses for PV arrays and the PV output corresponding to the parallel placement distance. The number of PV Panels depends on the rooftop area.
Energies 11 01391 g008
Figure 9. Comparison between the saving in cooling load of building with the self-shading of PV arrays by placing them at a various distance on building rooftop, and the net energy required to maintain the temperature in the building by using rooftop PV energy generation.
Energies 11 01391 g009
Figure 10. System schematic of Hybrid Solar Wind Energy System in HomerPro.
Energies 11 01391 g010
Figure 11. Hourly average PV energy generation, electrical load, grid sales, grid purchases, GHI, and temperature in a year.
Energies 11 01391 g011
Figure 12. Hourly based yearly average PV energy generation, electrical load, grid sales, grid purchases, and GHI.
Energies 11 01391 g012
Figure 13. The datamap of the system (a) Solar Energy generation in kW (b) Energy Purchased from the Grid in kW; (c) Energy Sold to the Grid in kW; (d) Percentage of Renewable Energy Penetration.
Energies 11 01391 g013
Figure 14. Net present cost (NPC) of scenario 5 with respect to components and cost type.
Energies 11 01391 g014
Figure 15. Yearly cash flow diagram of scenario 5 by cost type.
Energies 11 01391 g015
Figure 16. Yearly cash flow diagram of scenario 5 by components.
Energies 11 01391 g016
Table 1. The Monthly Tilt angle for Majmaah City [47].
Jan.Feb.Mar.Apr.MayJun.Jul.Aug.Sep.Oct.Nov.Dec.
51432913000623394853
Table 2. Parameters for Building Energy simulation in EnergyPlus.
ParameterValues
Number of people/100 m25.382
Lighting Power Density10.7639
Electrical Equipment Power Density10.7639
Thermostat (Cooling)25.0 °C
Thermostat (Heating)20.0 °C
Exterior Wall
Outside LayerM01 100 mm brick
Layer 2M15 200 mm heavyweight concrete
Layer 3I02 50 mm insulation board
Layer 4F04 Wall air space resistance
Layer 5G01a 19 mm gypsum board
Exterior Roof
Outside LayerM11 100 mm lightweight concrete
Layer 2F05 Ceiling air space resistance
Layer 3F16 Acoustic tile
Interior Ceiling
Outside LayerM11 100 mm lightweight concrete
Layer 2F05 Ceiling air space resistance
Layer 3F16 Acoustic tile
Exterior Window
Outside LayerClear 3 mm
Layer 2Air 13 mm
Layer 3Clear 3 mm
Window
Thickness {m}0.003
Solar Transmittance at Normal Incidence0.837
Visible Transmittance at Normal Incidence0.898
Infrared Transmittance at Normal Incidence0
Conductivity {W/m-K}0.9
Office Lights Schedule
WeekdaysWeekendsHolidays
Until: 05:000.05Until: 06:000.05Until: 24:000.05
Until: 07:000.1Until: 08:000.1
Until: 08:000.3Until: 12:000.3
Until: 17:000.9Until: 17:000.15
Until: 18:000.5Until: 24:000.05
Until: 20:000.3
Until: 22:000.2
Until: 23:000.1
Until: 24:000.05
Office Equipment Schedule
WeekdaysWeekendsHolidays
Until: 08:000.40Until: 06:000.30Until: 24:000.30
Until: 12:000.90Until: 08:000.4
Until: 13:000.80Until: 12:000.5
Until: 17:000.90Until: 17:000.35
Until: 18:000.50Until: 24:000.30
Until: 24:000.40
Office Occupancy Schedule
WeekdaysWeekendsHolidays
Until: 06:000.0Until: 06:000.0Until: 06:000.0
Until: 07:000.1Until: 08:000.1Until: 18:000.0
Until: 08:000.2Until: 12:000.3Until: 24:000.0
Until: 12:000.95Until: 17:000.1
Until: 13:000.5Until: 19:000.0
Until: 17:000.95Until: 24:000.0
Until: 18:000.3
Until: 20:000.1
Until: 24:000.05
Table 3. Cost parameters of Solar and Wind [51].
DescriptionCost
SolarEPC Cost (US$/MW)1,021,431
PDC (US$/MW)36,658
IDC (US$/MW)10,714
Net Initial Cost (US$/kW) 1068.80
O&M US$/kW/year7.82286
Insurance US$/kW/year3.37714
WindEPC Cost + PDC + IDC (MUS$/MW)1.93
O&M (USC/kWh)1.1986
Insurance (USC/kWh)0.2523
Table 4. Comparison of six scenarios of renewable energy systems.
ScenarioNPCCapital CostLCOEInstalled PVInstalled WindSystem ConverterBatteriesGrid SalesGrid PurchaseRenewable Penetration
MUS$MUS$(US$/kWh)MWMWMWQtyGWhGWh%
1. Off-grid Hybrid26.117.50.37507.3821.63.25018,384--100
2. PV only (NS)4.773.950.04723.055-2.270-2.542.4468.8
3. Wind only (NS)7.186.180.0658-3.2--3.062.7267.8
4. Hybrid (NS)5.374.440.05502.2380.81.670-2.172.1771.2
5. PV (FS)4.413.640.04722.815-2.097-2.252.2568.8
6. Hybrid (FS)5.004.140.05562.0050.81.495-1.991.9971.4