Article

Methodical Aspects of Biogas Production in Small-Volume Bioreactors in Laboratory Investigations

Institute of Agrophysics, Polish Academy of Sciences, Doświadczalna 4, 20-290 Lublin, Poland
*
Author to whom correspondence should be addressed.
Energies 2018, 11(6), 1378; https://doi.org/10.3390/en11061378
Submission received: 27 April 2018 / Revised: 22 May 2018 / Accepted: 25 May 2018 / Published: 29 May 2018

Abstract

:
The aim of this study was to develop a methodology to investigate the biofermentation process in small-volume fermenters. Dark serum bottles with a volume of 100–120 mL, tightly sealed with a rubber septum, were used as bioreactors. The optimum measurement conditions in this type of bioreactor comprise: (i) filling two-thirds of the maximum volume with a suspension; (ii) a 2% bioreactor loading (on a dry basis) and; (iii) the daily equalization of pressure by removing the biogas through the septum pierced with a syringe needle and the intensive mixing of the remaining suspension. The methane yield (quantity and dynamics) obtained in this type of bioreactor is analogous to that of industrial bioreactors or large-scale laboratory bioreactors. The use of small-volume bioreactors that can be incubated will facilitate the preliminary selection of analysed systems and provide an indication of those that should be investigated in large-scale bioreactors.

1. Introduction

Renewable energy is derived from a constantly increasing range of raw materials [1,2,3] that can be of plant [4,5,6] or animal [7,8] origin. The technologies developed in this field have already been widely applied in industry [9,10,11]. The practical application of biogas production installations does not exclude on-going development and improvement, which is evidenced by the latest reports [6,12,13]. Irrespective of the direction of research related to the development of biogas production technologies, three areas of research activity can be distinguished: (i) laboratory-scale experiments [1,8,14], (ii) semi-industrial scale experiments [15] and (iii) pilot experiments in industrial installations [16,17,18]. Since scientific research is inherently associated with a large number of experiments (multifarious aspects investigated in many repetitions), the technical possibilities of conducting such investigations in large-scale installations pose a problem. The larger the bioreactor, the more similar the research conditions are to industrial-scale bioreactors and the more difficult it is to perform multiple repetitions. Given the necessity to take measurements for many systems in several week-long experiments, the use of large-scale bioreactors is virtually impossible.
It is, therefore, not surprising that researchers use different types and sizes of laboratory bioreactors with a substantially lower volume than that of industrial installations. The data presented in Table 1 confirms that laboratory scale is still important for investigations. Taking into account the volumes of the bioreactors, we divided them into three groups: large volume (>2.5 dm3), medium volume (≤2.5 dm3 and >250 mL), and small volume (≤250 mL). However, the volume of the bioreactor is not the only differentiating factor. The construction is usually volume-dependent. The large volume bioreactors (Table 1) are generally miniatures of the full-scale bioreactors. This means that they usually have a similar construction and more or less advanced automation. The medium-scale bioreactors are usually different kinds of bottles or other laboratory vessels. Automation is not often used in such bioreactors and, therefore, all actions undertaken during the biogas production are carried out manually. The advantages of medium scale bioreactors are that they take up far less space and are much cheaper. However, mass measurements are still technically difficult because less space does not mean small space.
The last group of bioreactors presented in Table 1 have a small volume. Serum bottles are used in the vast majority but even smaller vials are also applied. It is obvious that such small-volume vessels must be hermetically sealed and that it is not possible to automate the system. This means that with the assumed frequency, the methane produced has to be released to avoid high pressures in the bottle. The consequence of such a small volume is the necessity to use gas chromatography (GC) for gas quality measurements because the majority of other gas metres require large volumes of the gases. Thus, if small volume bioreactors have such disadvantages the question becomes—why are they used in research in so many laboratories? The answer is quite simple; they allow researchers to carry out mass screening investigations that are quick and cheap. The results obtained in such experiments can demonstrate the most effective method for larger-scale investigations.
As follows from the presented literature review, research on anaerobic digestion in small volumes exists. However, there is no literature that presents a methodology of conducting this type of research.
The purpose of this work is to find an optimal methodology for the production of biogas in small-volume bioreactors.
Hence, the importance of research on the methodology of biogas production in small volumes. An example here may be seen in the latest literature, which addresses the subject of research in the laboratory scale of anaerobic digestion [39,40,41,42,43].

2. Material and Methods

The substrate used for fermentation was chopped maize silage with 32.22% dry matter content. An agricultural biogas plant, using mainly maize silage and beet pulp, provided the bioreactor inoculum. The substrate and the inoculum were mixed at a weight ratio of 1:1 (total solids). The bioreactors prepared in this way were placed in an incubator in the dark at a temperature of 37 °C ± 1 °C. One hundred and twenty millilitre dark serum bottles that were tightly sealed with a rubber septum were used as bioreactors. The bottles were filled to a volume of 75 mL with the substrate and inoculum mixture.

2.1. The First Series of Measurements

The aim of the first series of measurements was to select the optimal loading of the bottle bioreactors. The bioreactor loading was differentiated using a mixture with a concentration corresponding to 2%, 7% and 13% (on a dry basis). This choice of loading was consistent with the information presented in the paper by Hilkiah Igoni et al. [44], who cited data provided by the Oregon State Department of Energy. According to these data, three ranges of loading, i.e., up to 2%, 2–10% and 11–13%, can be applied depending on the type of sludge and bioreactors. The extreme values were chosen for the investigations. A 7% loading value was selected from the 2–10% range.
In order to ensure the greatest similarity between the process occurring in the bottles and process carried out in industrial bioreactors, the produced biogas was removed daily (this procedure was carried out using the needle from a syringe) from the first series of bottles and its volume was measured. The measurements of the concentration of each component of the biogas (methane, carbon dioxide, oxygen and nitrogen) were performed on selected days of the week for three weeks using GC. In the results and discussion sections, this part of the experiment will be referred to as series one. The experiment in this series was carried out in five replications (replications should be understood as parallel measurements in separate bottles).

2.2. The Second Series of Measurements

The aim of the second series of measurements was to compare the methanogenesis yield under the conditions of the daily reduction of pressure (daily gas removal as in series one) and under pressure (no pressure reduction from the incubated bottles). The bottles were filled with silage and inoculum (at the same weight ratio as in series one) at 2% loading, selected on the basis of the results obtained in series one. In the variant with the daily reduction of pressure, measurements were carried out in three bottles throughout the experiment. After incubation, the bottles were opened and the pH was measured.
Only one measurement was taken in the variant without pressure reduction, i.e., on a chosen day of incubation (the same day as the measurements in the reduced-pressure bottles) the gas was removed from each bottle and its volume and composition were determined. Next, the bottle was opened and, after measuring the pH, the biomass was disposed of. This procedure necessitated the preparation of a greater number of bottles.
In series two, the experiment was conducted for three weeks in three replications (three parallel bottles per incubation day).

2.3. The Third Series of Measurements

The results obtained in the other series indicated that the biogas yield in the replications varied largely and the reaction of the suspension after the measurements sometimes exhibited excessive acidification (from the point of view of methane fermentation efficiency). Therefore, the aim of the third series of measurements was to check whether it was possible to adjust the pH at the beginning of the process in order to optimize methanogenesis in the bottles.
From the bioreactor load (2%) indicated by the results obtained in series one, a third series of measurements were performed (with the daily removal of the produced biogas) at different values of the initial pH of the suspension placed in the bottles. In the first variant, the suspension was incubated without any addition (the pH of the input mixture was 7.88). In the second variant, 1 g NaHCO3 (per gram of dry weight) was added to the input suspension. The determination of the biogas composition was carried out on specified days of the week and the incubation lasted for two and a half weeks. Following incubation, the bottles were opened and the pH was measured. The measurements of series three were performed in five replications. In each series, the content of the bottles was intensively stirred after each measurement of the volume of the produced biogas.
The composition of the biogas was determined chromatographically using a Schimadzu-14A gas detector equipped with a thermal conductivity detector (TCD) detector. A detector equipped with a 2 m column and a diameter of 3.2 mm and filled with Porapak Q was used for the determination of the methane content. Helium was used as a carrier gas in the chromatograph. The carrier gas-flow through the column was set at 40 mL·min−1. The temperatures of the column and the detector were 40 °C and 60 °C, respectively.

3. Results and Discussion

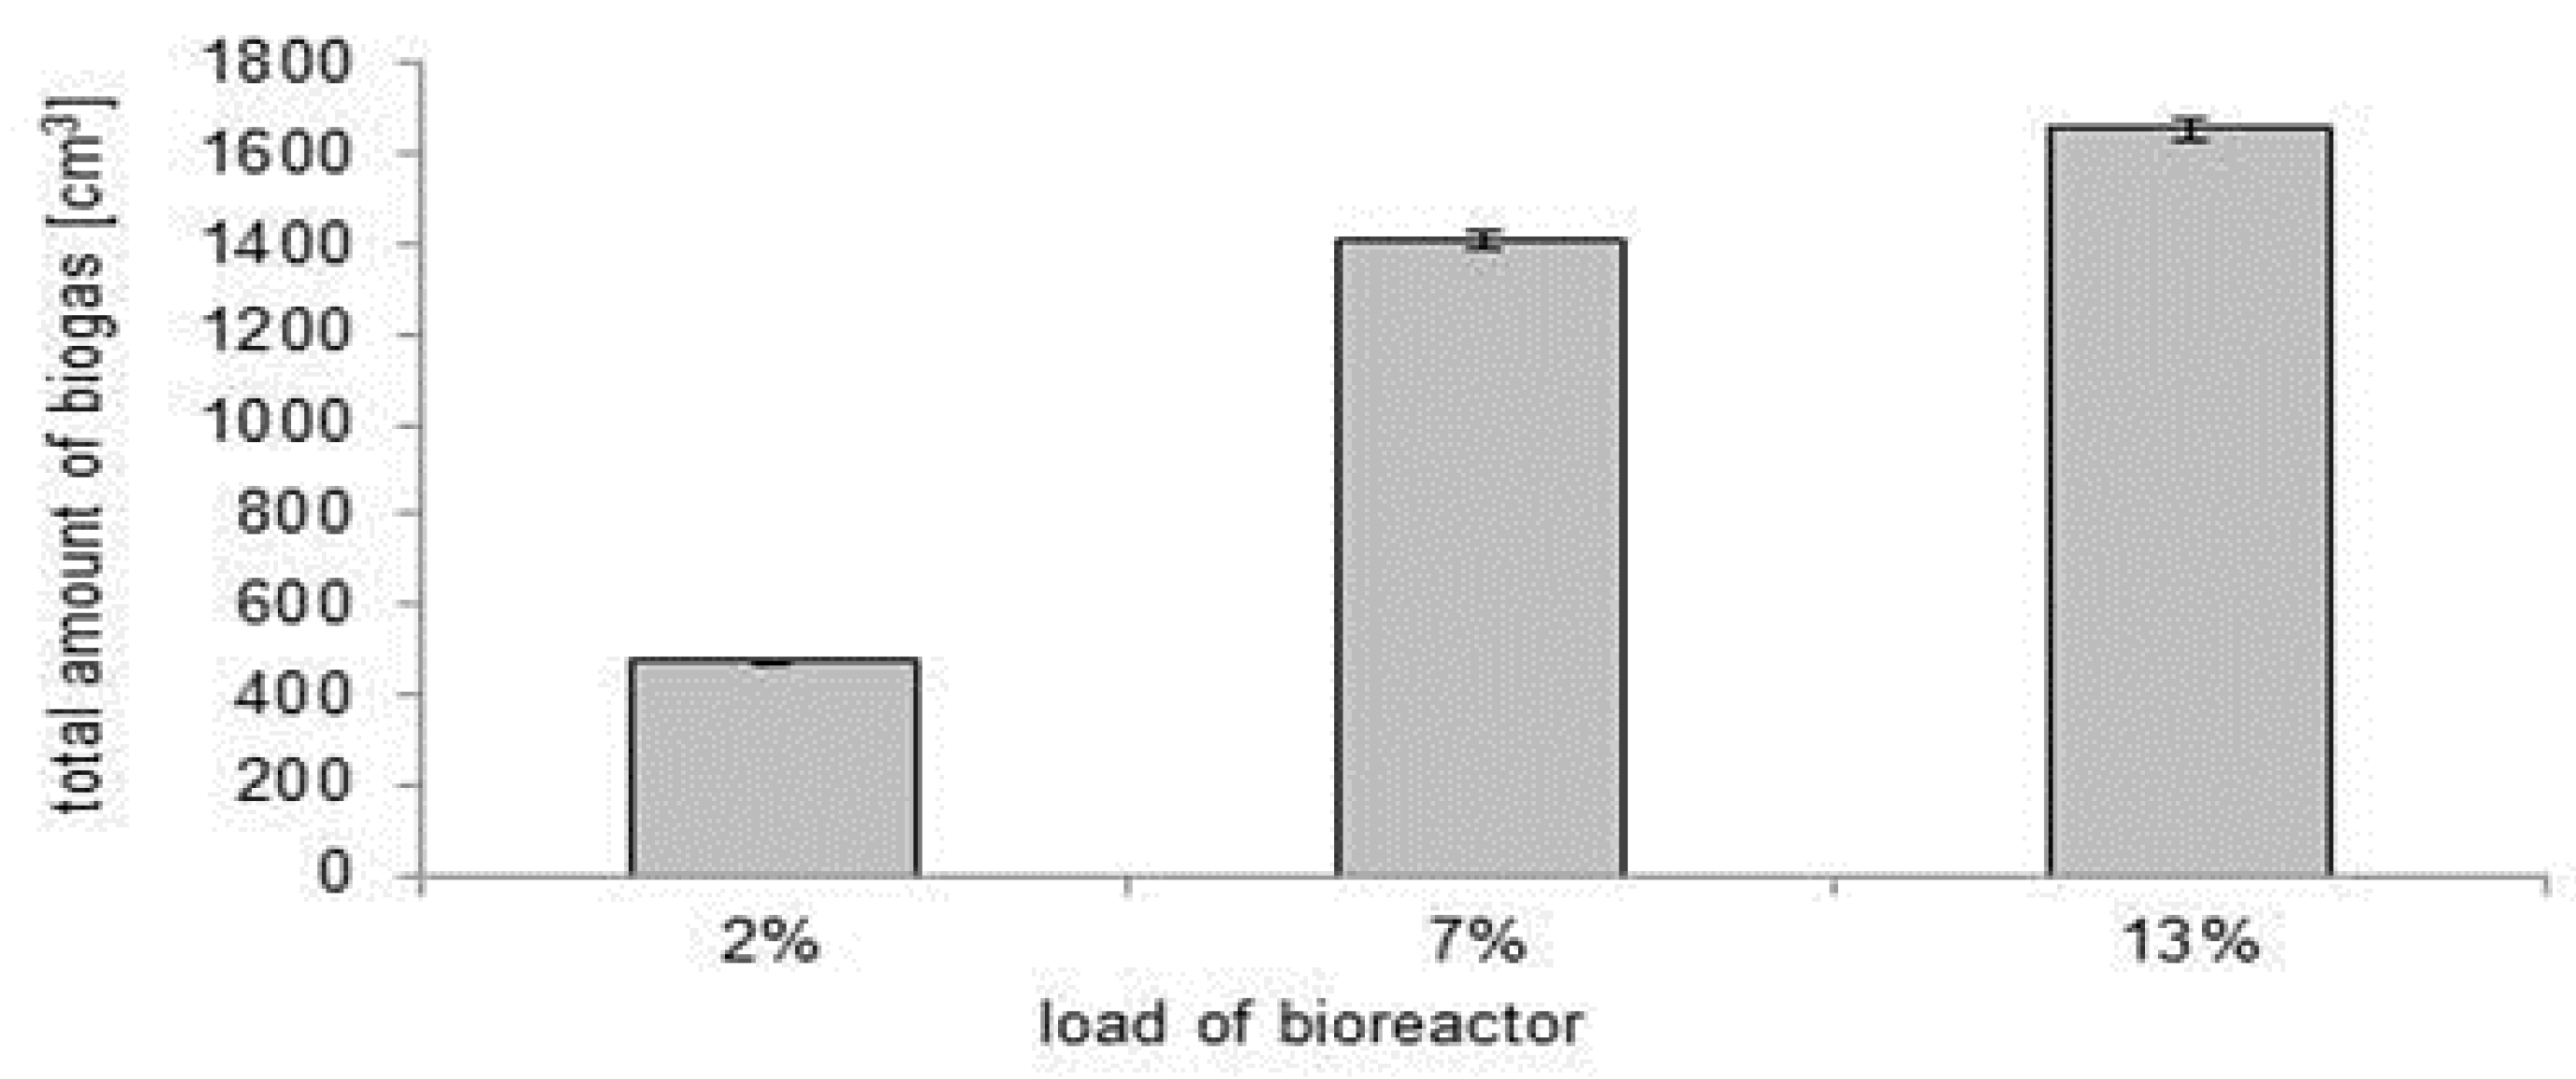
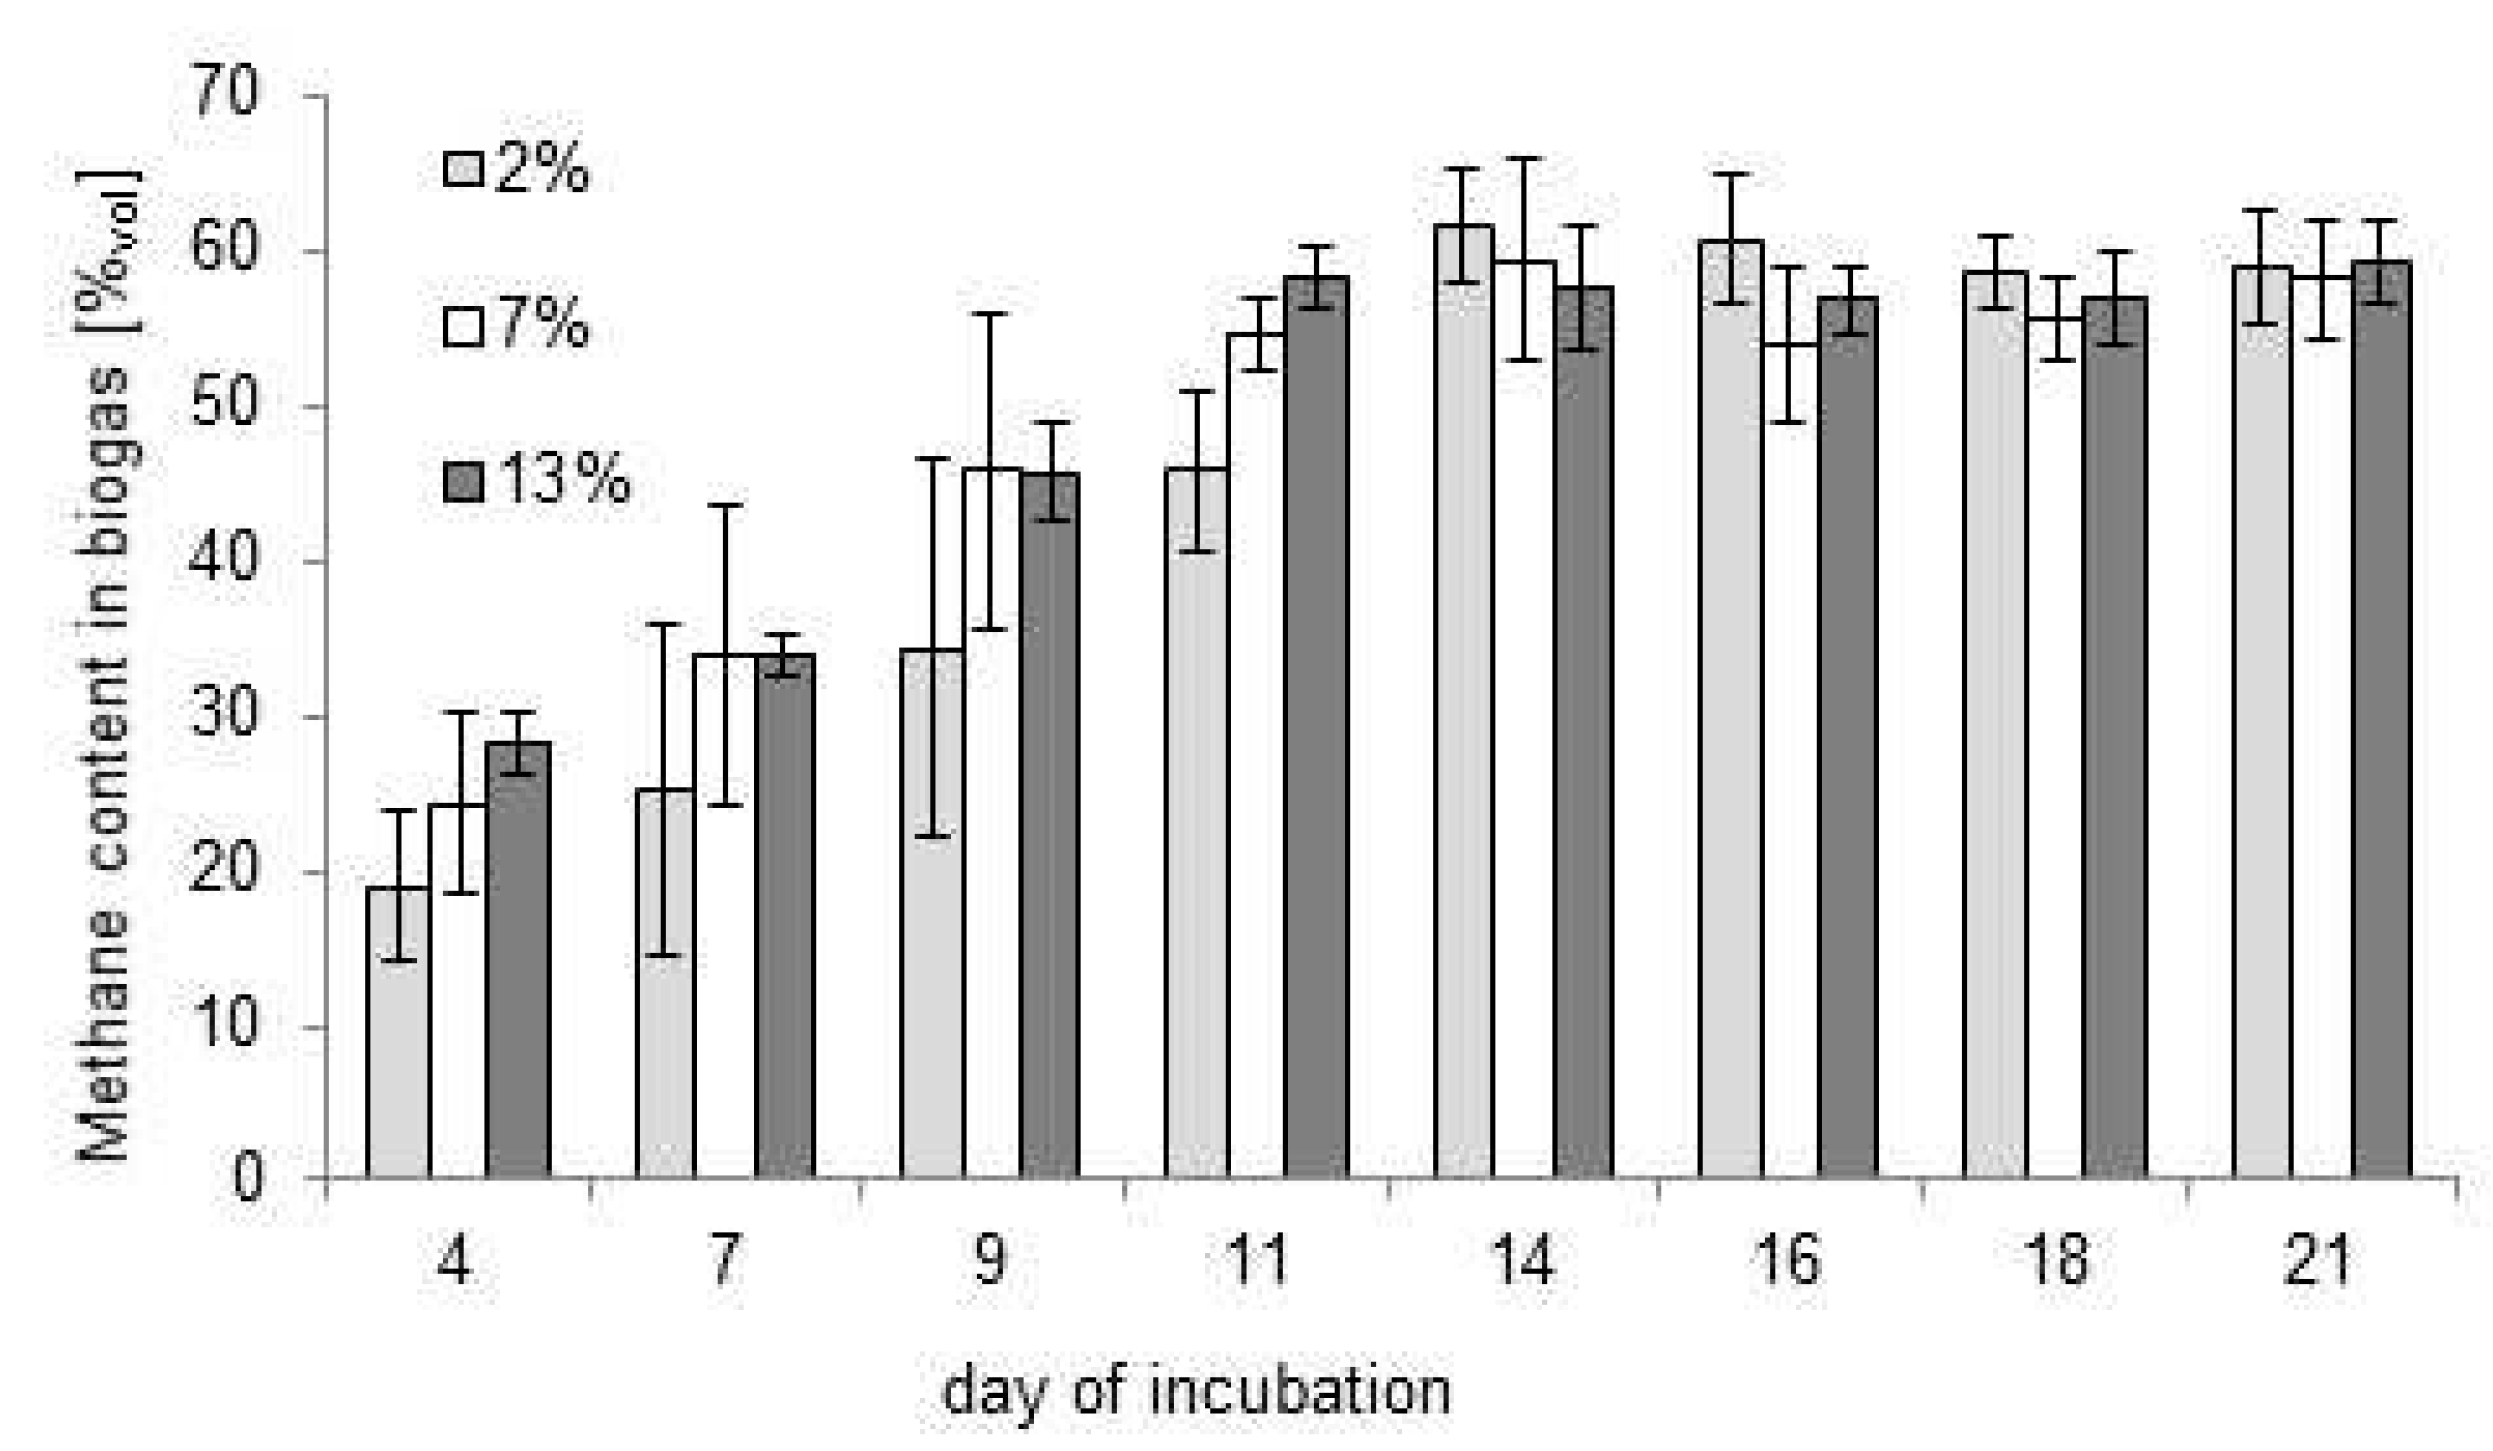
3.1. Choice of the Optimal Bioreactor Loading

In the first stage, the optimal loading had to be chosen for this type of bioreactor. The results obtained in the measurements from series one were used for this purpose. The total volume of the biogas obtained for each loading value during the three week incubation is presented in Figure 1. The content of methane in the biogas for all the bioreactor-loading values on the successive incubation days is presented in Figure 2.
As might be expected, the highest biogas yield was found in the highest bioreactor loading, i.e., 13% (Figure 1). However, it is worth noting that the difference in biogas yields between 7% and 13% was significantly lower than that between 2% and 7% (244 mL and 937 mL, respectively). This may indicate that the biogas production process at 13% loading was inhibited by pressure formed in the bottle and that the daily reduction thereof was insufficient. Another cause may lie in the fact that microorganisms are not capable of a quicker and efficient reduction of biomass and the production of biogas under excessive loading. This hypothesis is supported by the results presented in the paper by Betts et al. [45]. If the bioreactor is loaded with excessive amounts of biomass, slow growth of methanogenic bacteria can result in a rapid decline in pH throughout the process. This situation may be caused by intermediates produced in previous phases that have not been completely decomposed. Regardless of the actual cause of the decrease in dynamics of gas yields, 13% loading had to be excluded as it was too high. The primary reason for discarding 7% loading was the fact that, similar to 13% loading, the septa sealing the bottles were always bulging and, in some cases, the pressure was so high that the septum lost tightness and gas leaked out.
The total amount of biogas produced at 2% loading was lower than in the case of higher loads (Figure 1). This seems to be obvious: the lower the substrate input; the lower the biogas yield. However, it is worth analysing the methane content in the produced biogas. Analysis of trends on the graph presented in Figure 2 indicates that, at 2% loading, methane concentration in the first biofermentation stage (up to day 11) was lower than at other loading values. However, the analysis did not show statistically significant differences. Moreover, in the second stage (from day 14) of the experiments, concentrations of CH4 for the 2% loading were highest (there was still no statistical significance between the individual values of loaded biomass). The content of methane at the level of ~ 60% volume was high and comparable with other investigations in both laboratory [46] and industrial [16,17,47] bioreactors. Therefore, since this provides indirect information about the quality of the biofermentation process, the content of methane in the biogas implied the similar efficiency of the process, irrespective of the loading selected for the experiment. Thus, 2% (per dry weight) was assumed to be the best loading in the case of septum-sealed bottle bioreactors and, therefore, only the results obtained at this loading will be presented and discussed below.
Biogas composition (i.e., primarily methane content) derived in the biofermentation process in bottles with 2% loading did not raise any objections; in contrast, there was a problem of high divergence of results obtained in the parallel replications (Figure 2). This may have been caused by the relatively high variability of the pH value of the suspension.
As indicated in Table 2, in some cases the pH of the suspension dropped below 6.7, i.e., a value regarded as a threshold below which the biofermentation process is inhibited [48,49]. Carbon dioxide, which accumulated in the bottle and dissolved in the solution, forming HCO3-ions, was found to be a direct cause of suspension acidification [50]. In such cases, methane content in the biogas decreased. Since the same substrate and inoculum mixture was used in all of the replications, the suspension acidification in some bottles can be explained by the heterogeneity of the input mixture, even though it had been vigorously stirred to achieve homogenization [51].

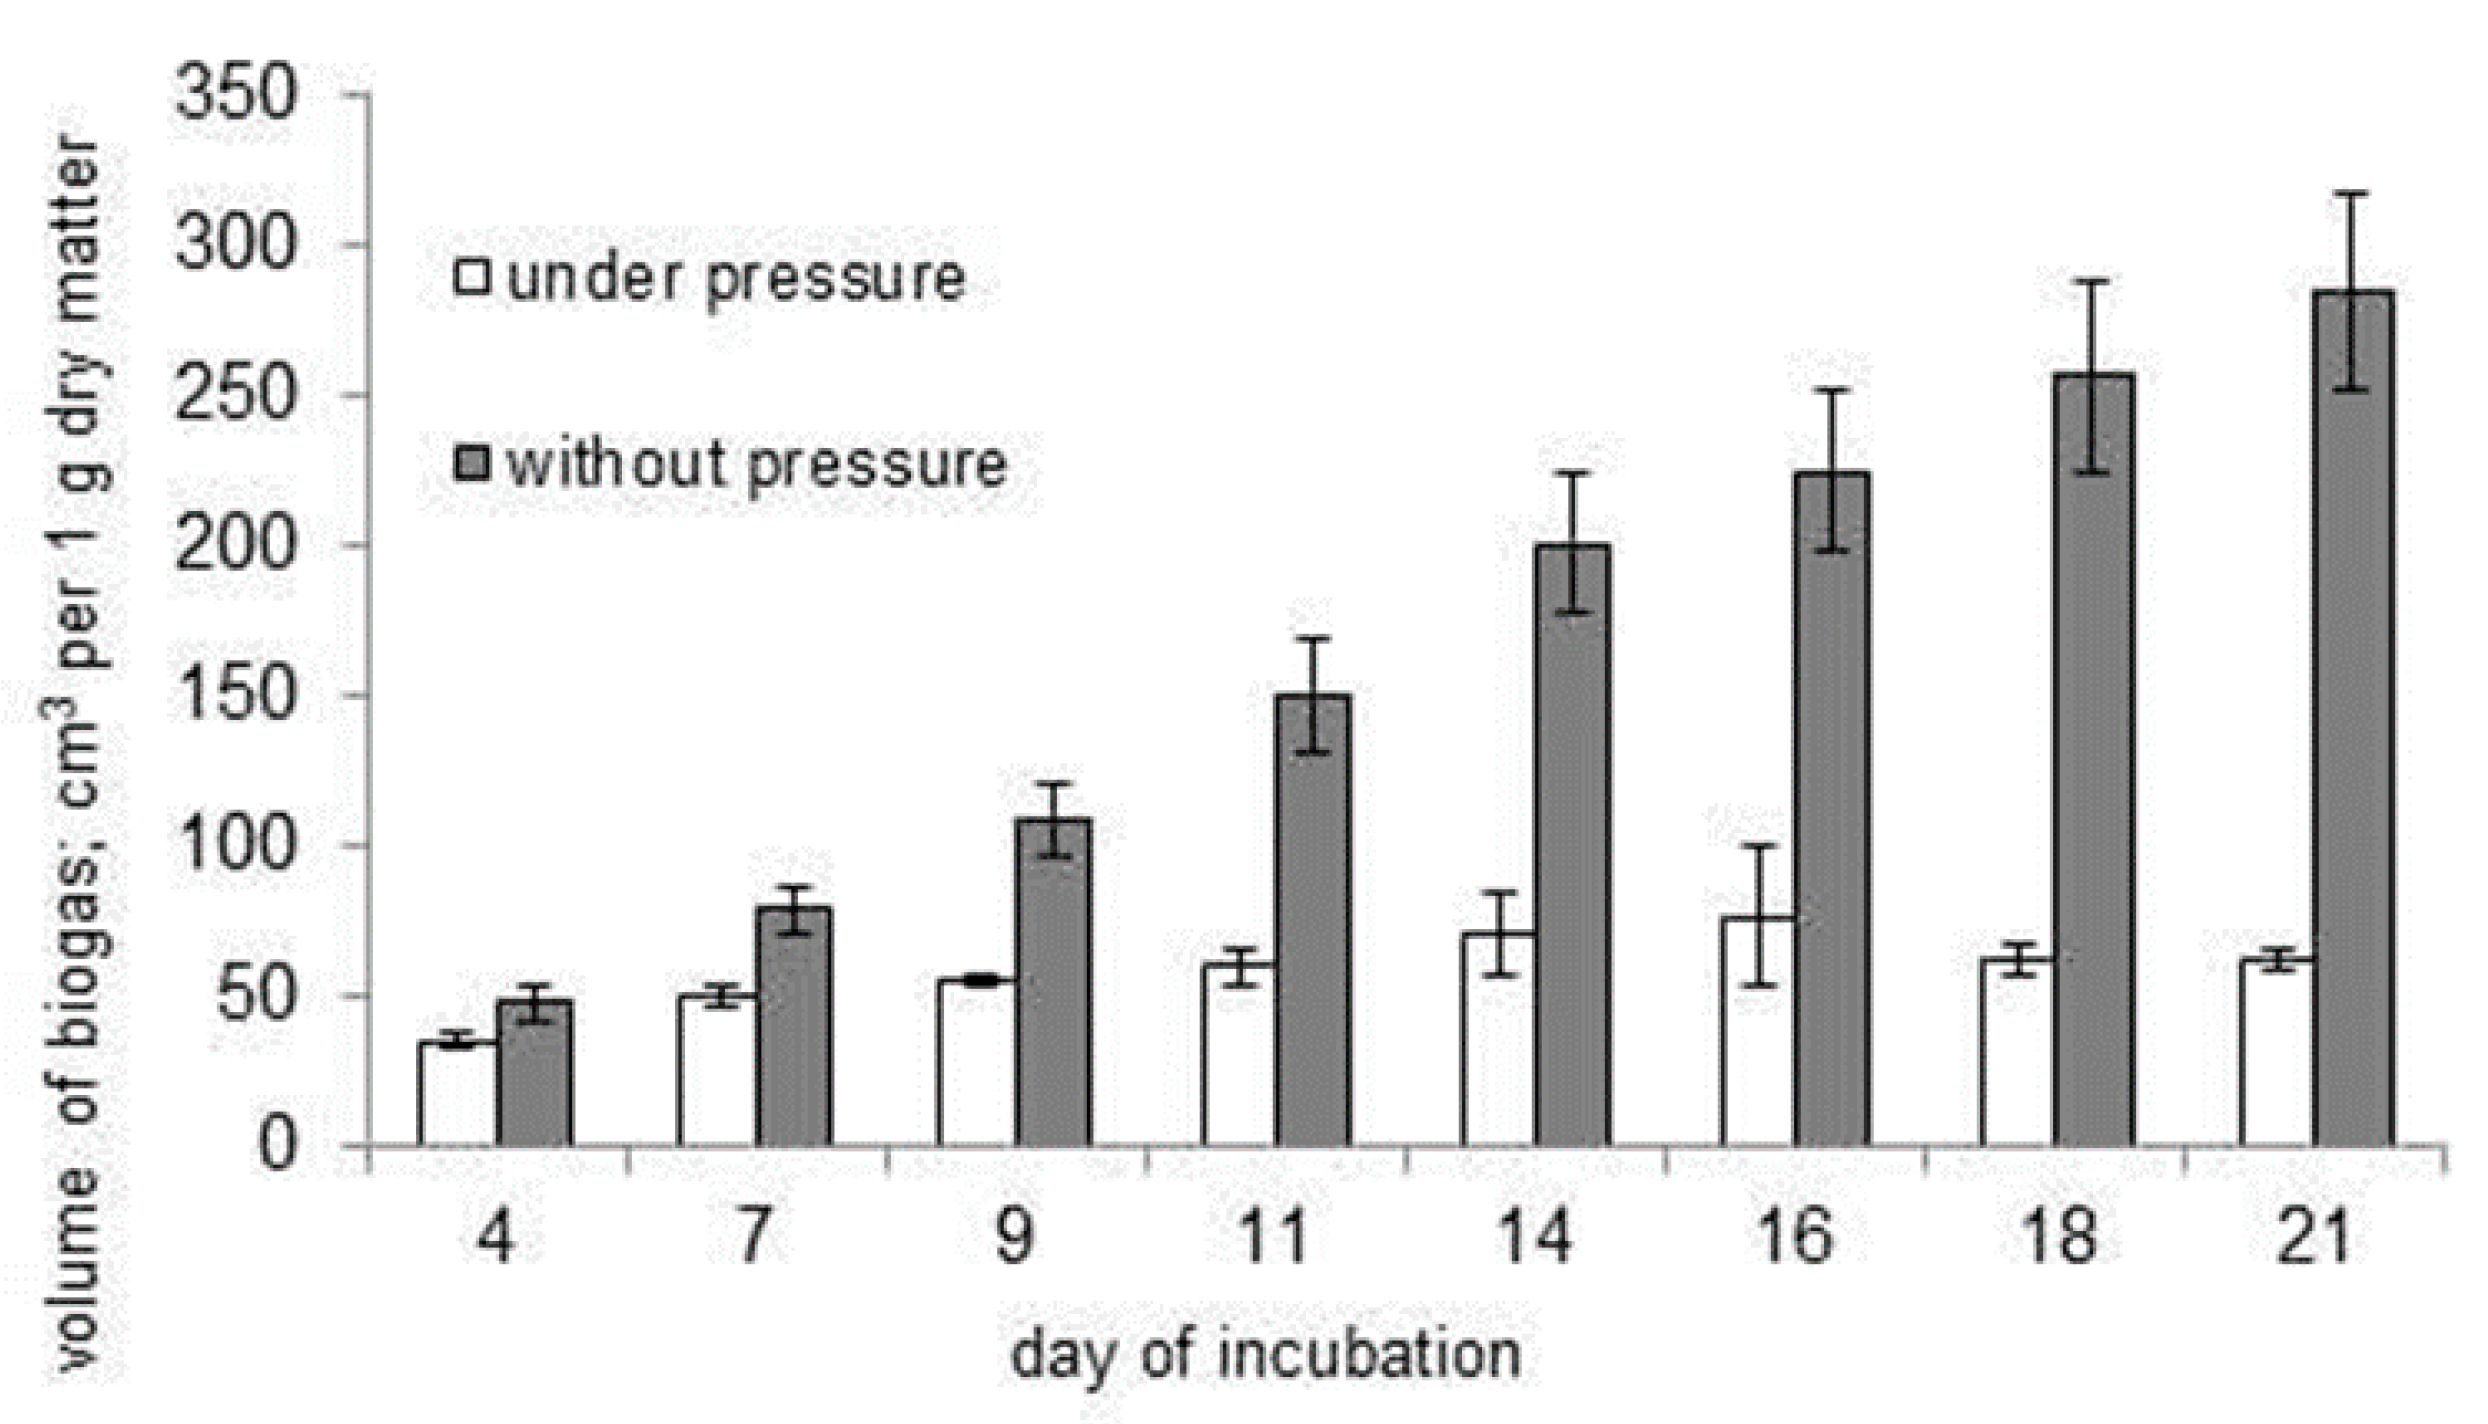
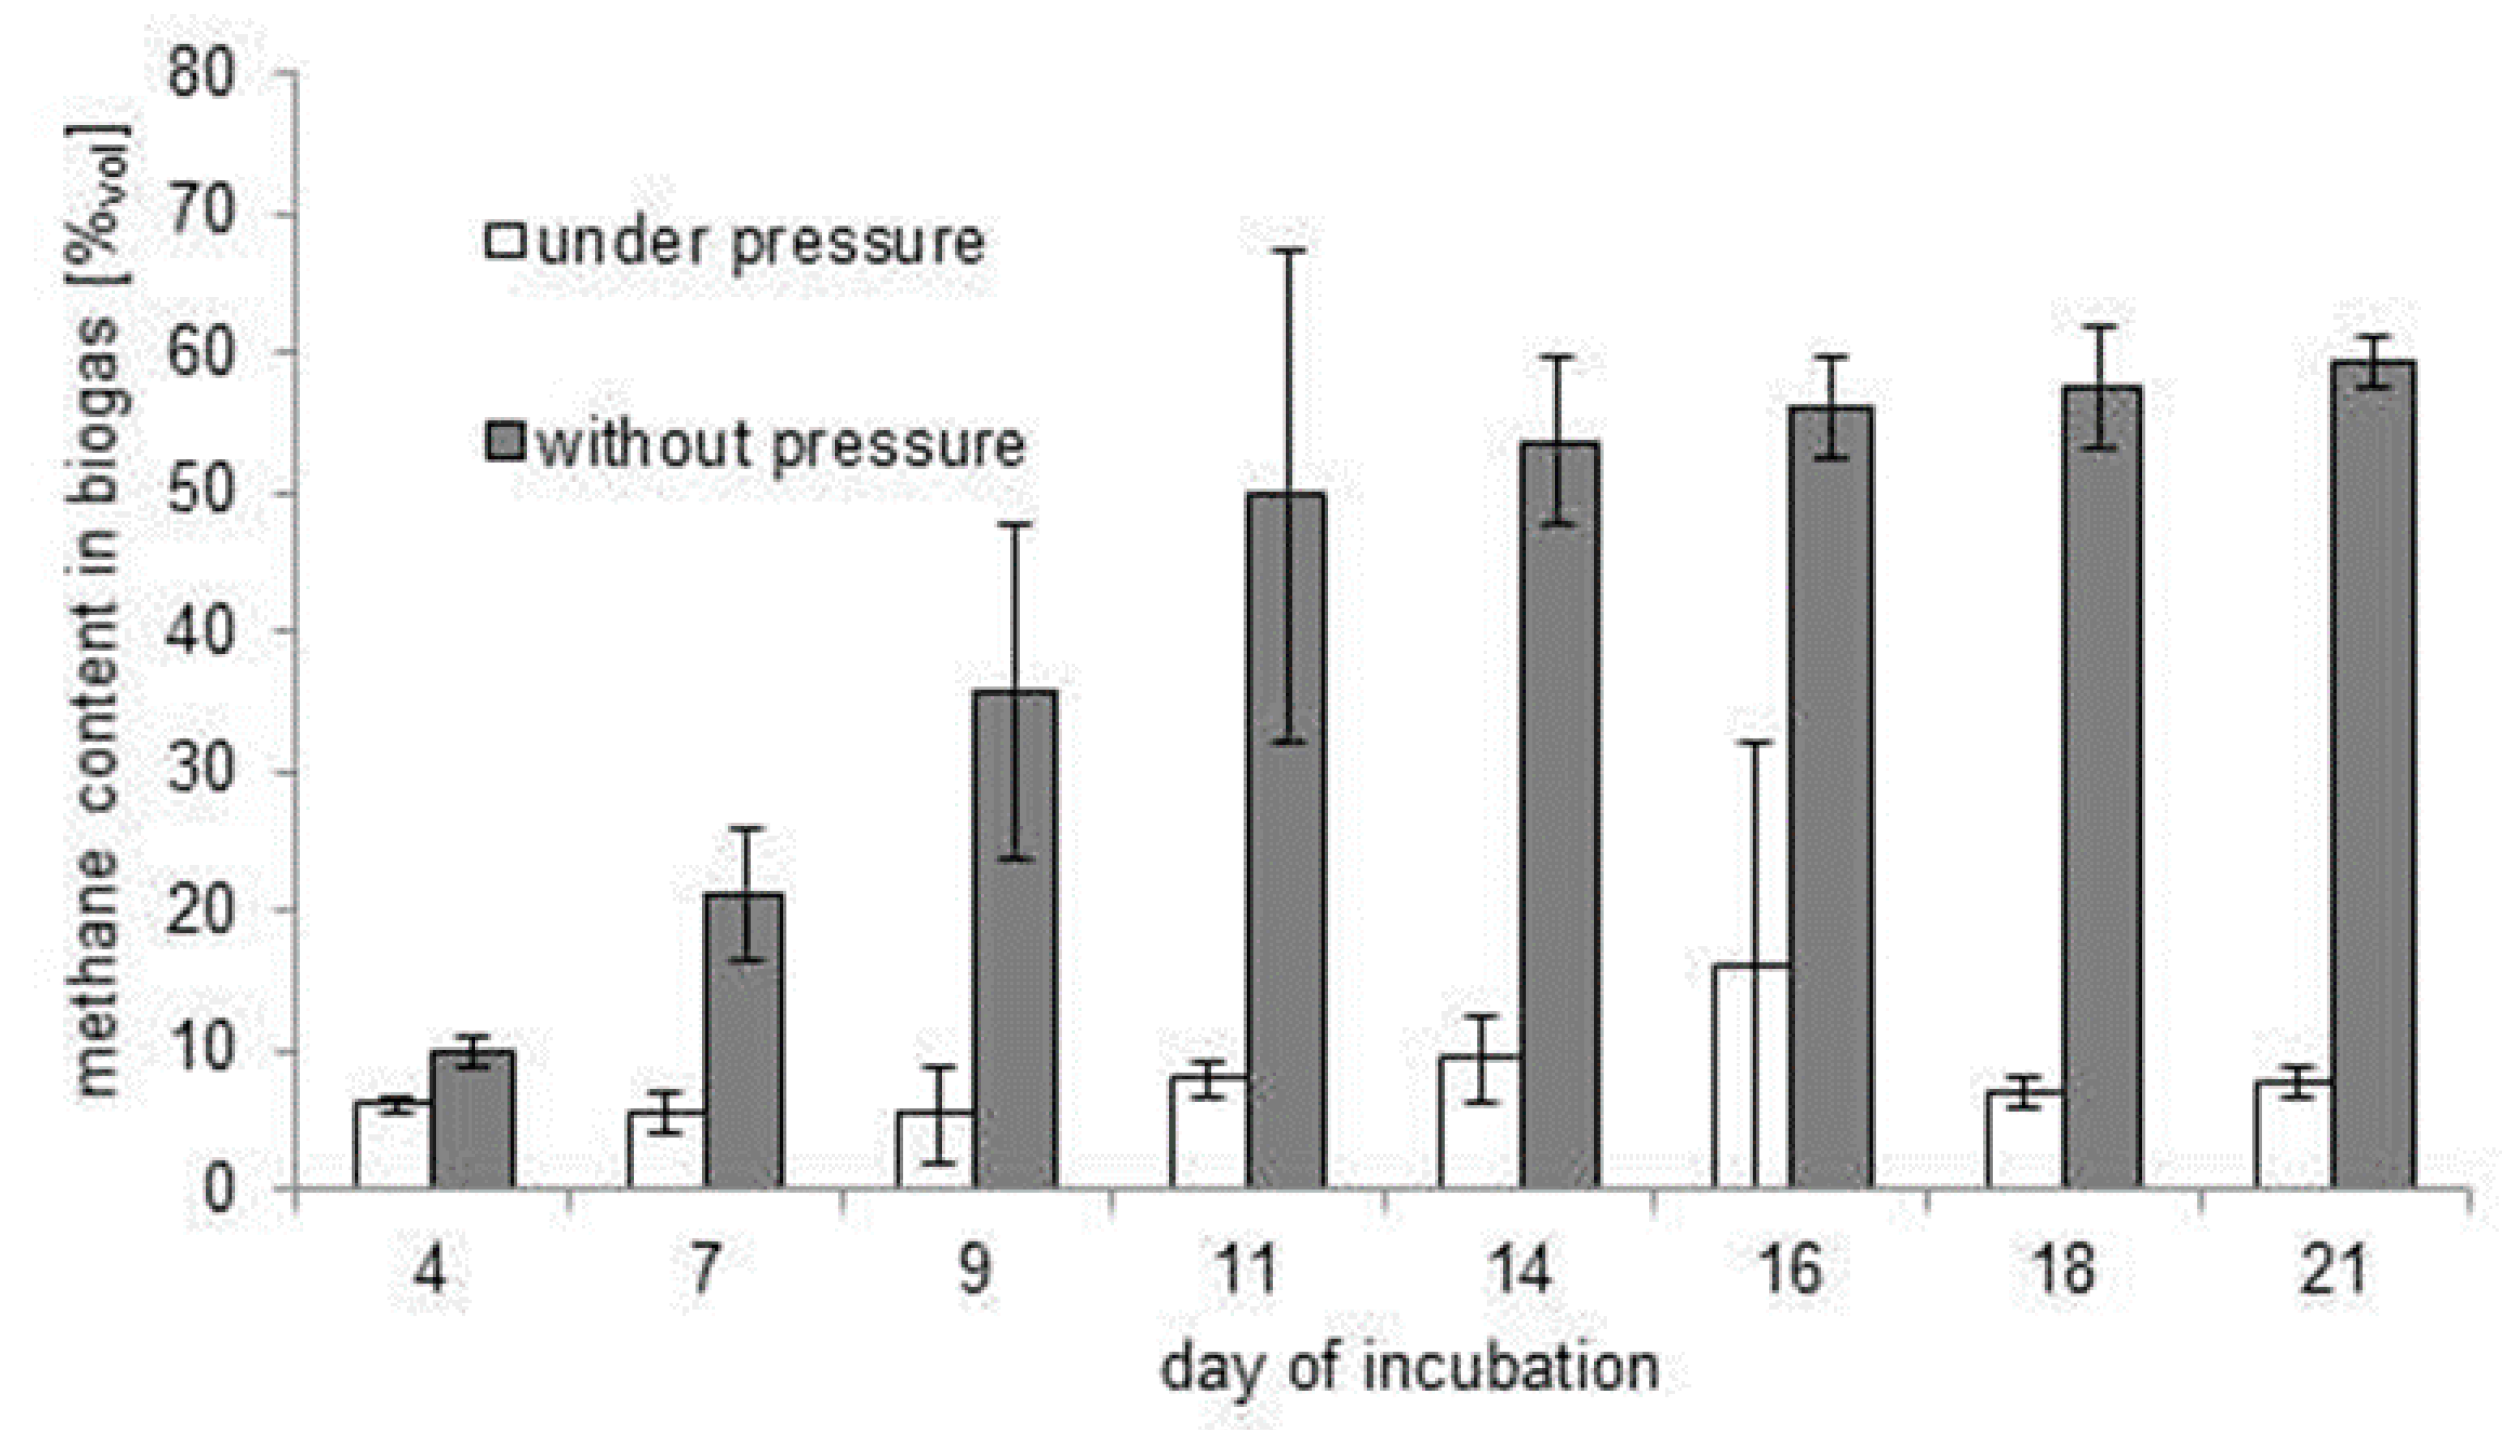
3.2. Inhibition of the Biofermentation Process by Excessive Pressure of Biogas

Gas yields obtained during biofermentation in the bottles in which the gas was removed daily to equalize the pressure to the atmospheric value, and in the bottles without gas removal and increasing pressure, are presented in Figure 3. In both cases, the biomass load was 2%. The content of methane in the biogas on successive days of the series two experiments is shown in Figure 4. The points in the graph correspond to the points in Figure 3. Table 2 presents the pH of the suspension measured in the bottles without gas removal. The measurements were carried out immediately after determination of the biogas yield and composition for the 2% loading.
The structure of industrial bioreactors and large-scale laboratory bioreactors ensure the continuous collection of produced biogas. On one hand, this provides safety (elimination of the possibility of an explosion), on the other hand, it shifts the reaction equilibrium towards biogas production. According to Strömberg et al. [52], gas pressure can be one of the most important factors influencing biogas production. The use of small-volume bottles, tightly sealed with septa, gave rise to the problem of excessive pressure. The standard solution adopted in the experiments involved the aforementioned and discussed procedure of the daily removal of gas from the headspace by piercing the septum with a syringe needle (with simultaneous measurements of the volume of the produced biogas). However, we decided to determine the dynamics of the process under excessive pressure. In fact, the probability of eliminating the need for time-consuming pressure equalization was low. Nevertheless, an exploration of the rate of biofermentation inhibition appeared attractive, particularly given the fact that experiments that can provide an answer to this question are not feasible in industrial bioreactors and large-scale laboratory bioreactors for two reasons: the first reason is related to safety (explosion of such a bioreactor would pose a real threat to the environment); the other is economics (the cost of the bioreactor).
Since the pressure in the bottle at the higher bioreactor loadings (7% and 13%) caused bulging of the septum rubber (or unsealed it), even after daily biogas removal, this stage of the investigation was carried out only at 2% loading. Analysis of Figure 3 reveals that biogas production under excessive pressure at this loading was already inhibited from day four. It can be claimed that biogas yield remains virtually unchanged throughout the incubation period and reaches a level of several tens of per cent per gram of dry weight. When pressure is reduced daily, the amount of produced biogas increases throughout the incubation period. A similar relationship can be noted in Figure 4. The amount of methane produced under excessive pressure hardly changed and remained at a level of several per cent. In turn, when pressure was reduced daily, methane production yield had already exceeded 50% by incubation day 11 and had reached almost 60% by the end of the experiment (day 21).

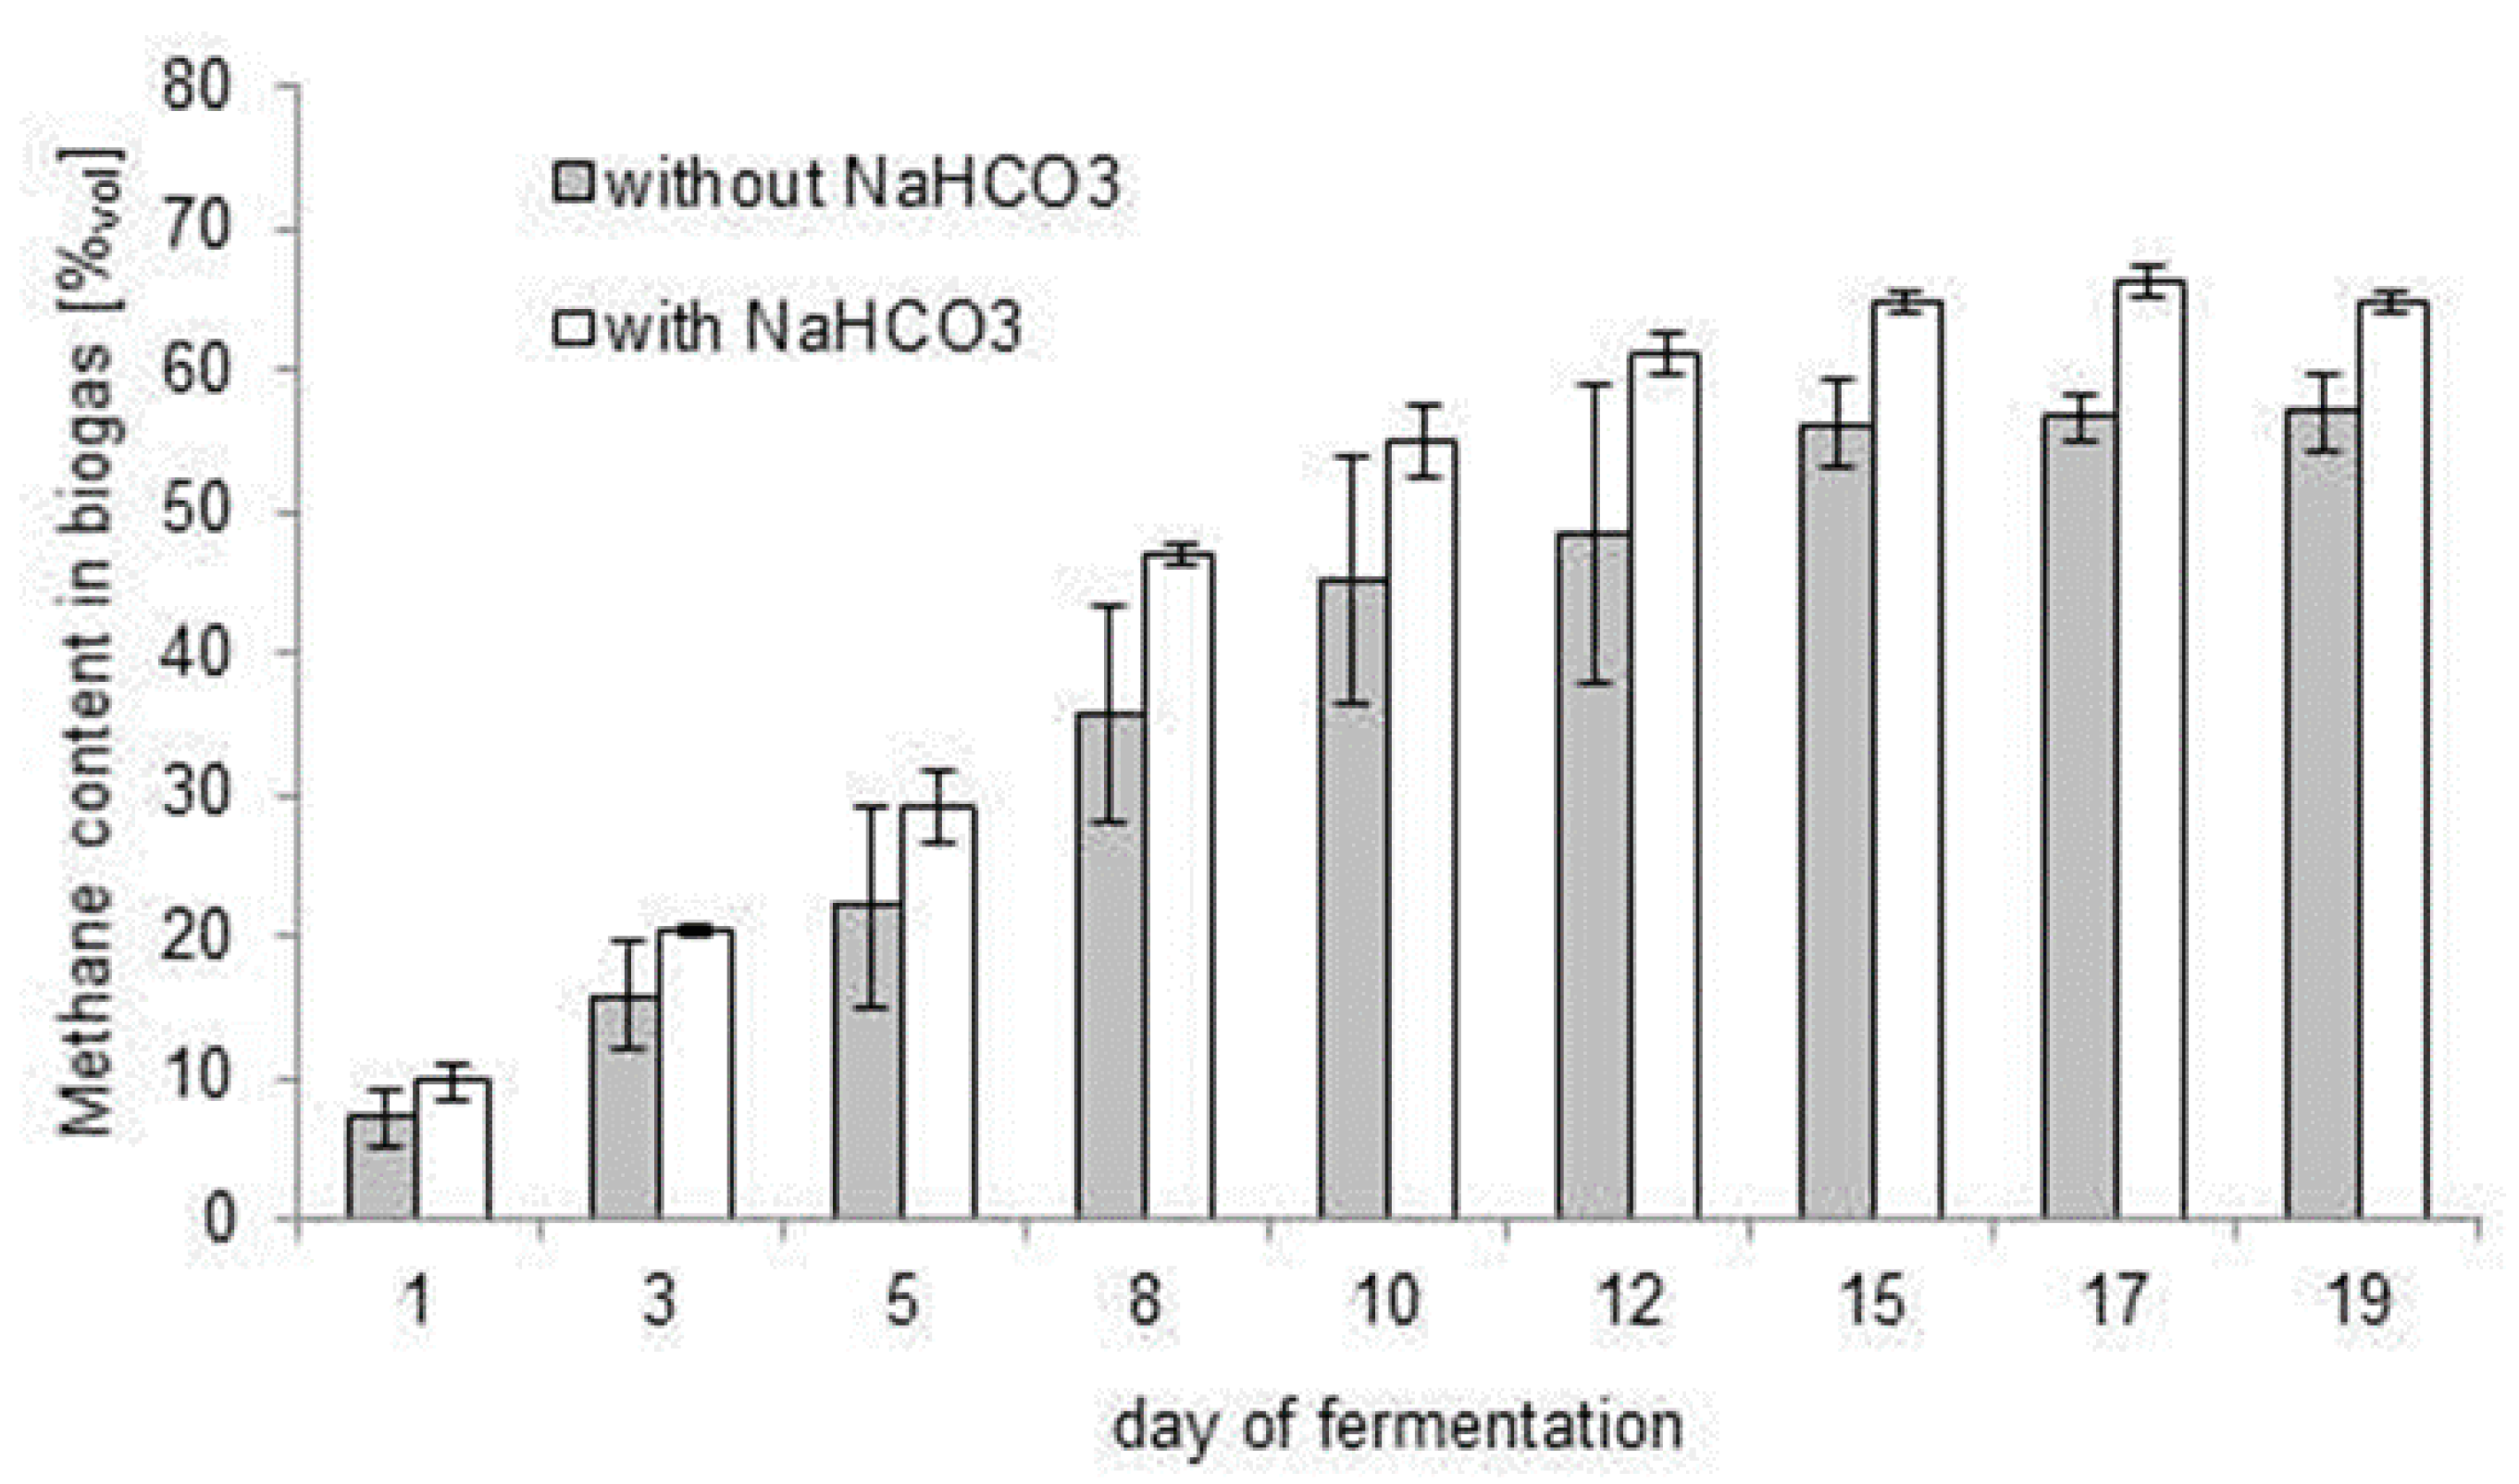
3.3. Stabilisation of the Biogas Production Process with Bicarbonate

The content of methane in variants with and without the addition of a sodium bicarbonate solution to the input mixture is presented in Figure 5.
Analysis of the graph presented in Figure 5 allows the unambiguous conclusion that the addition of bicarbonate not only stabilized the results (with a substantially lower standard deviation for the variant with NaHCO3 supplementation) but also ensured higher methane yields. By day 12 of incubation, methane concentration had already exceeded 60%, i.e., a yield obtained within circa 14 days in the experiment variant presented in Figure 1. Stabilization of pH was confirmed by the results obtained during measurements of the suspension after opening the bottles; pH ranged from 7.04 to 7.48 and did not drop below the threshold of 6.7. The idea of adding a sodium bicarbonate solution to the input suspension was borrowed from the paper by Esposito et al. [14]. The substance is designed to prevent critical pH lowering during the fermentation process, which in extreme cases may lead to the inhibition of methanogenesis [53].
The paper by Mittweg et al. [54] should be mentioned when comparing the results presented above with those reported by other researchers who have used bioreactors with similar volumes. The authors used 100 mL syringes as fermentation chambers. Their results indicate that the process carried out in such bioreactors can be used in laboratory investigations. The only drawback of this solution is the technical difficulty in reproducing the structure described in their paper. The solution proposed in this study seems to be considerably simpler.

4. Conclusions

Many parameters have to be taken into consideration during research on the methodological aspects of biogas production under laboratory conditions, factors that have undoubtedly influenced the final outcomes of this experiment. Although the highest yield of biogas was reported for the 13% load, in the final results this turned out to be too high for such fixed conditions of the digestion process. The optimal conditions for anaerobic digestion in small bioreactors are to fill two-thirds of the maximum volume with a suspension, using a 2% bioreactor loading (on a dry basis) and to ensure the daily equalization of pressure by the removal of biogas through the septum pierced with a syringe needle followed by intensive mixing of the remaining suspension. The addition of bicarbonate stabilized the results (with a substantially lower standard deviation for the variant with NaHCO3 supplementation) and ensured higher methane yields.

Author Contributions

Concept, research and writing, J.K. and A.K.; Review & Editing, A.K.

Conflicts of Interest

The authors declare no conflict of interest.

References

  1. Adebayo, A.; Jekayinfa, S.; Linke, B. Effect of Co-Digestion on Anaerobic Digestion of Cattle Slurry with Maize Cob at Mesophilic Temperature. J. Energy Technol. Policy 2013, 3, 47–55. [Google Scholar]
  2. Gupta, P.; Gupta, A. Biogas production from coal via anaerobic fermentation. Fuel 2014. [Google Scholar] [CrossRef]
  3. Krzemińska, I.; Pawlik-Skowrońska, B.; Trzcińska, M.; Tys, J. Influence of photoperiods on the growth rate and biomass productivity of green microalgae. Bioproc. Biosyst. Eng. 2013. [Google Scholar] [CrossRef]
  4. Amon, Y.; Amon, B.; Kryvoruchko, V.; Machtmüller, A.; Hopfner-Sixt, K.; Bodiroza, V.; Hrbek, R.; Friedel, J.; Pötsch, E.; Wagentristl, H.; et al. Methane production through anaerobic digestion of various energy crops grown in sustainable crop rotation. Bioresour. Technol. 2007. [Google Scholar] [CrossRef] [PubMed]
  5. Frąc, M.; Jezierska-Tys, S.; Tys, J. Microalgae for biofuels production and environmental applications: A review. Afr. J. Biotechnol. 2010. [Google Scholar] [CrossRef]
  6. Oleszek, M.; Matyka, M.; Lalak, J.; Tys, J.; Paprota, E. Characterization of Sida hermaphrodita as a feedstock for anaerobic digestion process. J. Food Agric. Environ. 2013, 11, 1839–1841. [Google Scholar]
  7. Chen, Y.; Cheng, J.; Creamer, K. Inhibition of anaerobic digestion precess: A review. Bioresour. Technol. 2008. [Google Scholar] [CrossRef]
  8. Kafle, G.K.; Kim, S.H.; Sung, K.I. Ensiling of fish industry waste for biogas production: A lab scale evaluation of biochemical methane potential (BMP) and kinetics. Bioresour. Technol. 2013. [Google Scholar] [CrossRef] [PubMed]
  9. Pawłowska, M.; Siepak, J. Enhancement of Methanogenesis at a Municipal Landfill Site by Addition of Sewage Sludge. Environ. Eng. Sci. 2006. [Google Scholar] [CrossRef]
  10. Amigun, B.; Sigamoney, R.; Von Blottnitz, H. Commercialisation of biofuel industry in Africa: A review. Renew. Sustain. Energy Rev. 2008. [Google Scholar] [CrossRef]
  11. Lybaek, R.; Christansen, T.; Kjaer, T. Governing innovation for sustainable development in the Danish Biogas Sector—A historical overview and analysis of innovation. Sustain. Dev. 2013. [Google Scholar] [CrossRef]
  12. Gaida, D.; Luis, S.B.A.; Brito, A.; Wolf, C.; Back, T.; Bongards, M.; McLoone, S.F. Optimal control of biogas plant using nonlinear model predictive control. In Proceedings of the ISSC 2011, Dublin, Ireland, 23–24 June 2011. [Google Scholar]
  13. Markard, J.; Stadelmann, M.; Truffer, B. Prospective analysis of technological innovation systems: Identifying technological and organizational development options for biogas in Switzerland. Res. Policy 2009. [Google Scholar] [CrossRef]
  14. Esposito, G.; Frunzo, L.; Liotta, F.; Panico, A.; Pirozzi, F. Bio-Methane potential test to measure the biogas production from the digestion and co-digestion of complex organic substrates. Open Environ. Eng. J. 2012, 5, 1–8. [Google Scholar] [CrossRef]
  15. Opwis, K.; Mayer-Gall, T.; Gutmann, J.S.; Dammer, C.; Titscher, T.; Nickisch-Hartfiel, A.; Grün, O.; Spurk, C.; Schloderer, C.; Köppe, A.; et al. Semi-industrial production of methane from textile wastewater. Energy Sustain. Soc. 2012. [Google Scholar] [CrossRef]
  16. Kaparaju, P.; Ellegaard, L.; Angelidaki, I. Optimisation of biogas production from manure through serial digestion: Lab-scale and pilot-scale studies. Bioresour. Technol. 2009. [Google Scholar] [CrossRef] [PubMed]
  17. Omil, F.; Garrido, J.; Arrojo, B.; Mendez, R. Anaerobic filter reactor performance for the treatment of complex dairy wastewater at industrial scale. Water Res. 2003. [Google Scholar] [CrossRef]
  18. Singh, K.J.; Sooch, S.S. Comparative study of economics of different models of family size biogas plants for state of Punjab, India. Energy Convers. Manag. 2004. [Google Scholar] [CrossRef]
  19. Wu, S.; Ni, P.; Li, J.; Sun, H.; Wang, Y.; Luo, H.; Dach, J.; Dong, R. Integrated approach to sustain biogas production in anaerobic digestion of chicken manure under recycled utilization of liquid digestate: Dynamics of ammonium accumulation and mitigation control. Bioresour. Technol. 2016. [Google Scholar] [CrossRef] [PubMed]
  20. Montusiewicz, A.; Lebiocka, M. Co-digestion of intermediate landfill leachate and sewage sludge as a method of leachate utilization. Bioresour. Technol. 2011. [Google Scholar] [CrossRef] [PubMed]
  21. Nair, V.V.; Dhar, H.; Kumar, S.; Thalla, A.K.; Mukherjee, S.; Wong, J.W.C. Artificial neural network based modeling to evaluate methane yield from biogas in a laboratory-scale anaerobic bioreactor. Bioresour. Technol. 2016. [Google Scholar] [CrossRef] [PubMed]
  22. Ghanimeh, S.; El Fadel, M.; Saikaly, P. Mixing effect on thermophilic anaerobic digestion of source-sorted organic fraction of municipal solid waste. Bioresour. Technol. 2012. [Google Scholar] [CrossRef] [PubMed]
  23. Asadi, A.; Zinatizadeh, A.A.; Van Loosdrecht, M. A novel continuous feed and intermittent discharge airlift bioreactor (CFIDAB) for enhanced simultaneous removal of carbon and nutrients from soft drink industrial wastewater. Chem. Eng. J. 2016. [Google Scholar] [CrossRef]
  24. Westerholm, M.; Müller, B.; Isaksson, S.; Schnürer, A. Trace element and temperature effects on microbial communities and links to biogas digester performance at high ammonia levels. Biotechnol. Biofuel 2015. [Google Scholar] [CrossRef] [PubMed]
  25. Karim, K.; Hoffmann, R.; Klasson, K.T.; Al-Dahhan, M.H. Anaerobic digestion of animal waste: Effect of mode of mixing. Water Res. 2005. [Google Scholar] [CrossRef] [PubMed]
  26. Getahun, T.; Gebrehiwot, M.; Ambelu, A.; Van Gerven, T.; Van der Bruggen, B. The potential of biogas production from municipal solid waste in a tropical climate. Environ. Monit. Assess. 2014. [Google Scholar] [CrossRef] [PubMed]
  27. Lindmark, J.; Eriksson, P.; Thorin, E. The effects of different mixing intensities during anaerobic digestion of the organic fraction of municipal solid waste. Waste Manag. 2014. [Google Scholar] [CrossRef] [PubMed]
  28. Kim, M.; Ahn, Y.H.; Speece, R.E. Comparative process stability and efficiency of anaerobic digestion; mesophilic vs. thermophilic. Water Res. 2002. [Google Scholar] [CrossRef]
  29. Shen, Y.; Linville, J.L.; Urgun-Demitras, M.; Schoene, R.P.; Snyder, S.W. Producing pipeline-quality biomethane via anaerobic digestion of sludge amended with corn stover biochar with in-situ CO2 removal. Appl. Energ. 2015. [Google Scholar] [CrossRef]
  30. Durán-García, M.; Ramírez, Y.; Rojas-Solórzano, L. Biogas home-production assessment using a selective sample of organic vegetable waste. A preliminary study. Interciencia 2012, 37, 128–132. [Google Scholar]
  31. Rojas, C.; Fang, S.; Uhlenhut, F.; Borchert, A.; Stein, I.; Schlaak, M. Stirring and biomass starter influences the anaerobic digestion of different substrates for biogas production. Eng. Life Sci. 2010. [Google Scholar] [CrossRef]
  32. Lo, H.M.; Chiu, H.Y.; Lo, S.W.; Lo, F.C. Effects of micro-nano and non micro-nano MSWI ashes addition on MSW anaerobic digestion. Bioresour. Technol. 2012. [Google Scholar] [CrossRef] [PubMed]
  33. Zhong, W.; Zhang, Z.; Luo, Y.; Qiao, W.; Xiao, M.; Zhang, M. Biogas productivity by co-digesting Taihu blue algae with corn straw as an external carbon source. Bioresour. Technol. 2012. [Google Scholar] [CrossRef] [PubMed]
  34. Kinnunen, H.V.; Koskinen, P.E.P.; Rintala, J. Mesophilic and thermophilic anaerobic laboratory-scale digestion of Nannochloropsis microalga residues. Bioresour. Technol. 2014. [Google Scholar] [CrossRef] [PubMed]
  35. Lee, E.; Cumberbatch, J.; Wang, M.; Zhang, Q. Kinetic parameter estimation model for anaerobic co-digestion of waste activated sludge and microalgae. Bioresour. Technol. 2017. [Google Scholar] [CrossRef] [PubMed]
  36. Kusch, S.; Oechsner, H.; Jungbluth, T. Biogas production with horse dung in solid-phase digestion systems. Bioresour. Technol. 2008. [Google Scholar] [CrossRef] [PubMed]
  37. Kucera, L.; Kurka, O.; Bartak, P.; Bednar, P. Liquid chromatography/high resolution tandem mass spectrometry—Tool for the study of polyphenol profile changes during micro-scale biogas digestion of grape marcs. Chemosphere 2017. [Google Scholar] [CrossRef]
  38. Szafranek-Nakonieczna, A.; Stępniewska, Z. The influence of the aeration status (ODR, Eh) of peat soils on their ability to produce methane. Wetlands Ecol. Manag. 2015. [Google Scholar] [CrossRef]
  39. Kougias, G.P.; Angelidaki, I. Biogas and its opportunities—A review. Front. Environ. Sci. Eng. 2018, 12, 14. [Google Scholar] [CrossRef]
  40. Schmidt, T.; McCabe, B.; Harris, P. Process Monitoring and Control for an Anaerobic Covered Lagoon Treating Abattoir Wastewater. Chem. Eng. Technol. 2018, 41, 755–760. [Google Scholar] [CrossRef]
  41. Kozłowski, K.; Dach, J.; Lewicki, A.; Cieślik, M.; Czekała, W.; Janczak, D.; Brzoski, M. Laboratory Simulation of an Agricultural Biogas Plant Start-up. Chem. Eng. Technol. 2018, 41, 711–716. [Google Scholar] [CrossRef]
  42. Gallegos, D.; Wedwitschka, H.; Moeller, L.; Zehnsdorf, A.; Stinner, W. Effect of particle size reduction and ensiling fermentation on biogas formation and silage quality of wheat straw. Bioresour. Technol. 2017, 245, 216–224. [Google Scholar] [CrossRef] [PubMed]
  43. Safari, M.; Abdi, R.; Adl, M.; Kafashan, J. Optimization of biogas productivity in lab-scale by response surface methodology. Renew. Energy 2018, 118, 368–375. [Google Scholar] [CrossRef]
  44. Hilkiah, I.A.; Ayotamuno, M.J.; Eze, C.L.; Ogaji, S.O.T.; Probert, S.D. Designs of anaerobic digesters for producing biogas from municipal solid-waste. Appl. Energy 2008. [Google Scholar] [CrossRef]
  45. Betts, J.I.; Baganz, F. Miniature bioreactors: Current practices and future opportunities. Microb. Cell Fact. 2006. [Google Scholar] [CrossRef] [PubMed]
  46. Oleszek, M.; Tys, J. Lab scale measurement of biogas yield. Chem. Ind. 2013, 92, 126–130. [Google Scholar]
  47. Lourenço, N.D.; Lopes, J.A.; Almeida, C.F.; Sarraguça, M.C.; Pinheiro, H.M. Bioreactor monitoring with spectroscopy and chemometrics: A review. Anal. Bioanal. Chem. 2012. [Google Scholar] [CrossRef] [PubMed]
  48. Frąc, M.; Ziemiński, K. Methane fermentation process for utilization of organic waste. Int. Agrophys. 2012. [Google Scholar] [CrossRef]
  49. Lalak, J.; Kasprzycka, A.; Martyniak, D.; Tys, J. Effect of biological pretreatment of Agropyron elongatum ‘BAMAR’ on biogas production by anaerobic digestion. Bioresour. Technol. 2016, 200, 194–200. [Google Scholar] [CrossRef] [PubMed]
  50. Angelidaki, I.; Sanders, W. Assessment of the anaerobic biodegradability of macropollutants. Rev. Environ. Sci. Biol. Technol. 2014, 3, 117–129. [Google Scholar] [CrossRef]
  51. Zhang, S.; Zhang, P.; Zhang, G.; Fan, J.; Zhang, Y. Enhancement of anaerobic sludge digestion by high-pressure homogenization. Bioresour. Technol. 2012. [Google Scholar] [CrossRef] [PubMed]
  52. Strömberg, S.; Nistor, M.; Liu, J. Towards eliminating systematic errors caused by the experimental conditions in Biochemical Methane Potential (BMP) tests. Waste Manag. 2014, 34, 1939–1948. [Google Scholar] [CrossRef] [PubMed]
  53. Piątek, M.; Lisowski, A.; Kasprzycka, A.; Lisowska, B. The dynamics of an anaerobic digestion of crop substrates with an unfavourable carbon to nitrogen ratio. Bioresour. Technol. 2016, 216, 607–612. [Google Scholar] [CrossRef] [PubMed]
  54. Mittweg, G.; Oechsner, H.; Hahn, V.; Lemmer, A.; Reinhardt-Hanisch, A. Repeatability of a laboratory batch method to determine the specific biogas and methane yields. Eng Life Sci. 2016. [Google Scholar] [CrossRef]
Figure 1. Total volume of biogas obtained during 3 week incubation for different values of bioreactor loading. Results from measurement series 1.
Energies 11 01378 g001
Figure 2. Methane content of biogas on successive incubation days for different bioreactor loading values. Results from measurement series 1.
Energies 11 01378 g002
Figure 3. Biogas production on the consecutive days of incubation in the bottles at 2% loading in measurement series 2. Gas volumes are converted into 1 g of dry weight.
Energies 11 01378 g003
Figure 4. The content of methane in the biogas on successive days of incubation at 2% loading in bottles with daily gas removal and in bottles without gas removal.
Energies 11 01378 g004
Figure 5. Methane content in the biogas on successive days of incubation in bottles with and without the addition of sodium bicarbonate (series 3).
Energies 11 01378 g005
Table 1. Review of laboratory investigations and the bioreactors used in these works.
Group of Laboratory BioreactorsVolume of Used BioreactorPublication
20 dm3 semi-continuously stirred tank reactors[19]
big volume40 dm3 bioreactor[20]
20 dm3 bioreactor[21]
14 dm3 digesters[22]
5,3 dm3 bioreactor[23]
5 dm3 bioreactor[24]
5 dm3 double glass cylinder[16]
3,75 dm3 clear PVC[25]
medium volume2.5 dm3 batch digester[26]
2.3 dm3 and 1.3 dm3 glass bottles[8]
1 dm3 serum flasks[27]
1.1 dm3 glass bottles[28]
600 cm3 digesters[29]
600 cm3 PET bottles[30]
500 cm3 digesters[31]
500 cm3 plastic bottle[32]
small volume150 cm3 serum bottles[33]
119 cm3 glass bottles[34]
100 cm3 serum bottles[35]
100 cm3 glass syringe[36]
60 cm3 vials[37]
60 cm3 dark vials[38]
Table 2. pH of the suspension in bioreactors (2% loading) without daily gas removal on consecutive incubation days. Results of measurement series 2.
ReplicationDay of Incubation
358101215171921
Average6.155.775.605.705.865.865.615.495.82
Standard deviation0.020.090.170.080.230.620.030.140.07

