Article

Analytical Modeling Approach to Study Harmonic Mitigation in AC Grids with Active Impedance at Selective Frequencies

1
Electronics and Computing Department, Mondragon University, 20500 Mondragon, Spain
2
Industry and Marine Drives Department, Ingeteam Power Technology S.A., 48170 Zamudio, Spain
*
Author to whom correspondence should be addressed.
Energies 2018, 11(6), 1337; https://doi.org/10.3390/en11061337
Submission received: 18 April 2018 / Revised: 21 May 2018 / Accepted: 22 May 2018 / Published: 24 May 2018
(This article belongs to the Section F: Electrical Engineering)

Abstract

:
This paper presents an analytical model, oriented to study harmonic mitigation aspects in AC grids. As it is well known, the presence of non-desired harmonics in AC grids can be palliated in several manners. However, in this paper, a power electronic-based active impedance at selective frequencies (ACISEF) is used, due to its already proven flexibility and adaptability to the changing characteristics of AC grids. Hence, the proposed analytical model approach is specially conceived to globally consider both the model of the AC grid itself with its electric equivalent impedances, together with the power electronic-based ACISEF, including its control loops. In addition, the proposed analytical model presents practical and useful properties, as it is simple to understand and simple to use, it has low computational cost and simple adaptability to different scenarios of AC grids, and it provides an accurate enough representation of the reality. The benefits of using the proposed analytical model are shown in this paper through some examples of its usefulness, including an analysis of stability and the identification of sources of instability for a robust design, an analysis of effectiveness in harmonic mitigation, an analysis to assist in the choice of the most suitable active impedance under a given state of the AC grid, an analysis of the interaction between different compensators, and so on. To conclude, experimental validation of a 2.15 kA ACISEF in a real 33 kV AC grid is provided, in which real users (household and industry loads) and crucial elements such as wind parks and HVDC systems are near inter-connected.

1. Introduction

The study proposal of this paper is contextualized by the idea of using power electronic converters with different functionalities in order to improve the performance and characteristics of AC grids. More specifically, the global modeling approach proposed together with a power electronics converter with the functionality of active impedance at selective frequencies (ACISEF) is oriented to effectively mitigate the voltage harmonic content of AC grids. The concept of an active filter for suppressing harmonics in AC grids has been around for many decades [1,2]. Since the early beginnings, uncountable advances and contributions have been spread in many different directions, trying to improve or study many different aspects related to this topic. In fact, the idea of active filtering has been adapted or reconfigured to many other similar application fields, as covered in [3]. These application areas include the active stabilization of power converters [4,5] as well as the concept of active filter, which has been extended or expanded to the concepts of ‘virtual impedance’ or ‘active impedance’ for active power controls [6,7] or for fault rides through functionality [8,9], and even to achieve improvements in current source converters [10].
On the other hand, a remarkable field in relation to the topic covered in this article is the stability assessment of AC grids in general, when power electronic converters connected to the grid with different functionalities are included. Stability analysis becomes crucial when introducing new and increased complexity power converters to AC grids. However, here again the origin of stability assessments is also quite old. Many references report that one of the first investigations in relation to this stability issue was presented by Middlebrook [11], in which the interaction between closed loop controlled DC-DC converters and their input filters was the source of instability. Since that study, many analyses of different natures have been developed by many individuals. Some recent and remarkable contributions are for instance: stability improvements and harmonic suppression in AC micro-grids by using virtual impedance concept [12], AC stability analyses based on dq frames [13], impedance modeling approaches to address resonance problems in HVDC systems [14], and the improvement of transient response of power converters in AC grids by using virtual synchronous generators [15]. Hence, the modeling approach proposed in this article for stability assessment is useful for many other purposes, compared to the abovementioned assessment methods and many others not mentioned here due lack of space. It presents the following differential characteristics: since it is based on αβ or abc reference frames, the rotational transformations are not necessary at the analytical model, avoiding the discontinuity produced for dq representation as well as avoiding the appearance of coupling terms or coupled matrices in the study. It shows that for an accurate representation of the global system (integrating an AC grid and converters with their control loops) valid for a wide range of harmonics, it is enough to use a linear model, avoiding complex linearization techniques. In addition, it can be said that the mathematic equations involved in this modeling approach are quite simple and do not require an advanced knowledge of complex control or modeling theories, which is welcome if this method is to be adopted by power converter manufacturers or a wide variety of technicians and engineers. In addition, it accepts all types of widely extended generic analyses such as the Nyquist stability criterion and many others. Finally, it has to be mentioned that the modeling philosophy followed in this article is an adaptation to AC grids of the modeling philosophy already applied in DC grids and already proven and published in Reference [16].

2. A Conceptual Approach to the Problem of Voltage Harmonics in AC Grids

In AC grids that are closely connected to one or more wind parks, normally there is a combination of several interconnected elements: wind turbines, medium voltage network cables (subterranean or submarine), power transformers, high voltage transmission cables, shunt compensators, passive harmonic filters, STATCOMs, and more, together with loads or consumers. In practice, often the design, combination, and connection of all of these elements are made under uncertainties, such as the quick tendering process, the uncertainties of models, the absence of or late data provision by Transmission System Operators (TSOs) or wind park owners, the addition of new elements in the electrical infrastructure, component tolerances, and many others. This maybe non-ideal, but real contexts often mean the non-compliance of several requirements of grid codes, one of which is an abnormally high voltage harmonic level at the AC grid, causing operational problems at loads and for users connected near to that grid [17].
Thus, the proposed contribution of this article arises from a real necessity in a specific AC grid. Due to confidential concerns, it is not possible to provide too many specific details about this context. However, the details are not necessary to understand the main conceptual issues. The most important elements of the grid are depicted in Figure 1. It is possible to distinguish two medium-scale wind farms closely connected, together with a thyristor-based HVDC system. There are also some towns and industrial loads in the neighborhood. The combination of all of these elements interacting together produces in some periods of time (depending on the available generation, load consumption, etc.) a deterioration of the quality of the AC grid voltage due to the presence of low-order voltage harmonics (predominantly 11th and 13th orders in the validation scenario of this article, among others) of unusually high amplitude levels, leading to undesirable problems at the elements connected to the AC grid. This unacceptable situation can be solved by the inclusion of active filters (by means of VSC converters) to mitigate the voltage harmonic of the grid [18].
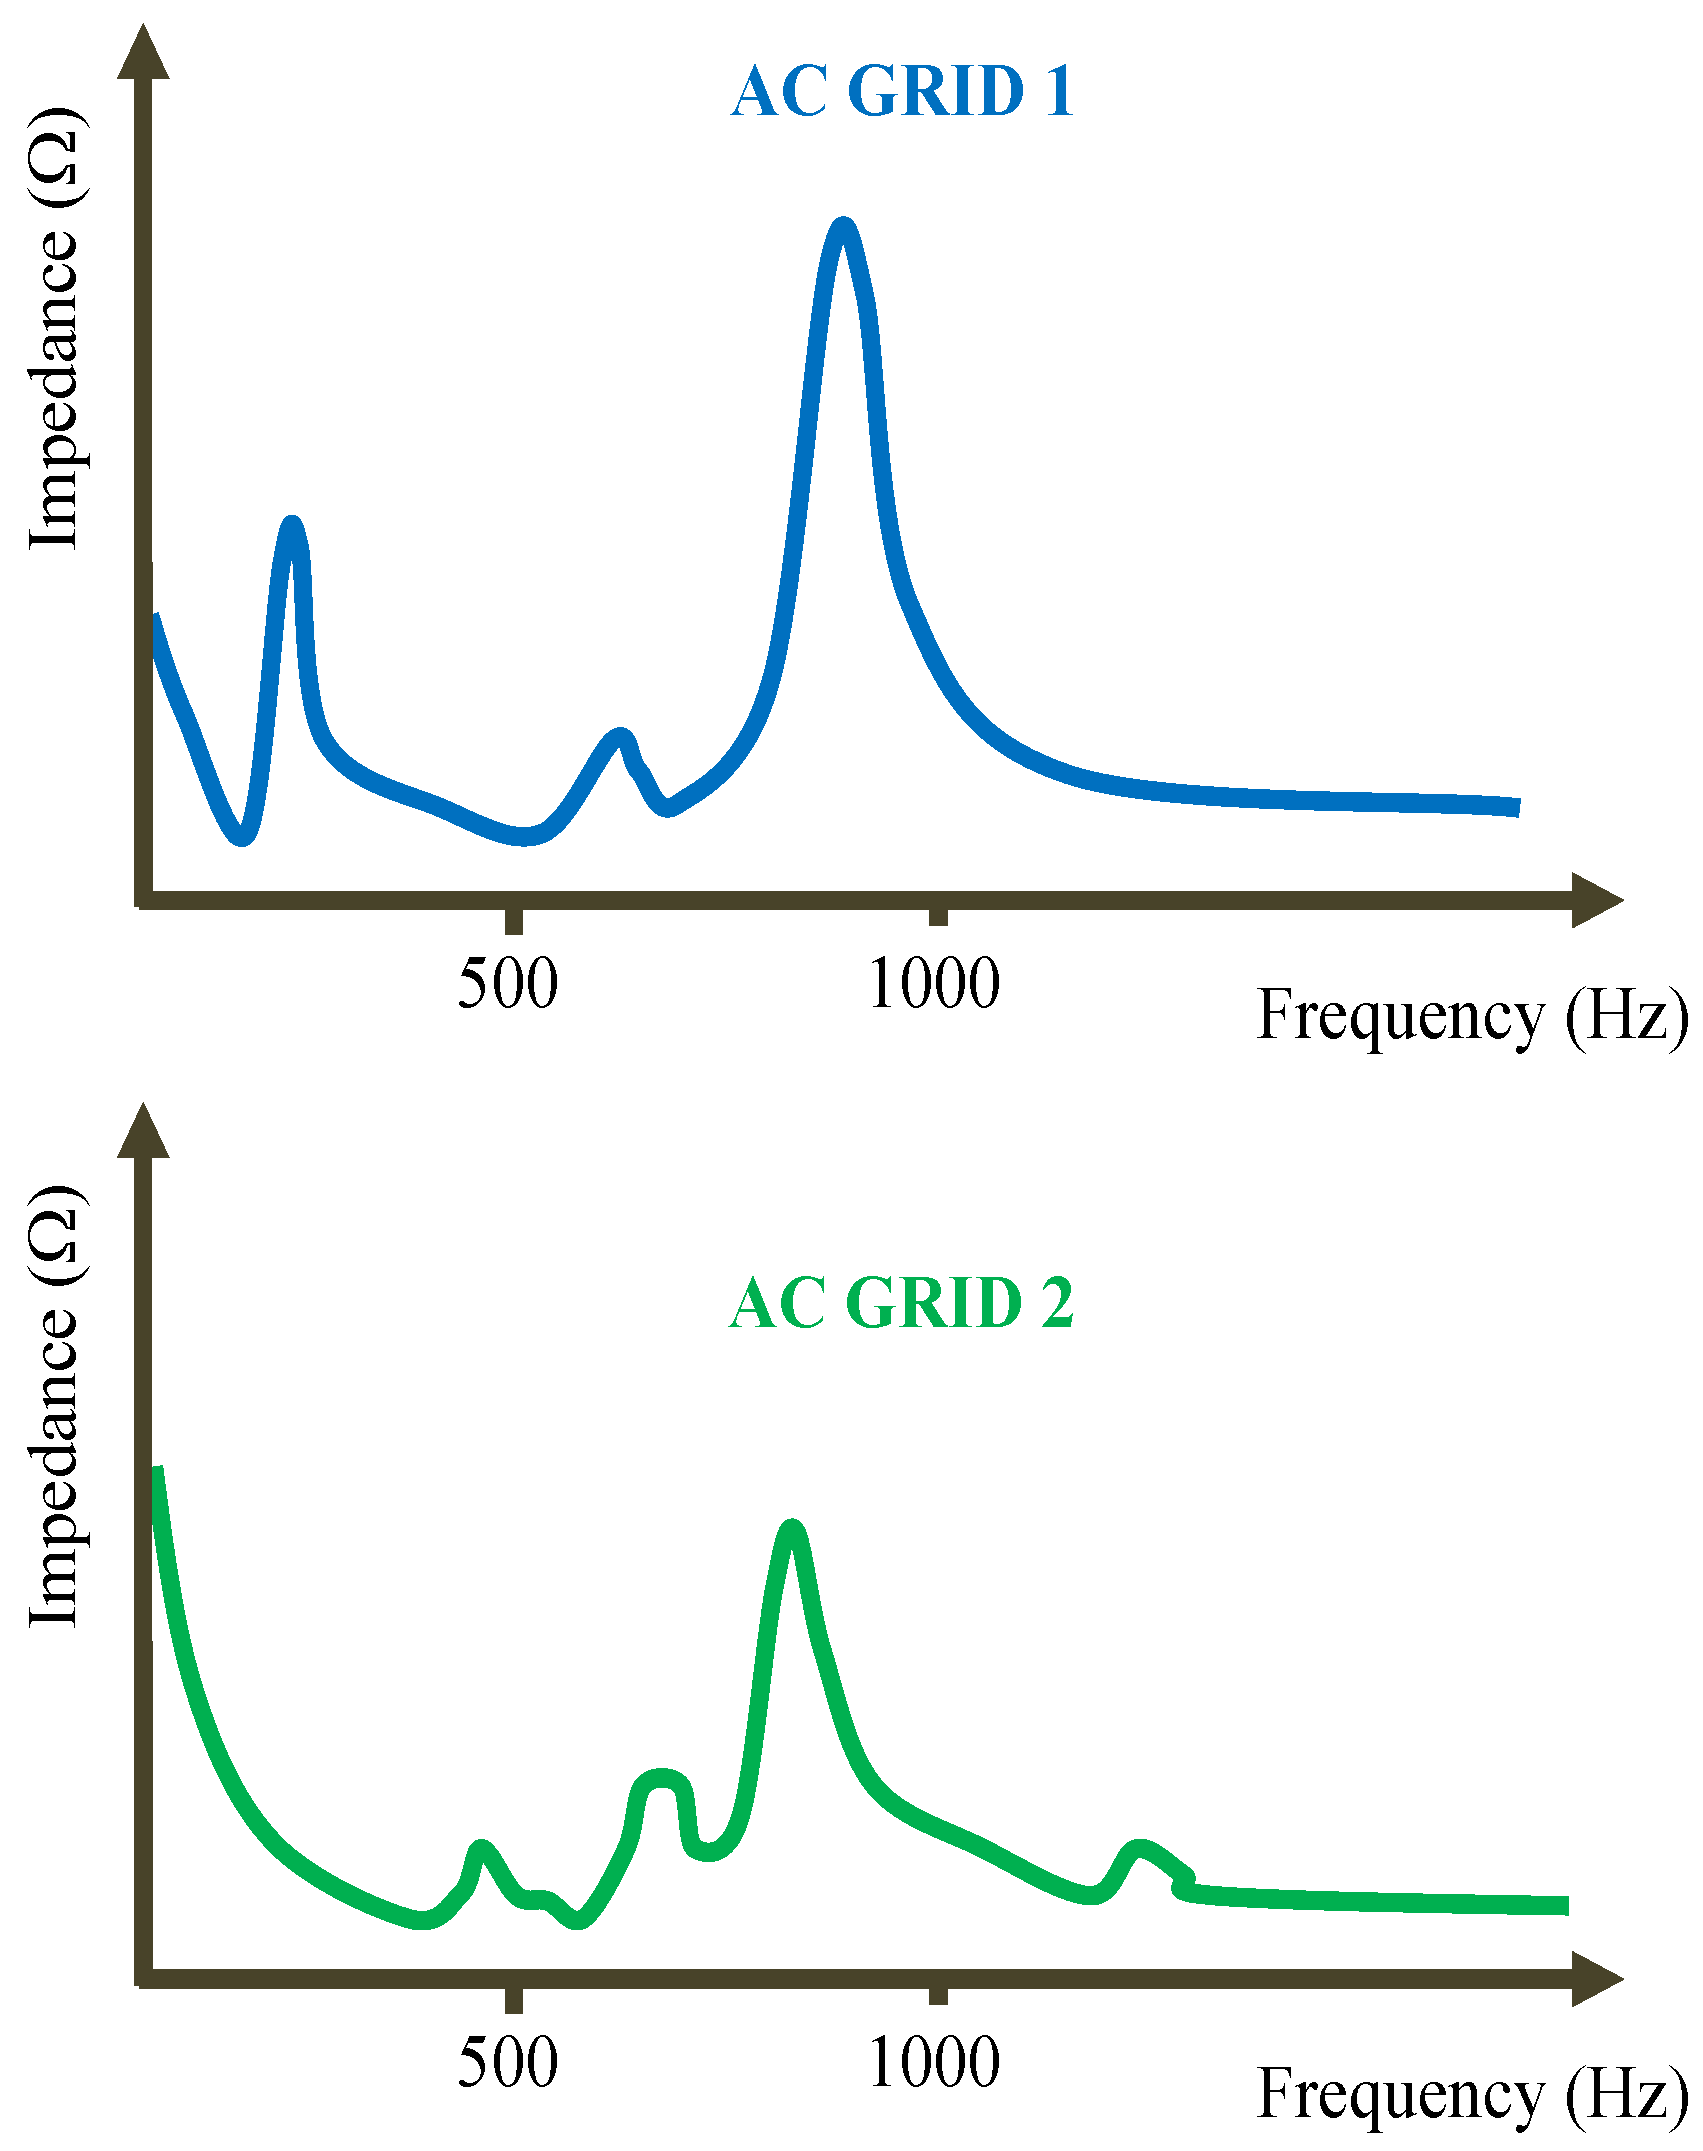
This harmonic voltage problem can be explained in a simplified manner, as follows. First of all, submarine or subterranean cables present strong capacitive behavior. These cables can be modeled by a combination of series ‘π’ circuits [19] in which the capacitances and inductances of the equivalent electric model depend on distances, voltage, and construction characteristics of the cable itself. Thus, the parallel and series connections in AC grids of different longitudes and natures of cables, together with the combination of other elements (transformer, shunt compensators, harmonic passive filters, and so on) lead to an equivalent impedance of AC grids, such as that presented in Figure 2.
As can be seen, for the equivalent impedance of the AC grid seen at a specific point, present resonances and anti-resonances often occur at low frequencies that can interact with low-order voltage or current harmonics (<21st) emitted by loads or power converters connected to the AC grid (HVDC system, VSC of wind turbines or loads). The interaction of all of these elements generally produces an abnormally high harmonic voltage at the AC grid, as mentioned before. Furthermore, it should be noted that, depending on the state of the AC grid at one specific moment or within a time interval (number of wind turbines connected with their corresponding distribution cables and harmonic emission, type of industrial load connected at one specific moment, etc.), the equivalent AC impedance and the harmonic emission can be modified, which means that the resonance frequencies of the equivalent impedances can change locations. All of these facts offer the possibility to solve this challenge of mitigating the voltage harmonics of the AC grid through the active impedance at selective frequencies (ACISEF) studied in this article. For that purpose, the global analytical model proposed will help in the general understanding of this multi-phenomenon, complex problem. Note also that the location of the ACISEF is generally restricted and cannot be placed in ideal locations where their influence could be potentially more effective. Going forward, the next sections in this paper are written in a much more general scientific style, leaving aside the practical aspects and details mentioned in this section.

3. Active Impedance at Selective Frequencies (ACISEF)

3.1. Equivalent AC Grid Model

This subsection presents the generic equivalent AC grid model used for the analysis. In Figure 3, it is seen that the equivalent AC grid model is composed by a voltage source (vs) and a disposition of series inductive impedances (R1-L1, R2-L2, R3-L3), together with a disposition of parallel capacitive impedances (Rc1-C1, Rc2-C2) and a parallel pure resistance (RL). As discussed in previous section, this equivalent AC grid model can represent the series and parallel connections of different elements composing a given AC grid (with multiple branches): transformers, submarine or subterranean cables of different natures, and the generation of renewable energy by resources such as wind parks and so on. Note that a fifth order system was chosen for this general example (L1, L2, L3, C1, C2) in which the model is presented, in order to attempt to find a balance between the complexity of the AC grid studied and an easier pedagogical exposition.
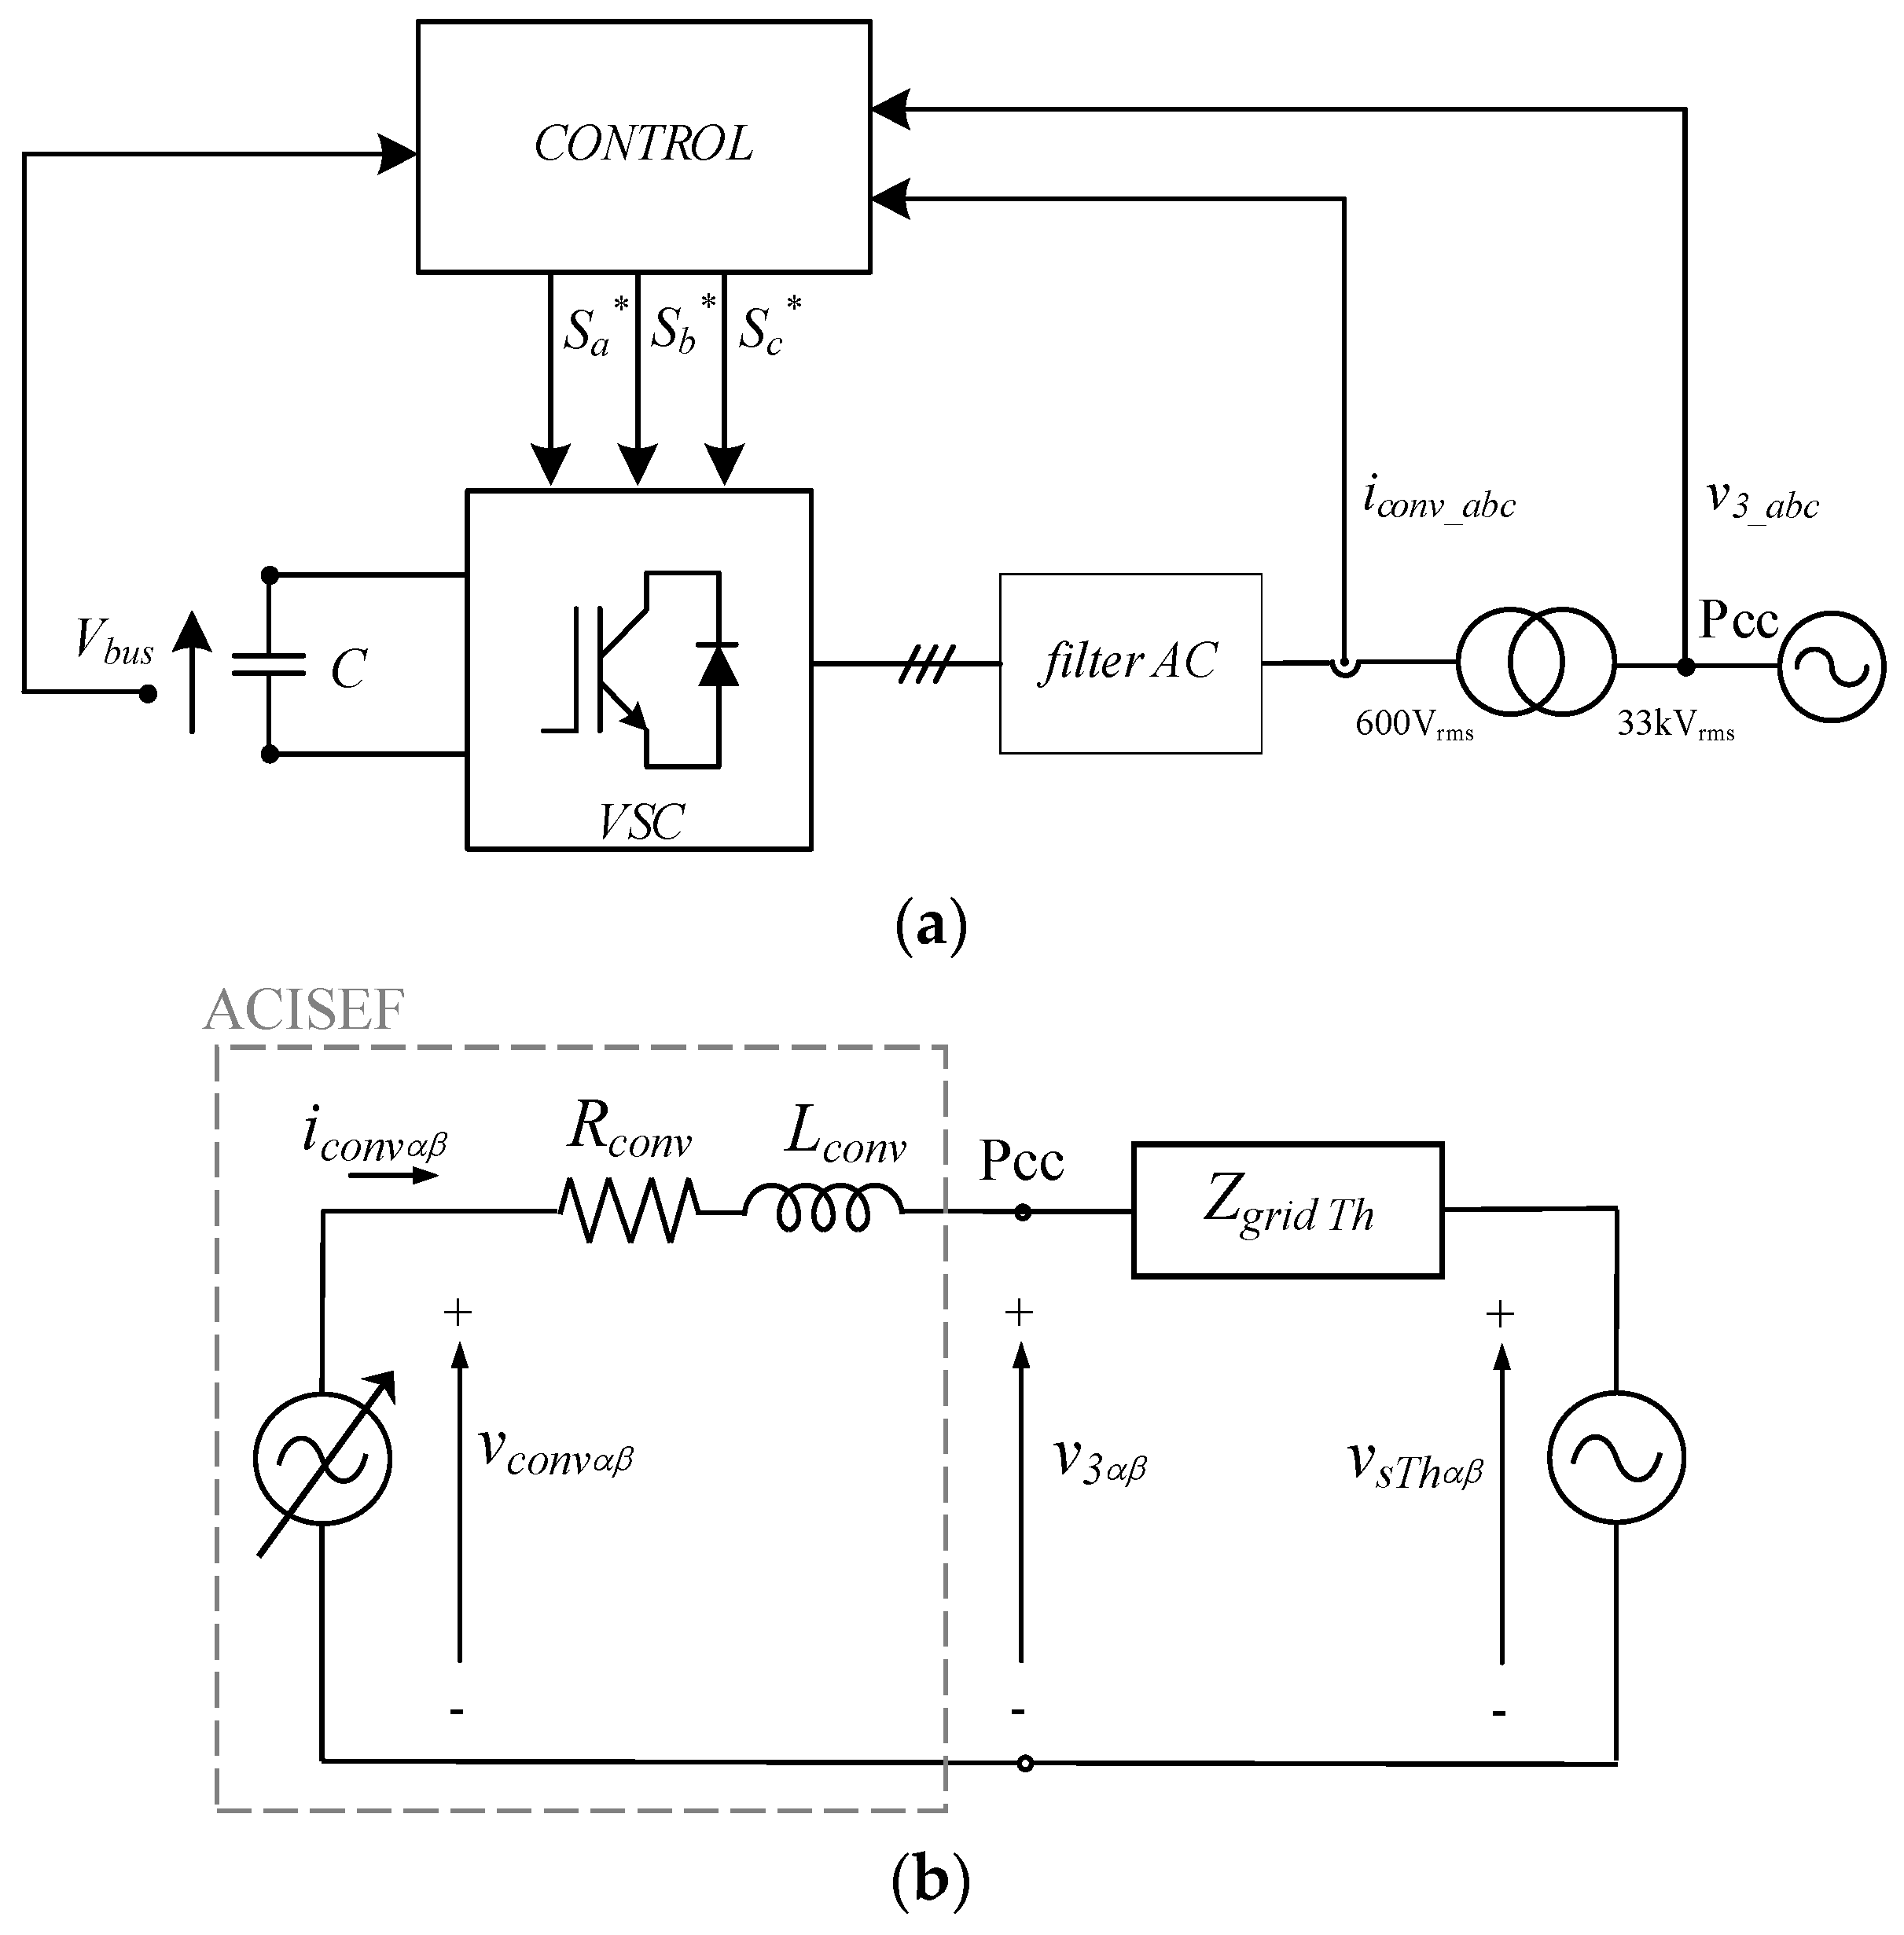
Then, connected to the AC grid at a point where the presence of undesired voltage harmonics was found, the converter providing active impedance at selective frequencies (ACISEF) is located. This point is called point of common coupling (Pcc). By neglecting the higher frequencies produced by the switching frequency (and multiple families) of the power electronic converter, it can be seen that the setup is modeled as an equivalent controlled voltage source (vconv) and a series impedance (Rconv-Lconv) mainly representing the converter’s harmonic filter impedance plus the equivalent impedance of transformer for connecting to the medium voltage AC grid (see Appendix A for data). By means of the proposed converter’s control, presented in subsequent sections, it will provide a vconv of 50 Hz (frequency of grid) added to the frequencies of harmonics that it is required to actively mitigate (550 Hz, 650 Hz, 750 Hz, etc.).
It has to be remarked that this is just an initial simplified scenario representing a reasonable number of phenomena. The models of the different elements comprising the system could be increased in complexity (or accuracy) depending on the phenomena on which the analysis is focused. This could involve a more optimized passive filter at converter’s output [21], a higher order of the equivalent AC grid, more active converters interacting with the system, and so on.
Note also that the voltage and currents of the model are represented in a stationary reference frame (αβ). This is achieved by transforming the abc three-phase voltages and currents to their corresponding αβ components, using the well-known numerical Clarke transformation. Thus, for instance, the voltage source vector vsαβ is composed by two sinusoidal components (v, v) with a frequency of 50 Hz under no presence of undesired harmonics, and the same is applied to the rest of the voltage and current magnitude of the system (i1αβ, i2αβ, i3αβ, iconvαβ, v1αβ, v2αβ, v3αβ, vconvαβ). It has to be highlighted that this modeling approach is advantageous compared to, for instance, a representation in a dq rotating reference frame, due to reasons such as the possibility to easily incorporate different frequencies at the voltage and current magnitudes without the need of different speed rotating dq reference frames, the lack of coupling terms, and so on.
On the other hand, as an example, Figure 4 shows the model Bode diagrams and poles of the studied AC grid not connected with the ACISEF (see Appendix A for numerical values of impedances). For this specific example, it is seen that at the grid voltage and currents (v3αβ, i3αβ) two big resonances appear, located at approximately 540 Hz and 900 Hz (Figure 4a,b). This means that these two specific voltage and currents, when at the source voltage (vsαβ), are polluted with small amplitude harmonics in the surroundings of the two resonant frequencies. Thus, there will be a big amplification in relation to the amplification that occurs at the grid’s 50 Hz frequency, potentially causing problems for the users connected to this grid. Note that the source voltage (vsαβ) represents the equivalent combination of voltage source converters (VSC), such as wind turbines of wind parks, loads, and many other elements that may emit small amount of voltage harmonics at or near these resonance frequencies, due to their intrinsic switching behavior.
In addition, Figure 4c shows the pole plot of the transfer function v3αβ(s)/vsαβ(s). It can be seen that there are two dominant complex conjugate pole pairs, with an imaginary part that corresponds to the resonant frequencies (in rad/s) and a real part that is associated with the amplitude. There is also a fifth real pole whose influence is not significant compared to the dominant ones. For simplicity, and as the real negative part is very far from the dominant poles, it is not shown in the plot. It must be highlighted that the rest of the variables of the system (i1αβ, i2αβ, v1αβ, v2αβ) present the same poles and therefore will result in very similar Bode diagrams with resonances located at same frequencies. Note that a fifth order system may not accurately represent frequencies higher than 1 kHz; however, for simplicity in the exposition this order is adopted in an attempt to avoid the necessity of working with a more complex system. It has to be highlighted that for the range of frequencies analyzed in this article, the fifth order system is accurate enough.

3.2. Converter Operating as Active Impedance at Selective Frequencies (ACISEF)

This section presents how the converter works, operating as an active impedance at selective frequencies. In Figure 5a, a schematic of the power circuit is shown. It is composed by a two-level low voltage converter (600 Vrms) connected to the grid’s point of common coupling through an L filter and a transformer. The DC side of the converter is simply a combination of series and parallel DC bus capacitors. The DC bus voltage (Vbus), grid voltage at the Pcc (v3), and the converter’s output currents (iconv) in abc form are measured for the control. Then, in Figure 5b, the simplified equivalent electric model in αβ is represented, with the converter connected to the AC grid and after having applied Thevenin’s equivalent circuit to the AC grid of Figure 5. Note that the ‘converter’s impedances’, which are the addition of the filter and transformer impedances (Rconv-Lconv), together with the current and voltages (iconv, vconv), are referred to the highest voltage side of the transformer for an easier notation.
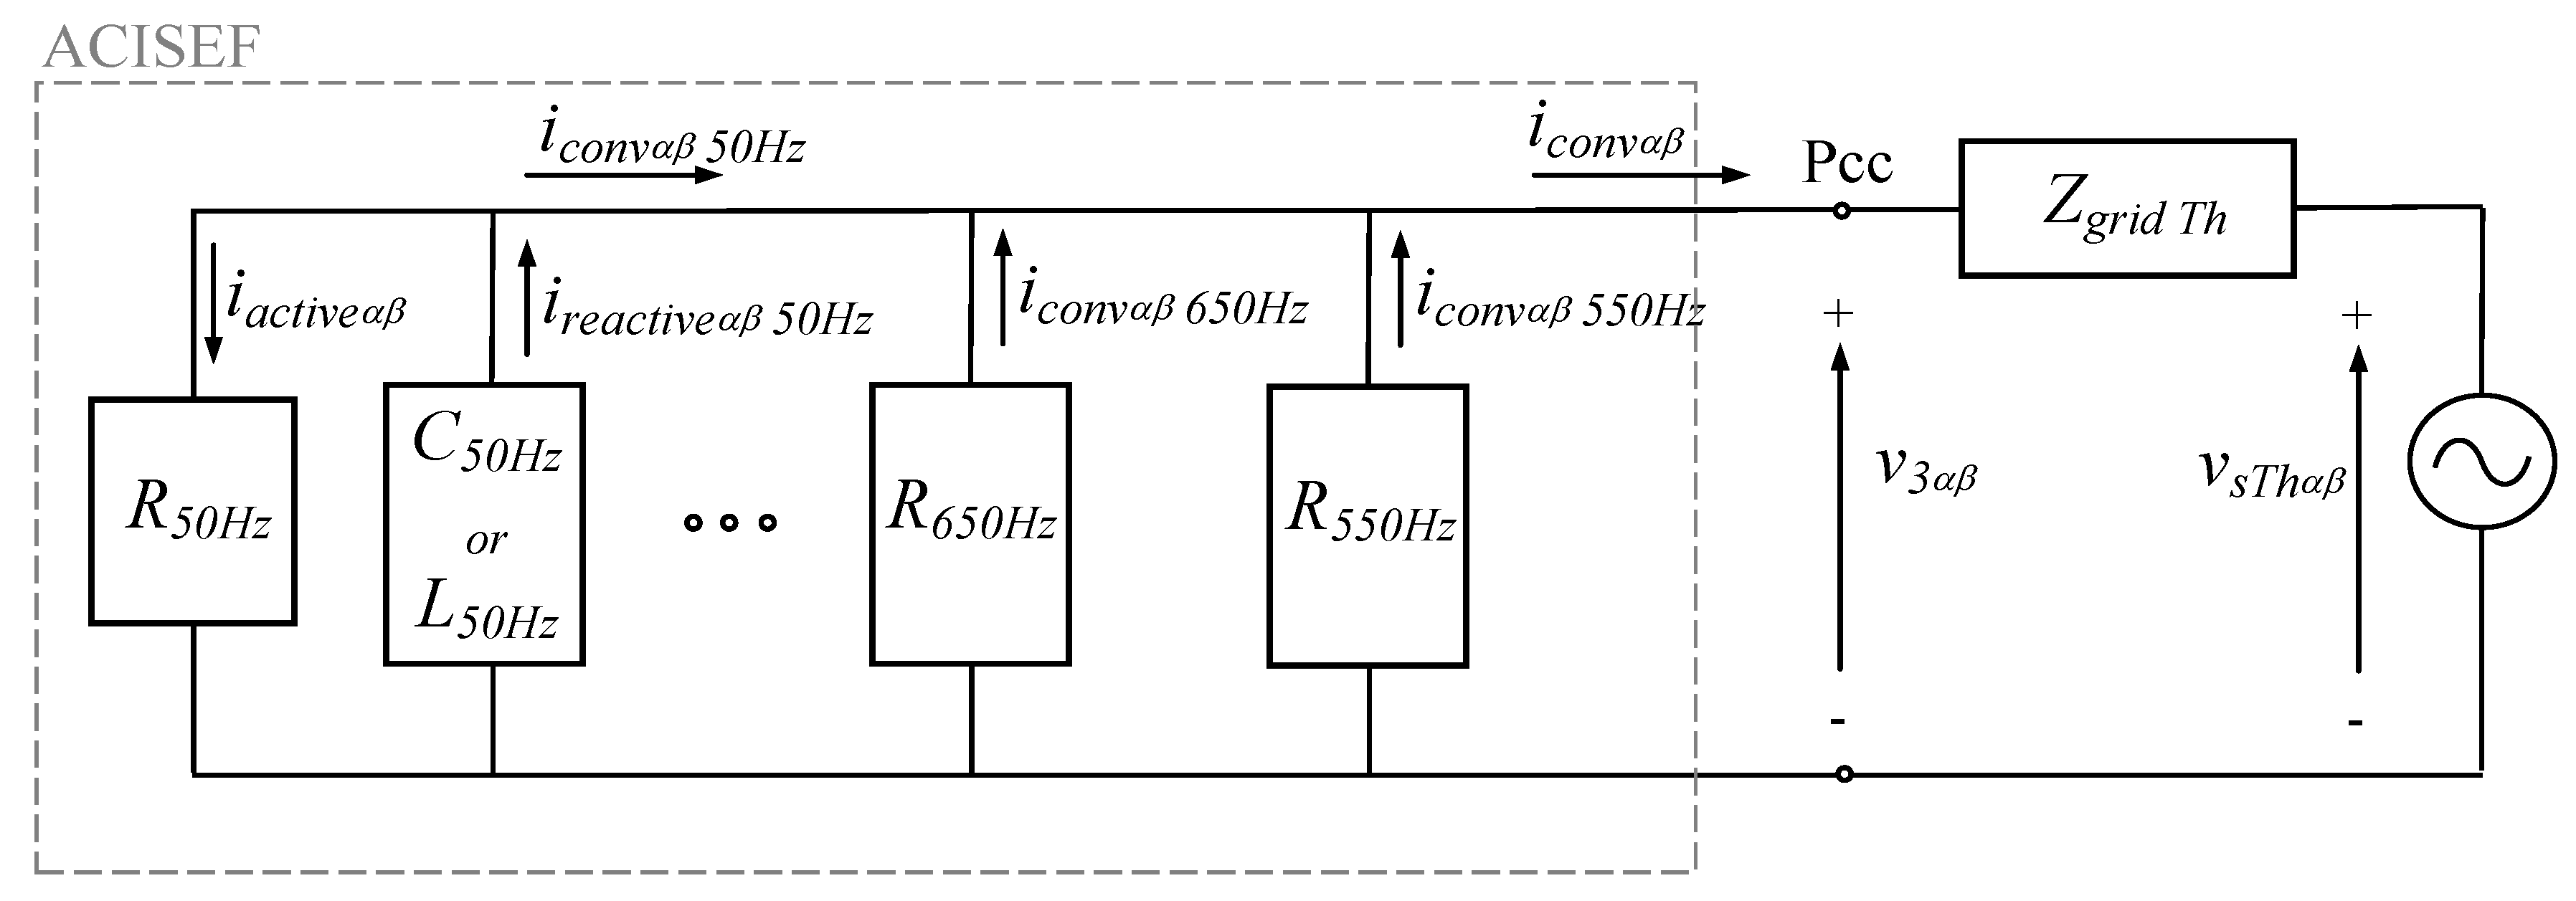
Therefore, by using the control strategy that in later paragraphs is explained the converter is able to behave as an active (or virtual) impedance at selective frequencies. As schematically represented in Figure 6, it is seen that the converter can provide impedance behavior at selected frequencies, such as for instance: R550Hz, R650Hz, and so on. Each selected impedance, by measuring the voltage at the Pcc (v3αβ), only reacts to its corresponding frequency, providing a current defined by the desired impedance itself. The selected active impedances can behave as pure resistive impedances, or as a combination of resistive and inductive (and/or capacitive) impedances (in series or in parallel).
Then, as the converter configuration does not contain a DC energy source, the converter also needs to behave as a 50 Hz resistance (R50Hz), in order to provide the necessary active power to the DC bus capacitor (for instance for power losses) and be able to maintain the DC bus voltage at a fixed constant value. In addition, the converter also is able to behave as a 50 Hz reactive impedance (L50Hz or C50Hz), behaving as a reactive power compensator at the Pcc, the 50 Hz grid’s fundamental frequency. This means that the ACISEF can provide two simultaneous services: one service is the classic STATCOM (reactive power compensator) at 50 Hz; the other is the voltage harmonic mitigation at the Pcc. Overall, it behaves as an active impedance at selected frequencies.
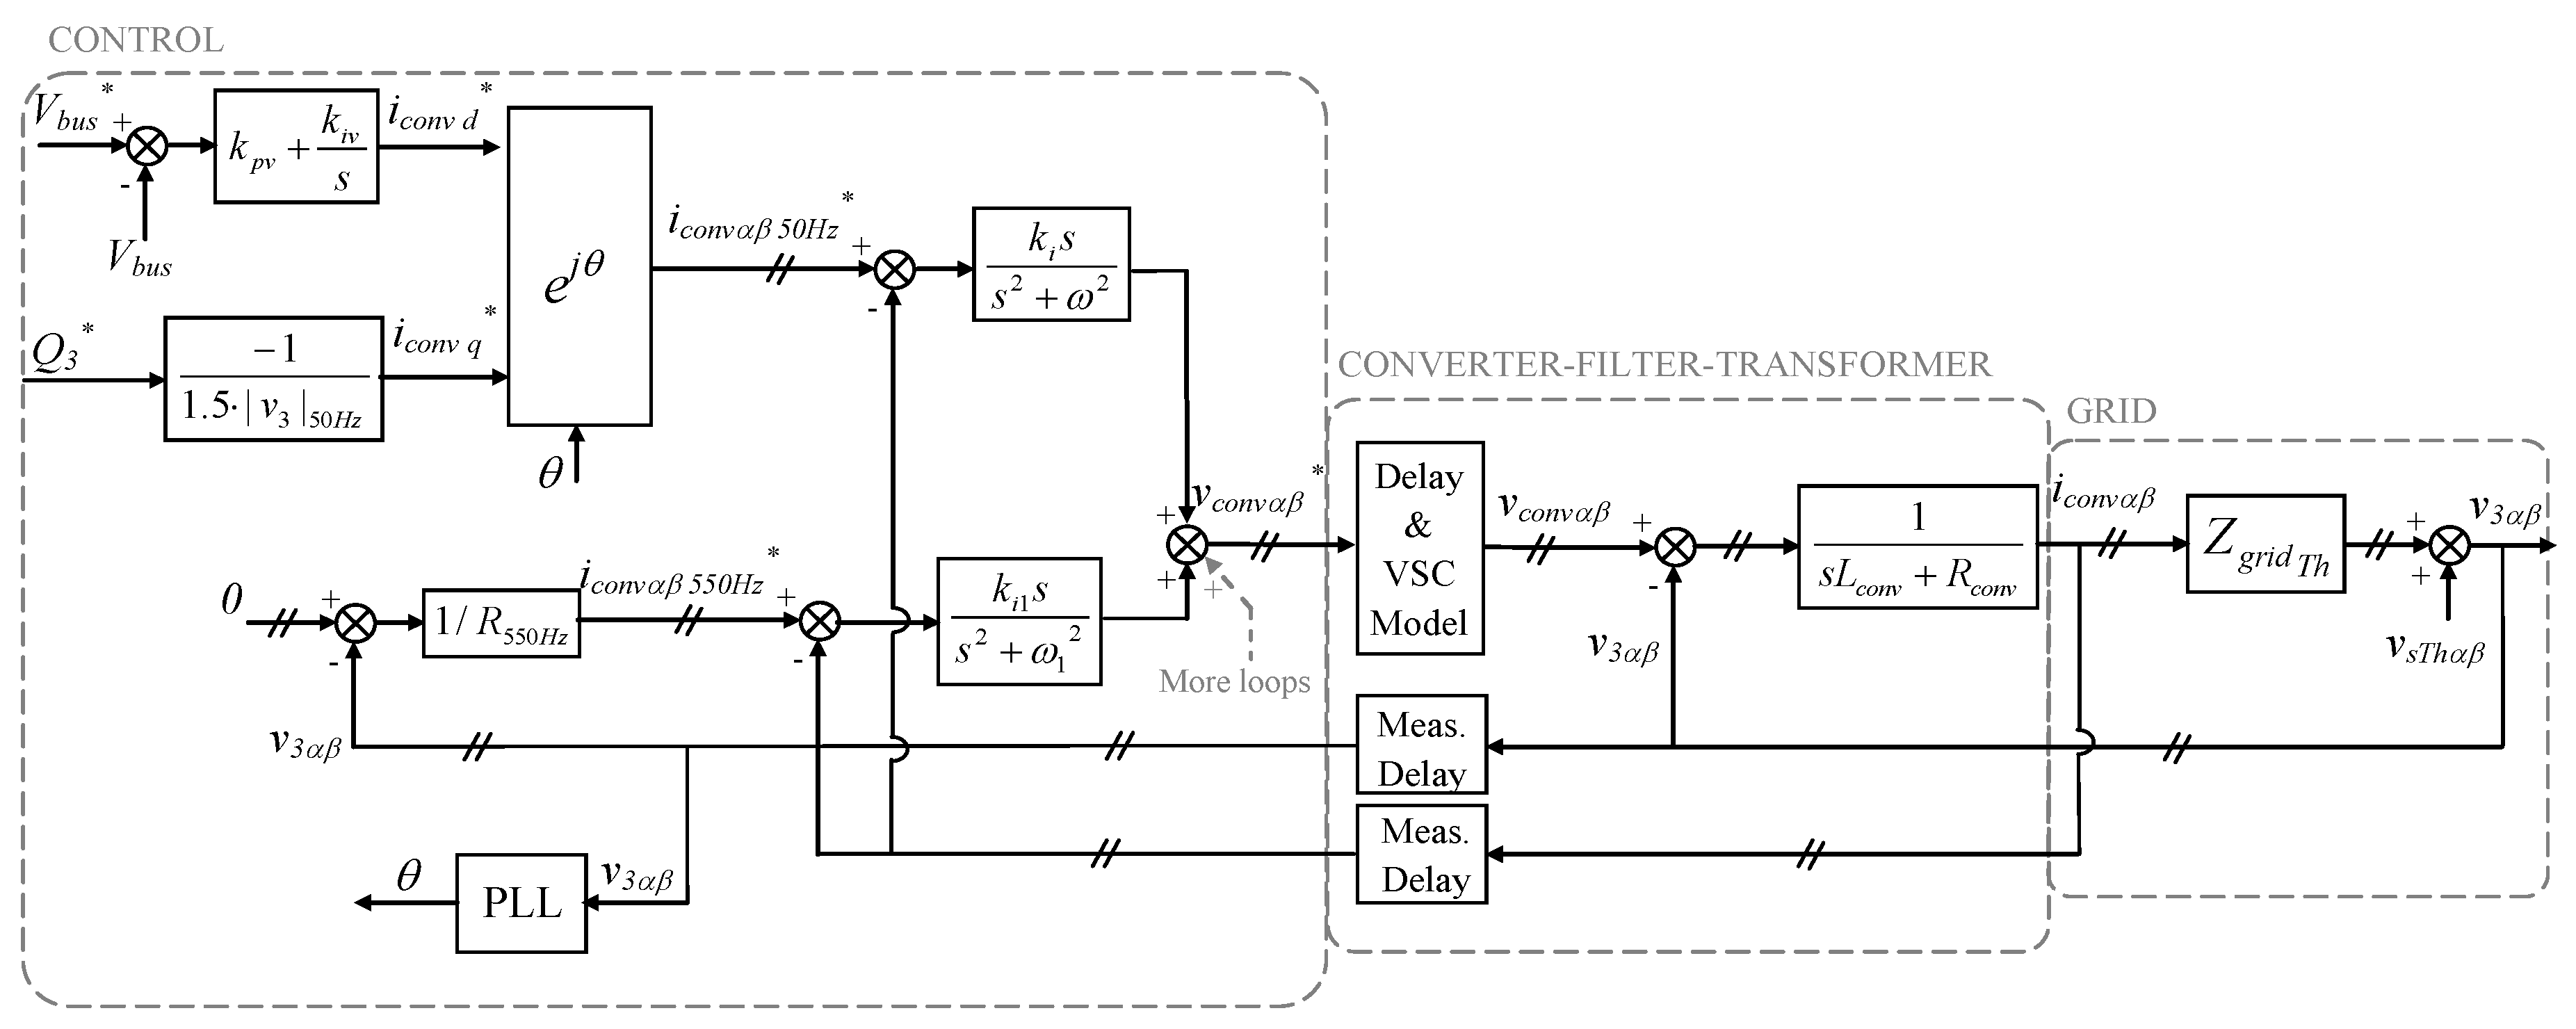
This abstract conceptualization graphically represented in Figure 6 can be materialized with the control block diagram shown in Figure 7. The voltage applied by the converter is created by the addition of several current loops. The active impedance behavior for voltage harmonic mitigation at each selected frequency is composed by a pair of current loops in the stationary reference frame (αβ). The αβ components of the current at each frequency are controlled by their respective resonant controllers. It is possible to add as many pair of loops as there are voltage harmonics that are desired to be mitigated. Then, the active and reactive powers at 50 Hz are controlled in a synchronous rotating reference frame (dq) with the help of a phase-locked loop (PLL) and a PI (proportional-integral) controller for the DC bus voltage control.
Note that for the resonant controllers in the stationary reference frame, only integral terms were included. A proportional gain could be also added to each resonant regulator (or any other alternative); however, in this case, this was not done for the purpose of maintaining simplicity in subsequent analyses. Also, considering the faster dynamic response that the proportional gain provide to the current loops, is was not seen as a necessity [17,18]. It must also be highlighted that the current loops implemented in Figure 7 at the stationary reference frame (αβ) could be also implemented in the synchronous rotating reference frame (dq). Nevertheless, a totally equivalent behavior of the currents loops would be obtained, as proved for instance in [22,23]. Even with the combination of current loops, using both synchronous rotating frames and stationary frames is possible while still reaching equivalent current loops behavior [17,18]. Lastly, note that the control loops or control structure presented in Figure 7, for the ACISEF concept, is not new as it has been already proposed in [7].

3.3. Model Analytical Equations of ACISEF

On the other hand, the converter model together with the output power filter and transformer model can be represented according to the following analytical expression in the stationary reference frame:
( i c o n v α β 50 Hz * i c o n v α β ) F D ( s ) + ( v 3 α β R v 1 i c o n v α β ) F 1 D ( s ) = v 3 α β + ( R c o n v + s L c o n v ) i c o n v α β
The left side of the equation gives the voltage created by the converter, and the right of the equation gives the voltage droop at the filter and transformer added to the voltage of the grid at the Pcc. A unique Rv1 active impedance (pure resistive) was considered in this expression, but more terms intended to mitigate more harmonics could be also added:
F = k i s s 2 + ω 2
F 1 = k i 1 s s 2 + ω 1 2
In this case, ω and ω1 are respectively the angular frequencies of the grid and the voltage harmonic that is intended to be mitigated. Meanwhile, ki and ki1 are the integral gains of the resonant regulators. The switching harmonics due to the switching frequency and modulation utilized were also neglected in this analysis. Note that all of the measurement delays represented in Figure 7 were neglected in this initial example, assuming that they are not significant. Then the VSC delay was represented as D(s) and could be modeled by the Pade approach, using a transfer function of a specific order depending on the actual delay of the specific VSC analyzed [24]. On the contrary, this delay can be also eliminated or minimized by the technique presented in [25]. Note also that for the 50 Hz current loop, the DC bus voltage loop and the reactive power reference were not considered, assuming that they are decoupled from the AC side. These assumptions are considered to be reasonably accurate and help the step-by-step pedagogical understanding of future analyses. However, in future model extensions, this analytical model proposal could integrate any non-modeled phenomena at this first approach. Finally, is has to be mentioned that Equation (1) is valid for both αβ sinusoidal components of voltages and currents of the system, being: i c o n v α β 50 Hz * = [ i c o n v α 50 Hz * , i c o n v β 50 Hz * ] , i c o n v α β 50 Hz = [ i c o n v α 50 Hz , i c o n v β 50 Hz ] , v 3 α β = [ v 3 α , v 3 β ] .
Therefore, rearranging Equation (1) into an input-output matrix form, the ACISEF model matrix equation can be represented as (assuming that the VSC delay is eliminated by the aforementioned technique [25]):
i c o n v α β = [ C o n v 1 C o n v 2 ] [ i c o n v α β 50 Hz * v 3 α β ]
With:
C o n v 1 = F F + F 1 + R c o n v + s L c o n v
C o n v 2 = F 1 / R v 1 1 F + F 1 + R c o n v + s L c o n v
This means that the provided converter current depends on two inputs: the reference for the 50 Hz current (active and reactive power control) and the voltage of the grid at the Pcc (active Rv1 impedance for harmonic mitigation). The terms Conv1 and Conv2 are fifth order transfer functions for this particular case, in which the denominator (poles) are the same:
C o n v 1 = ( k i ) s 3 + ( k i ω 1 2 ) s ( L c o n v ) s 5 + ( R c o n v ) s 4 + ( L c o n v ω 2 + L c o n v ω 1 2 + k i + k i 1 ) s 3 + ( R c o n v ω 2 + R c o n v ω 1 2 ) s 2 + ( L c o n v ω 2 ω 1 2 + k i ω 1 2 + k i 1 ω 2 ) s + R c o n v ω 2 ω 1 2
C o n v 2 = ( R v 1 ) s 4 + ( k i 1 ) s 3 ( R v 1 ω 2 + R v 1 ω 1 2 ) s 2 + ( k i 1 ω 2 ) s R v 1 ω 2 ω 1 2 ( L c o n v ) s 5 + ( R c o n v ) s 4 + ( L c o n v ω 2 + L c o n v ω 1 2 + k i + k i 1 ) s 3 + ( R c o n v ω 2 + R c o n v ω 1 2 ) s 2 + ( L c o n v ω 2 ω 1 2 + k i ω 1 2 + k i 1 ω 2 ) s + R c o n v ω 2 ω 1 2
It can be seen that the poles do not depend on the active impedance value. It is seen that Rv1 only affects the zeros of Conv2(s).

3.4. Performance Analysis of ACISEF

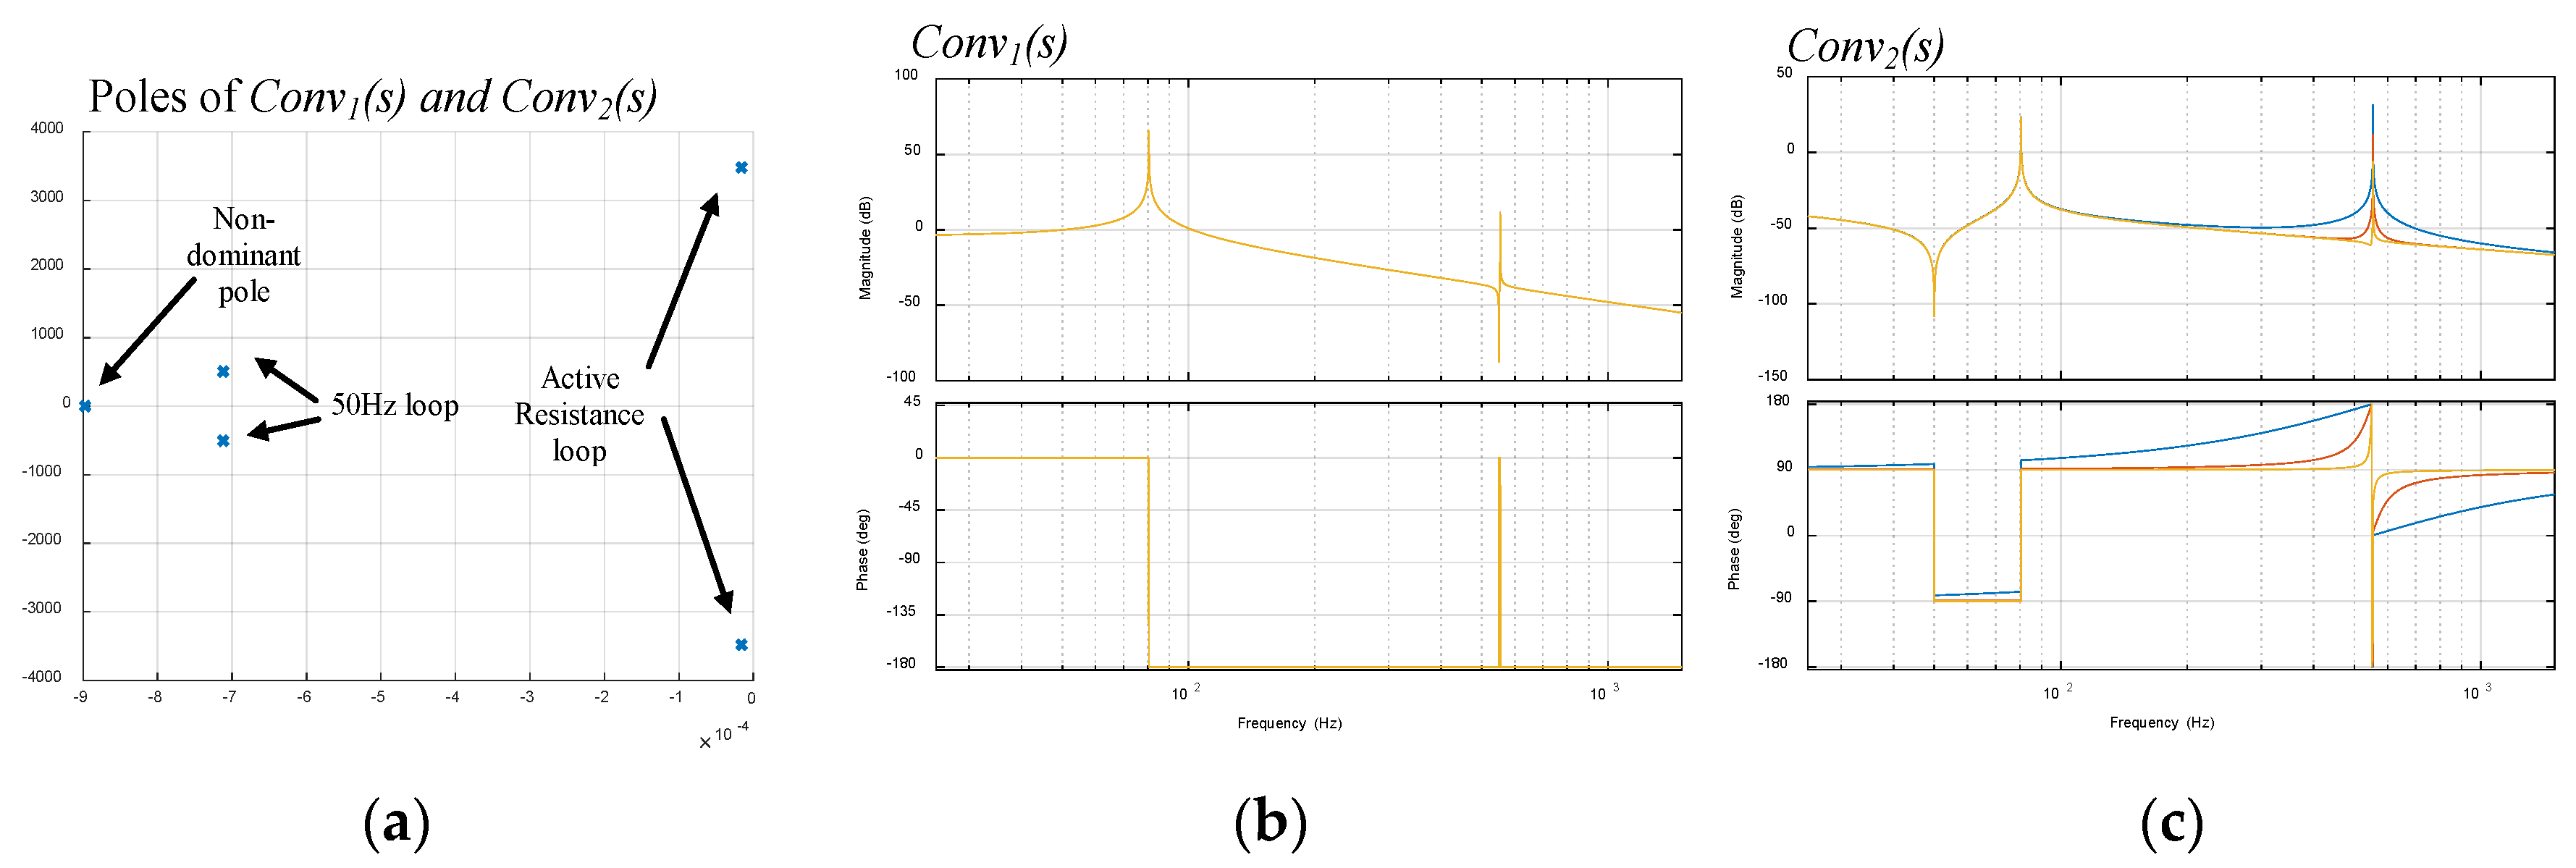
Once the analytical expressions of the output current iconvαβ of the converter are derived, the system is ready to be analyzed. Pole representations and Bode plots of Conv1(s) and Conv2(s) at different pure active resistance values are provided in Figure 8 (see Appendix A for the numerical values utilized). In relation to the poles (Figure 8a), it is possible to observe two pairs of complex conjugate poles at approximately ω and ω1 (imaginary parts), the first dominated by the 50 Hz loop and the second dominated by the active resistance for harmonic mitigation. The fifth real pole results from the combination of all of the parameters of the system, but it is mainly dominated by the filter’s impedance (Rconv-Lconv). Its influence on the system’s dynamic is of little importance. In relation to the Bode plots of Conv1(s) (Figure 8b), as can be deduced from Equation (5), the change in the active virtual resistance does not affect the dynamic of this transfer function. It is seen that the gain at 50 Hz is 0 dB (gain 1), which is the objective of the loop. This loop is able to react to frequencies up to approximately 110 Hz (−3 dB), which is the bandwidth of the current loop with the chosen ki of the resonant regulator. Note that a minimum bandwidth is always necessary to provide to the loop the required dynamic response capacity to follow reference variations and be able to ensure perturbations rejection. Then, at 550 Hz, there is a rejection of this loop by means of an attenuation of around −90 dB. In relation to the Bode plots of Conv2(s) (Figure 8c), it is seen that at 50 Hz of the Pcc, the voltage does not respond (−100 dB), while at the 550 Hz it presents the admittance in dB programmed by the active resistance chosen, i.e., blue: Rv1 = 7.562 Ω → −17.5 dB, red: Rv1 = 75.62 Ω → −37.5 dB, orange: Rv1 = 756.2 Ω → −57.5 dB. In all of these cases, the phase shift is 180° at 550 Hz in order to behave as a pure resistance in opposite phase. Note that the resonance peak is at around 553 Hz (not exactly at 550 Hz), which is again due to the necessary bandwidth of this loop.
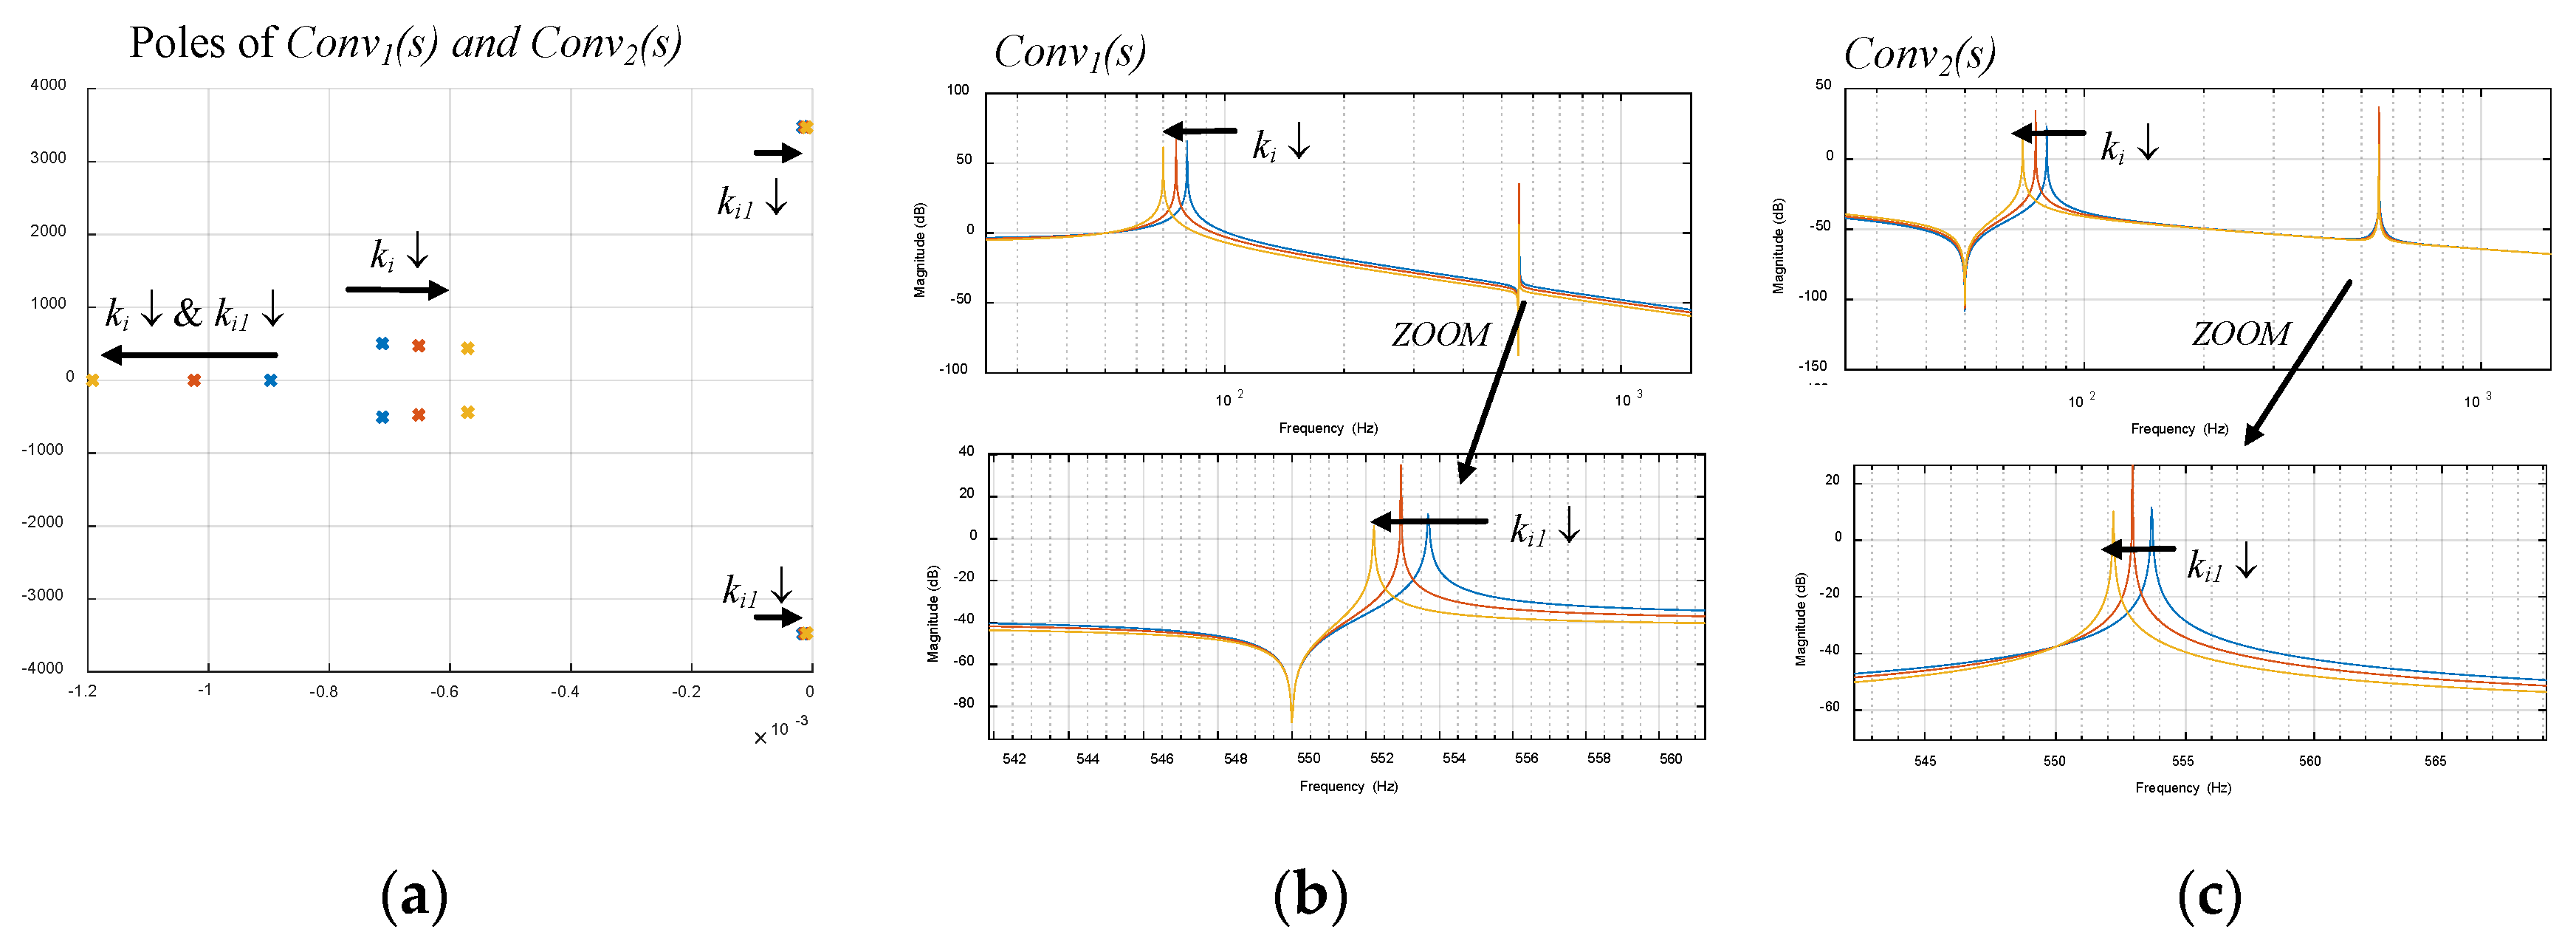
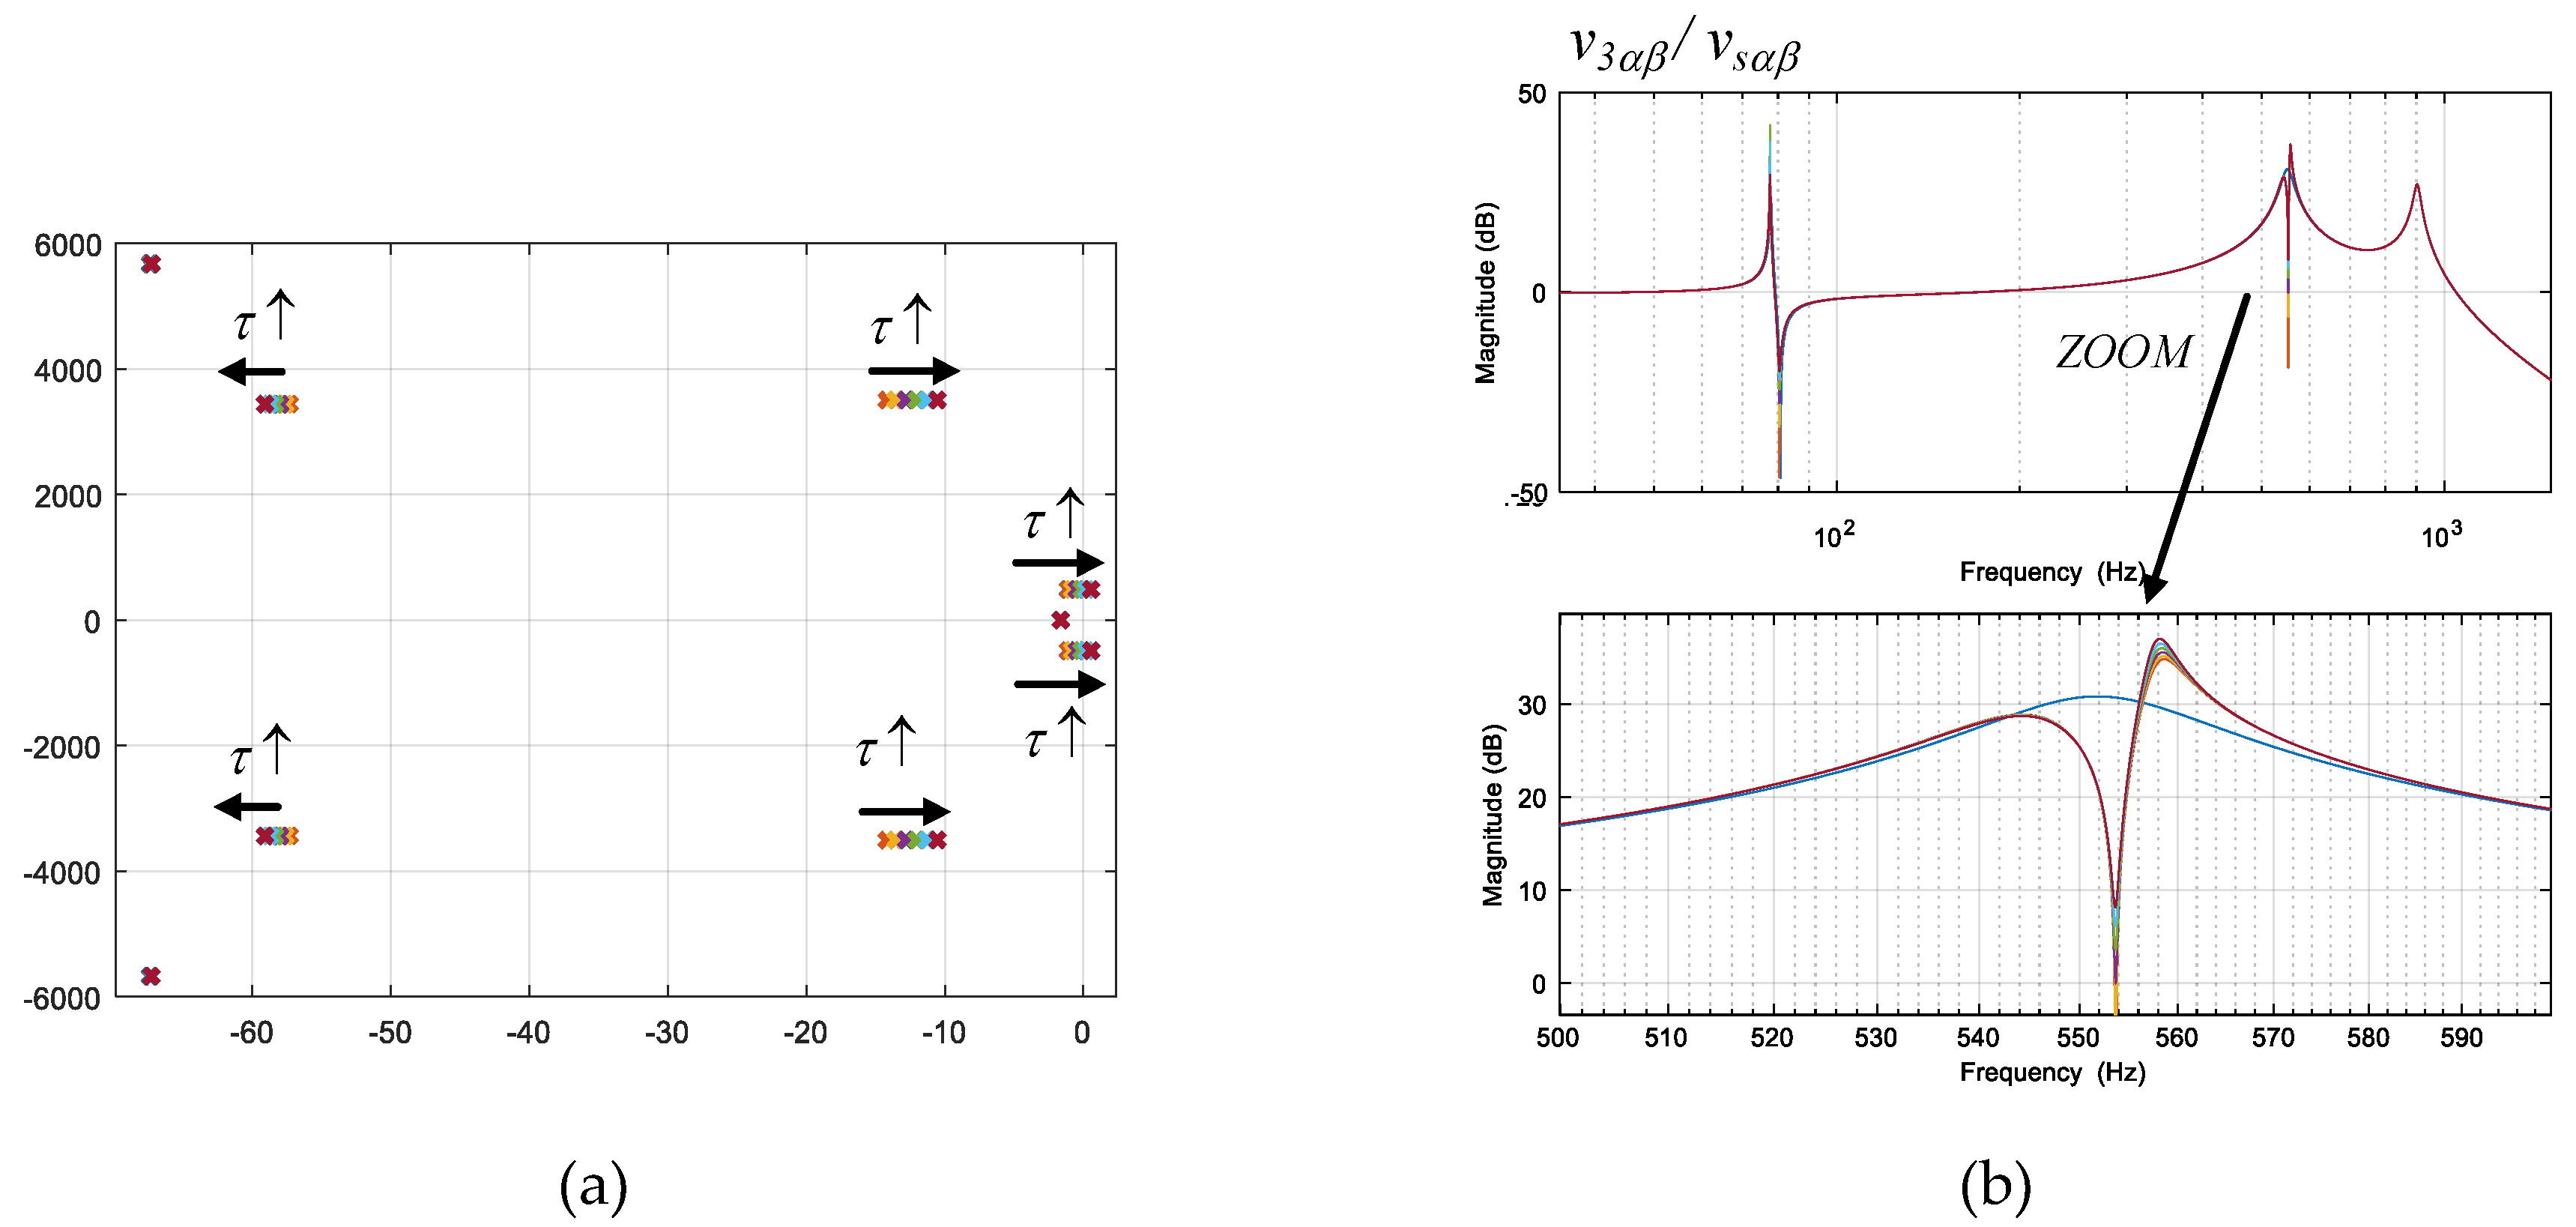
According to a different analysis, Figure 9 shows the behavior of the pole and Bode plots with active resistance Rv1 = 75.62 Ω and different gains of resonant regulators. Regarding the poles, it is seen that the poles corresponding to 50 Hz and 550 Hz move their real parts to the right with an integral gain decrease (opposingly, the move to the left with an integral gain increase). This means that a too-low gain could destabilize the system. It can be seen also that the real pole moves to the left with the gain decrease. In relation to the Bode plot of Conv1(s) (Figure 9b), it can be seen that at 50 Hz the gain is still 0 dB, while the bandwidth is reduced (peaks move left) with a lower ki gain. The same happens at 550 Hz. Finally, in relation to the Bode plot of Conv2(s) (Figure 9c), something equivalent occurs; the active admittance is kept constant (Rv1 = 75.62 Ω → −37.5 dB) while the bandwidth of the loops is reduced with lower integral gains.

4. Analytical Global Model of AC Grid and ACISEF

4.1. Partial Analytical Models

This section describes how the analytical model of the entire AC grid together with the ACISEF can be developed, which is the main theoretical contribution of this article. This global model is interesting for design and analysis purposes, since it joins together the control strategy (control loops) of the converter connected to the grid with the grid itself. The modeling approach presented is progressive, in the sense that it first models the different elements of the system separately (grid parts and ACISEF), according to a specific matrix equation structure. Then, once the different elements of the system are modeled, it interconnects all of them (as detailed in the next subsection) to obtain the global analytical model. This, step-by-step modeling procedure is very helpful since it can be easily adapted to changes of the grid or new grid scenarios.
Therefore, the first task is to separately derive the model matrix equations of the different parts of the AC grid. These equations come from the basic equations derived from the electric circuit of Figure 3:
v s α β = ( R 1 + s L 1 ) i 1 α β + v 1 α β ,   v 1 α β = ( 1 s C 1 + R c 1 ) ( i 1 α β i 2 α β )
v 1 α β = ( R 2 + s L 2 ) i 2 α β + v 2 α β ,   v 2 α β = ( 1 s C 2 + R c 2 ) ( i 2 α β i 3 α β )
v 2 α β = ( R 3 + s L 3 ) i 3 α β + v 3 α β ,   v 3 α β R L = i 3 α β + i c o n v α β
The structure of the matrix equations to be obtained is equivalent to those obtained for the ACISEF individual model by means of Equations (4)–(6). Hence, based on the equivalent AC electric circuit of Figure 3, the ‘Source’ model is derived. This basic element is composed by the equivalent voltage source and the impedances R1 and L1. By applying basic electric equations, it is possible to derive:
i 1 α β = [ S o u r c e 1 S o u r c e 2 ] [ v s α β v 1 α β ]
Being:
S o u r c e 1 = 1 R 1 + s L 1 ,   S o u r c e 2 = 1 R 1 + s L 1
By analyzing the resulting matrix expression, this ‘Source’ element can be conceptually understood as an admittance that depends on two voltage inputs and provides a current as output. After this, the next part that can be separately modeled is the ‘PI’ element, composed by the parallel C1-Rc1 and C2-Rc2 impedances as well as the series R2 and L2 impedances. By carefully manipulating equations, it is possible to obtain the following matrix equation:
[ i 2 α β v 1 α β v 2 α β ] = [ P i 11 P i 12 P i 21 P i 22 P i 31 P i 32 ] [ i 1 α β i 3 α β ]
Being:
P i 11 = 1 s C 1 + R c 1 R 2 + L 2 s + 1 s C 1 + R c 1 + 1 s C 2 + R c 2   P i 12 = 1 s C 2 + R c 2 R 2 + L 2 s + 1 s C 1 + R c 1 + 1 s C 2 + R c 2
P i 21 = ( 1 s C 1 + R c 1 ) ( 1 s C 1 + R c 1 ) 2 R 2 + L 2 s + 1 s C 1 + R c 1 + 1 s C 2 + R c 2   P i 22 = ( 1 s C 1 + R c 1 ) ( 1 s C 2 + R c 2 ) R 2 + L 2 s + 1 s C 1 + R c 1 + 1 s C 2 + R c 2
P i 31 = ( 1 s C 1 + R c 1 ) ( 1 s C 2 + R c 2 ) R 2 + L 2 s + 1 s C 1 + R c 1 + 1 s C 2 + R c 2   P i 32 = ( 1 s C 2 + R c 2 ) + ( 1 s C 2 + R c 2 ) 2 R 2 + L 2 s + 1 s C 1 + R c 1 + 1 s C 2 + R c 2
Conceptually, the ‘Pi’ element can be seen as an impedance that presents to input currents and provides two voltages and an internal current as outputs.
Finally, an ‘RLR’ element is distinguished, composed by the series impedances R3 and L3 and a parallel pure resistive RL impedance. The matrix equation thus obtained is:
[ v 3 α β i 3 α β ] = [ R L R 11 R L R 12 R L R 21 R L R 22 ] [ v 2 α β i c o n v α β ]
Being:
R L R 11 = R L R 3 + R L + L 3 s   R L R 12 = R L ( R 3 + L 3 s ) R 3 + R L + L 3 s
R L R 21 = 1 R 3 + R L + L 3 s   R L R 22 = R L R 3 + R L + L 3 s
With this, all of the separate elements of the AC grid and the ACISEF itself have been analytically modeled. Note that the ‘Source’, ‘PI’, and ‘RLR’ elements are basic parts of an AC grid and can be separately added or combined (in series and in parallel) to form any type of AC grid. In future hypothetical works, if a new AC grid model analysis requires the incorporation of a new non-considered element (such as for instance passive filters), the reader can easily derive the associated matrix equation. This example-based exposition is not intended to cover all of the possible combinations that may exist.

4.2. Interconnection of All Separate Individual Models: Global Analytical Model

Once the individual models are obtained, as in the previous subsection, the global model integrating all of the separate models can be obtained. In order to do that, the same process as that followed in [16] is carried out. As can be noticed, in all matrix expressions obtained, the input and output variables are repeated; in some elements are inputs and in others outputs. Therefore, it is possible to use a computer-based tool (symbolic or numeric) to mathematically interconnect all of the matrices. For this particular case, the ‘connect’ function from Matlab (Control System Toolbox) is used, since it can be very easily applied. By taking the ACISEF model Equations (4)–(6), together with the AC grid model Equations (9)–(20), and using the ‘connect’ function, is possible to obtain a global matrix with this structure:
[ v 1 α β v 2 α β v 3 α β i 1 α β i 2 α β i 3 α β i c o n v α β ] = [ M G A M ( s ) ] [ i c o n v α β 50 Hz * v s α β ]
The matrix MGAM(s) of the global analytical model contains all of the transfer functions (order 10 in this particular case) that represent the multivariable system, with, in this case, two inputs and seven outputs. Note that should it be of interest for the analysis, more outputs to the model could be added, such as powers or other electric variables, by adding the corresponding model equations. Once the global analytical model is obtained, it is possible to use it for any kind of analysis: stability, robustness, design, etc., as shown in the next section.
Finally, before continuing, it is necessary to remark two general conceptual issues. First, one might think that it could be possible to avoid this last step of interconnection by using a computer-based tool and instead to derive the final global matrix ‘by hand’. The reader should note that this is a not very easy task, since the resulting matrix MGAM(s) is too large and complex to handle by hand. So, it is probably a more functional option to use the ‘connect’ function to interconnect all of the individual parts of the system, keeping in mind that this is an adaptable and general modeling procedure that can be suited to future AC grid scenarios, in which more branches, elements, Pi circuits, loads, and many other elements can be incorporated. Finally, the ‘integrative nature’ of this modeling approach must be considered. Note that to conduct a particular analysis focused on special phenomena, for instance a more complex converter filter (LC) [21], a ‘Pi’ circuit with a more complex series impedance [19], a converter model considering the switching harmonics, or some other phenomena, the above modeling philosophy and procedure will still be useful. The only additional task would be to incorporate more complex model equations, describing the behavior of the new and more complex phenomena.

5. Usefulness of the Global Analytical Model: Analysis Based on the Model

5.1. Introduction

The following sections show the usefulness of the global analytical model. By means of a multi-phenomenon analysis approach, different aspects related to the system will be analyzed with the help of the analytical model. Pole and Bode plots are used for the analysis, which reveal the stability (and robustness against parameters variations) on the one hand and the frequency performance (resonances and harmonic issues) on the other. Since the system is quite complex in the sense that there are many parameters or factors that could affect the stability and harmonic performance of the global system, the analysis is addressed step-by-step, analyzing different factors individually and separately. It has to be remarked that the analyses presented in this section are merely short illustrative examples of what could be analyzed and how such analyses could be conducted with the proposed model.
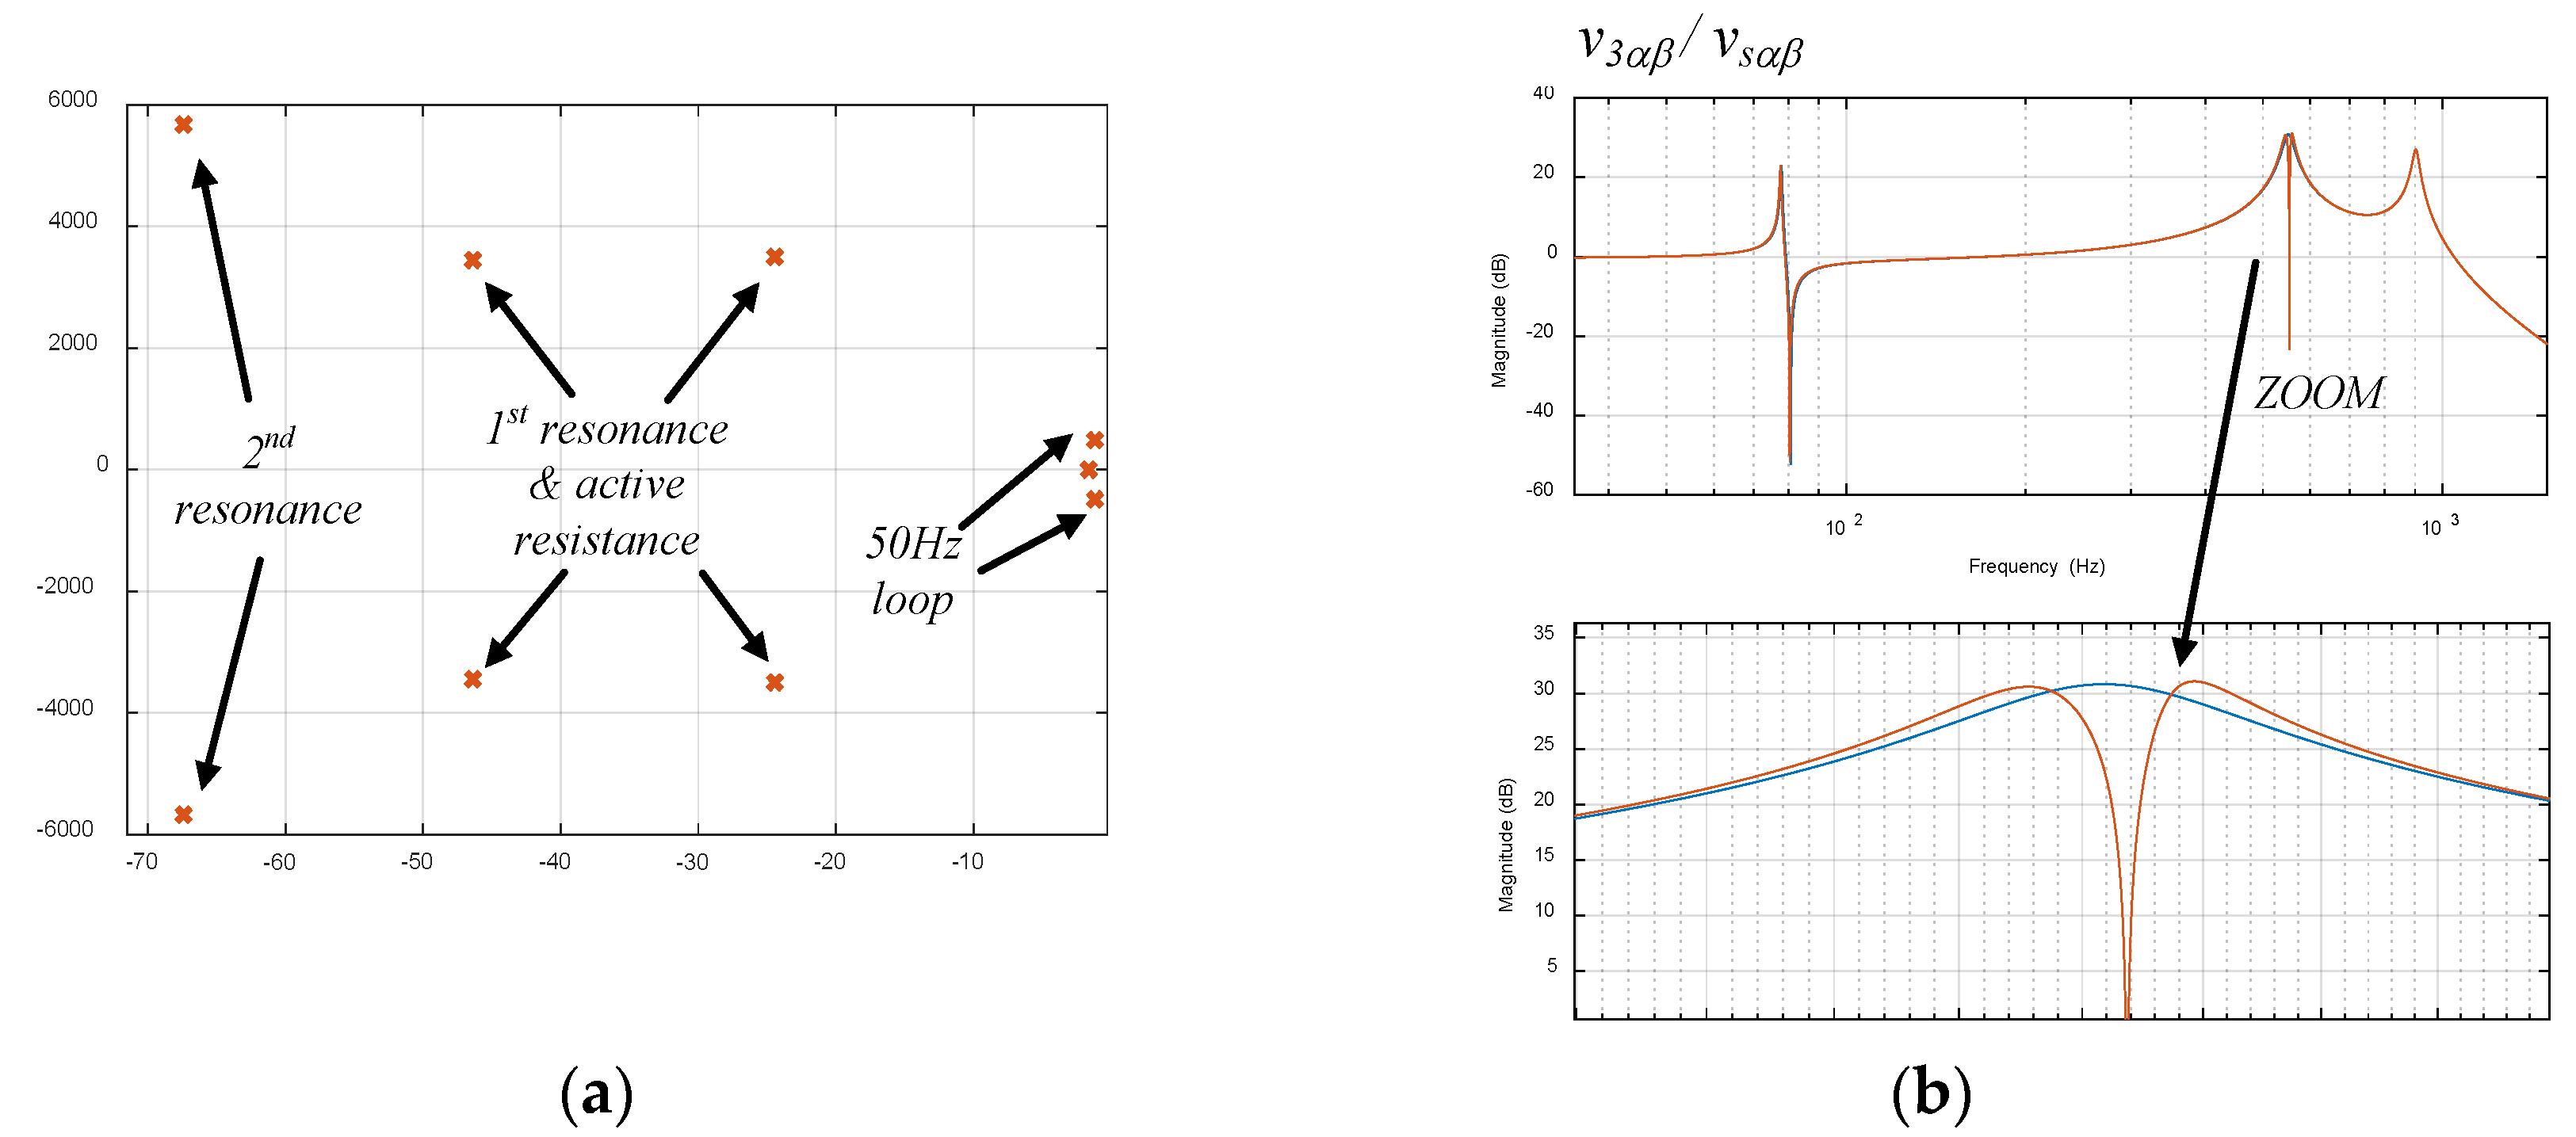
Hence, the first study performed is the active impedance effect of the ACISEF, when it is connected to the AC grid used in previous sections (see Appendix A for data). The graphics shown mainly focus on the harmonic mitigation performance analysis; therefore, no Bode plots related to the 50 Hz loop are shown, although the loop is present. Hence, as can be seen in Figure 10a where the poles of all the transfer functions of the system are presented (the poles of all of the elements in MGAM(s) in Equation (21) are the same, what means that all the elements are present with the same denominator), the presence of an active resistance Rv1 = 7.562 kΩ (2.5 Ω at the low voltage side) programmed at 550 Hz (harmonic 11) makes two complex conjugate pole pairs appear around 550 Hz (3.4 krad/s). One pair is due to the presence of the AC grid equivalent impedance and the other pair is due to the loop. Then, there is one more complex conjugate pole pair mainly due to the second resonance of the AC grid at approximately 900 Hz (5.6 krad/s). In this example, there is no active resistance implemented. Then, there is one more complex conjugate pole pair mainly due to the presence of the 50 Hz loop (314 rad/s) of the ACISEF. Also, there is also one real pole located approximately at −1.7, which is due to the imbricated interaction of different parameters of the ACISEF. Finally, there is also a non-dominant pole at −12 × 105, due to the imbricated interaction of the parameters of the system that were left out of the graphic for simplicity in the exposition.
On the other hand, in Figure 10b, the Bode plot of v3αβ(s)/vsαβ(s) depicts the transfer function with the active resistance activated (red) and disabled (blue). At 550 Hz an attenuation of 3.2 dB is obtained (from 30.7 dB to 27.5 dB) at the AC grid, which means that if there are voltage harmonics caused at the equivalent source (voltage source converters, thyristor-based HVDC, etc.), these harmonics will be attenuated by 3.2 dB thanks to the active resistance programmed. It can be seen as well that due to the bandwidth of the 550 Hz current loop (the active resistance), attenuation is also achieved in the neighborhood frequencies of 550 Hz. Note that the presence of the 50 Hz loop, produces at the point of common coupling (v3αβ) a resonance effect in the vicinity of 80 Hz. This inevitable fact is not important in principle since it does not coincide with multiples of 50 Hz harmonics.

5.2. Variation of Active Impedance Values

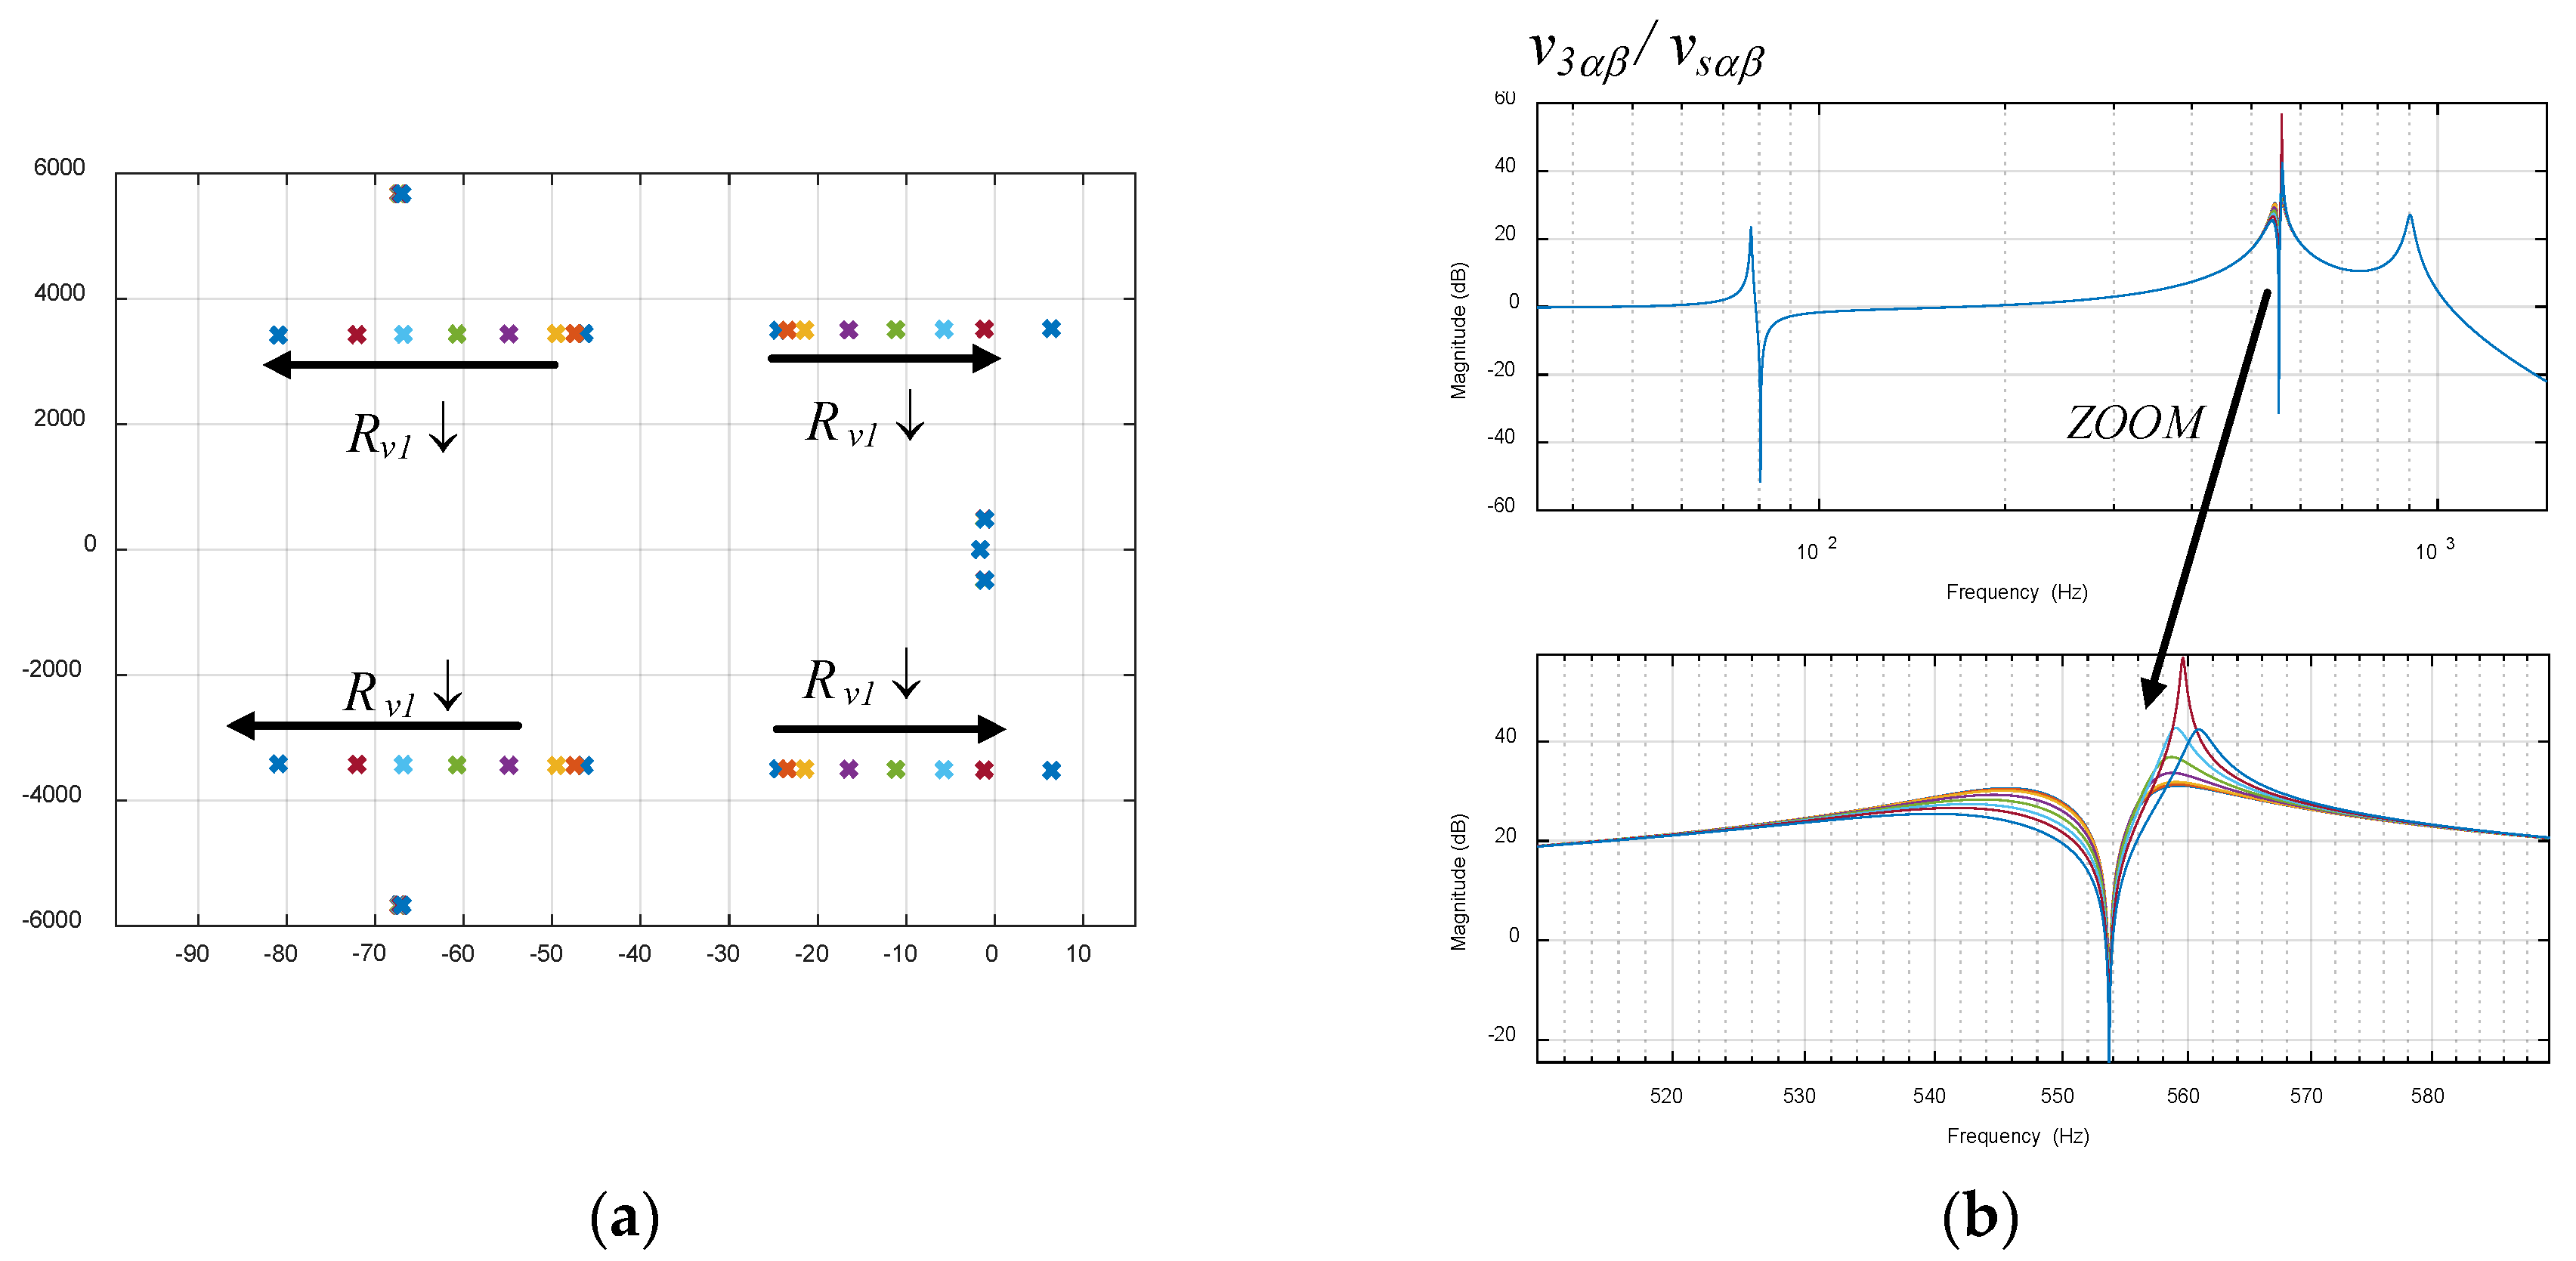
In this analysis, the variation of the active resistance is evaluated. From the initial value used in the previous analysis, specifically Rv1 = 7.562 kΩ (2.5 Ω at the low voltage side) programmed at 550 Hz (harmonic 11), several smaller active resistances are programmed (multiplied by factors: (1 0.75 0.5 0.25 0.15 0.1 0.075 0.05)). As can be observed in Figure 11a, the active resistance variation mainly affects the 550 Hz complex conjugate pole pairs, displacing them to the right and to the left with lower active resistance values. What it is very important here is to notice that the poles moving to the right can become unstable with very low values of active resistance. Alternatively, the rest of the poles are almost maintained unaltered. On the other hand, as can be observed in Figure 11b in the Bode diagrams, the active resistance decrease produces a higher attenuation at 550 Hz and the surrounding neighborhood, as expected. Therefore, through this analysis, the analytical global model reveals that it is important to choose an appropriate active resistance (not too small of a value) in order to make the system stable (as in an unstable situation, overcurrent or overvoltage protection would disconnect the converter).

5.3. Variation of the Current Loop Bandwidth of the Active Resistance

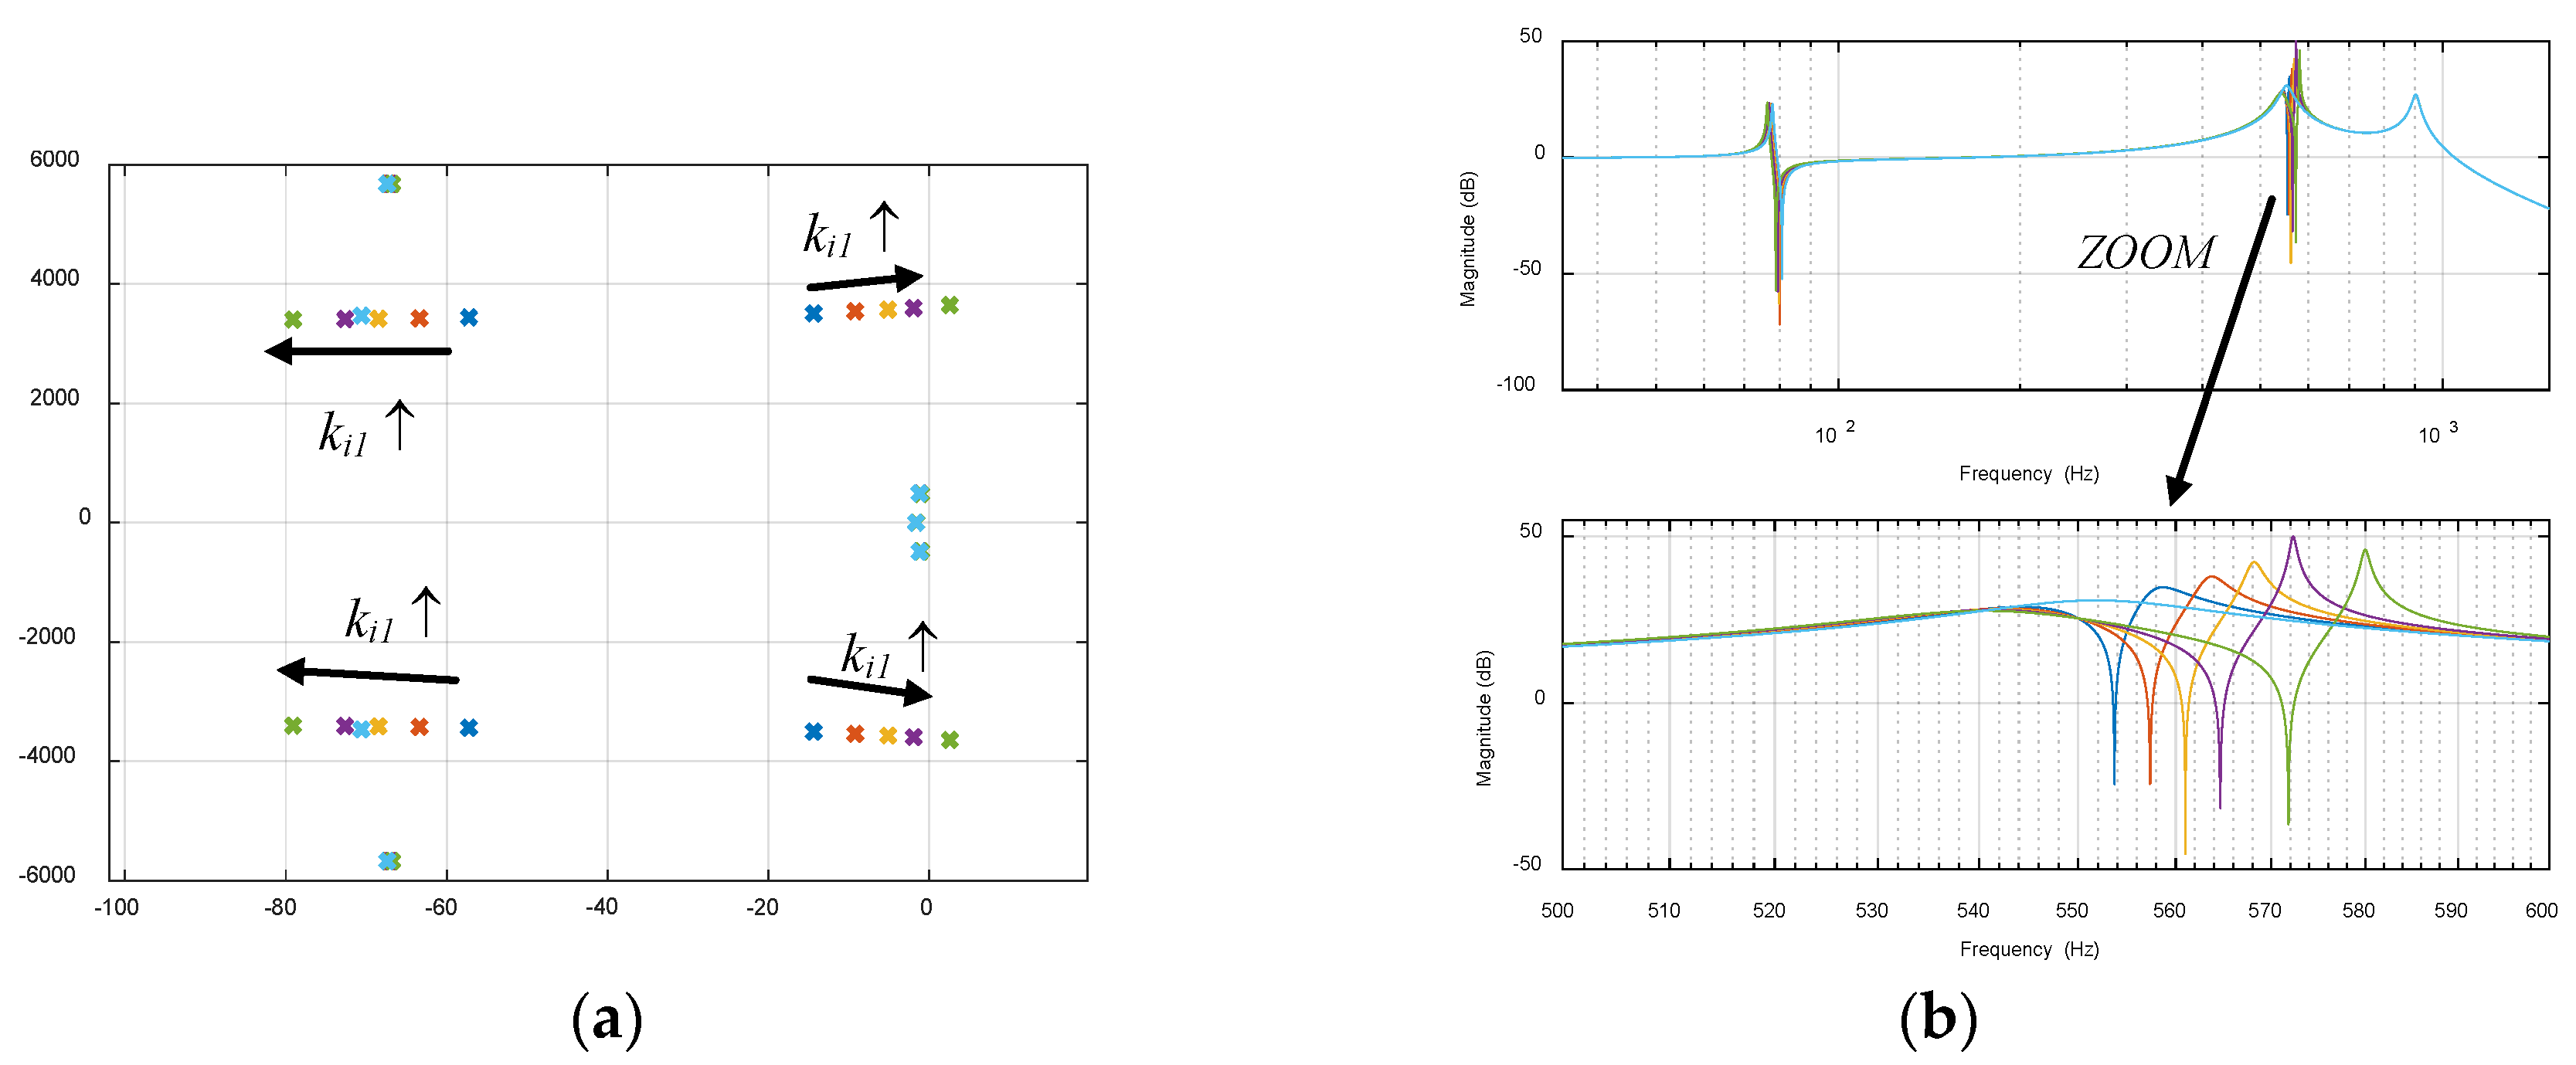
In this analysis, the variation of the current loop bandwidth of the active resistance is evaluated. With a constant Rv1 = 7.562 kΩ (2.5 Ω at the low voltage side) programmed at 550 Hz (harmonic 11), the gain of the integral part of the loop (ki1) is increased from its initial value (see Appendix A). As can be seen in Figure 12a, the variation again mainly affects the 550 Hz complex conjugate pole pairs, displacing them to the right and to the left with higher active resistance values, as well as possibly causing the system to become unstable with very high gains (high bandwidths). In the opposite direction, if ki1 is smaller, the systems would also become unstable due to a displacement to the right of the left hand-situated conjugate pole pair. On the other hand, as can be observed in the Bode diagrams of Figure 12b, this gain does not affect the attenuation achieved at a frequency of exactly 550 Hz. However, as expected, with a higher current loop bandwidth, the frequency range affected by the active resistance is bigger.

5.4. Variation of the AC Grid Impedances

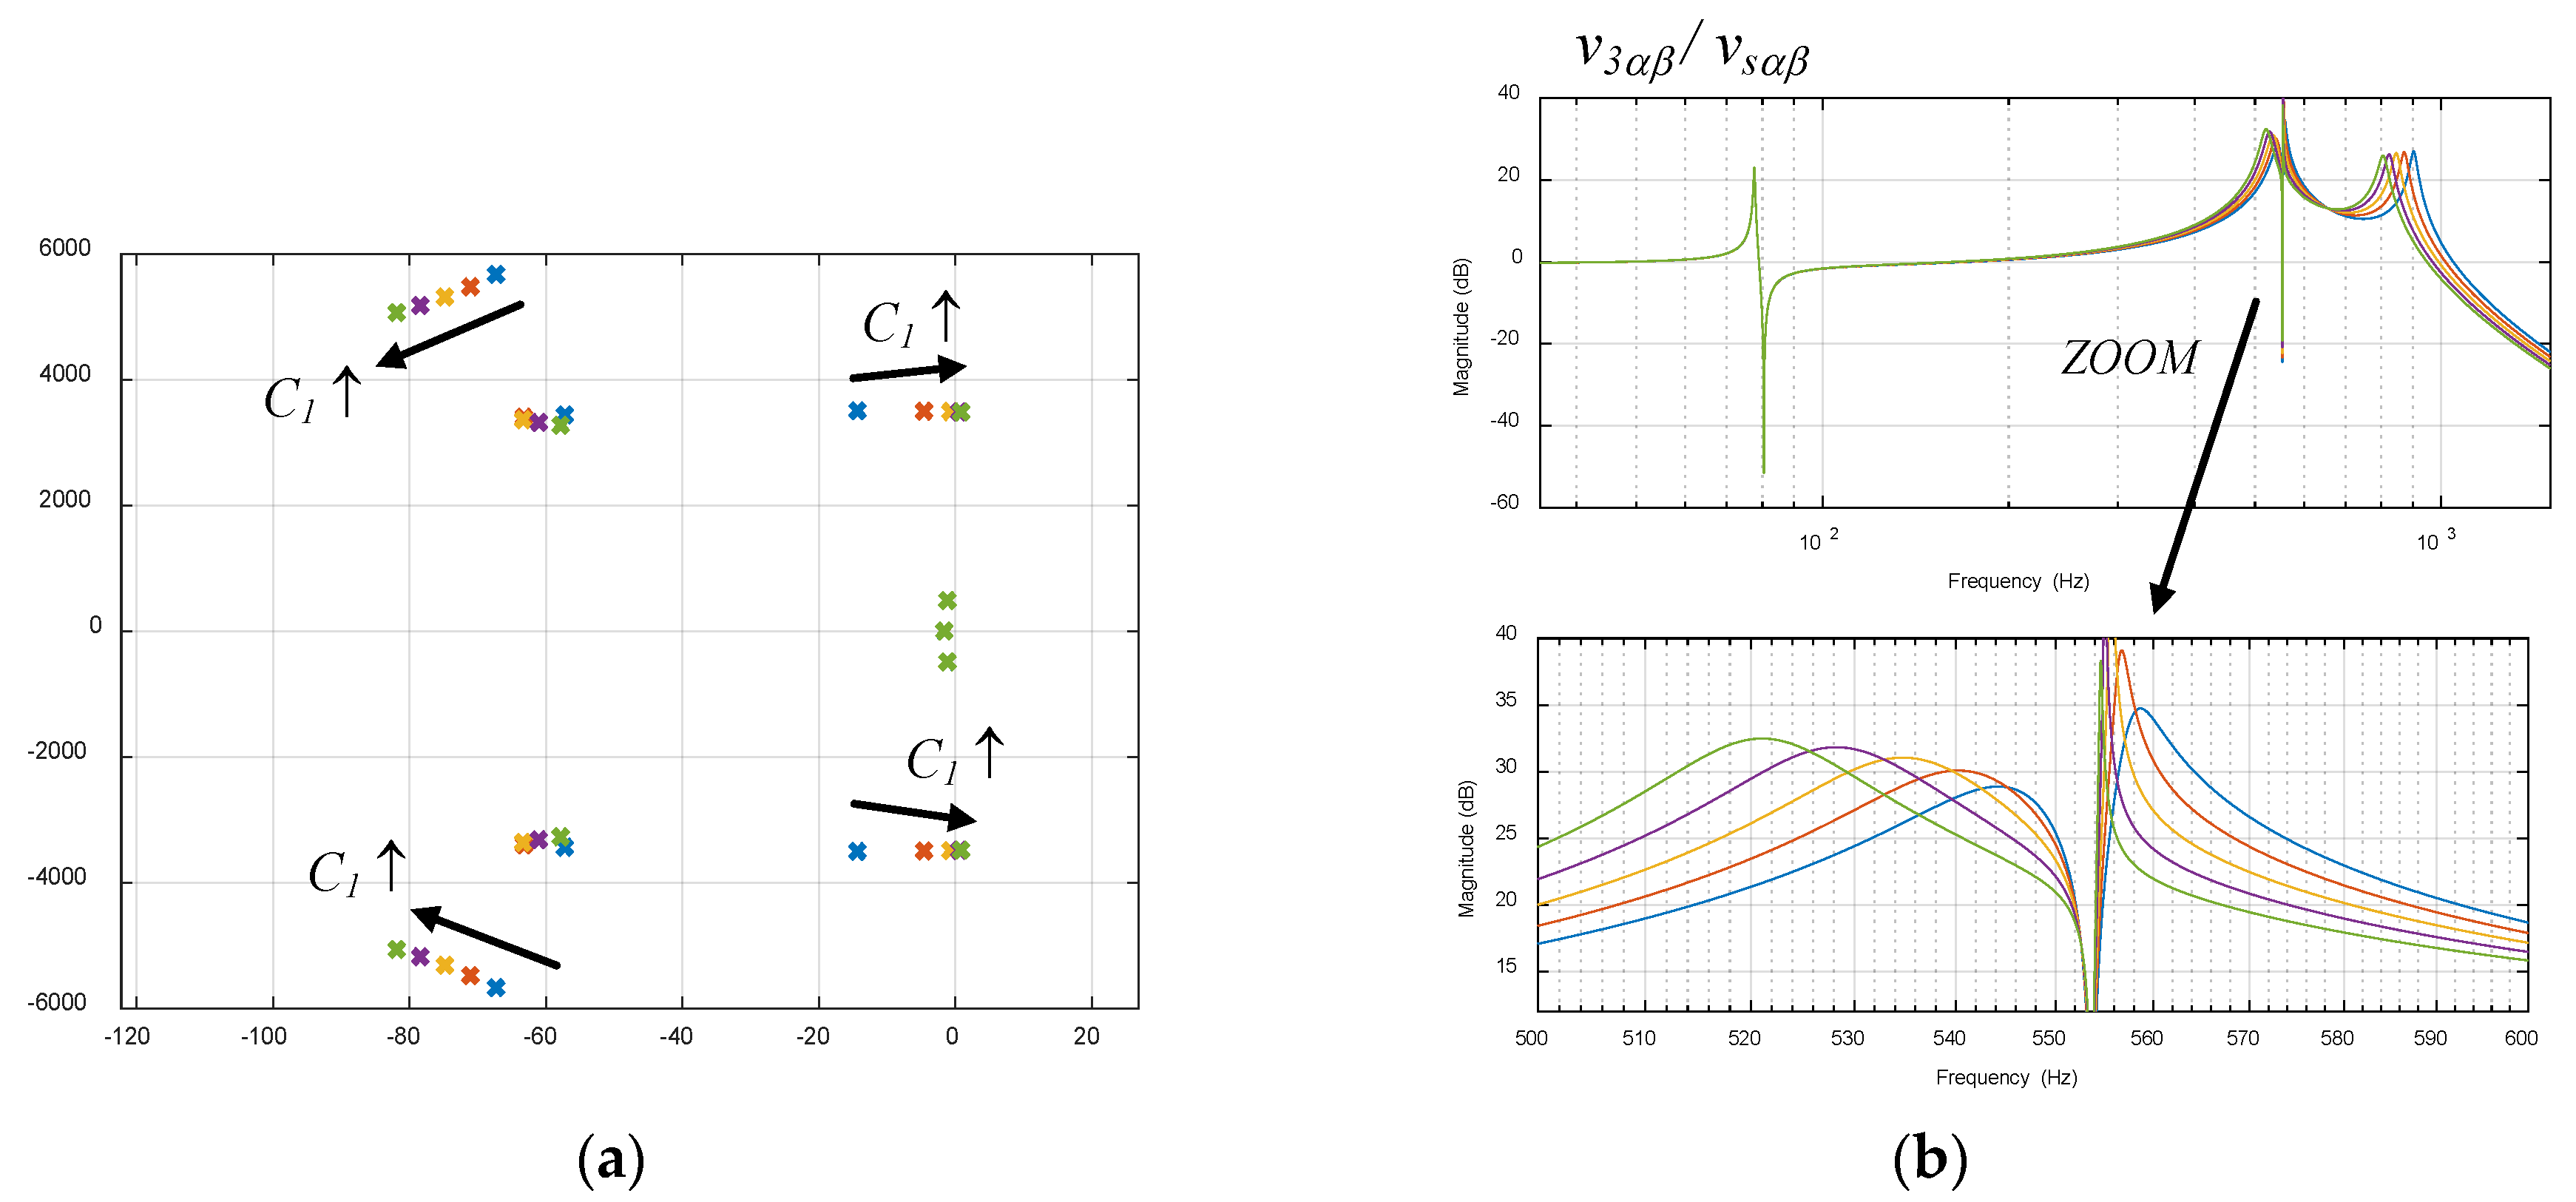
In this analysis, the effect produced by the variation of the equivalent impedances of the AC grid is evaluated. It emulates, for instance, the connection/disconnection of a significant group of wind turbines (and their corresponding subterranean capacitive cables) in the proximity of the Pcc, which is quite typical is some AC grids. From the initial value used for the grid impedances (see Appendix A), C1 is multiplied by factors (1 1.1 1.2 1.3 1.4), while the active resistance is kept constant at Rv1 = 1.51 kΩ (0.5 Ω at the low voltage side). In Figure 13a,b, it can be seen that C1 affects both 550 Hz and 900 Hz resonances of the AC grid, displacing them to the left as expected. However, since the active resistance remains constant at 550 Hz (note that the harmonics are expected to appear at multiples of 50 Hz), the system can become unstable, since the 550 Hz complex conjugate poles located nearer to the imaginary axes can cross to the positive plane. In fact, for this particular case analyzed, with multiplying factors of 1.3 and 1.4, the real part of the poles becomes unstable.
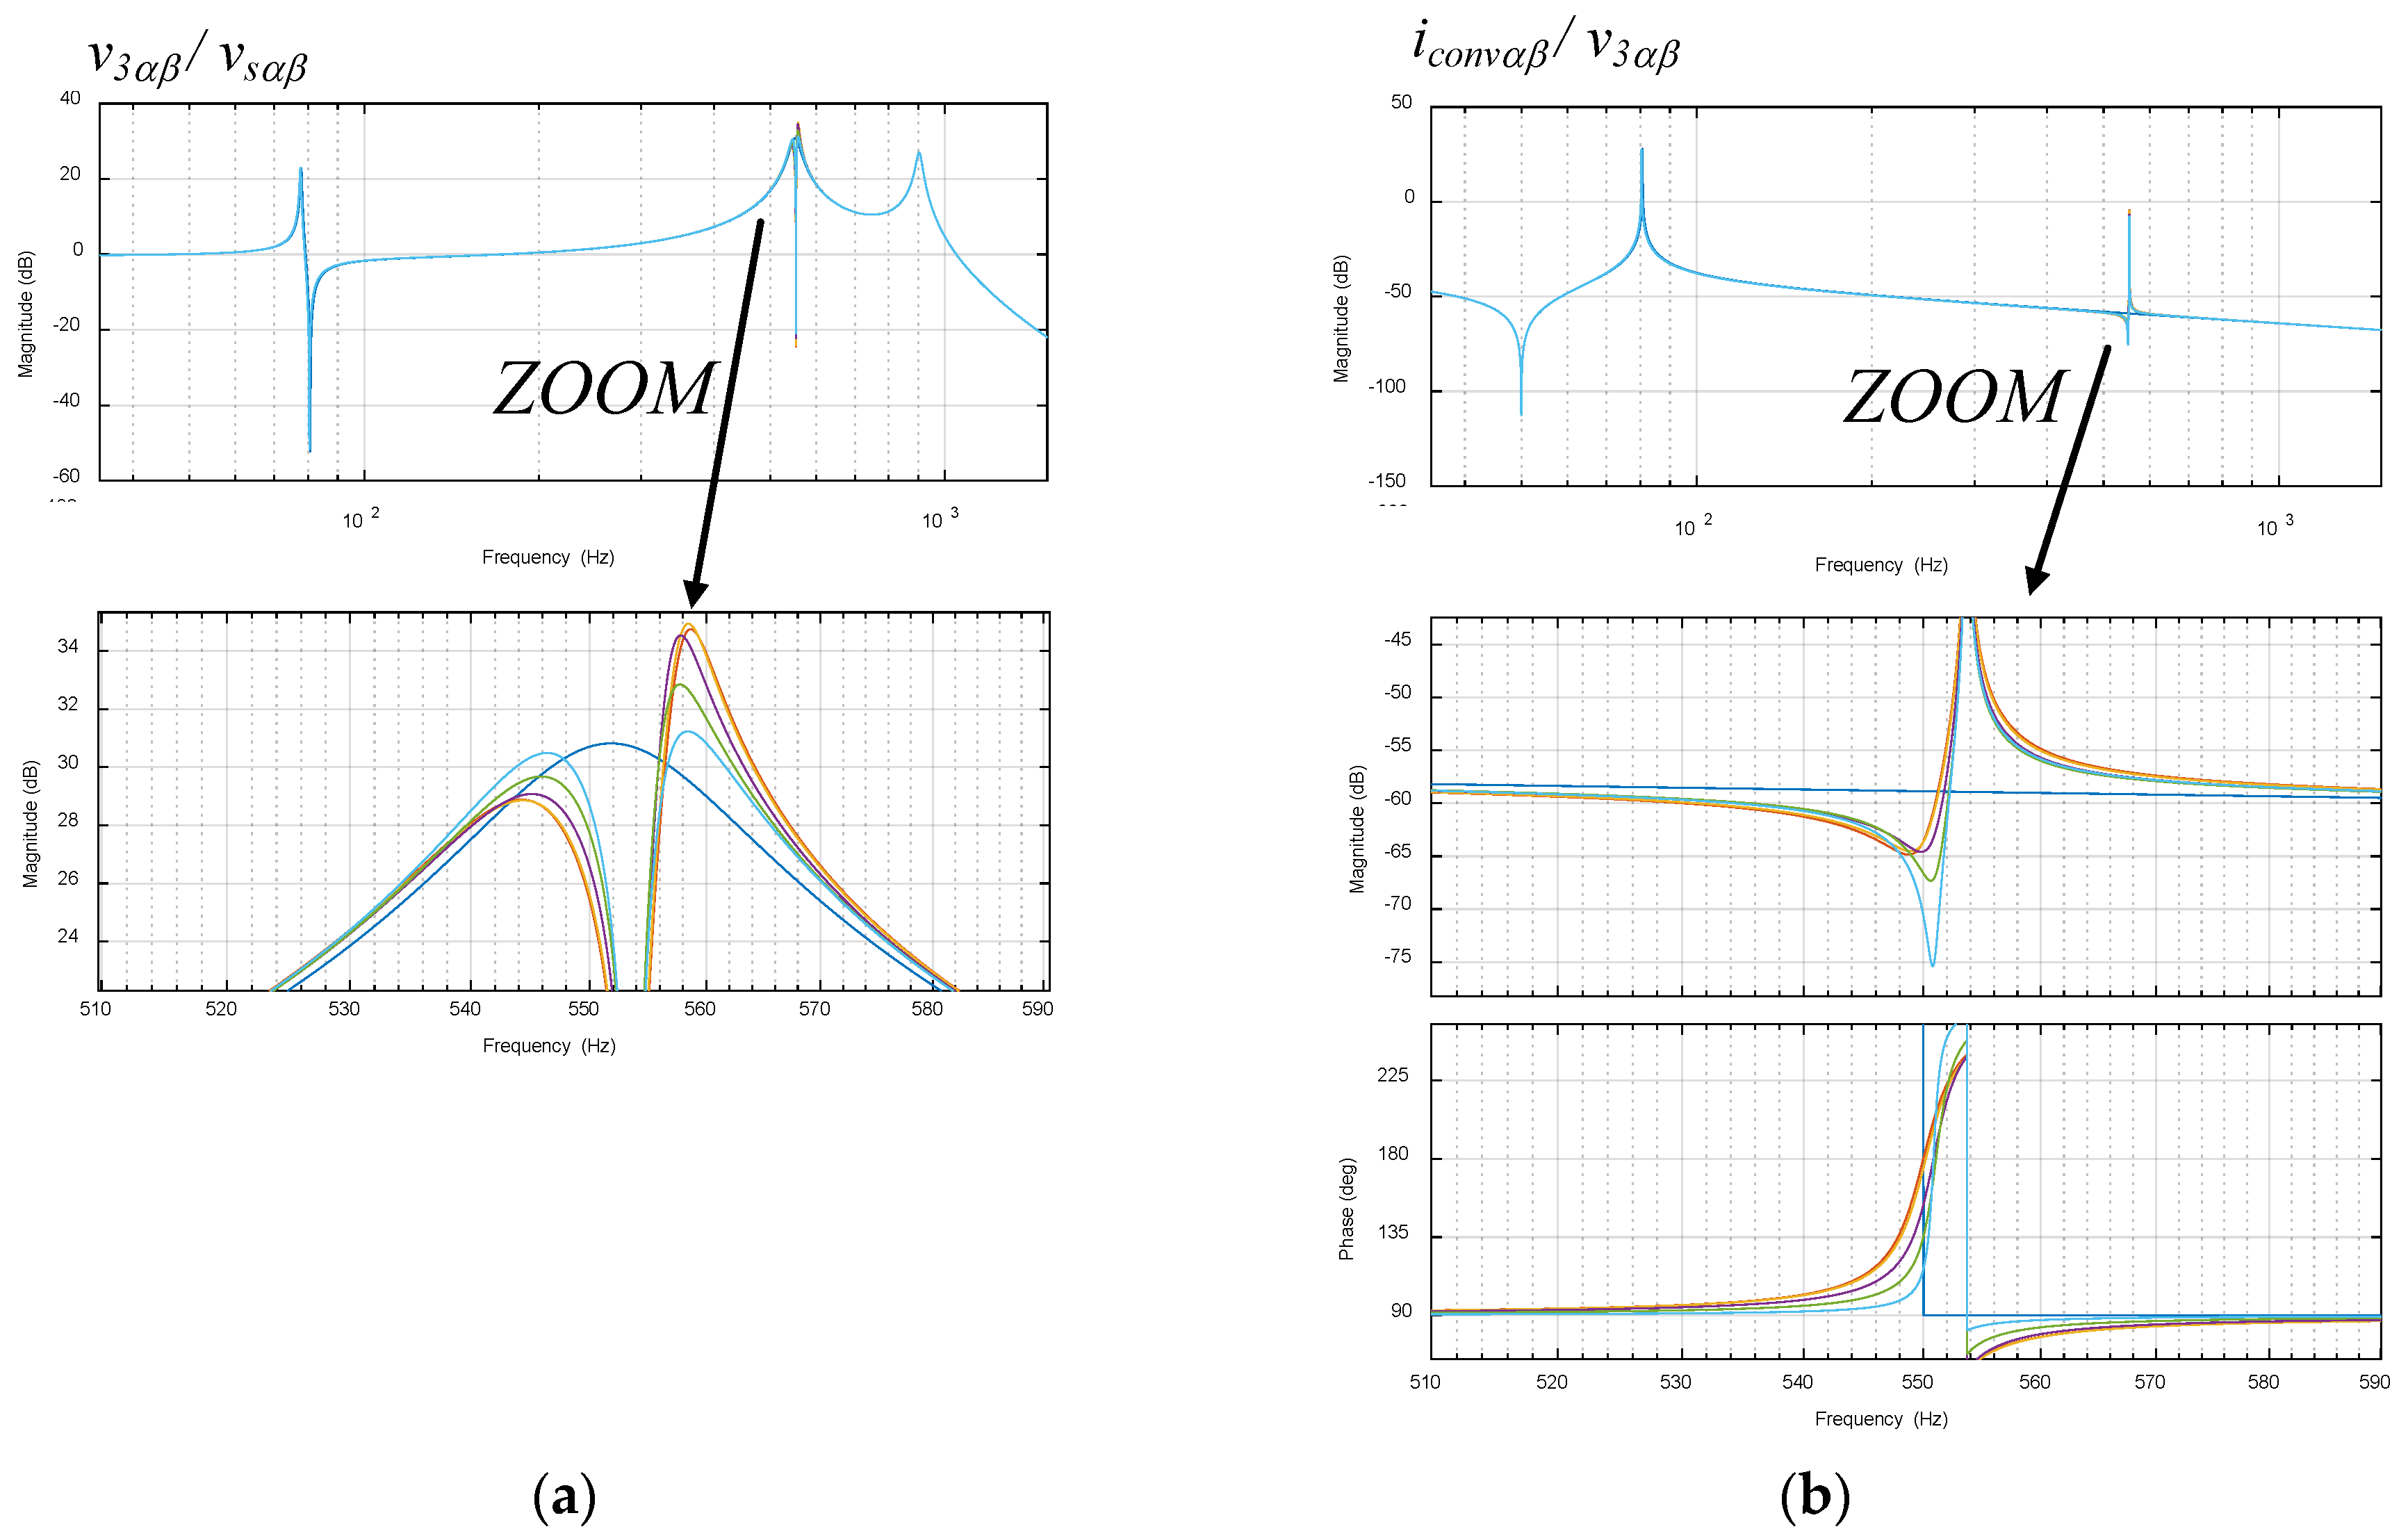
This behavior in practice, in real AC grids, is very important to take into consideration, since the ACISEF should know or identify that the AC grid impedance has been altered in order to avoid provoking its disconnection (due to an overcurrent or overvoltage) and the subsequent contingence at the AC grid and the ACISEF itself. Thus, in this article only a general or conceptual possible solution to this challenge is provided. However, one more analysis has to be made first. As is presented in Figure 14a,b, the system was initially unstable with the AC impedance change of C1·1.4 and the initial active resistance of: Rv1 = 1.51 kΩ (0.5 Ω at the low voltage side). However, by increasing the active resistance (only multiplying by 1.5 in this particular case) the system becomes stable again. Therefore, in concordance with the analysis carried out Section 5.2, it is necessary to select the appropriate active resistance (by increasing it) when the AC grid impedance, thus also the resonance location, is varied.
Thus, the general conceptual idea to solve this challenge in practice can be understood as two tasks or steps to follow: first the detection of an impedance change and second the actuation.
  • The way in which changes in the AC grid impedance can be detected is by verifying whether the correction (attenuation) of the 550 Hz voltage harmonics (that we aim to mitigate) at the Pcc is becoming smaller. Note that in the Bode diagrams in Figure 13b, a significant amplitude decrease can be observed.
  • Then, once the impedance decrease has been detected indirectly, the active resistance should be increased in order to guarantee the stability of the ACISEF.
A high-order level routine of continuously supervising and actuating, if necessary, according to this idea should be included to determine the active resistance actual value. It can be noted that that the idea is very similar to ‘perturb and observe algorithms’ or ‘anti-islanding detecting algorithms’ applied in photovoltaic converters [23].

5.5. Combination of Active Resistances and Inductances

In this analysis, we sought an answer to the following question: what is more effective for harmonic mitigation—active resistances or a combination of active impedances? Thus, again using the global analytical model, the effect and effectiveness of combinations of different natures of active impedances can be quickly evaluated. We started by simply modifying the control Equation (1) of the ACISEF and adding an active inductance Lv1, as follows:
( i c o n v α β 50 H z * i c o n v α β ) F D ( s ) + ( v 3 α β R v 1 + s L v 1 i c o n v α β ) F 1 D ( s ) = v 3 α β + ( R c o n v + s L c o n v ) i c o n v α β
Then, the entire global model must be calculated according to the procedure explained in previous section. Note that this is easy to do using a computer-based program. Therefore, in Figure 15a,b, Bode diagrams of the voltage at the Pcc and the admittance of the ACISEF with different active Rv1-Lv1 values programmed at 550 Hz are shown (Rv1 = 0.75 kΩ is kept constant and Lv1 = 218.8 mH is multiplied by factors (0 0.1 0.5 1 2)). It can be seen that the red graph (Lv1 = 0) produces the maximum attenuation at 550 Hz of v3αβ(s)/vsαβ(s). In fact, after conducting several calculations, no better attenuation of the resonance was detected due to the inclusion of the active inductance.
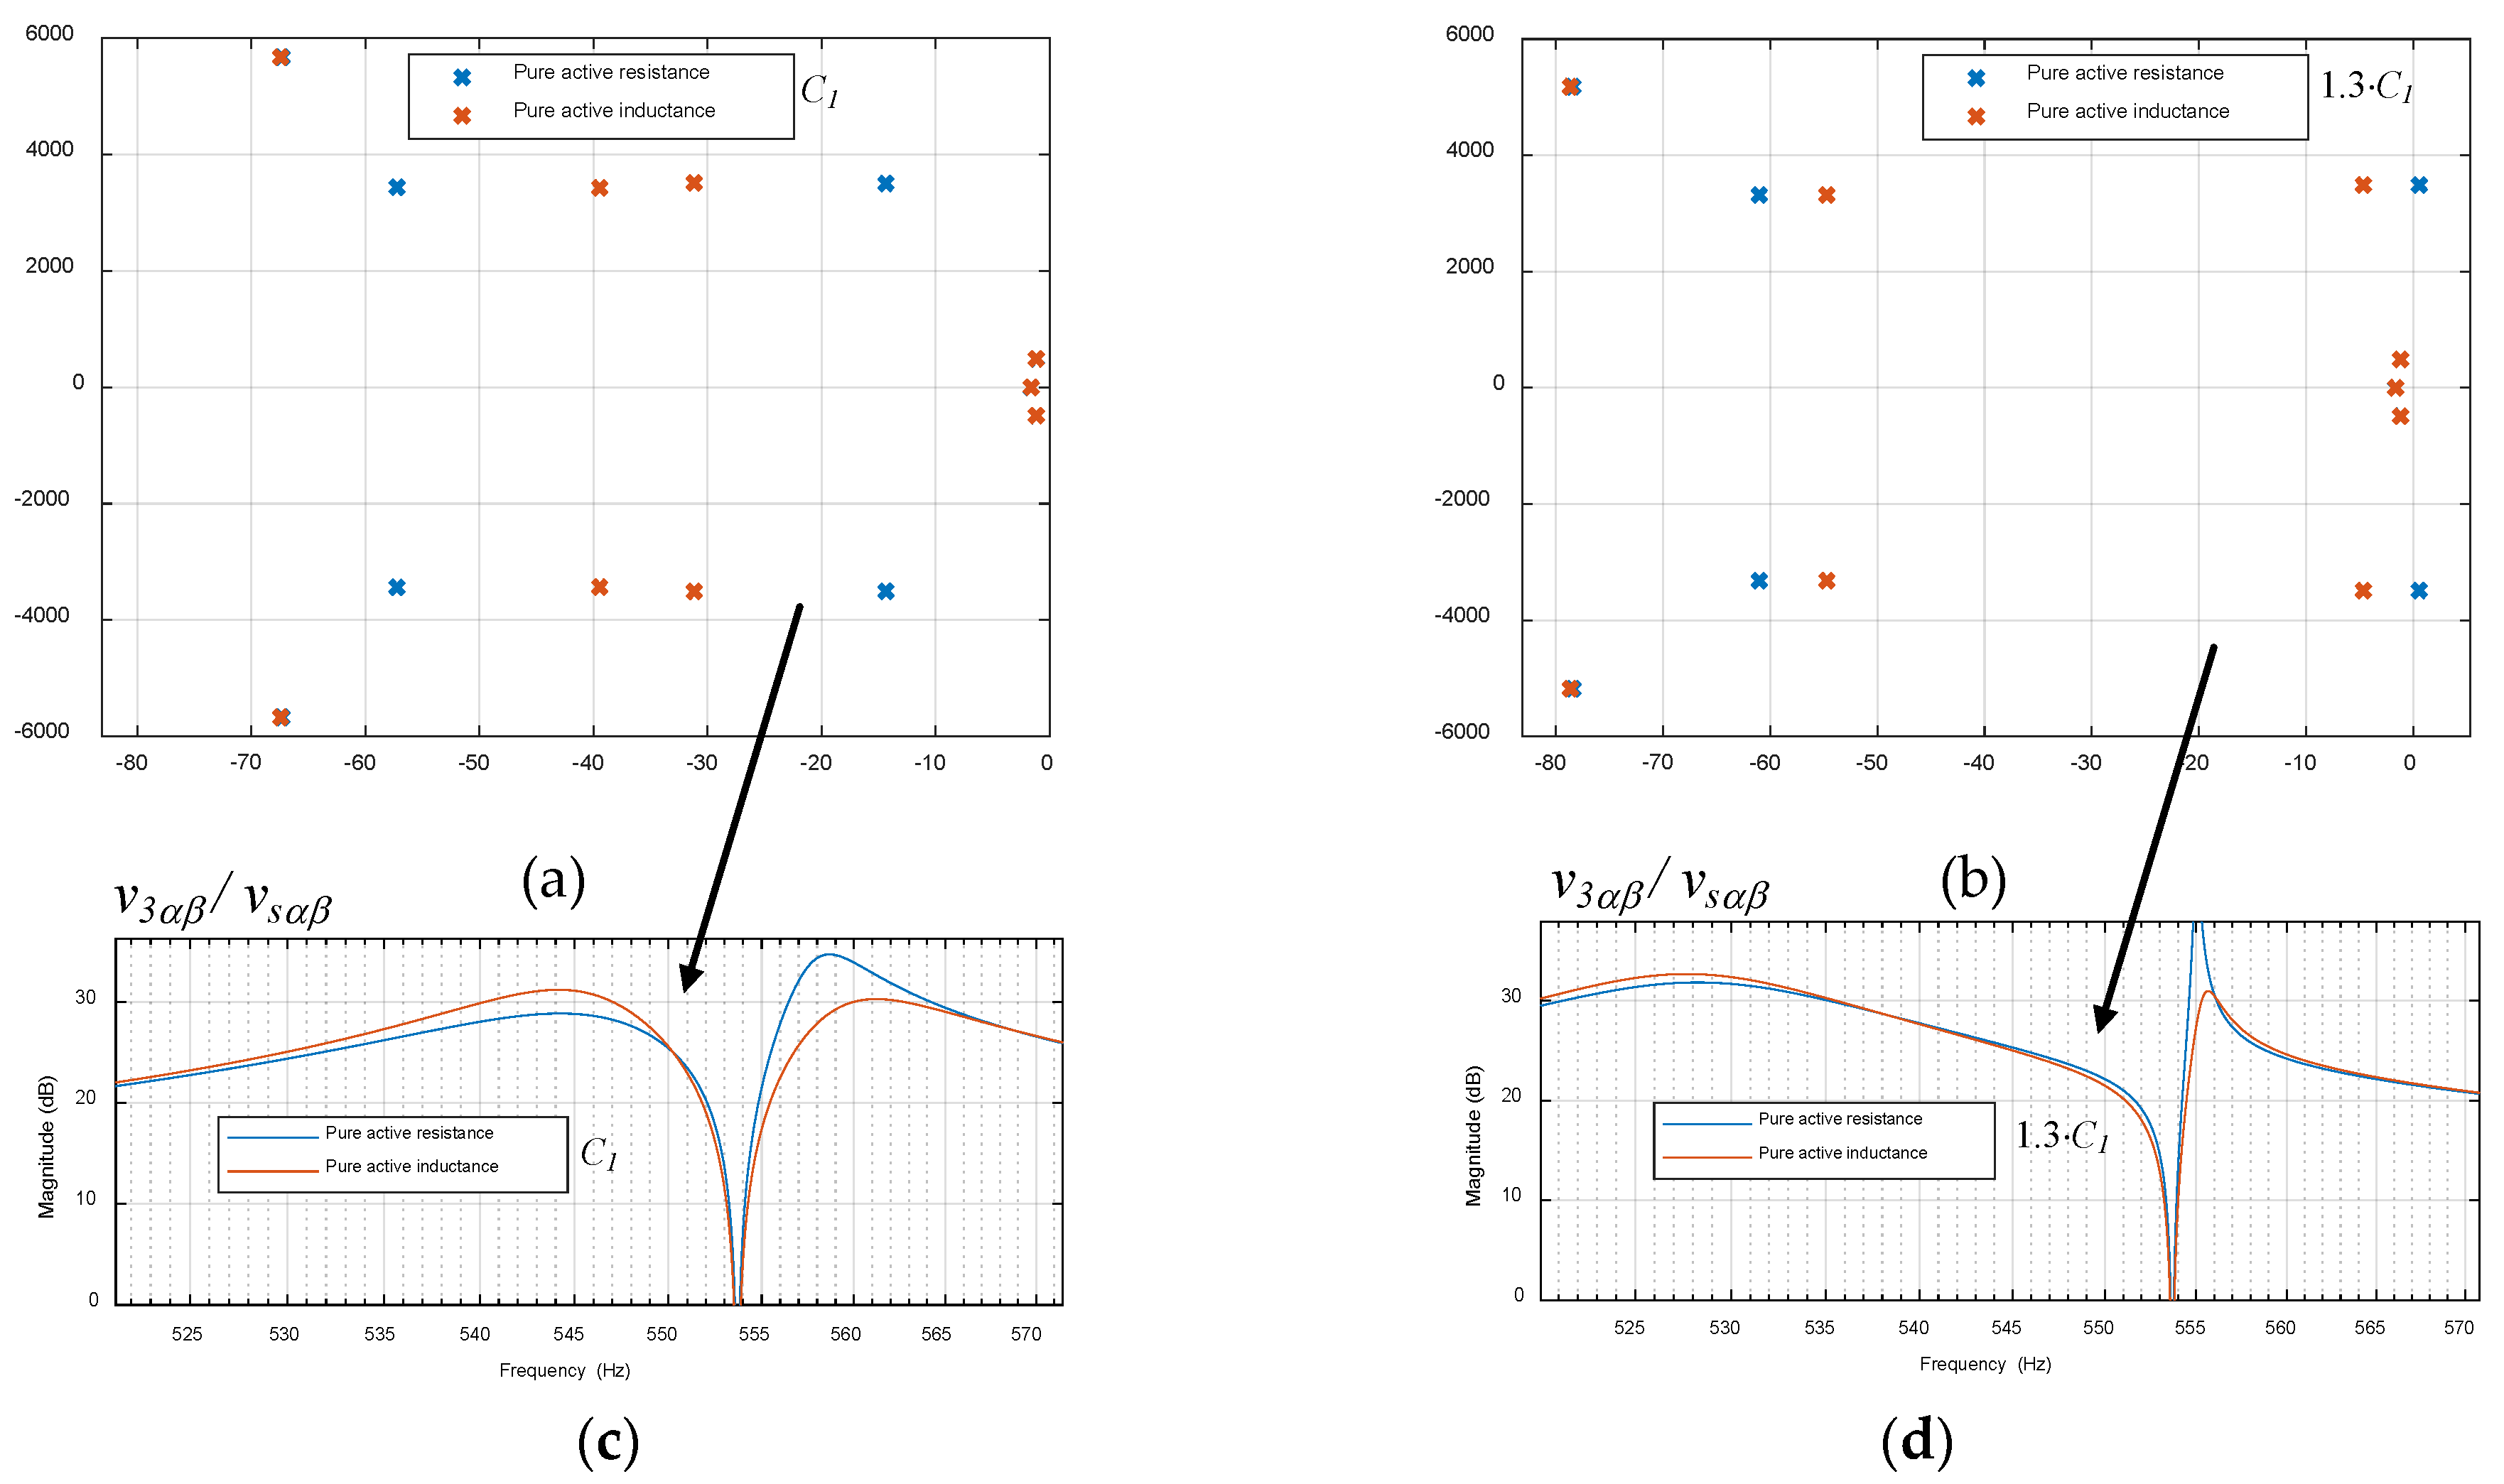
However, when a variation at the AC impedance occurs, for instance 1.3·C1, as in one of the examples from the previous sections, it was found that using a pure active negative inductance rather than a pure active resistance can provide more robustness to the system. This is a very interesting fact. Thus, as seen in Figure 16, when the impedance of the AC grid does not change but rather remains as expected, an active pure resistance or inductance of the same value (1.512 kΩ in both cases at 550 Hz) produces equal attenuation of the 550 Hz harmonic at the voltage at the Pcc. However, when the AC grid impedance changes (by, for example, a 30% increase in C1), while the pure active resistance does not guarantee stability, the pure active inductance ensures stability (poles with negative real parts). The active inductance also introduces a non-dominant pole with a high negative real part (not shown in Figure 16a,c for simplicity), but still presents good harmonic attenuation. Thus, with this particular and simple example, we seek to illustrate how in some AC grid scenarios, the combination of active resistances and active inductances can lead to a more robust global performance in reaction to uncertainties or variations of the AC grid impedances. Hence, with different AC grid scenarios with different natures of impedances, the combination of active resistances, inductances, or even capacitances could provide effective solutions. As such, we here emphasize that the analytical global model can be a suitable general tool to analyze these types of questions in an easy and quick way.

5.6. Effect of Delays in Control

In this analysis, the effect produced by the delays in the control is analyzed. In general, there are two main sources of delays that should be compensated: one is related to the current and voltage measurements and the other is the delay in the synthesis of the voltage by the VSC. These two delays can be included at the model Equation (1) of the ACISEF as follows:
( i c o n v α β 50 H z * i c o n v α β M ( s ) ) F D ( s ) + ( v 3 α β M ( s ) R v 1 i c o n v α β M ( s ) ) F 1 D ( s ) = v 3 α β + ( R c o n v + s L c o n v ) i c o n v α β
where M(s) is the delay at the measurements in voltages and currents (sensor phase shift, low pass filter introduction, digitalization, and phenomena that can be equivalently modeled), while D(s), as mentioned before, is the delay in the synthesis of the actual output voltage by the VSC. Commonly, it is good practice to use compensation techniques for these delays in order to mitigate their negative effects on the control performance. Some of the compensation or mitigation methods that can be applied are described in [25]. However, in this analysis, we seek to show how important it is to compensate as much as possible for these delays to guarantee the stability of the system. As a simple and illustrative example, suppose that the D(s) delay are perfectly compensated (not affecting the system), but the delays at the measurements are not fully compensated. Therefore, simple modeling transfer functions are adopted:
M ( s ) = 1 τ s + 1        D ( s ) = 1
where τ is the delay at the measurements that our system presents (supposing that both current and voltage measurements present equal delays). Thus, by substituting the previous two equations from the analytical global model (if the effect of a delayed voltage synthesis is to be analyzed, this pure delay can be modeled by an appropriate order of Padé approximation [24]), the effect of the delay on the performance of the system can be analyzed. In Figure 17a,b, it can be seen that for different magnitudes of τ delay, the attenuation capacity of the ACISEF is not depleted. It is able to obtain the 550 Hz harmonic mitigation unaltered. However, the stability of the system is strongly conditioned, since the delay affects all of the control loops and therefore also all of the complex conjugate poles involved with or related to the loop. Thus, as can be seen in Figure 17a, with relatively small delays the system becomes unstable, since the poles that are nearer to the imaginary axis become unstable as they are displaced to the right. It has to be highlighted that a given delay will be more problematic with a higher bandwidth of the current loops (higher ki and ki1 gains) as well as with lower active resistances. This means that the instability arises from a combination of different control parameters: delay, current loops’ bandwidths, and active resistance choice, together with the AC grid impedance itself. Again, we here emphasize that the analytical global model can be an easy tool that gives a wide perspective to analyze a multi-phenomenon complex issue.

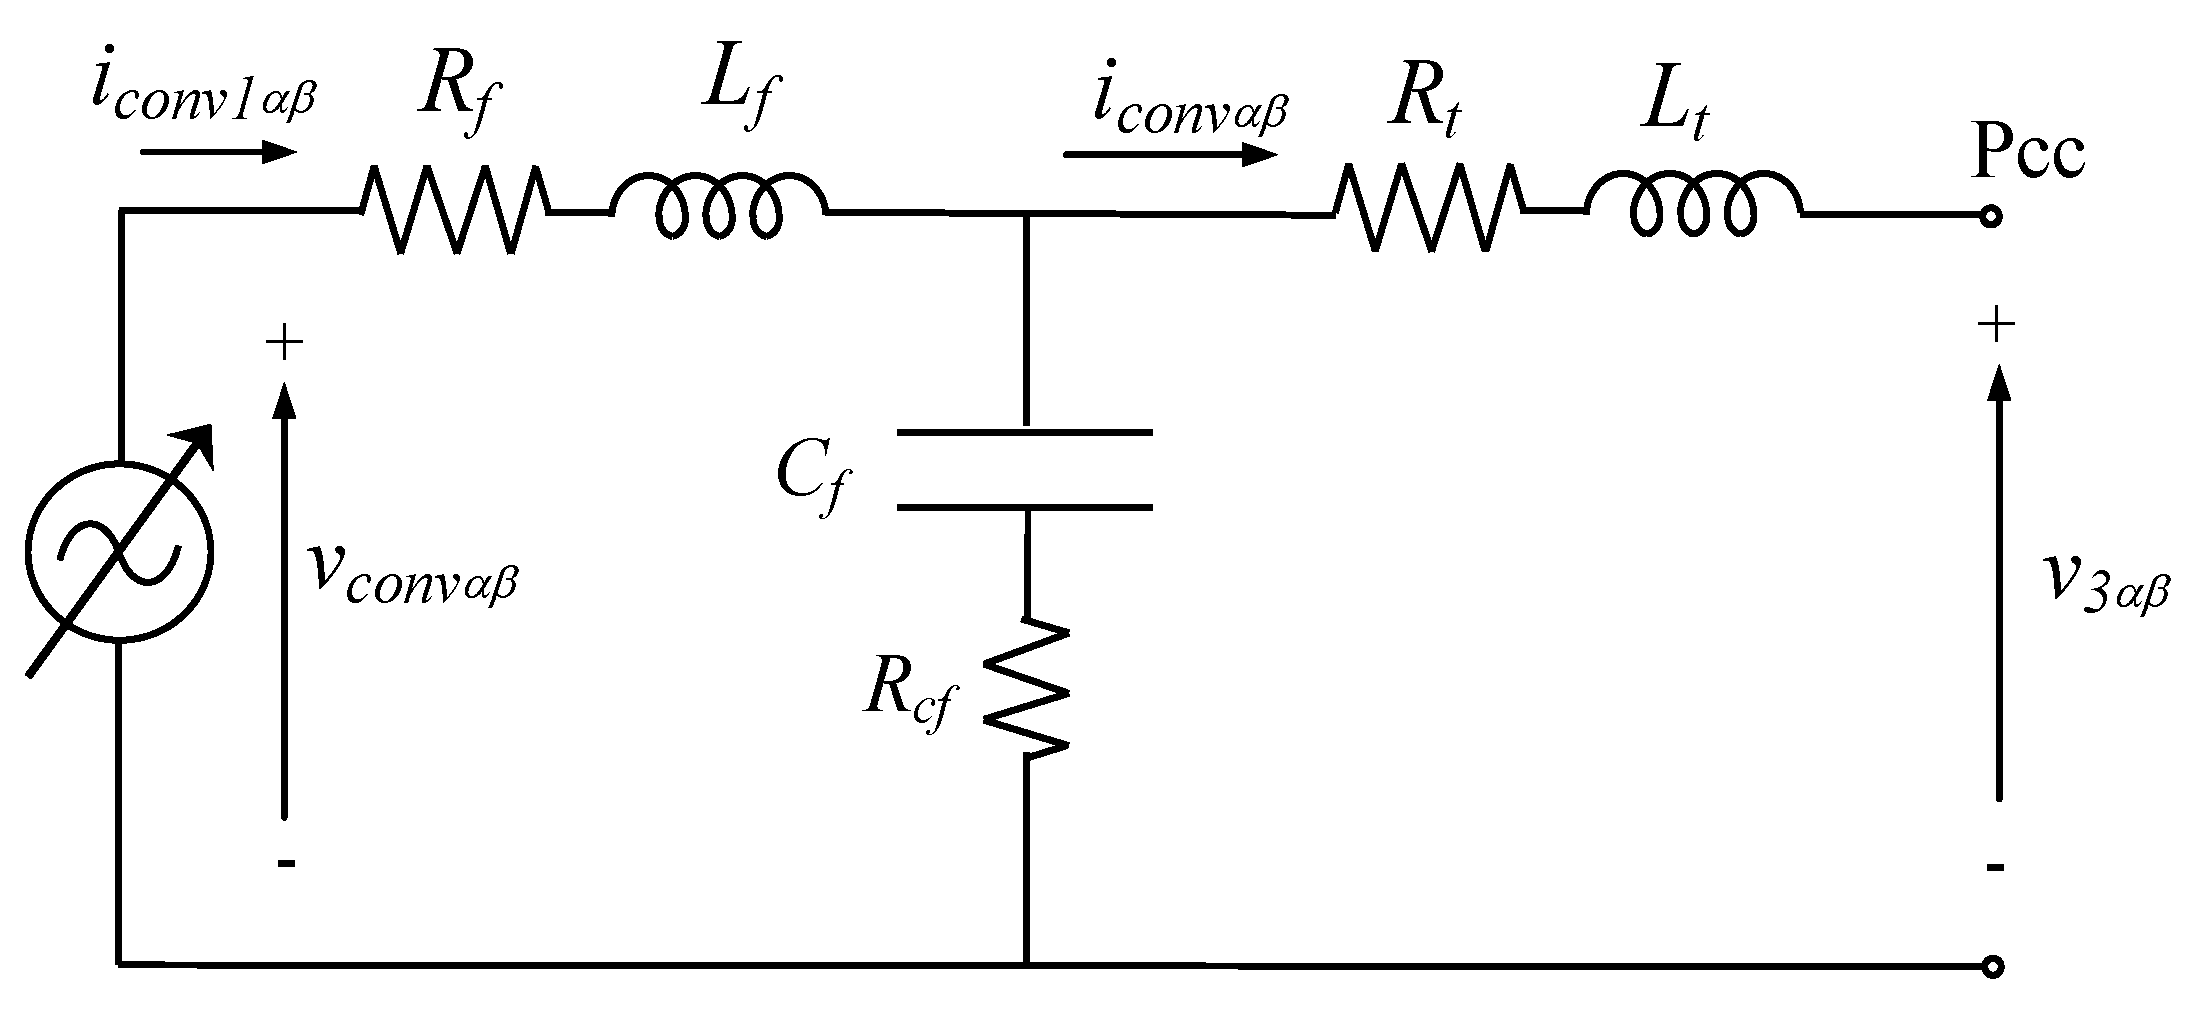
5.7. Analysis of an ACISEF with an LC Output Filter

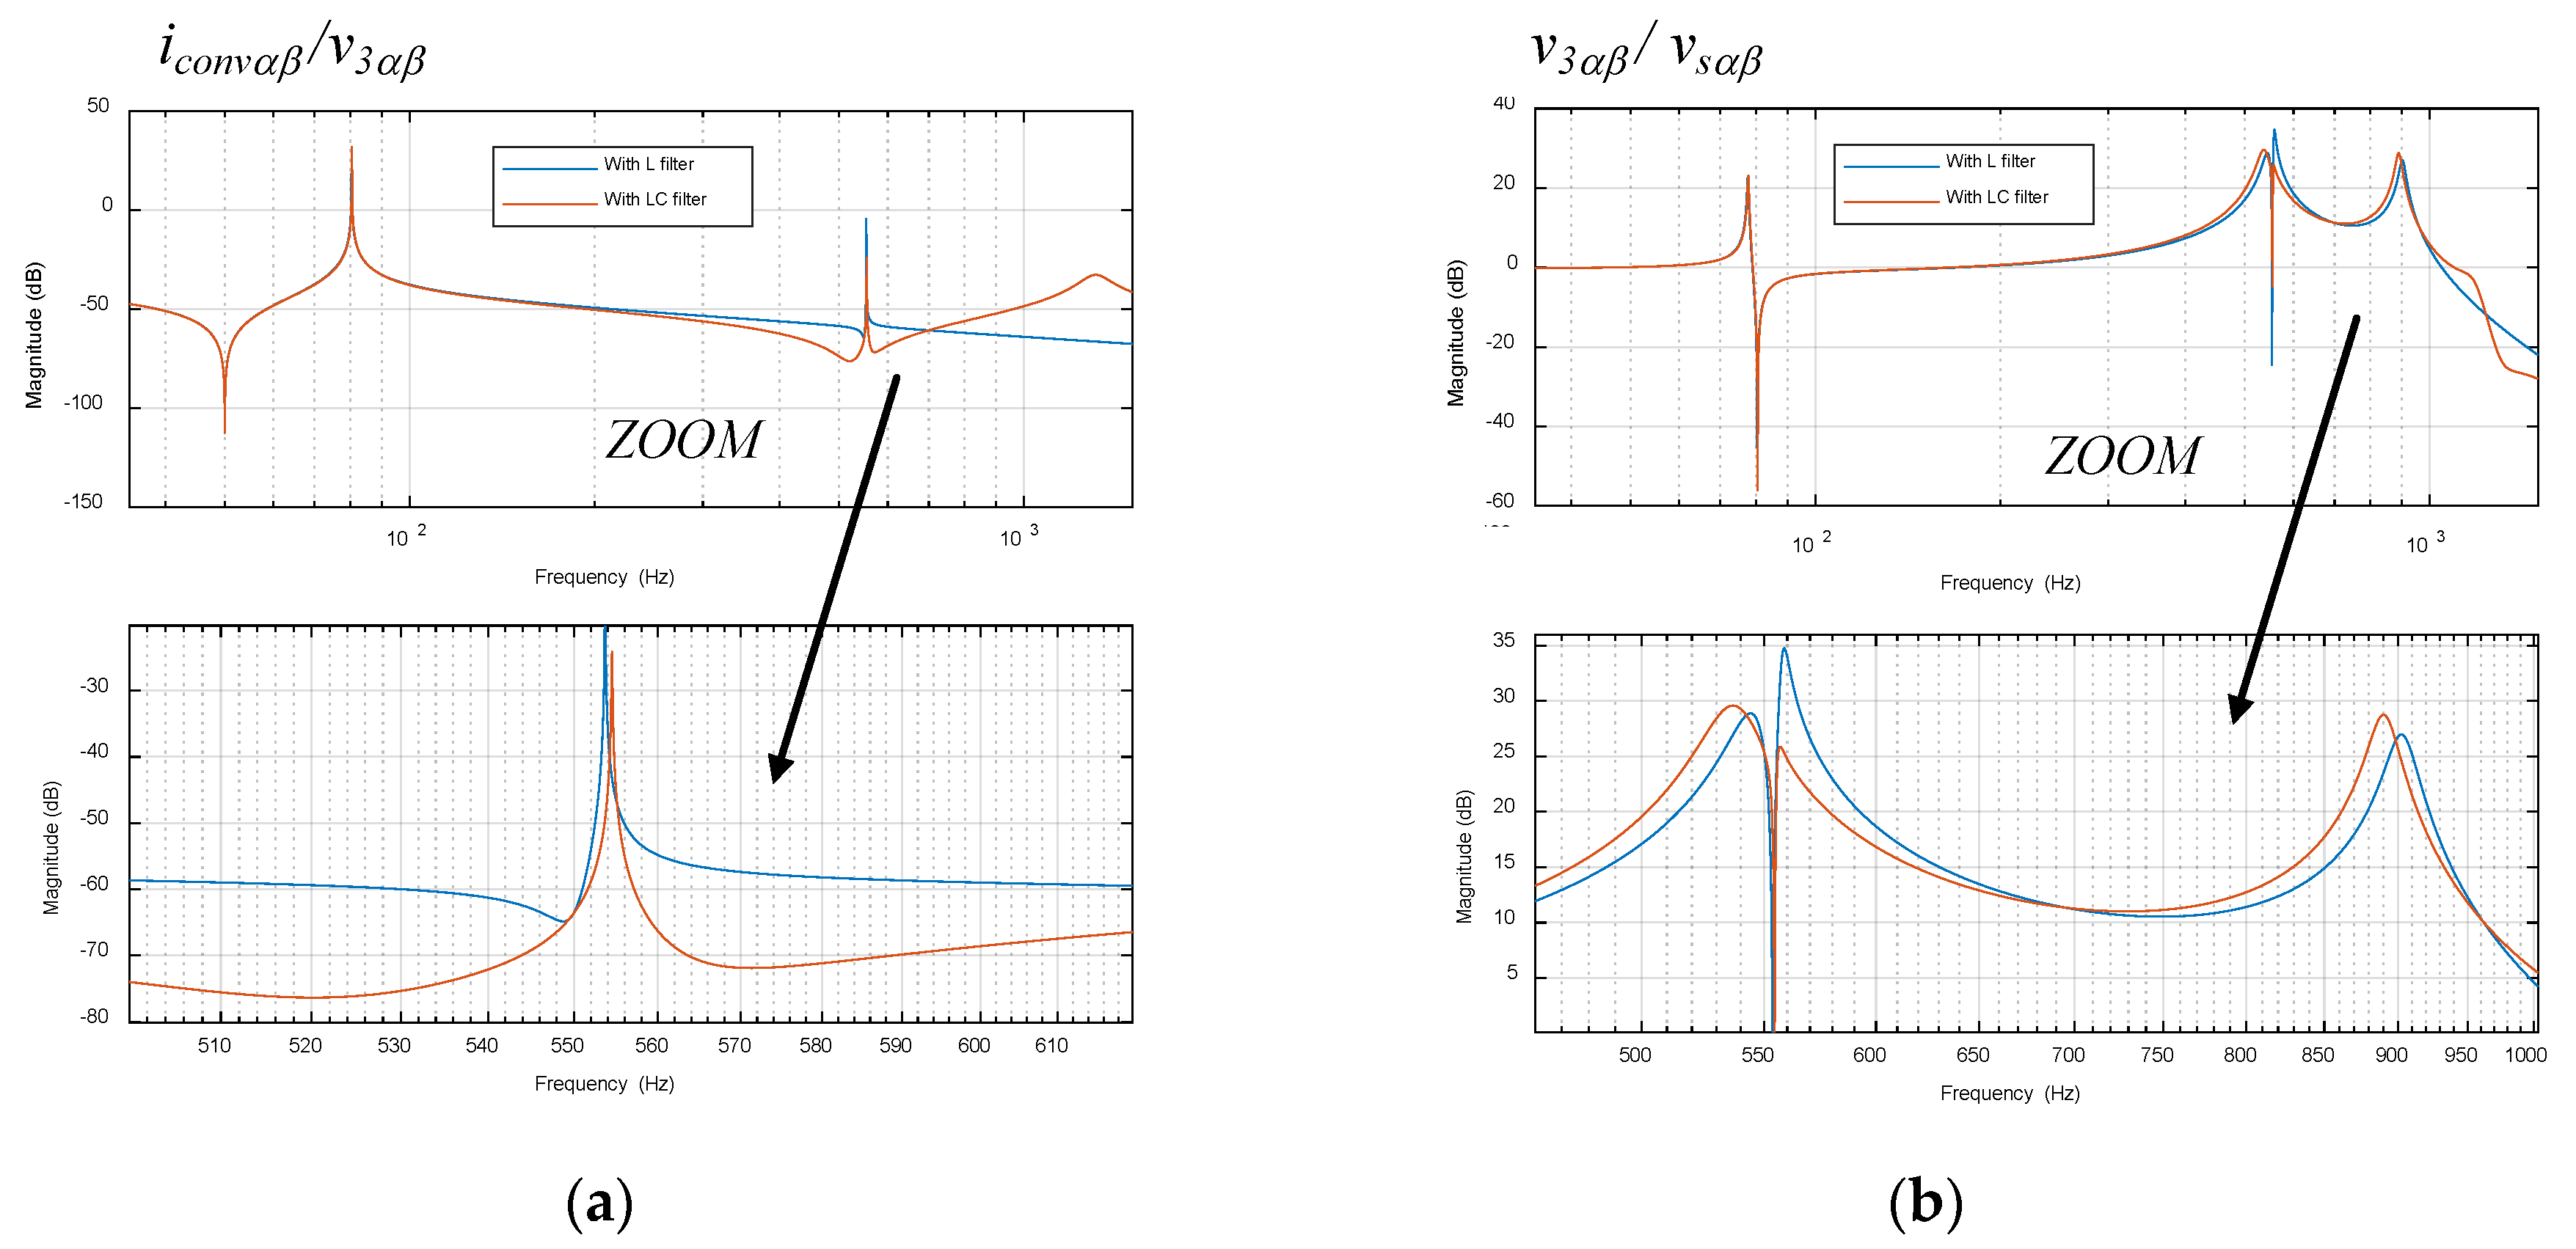
Finally, this section shows how the ACISEF is still effective with an output LC filter (providing better attenuation of the switching harmonics) and how the analytical global model can analyze it. Hence, if the output filter at the converter side is modified to an LC filter, as represented in Figure 18, the analytical model equations must be slightly modified. Note that Rt and Lt are the equivalent transformer’s impedances. For this particular illustrative example, the following numerical choices are made (high voltage side values): Rt = Rconv·(1/3), Lt = Lconv·(1/3), Rf = Rconv·(2/3), Lf = Lconv·(2/3), Rcf = 10 mΩ·(n_transformer)2, Cf = 1250 µF/(n_transformer)2.
In this way, the converter equivalent electric equation yields with the inclusion of the new elements:
v c o n v α β = B ( s ) v 3 α β + A ( s ) i c o n v α β
Being:
A ( s ) = ( R f + s L f ) ( R c f + 1 s C f + R t + s L t ) + ( R t + s L t ) ( R c f + 1 s C f ) R c f + 1 s C f
B ( s ) = 1 + R f + s L f R c f + 1 s C f
This means that the input-output matrix expression of the ACISEF is modified as follows (assuming that the delays are compensated):
i c o n v α β = [ C o n v 1 C o n v 2 ] [ i c o n v α β 50 Hz * v 3 α β ]
With:
C o n v 1 = F F + F 1 + A
C o n v 2 = F 1 / R v 1 B F + F 1 + A
As can be noted, since the matrix structure remains equivalent, is easy to substitute the new ACISEF expression into the global analytical model (Equation (21)). Consequently, substituting numerical values into the new LC filter and including it in the AC grid used in the previous analyses, it can be observed in Figure 19 that the effectiveness of the ACISEF in mitigating low-order voltage harmonics at the grid is maintained. With an active resistance of 1.5 kΩ (at the high voltage side) programmed at 550 Hz in both cases, it can be seen that the 550 Hz harmonic voltage attenuation is ensured with an L and LC output filter. Note that the capacitance Cf of the output filter slightly modifies the resonances of the entire global system, but it is not possible to introduce a third resonance to the system since it is small compared to the AC grid’s capacitances C1 and C2. It has to be highlighted that in this case the LC filter was tuned to present the resonance at approximately 1350 Hz, as can be seen in Figure 19a. Note that an active damping resistance could be also incorporated at this frequency of 1350 Hz (by adding an active resistance loop at 1350 Hz), with the same philosophy as that followed in this article, in order to reduce the damping passive resistance Rcf as much as possible and therefore reduce the power losses of the filter. The conceptual functionality of this ‘active’ or ‘damping’ resistance could be understood to damp the LC filter resonance, rather than the harmonic voltage mitigation of the AC grid [5]. However, the way in which it is implemented would be equivalent. Nevertheless, this analysis is beyond the scope of this section. Moreover, that is beyond the scope of this article to analyze and conclude whether an L filter would bring more benefits than an LC filter for this application. However, although the LC filter would bring some advantages, such as a reduction in the output current switching ripple, the losses of the filter may be increased (thus requiring an additional cooling system) since all output current and voltage harmonics tend to go through the Cf and Rcf.

6. Extension to a Grid with more Signified Branches

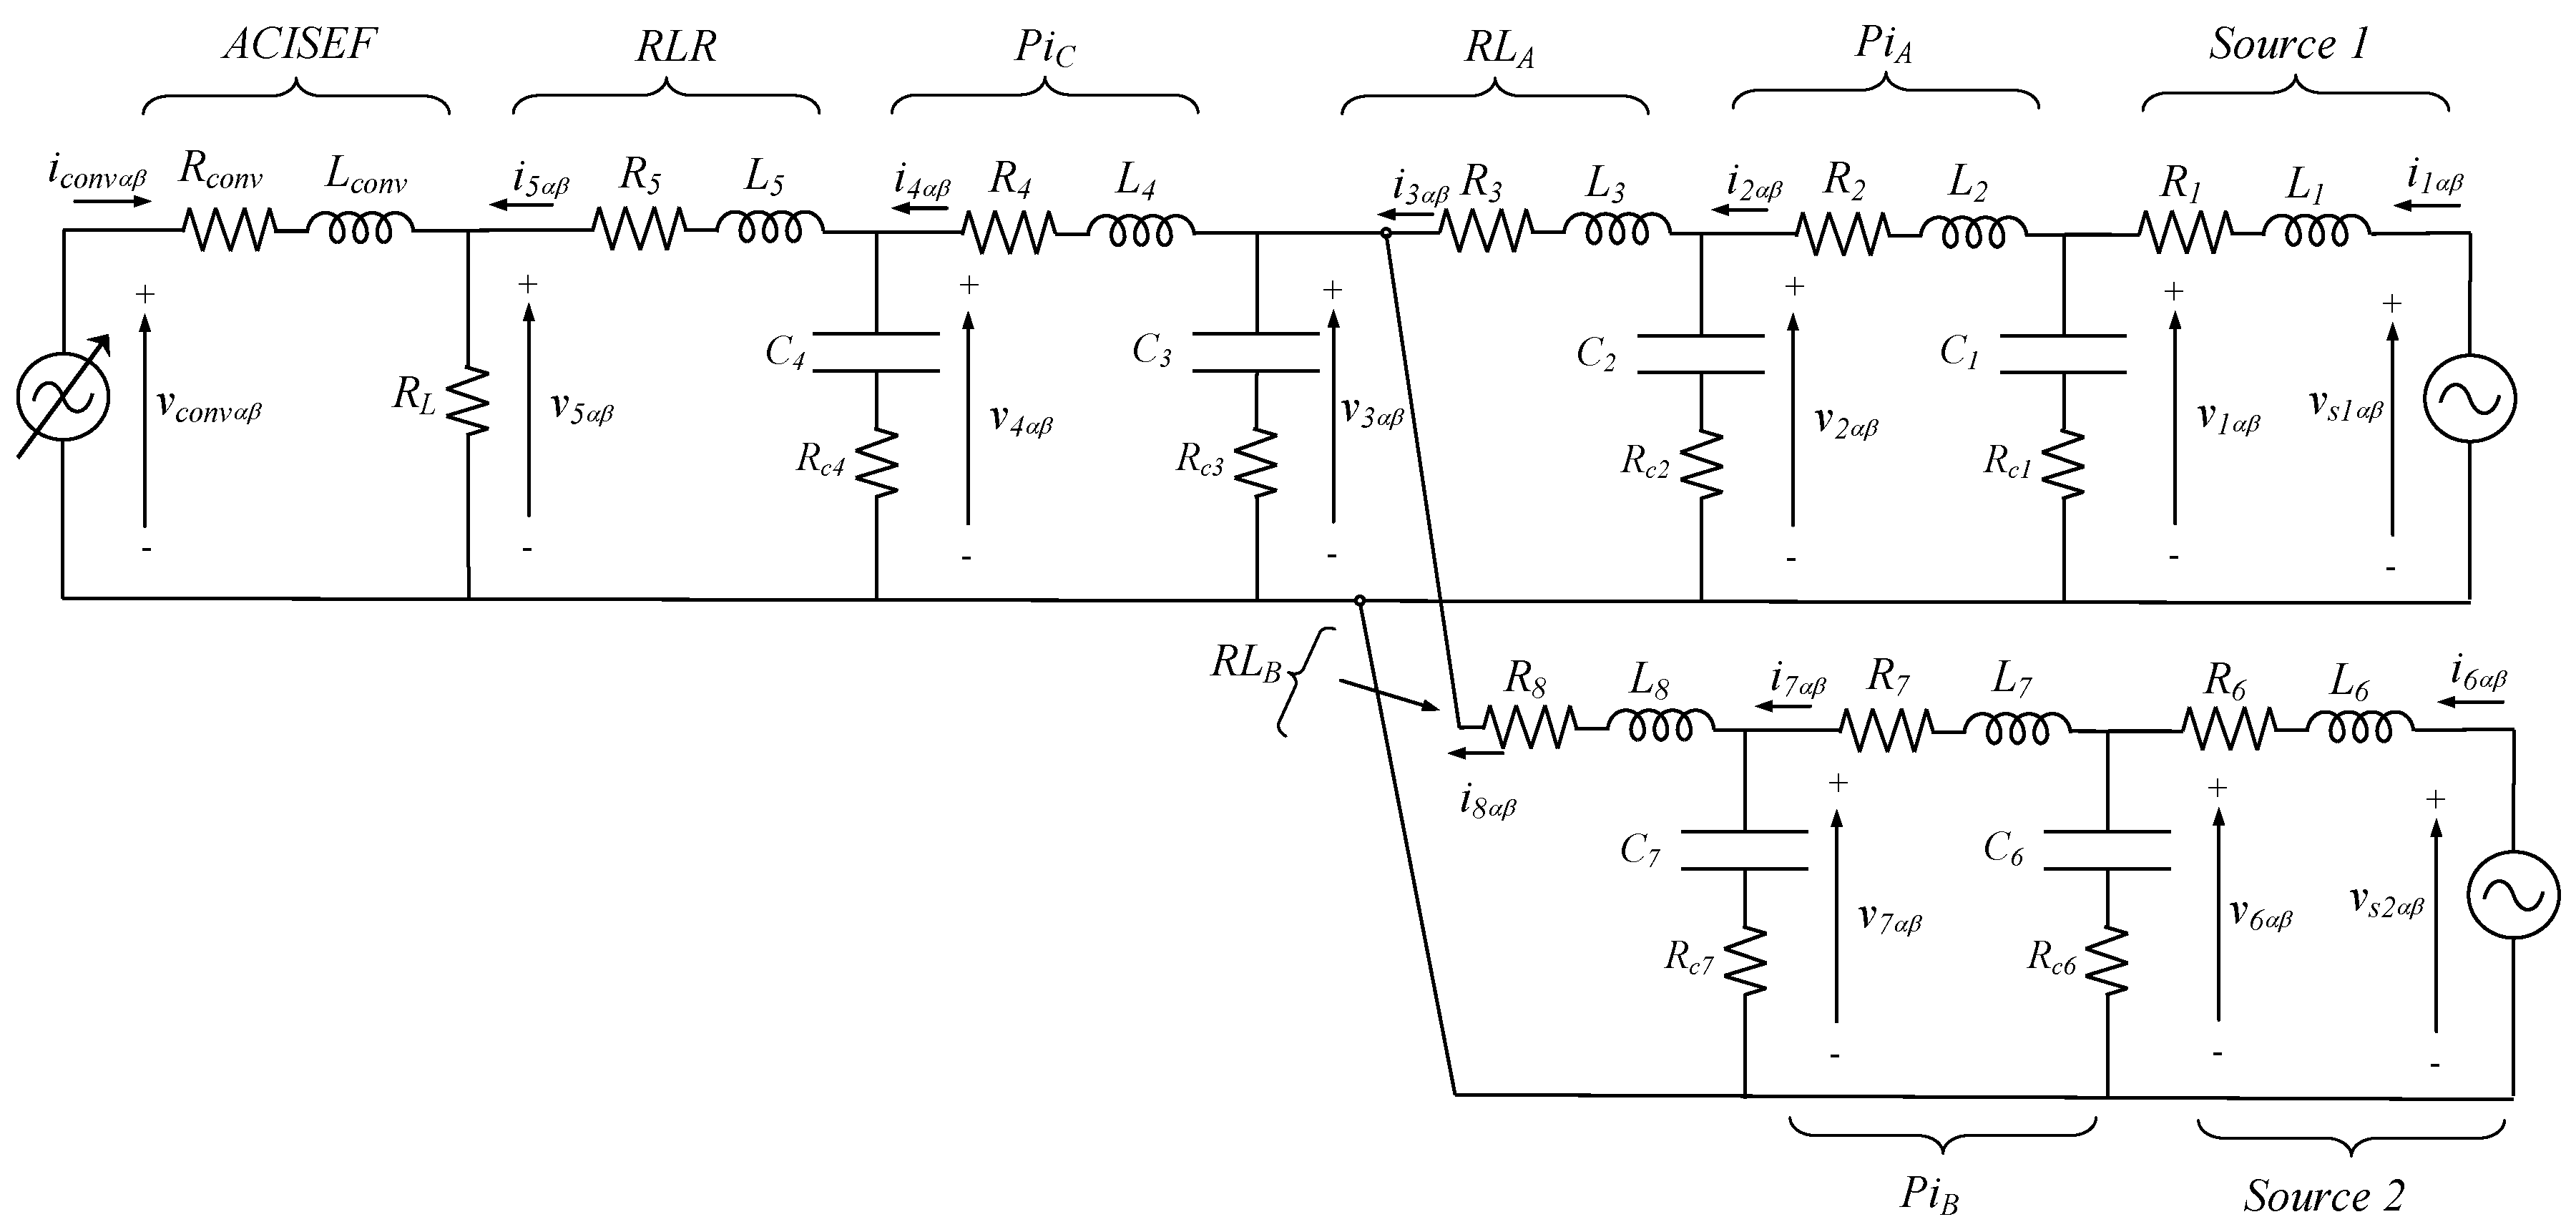
This last section only goes one step ahead in the line of analysis presented in this article. It shortly introduces, but not deeply analyzes, how the analytical global model can be structured for AC grids in which it is necessary to contemplate more branches. Thus, Figure 20 shows an example of a more complex AC grid that allows the study of greater detail, illustrating an example of certain AC grids for which more information is available. It could represent, for instance, a simplified version of the connection of two nearby wind parks, two main sub-grids of a unique wind park, or even a wind park with an inner grid modeled in detail, including as many branches as wind turbines.
Hence, the following set of equations shows how the global analytical model can be derived from the connection of the individual basic models. Sources:
i 1 α β = [ S o u r c e 1 A S o u r c e 2 A ] [ v s 1 α β v 1 α β ] ,   i 6 α β = [ S o u r c e 1 B S o u r c e 2 B ] [ v s 2 α β v 6 α β ]
Pi circuits:
[ i 2 α β v 1 α β v 2 α β ] = [ P i 11 A P i 12 A P i 21 A P i 22 A P i 31 A P i 32 A ] [ i 1 α β i 3 α β ] ,   [ i 4 α β v 3 α β v 4 α β ] = [ P i 11 C P i 12 C P i 21 C P i 22 C P i 31 C P i 32 C ] [ i 3 α β + i 8 α β i 5 α β ] , [ i 7 α β v 6 α β v 7 α β ] = [ P i 11 B P i 12 B P i 21 B P i 22 B P i 31 B P i 32 B ] [ i 6 α β i 8 α β ]
RLR and ACISEF:
[ v 5 α β i 5 α β ] = [ R L R 11 R L R 12 R L R 21 R L R 22 ] [ v 4 α β i c o n v α β ] ,   i c o n v α β = [ C o n v 1 C o n v 2 ] [ i c o n v α β 50 H z * v 5 α β ]
RL circuits (not used in previous sections):
i 3 α β = [ R L 1 A R L 2 A ] [ v 2 α β v 3 α β ] ,   i 8 α β = [ R L 1 B R L 2 B ] [ v 7 α β v 3 α β ]
Being for this particular case:
R L 1 A = 1 R 3 + s L 3 ,   R L 2 A = 1 R 3 + s L 3 ,   R L 1 B = 1 R 8 + s L 8 ,   R L 2 B = 1 R 8 + s L 8
The rest of the matrices shown here should be treated accordingly, with their corresponding impedances substituted into the basic matrix pattern presented in Section 4. Therefore, with all of these individual model matrices and using for instance the ‘connect’ function from Matlab (or any other numeric or symbolic commercial software), the final global analytical model can be obtained:
[ v 1 α β . . v 7 α β i 1 α β . . i 8 α β i c o n v α β ] = [ M G A M ( s ) ] [ i c o n v α β 50 Hz * v s 1 α β v s 2 α β ]
Therefore, in this way, it is possible to follow an analysis procedure equivalent to that in the previous section to deeply analyze the characteristics and behaviors of any other AC grid for which information is available. Note also that, for instance, source 2 could be substituted by a second ACISEF located in a different point on the grid, and interaction between both active elements could also be studied. However, in this article this is left as an open study.

7. Validation of the Proposed Analytical Model and ACISEF Effectiveness

7.1. Functionality Validation of the ACISEF Validation in Simulation

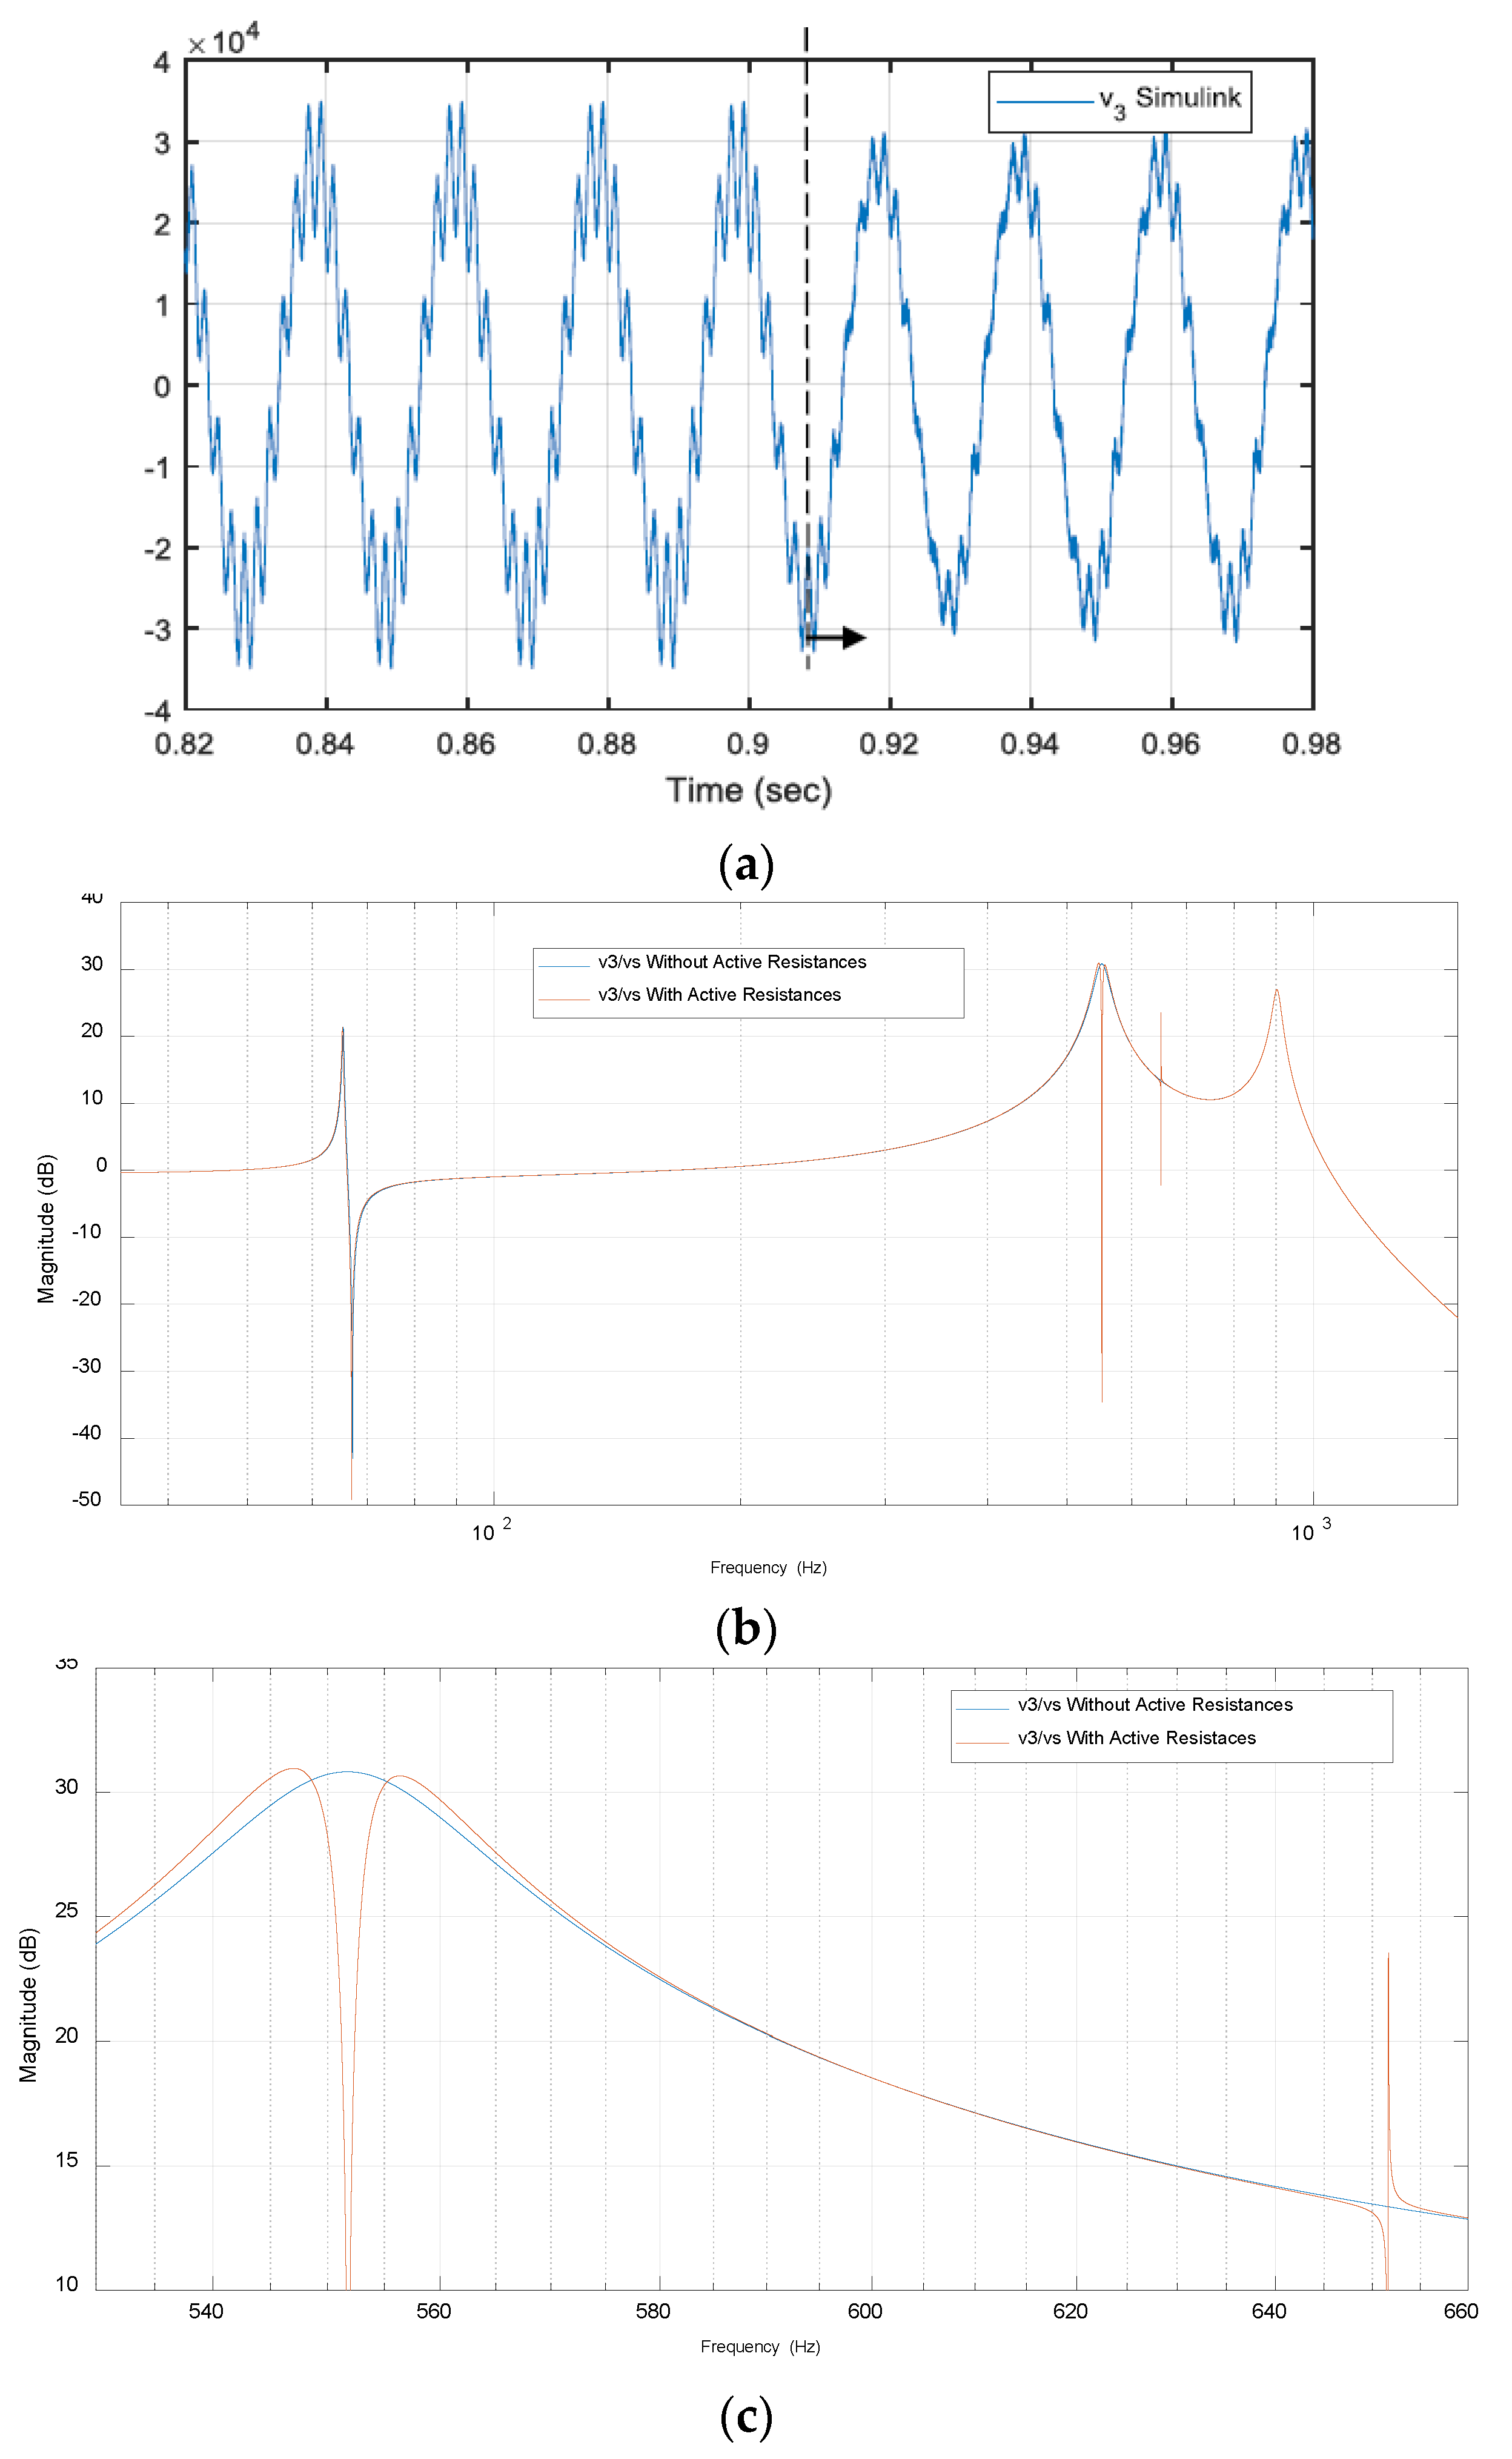
This section shows the effectiveness of the ACISEF concept in mitigating voltage harmonics in an AC grid. For that purpose, the Simulink SimPower System environment is used to implement the AC grid utilized as example throughout this paper, together with the ACISEF model implemented with all of its details (Figure 7): discrete control loops, space vector modulation, delays, and compensation, etc. In order to attain a general example, the converter is programmed to mitigate two harmonics that are present at the AC source (emulating, for instance, the harmonics emitted by polluting loads): the 11th harmonic (550 Hz) and the 13th harmonic (650 Hz). At the source voltage (vsabc), 0.01 p.u. of the amplitude of 11th and 13th voltage harmonics are added (1% of 33 kV of the rated voltage), emulating a residual emission of voltage harmonics of a fictitious special load (such as a thyristor-based rectifier or even a modern voltage source converter, for instance, a group of wind turbines). The active pure resistances programmed are 10 Ω (at the low voltage side) to 550 Hz and 2.5 Ω (at the low voltage side) to 650 Hz. Figure 21 shows how, after enabling the active resistances at second 0.9, the voltage harmonics are significantly reduced as expected. This is in good agreement with the Bode diagrams shown in the figure, where it is possible to see how the effect of the active resistances damps the voltage resonance at v3α for both the 11th and 13th harmonics. It can be remarked that for this specific example, the 11th harmonic causes many more inconveniences than the 13th, due to higher amplitude of the v3αβ/vsαβ transfer function at 550 Hz. In fact, the resonance is almost located at this frequency; therefore, the active resistance value has a different attenuation effect at the 11th and 13th harmonics. Note that in the neighborhood above the frequency of 50 Hz, the ACISEF clearly influences the amplitude of v3α due to the presence of its loops.

7.2. Analytical Model Validation in Simulation

This section demonstrates validates the analytical global model, comprising the AC grid and the ACISEF with its control. In order to achieve that the analytical model described in Section 4, it is compared to the Simulink SimPower System model presented in the previous subsection, in which the whole AC grid together with the ACISEF model is implemented, including discrete control loops, space vector modulation, delays, and compensations.
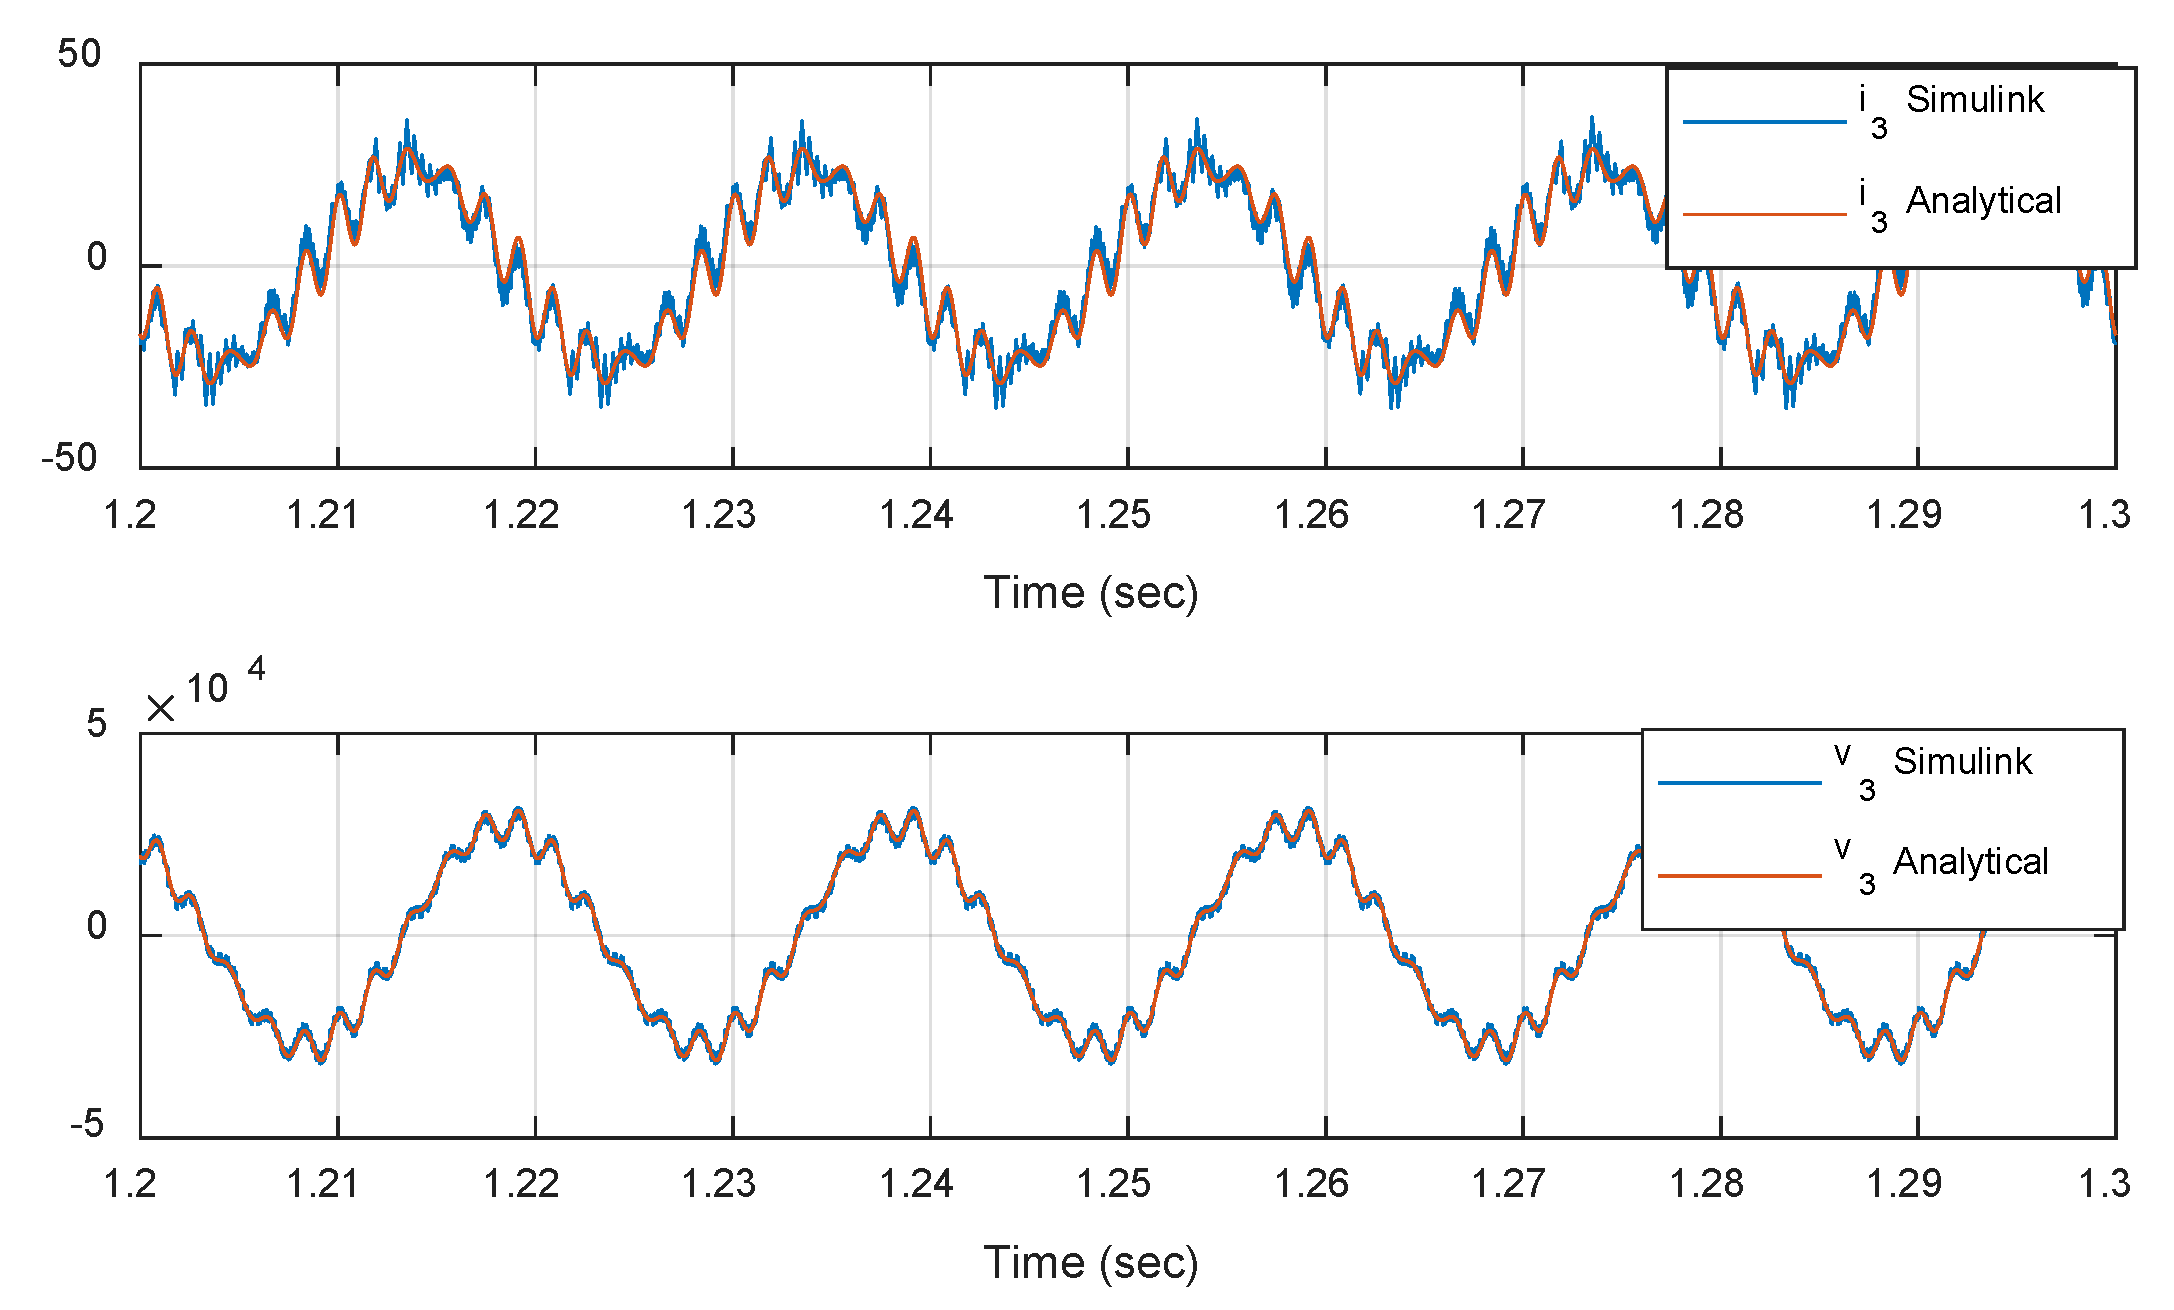
Thus, in Figure 22, two variables of both models are superposed: i3α and v3α. They operate with an active pure resistance of 10 Ω (at the low voltage side) to 550 Hz and an active resistance of 7 Ω (at the low voltage side) to 650 Hz. It can be seen that both variables match significantly well, even knowing the fact that at current i3α an important current ripple appears at the Simulink detailed model, while it does not appear in the analytical model because is not considered. It can be said that this good agreement between both models is also corroborated in the rest of the variables of the system and at different operating conditions. However, due to lack of space and in order to simply this exposition, these results are not shown in this article.

7.3. Experimental Validation of the Functionality of the ACISEF in a Real AC Grid

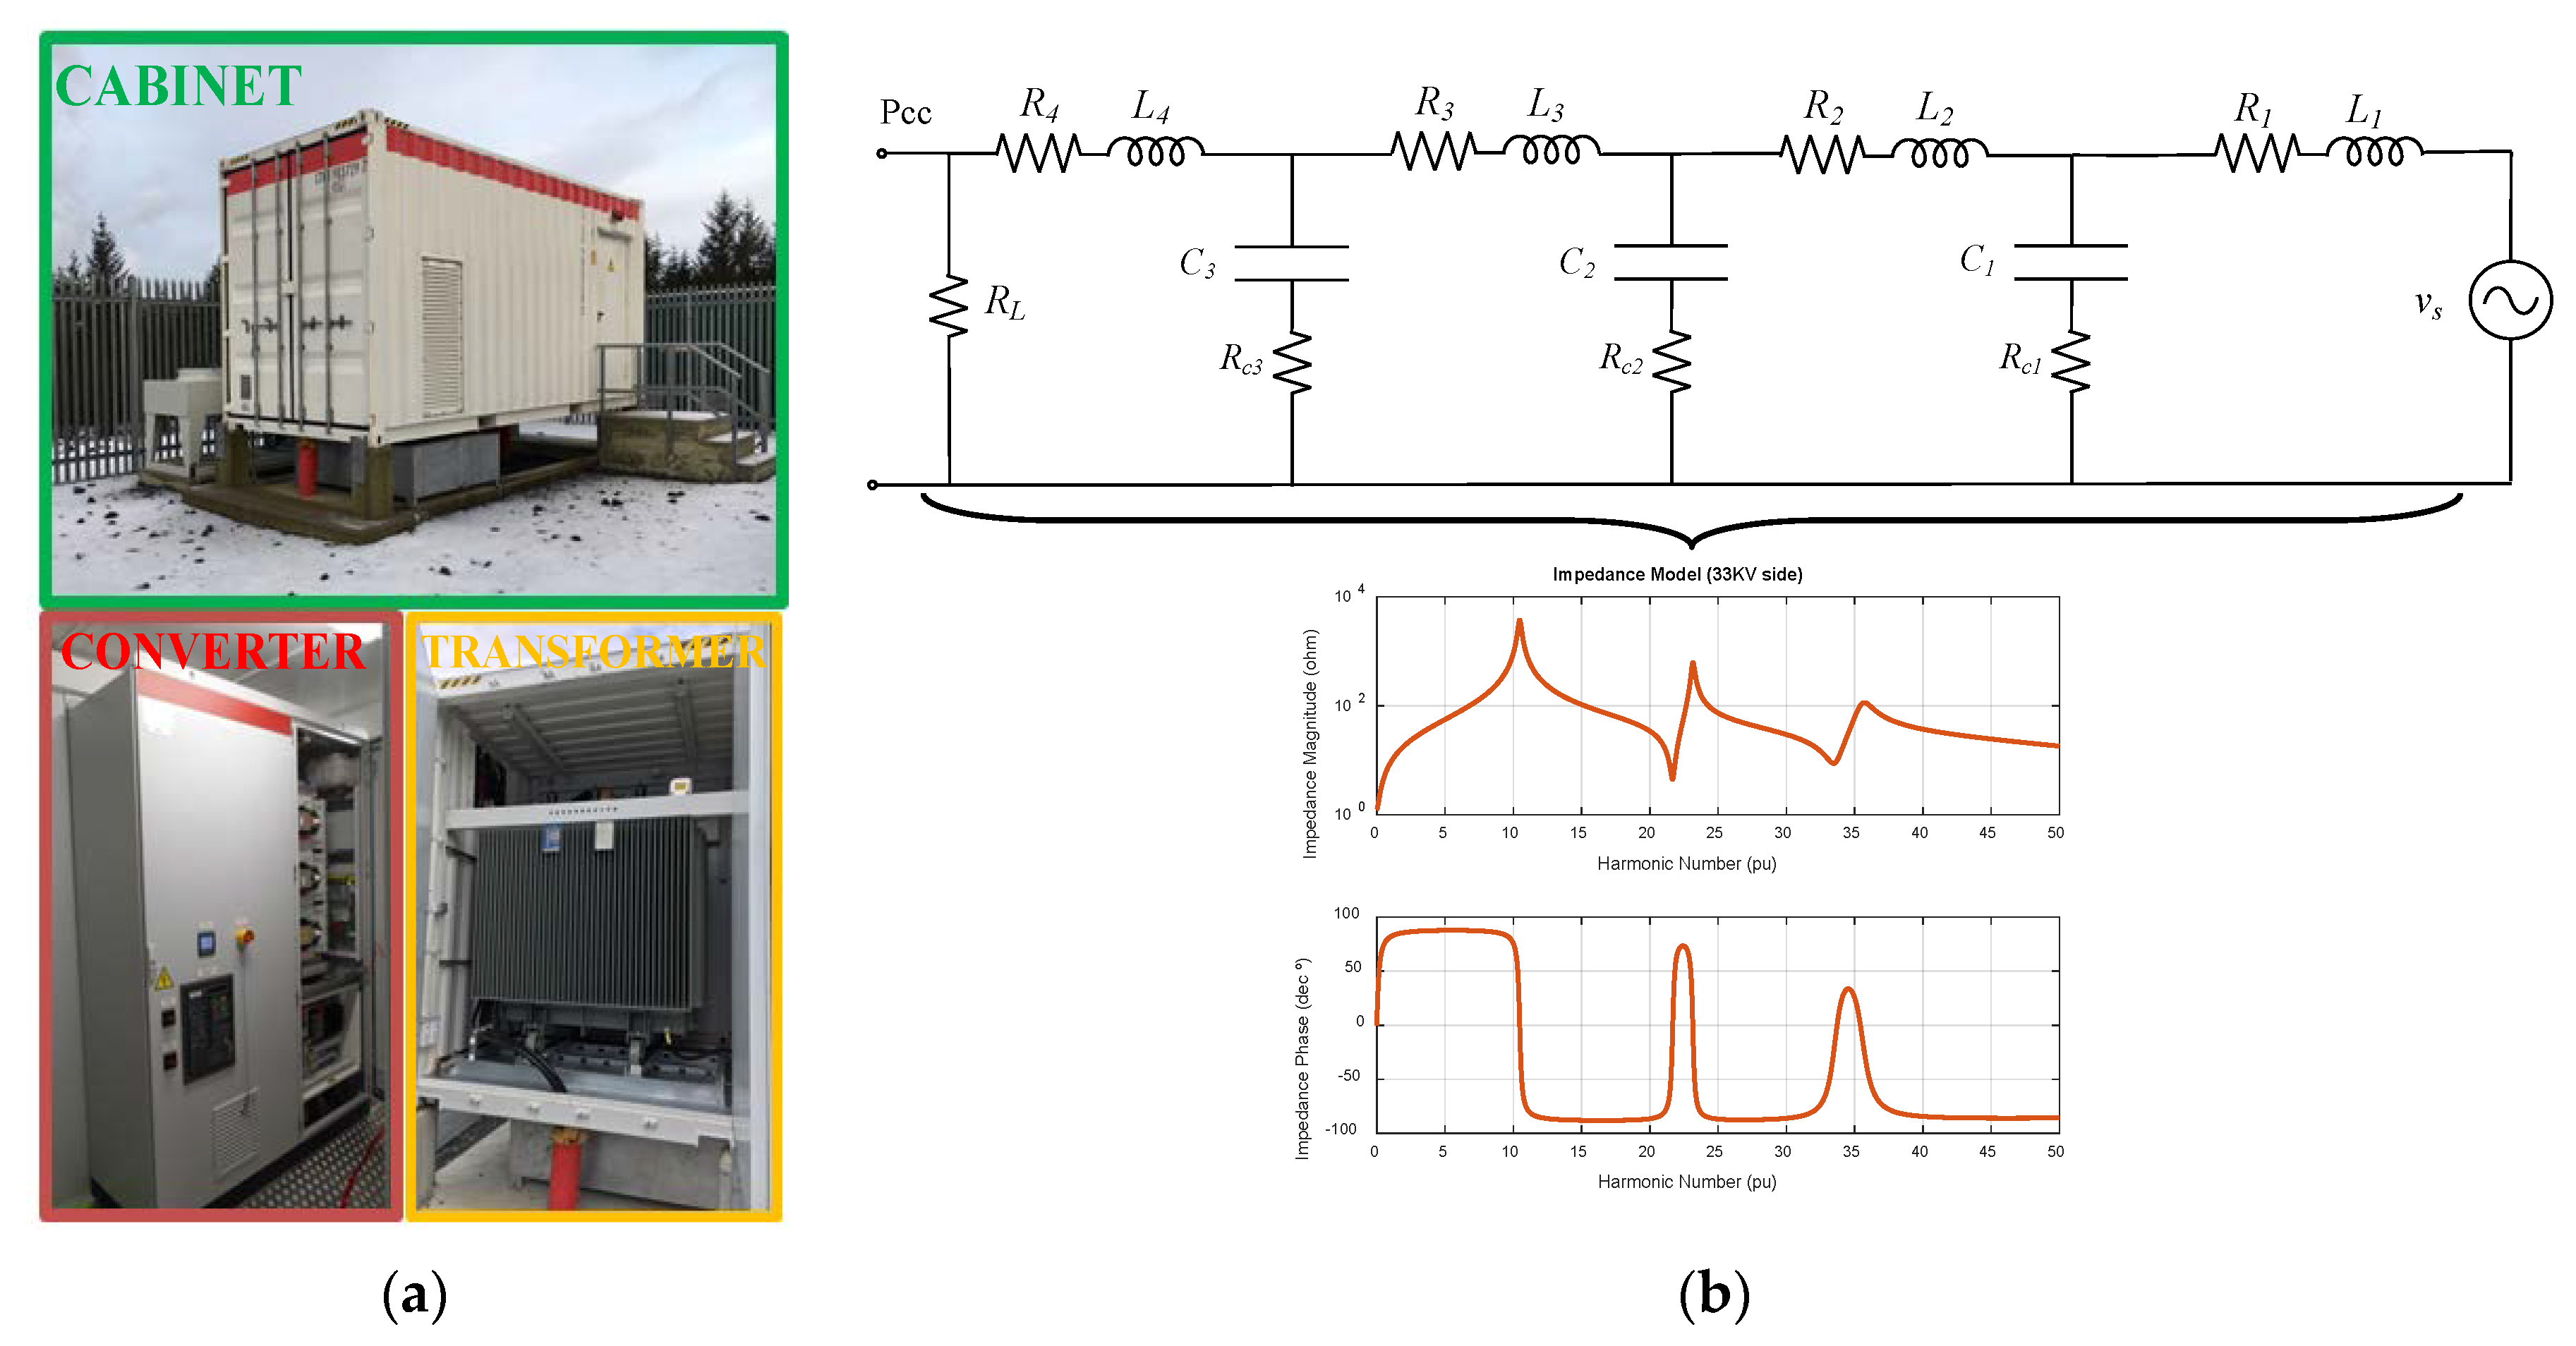
In this final section, the effectiveness of the functionality of the ASICEF is validated in a real AC grid. For this purpose, a brief but clear set of results obtained in a real AC grid are provided. Due to confidential issues, not many details of the system can be provided (such as the exact location and the exact type of elements connected). However, it can be said that the ACISEF is located in an available point of the grid and can effectively mitigate a significant amount of the 11th and 13th voltage harmonics, which are present sometimes during the day at the grid due to the nearby connection of several elements such as wind parks, thyristor-based HVDC systems, and some specific loads. In Figure 23, a picture of the converter, transformer, and location of the ACISEF is provided, together with an estimated equivalent impedance of the AC grid at the point where the ACISEF is connected. In addition, it can be seen that the accordingly adapted equivalent electric model is well fitted with a seventh order system. It also presents a quite strong resonance at approximately the 11th harmonic, similar to equivalent models used in the previous sections. Being more specific, the ACISEF is located at the substation of a remote wind farm, placed to a 10 km of distance from the nearest town (a small town). Therefore, it is at a weak point which is the end of a 33 kV line. The main rated electrical characteristics of the converter used, are summarized at the Appendix A. The transformer and the higher voltage side is of 33 kV, which is equal to the transmission voltage at the Pcc. It is a hermetically sealed transformer, with an oil natural air natural (ONAN) cooling type. The container where the converter is located incorporates an indoor temperature control, by an air conditioning unit. The converter itself is water cooled. The control of the converter is distributed into two layers. The first layer is a main PLC for communications between the substation where the converter is placed and the power plant controller. It presents additional analogue and digital input outputs for protections and visualizations. It manages alarms such as: transformer’s overcurrents, overpressure, oil temperature, fire system alarms and so on. The second layer, consist on the converter control described at the paper, which is implemented on a digital signal processor (DSP).
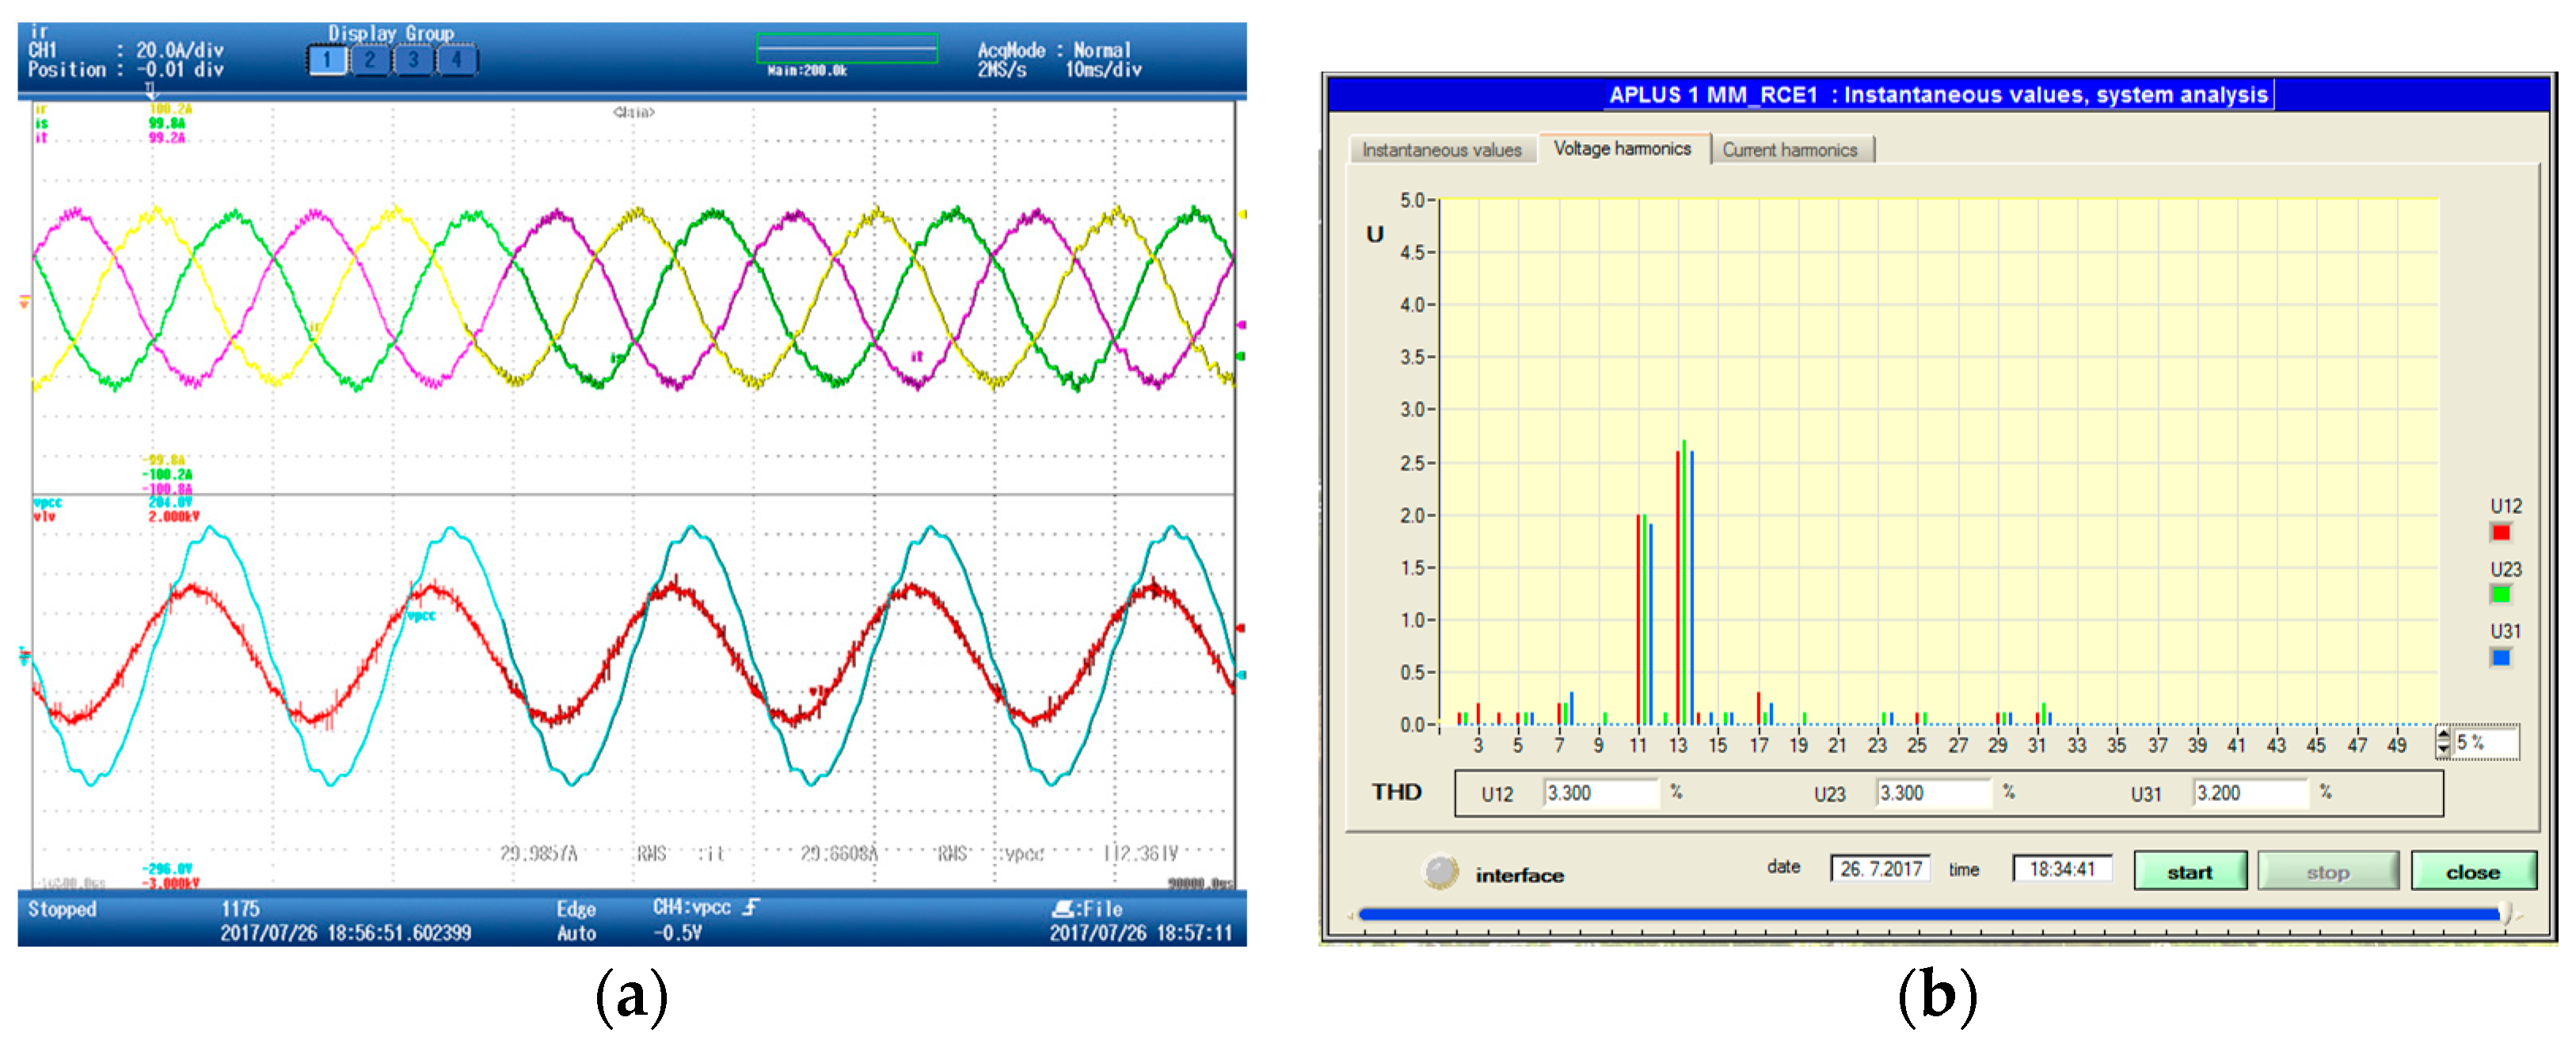
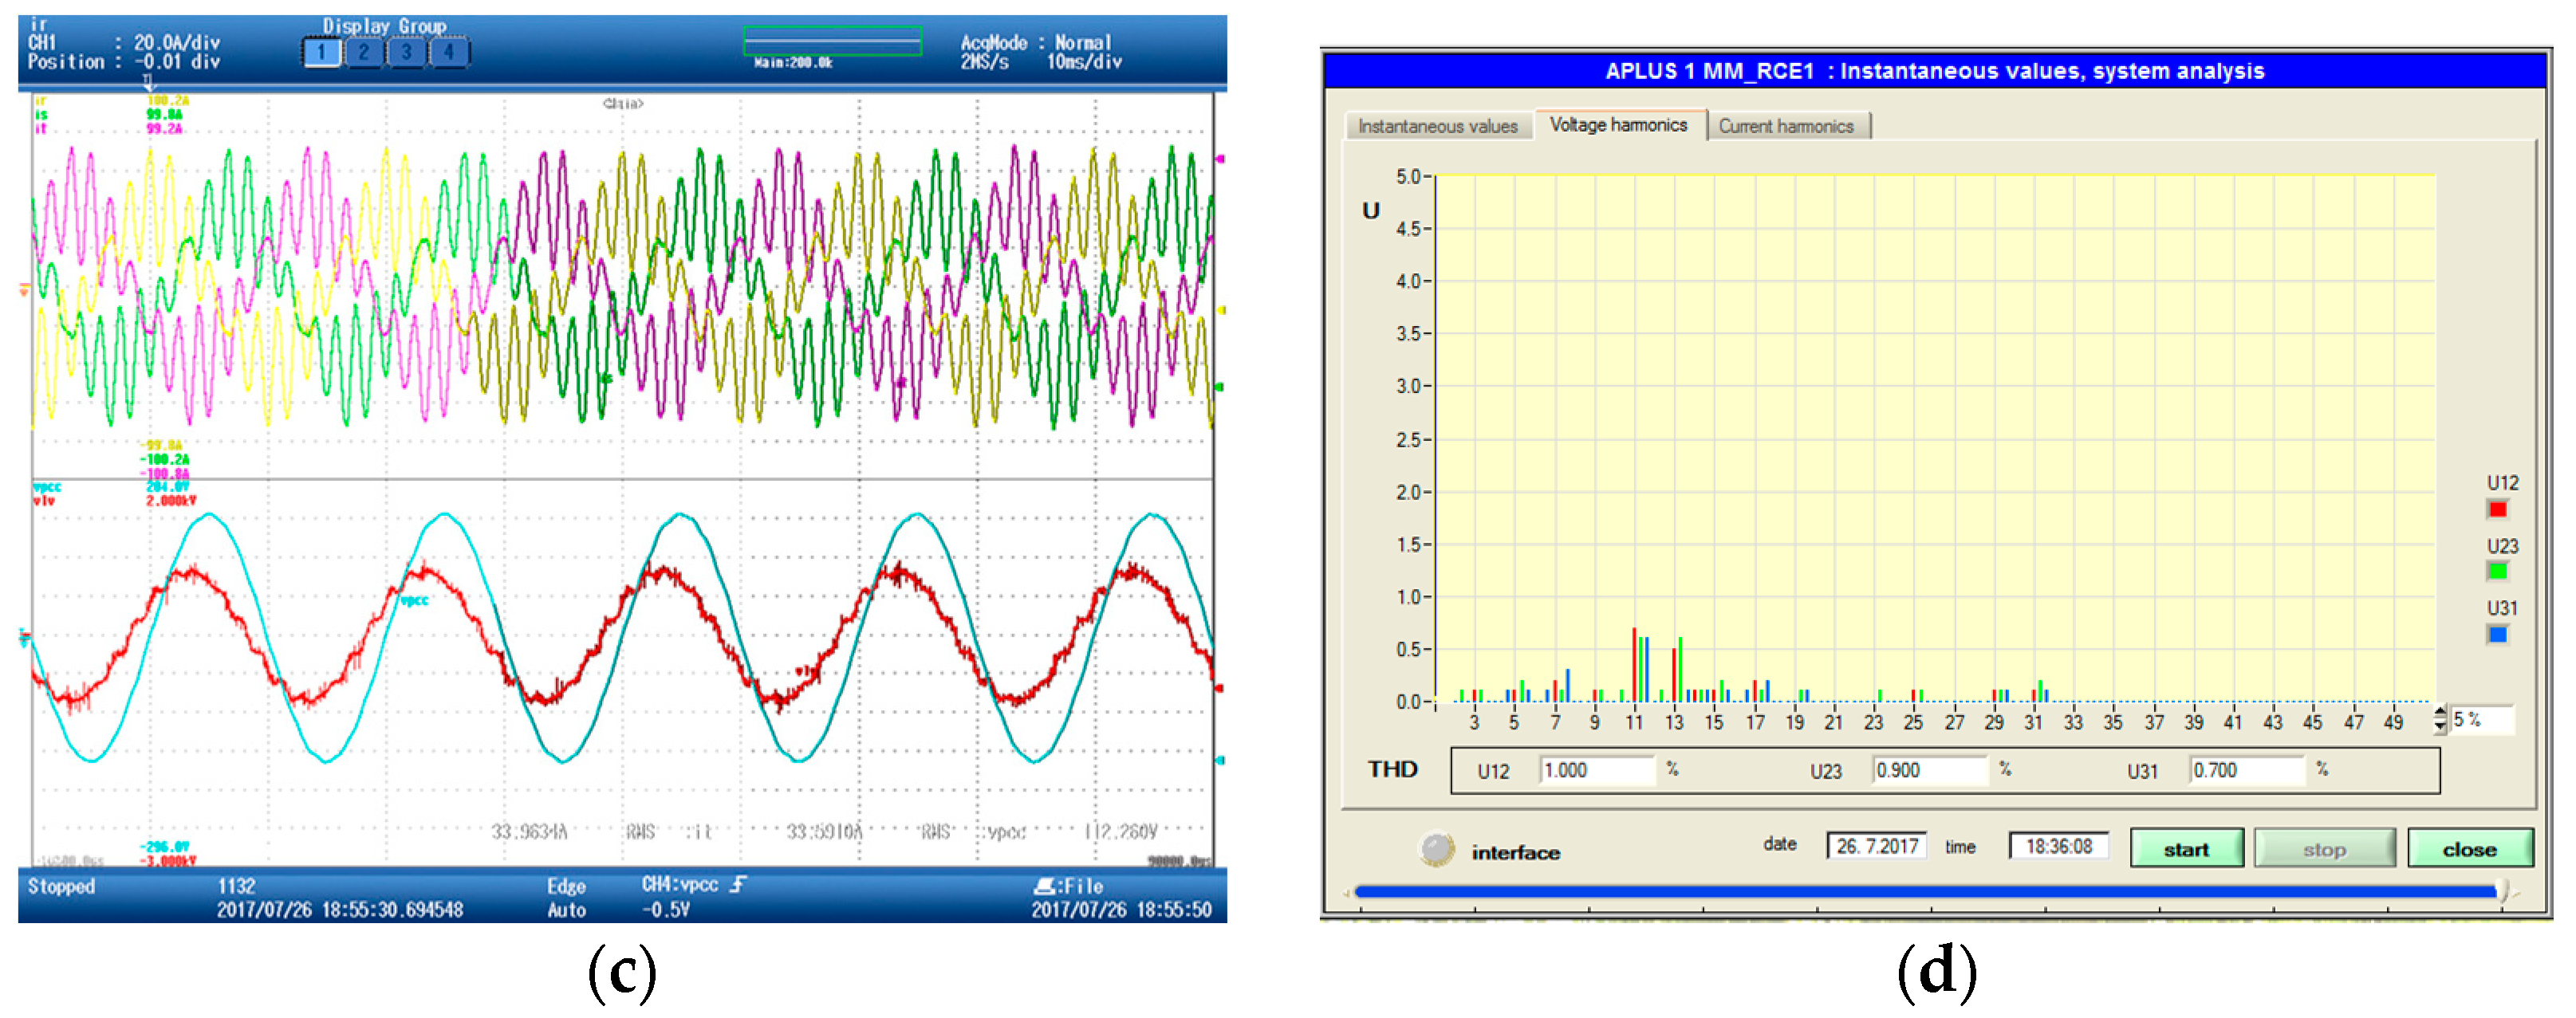
Thus, Figure 24a shows the current provided by the ACISEF operating as a reactive power compensator together with the voltage at the Pcc significantly polluted with the 11th (550 Hz) and 13th (650 Hz) voltage harmonics. In Figure 24b, it can be observed at the spectrum that the amplitude of the voltage harmonics at the 33 kV Pcc (approximately 2% and 2.5% for each harmonic, respectively). Then, in Figure 24c,d, the active impedance is enabled for the 11th and 13th harmonics (pure resistive 300 Ω at the higher voltage side for both harmonics), as described in the theoretical part of this paper. It is possible to see that the ACISEF provides the necessary converter current harmonics to significantly reduce the pollution of voltage harmonics (approximately 0.6% for both harmonics) and still be able to provide some remaining reactive current, for reactive current compensation at 50 Hz at the Pcc. It can also be observed that the THD of the voltage at each phase is improved considerably, i.e., phase a improves from 3.3% to 1%, phase b from 3.3% to 0.9%, and phase c from 3.2% to 0.7%.
Note that in order to effectively reduce the voltage harmonics at the Pcc, the voltage at the lower voltage side of the transformer has to be further distorted due to the presence of the transformer’s leakage inductance. Thus, these results demonstrate the effectiveness and capacity to mitigate harmonics of the proposed multiservice solution in real AC grids and the possibility to work simultaneously as a reactive power compensator for a fundamental frequency of 50 Hz. Note also that, depending on the specific needs of the moment, different active impedance values could be used in order to obtain a different reduction (bigger or lower) of the polluting voltage harmonics.

7.4. Discussion about the Limitations of the ACISEF

Finally, once the ACISEF has been experimentally validated at certain operating conditions, this section tries to briefly describe under which situations, the ACISEF will be effective or not. More specifically, under what nature of oscillatory behavior present at the grid voltage, the ACISEF would be able to correct or mitigate it.
Thus, attending to the frequency range in which the ACISEF could effectively mitigate voltage harmonics at the grid, the three most important inter-related factors determining this range are: the switching frequency of the converter (fsw), the modulation and the bandwidth of the current loops. Note also that especially the bandwidth of the current loops also depends on design parameters such as: filter’s impedance and nature of the filter (pure inductive or inductive capacitive filter would affect differently), transformer design, gains of the regulator, etc… Hence, for the converter used for the validation of this proposal (2.5 kHz and 2 level PWM converter), a maximum harmonic of around 19th order has been effectively mitigated (under simulation conditions, because at the real system only 11th and 13th harmonics were present).
Then, attending to the maximum amplitude of voltage harmonics that the ACISEF could mitigate, there are also again quite number of inter-related factors of the converter, determining this maximum amplitude: rated output voltage, DC bus voltage, rated output current, filter’s impedances (again an LC filter would not be the same as an L filter), DC bus capacitance, resulting power losses, cooling system used, etc At the employed experimental system, it has been possible to reach without exceeding any limit (rated voltage, rated current, losses, temperature limit of semiconductors, etc) a maximum elimination of approximately 3% of the 11th and 13th voltage harmonics present at the grid. What means that if for instance the 11th and 13th voltage harmonics at the grid are bigger than 3%, the ACISEF would not be able to fully eliminate them (it would mitigate them). Note that this maximum amplitude of voltage elimination is associated to the frequency of the harmonics themselves. For instance, seeking to correct a 19th harmonic, the maximum amplitude would be less due to several factors: bigger voltage droop at the filter, bigger power losses and so on.
On the other hand, in relation to the voltage harmonics that we can more likely find at the voltage grid, it is possible to first say that they are mainly caused by loads or generator systems based on power electronics. They consume or generate current harmonics that are converted into voltage harmonics due to the voltage droops, at line parasitic impedances basically. Therefore in many cases, harmonics multiple to the grid’s frequency (5, 7, 11, 13, 17, 19, etc) caused by diode or thyristor rectifiers (6, 12, 24, … pulses) are the most important ones in amplitude; for instance HVDCs or industrial loads. As commented in previous paragraph, most of these of harmonics (if they are problematically amplified by the grid’s parasitic impedances) are within the range in which the presented ACISEF is able to mitigate, i.e., up to its particular harmonic limit: 19th.
Then, it is possible to find also harmonics multiple to the grid’s frequency but of higher frequency than previous ones, approximately within the range of 1.5 kHz and 10 kHz. This range of harmonic, are caused mainly by PWM modulated voltage source converters connected to the grid: modern wind turbines, solar panels, etc. … These higher frequencies are in principle, the most attenuated ones by the nature of the parasitic line’s impedances (inductances and capacitances). Therefore, in general are the less problematic ones. However, if at any fictitious specific scenario, in which one or several of these harmonics are polluting significantly the grid voltage, the presented ACISEF would not be capable of correcting these harmonics due to their high frequency. It would be necessary to design a converter which is able to operate at higher switching frequency: change of semiconductors, filter, current loops dynamics, etc.
On the other hand, if any of the voltage harmonics present at the grid is variable in phase and amplitude, basically is due to the fact that the polluting sources (diode rectifiers or voltage source converters connected to the grid) change their operating regime (non-constant generated power for a wind turbine, a train approaching to the train station, etc.). Under this situation, the ACISEF would be able to correct this harmonics that vary in amplitude and phase, if the current loops are able to dynamically follow to this variation. For that purpose, the gains of the resonant controllers should be accordingly tuned, in consonance to a proper design of parameters such as: the filter’s impedance, the switching frequency and so on.
Finally, hypothetically it could be also to find a grid polluted with harmonics not multiple to the grid’s frequency. These type of harmonics are very rare to be sustained during long period of time, since they are associated mainly to transient phenomena such as: connection or disconnections of big motors or transformers (inrush currents), or simply big transients of generators or loads based on power electronics, where all the modes of the system are excited. Under this harmonics non multiple to the frequency of the grid and present during short periods of time (few grid’s cycles), in principle the ACISEF would be able to mitigate them. It would be necessary just to accurately identify the problematic frequencies at an off-line study, and then add sufficiently quick current loops accordingly. Nevertheless, this is a challenging situation that within the context of this article has not been corroborated, so it is left as a future work.

8. Conclusions

The global analytical model presented in this article facilitated the study of the performance of the ACISEF converter interacting with the AC grid at a higher abstraction level. It reinforced the holistic view of tackling such a problem, making it easier to draw conclusions to aid with design decisions. It is remarkable that the global analytical model proposed matched very well with Matlab model-based simulations (or other commercial software). Moreover, the experimental results showed that for certain types of analyses, it is not necessary to include the current and voltage ripples of the system of to the switching behavior of the converter. This fact enabled us to work with a simple and low-computational-cost analytical model, which can be used as an additional tool combined with others to achieve a practical and fast design in a context where uncertainties are often common—such as the absence of or late data provision by Transmission System Operators (TSOs) or wind park owners, the addition of new elements in the electrical infrastructure, component tolerances, etc. Moreover, another merit of the analytical approach is its flexibility, since it is easy to modify or incorporate new branches or elements into this model in order to easily adapt to new scenarios.
Being more specific, by means of several simulations applied to the model, it has been theoretically analyzed several design aspects of the ACISEF: how affects the variation of the active impedances, how affects the current loops’ bandwidth, how affects the AC grid’s impedances, which is the effectiveness of combining active resistances and inductances, how affects the time delays associated to the implementation and finally, how by means of the proposed model the design of an output LC filter can be carried out.
Then, the simulated based validation in Matlab-Simulink environment, including discrete control loops, modulation compensation and so on, demonstrated first that the proposed ACISEF is able to mitigate voltage harmonics effectively. Secondly, it demonstrated that the global analytic model proposed and the Matlab-Simulink based model, match properly.
Moreover, this study demonstrated that a high-power (2.1 kA) electronic converter operation with a switching frequency of 2.5 kHz is capable of effectively mitigate voltage harmonics of a 33 kV AC grid up to the 13th order (650 Hz). The experimental evidence provided by the converter, operating for months (until the publication of this article) as an active impedance at selective frequencies and reducing the harmonic voltage distortion to acceptable levels in a complex AC grid, in which wind parks, HVDCs, and civilian loads interact all together, shows that power electronic-based converters can provide useful services to real problems of AC grids.
Finally, the integrative character of this model has to be highlighted, since it is prepared to accept future extensions, such as the incorporation of switching ripples, to study certain phenomena in an alternative way, as well as to integrate the frequency/amplitude variations of the grid to analyze the power share.

Author Contributions

G.A.; Conceptualization, Formal Analysis, Investigation, Writing-Original Draft Preparation, A.L.; Conceptualization, Formal Analysis, Investigation, Software, Validation, G.S.; Conceptualization, Formal Analysis, Investigation, Software, Validation, J.A.B.; Conceptualization, Formal Analysis, Investigation.

Conflicts of Interest

The authors declare no conflict of interest.

Appendix A

AC grid:
  • L1 = 2.625 mH, R1 = 0.1 Ω, C1 = 16.87 µF, Rc1 = 26.2 mΩ,
  • L2 = 12.7 mH, R2 = 0.3 Ω, C2 = 4.84 µF, Rc2 = 2.63 Ω,
  • L3 = 17.09 mH, R3 = 0.75 Ω, RL = 20 kΩ, vs = 33 kV (Line-Line RMS).
ACISEF:
  • Two-level voltage source converter with low-voltage IGBTs.
  • Irms converter = 2150 A.
  • Vbus = 1150 V.
  • n_transformer = 33,000/600. Delta-Wye (Dyn11)
  • Rconv = 0.2 × 10⁻⁶·(n_transformer2) Ω (at the high voltage side)
  • Lconv = 85 × 10−6·(n_transformer2) H (at the high voltage side)
  • ki = ki1 = ki2= 13.5·(n_transformer2) (at the high voltage side)
  • ω = 2·pi·50 rad/s, ω1 = ω·11, ω2 = ω·13.
  • fsw = 2.5 kHz

References

  1. Gyugyi, L.; Strycula, E.C. Active ac power filters. In Proceedings of the IEEE-IAS Annual Meeting, Chicago, IL, USA, 11–14 October 1976; pp. 529–535. [Google Scholar]
  2. Akagi, H. New trends in active filters for power conditioning. IEEE Trans. Ind. Appl. 1996, 32, 1313–1322. [Google Scholar] [CrossRef] [Green Version]
  3. Wang, X.; Li, Y.W.; Blaabjerg, F.; Chiang Loh, P. Virtual-Impedance-Based Control for Voltage-Source and Current-Source Converters. IEEE Trans. Power Electron. 2015, 30, 7019–7037. [Google Scholar] [CrossRef]
  4. Tao, Y.; Liu, Q.; Deng, Y.; Liu, X.; He, X. Analysis and mitigation of inverter output impedance impacts for distributed energy resource interface. IEEE Trans. Power Electron. 2015, 30, 3563–3576. [Google Scholar] [CrossRef]
  5. Wang, X.; Blaabjerg, F.; Loh, P.C. Virtual RC damping of LCL-filtered voltage source converters with extended selective harmonic compensation. IEEE Trans. Power Electron. 2015, 30, 4726–4737. [Google Scholar] [CrossRef]
  6. Matas, J.; Castilla, M.; Vicuna, L.G.; Miret, J.; Vasquez, J. Virtual impedance loop for droop-controlled single-phase parallel inverters using a second-order general-integrator scheme. IEEE Trans. Power Electron. 2010, 25, 2993–3002. [Google Scholar] [CrossRef]
  7. He, J.; Li, Y.W.; Munir, M.S. A flexible harmonic control approach through voltage-controlled DG-grid interfacing converters. IEEE Trans. Ind. Electon. 2012, 59, 444–455. [Google Scholar] [CrossRef]
  8. Paquette, A.D.; Divan, D.M. Virtual impedance current limiting for inverters in microgrids with synchronous generators. IEEE Trans. Ind. Appl. 2014, 51, 1630–1638. [Google Scholar] [CrossRef]
  9. Li, Y.W.; Vilathgamuwa, D.M.; Loh, P.C.; Blaabjerg, F. A dual-functional medium voltage level DVR to limit downstream fault currents. IEEE Trans. Power Electron. 2007, 22, 1330–1340. [Google Scholar] [CrossRef]
  10. Zhang, Y.; Li, Y.W.; Zargari, N.R.; Cheng, Z. Improved Selective Harmonics Elimination Scheme with Online Harmonic Compensation for High-Power PWM Converters. IEEE Trans. Power Electron. 2015, 30, 3508–3517. [Google Scholar] [CrossRef]
  11. Middlebrook, R.D. Input filter considerations in design and application of switching regulators. In Proceedings of the IEEE Industry Applications Society, Cleveland, OH, USA, 30 September–4 October 1979; pp. 366–382. [Google Scholar]
  12. Dong, H.; Yuan, S.; Han, Z.; Cai, Z.; Jia, G.; Ge, Y. A Comprehensive Strategy for Accurate Reactive Power Distribution, Stability Improvement and Harmonic Suppression of Multi-Inverter-Based Micro-Grid. Energies 2018, 11, 745. [Google Scholar] [CrossRef]
  13. Wen, B.; Burgos, R.; Boroyevich, D.; Mattavelli, P.; Shen, Z. AC Stability Analysis and dq Frame Impedance Specifications in Power-Electronics-Based Distributed Power Systems. IEEE J. Emerg. Sel. Top. Power Electron. 2017, 5, 1455–1465. [Google Scholar] [CrossRef]
  14. Agbemuko, A.J.; Domínguez-García, J.L.; Prieto-Araujo, E.; Gomis-Bellmunt, O. Impedance Modelling and Parametric Sensitivity of a VSC-HVDC System: New Insights on Resonances and Interactions. Energies 2018, 11, 845. [Google Scholar] [CrossRef]
  15. Yuan, C.; Xie, P.; Yang, D.; Xiao, X. Transient Stability Analysis of Islanded AC Microgrids with a Significant Share of Virtual Synchronous Generators. Energies 2018, 11, 44. [Google Scholar] [CrossRef]
  16. Alacano, A.; Valera, J.J.; Abad, G.; Izurza, P. Power Electronics Based DC Distribution Systems for Electrically Propelled Vessels: A Multivariable Modeling Approach for Design and Analysis. IEEE J. Emerg. Sel. Top. Power Electron. 2017, 5, 1604–1620. [Google Scholar] [CrossRef]
  17. Kocewiak, Ł.H.; Gautschi, M.; Zeni, L.; Hesselbæk, B.; Negra, N.B.; Sørensen, T.S.; Blaumeiser, B.; Vogelsanger, S. Power Quality Improvement of Wind Power Plants by Active Filters Embedded in STATCOMs. In Proceedings of the 15th International Workshop on Large-Scale Integration of Wind Power into Power Systems as well as Transmission Networks for Offshore Wind Farms, Energynautics GmbH, Vienna, Austria, 15–17 November 2016. [Google Scholar]
  18. Chaudhary, S.K.; Lascu, C.; Teodorescu, R.; Kocewiak, Ł.H. Voltage Feedback based Harmonic Compensation for an Offshore Wind Power Plant. In Proceedings of the IEEE International Conference on Power Electronics, Drives and Energy Systems (PEDES), Trivandrum, India, 14–17 December 2016. [Google Scholar]
  19. Zhang, S.; Jiang, S.; Lu, X.; Ge, B.; Peng, F.Z. Resonance Issues and Damping Techniques for Grid-Connected Inverters with Long Transmission Cable. IEEE Trans. Power Electron. 2014, 29, 2014. [Google Scholar] [CrossRef]
  20. Kocewiak, Ł.H. Harmonic Challenges and Mitigation in Large Offshore Wind Power Plants. In Proceedings of the Harmony Symposyum, Aalborg, Denmark, 26 August 2015. [Google Scholar]
  21. Zabaleta, M.; Burguete, E.; Madariaga, D.; Zubimendi, I.; Zubiaga, M.; Larrazabal, I. LCL grid filter design of a multimegawatt medium-voltage converter for offshore wind turbine using SHEPWM modulation. IEEE Trans. Power Electron. 2016, 31, 1993–2001. [Google Scholar] [CrossRef]
  22. Mattavelli, P.; Buso, S. Digital Control in Power Electronics; Morgan & Claypool: San Rafael, CA, USA, 2006. [Google Scholar]
  23. Teodorescu, R.; Liserre, M.; Rodriguez, P. Grid Converters for Photovoltaic and Wind Power Systems; John Wiley and Sons: Hoboken, NJ, USA, 2011. [Google Scholar]
  24. Unamuno, E.; Barrena, J.A. Design and small-signal stability analysis of a virtual-capacitor control for DC microgrids. In Proceedings of the 19th European Conference on Power Electronics and Applications, Warsaw, Poland, 11–14 September 2017. [Google Scholar]
  25. Sul, K. Control of Electric Machine Drive Systems; John Wiley & Sons. Inc.: Hoboken, NJ, USA, 2011. [Google Scholar]
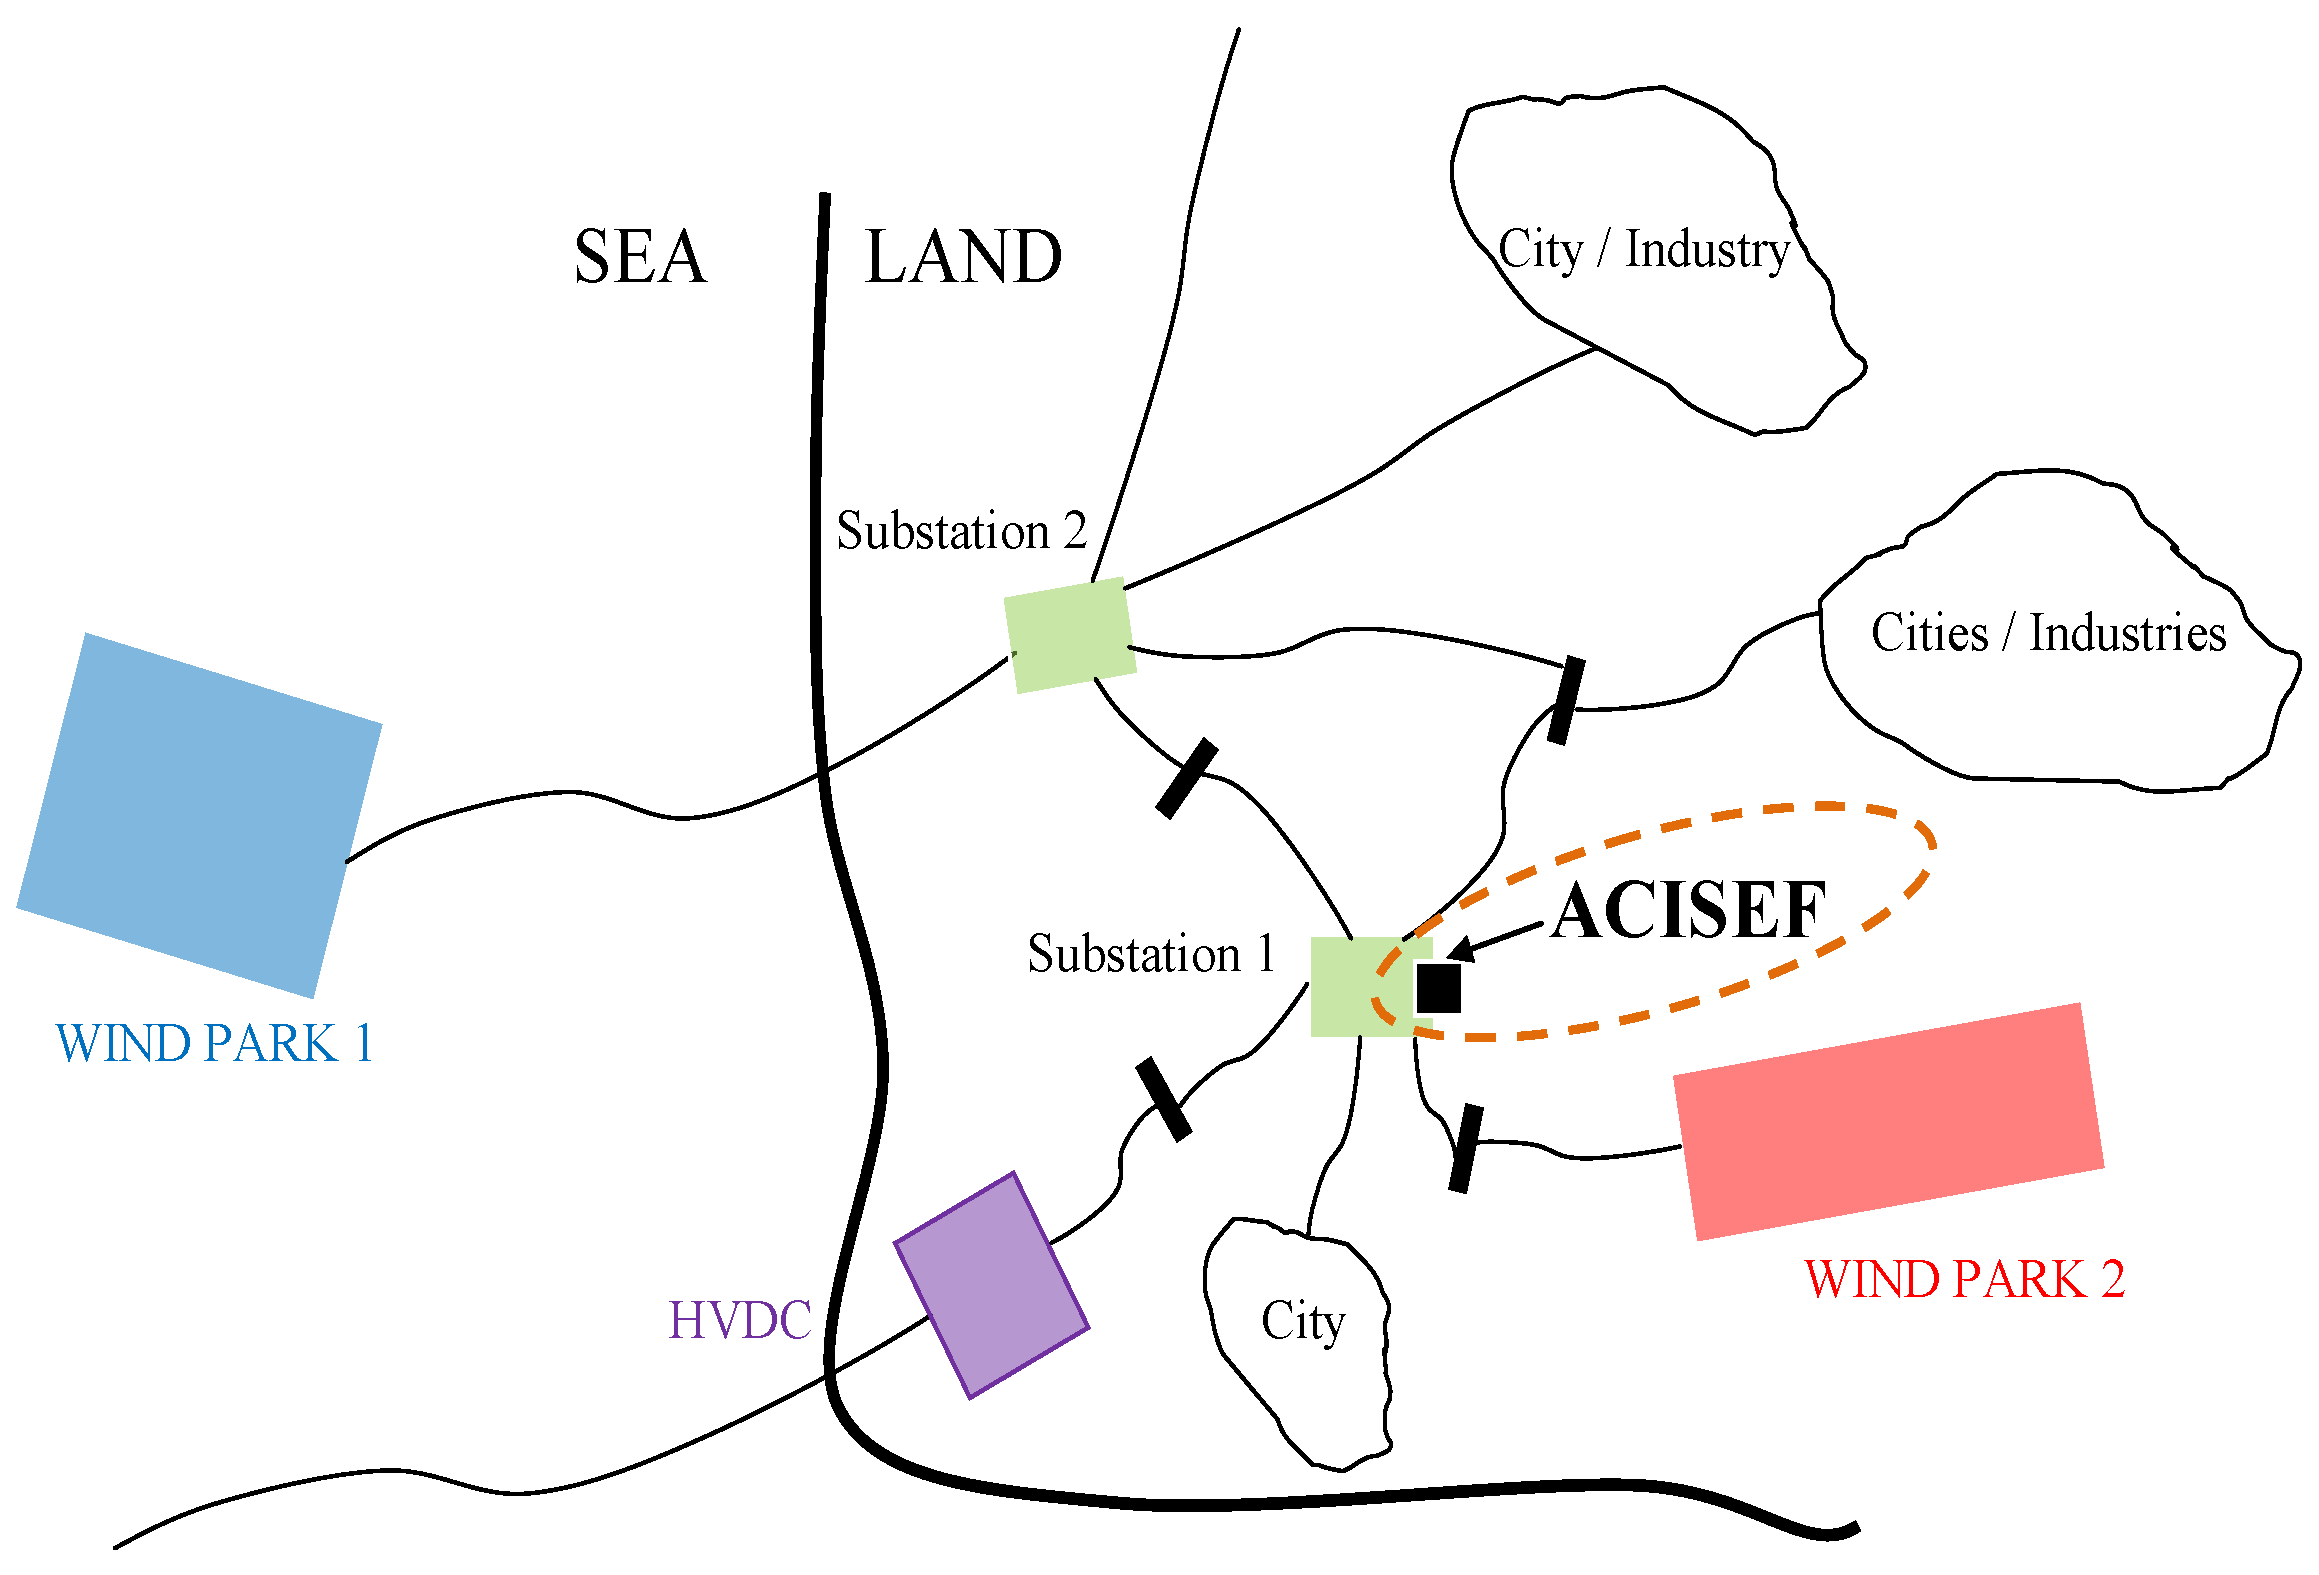
Figure 1. A possible AC grid with an abnormal low-order voltage harmonic level and the location of the active impedance at selective frequencies (ACISEF) at a sub-station.
Energies 11 01337 g001
Figure 2. Possible equivalent impedance of AC grids seen at one specific point, due to the combination of several elements connected to the given grids (for example, a strong presence of subterranean or submarine cables such as those in wind parks, transformer, shunt compensators, and harmonic passive filters) [20].
Energies 11 01337 g002
Figure 3. Equivalent AC grid model and converter providing active impedance at selective frequencies (ACISEF) connected at the Pcc.
Energies 11 01337 g003
Figure 4. Bode diagrams and poles of an equivalent AC grid model, without connecting the ACISEF. (a) Bode of v3αβ(s)/vsαβ(s); (b) Bode of i3αβ(s)/vsαβ(s); (c) Poles of the system.
Energies 11 01337 g004
Figure 5. Converter operating as an active impedance at selective frequencies. (a) Power circuit structure; (b) simplified equivalent electric model of the AC grid and ACISEF with the application of Thevenin’s theorem.
Energies 11 01337 g005
Figure 6. Schematic representation of the converter, behaving as an active impedance at selective frequencies.
Energies 11 01337 g006
Figure 7. Control block diagram of ACISEF, with current loops in the stationary reference frame (αβ). There can be as many loops as there are active impedances to implement.
Energies 11 01337 g007
Figure 8. Poles and Bode plots of Conv1(s) and Conv2(s) at different active resistance values. (a) Poles of Conv1(s) and Conv2(s), (b) Bode plot of Conv1(s), (c) Bode plot of Conv2(s) (blue: Rv1 = 7.562 Ω, red: Rv1 = 75.62 Ω, orange: Rv1 = 756.2 Ω).
Energies 11 01337 g008
Figure 9. Poles and Bode plots of Conv1(s) and Conv2(s) with active resistance Rv1 = 75.62 Ω and different gains of resonant regulators. (a) Poles of Conv1(s) and Conv2(s), (b) Bode plot of Conv1(s), (c) Bode plot of Conv2(s) (blue: ki = ki1 = 40,837, red: ki = ki1 = 32,670, orange: ki = ki1 = 24,502).
Energies 11 01337 g009
Figure 10. Dominant poles and Bode plots of the voltage at the Pcc with active resistance Rv1 = 7.562 kΩ (2.5 Ω at the low voltage side) programmed at 550 Hz. (a) Dominant poles of the system, (b) Bode plot of v3αβ(s)/vsαβ(s).
Energies 11 01337 g010
Figure 11. Dominant poles and Bode plots of the voltage at the Pcc with different active resistances (Rv1 = 7.562 kΩ multiplied by factors of (1 0.75 0.5 0.25 0.15 0.1 0.075 0.05)) programmed at 550 Hz. (a) Dominant poles of the system, (b) Bode plot of v3αβ(s)/vsαβ(s).
Energies 11 01337 g011
Figure 12. Dominant poles and Bode plots of the voltage at the Pcc with different ki1 values (multiplied by factors (1 2 3 4 6) from its initial value). Active resistance is constant Rv1 = 7.562 kΩ programmed at 550 Hz. (a) Dominant poles of the system, (b) Bode plot of v3αβ(s)/vsαβ(s).
Energies 11 01337 g012
Figure 13. Dominant poles and Bode plots of the voltage at the Pcc with different C1 (multiplied by factors (1 1.1 1.2 1.3 1.4) from its initial value) values of the AC grid impedance. Active resistance is constant Rv1 = 1.51 kΩ programmed at 550 Hz. (a) Dominant poles of the system, (b) Bode plot of v3αβ(s)/vsαβ(s).
Energies 11 01337 g013
Figure 14. Dominant poles and Bode plots of the voltage at the Pcc with altered AC grid impedance (C1·1.4) and with different active resistances (Rv1 = 1.51 kΩ multiplied by factors (1 1.5 2 3)) programmed at 550 Hz. (a) Dominant poles of the system, (b) Bode plot of v3αβ(s)/vsαβ(s).
Energies 11 01337 g014
Figure 15. Bode plots of the voltage at the Pcc and the admittance of the ACISEF with different active Rv1-Lv1 values programmed at 550 Hz (Rv1 = 0.75 kΩ is kept constant and Lv1 = 218.8 mH is multiplied by factors (0 0.1 0.5 1 2)). (a) Bode plot of v3αβ(s)/vsαβ(s), (b) Bode plot of iconvαβ(s)/v3αβ(s).
Energies 11 01337 g015
Figure 16. Pole plots and Bode plots of the voltage at the Pcc when the C1 impedance of grid changes and pure active resistance (Rv1 = 1.512 kΩ) and pure active inductance (Lv1 = −437 mH, which is −1.51 kΩ at 550 Hz) are programmed at the ACISEF at 550 Hz. (a) Pole plots with C1 at the initially programmed value, (b) pole plots with the AC impedance changed to 1.3·C1, (c) Bode plot of v3αβ(s)/vsαβ(s) with C1 at the initially programmed value, (d) Bode plot of v3αβ(s)/vsαβ(s) with the AC impedance changed to 1.3·C1.
Energies 11 01337 g016
Figure 17. Dominant poles and Bode plots of the voltage at the Pcc, with different τ delays at voltage and current measurements (the initial value is 100 µsec, which is then multiplied by factors (0.05 0.1 0.15 0.2)). The active resistance is kept constant at Rv1 = 1.51 kΩ programmed at 550 Hz. (a) Dominant poles of the system, (b) Bode plot of v3αβ(s)/vsαβ(s).
Energies 11 01337 g017
Figure 18. ACISEF equivalent circuit with an output LC filter.
Energies 11 01337 g018
Figure 19. Bode plots with the ACISEF with L and LC output filters and active resistance (Rv1 = 1.51 kΩ programmed at 550 Hz). (a) Bode diagram of iconvαβ/v3αβ, (b) Bode diagram of v3αβ(s)/vsαβ(s).
Energies 11 01337 g019
Figure 20. Equivalent AC grid with more than one branch.
Energies 11 01337 g020
Figure 21. Performance evaluation (a) Voltage v3α at the Pcc, polluted with the 11th and 13th harmonics as a consequence of the harmonics emissions in the source voltage. At second 0.9, the ACISEF is enabled, operating with two active selective resistances: 10 Ω (at the low voltage side) to 550 Hz and 2.5 Ω (at the low voltage side) to 650 Hz. (b) Bode plot of v3αβ/vsαβ, with and without active resistances. (c) Magnification of the previous image.
Energies 11 01337 g021
Figure 22. The ACISEF operating as an active pure resistance of 10 Ω (at the low voltage side) to 550 Hz and 7 Ω (at the low voltage side) to 650 Hz. Comparison of i3α and v3α variables of the system, for the analytical model and the Simulink detailed model (including discrete control loops, modulation, delays, and compensations).
Energies 11 01337 g022
Figure 23. Experimental setup and equivalent impedance of AC grid (a) A picture of the converter, transformer, and location of the ACISEF, (b) estimated equivalent impedance of the AC grid at the point where the ACISEF is connected (Pcc) and adapted equivalent electric model (seventh order model approach).
Energies 11 01337 g023
Figure 24. Experimental results of the ACISEF in a real AC grid. (a) The ACISEF provides 300 kVAR of reactive power and the active impedances at 550 Hz and 650 Hz are not enabled (top: converter currents at the low voltage side, bottom: Pcc voltage at 33 kV (blue) and PCC voltage at the low voltage side of the transformer (600 V) (red)). (b) Harmonic content of the grid voltage at the Pcc (33 kV side) with the active impedances not enabled. (c) The ACISEF provides 300 kVAR of reactive power and the active impedances at 550 Hz and 650 Hz (300 Ω for both harmonics) are enabled (top: converter currents at the low voltage side, bottom: Pcc voltage at 33 kV (blue) and PCC voltage at the low voltage side of the transformer (600 V) (red)). (d) Harmonic content of the grid voltage at the Pcc (33 kV side) with the active impedances enabled.
Energies 11 01337 g024aEnergies 11 01337 g024b