Abstract
The lower rate of penetration (ROP) is one of the key technical difficulties during drilling of shale reservoirs. Percussive-rotary drilling (PRD) is crucial for increasing ROP. One of the core problems of ROP optimization for PRD are the dynamic damage characteristics of rock fragmentation. By considering the dynamic drilling parameters, a new model for estimating the PRD with a full-scale polycrystalline diamond compact (PDC) bit is established. The mechanical parameters of shale are measured by a wave velocity method. Rock damage characteristics are simulated by using the finite element method. The numerical simulation model is verified by the actual drilling case in LMX shale reservoir in Sichuan (China). The results indicate that rock element damage occurs along the direction of maximum principal stress. The order of decreasing rock damage rate is impact-static load, static load and impact load. When the impact load has the same peak value, and the rock elements in contact with the cutters obtain more energy with load frequency increasing. The rock fragmentation efficiency under a sine wave is higher than rectangular and pulse waves. The rock can obtain more energy to be broken with the increasing impact load duration and peak values. When the impact-static load goes over the rock damage threshold value, the higher the peak value of the impact load is, the more energy the rock will obtain. The higher the lateral vibration amplitude of the drill bit, the lower the efficiency of rock fragmentation. Repetitions of drill bit axial vibration at one indentation point will reduce the ROP, and the axial vibration energy of the drill bit is consumed. Therefore, a small lateral movement and reasonable axial vibration frequency increase the rock breaking efficiency. The ROP was increased through the suppression of drill string and the application of vibration. The study results can be used in the optimization designs of bit trajectory and ROP for PRD tools.
1. Introduction
The lower rate of penetration (ROP) is one of the key technical difficulties during drilling of shale reservoirs. The low ROP increases the drilling time and cost. The drill string will produce complex vibrations and shock to the bit, then the rock-bit interaction load is dynamic. In order to increase the ROP, several typical drilling technologies were proposed, such as rotary drilling, percussive drilling and percussive-rotary drilling (PRD) (Figure 1). However, the rock fragmentation under dynamic loads was not clarified [1,2]. There are lots of studies concerning rock dynamic fragmentation mechanisms. One of the earliest reports of percussion drilling technique occurred in 1940s [3]. Since then different terms have been used, such as downhole hammer, percussion hammer, down-the-hole hammer, percussive drilling, and PRD [4,5]. PRD is developed from rotary drilling and percussive drilling. Significant results in understanding the percussive fragmentation mechanism have also been achieved in the laboratory. The rock fragmentation efficiency is not a linear relationship with the drilling parameters, such as weight on bit (WOB), torque on bit (TOB), and rotations per minute (RPM). Experiments examining rock breakage under dynamic and static loads were carried out. PRD is one of the best ways to improve the drilling efficiency of hard formation. The fragmentation investigation of granite is studied by the use of the dynamic and static rock-breaking test device, reasonable load of single cutter cutting rock under the impact-static action was proposed [6,7,8].
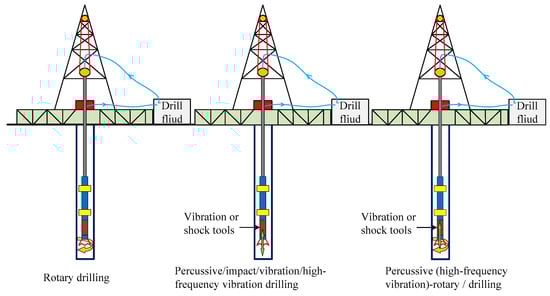
Figure 1.
The typical drilling types in the oil and gas engineering.
However, the fragmentation process and stress field of rock-bit interactions is not still clear. Numerical simulation methods such as discrete element method (DEM), finite element method (FEM) and finite difference method (FDM) are some of the most effective ways to study the process and stress field of broken rock. The DEM can present the form of rock cracks and the separation of chips from the rocks, but it’s difficult to simulate the full-scale bits and irregular shape cutters. The modeling and simulations of a dynamic single cutter drilling were investigated by DEM [9]. The effects of borehole pressure on bit-cutter induced rock fragmentation was studied by DEM. The FEM can simulate the complex shape of bits and cutters, but it is difficult to represent the rock cracking process. The numerical indentation model of a single indenter was established by the FEM [10,11]. The indentation fragmentation process of rocks under dynamic loads, different deviation angles and different cutters angles were investigated. A simulation model of a PRD system was established [12,13], which can predict ROP, impact energy and piston impact force. The rock fragmentation process of PRD was studied by a plastic strain failure model, which indicated that PRD mainly depends on impact load, but not rotatory load [14]. A numerical model of high-frequency torsional impacts was used to study the rock crushing process and simulate the evolution of damage initiation and propagation [15]. The impact fragmentation of bluestone was studied by using the FEM [12], which focused on multi-type bits. Numerical simulation of the rock fragmentation process subject to static and dynamic loading was studied [16]; this numerical model focused on the effect of two drill cutters. A simulation model of PRD was established based on FDM, and the rock fragmentation mechanism of a bit cutter was studied [7,17,18,19,20]. With the use of lower WOB, PRD has been shown to improve ROP in some hard and brittle formations. However, the suppression and control of drill string vibration can also increase ROP [21,22,23].
Although PRD has been proposed for years, there is still not a wide range of applications in oil and gas well drilling, especially for shale reservoirs. Various simplified methods which were proven in the early periods are inadequate for the analysis of rock damage characteristics of PRD in anisotropic shale. The ROP of PRD is unstable in the same formation. Many studies of PRD in hard rock do not consider the shale formation and the complex shape of full-size PDC bits. However, the mechanical properties and dynamic characteristics of shale differ from those of other rock types; the dynamic drilling parameters of PRD are coupled in the drilling process, and the need for complex experimental instruments and field tests increase the experimental and test costs dramatically. Modern numerical techniques based on FEM allow a detailed analysis to be performed. In this paper, a simulation model of a full-size PDC bit was established by FEM. This paper primarily focuses on the shale dynamic damage efficiency based on damage mechanics, strength theory, experimental and field statistic results, as well as considering dynamic parameters, including load combinations forms, impact frequency, impact wave shape, duration of impact load and impact load peak values.
2. Simulation Model Description
2.1. Rock Constitutive Law
For this numerical study of PRD, it is assumed that the rock will yield according to the Drucker–Prager yield criterion [24]. The rock constitutive law is written in the following form:
where is the invariant of the stress tensor, is the invariant of the stress deviator, is the friction angle, is the cohesive force, and are material parameters written in terms of and , and , and are the principal stress.
2.2. Rock Damage Criterion
The rock damage criterion determine the rock element damage and fragmentation process of PRD, the criterion of estimating rock damage is as defined follows [20,25]:
where is equivalent plastic strain of rock materials failure, is equivalent plastic strain:
where represents the damage variable, and are elastic modulus of the damaged and the undamaged material, respectively. The evolution of the elemental damage variable can be expressed as follows:
where is stress, is the critical plastic strain, the stress–strain curve with progressive damage degradation is shown in Figure 2. and are the critical yield stress and critical plastic strain of rock beginning to fail, respectively. ; is the equivalent plastic strain of rock material failure, and when , complete rock element failure occurs.
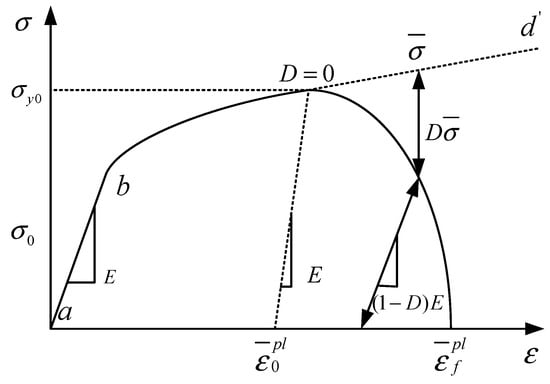
Figure 2.
The stress–strain curve with progressive damage degradation.
2.3. Bit-Rock Interaction Mathematical Model
The simulation model considers many factors, the equation of motion can be written in the assembled general form as [26]:
where is generalized displacement matrix; is generalized velocity matrix: is generalized acceleration matrix; is the global assembled mass matrix of the system; is the global assembled damping matrix of the system; is the global assembled stiffness matrix of the system; is the generalized force vector matrix.
2.4. Determination of Mechanical Parameters
The rock mechanical properties are an important factor for the numerical simulation of PRD during shale reservoir drilling. The study field is located in the Sichuan Basin. The Longmaxi (LMX) shale formation with a thickness of 79 m is one of the gas reservoirs in the Sichuan region.
To evaluate the dynamic process of rock damage in shale gas reservoirs, the rock elastic mechanical properties were measured. Shales have anisotropic characteristics and are typically considered to be symmetric with a symmetry axis perpendicular to the bedding. When evaluated from elastic wave velocity measurements, this tensor characterizes the dynamic apparent behavior of the material. Multi-core methods have been used to study anisotropy [27]. Five independent constants may be related uniquely to the five classical engineering elastic constants of a transversely isotropic medium [28]:
where is written in the following form:
These five independent constants are related to the five elastic wave velocities measured experimentally as follows:
where is the dynamic Young’s modulus perpendicular to the plane of isotropy, is the dynamic Young’s modulus parallel to the plane of isotropy, is bulk modulus, is shear modulus, , and is the dynamic Poisson’s ratio. is the rock density, , , , , and are stiffness constants, , , , , and are P- and S-wave velocities in different directions. These elastic constants can be estimated from the bulk density of the material and the P-wave and S-wave velocities measured perpendicular , parallel , and 45° parallel , to the exfoliation plane. The P-wave is compressional wave that are longitudinal in nature. The S-wave is shear waves that are transverse in nature. The most common method of measuring these velocities is through the production of three cylindrical cores obtained from the main sample, as shown in Figure 3 and Figure 4.
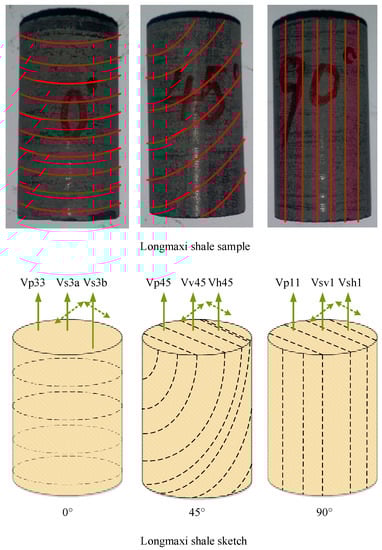
Figure 3.
Schematic showing the three-plug method for anisotropic measurements.
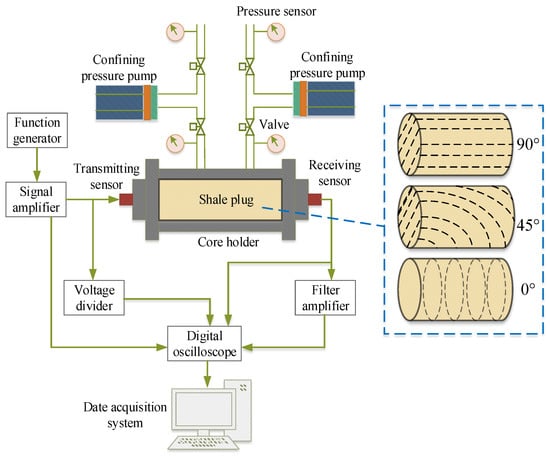
Figure 4.
Supersonic wave test device in high pressure environment.
Figure 5 shows the P- and S-wave velocities in the LMX shale under hydrostatic loading between 0 and 60 MPa. With increasing confining pressure, the P- and S-wave velocities increase gradually and the P-wave velocity is higher than the S-wave velocity.
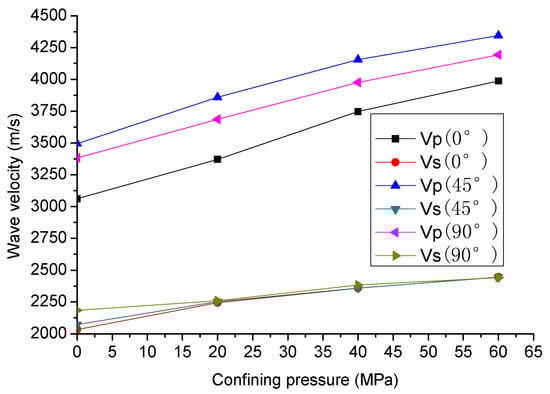
Figure 5.
Evolution of P- and S-wave velocities in the LMX shale under hydrostatic loading.
Figure 6 indicates the dynamic Poisson’s ratio of the LMX shale under confining pressure between 0 and 60 MPa. When compressed in a direction perpendicular to the axis of symmetry, is the dynamic Poisson’s ratio obtained by dividing the strain perpendicular to the direction of compression in the plane of isotropy by the strain parallel to the direction of compression. is the dynamic Poisson’s ratio obtained by dividing the strain parallel to the axis of symmetry by the strain parallel to the direction of compression. is the dynamic Poisson’s ratio obtained by dividing the strain perpendicular to the axis of symmetry by the strain parallel to the axis of symmetry when compared in a direction parallel to the axis of symmetry [27,28]. When the confining pressure is in the range of 0–40 MPa, the Poisson’s ratio and decrease gradually, but the Poisson’s ratio increases.
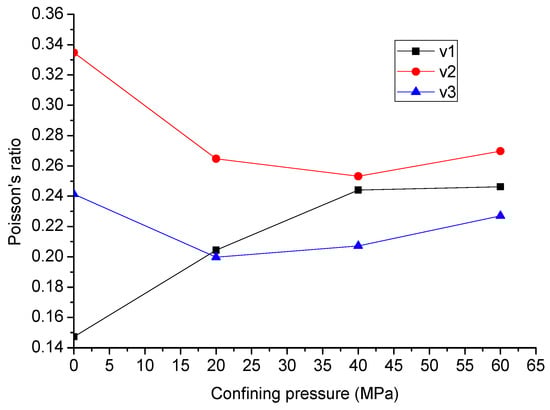
Figure 6.
Dynamic Poisson’s ratio of the LMX shale under confining pressure.
Figure 7 shows the dynamic modulus of the LMX shale under hydrostatic loading between 0 and 60 MPa. The dynamic modulus (, , , )increases with the increasing of the confining pressure. The Young’s modulus is lower than .
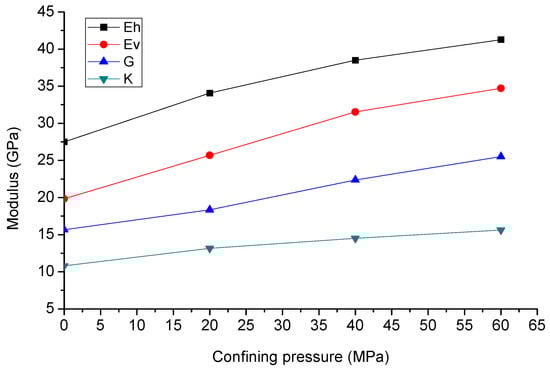
Figure 7.
Dynamic modulus of the LMX shale under hydrostatic loading.
The rock mechanical parameters used in the model are based on field data and laboratory experiments on a horizontal well [29,30]. The target formation is the LMX shale formation. The confining pressure is 25 MPa. The drilling direction is parallel to the shale bedding plane. There are complex contacts between drill bit and rock, and the friction coefficient is identified as 0.2. Material parameters used for the PRD simulation model are summarized in Table 1.

Table 1.
Rock mechanical parameters used in the model.
2.5. Geometry and Mesh of the Model
In order to facilitate the establishment and calculation of the numerical model, the following assumptions are made: the rock internal pore pressure, temperature, and the bottom hole flow field are ignored, but the hydrostatic pressure is considered; repeated fragmentation of cuttings is neglected, and if rock failure occurs, an element is removed from the mesh; The full-scale PDC bit is simplified as a rigid body. Numerical simulation of PRD is investigated by using ABAQUS, as presented in Figure 8; the bit and rock have the same Y-symmetrical axis. The full-scale PDC bit consists of 6 blades on which the cutters are mounted. Bit diameter is 215.9 mm, bit cutter diameter is 16 mm, and the diameter and height of the cylindrical rock sample are set to be 330 mm and 120 mm, respectively. Both the rock and bit were meshed using eight-node hexahedral linear reduced integration elements, among which an hourglass control was considered. The mesh resolution was optimized with respect to the computing resources available. Because of the strong nonlinear of the numerical model, the implicit algorithm was used to calculate the stress field caused by the confining pressure and hydrostatic pressure, the explicit algorithm was used to analyze the bit-rock interaction [31].
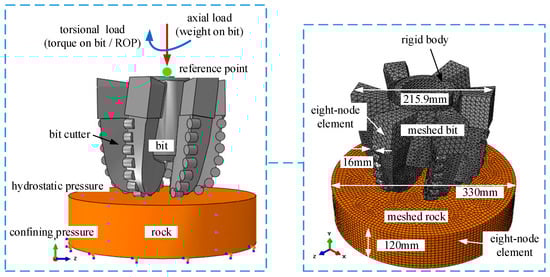
Figure 8.
The 3D full-size bit-rock model geometry and element mesh for PRD.
2.6. Boundary Conditions
This paper focus on dynamic damage of shale under PRD, the boundary conditions of the model are as follows in Table 2. Fixed boundary conditions for the sides and bottom of the rock were applied according to the actual drilling conditions, as shown in Figure 8.
Table 2.
Degree of freedom for the PRD simulation model.
The PRD simulation model of full-scale bit operated under impact load, static load and RPM. The load was applied to the top of the drill bit, and the value of different loads mainly depended on the research problem. The triangle wave shape of impact load is the basic wave form. The input parameters adopted for the model are listed in Table 3. In order to apply the load to the bit, a reference point was built for the rigid bit. The overburden pressure and confining pressure acted on the shale sample by combined explicit-implicit algorithm, which is a beneficial for increasing the calculated efficiency of the numerical simulation model [26,32].
Table 3.
Input parameters adopted for the model.
The modelling progress of PRD with a full-scale PDC bit was as shown in Figure 9, which illustrates the relationship of input parameters and output parameters in the numerical model of PRD. At the same time, the rock constitutive law, rock damage criterion and mechanical parameters were reflected in the model property part. The bit-rock interaction was reflected in the model assembly and interaction part.
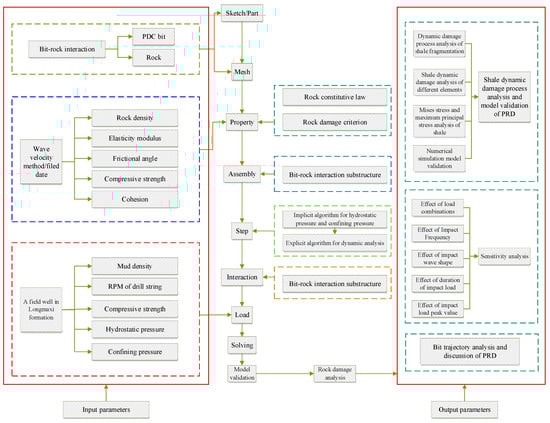
Figure 9.
The modelling progress of PRD with a full-scale PDC bit.
There are so many formulas and parameters in this paper, in order to understand the relationship between parameters of the simulation model. The relationships between parameter types and parameter acquisition methods are listed in Table 4, which presents the parameters that are required as input for the simulation work and what are the parameters that can be measured in the lab and the parameters that should be calculated according to the equations in Section 2.
Table 4.
The relationship of parameter types and parameter acquisition methods.
3. Modelling Results and Discussion
3.1. Shale Dynamic Damage Process Analysis and Model Validation of PRD
3.1.1. Dynamic Damage Process Analysis of Shale Fragmentation
In the 3D numerical simulation model of PRD, an element is removed from the mesh if the damage variable D reaches 0.99. Figure 10 shows the contour plot of the rock damage variable with different drilling times. Figure 10a shows the bit-rock initiation point of PRD. When t = 0 s, the bit isn’t subjected to WOB and TOB, and the rock was in the in-situ condition, therefore, the damage of shale elements did not occur. Figure 10b,c show the bit contacted with shale elements, where the rock produced a certain amount of deformation in the contact elements, but the damage variable D has not reached the threshold of rock element damage failure; therefore, the bit did not break the rock. However, rock element damage failure occurs with the increasing of impact load and static load, as shown in Figure 10d, then immediately separate from the rock mass, the bit has drilled the rock surface. By that same manner, the bit peels off the second layer of shale. The whole process of shale breaking is finished, as show in Figure 10e,f. The numerical simulation of shale dynamic damage can show the entire rock fragmentation process for any drilling condition and provides a basis and system for the design of PRD without complex experimental instruments and field tests, which can reduce the experiment and test costs dramatically [15,26].
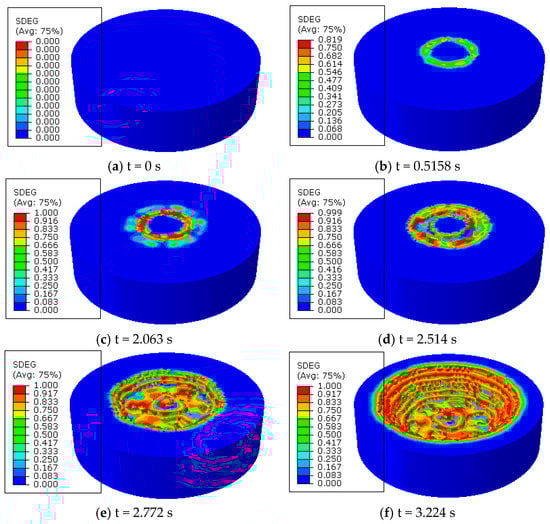
Figure 10.
Contour plot of shale damage variable with different drilling time.
3.1.2. Shale Dynamic Damage Analysis of Different Elements
To analyze the damage sensitivity of the rock elements at different positions, five rock elements were set at the same height but with different radii, as shown in Figure 11. The damage of E2784 occurs earliest, as shown in Figure 12, where the damage variable increased quickly from 0 to 0.05 s, reaching its maximum value of 1 at 2.3 s, but the entire damage process is slow and has fluctuations. The damage of E2476 begins to happen at 1.7 s, reaching its maximum value at 2.5 s; the damage rate of E2476 is faster than E2784. When t = 2.7 s, E2618 and E253 began to experience damage almost at the same time, and failure occurs quickly at 2.75 s. Compared with E2784 and E2476, the damage variables of E2618 and E253 have no fluctuations. Element failure occurs only when the damage variable reaches the value D = 0.99, therefore E1523 is damaged at 3.05 s, but element failure does not occur. When different rock elements have the same drilling and formation conditions, with increasing distance from the element to the rock center, the fluctuations’ amplitudes of rock element damage at first increase and later decrease gradually in PRD. The results show that the rock elements of the bit center produce vibration to the bit, which increases the friction and wear of the bit; however, the rock elements of the bit edge produce shock to the bit, which increases the fracture probability of the bit cutters. This phenomenon is similar to the failure of a drill bit in field drilling conditions. The research results are important to the design and optimization of the drill bit.
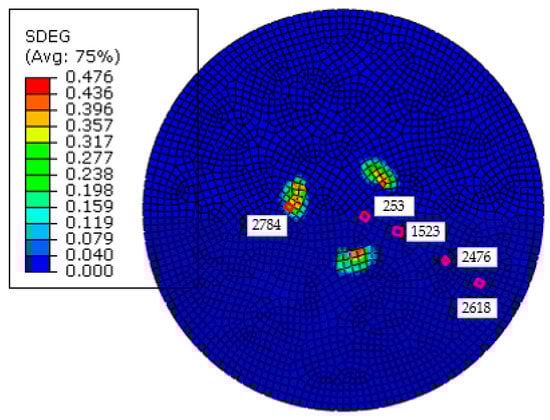
Figure 11.
Five typical elements used for the simulation.
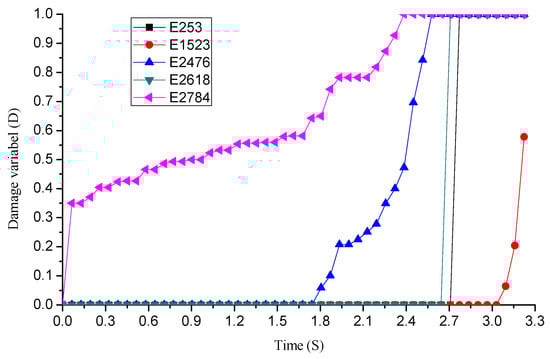
Figure 12.
The damage process of five typical rock elements.
3.1.3. Mises Stress and Maximum Principal Stress Analysis of Shale
The contours of shale Mises stress and maximum principal stress for different drilling times are shown in Figure 13 and Figure 14, respectively. With increasing distance from the rock center to the sides, the maximum principal stress of shale decreases quickly, but the Mises stress of shale increases gradually. However, the rock’s Mises stress is greater than rock’s maximum principal stress at the bottom, and rock failure occurs along the direction of maximum principal stress. The pit has tensile stress, shear stress and compressive stress; shale fragmentation mainly depends on tensile and shear stress in PRD, followed by the compressive stress [15,18,19,20]. The results can be a suggestion to the drilling parameters’ optimization.
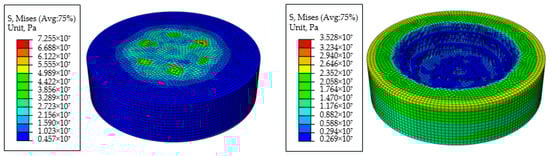
Figure 13.
Mises stress contour of shale (left: t = 1.741 s; right: t = 3.059 s).
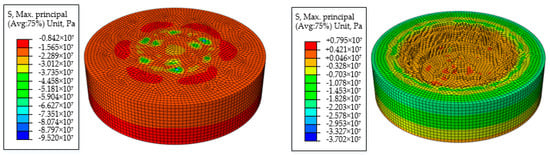
Figure 14.
Maximum principal stress contour of shale (left: t = 1.741 s; right: t = 3.059 s).
3.1.4. Numerical Simulation Model Validation
The numerical simulation model was verified by the actual drilling case in LMX shale reservoir of Sichuan. The simulation results are compared with the field statistics data of ROP. There is a nonlinear relationship in the simulation ROP, as shown in Figure 15. When the drill bit contacts the rock, the rock damage failure gradually occurs. When the damage value reaches the maximum value, the surface rock spalling, ROP increases quickly (0–A), followed by rapid decline (A–B). Because of the geometry of the drill bit, the ROP had a period of stability (B–C). When the bit is completely drilled into the shale (C–D), ROP reaches the peak value (D). The dynamic damage process of PRD is also show in Figure 10. The ROP with impact load is 8.5 m/h, and the ROP without impact load is 7.7 m/h. The basic parameters of this simulation model are from the LMX shale in Sichuan. The latest statistical results of ROP in this area are as shown in Figure 16.
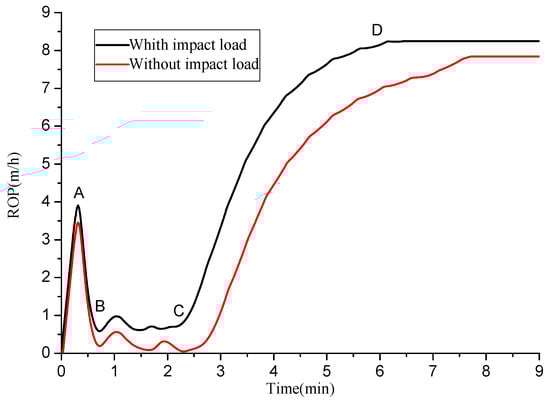
Figure 15.
The simulation results of ROP under PRD and rotary drilling without impact loads.
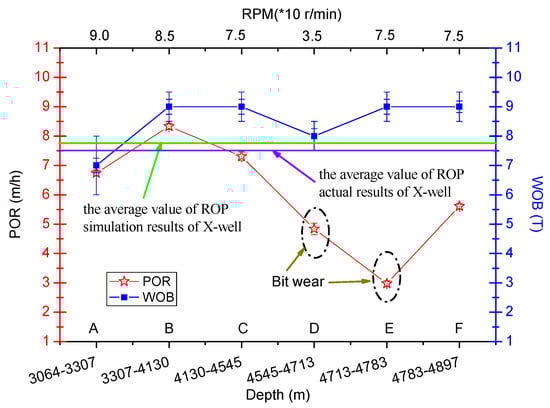
Figure 16.
ROP comparison of actual and simulation in X-well (LMX shale gas reservoir).
The horizontal length of X-well is more than 1000 m, and the cutters fracture and drill bit wear occurs in the D and E sections (4545~4783 m), so we only considered the A, B, C and F Sections, as show in Figure 16. The WOB fluctuation mean of A, B, C and F Sections is 8t, the volatility error is 0.25~0.5 t, RMP is 80 r/min, the average value of actual ROP is 7.5 m/h. At the same block and the same vertical depth, the ROP statistical results (7.5 m/h) of shale are relatively close to the simulation results (7.7 m/h), as shown in Figure 15, which verified the numerical simulation model.
3.2. Sensitivity Analysis of Dynamic Drilling Parameters
3.2.1. Effect of Load Combinations
The damage variable of E2534 for different load combinations is presented in Figure 17. The different load combinations have different damage rate on the rock, the damage rate of shale under coupled impact-static load (PRD) is higher than static load (conventional drilling) and impact load (percussive drilling without RPM). The shale elements failure occurs quickly under dynamic-static force. The damage initiation time is lower than for conventional drilling and percussive drilling, and the damage evolution for PRD requires less time than for percussive drilling. The results show that PRD benefits the efficiency of rock fragmentation [8]. However, rock failure does not occur under impact loads, which because the impact load is small, making the penetration force of each bit cutter get smaller, so the stress value cannot reach shale failure critical condition. Furthermore, the impact time is 0.4 ms, which cannot meet the needs of accumulative failure time. Therefore, when the ROP optimization design is conducted under complex drilling conditions, the mechanical behavior of a single bit cutter should be studied as an independent research unit, and the loads should be assigned to each bit cutters according to the spatial distribution of the bit cutters. Every single cutter can be an effective cutter [11,32].
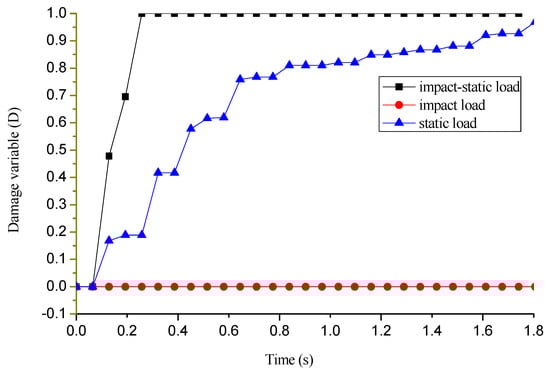
Figure 17.
Damage variable of E2534 for different load combinations.
3.2.2. Effect of Impact Frequency
Figure 18 shows different impact frequency signals, and the damage variable of E2534 under different impact frequencies is presented in Figure 19. The rock damage efficiency under load frequency f = 120 Hz is higher than f = 80 Hz and f = 60 Hz. Rock failure is a damage-cumulative process. If damage cumulatively reaches the critical crack value, the rock elements will peel off from the rock mass. When the impact load has the same peak value, the rock elements contacting with the cutters obtain more energy with the increasing load frequency; this finding suggests that high impact frequency may be used to increase the ROP. However, rock fragmentation efficiency does not grow linearly with load frequency. The impact frequency is limited by the life of PRD tools, and the life of PRD tools is expected to decrease. Considering both the ROP and the life of PRD tools, too high an impact frequency is not suitable for use in PRD.
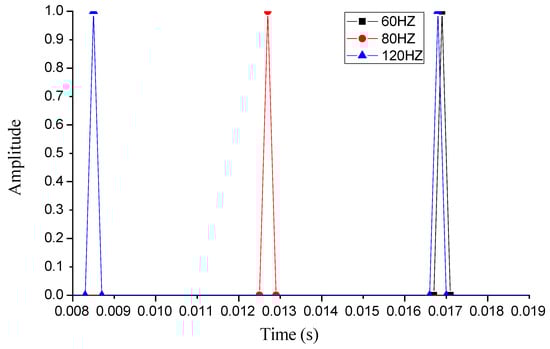
Figure 18.
Different impact frequencies of PRD.
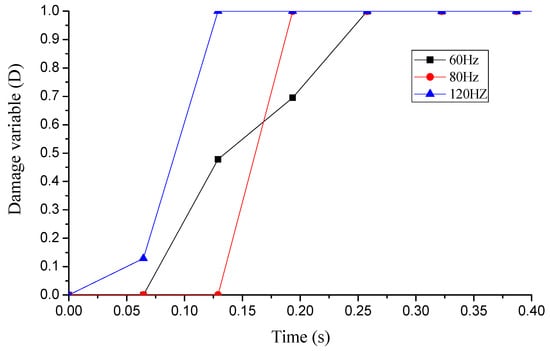
Figure 19.
Damage variable of E2534 under different impact frequencies.
3.2.3. Effect of Impact Wave Shape
Figure 20 shows different impact wave shapes of PRD. Damage variable of E2534 under different impact wave shapes is presented in Figure 21. Shale begins to produce damage at the same time under different impact load wave forms, which has a great influence on ROP. The shale crushing efficiency under a sine shape is higher than rectangular wave or pulse wave. When the value of coupled impact-static load exceeds the rock damage critical value, the envelope area of the shock wave shape is the key factor that influences the breaking efficiency. A sine wave is a type of continuous wave; therefore, the sine wave shape and coupled dynamic-static load always has effect on the entire shale element damage process. Comparing rectangular wave and pulse wave, shale damage efficiency under a rectangular wave is superior to a pulse wave because the effective time of a rectangular wave is longer. The results indicate that the sine wave form should be used to the design of PRD tools [5].
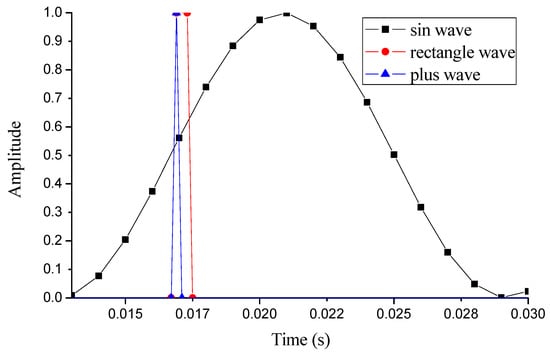
Figure 20.
Different impact wave shapes of PRD.
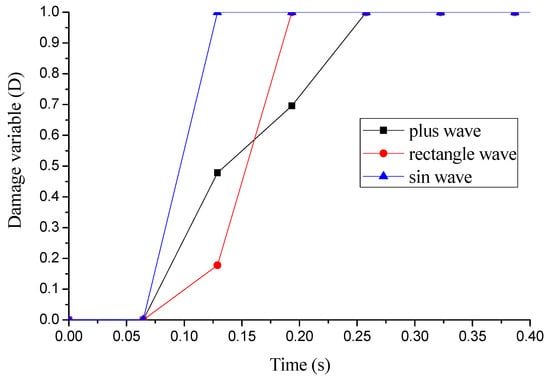
Figure 21.
Damage variable of E2534 under different impact wave shapes.
3.2.4. Effect of Duration of Impact Load
Figure 22 shows different durations of impact load of PRD. Damage variable of E2534 for different durations of impact load is presented in Figure 23. Rock breaking efficiency under the duration of an impact load for 8 ms is higher than that of 4 ms and 0.4 ms. When the load duration is t = 8 ms and t = 4 ms, the damage rate increases suddenly at 0.13 s. Although the duration of the three impact loads is different, the peak value of the impact load is the same, which is able to break the shale. There is a close relationship between crushing efficiency and time beyond the critical value of rock fragmentation. The rock can obtain more energy to be broken with an increase of duration of the impact load. At this time, the crushing efficiency is similar to the form of the impact load wave, focusing on input energy for the rock. The increase of impact load duration is of benefit for the increase of ROP.
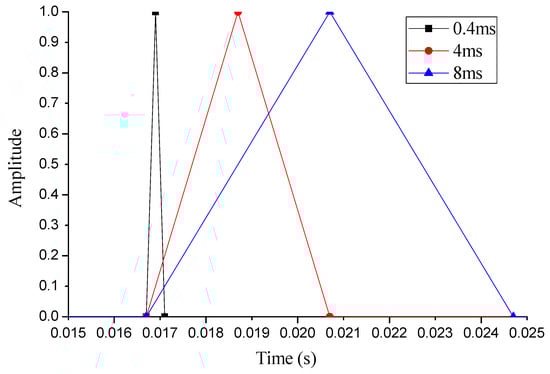
Figure 22.
Different durations of impact load of PRD.
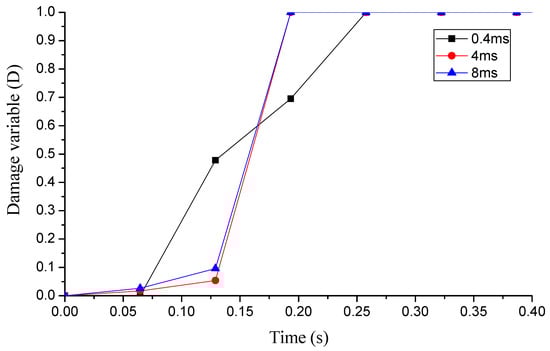
Figure 23.
Damage variable of E2534 under different durations of impact load.
3.2.5. Effect of Impact Load Peak Value
Figure 24 shows different peak values of impact loads of PRD. The damage variable of E2534 for different peak values of impact load is presented in Figure 25. Rock damage happens first under peak load Fi = 40 kN, followed by Fi = 20 kN and Fi = 30 kN. Rock failure occurs first under Fi = 40 kN, but the whole process of shale element failure is slow; damage values continue to increase. When Fi = 30 kN and Fi = 20 kN, rock element failure occurs almost at t = 0.25 s. However, the rock damage rate under Fi = 30 kN is faster than Fi = 20 kN. The rock can be broken by three peak values, and fragmentation efficiency of the rock is improved with the increase of the peak value. Because the change in peak value amplitude is small, each cutter of the bit gets less stress, and the breaking effect is not obvious in Figure 25. Moreover, the coupled impact-static load goes over the rock failure threshold; so the higher the peak value of the impact load, the more input energy the rock will obtain. The peak value of impact load is one of the most important dynamic drilling parameters of PRD.
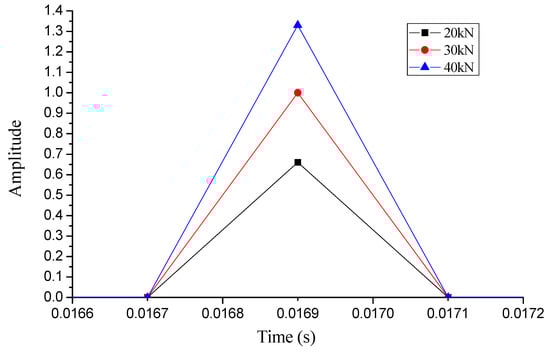
Figure 24.
Different peak values of impact loads of PRD.
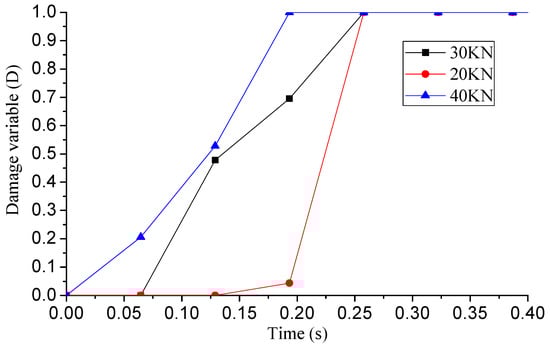
Figure 25.
Damage variable of E2534 under different peak values of impact loads.
3.3. Bit Trajectory Analysis and Discussion of PRD
The drill bit trajectory and damage variable of shale under different PRD drilling parameters is as shown in Figure 26 and Figure 27, respectively. Drill bit trajectory is an important characteristic of drilling engineering, which has a close relationship with ROP and borehole quality. However, there is little research about this aspect [1,2,3,7,8,9,14,17,18,19]. A typical 3D bit trajectory of PRD is presented in Figure 26a, which based on the model of PRD, as shown in Table 3. The 3D bit trajectory is a spiral shape. The fluctuation range of drill bit in the XY plane is −0.00015~0.00015 m in one, and the other is less than −0.00015~0.00015 m. During the initial stage of PRD, shale element failure does not occur, there is no ROP, and the drill bit just slightly fluctuates on the surface of the shale specimen. When the surface of the shale specimen is broken, the bit drills the rock fast, as shown in Figure 10 and Figure 15.
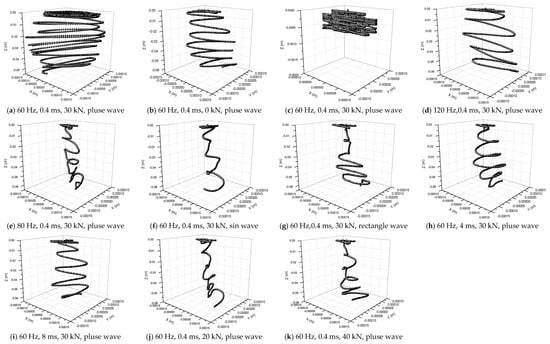
Figure 26.
3D drill bit trajectory of PRD.
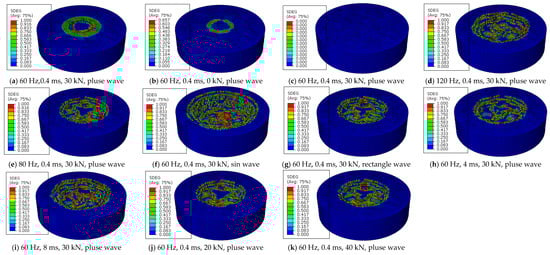
Figure 27.
Contour plot of damage variable of shale at 0.3224 s.
The movement trajectory of the drill bit is quite different in PRD. Some important laws were found. In comprehensive contrast analysis of Figure 26 and Figure 27, when the impact frequency is 60 Hz, impact is 0.4 ms, the peak value of impact force is 30 kN, and impact wave is sine wave, the ROP is at a maximum value, as show in Figure 26f and Figure 27f. The minimum ROP is show in Figure 26c and Figure 27c. Moreover, the higher the lateral vibration amplitude, the lower the efficiency of rock fragmentation [22]. Repeated instances of drill bit axial vibration for one indentation point will reduce the ROP. This law explains the reason that the lateral and axial random vibration of drill string or drill bit will reduce the ROP.
A clear contradiction between previous studies’ measures was encountered. Suppressing drill bit and drill string vibration increase the ROP [1,2,22], and applied vibration and shock loads of the bit and drill string increase the ROP, such as in PRD and percussive drilling without RPM [3,4,15]. From an energy point of view, the energy of a drill bit and drilling system was transmitted to the wellbore by lateral vibration. If a reasonable relationship of drill string axial vibration signal and RPM cannot be established, which will cause duplicate rock crushing, then the axial vibration energy of the bit is consumed. Therefore, small lateral movement and reasonable axial vibration frequency increases the energy efficiency of rock breaking. The results indicate that the ROP was increased through the suppression of drill string and the application vibration, which is a benefit for the design of bottom hole assembly and drilling tools.
The model proposed in this paper does not consider the changes of bit deformation and wear. Moreover, a new coupled bit-rock model of PRD considering the mixed vibration conditions should also be developed. In the future study, we need to combine the accurate measurement data of the near-bit and the numerical model. In order to validate and improve the applicable scope of the numerical model. We need to establish an experimental device for PRD.
4. Conclusions
Considering load combinations, impact frequency, impact wave shapes, durations of impact load and impact load peak values, a model for estimating the PRD of the full-size PDC bit was developed. The anisotropic parameters of shale are obtained by wave velocities. The numerical simulation model is verified by the actual drilling case in the LMX shale reservoir of Sichuan (China). The entire process of rock damage and elements in different positions are discussed. The PRD model is able to estimate the rock damage efficiency. Drill bit trajectory is an important characteristic of drilling engineering, which has a close relationship with ROP and borehole quality. The higher the lateral vibration amplitude, the lower the efficiency of rock fragmentation. Repeated instances of drill bit axial vibration for one indentation point will reduce the ROP. A small lateral movement and reasonable axial vibration frequency increase the energy efficiency of rock breaking. The ROP was increased through the suppression of drill string and the application of vibration. The relationship of drill string vibration and ROP is the key research problem in the future.
Author Contributions
All authors have worked on this manuscript together and all authors have read and approved this manuscript.
Funding
This research was funded by [National Science and Technology Major Project] grant number [2016ZX05022001], [National Science and Technology Major Project] grant number [2016ZX05028001], [Major National Basic Research Development Program of China (973 Program)] grant number [2013CB228003], [Science and Technology Support Program of Sichuan Province] grant number [2015SZ0003].
Acknowledgments
The authors appreciate Anping Tong and Heyi Yuan for their contributions to the experimental work and modelling test work. We are immensely grateful to the anonymous reviewers and editors for their constructive comments and suggestions to improve this paper.
Conflicts of Interest
The authors declare no conflict of interest.
References
- Dong, G.J.; Chen, P. A Review of the Evaluation, Control, and Application Technologies for Drill String Vibrations and Shocks in Oil and Gas Well. Shock Vib. 2016, 2016, 7418635. [Google Scholar] [CrossRef]
- Dong, G.J.; Chen, P.; Deng, Y.Z.; Guo, Z.X. A literature review of researches on drillstring vibration suppression. J. Southwest Pet. Univ. Sci. Technol. Ed. 2016, 38, 121–134. [Google Scholar]
- Harpst, W.E.; Davis, E.E. Rotary percussion drilling. Oil Gas J. 1949, 11, 10–15. [Google Scholar]
- Hustrulid, W.A.; Fairhurst, C. A theoretical and experimental study of the percussive drilling of rock part I—theory of percussive drilling. Int. J. Rock Mech. Min. Sci. Geomech. Abstr. 1971, 8, 311–333. [Google Scholar] [CrossRef]
- Whiteley, M.C.; England, W.P. Air drilling operations improved by percussion-bit/hammer-tool tandem. SPE Drill. Eng. 1986, 1, 377–382. [Google Scholar] [CrossRef]
- Green, S.J.; Judzis, A.; Curry, D.; Black, A.D.; Prasad, U.; Rogers, J.D. Single Cutter Testing Improves Understanding of Deep-Well Hammer Drilling Performance. In Proceedings of the SPE Annual Technical Conference and Exhibition, Dallas, TX, USA, 9–12 October 2005. [Google Scholar]
- Han, G.; Bruno, M.S.; Dusseault, M.B. 3D simulation of rock breakage with air hammers in gas-well drilling. In Proceedings of the SPE Gas Technology Symposium, San Antonio, TX, USA, 24–27 September 2006. [Google Scholar]
- Zhao, F.J.; Li, X.B.; Feng, T.; Xie, S.Y. Theoretical analysis and experiments of rock fragmentation under coupling dynamic and static loads. Chin. J. Rock Mech. Eng. 2005, 24, 1315–1320. [Google Scholar]
- Su, O.; Akcin, N.A. Numerical simulation of rock cutting using the discrete element method. Int. J. Rock Mech. Min. Sci. 2011, 48, 434–442. [Google Scholar] [CrossRef]
- Dong, G.J.; Chen, P. Anisotropy indentation fragmentation mechanism of shale under coupled loads and different deviation angles. Electron. J. Geotechn. Eng. 2017, 22, 981–995. [Google Scholar]
- Menezes, P.L.; Lovell, M.R.; Avdeev, I.V.; Iii, C.F.H. Studies on the formation of discontinuous rock fragments during cutting operation. Int. J. Rock Mech. Min. Sci. 2014, 71, 131–142. [Google Scholar] [CrossRef]
- Lin, Y.H.; Shi, T.H.; Li, R.F.; Zeng, D.Z.; Liu, X.X.; Zhang, D.P. Simulation of impact force and penetration rate of air hammer bit drilling. Chin. J. Rock Mech. Eng. 2005, 18, 023. [Google Scholar]
- Chiang, L.E.; Elias, D.A. A 3D FEM methodology for simulating the impact in rock-drilling hammers. Int. J. Rock Mech. Min. Sci. 2008, 45, 701–711. [Google Scholar] [CrossRef]
- Huang, Z.Q.; Fan, Y.T.; Wei, Z.Q.; Tan, L.; Bu, Y. Simulation study on rock-breaking mechanism of percussion-rotary bit. J. Southwest Pet. Univ. Sci. Technol. Ed. 2010, 1, 029. [Google Scholar]
- Zhu, X.; Tang, L.; Tong, H. Effects of high-frequency torsional impacts on rock drilling. Rock Mech. Rock Eng. 2014, 47, 1345–1354. [Google Scholar] [CrossRef]
- Wang, S.Y.; Sloan, S.W.; Liu, H.Y.; Tang, C.A. Numerical simulation of the rock fragmentation process induced by two drill bits subjected to static and dynamic (impact) loading. Rock Mech. Rock Eng. 2011, 44, 317–332. [Google Scholar] [CrossRef]
- Tulu, I.B.; Heasley, K.A. Calibration of 3d cutter-rock model with single cutter tests. In Proceedings of the 43rd US Rock Mechanics Symposium & 4th US—Canada Rock Mechanics Symposium, Asheville, NC, USA, 28 June–1 July 2009; American Rock Mechanics Association: Alexandria, VA, USA, 2009. [Google Scholar]
- Kou, S.Q.; Lindqvist, P.A.; Tang, C.A.; Xu, X.H. Numerical simulation of the cutting of inhomogeneous rocks. Int. J. Rock Mech. Min. Sci. 1999, 36, 711–717. [Google Scholar] [CrossRef]
- Liu, H.Y.; Kou, S.Q.; Lindqvist, P.A.; Tang, C.A. Numerical simulation of the rock fragmentation process induced by indenters. Int. J. Rock Mech. Min. Sci. 2002, 39, 491–505. [Google Scholar] [CrossRef]
- Liu, H.Y.; Kou, S.Q.; Lindqvist, P.A. Numerical studies on Bit-Rock fragmentation mechanisms. Int. J. Geomech. 2008, 8, 45–67. [Google Scholar] [CrossRef]
- Dong, G.J.; Chen, P. The vibration characteristics of drillstring with positive displacement motor in compound drilling Part 1: Dynamical modelling and monitoring validation. Int. J. Hydrogen Energy 2018, 43, 2890–2902. [Google Scholar] [CrossRef]
- Ghasemloonia, A.; Rideout, D.G.; Butt, S.D. A review of drillstring vibration modeling and suppression methods. J. Pet. Sci. Eng. 2015, 131, 150–164. [Google Scholar] [CrossRef]
- Dong, G.J.; Chen, P. The vibration characteristics of drillstring with positive displacement motor in compound drilling Part 2: Transient dynamics and bit control force analysis. Int. J. Hydrogen Energy 2018, in press. [Google Scholar] [CrossRef]
- Liebe, T.; Willam, K. Localization properties of generalized Drucker-Prager elastoplasticity. J. Eng. Mech. 2001, 127, 616–619. [Google Scholar] [CrossRef]
- Lemaitre, J. A continuous damage mechanics model for ductile fracture. J. Eng. Mater. Technol. 1985, 107, 83–89. [Google Scholar] [CrossRef]
- Zhong, Z. Finite Element Procedures for Contact-Impact Problems; Oxford University Press: Oxford, UK, 1993. [Google Scholar]
- Hornby, B.E. Experimental laboratory determination of the dynamic elastic properties of wet, drained shales. J. Geophys. Res. Solid Earth 1998, 103, 29945–29964. [Google Scholar] [CrossRef]
- Podio, A.L.; Gregory, A.R.; Gray, K.E. Dynamic properties of dry and water-saturated Green River shale under stress. Soc. Pet. Eng. J. 1968, 8, 389–404. [Google Scholar] [CrossRef]
- Dong, G.J.; Chen, P. A comparative experiment investigate of strength parameters for Longmaxi shale at the macro- and mesoscales. Int. J. Hydrogen Energy 2017, 42, 20074–83. [Google Scholar] [CrossRef]
- Dong, G.J.; Chen, P. A comparative experiment study of shale indentation fragmentation mechanism at the macroscale and mesoscale. Adv. Mech. Eng. 2017, 9, 1687814017726244. [Google Scholar] [CrossRef]
- Saksala, T. Numerical modelling of bit-rock fracture mechanisms in percussive drilling with a continuum approach. Int. J. Numer. Anal. Methods Geomech. 2011, 35, 1483–1505. [Google Scholar] [CrossRef]
- Liu, S.; Chang, H.; Li, H.; Cheng, G. Numerical and experimental investigation of the impact fragmentation of bluestone using multi-type bits. Int. J. Rock Mech. Min. Sci. 2017, 91, 18–28. [Google Scholar] [CrossRef]
© 2018 by the authors. Licensee MDPI, Basel, Switzerland. This article is an open access article distributed under the terms and conditions of the Creative Commons Attribution (CC BY) license (http://creativecommons.org/licenses/by/4.0/).