Article

Heat Generation Characteristics of LiFePO4 Pouch Cells with Passive Thermal Management

Department of Mechanical Engineering, University of Kansas, Lawrence, KS 66046, USA
*
Author to whom correspondence should be addressed.
These two authors contributed equally to this work.
Energies 2018, 11(5), 1243; https://doi.org/10.3390/en11051243
Submission received: 6 April 2018 / Revised: 25 April 2018 / Accepted: 7 May 2018 / Published: 14 May 2018
(This article belongs to the Section D: Energy Storage and Application)

Abstract

:
This article experimentally investigates the heat generation characteristics and the effectiveness of passive cooling of commercially available LiFePO4 (7.25 mm × 160 mm × 227 mm, 19.5 Ah) cells using different cooling materials. The specific heat capacity and the entropy coefficient of the cell are experimentally measured. The heat generation rate of the cell at 1–4 C current rates are also determined using three different methods: (1) the heat absorption calculated from the temperature increase of cooling water; (2) the energy loss calculated from the difference between the operating voltage and open circuit voltage; and (3) the energy loss during a charge-discharge cycle calculated using the voltage difference between charging and discharging. Results show that the heat generation rate estimated from heat absorbed by the water can be underestimated by up to 47.8% because of the temperature gradient within the cell and on the surface. The effectiveness of different passive cooling materials is compared at discharge current rates of 1–3 C. The average increase of the cell surface temperature is 22.6, 17.1, 7.7, 7.2 and 6.4 °C at 3 C (58.5 A) using air, aluminum foam, octadecane, water with aluminum foam and water, respectively.

1. Introduction

The progress of electrification in automotive applications relies heavily on the advance of battery technologies. Lithium-ion batteries provide longer life, better safety and higher energy/power densities than other rechargeable batteries [1]. Both symmetrical and asymmetrical charging and discharging at higher rates are required in automotive applications. The elevated temperatures during the charging and discharging have detrimental effects on battery life and efficiency and may even lead to unwanted fire hazards [2]. Hence, study of the thermal behavior of batteries is crucial to designing efficient thermal management systems and improve the performance and safety of lithium-ion batteries.
Heat generation in a battery is a complex process [3]. In order to investigate the thermal behavior or heat generation of the battery, understanding fundamental battery properties, such as its specific heat and entropy change, is very important. Thus, some studies have experimentally measured such properties of certain types of lithium-ion batteries [4,5,6,7,8]. The specific heat capacity plays an important role in determining the temperature increase in a cell with a given amount of heat generation [3,4,5,6,7,9]. Similarly, entropy change rate with temperature, which depends on the battery chemistry and temperature, is crucial to determining the reversible heat generation rate.
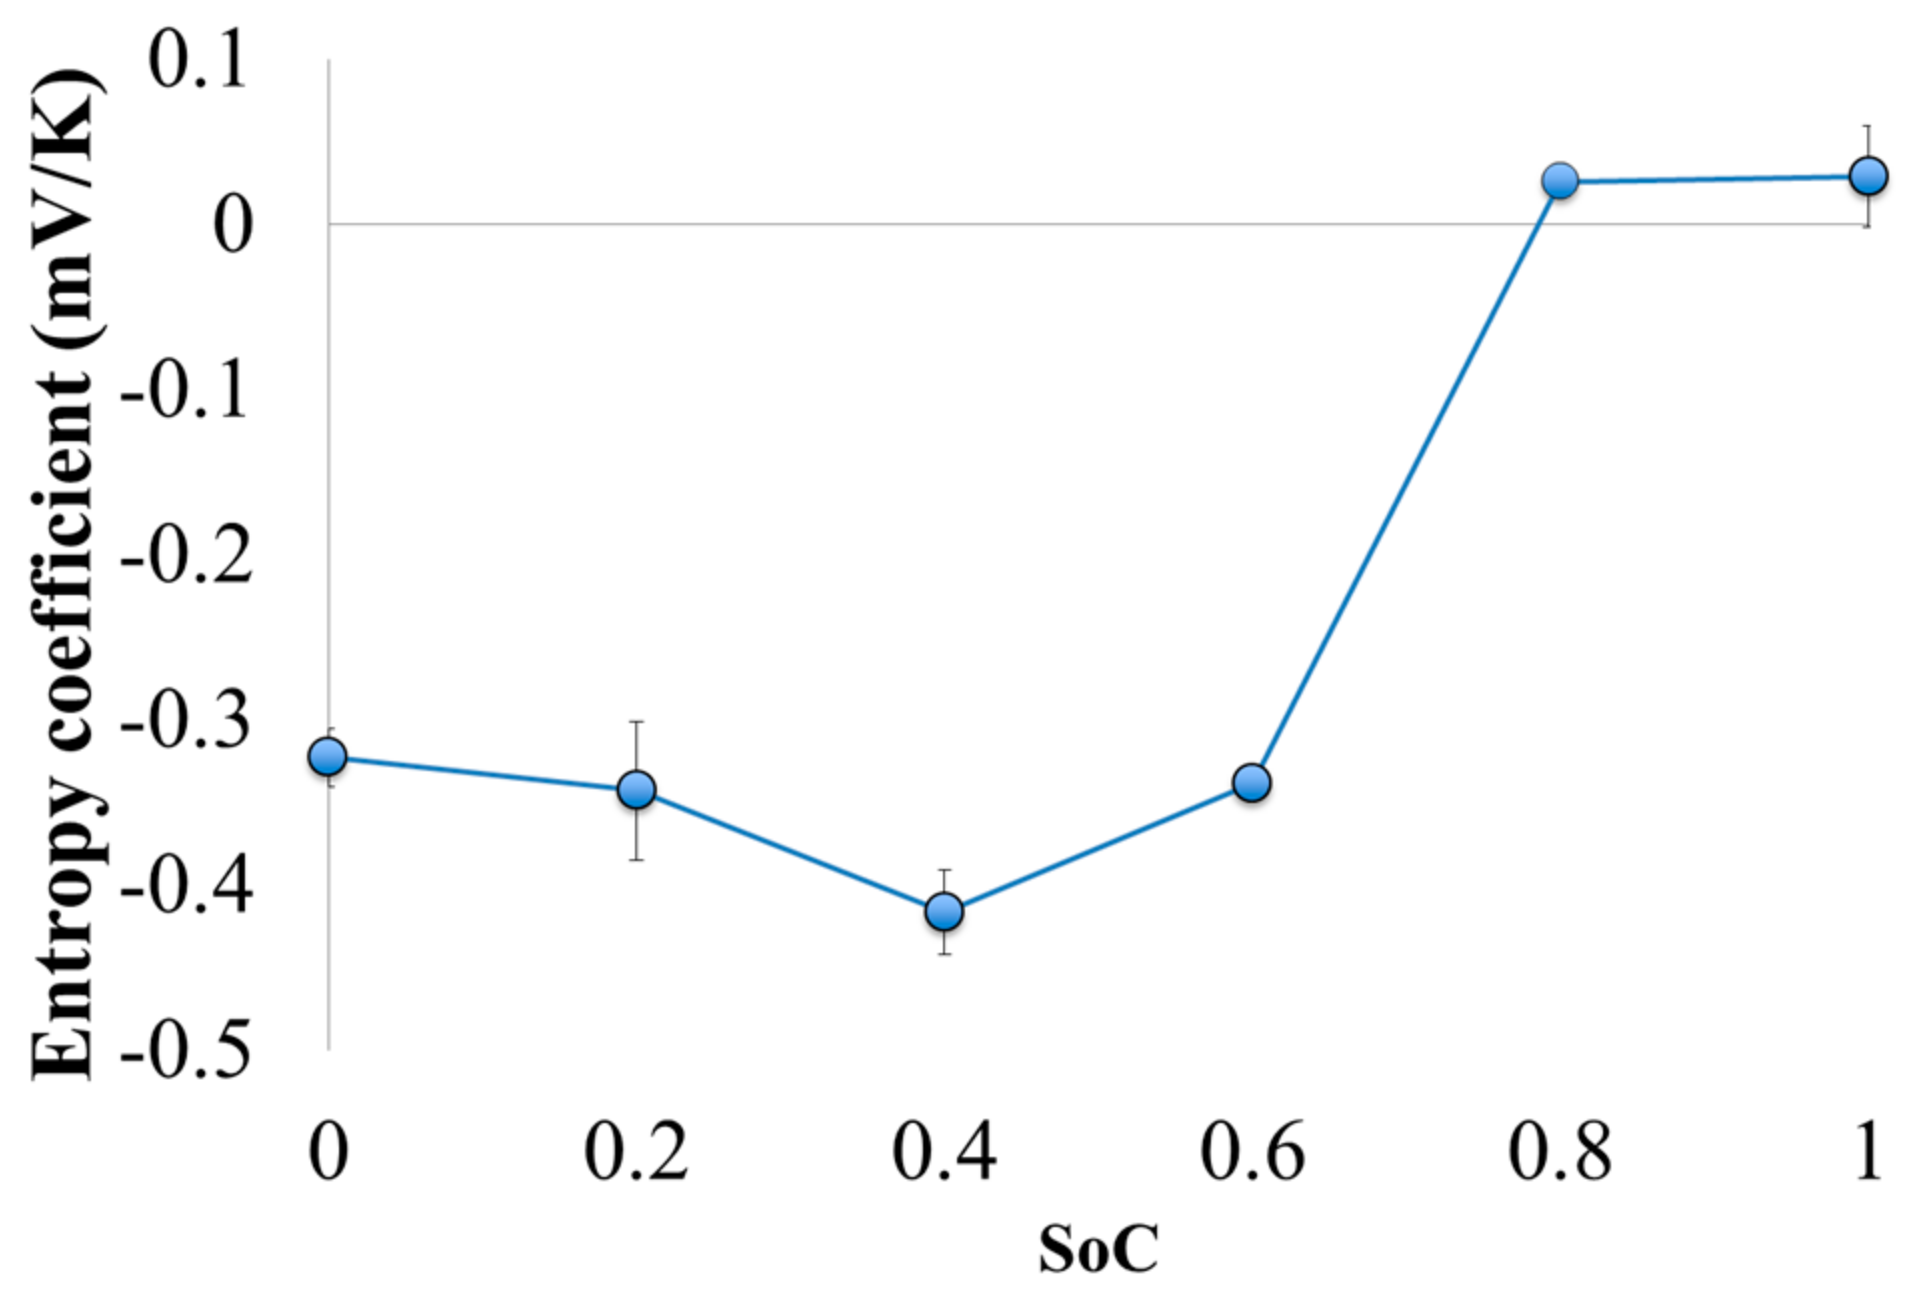
Lin et al. [4] characterized the heat generation of a prismatic cell using an accelerated rate calorimeter. The heat generated by the cell was calculated using the measured specific heat capacity and temperature increase data. Specific heat capacity was measured using an assembly where the heater with a constant heat flux was sandwiched between two cells placed in an adiabatic chamber. The specific heat of the cell was determined to be 1067 J kg−1 K−1. The cell changed from an endothermic state, initially, to an exothermic state when it was charged and discharged at the current rate of 0.33 C due to the effect of the reversible heat. The trend of heat generation at 1 C and 2 C current rates during discharging also showed endothermic followed by exothermic thermal behavior. Charging at 1 C and 2 C current rates, however, did not exhibit the endothermic behavior. They concluded that, even for well-designed large batteries, Joule heating in the current collectors is higher than reversible heat. It was seen that the trends of heat generation rate during both charging and discharging were nonlinear and S-shaped. To determine the reversible heat rate, the entropy coefficient was determined by measuring the open circuit voltage (OCV) values at different temperatures. The entropy coefficients changed from negative to positive at the state of charge (SoC) of 0.4.
Bandhauer et al. [6] also calculated the reversible heat generation using the entropy coefficient. It was determined from the slope of OCV with temperature (with the temperature range of 15–55 °C) at a required SoC. The irreversible heat generation rate was evaluated using the cell overpotential. The heat generation rate increased with an increase in current rate. The entropy coefficients were found to be within a range of ±9.93 μV K−1 to ±13.43 μV K−1 for the two battery samples they tested. They concluded that the heat generation rate is a strong function of ambient temperature between 15 °C and 55 °C, especially at high current rates, because both transport properties and kinetics are functions of temperature in lithium-ion batteries. At low temperature, the irreversible heat increased with the decrease of temperature due to mass transport and kinetic limitations, whereas the reversible potential is not a strong function of temperature.
Chen et al. [10] investigated the heat generation rate as well as the efficiency of 20-Ah LiFePO4 lithium-ion pouch cell at different temperatures (−10 to 40 °C). The battery was sandwiched between two high-density polyethylene plates 4 times thicker than the battery. A 10-W heater was used to calibrate the calorimeter. They illustrated that the heat generation increased with the increase of the discharge current rate. At low discharge current rate (0.25 C), the heat was endothermic. The heat generation was found to decrease with the increase in temperature due to the increased rates of mass transport and reduced activation loss, which reduced overpotential during discharge. They also showed that the battery capacity increased with the increase of the temperature due to the higher ionic conductivity at a higher temperature. The preferred operating temperature of the prismatic lithium-ion battery was between 30 °C and 40 °C.
Chen et al. [11] studied the effect of several passive cooling materials on lithium-ion battery performance. They compared the performance of air with the mixture of water and ethylene glycol (50–50 vol). The battery capacity decreased by 95% when the ambient temperature was lowered from 20 °C to −10 °C due to the decrease in ionic conductivity and slowdown of electrochemical reactions of the battery. The optimum operating temperature was found to be between 20 °C and 30 °C, where the capacity of the battery was near the maximum and the performance degradation was minimized. A comparison between the battery capacity using water-ethylene glycol and air at 20 °C showed that, although the water ethylene glycol mixture helped in maintaining lower battery surface temperature, higher capacity was obtained when the battery was cooled by air because of the higher temperature of the air-cooled battery.
Alipanah et al. [12] numerically studied passive thermal management systems of lithium-ion batteries made from pure octadecane, pure gallium and octadecane-aluminum foam composite materials at different heat fluxes and metal foam porosities. They concluded that convective heat transfer was one of the most important factors affecting the battery surface temperature uniformity.
Many studies [3,4,5,6,7,8,11,13] reported in the literature are based on cylindrical or prismatic cells. Pouch cells are more compact and have higher packing efficiency compared to other types of cells (cylindrical cell, coin cell, and prismatic cell) and are widely used in vehicular operations. Hence, large pouch cells with high capacity have been an interest of study. The compact design and high specific energy of pouch cells brings more challenges to thermal management, since there is less empty space for the thermal management system. In addition, the non-homogeneous reactions and charge transfer within the cell may result in high temperature difference. Therefore, pouch cells with large size face more challenges with regard to maintaining a uniform temperature on the surface, especially at high current rates. In the case of high-capacity cells, many experimental studies have been limited to a maximum current density of 2 C, which might not be enough for high-power applications during the acceleration and fast charging of electric vehicles.
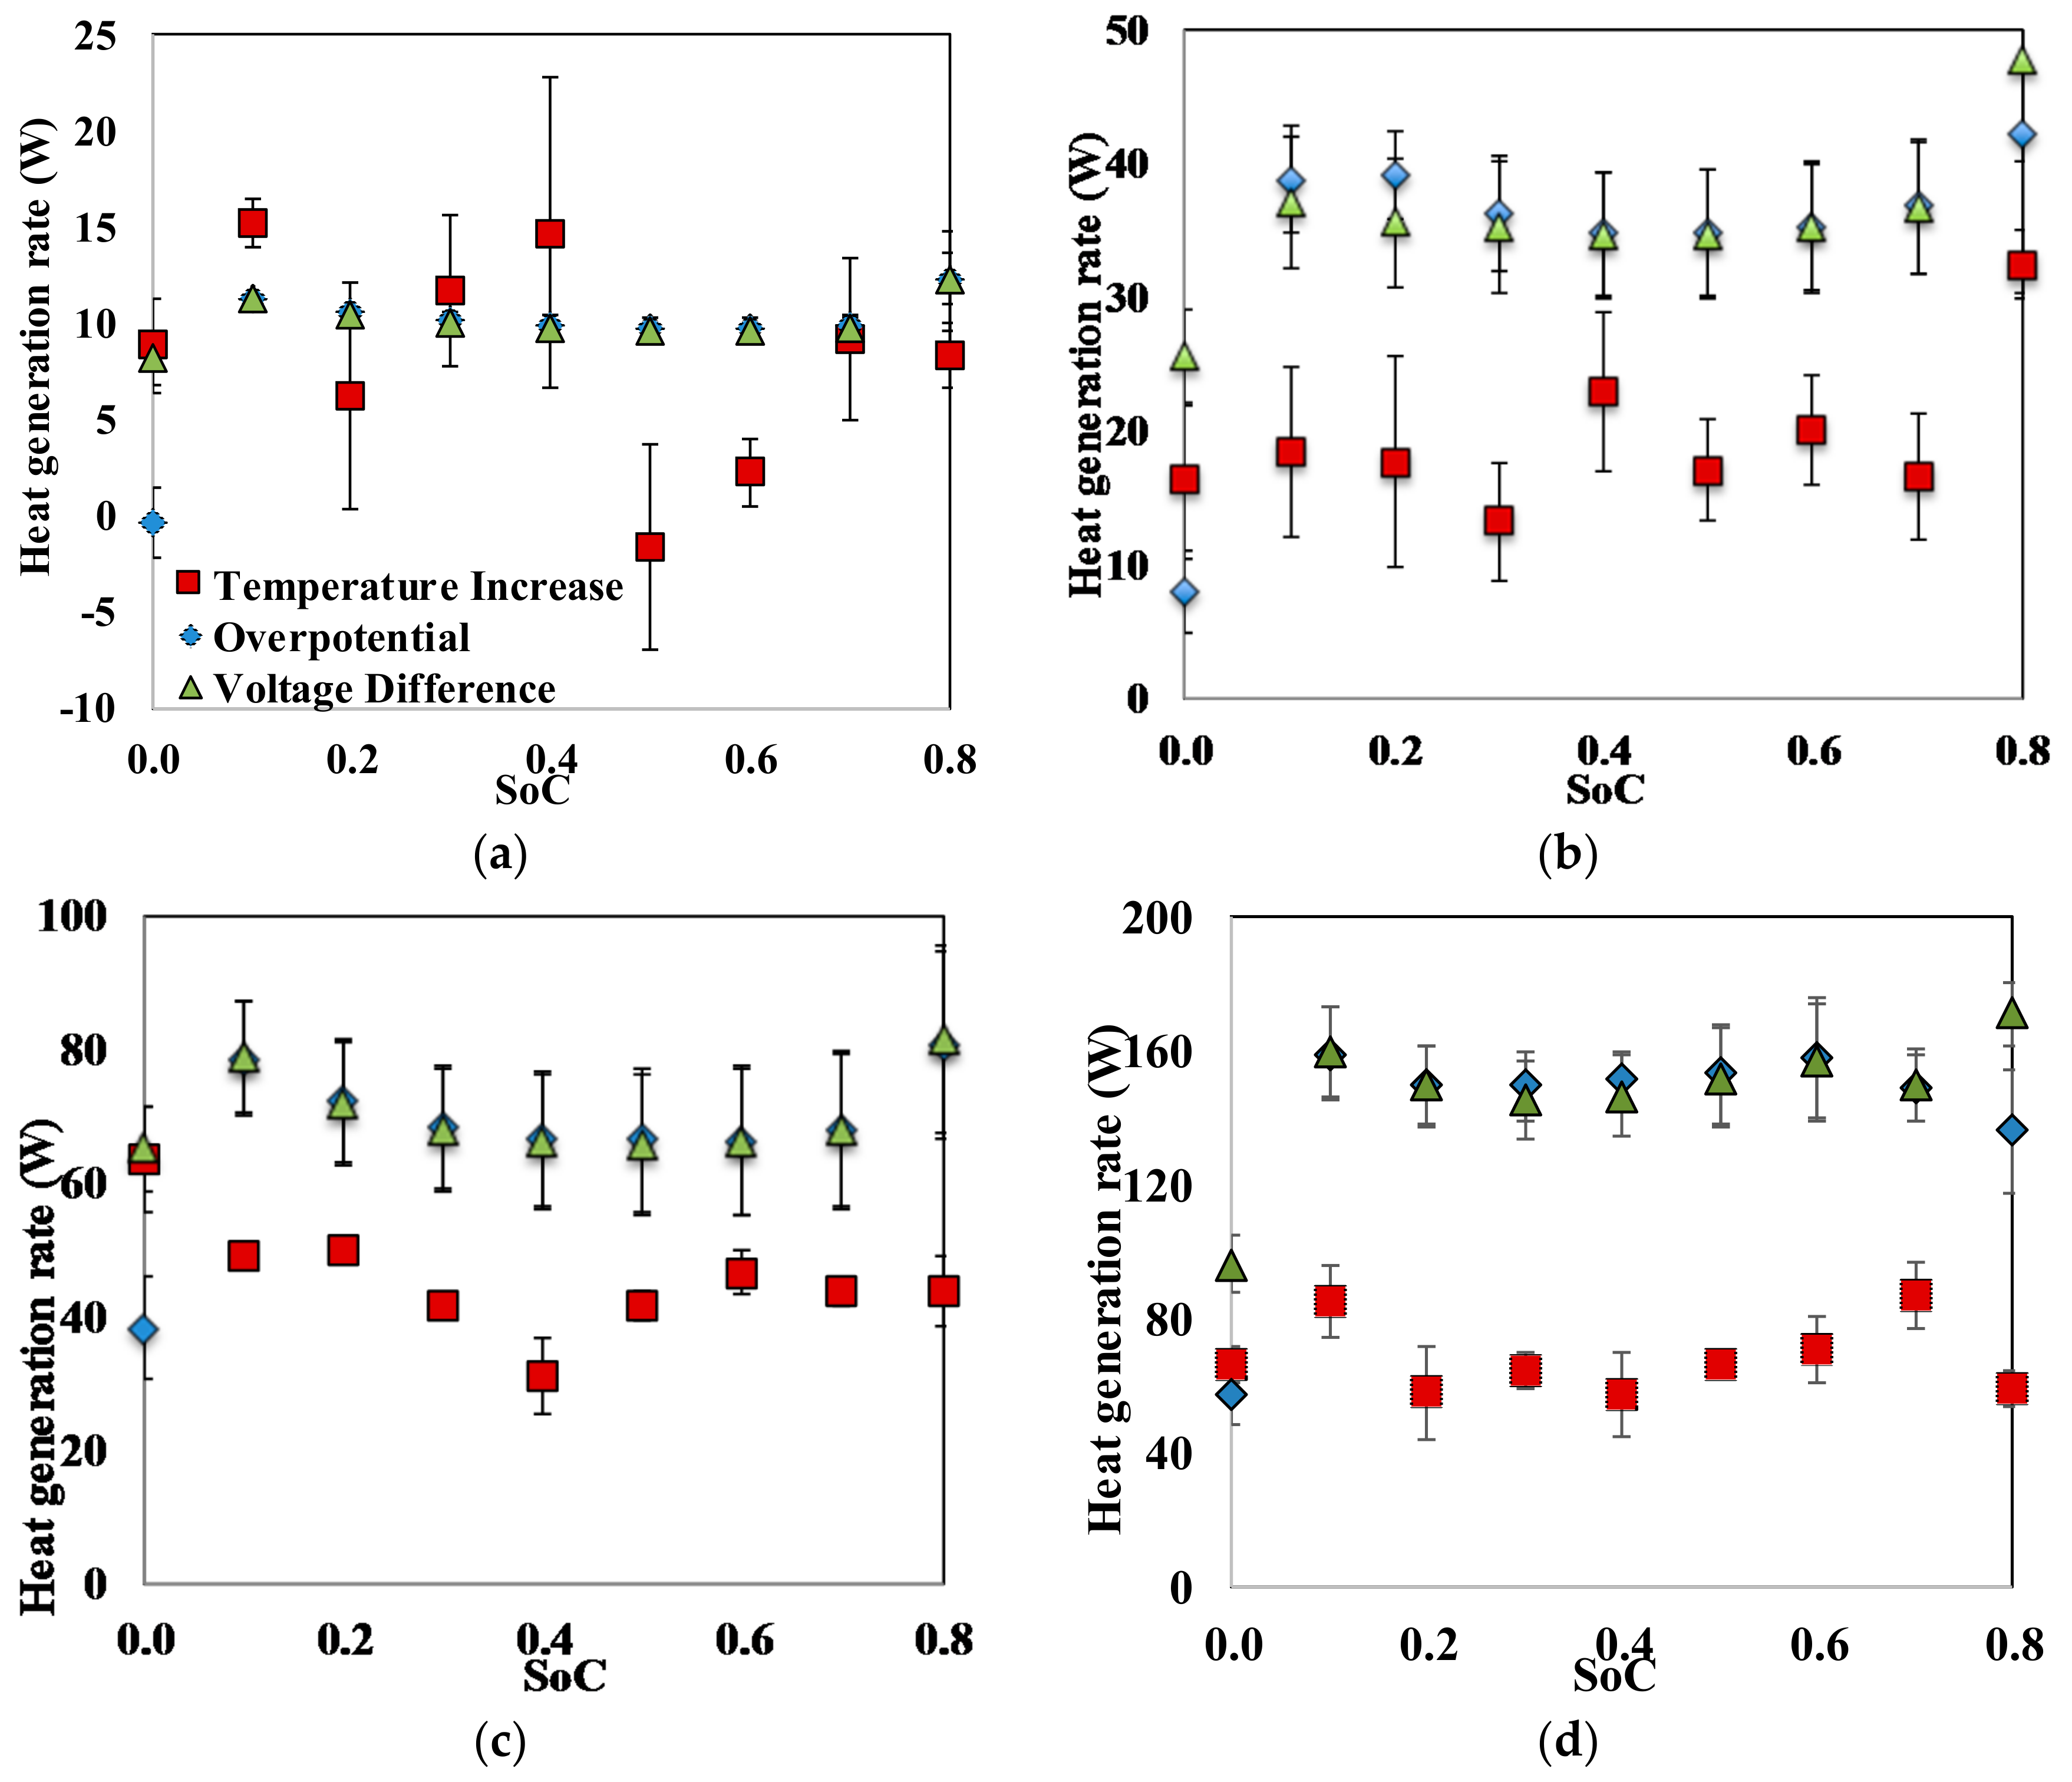
This study first estimates, by experiments, battery thermal properties such as the entropy coefficient and heat capacity, which are important parameters for predicting battery thermal behavior and lifetime under any given operating conditions. Second, the heat generation characteristics of cells during charging and discharging cycles have been tested. There are several approaches for estimating the heat generation rate of a battery. Estimations from different approaches could vary significantly because of the accuracy of experimental approaches, errors and uncertainties of measurements, and accuracies of instruments. Thus, this study quantifies the different heat generation rates predicted by different measurement approaches. The thermal properties and heat generation characteristics of the large LiFePO4 pouch cells measured in this study facilitate the simulation, health monitoring [14], and design of control and management systems [15]. Third, the temperature gradient within the battery (in both in-plane and through-plane directions) could be very high, especially at high current rates. The measurement of temperature difference caused by non-homogeneous heat generation is necessary to design effective thermal management systems. Therefore, this study measures the temperature gradient in the through-plane direction and compares the effectiveness of five different passive cooling materials (air, aluminum foam, phase change material (PCM), water, and water with aluminum foam). The experimental evidence of high temperature difference (more than 30 °C) on the battery surface highlight the urgent need for effective thermal management to remove the temperature gradient within a cell and stacks of cells.

2. Experimental Apparatus and Procedure

Commercially available LiFePO4 pouch cells with 19.5 Ah capacity provided by Smith Electric Vehicles were measured in this study. The cells have dimension of (7.25 × 160 × 227) mm3, nominal voltage of 3.3 V, and energy density of 247 Wh/L.

2.1. Measurements of the Entropy Coefficient

The OCV is required to analyze the heat generation using the overpotential of the cell, which is the difference between the measured voltage and the estimated OCV. Therefore, this study will experimentally measure the entropy coefficient in order to estimate the OCV at a given temperature and SoC. The experimental setup consists of battery cycling equipment (Arbin Instrument MSTAT4, College Station, TX, USA) and a temperature-controlled water bath (Fisher Scientific’s Isotemp 4100H7, Hampton, NH, USA). The battery cycling equipment was programmed to charge and discharge a cell at constant current rates from 1 A to 5 A. The water bath was set up to maintain the constant water temperature ranging from 5 °C to 85 °C for the desired time interval. During entropy coefficient tests, the cell was kept inside the water bath with the active area completely immersed in water and only the electrode outside the water surface to avoid short circuit. The cell temperature was brought to the uniform temperature of the bath before testing by resting the cell in the water bath for 30 min with the given set up temperature. The cell was charged and discharged with a current rate of 5 A (0.25 C) to the SoC of 0.0, 0.1, 0.2, 0.4, 0.6, 0.8 and 1.0. The OCV of the cell, while it was resting in the water bath at the setting temperature, was measured every 10 s using the Arbin battery tester. The cell was taken out of the water bath and was allowed to rest under room temperature for at least 5 h after each temperature cycle. The temperature of the water bath was then changed to a different temperature and the same procedure was repeated. All the tests were repeated at least three times. The entropy coefficient, which is the partial derivative of OCV respect to temperature, was calculated and averaged at various temperatures (20, 25, 30, 35, 40, 45 and 50 °C).

2.2. Measurement of the Specific Heat Capacity

The specific heat capacity is a key parameter for estimating the heat generation by the cell based on the temperature increase. This study measured the specific heat capacity of the LiFePO4 pouch cells using a customized setup. The experimental setup for specific heat capacity measurement of the cell consisted of a silicon heater (Omega SRFG-608/2) sandwiched between two cells enclosed in an acrylic container with a specific heat of 1.47 kJ/kg/K and density of 1150 kg/m3 (properties are reported by the manufacturer). The rectangular enclosure, which had an inside volume of 240 × 155 × 22 mm3, was made of acrylic sheets of thickness 12.5 mm (the Makrolon polycarbonate manufactured by Bayer). A groove with a width of 3 mm and a depth of 4 mm was created on the mid-width of the side and bottom walls in order to place the cell in the middle of the container, in order to minimize the heat loss through the container. The enclosure was covered by foam rubber insulation to reduce the heat loss to the surroundings during experiments. T-type thermocouples (Omega) were used to measure temperature inside the container and on the cell surface. Three thermocouples were attached on each side of the cell. One thermocouple was inserted through a small hole drilled on each side of the container to measure the temperature and estimate the heat loss through the container. One thermocouple was also used to record the temperature of the air inside the container to account for heat absorbed by the air.
Temperature data was recorded every minute using a Data Acquisition/Switch Unit (Keysight 34972A, Santa Rosa, CA, USA). A digital weighing scale (Ohaus NV4101, Parsippany, NJ, USA) was used to measure the weight of the cell and container. A DC power supply (Gwinstek GPR-30H10D, New Taipei City, Taiwan) provided constant power to the heater to generate uniform heat flux until the temperature of the cell surface reached 60 °C. Using the temperature data at the cell surface, the temperature of the air inside the container, as well as the temperatures of the container walls at the center, the specific heat capacity of the cell is evaluated based on the energy balance:
( m C p d T d t ) cell = W ˙ DC ( m C p d T d t ) walls ( m C p d T d t ) air   gap
It should be mentioned that the amount of heat absorbed/lost through the insulation was neglected due to the negligible temperature increase of the insulation material. Although the temperature distribution along the height of the wall is likely nonlinear, using the temperature at the center of the wall is a good approximation for calculating the amount of heat absorption by the container walls. The experimental error introduced by this assumption is estimated to be less than 10%. The error is estimated using the difference between the temperature at the center of the wall and the average temperature between the bottom of the container wall and the temperature in the air gap (at the top).

2.3. Heat Generation Measurement

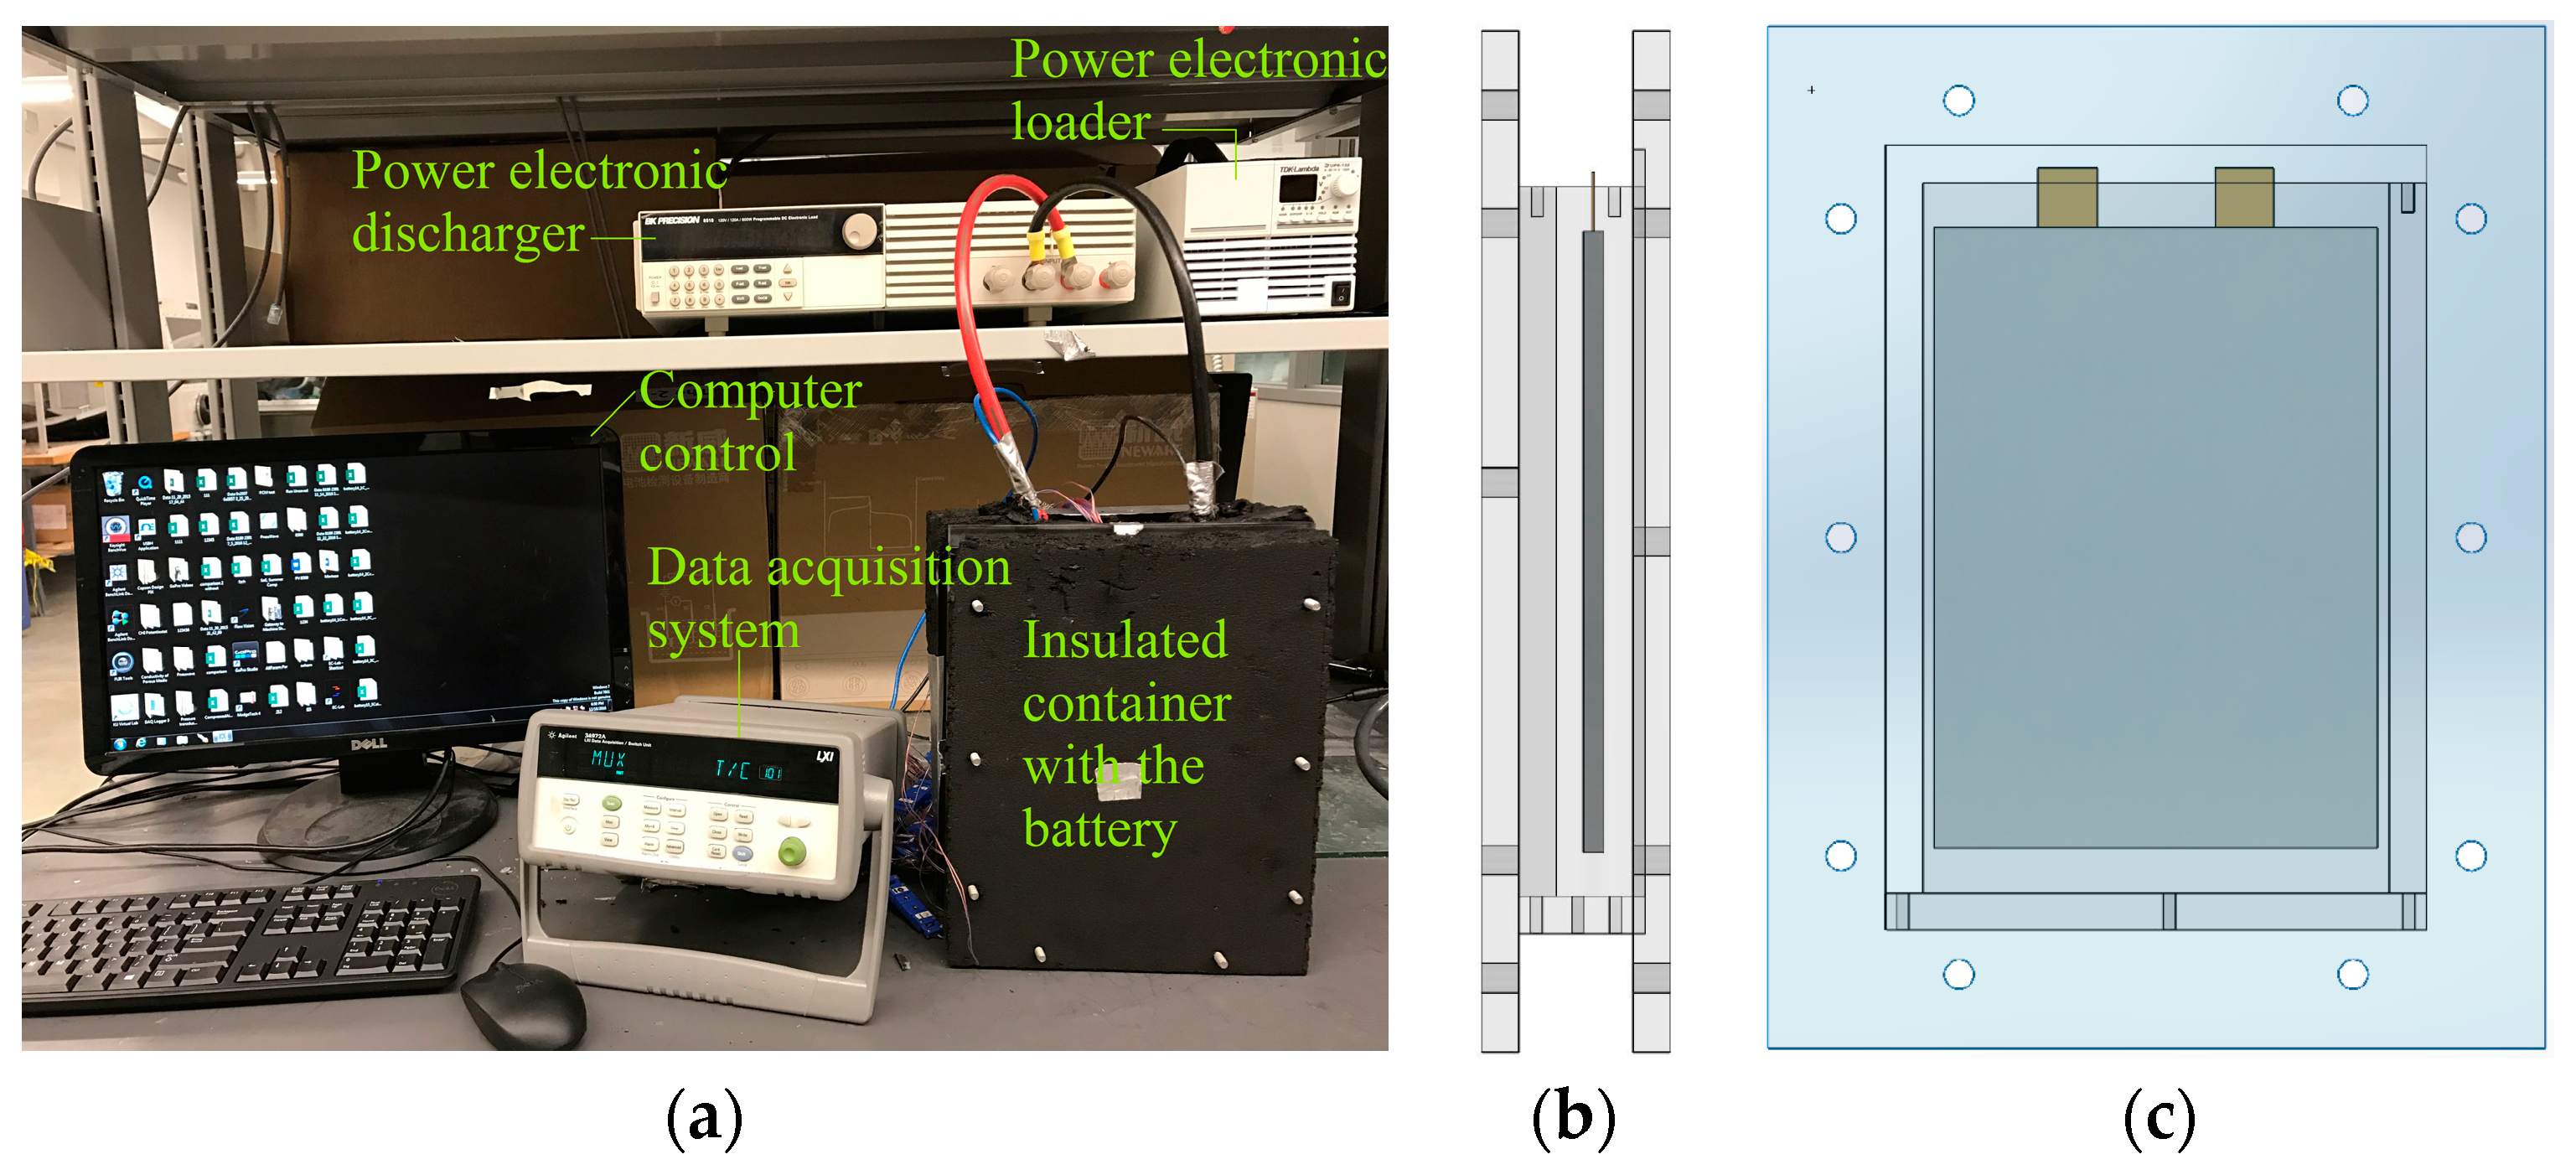
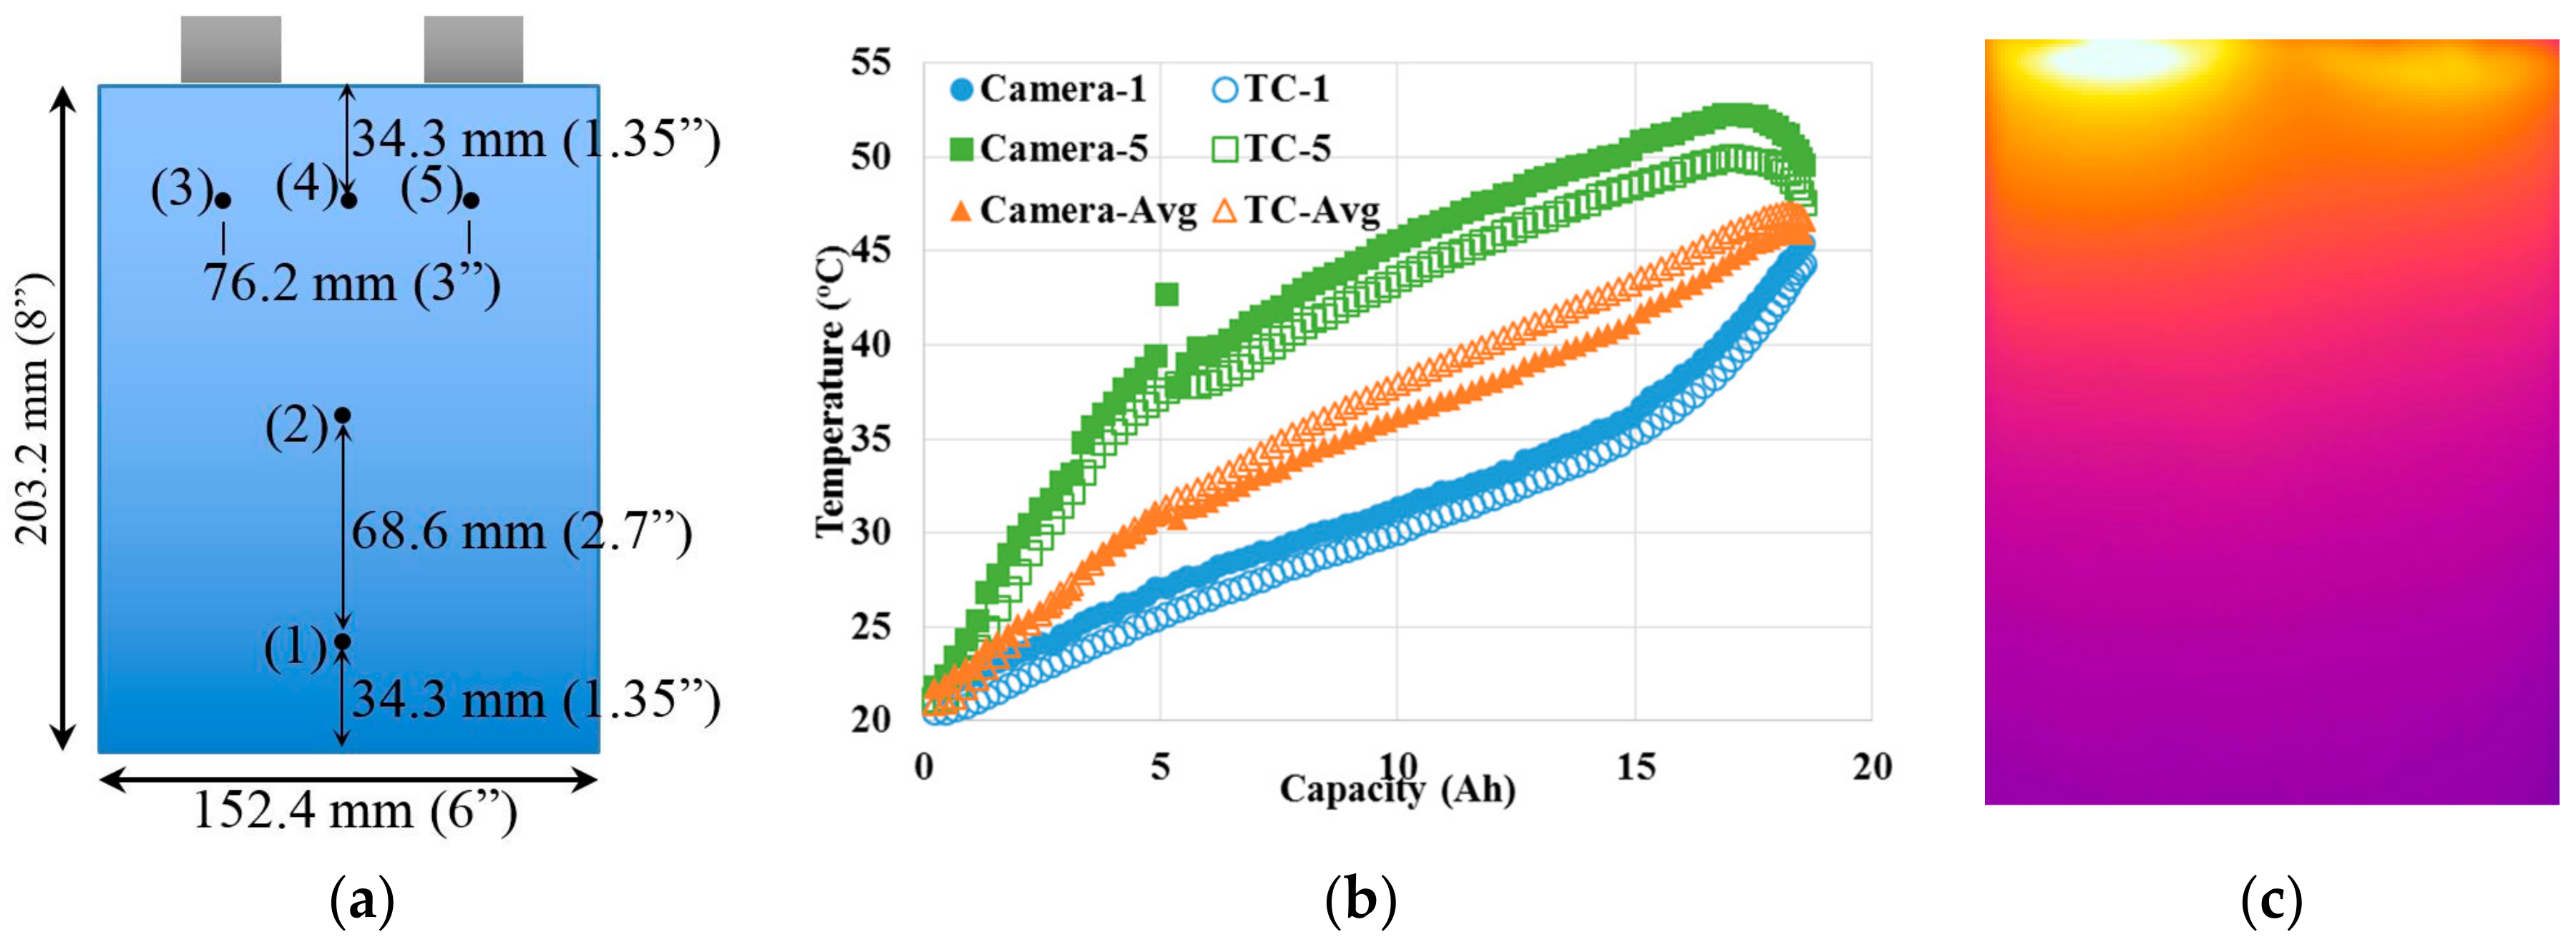
Figure 1 shows the experimental setup, as well as the side and front views of the battery in the container used to study the heat characteristic and passive cooling of lithium-ion cells using different materials. The experimental setup consisted of five parts: a rectangular enclosure with the cooling material, a data acquisitions system, a LiFePO4 cell, a battery discharger (BK Precision-8510), and a battery charger (TDK-Lambda ZUP6-132). The thickness of the cell is 7 mm and the space between the cell and wall at each side has a width of 7.5 mm. When the cell was directly exposed to the environment, the temperature at the cell surface was measured by a FLIR® A325sc Infrared Camera as well as thermocouples for comparison. One side of the cell surface was coated with Krylon® Ultra-Flat Black spray paint to ensure the surface emissivity of 0.95 before being measured by the infrared camera. The temperature on the other side of the cell was measured by five T-type thermocouples (Omega Engineering Inc., Stamford, CT, USA) with an accuracy of ±0.5 °C.
Figure 2a shows the distributions of the five thermocouples in order to measure the temperature gradient that might be present on the cell surface. The average temperature of all five thermocouples distributed along the cell surface was considered as the average cell surface temperature. Figure 2b compares the variations of cell surface temperatures with the capacity when the cell was discharged at 4 C (78 A). The average temperature differences were 1.2 (3.5%) and 1.9 °C (4.4%) between the camera and thermocouple measurements at the respective locations of thermocouple 1 and 5. The average temperature difference of the cell surface was calculated to be 1.1 °C (3.0%) between the camera and thermocouple measurements. The experimental differences between these two measurement methods are caused by the respective accuracies of the thermocouples and thermal camera, along with the thermocouple positions identified on thermal images. The comparisons indicate that both methods are reliable techniques and both methods are used in this study. The thermal image, Figure 2c, at the discharge capacity of 6.5 Ah shows a very large temperature difference (>30 °C) on the cell surface. The highest temperature was observed near the terminals (TC-3 and TC-5) and the lowest temperature was observed near the bottom (TC-1). Similar results could be observed from thermocouple measurements and will be discussed in detail. The high temperature difference in the cell level indicates the importance of effective thermal management. The temperature differences are likely higher in battery modules and stacks due to the limited heat dissipation rate through the surface by natural cooling. This study uses a single cell to set up a platform to develop and evaluate passive thermal management systems. The findings from this study could be easily applied to instruct the thermal management of battery modules and stacks.
Since most of the tests in this study were carried out when the cell was assembled in the container or was immersed in water, the infrared camera could not be applied and the following temperatures have been measured by thermocouples unless stated otherwise. A total of 13 T-type thermocouples with an accuracy of ±0.5 °C were used to record the temperature change. Five of those thermocouples were used to track the cell surface temperatures (Figure 2), and the rest were used to track the temperature of cooling materials, container walls, air gap in the container and ambient temperature of the laboratory. Temperatures measured by the thermocouples were recorded every 20 s by the Keysight 34972A data acquisition/switch unit. Before starting the experiment, the setup was placed in the laboratory overnight to reach a uniform atmospheric temperature (~20 °C) throughout the cell. Discharge and charge tests of cells at given current rates (1, 2, 3, and 4 C) were conducted. Before each discharge (/charge) test, the cell was fully charged (/discharged) at 2.5 A (1/8 C) until the voltage reached 3.7 V (/2.5 V), followed by at least 5-h rest to reach thermal equilibrium with the environment. The discharge (/charge) followed the constant current procedure until the cell voltage reached 2.5 V (/3.7 V). All experiments were repeated three times.

3. Results and Discussion

3.1. Measurement of Voltage and the Entropy Coefficient

The OCV of the cell was measured at various SoCs and temperatures. The slopes of OCV with respect to temperature were used to find the entropy coefficient as a function of SoC (Figure 3). As shown in Figure 3, the entropy coefficient is negative when the SoC is below 0.6 and positive when SoC was 0.8 and above. The lowest and highest values of the entropy coefficient were determined as −0.416 mV/K and 0.029 mV/K, respectively, at 0.4 SoC and 1 SoC. The measured entropy coefficients in this work are consistent with values reported in other studies and exhibit similar trends to SoC [3,4,5,6,7].

3.2. Specific Heat Capacity Measurement

The specific heat of the cell was measured following the procedure described in Section 2.2. Constant heat fluxes of 30 W, 40 W and 50 W were supplied through the heater until the temperature of the cell surface reached 60 °C. Equation (1) was used to calculate the specific heat capacity of the cell. The average heat capacities obtained at 30, 40 and 50 W power flux resulted in an average specific heat capacity of the cell of 932.5 ± 78.0 J/kg/K. The obtained value for specific heat capacity is close to the value reported in previous studies for a cell of the same chemistry but different capacity [4].

3.3. Heat Generation Measurement

The amount of heat generation and the temperature at the cell surface under various current rates and cooling conditions were measured under constant current rates, as described before. It should be noted that since the cell was only discharged and charged at constant currents, instead of constant current followed by constant voltage, the SoC of the cell could not reach 1.0, especially at high current rates. Therefore, this section only reports data between 0 and 0.8 SoC, in order to compare results consistently at various currents.

3.3.1. Charging vs. Discharging

The amount of heat generation was first estimated based on the temperature increase of each material (cell, water, container wall, air):
Q ˙ Q ˙ loss = ( m C p d T d t ) cell + ( m C p d T d t ) water + ( m C p d T d t ) walls + ( m C p d T d t ) air   gap
It is difficult to directly measure the amount of heat loss to the environment, Q ˙ loss , due to the low temperature increase at the insulation wall and the accuracy of thermocouples. Therefore, this study estimated the amount of the heat loss by tracking the heat loss of the whole setup from the time that the cell completed discharge/charge until it had rested in room condition for the same amount of time as it was in operation. Figure 4 shows the change of the amount of heat absorption (the right-hand side of Equation (2)) of the battery setup with time when it was charged at constant currents. The non-dimensional time is calculated by dividing the real time with the time that the cell can reach the SoC of 1 under the given current. Since the cell cannot be fully charged under constant current mode, the cell typically completed the charge process at the SoC of about 0.9. After the cell had rested under room conditions, the total amount of heat absorbed in the cell setup decreased due to the heat lost to the environment ( Q ˙ loss ). Using this approach, the amounts of heat lost are estimated to be 26.5%, 13.1%, 14.1%, and 10.4% of the total heat generated by the cell. These factors were used to calibrate the total amount of heat generation ( Q ˙ ).
The estimated heat generation rate during charge and discharge at current rates of 1, 2, 3 and 4 C are shown in Figure 5. In general, the heat generation rate of the cell in both charge and discharge increases with increasing SoC during charge and DoD during discharge. The least-squares fitting of heat generation rates, Q ˙ , at various current rates in Figure 5 are:
Q ˙ 1 C   charge = 196.49 × DoD 3 207.28 × DoD 2 + 53.07 × DoD
Q ˙ 1 C   discharge = 18.6 × SoC 3 0.49 × SoC 2 + 20.85 × SoC
Q ˙ 2 C   charge = 227.31 × DoD 3 271.35 × DoD 2 + 98.72 × DoD
Q ˙ 2 C   discharge = 290.68 × SoC 3 351.48 × SoC 2 + 127.02 × SoC
Q ˙ 3 C   charge = 187.30 × DoD 3 252.17 × DoD 2 + 121.37 × DoD
Q ˙ 3 C   discharge = 515.56 × SoC 3 551.47 × SoC 2 + 190.75 × SoC
Q ˙ 4 C   charge = 339.69 × DoD 3 458.25 × DoD 2 + 228.64 × DoD
Q ˙ 4 C   discharge = 677.94 × SoC 3 795.14 × SoC 2 + 298.28 × SoC
Please note that these above equations only apply to the constant current charge (/discharge) of the cell between the SoC (/DoD) of 0 and 0.8.
All the trends of heat generation are non-linear and S-shaped, as obtained in previous studies on lithium-ion batteries [4]. The heat generation rate increases with the increase in current rate during both charge and discharge. The increase of current rate increases both irreversible and reversible heat [9]. The increase in irreversible heat with the current rate is higher than that of the reversible heat. It can also be seen from the figure that the total amount of heat generation (the area below the fitted curves) during discharging is generally higher than that of charging at a given current rate. The differences are 58.8%, 17.7%, 26.1%, and −0.7% at 1, 2, 3, and 4 C, respectively. The difference can be attributed to the different activation over-potential as well as the reversible heat. The reversible heat is endothermic during charging and exothermic during discharging when the SoC is less than 80% [4].

3.3.2. Comparison of Heat Generation during a Charge-Discharge Cycle Using Different Methods

Since reliable and accurate estimations of the heat generation rate of a battery are required for designing a proper battery thermal management system, experimental measurements of the total heat generation during charge-discharge cycles at various current rates were carried out. This study compared three different methods to measure the total heat generation and discussed the experimental errors and limitations associated with each method. The first method was based on the energy balance and increase in temperature of the system (sensible heat) (Equation (2)). The second method estimated the amount of heat generation using overpotential, obtained from the operating voltage and the OCV, based on the Bernadi model [3]:
Q ˙ = I · | OCV V | I · T · OCV T
where, I is the current, V is the measured operating voltage and OCV is the estimated open circuit voltage. According to the previous equation, the total heat generation rate in the cell is composed of irreversible and reversible heats. The irreversible heat is generated by the ohmic loss, charge transfer resistance and mass transfer limitation, and the reversible heat is generated due to entropy change [6,16,17]. In this study, the value of OCV was obtained from the experiment described in Section 2.1 and summarized in a look-up table at each SoC and temperature. As cited in the literature, at higher current rates, the change in the magnitude of reversible heat is relatively small in comparison to the irreversible heat [3,10]. The reversible heats for both charging and discharging were equal in magnitudes and opposite in signs, which led to zero reversible heat generation in the cell over a cycle. Hence, only irreversible heat needs to be considered in a charge-discharge cycle. The third method evaluated the heat generation using the voltage difference between the charge and discharge at each SoC:
Q ˙ = I · ( V Charge V Discharge )
These three methods are named the “Temperature Increase”, “Overpotential”, and “Voltage Difference” methods, respectively. Figure 6 shows the heat generation rate over a charge-discharge cycle at 1, 2, 3 and 4 C current rates using all three methods. In addition, the total amounts of heat generated using the above-mentioned methods at various discharge rates are summarized in Table 1.
The results listed in Figure 6 and Table 1 indicate that the heat generation rates obtained from the second and third methods are very similar. The total heat generation rates calculated by these methods have less than 3% difference at every SoC of the cycle. Both account for the total irreversible heat generation inside the cell using various voltage information. The “Temperature Increase” method, however, significantly underestimates the amount of heat generation, especially at high C rates. At high current rates, the high heat generation leads to a significant temperature gradient within the cell, which is detected by this method [18], and on the cell surface (Figure 2c). The temperature gradient, as well as the time delay of temperature increase, results in significant experimental error when estimating the amount of heat generation based on the heat absorption rate using the temperature increase of the cell surface and the cooling material. As a result, the “Temperature Increase” method underestimated the heat generation rate by 25.4%, 35.0%, 30.1% and 47.8% at 1, 2, 3 and 4 C current rates, respectively.

3.3.3. Maximum Temperature Difference on the Cell Surface

An important impact of the heat generation of a cell is the temperature difference on its surface, which affects the lifetime and efficiency of the cell [12]. Hence, the maximum temperature differences on the cell surface using air, aluminum foam, PCM, water, and water with aluminum foam as cooling materials were studied at 1, 2 and 3 C discharge current rates, as shown in Figure 7. The maximum temperature on the cell surface was obtained near electrodes, i.e., at thermocouple locations 3 and 5 in Figure 2, and the minimum temperature was obtained at the bottom of the cell (thermocouple location 1). The properties of each of the cooling materials are listed in Table 2. The heat capacity determines the amount of heat that can be stored and released, while the effective thermal conductivity determines the heat transfer rate. The ideal cooling material needs to balance the high heat capacity with high thermal conductivity, especially when the cell has high heat generation rates (at high C rates). Therefore, this study investigates the combination of aluminum foam (high conductivity) with water (high heat capacity). Further studies integrating metal foams with PCMs are under investigation in our lab to make use of the high conductivity of metal foam and the high latent heat during phase change of the PCM.
All three results in Figure 7 show that water, water with aluminum foam, and PCM exhibit the lowest temperature differences throughout the cell surface for all discharge rates. Air results in the highest temperature difference on the cell surface followed by the foam at each current rate. The temperature differences between air and aluminum foam differed by around 2 to 3 °C. The maximum temperature difference as seen in Figure 7 increases significantly at higher current rates. In Figure 7a, a maximum temperature difference of 10.0 °C is obtained using air as the cooling material, while the maximum temperature increases of 28.9 °C and 33.3 °C are observed at 2 C and 3 C current rates, respectively, using air in Figure 7b,c. The cell cooled by PCM had a slightly higher maximum temperature difference than the cell cooled by water and water with foam because of its lower total heat capacity, as well as its lower thermal conductivity compared to the other two, as shown in Table 2. At 2 C and 3 C current rates, the PCM melted, and as a result, a large amount of heat was stored through the latent heat of the PCM. The maximum temperature differences on the cell surface using PCM were 6.3, 9.2 and 13.4 °C, respectively, at 1, 2 and 3 C current rates. The maximum temperature differences using water are 4.7, 8.0 and 12.9 °C at 1, 2 and 3 C current rates, respectively. Water with foam also resulted in similar maximum temperature differences, with 4.9, 8.5 and 15.3 °C differences at 1, 2 and 3 C current rates, respectively.

3.3.4. Average Temperature Increase of the Cell Surface

In order to study the effectiveness of various passive cooling materials, the increase of average surface temperature of the cell with DoD is also measured at different current rates. Average surface temperature of the cell refers to the average value of the readings from the 5 thermocouples attached to the cell surface. Figure 8 shows the trend of temperature increase with different cooling materials at each current rate. It can be seen from Figure 8a that the increase in average temperature of cell surface increases with the increase in the current rate [21]. The average temperature increase with air is the highest, i.e., approximately 6.6 °C at 1 C, 15.6 °C at 2 C, and 22.6 °C at 3 C current rate, due to the very low thermal conductivity and the low heat capacity of the air. Aluminum foam maintains an average temperature a few degrees (1–5 °C) lower, since it has relatively higher thermal conductivity and heat capacity.
Initially, PCM results in a higher increase in average temperature compared to water or water with foam due to its slightly lower thermal conductivity, as seen in Figure 8c. Later, it can be seen that the average temperature of the cell using PCM slows down as soon as the phase change temperature is reached. The phase change of PCM helps to store heat as latent heat and maintain a lower average temperature on the cell surface. This behavior is similar to the result obtained in references [21,22,23,24,25]. PCM shows promising application, especially at high discharge rates and/or in battery packs composed of multiple single cells, because of its phase change property.
Figure 8 also shows that the average surface temperature of the cell using only water is slightly lower than the average temperature using water with aluminum foam. Use of aluminum foam (0.9 porosity) with water results in about 10% volume decrease of water compared to the setup with only water. As can be seen from Table 2, since water has a higher heat capacity than aluminum, the total heat capacity using the water with foam as cooling material is 7.9% lower than the heat capacity of pure water. As a result, the average temperature of the cell when cooled using water with foam is slightly higher than using only water. The loss in quantity of water used affects the overall heat dissipation. With the same volume, water, water with aluminum foam and PCM exhibit the desired property to maintain lower average temperature and lower temperature gradient on the cell surface compared to air and aluminum foam. It should be noted that general principles of thermal management design in cell levels found in this study also applies to modules and stacks. Therefore, the comparison of several cooling materials helps to identify effective passive thermal management approaches for modules and stacks.

4. Conclusions

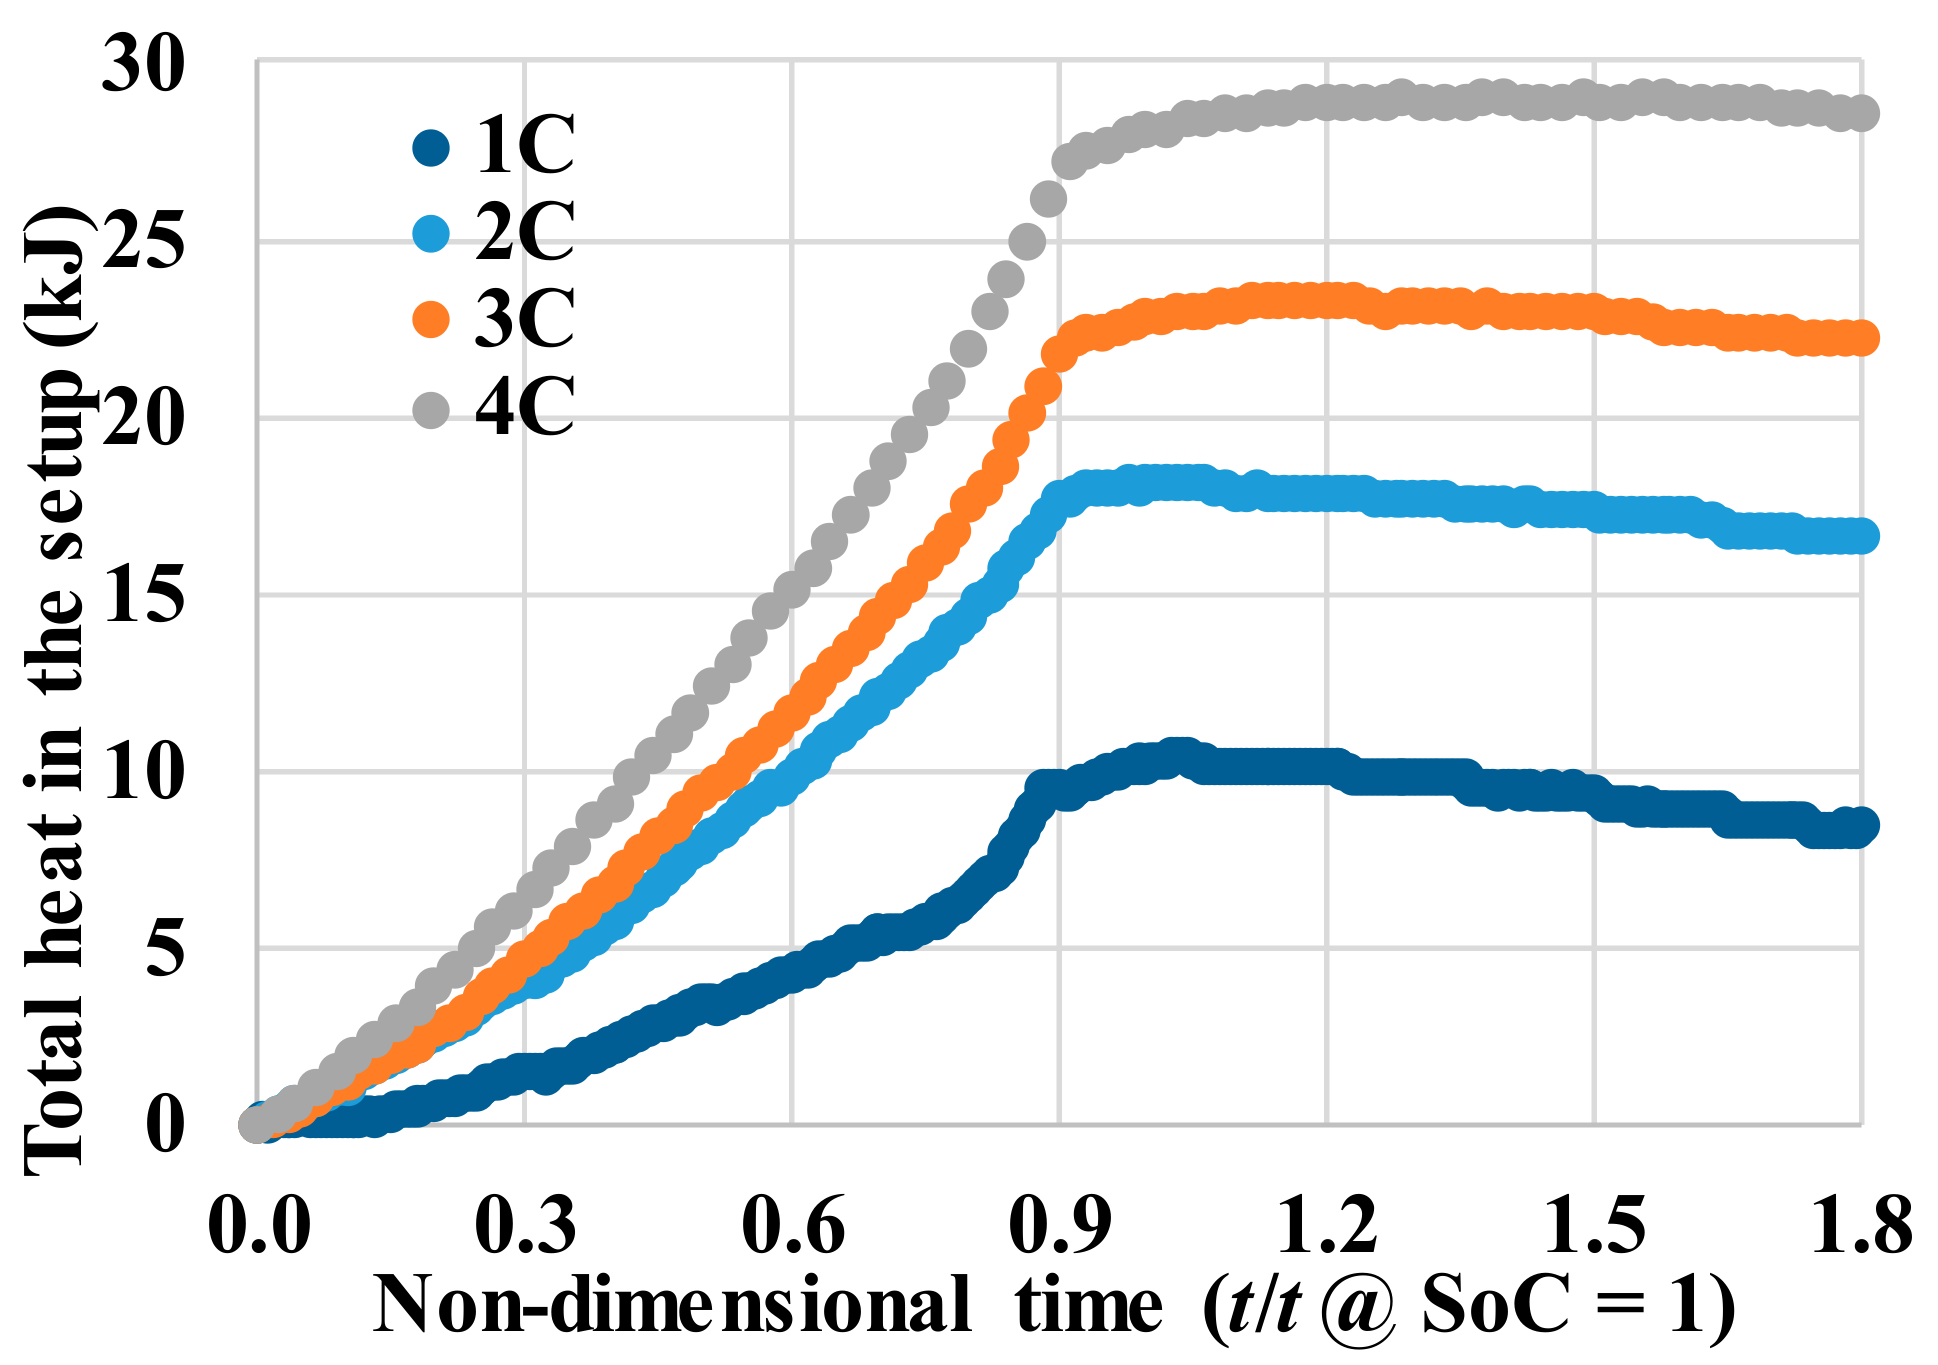
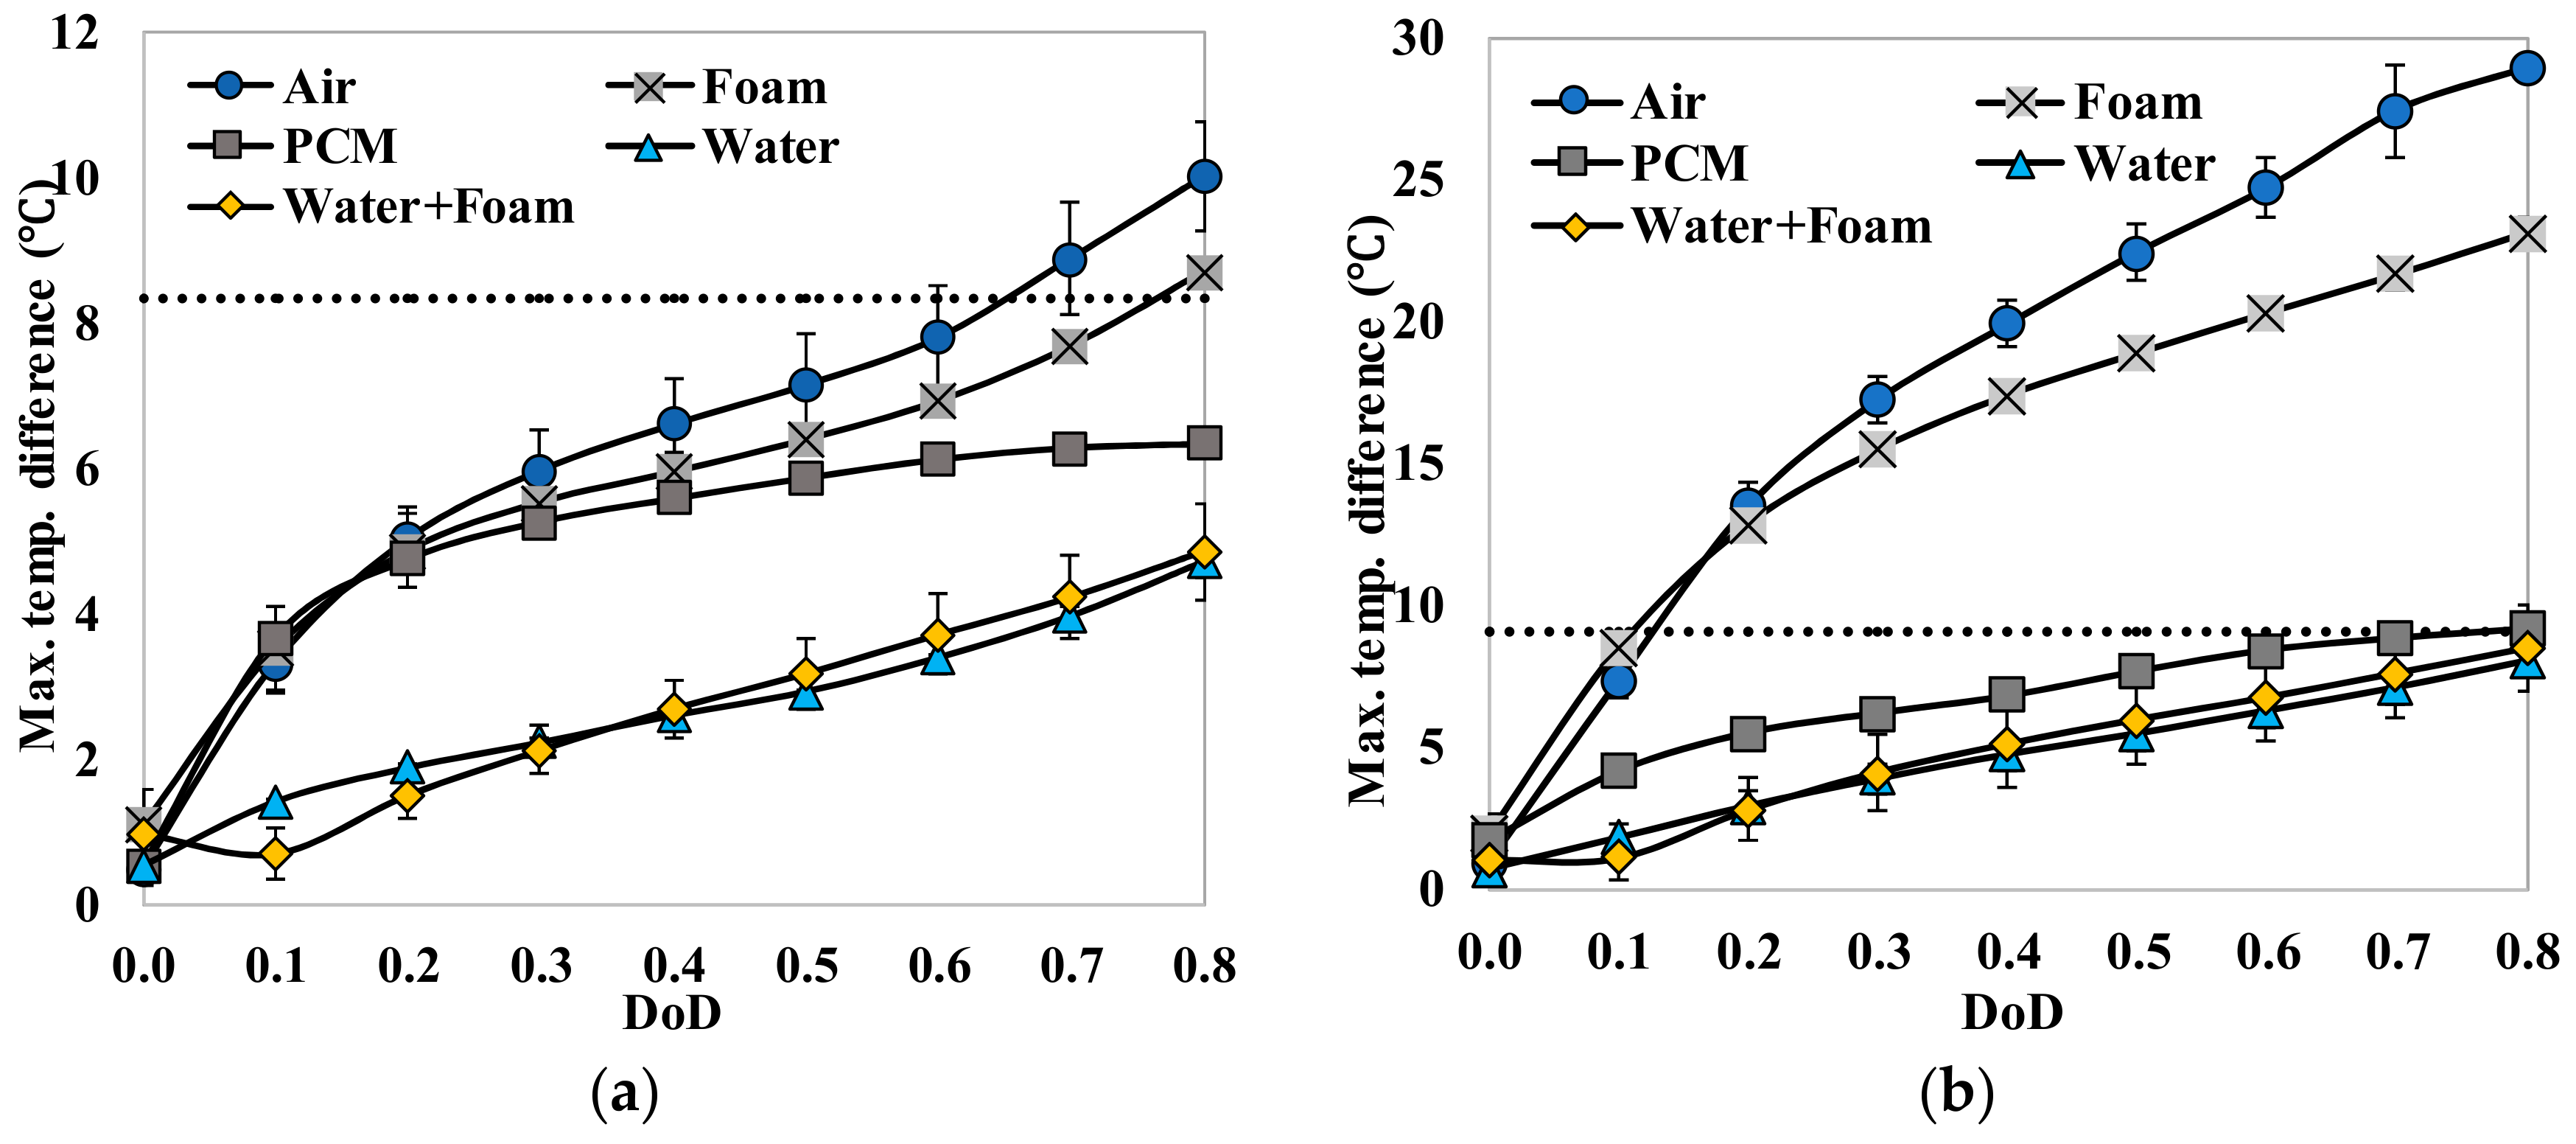
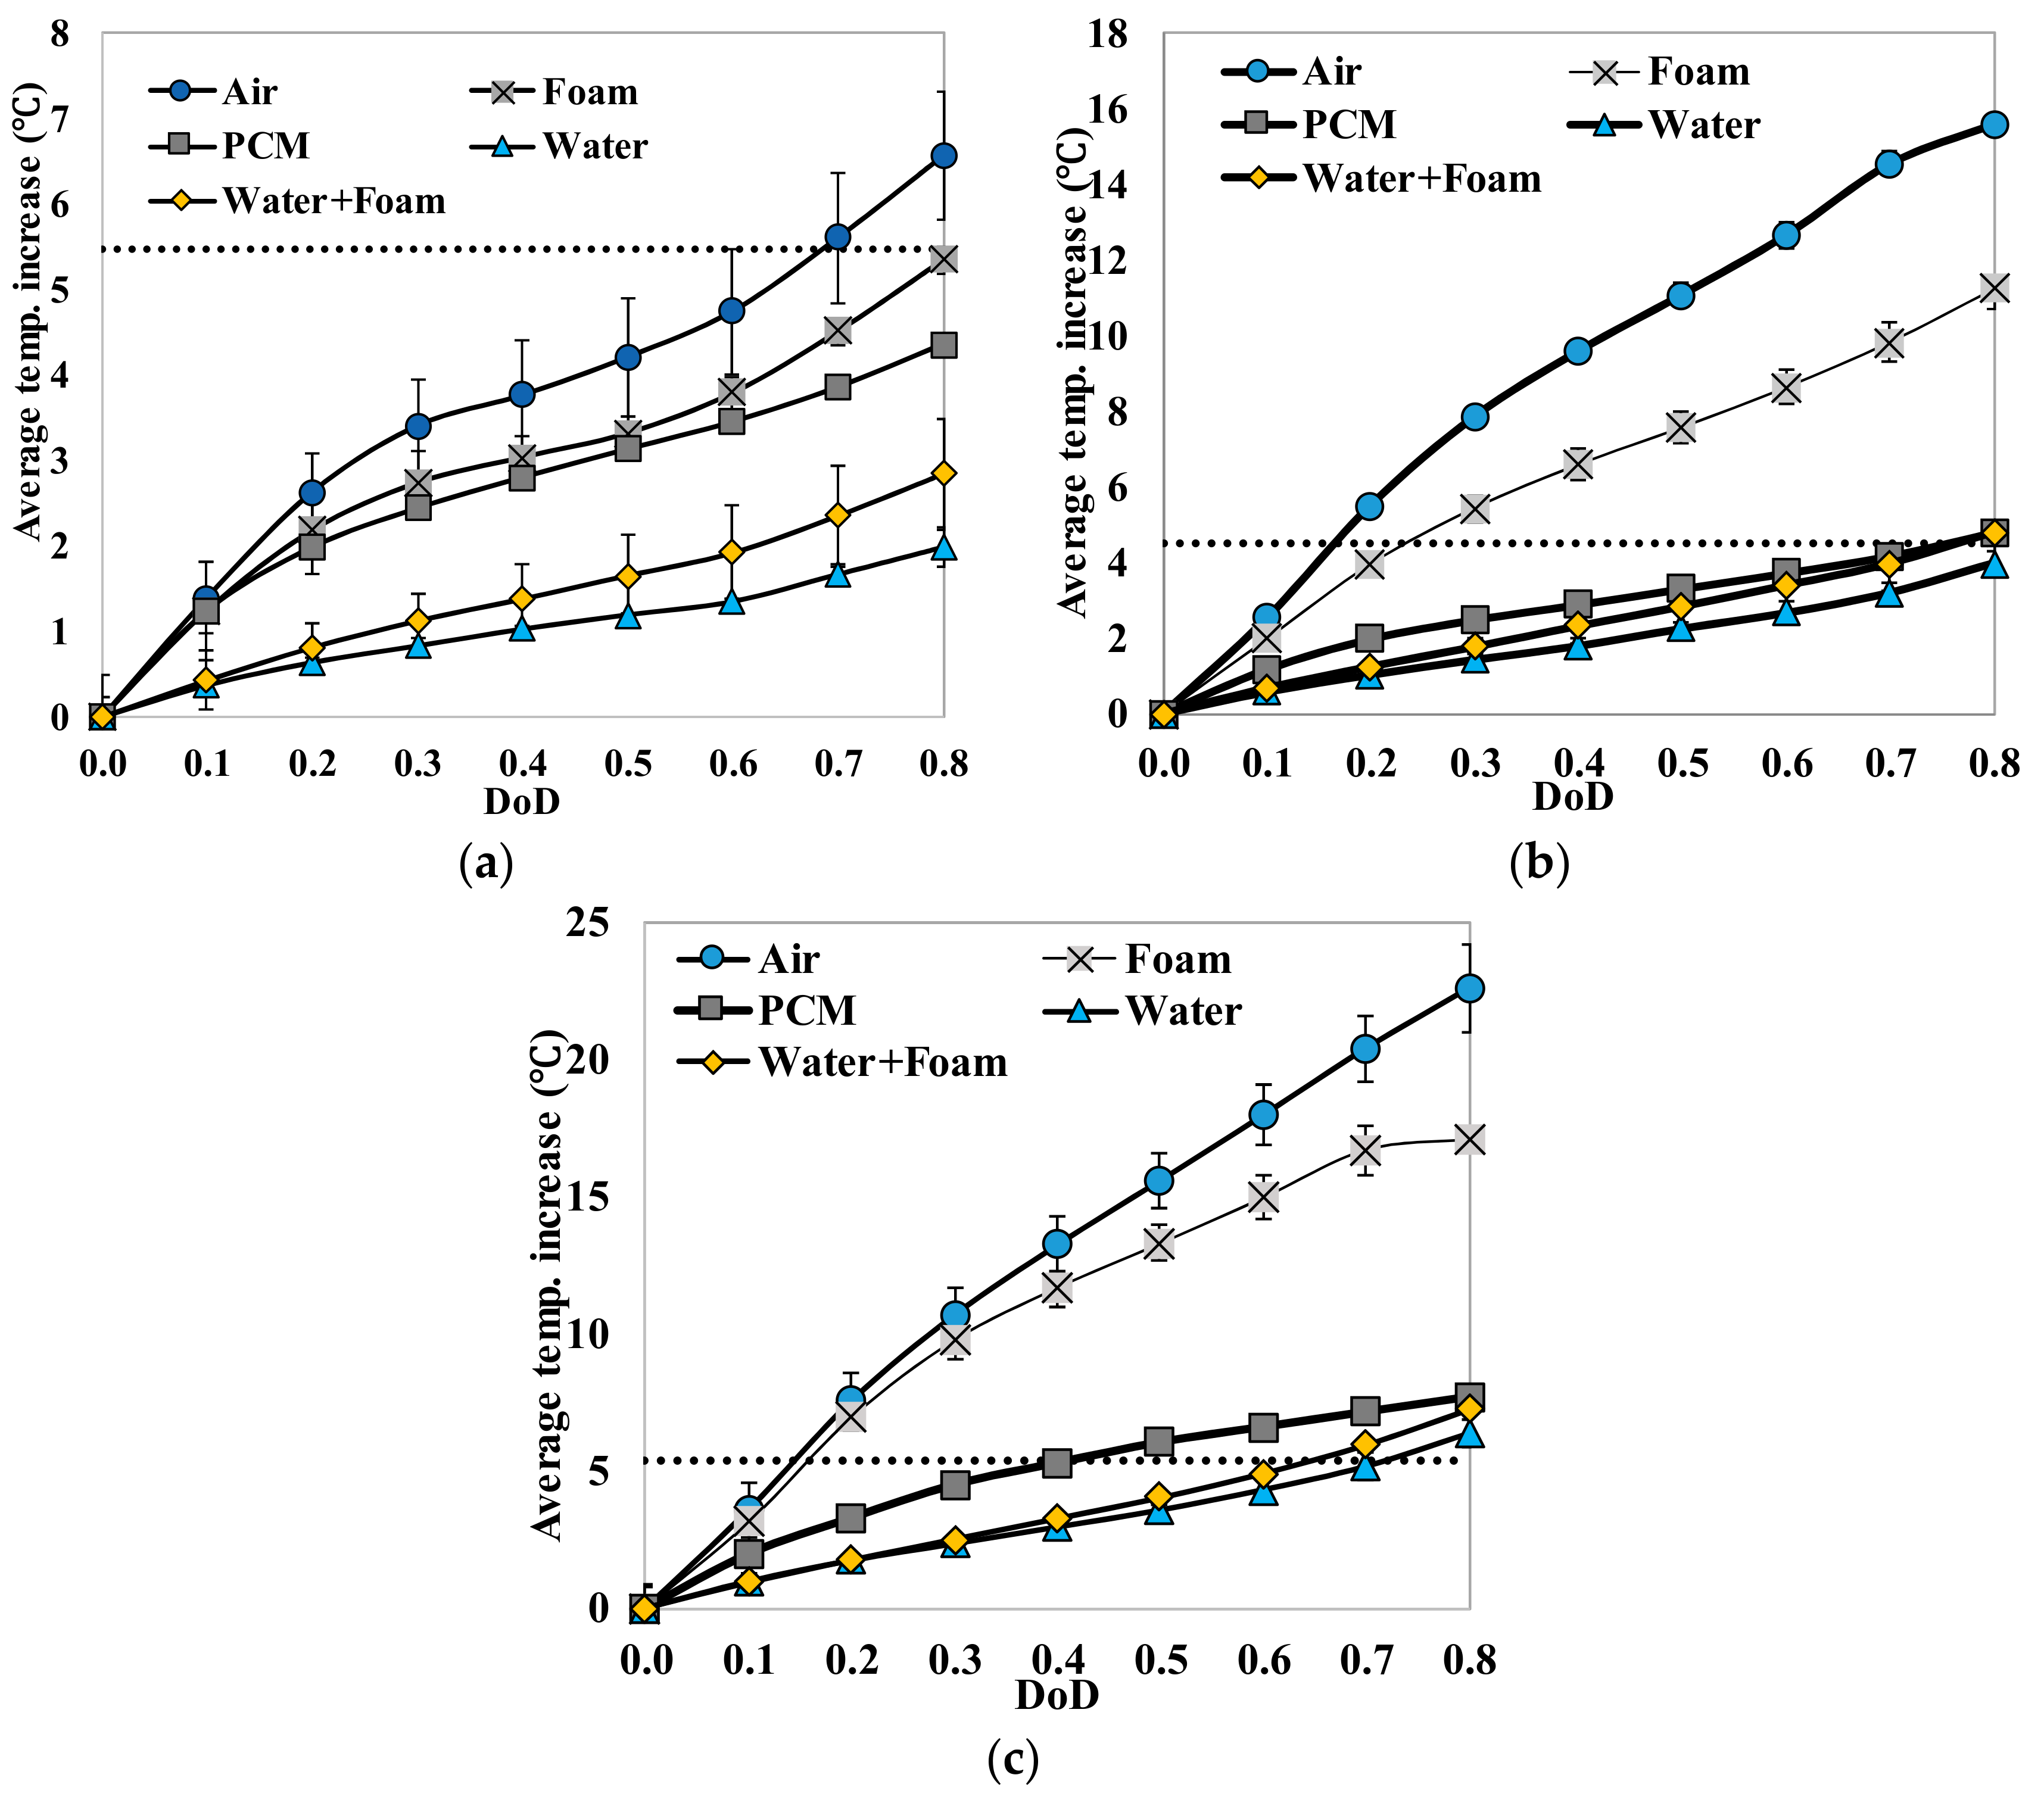
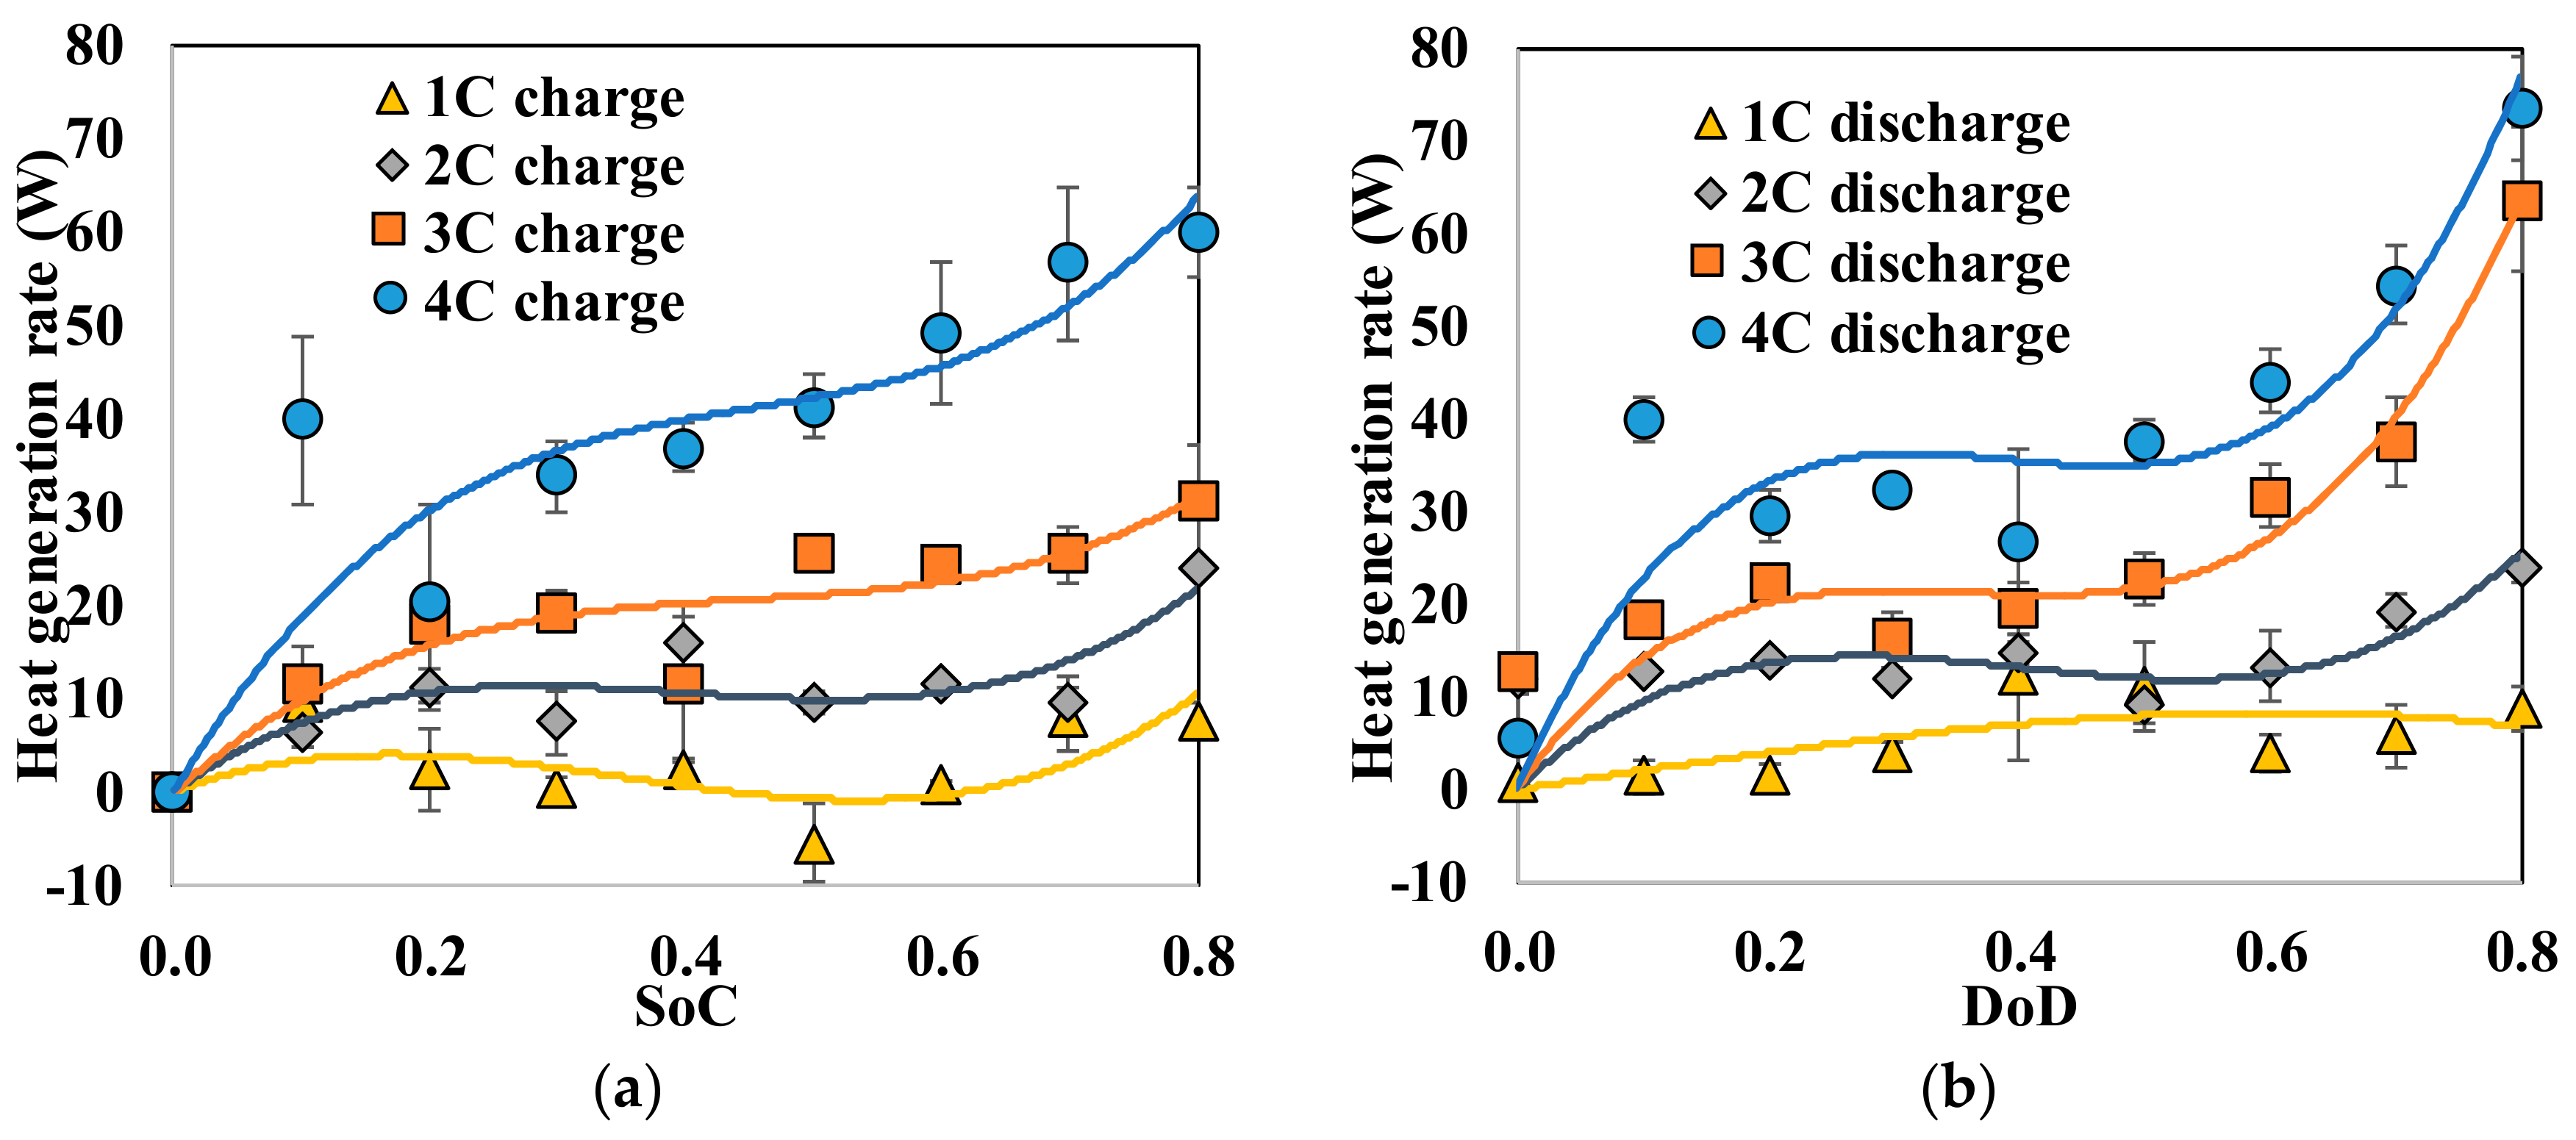
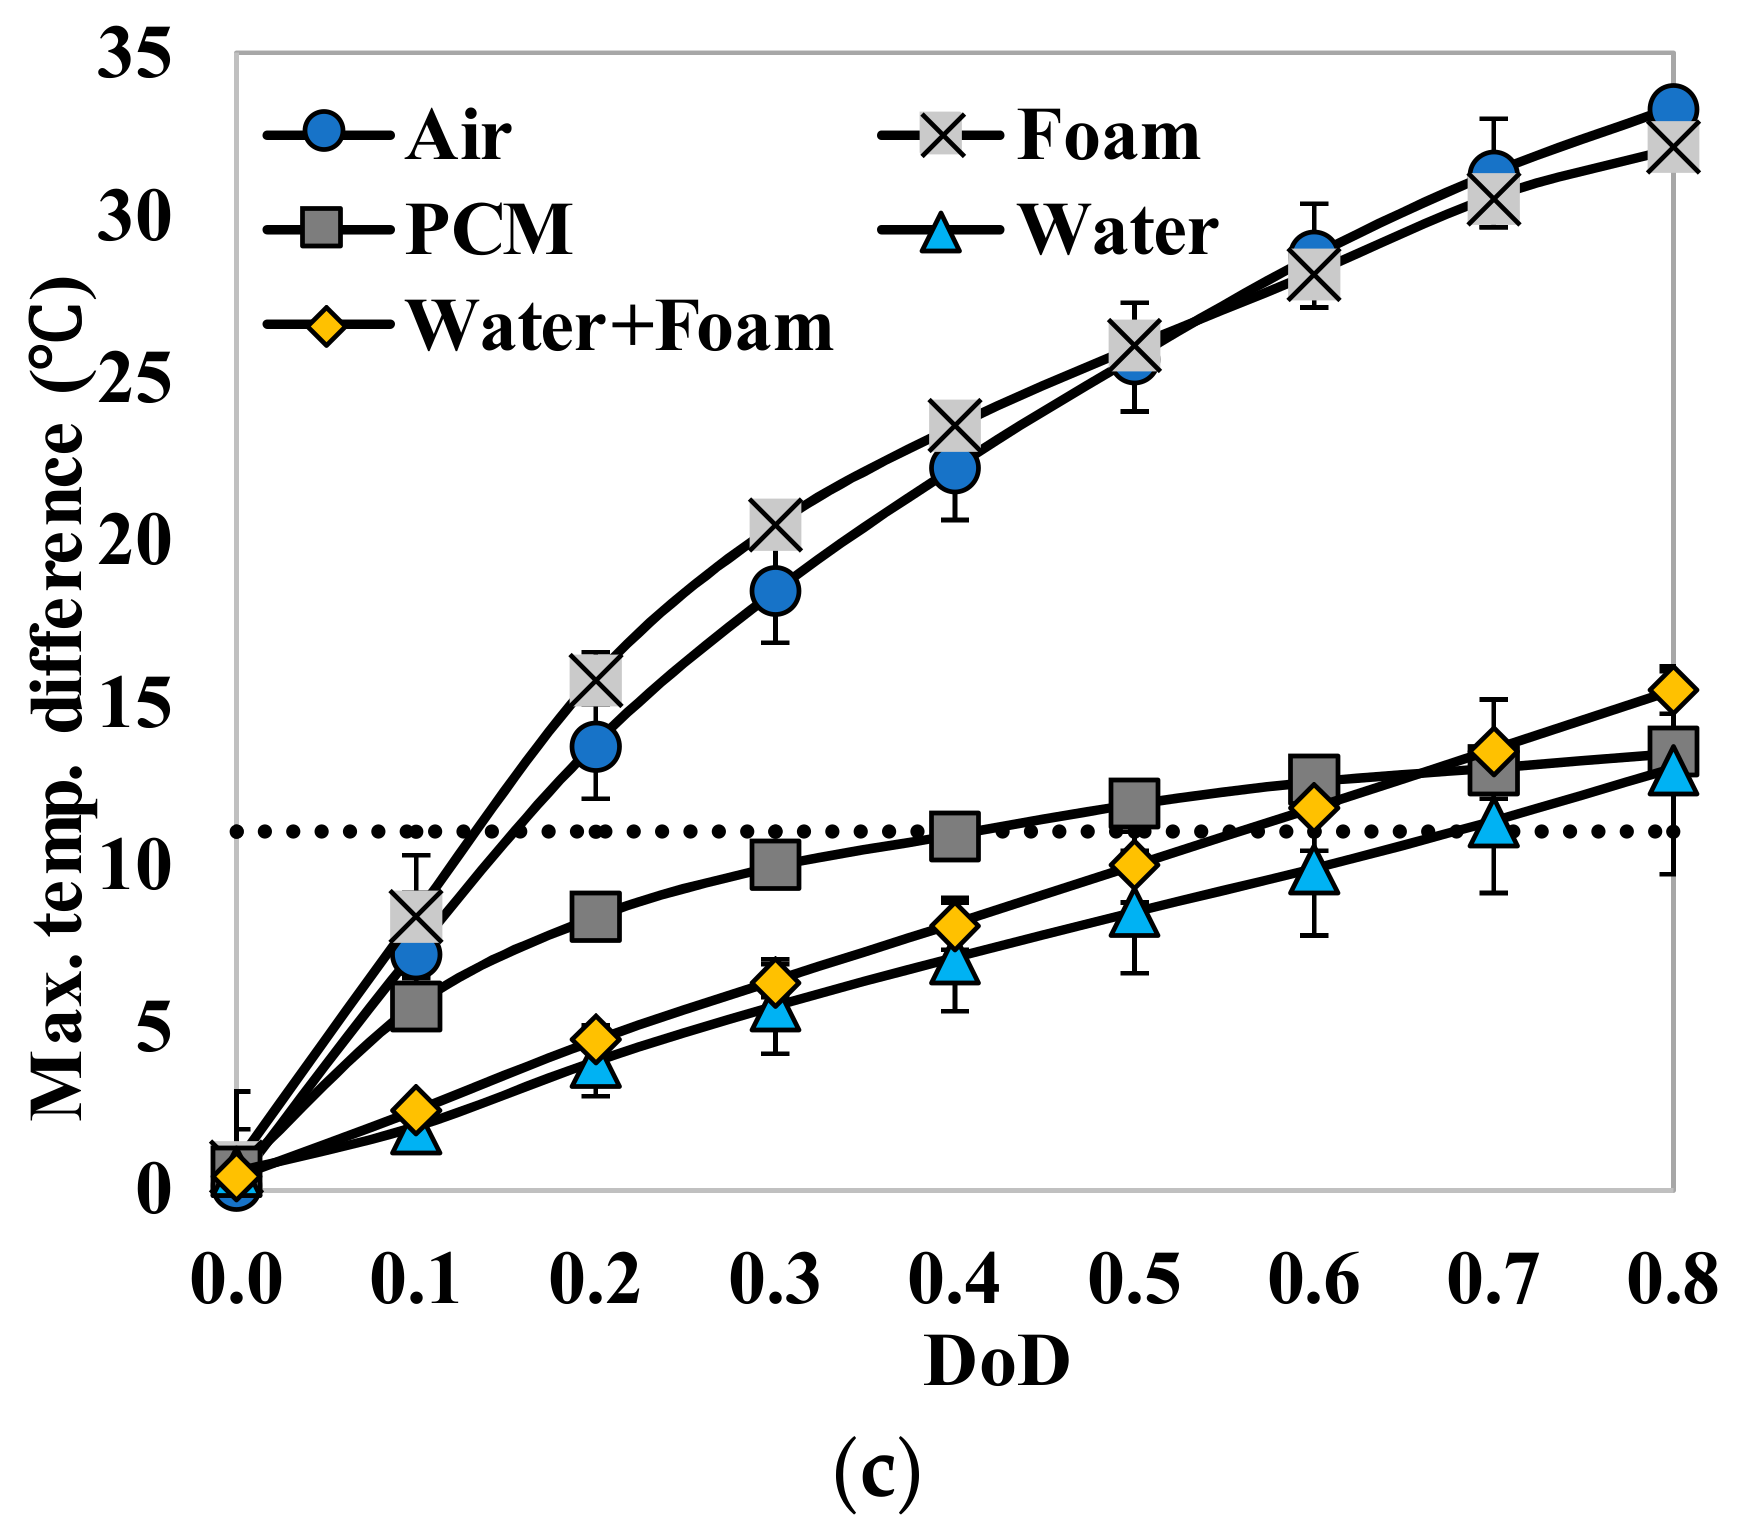
Fundamental thermal properties of the LiFePO4 cell, along with the heat generation characteristics of the cell, have been studied. The heat generation rate during the discharging process was higher than the heat generation rate during the charging process, which can be attributed to the slightly endothermic behavior observed during the charging process. The heat generation rate, as well as the total heat generated by the cell, increased with the increase in the current rate. The effectiveness of several cooling materials used in a passive thermal management system to maintain lower cell surface temperature and low surface temperature gradient has been studied. The results showed that cooling by natural convection of air might result in a large temperature increase and high temperature gradient on the cell surface (by more than 30 °C at 3 C current rate). Aluminum foam showed better cooling effects than air, while water, PCM, and water with aluminum foam are more desirable. Using PCM, water or water with aluminum foam as the cooling material, the average temperature increases at the surface are less than 8 °C and the maximum temperature differences at the surface are less than 16 °C, even at the current rate of 3 C. For such low average surface temperature increases on the cell surface using PCM, water and water with aluminum foam for cooling, the inside temperature of the cell will also stay within the safe limit. The heat generation estimation using the “Temperature Increase” method could significantly underestimate the heat generation since it can only consider the cell surface temperature.

Author Contributions

M.A., S.N., and X.L. designed the experiment; S.N., M.A., and D.B collected experimental data; S.N., M.A., and X.L. analyzed results; S.N. and M.A. write the manuscript, D.B. and X.L. edited the draft manuscript.

Acknowledgments

The authors greatly appreciate the sustained support of Austin Hausmann and Smith Electric Vehicles for providing the lithium-ion batteries investigated in this study. X.L. also wants to thank the financial support from New Faculty General Research Fund provided by the University of Kansas.

Conflicts of Interest

The authors declare no conflicts of interest.

References

  1. Optiz, A.; Badami, P.; Shen, L.; Vignarooban, K.; Kannan, A.M. Can Li-Ion batteries be the panacea for automotive applications? Renew. Sustain. Energy Rev. 2017, 68, 685–692. [Google Scholar] [CrossRef]
  2. Groot, J.; Swierczynski, M.; Stan, A.I.; Kaer, S.K. On the complex ageing characteristics of high-power LiFePO4/graphite battery cells cycles with high charge and discharge currents. J. Power Sources 2015, 286, 475–487. [Google Scholar] [CrossRef]
  3. Bernardi, D.; Pawlikowski, E.; Newman, J. A general energy balance for battery systems. J. Electrochem. Soc. 1985, 132, 5–12. [Google Scholar] [CrossRef]
  4. Lin, C.; Xu, S.; Li, Z.; Li, B.; Change, G.; Liu, J. Thermal analysis of large-capacity LiFePO4 power batteries for electric vehicles. J. Power Sources 2015, 294, 633–642. [Google Scholar] [CrossRef]
  5. Takano, K.; Saito, Y.; Kanari, K.; Nozaki, K.; Kato, K.; Negishi, A.; Kato, T. Entropy change in lithium ion cells on charge and discharge. J. Appl. Electrochem. 2002, 32, 251–258. [Google Scholar] [CrossRef]
  6. Bandhauer, T.M.; Garimella, S.; Fuller, T.F. Temperature-dependent electrochemical heat generation in a commercial lithium-ion battery. J. Power Sources 2014, 247, 618–628. [Google Scholar] [CrossRef]
  7. Forgez, C.; Do, D.V.; Friedrich, G.; Morcette, M.; Delacourt, C. Thermal modeling of a cylindrical LiFePO4/graphite lithium-ion battery. J. Power Sources 2010, 195, 2961–2968. [Google Scholar] [CrossRef]
  8. Drake, S.J.; Wetz, D.A.; Ostanek, J.K.; Miller, S.P.; Heinzel, J.M.; Jain, A. Measurement of anisotropic thermophysical properties of cylindrical Li-ion cells. J. Power Sources 2014, 252, 298–304. [Google Scholar] [CrossRef]
  9. Yildiz, M.; Karakoc, H.; Dincer, I. Modeling and validation of temperature changes in a pouch lithium-ion battery at various discharge rates. Int. Commun. Heat Mass Transf. 2016, 75, 311–314. [Google Scholar] [CrossRef]
  10. Chen, K.; Unsworth, G.; Li, X. Measurement of heat generation in prismatic Li-ion batteries. J. Power Sources 2014, 261, 28–37. [Google Scholar] [CrossRef]
  11. Chen, K.; Li, X. Accurate determination of battery discharge characteristics—A comparison between two battery temperature control methods. J. Power Sources 2014, 247, 961–966. [Google Scholar] [CrossRef]
  12. Rostami, M.A.; Li, X. Numerical Studies of Lithium-ion Battery Thermal Management System Using Phase Change Materials and Metal Foams. Int. J. Heat Mass Transf. 2016, 102, 1159–1168. [Google Scholar]
  13. Libeer, W.; Ramos, F.; Newton, C.; Alipanahrostami, M.; Depcik, C.; Li, X. Two-phase heat and mass transfer of phase change materials in thermal management systems. Int. J. Heat Mass Transf. 2016, 100, 215–223. [Google Scholar] [CrossRef]
  14. Zou, C.; Hu, X.; Wei, Z.; Tang, X. Electrothermal dynamics-conscious lithium-ion battery cell-level charging management via state-monitored predictive control. Energy 2017, 141, 250–259. [Google Scholar] [CrossRef]
  15. Zou, C.; Hu, X.; Wei, Z.; Wik, T.; Egardt, B. Electrochemical Estimation and Control for Lithium-Ion Battery Health-Aware Fast Charging. IEEE Trans. Ind. Electron. 2017, 65, 6635–6645. [Google Scholar] [CrossRef]
  16. Panchal, S.; Dincer, I.; Agelin-Chaab, M.; Fraser, R.; Fowler, M. Experimental and theoretical investigations of heat generation rates for a water-cooled LiFePO4 battery. Int. J. Heat Mass Transf. 2016, 101, 1093–1102. [Google Scholar] [CrossRef]
  17. Panchal, S.; Dincer, I.; Agelin-Chaab, M.; Fraser, R.; Fowler, M. Thermal modeling and validation of temperature distributions in a prismatic lithium-ion battery at different discharge rates and varying boundary conditions. Appl. Therm. Eng. 2016, 96, 190–199. [Google Scholar] [CrossRef]
  18. Bandhauer, T.M.; Garimella, S.; Fuller, T.F. A Critical Review of Thermal Issues in Lithium-Ion Batteries. J. Electrochem. Soc. 2011, 158, R1–R25. [Google Scholar] [CrossRef]
  19. Wang, F.; Li, X. The stagnant thermal conductivity of porous media predicted by the random walk theory. Int. J. Heat Mass Transf. 2017, 107, 520–523. [Google Scholar] [CrossRef]
  20. Singh, R.; Kasana, H.S. Computational aspects of thermal conductivity of highly porous metal foams. Appl. Therm. Eng. 2004, 24, 1841–1849. [Google Scholar] [CrossRef]
  21. Kizilel, R.; Lateef, A.; Sabbah, R.; Farid, M.M.; Selman, J.R.; Al-Hallaj, S. Passive control of temperature excursion and uniformity in high-energy Li-ion battery packs at high current and ambient temperature. J. Power Sources 2008, 183, 370–375. [Google Scholar] [CrossRef]
  22. Yan, J.; Li, K.; Chen, H.; Wang, Q.; Sun, J. Experimental study on the application of phase change material in the dynamic cycling of battery pack system. Energy Convers. Manag. 2016, 128, 12–19. [Google Scholar] [CrossRef]
  23. Li, W.Q.; Qu, Z.G.; He, Y.L.; Tao, Y.B. Experimental study of a passive thermal management system for high-powered lithium ion batteries using porous metal foam saturated with phase change materials. J. Power Sources 2015, 255, 403–410. [Google Scholar] [CrossRef]
  24. Sabbah, R.; Kizilel, R.; Selman, J.R.; Al-Hallaj, S. Active (air-cooled) vs. passive (phase change material) thermal management of high power lithium-ion packs: Limitation of temperature rise and uniformity of temperature distribution. J. Power Sources 2008, 182, 630–638. [Google Scholar] [CrossRef]
  25. Onda, K.; Oshima, T.; Nakayama, M.; Fukuda, K.; Araki, T. Thermal behavior of small lithium-ion battery during rapid charge and discharge cycles. J. Power Sources 2006, 158, 535–542. [Google Scholar] [CrossRef]
Figure 1. (a) Experimental setup for heat generation measurement; (b) side view of the battery in the acrylic container; and (c) front view of the battery in the acrylic container.
Energies 11 01243 g001
Figure 2. (a) Thermocouple locations on the cell surface; (b) the measured average temperature and temperatures at two locations (1 and 5) on the cell surface when the cell was discharged at 4 C (78 A); and (c) The thermal image (with identified thermocouple locations) on the cell surface after the cell was discharged at 4 C for 5 min (6.5 Ah capacity).
Energies 11 01243 g002
Figure 3. The entropy coefficient of the cell as a function of SoC.
Energies 11 01243 g003
Figure 4. The amount of heat accumulated in the cell setup when the cell was charged at various current rates followed by resting under room conditions.
Energies 11 01243 g004
Figure 5. Heat generation rates (a) as a function of SoC during charging and (b) as a function of DoD during discharging at various current rates by temperature increase approach.
Energies 11 01243 g005
Figure 6. Comparison of heat generation characteristics of the cell for a charging and discharging cycle as a function of SoC at (a) 1 C (b) 2 C (c) 3 C and (d) 4 C current rates.
Energies 11 01243 g006
Figure 7. Comparison of average temperature increase on the cell surface as a function of DoD using various cooling materials at (a) 1 C (b) 2 C and (c) 3 C current rates. The dashed line indicates the melting temperature of the PCM.
Energies 11 01243 g007aEnergies 11 01243 g007b
Figure 8. Comparison of average temperature increase on the cell surface as a function of DoD using various cooling materials at (a) 1 C (b) 2 C and (c) 3 C current rates. The dashed line indicates the melting temperature of the PCM.
Energies 11 01243 g008
Table 1. Summary of total heat generation using various methods at the end of cycle.
RatesOverpotential Using OCV (kJ)Overpotential Using Voltage Difference (kJ)Temperature Increase (kJ)
1 C30.34 ± 1.3729.81 ± 0.7522.23 ± 0.97
2 C54.29 ± 3.6053.32 ± 6.6634.68 ± 7.23
3 C68.71 ± 2.4868.73 ± 10.5848.06 ± 10.62
4 C110.66 ± 6.07110.04 ± 8.7657.47 ± 8.71
Table 2. Summary of the properties of various cooling materials.
MaterialMass (kg)Specific Heat Capacity (J/kg/K)Total Heat Capacity (J/K)Thermal Conductivity (W/m/K)
Air2.45 × 10−510000.0240.026
Foam + air8.08 × 10−289572.316.85 [19,20]
PCM0.491121601060.980.36
Water0.63742002679.260.60
Water + foam0.57 (water) 8.08 × 10⁻² (foam)4200 (water) 895 (foam)2466.317.66 [20]

