Article

Optimal Efficiency Tracking Control Scheme Based on Power Stabilization for a Wireless Power Transfer System with Multiple Receivers

Department of Electrical Engineering, Harbin Institute of Technology, Harbin 150001, China
*
Author to whom correspondence should be addressed.
Energies 2018, 11(5), 1232; https://doi.org/10.3390/en11051232
Submission received: 29 March 2018 / Revised: 3 May 2018 / Accepted: 4 May 2018 / Published: 12 May 2018
(This article belongs to the Special Issue Wireless Power Transfer 2018)

Abstract

:
With the increase of charging requirements in electrical equipment, the wireless power transfer (WPT) system with multiple receivers has gained more attention as the charging power and efficiency of a WPT system depends on the equivalent reflected impedance of the load. Based on the circuit model analysis of a single receiver WPT system, this paper investigated the multiple-receiver WPT system. The relationship between the mutual inductance, load, and system efficiency was discussed and the optimal load, the equivalent reflected impedance, and power division method were analyzed to design the proposed system control scheme. With the use of the perturbation and observation (P&O) algorithm control method, the current of transfer and receivers were regulated to achieve stable constant power charging. Furthermore, when searching the minimum input power of the system, the optimal efficiency under a fixed power division ratio was also received. The validity of the proposed system control method was confirmed by simulation and experimental results. Under the proposed control method, an efficiency above 80% can be achieved for a multiple-receiver WPT system with a fixed power division ratio working at 6.78 MHz.

1. Introduction

Wireless power transfer (WPT) systems for consumer electronic devices such as mobile phones, wearable devices, and micro robots are gaining more attention [1,2,3]. Many studies have been performed on wireless battery charging for intelligent devices and medical applications [4,5,6,7]. Usually, the ideal WPT system is expected to transmit energy efficiently, regardless of the relative position of the transmitter and receiver. However, in practical terms, when the distance of the receiver and transmitter do not meet the optimal transmission region, the efficiency is quite low [8]. Furthermore, in a multi-receiver wireless power transfer system, the receiving devices may have many different sizes, positions, load characteristics, and power requirements. Receivers near to the transmitter tend to absorb more power. There have been many achievements in circuit analysis, modeling, and the optimization of traditional WPT systems. However, there have been relatively few studies on multiple-receiver WPT systems. Although there has been some basic research addressing efficiency issues, the power allocation to power has not been considered. References [9,10] analyzed the efficiency of multiple-receiver systems under different conditions, but failed to propose power division and methods of efficiency improvement. The authors in Reference [11] proposed a method for designing circuit parameters based on different receivers and used the frequency tracking method to compensate for the system efficiency. However, it did not control the power assigned to each receiver. In Reference [12], an impedance inverter was inserted into the receiver end based on an equivalent circuit model. The power distribution of each receiver was controllable; however, the efficiency of the system was not improved using this method.
In a multiple-receiver WPT system, the power division control is as important as efficiency optimization. To satisfy the power distribution, efforts have been made to develop a practical system by improving system efficiency; containing more control freedom as well as more power stages. For example, References [13,14] proposed a time-division control for a multi-receiver WPT transmission system and a control method based on game theory for the receiver, which optimized the efficiency of the system while efficiently allocating the power of the receiving end. The receiver power ratio at the maximum efficiency of the system was obtained under the uncontrolled conditions [15]. Additional coils can be used to control the power flow with multiple receivers, enabling multiple small receivers to charge at a certain degree of spatial freedom [1]. A multi-transmitter multi-receiver system configuration was also developed in Reference [16]. The study of power transmission, while accompanied by data transmission, was implemented based on wearable devices [17,18]. All of these fundamental works show the variety of possible solutions for multiple-receiver applications. These works have proposed various solutions for multiple-receiver applications and have contributed to the research on multiple-receiver systems. However, in practical applications, more practical issues need to be considered, such as efficiency optimization, control complexity, power regulation, and device miniaturization requirements. Therefore, in a multiple-receiver WPT system, it is important to develop a suitable design and control scheme in practice. This paper presents a power division and optimal efficiency tracking control method based on a 6.78 MHz system. The system equations were derived and discussed. Finally, the effectiveness of the method was verified by experiments.

2. System Structure and Theoretical Analysis

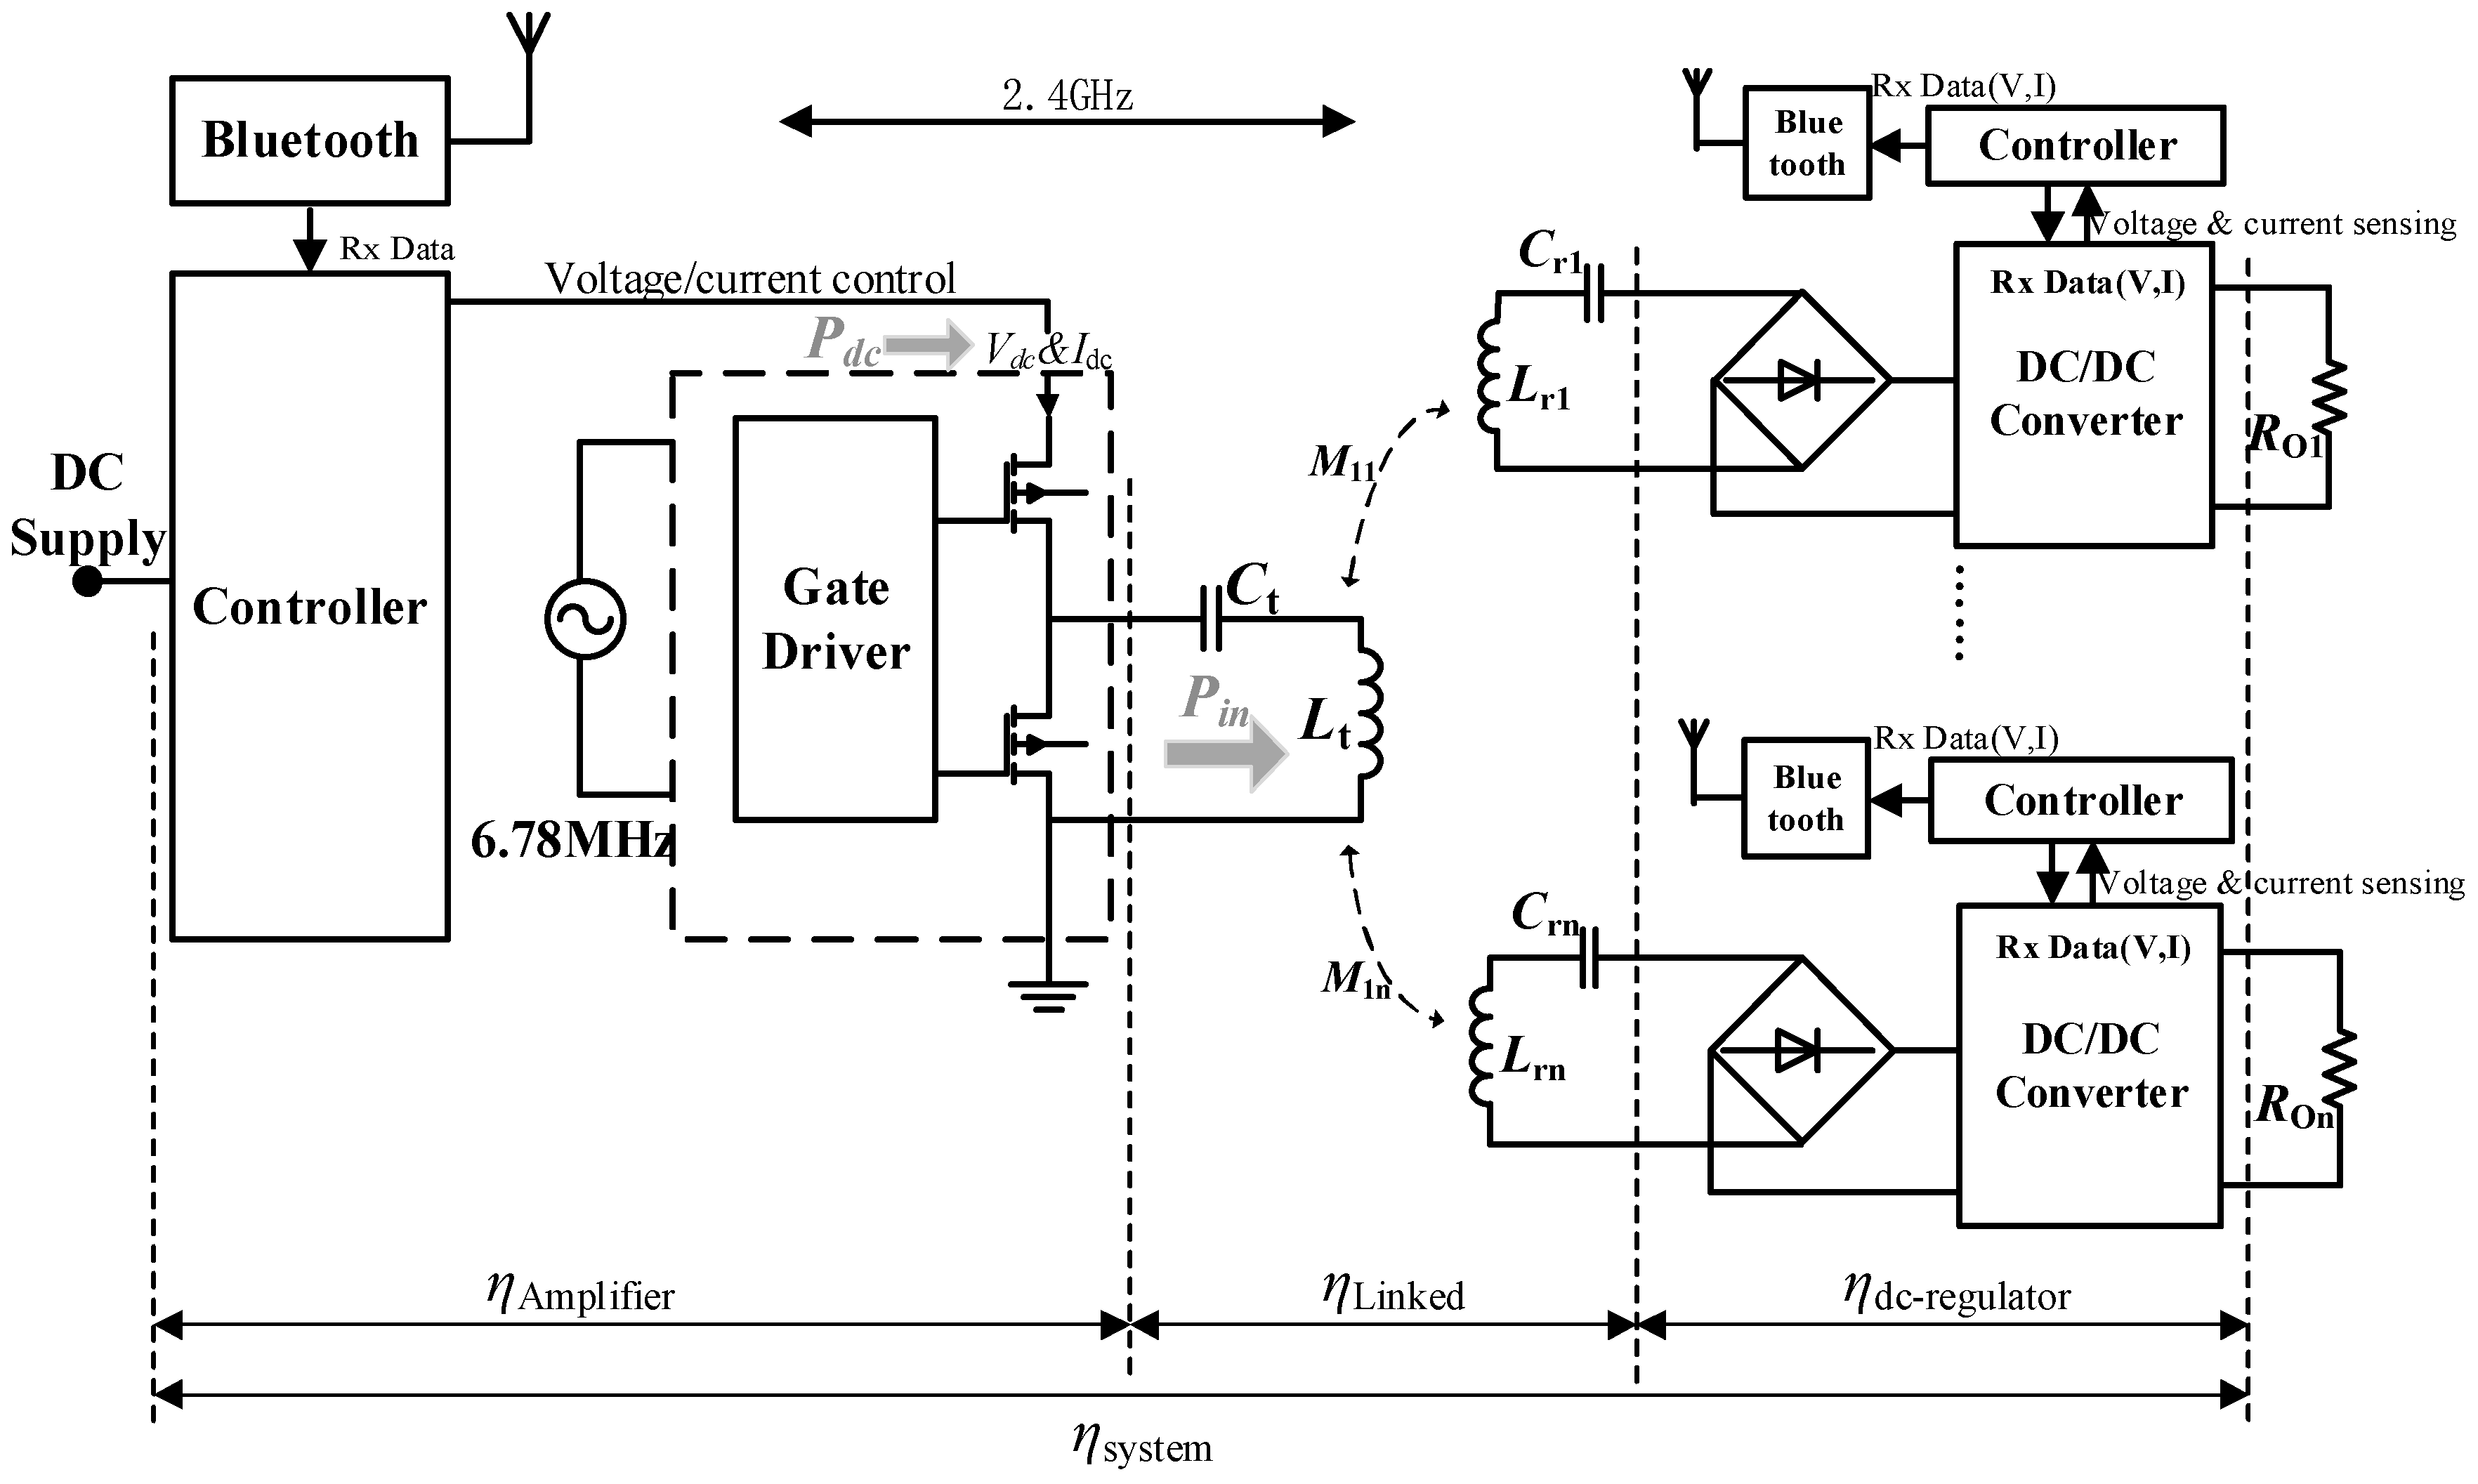
2.1. System Structure

The WPT system includes a variety of topological structures. Among the four basic topologies mentioned in Reference [19], only the series-series (SS) topology looking from the power source is independent of either the coupling coefficient or the load resistance at the resonant frequency.
ω = 1 L t C t = 1 L r 1 C r 1
Furthermore, the power reflection from the receiving side to the transmitting side is eliminated at this frequency. Therefore, the SS structure is widely used for variation load systems, such as the battery-charging WPT system [20,21]. So, in this paper, the SS structure was also used as the system structure.
As shown in Figure 1, it had the typical structure of a multiple-receiver WPT system. The transmitter (composed of a power amplifier and control structure) as well as multiple receivers (composed of a full-bridge rectifier) and a DC-DC converter were implemented at 6.78 MHz. Lt and Ct are the self-inductance and the resonant capacitance of the transmitter. Lr1 to Lrn, Cr1 to Crn, and Ro1 to Ron are the inductances, resonant capacitance, and load resistance of the multiple receivers, respectively. M11 to M1n are the mutual inductance between transmitter and the multiple receivers. ηAmplifier, ηLinked, and ηdc-regulator denote the efficiency of the power amplifier, transformation, and DC regulator, respectively.

2.2. Optimal Load Condition for Reflected Impedance Match

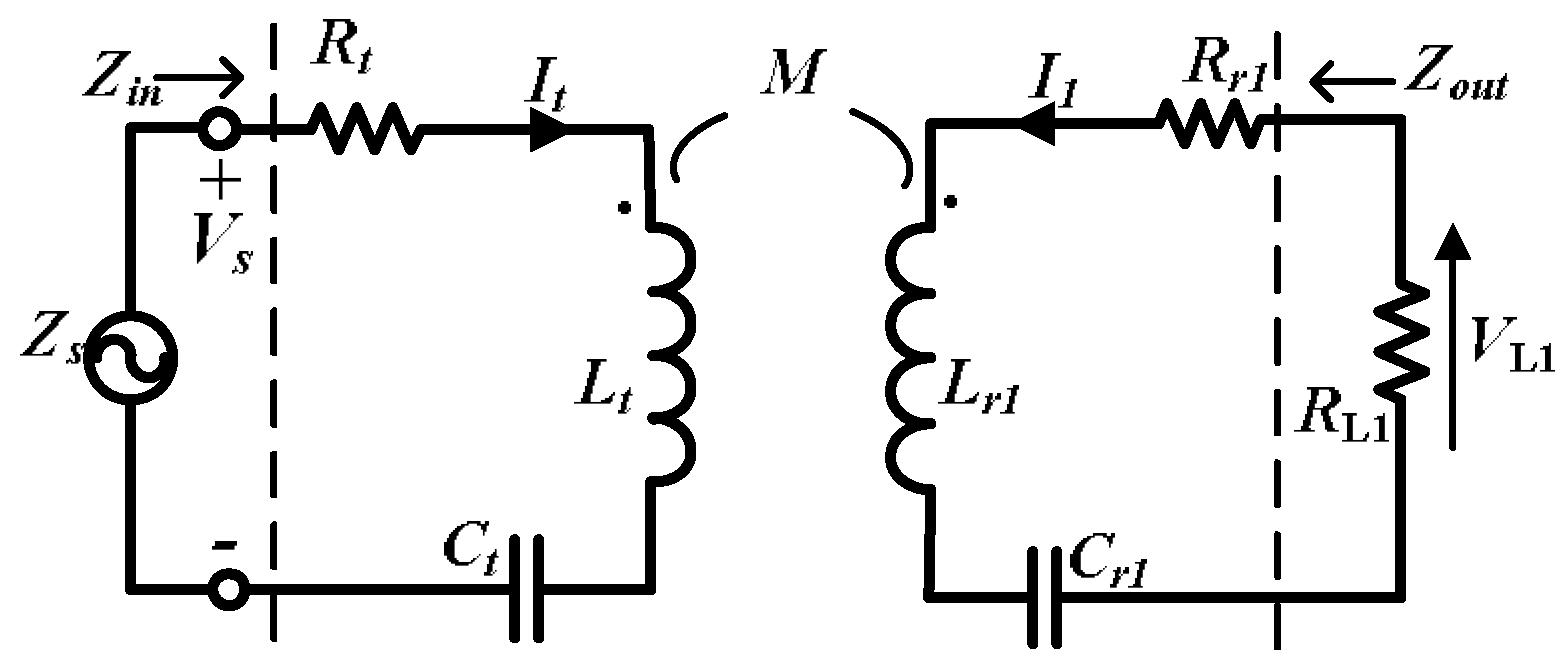
2.2.1. System with Single Receiver

Figure 2 demonstrates an equivalent circuit of a single-receiver WPT system. In a magnetic coupling resonant wireless power transmission system, power is transferred by a pair of coupled coils. The relationship between the mutual inductance M and coupling coefficient of coils k is expressed as:
M = k L t L r 1
Assuming that all the resonant circuits share the same resonant frequency ω, then:
j ω L t + 1 j ω C t 0
j ω L r 1 + 1 j ω C r 1 0
The reflected impedance of the receiver on the transmitter can be represented as:
Z R 1 = ω 2 M 2 R L 1 + R r 1 + j ( ω L r 1 1 ω C r 1 ) = ( ω M ) 2 R L 1 + R r 1
RL1 denotes the equivalent AC load of the system. The impedances Zin and Zout viewed from the transmitter toward the load and viewed from the receiver toward the source are expressed as:
Z i n = Z R 1 + R t + j ( ω L t 1 ω C t ) = R t + ω 2 M 2 R L 1 + R r 1
Z o u t = ω 2 M 2 R t + j ( ω L t 1 ω C t ) + R r 1 + j ( ω L r 1 1 ω C r 1 ) = R r 1 + ω 2 M 2 R t
Based on the equivalent Kirchhoff’s Voltage Law (KVL), the equation in the transmitting process can be obtained:
[ V S 0 ] = [ R t j ω M j ω M R L 1 + R r 1 ] [ I t I 1 ]
Solving current I1 in terms of It:
I 1 = j ω M R L 1 + R r 1 I t
Here, a loss coefficient is defined to express the relationship between the resistance and reactance of the coupling coils. The loss coefficient of transmitter qt and receiver qr1 are expressed separately:
q t = R t ω L t   q r 1 = R L 1 + R r 1 ω L r 1
With the current flowing the load, the power can be derived as:
P r 1 = | I 1 | 2 ( R L 1 + R r 1 )
Substituting Equation (9) into Equation (11), then replacing load with the loss coefficient and coupling coefficient from Equation (1), we obtain:
P r 1 = k 1 2 q r 1 ω L t | I t | 2
The efficiency for the receiver is:
η = P r 1 P i n = Z R 1 R L 1 R r 1 + R L 1 R t + R L 1 = ( ω M ) 2 R L 1 ( R r 1 + R L 1 ) 2 R t + ( ω M ) 2 ( R r 1 + R L 1 )
The optimal loads for maximum η can be obtained by solving the derivative equation:
η R L 1 = 0
Therefore, the optimal RL1 for a maximum η is expressed as:
R L 1 _ O P T = R r 1 1 + ω 2 M 2 R t R r 1
Let
K 1 = 1 + ω 2 M 2 R t R r 1
R L 1 _ O P T = R r 1 K 1
Furthermore, the maximum transfer efficiency is expressed as:
η _ o p t = K 1 1 K 1 + 1

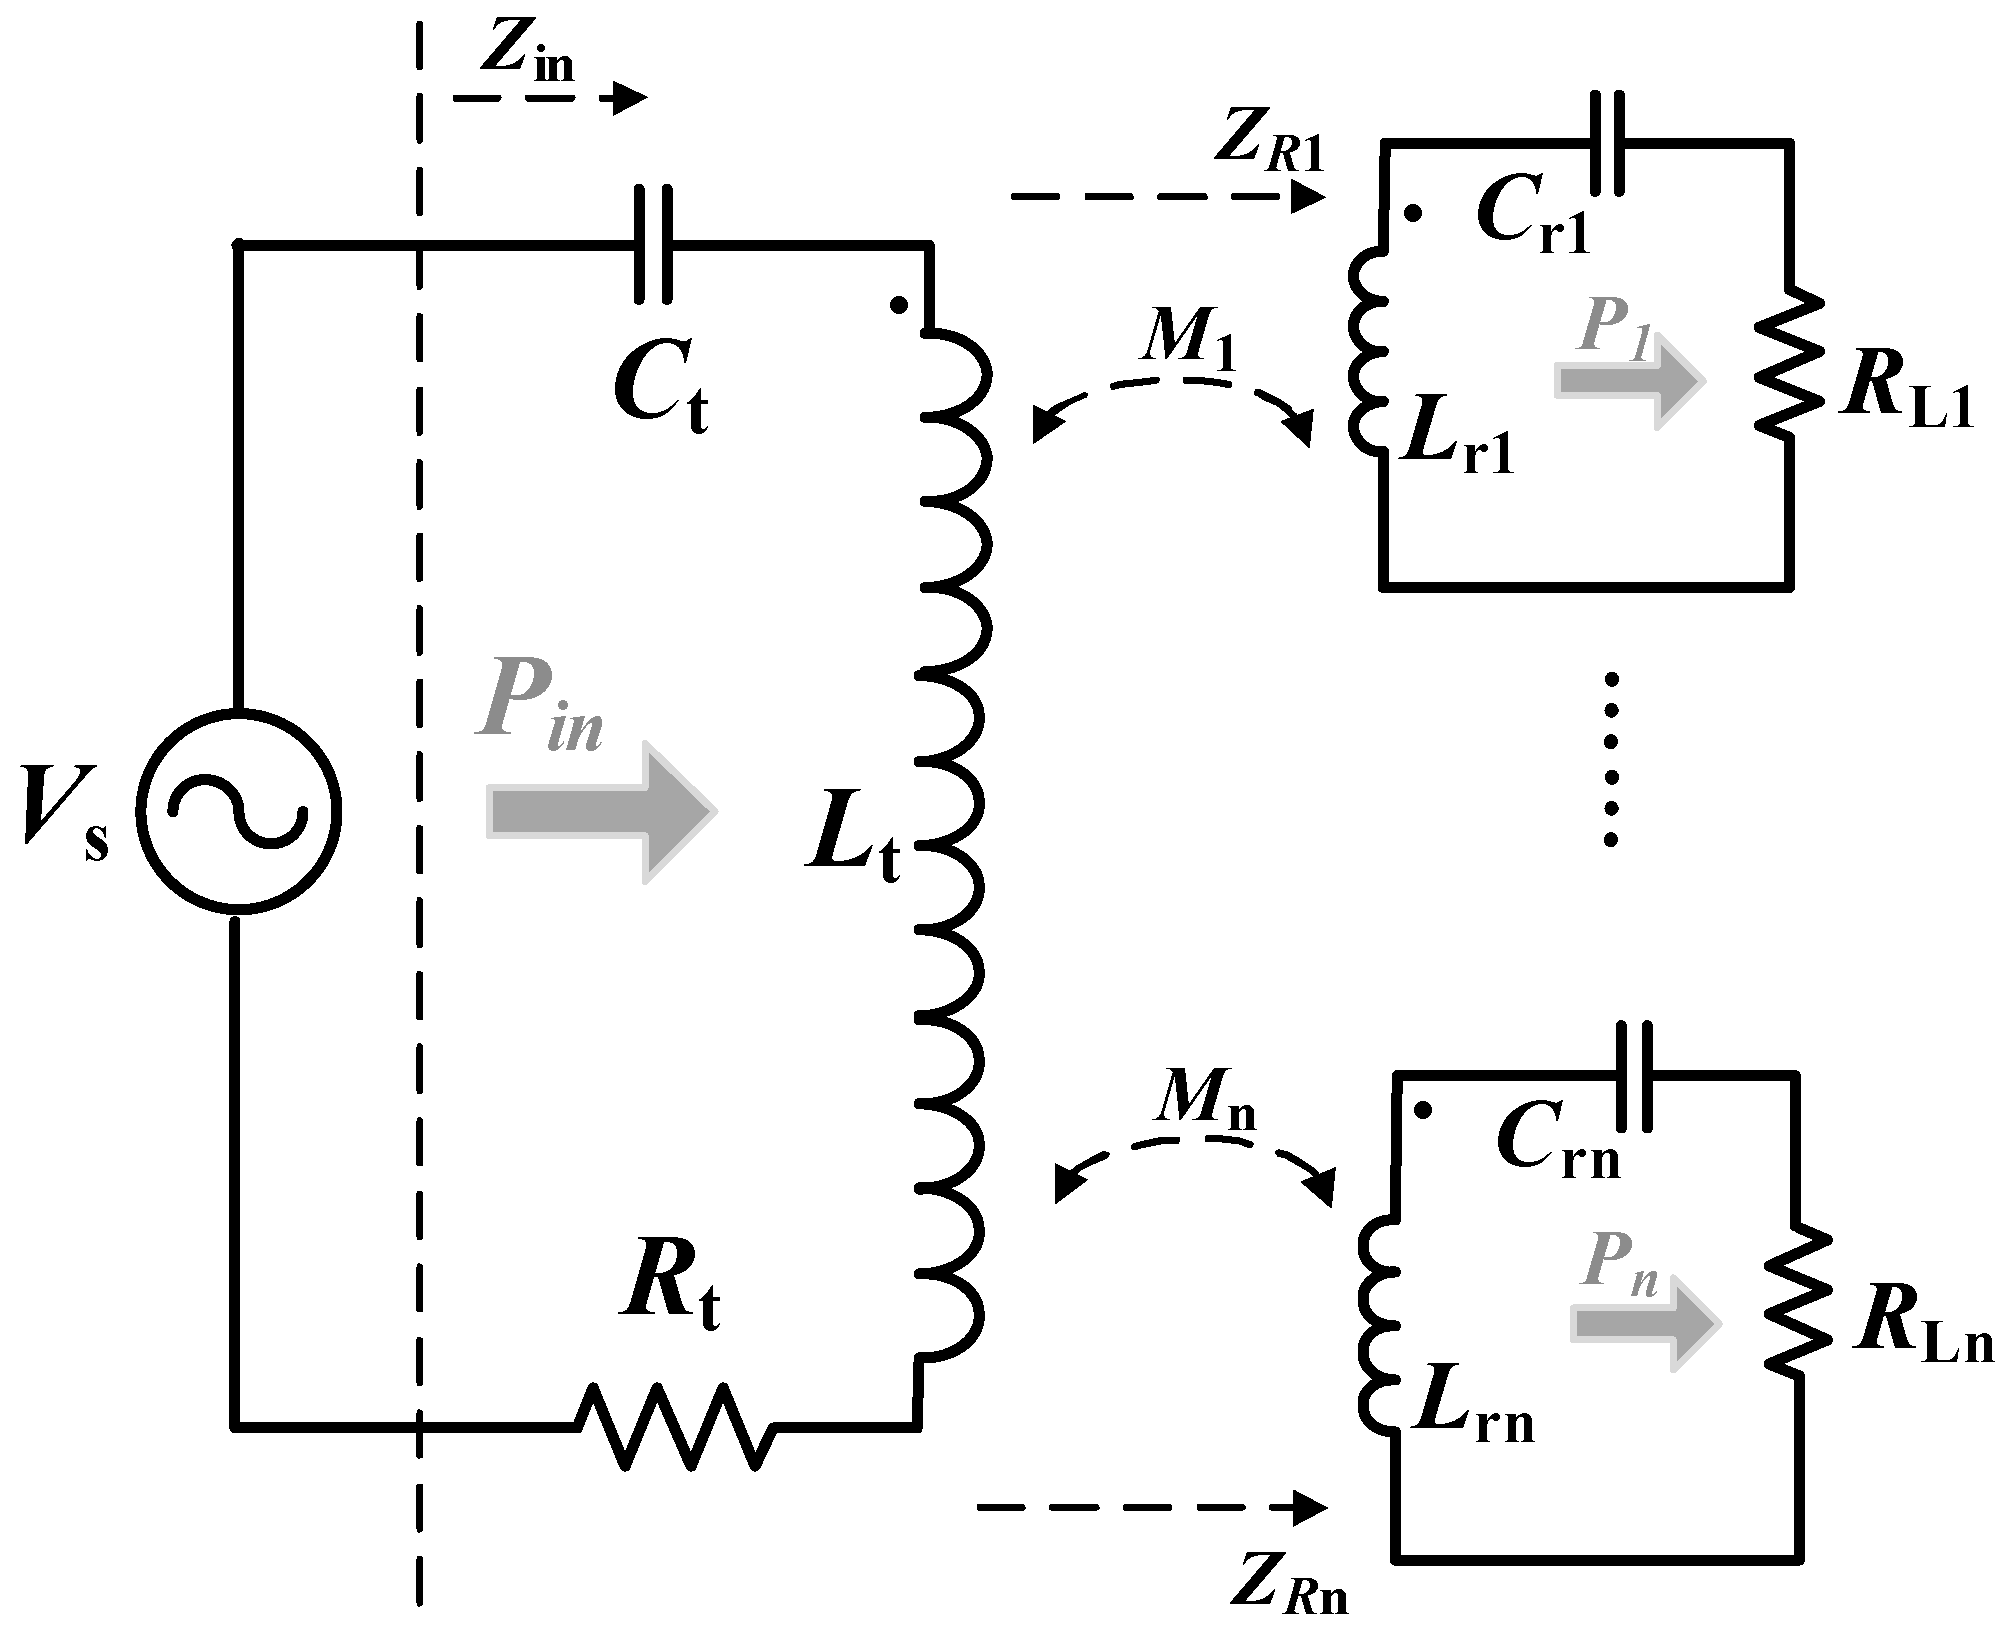
2.2.2. System with Multiple Receivers

In Figure 3, a multiple-receiver WPT system is represented. There is one transmitter and several (n ≥ 2) receivers. All of the receivers were coupled to the transmitter. Actually, the receiver coils were inserted into the receiver devices and the size of the receivers determined the size of the coils. With the application of mobile phones and other wearable devices, the receiver size is usually quite small, and will usually not be overlapping. In this case, cross-coupling can be ignored when compared to the coupling with the transmitter [22].
Mj (j = 1, 2, ⋯, n) is the mutual inductance between the transmitter and receivers; therefore, the coupling coefficient can be expressed as:
M j = k j L t L r j   f o r   j = 1 , 2 , , n
ZR1 to ZRn are the reflected impedance looking from the transmitter to the receivers, with the expression of the loss coefficients in a multiple-receiver system given as:
q t = R t ω L t   q r j = R r j + R L j ω L r j   f o r   j = 1 , 2 , , n
The reflected impedance ZRj (j = 1, 2, …, n) can be derived using the expression of loss coefficients from Equation (20) and coupling coefficients from Equation (19):
Z R j = k j 2 q r j ω L t   f o r   j = 1 , 2 , , n
As with the single receiver WPT system, assume that all coils have the same resonant frequency. Again, applying the KVL to the multiple-receiver system in Figure 3, the relationships of voltage and current can be given as:
[ V S 0 0 0 ] = [ R t j ω M 1 j ω M 2 j ω M n j ω M 1 R L 1 + R r 1 0 0 j ω M 2 0 R L 2 + R r 2 0 j ω M n 0 0 R L n + R r n ] [ I t I 1 I 2 I n ]
From Equation (22), the relationship among the currents is:
I i = j ω M i R r i + R L i I t   f o r   i = 1 , 2 , , n
Substituting Equation (23) into Equation (22), we obtain:
V s I t = i = 0 n Z i = ( q t + i = 1 n k i 2 q r i ) ω L t
Therefore, with the same current It flowing through the impedance of each receiver, the power division ratio can be derived using the ratio of impedance as follows:
P i : P j = Z R i : Z R j = k i 2 q r i : k j 2 q r j   f o r   i , j = 1 , 2 , , n   a n d   i j
The expression of Pi can be derived as:
P i = k i 2 q r i ω L t | I t | 2   f o r   i = 1 , 2 , , n
Thus, the efficiency for the ith load is:
η i = P i P i n = Z R i R L i R r i + R L i R t + i = 1 n R L i
The system efficiency can be expressed as:
η = i = 1 n P i P i n = i = 1 n Z R i R L i R r i + R L i R t + i = 1 n R L i = i = 1 n η i
The optimal loads for the maximum η can be obtained by solving the n partial derivative equations as follows:
η R L i = 0   f o r   i = 1 , 2 n
The solution is:
R L i _ O P T = R r i K n
where
K n = 1 + i = 1 n ω 2 M i 2 R t R r i
The simplified optimal efficiency can be expressed as:
η _ o p t = K n 1 K n + 1
which is similar to Equation (18).
It can be observed that:
R L 1 _ o p t : R L 2 _ o p t : : R L n _ o p t = R r 1 : R r 2 : : R r n
which means that when all of the loads turn to the optimal load, the power division ratio is:
P i : P j = Z R i : Z R j = M i 2 R r j : M j 2 R r i   f o r   i , j = 1 , 2 , , n   a n d   i j
This shows that when the load of the receiver is optimized, the system obtains the maximum efficiency. However, the power division ratio is determined by the mutual inductance between the receiver and the transmitter and the internal resistance of each receiver coil. This is obviously out of control.

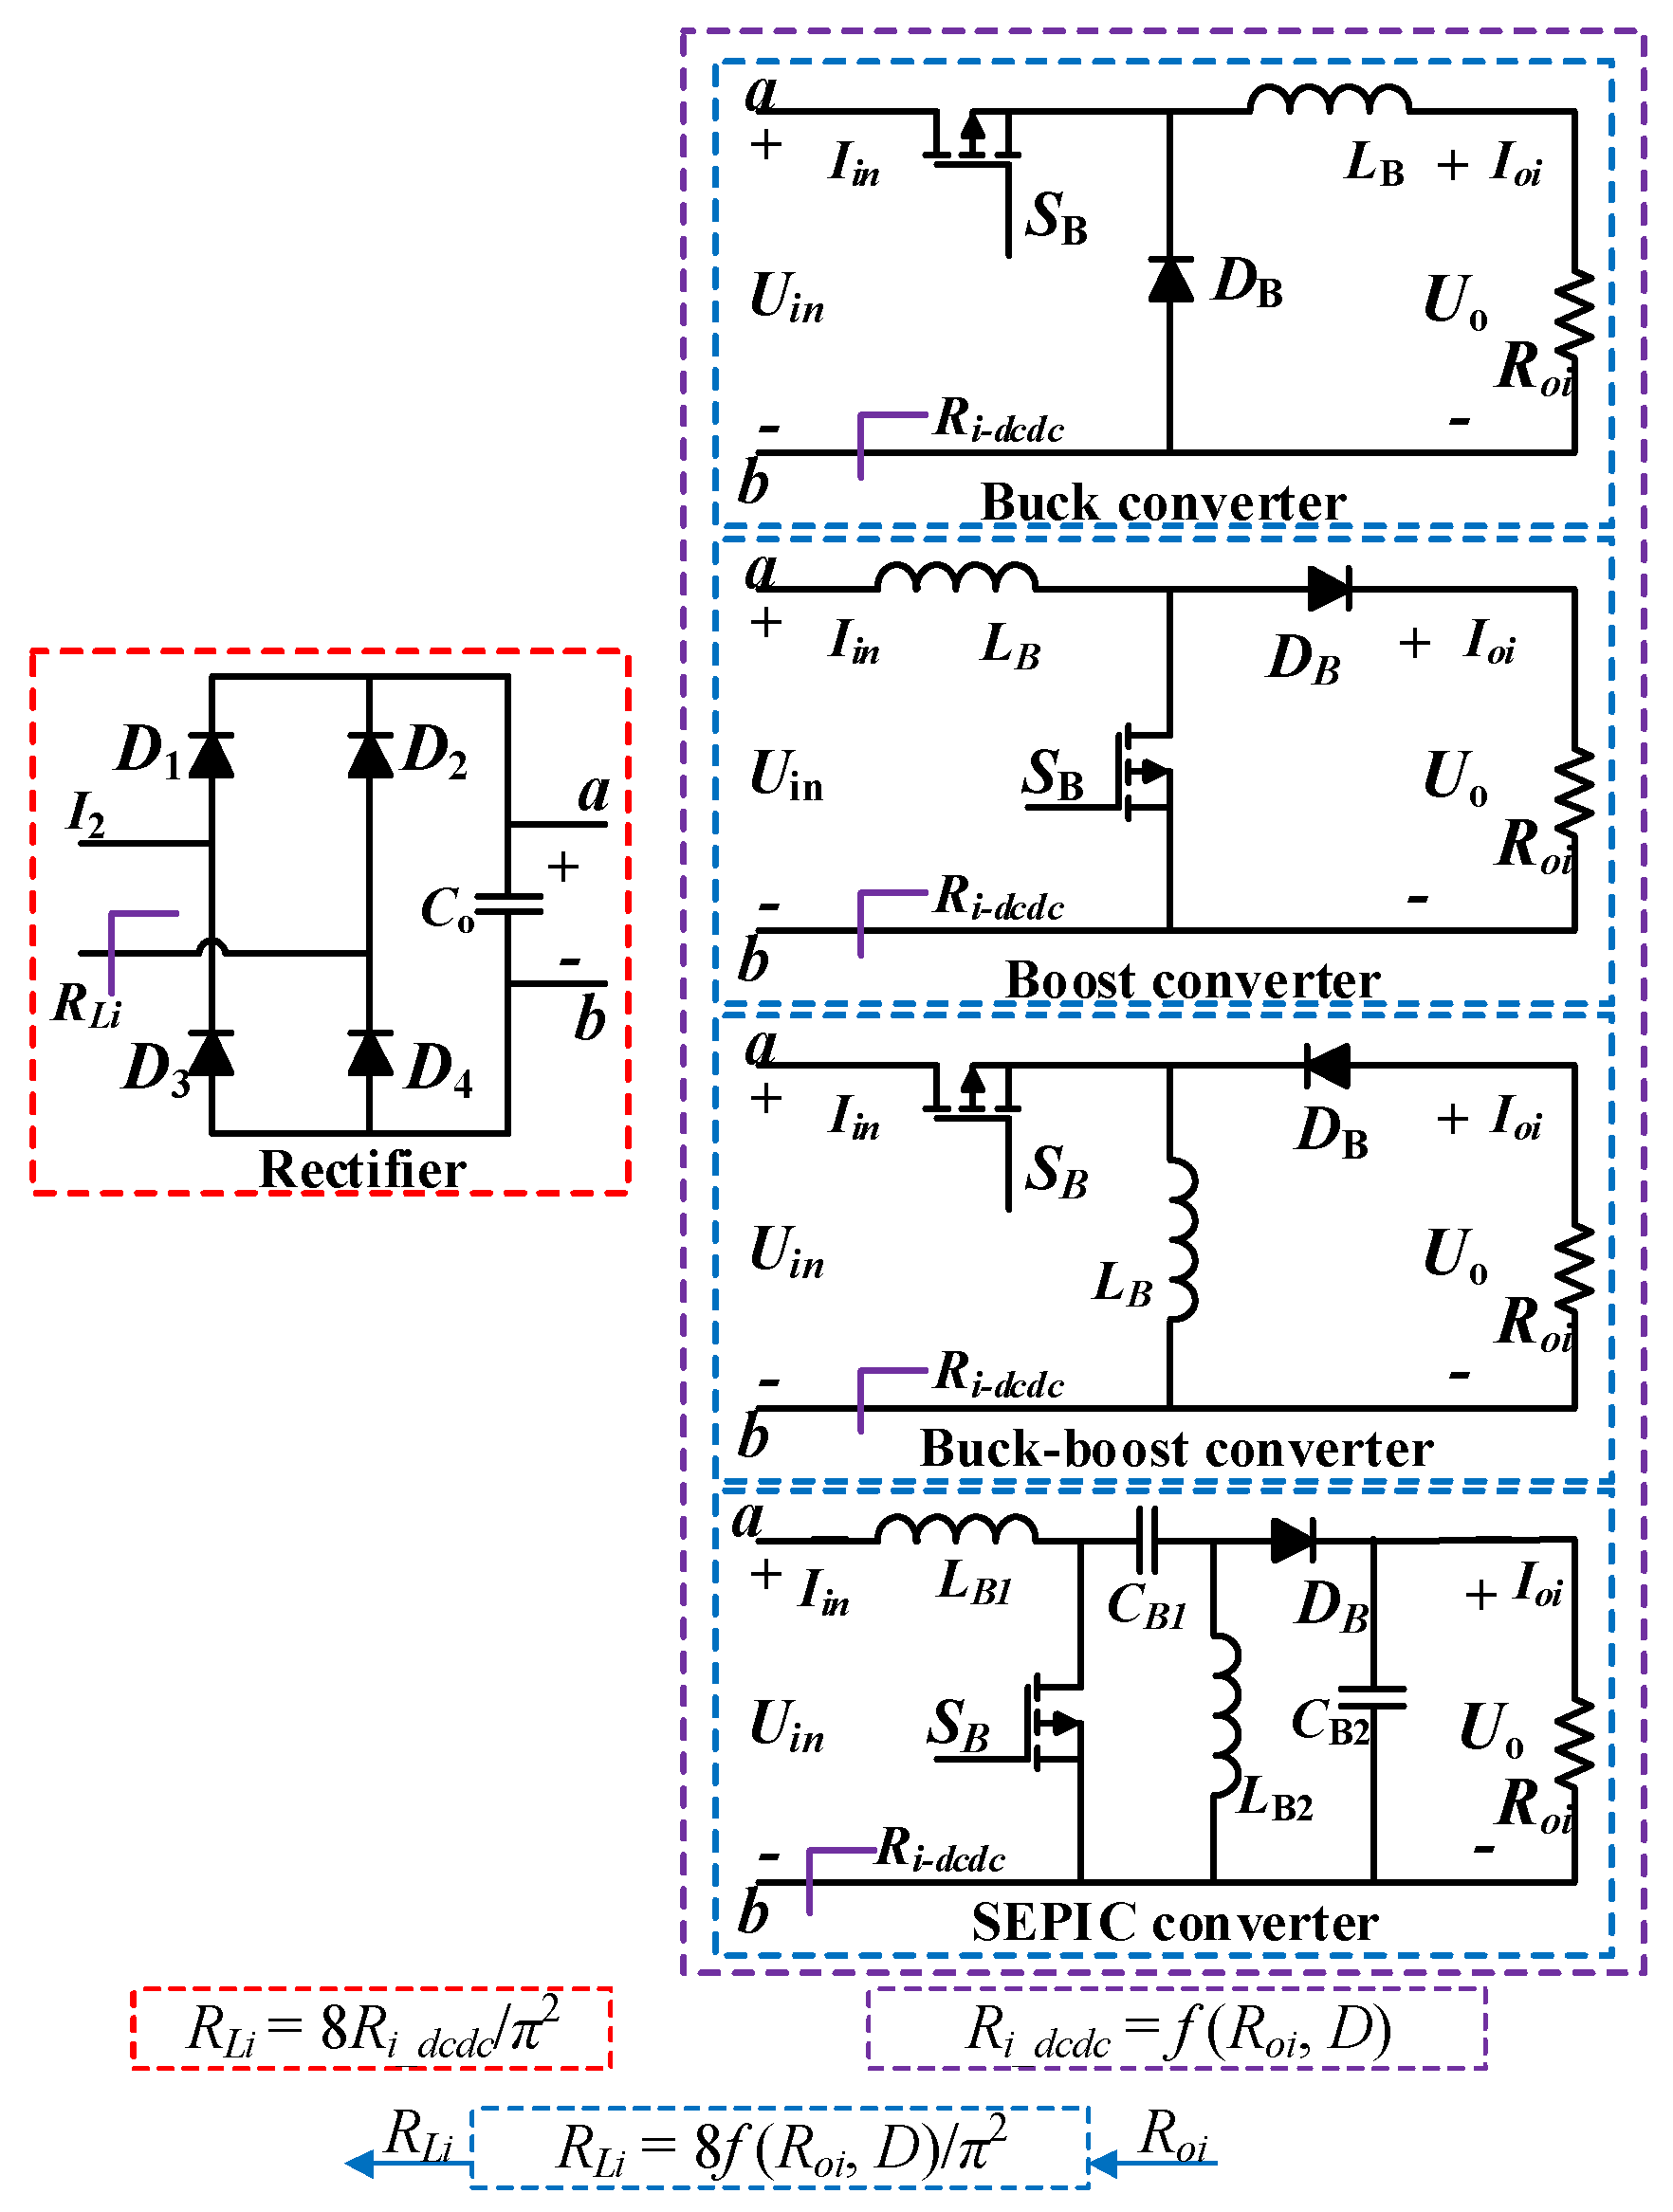
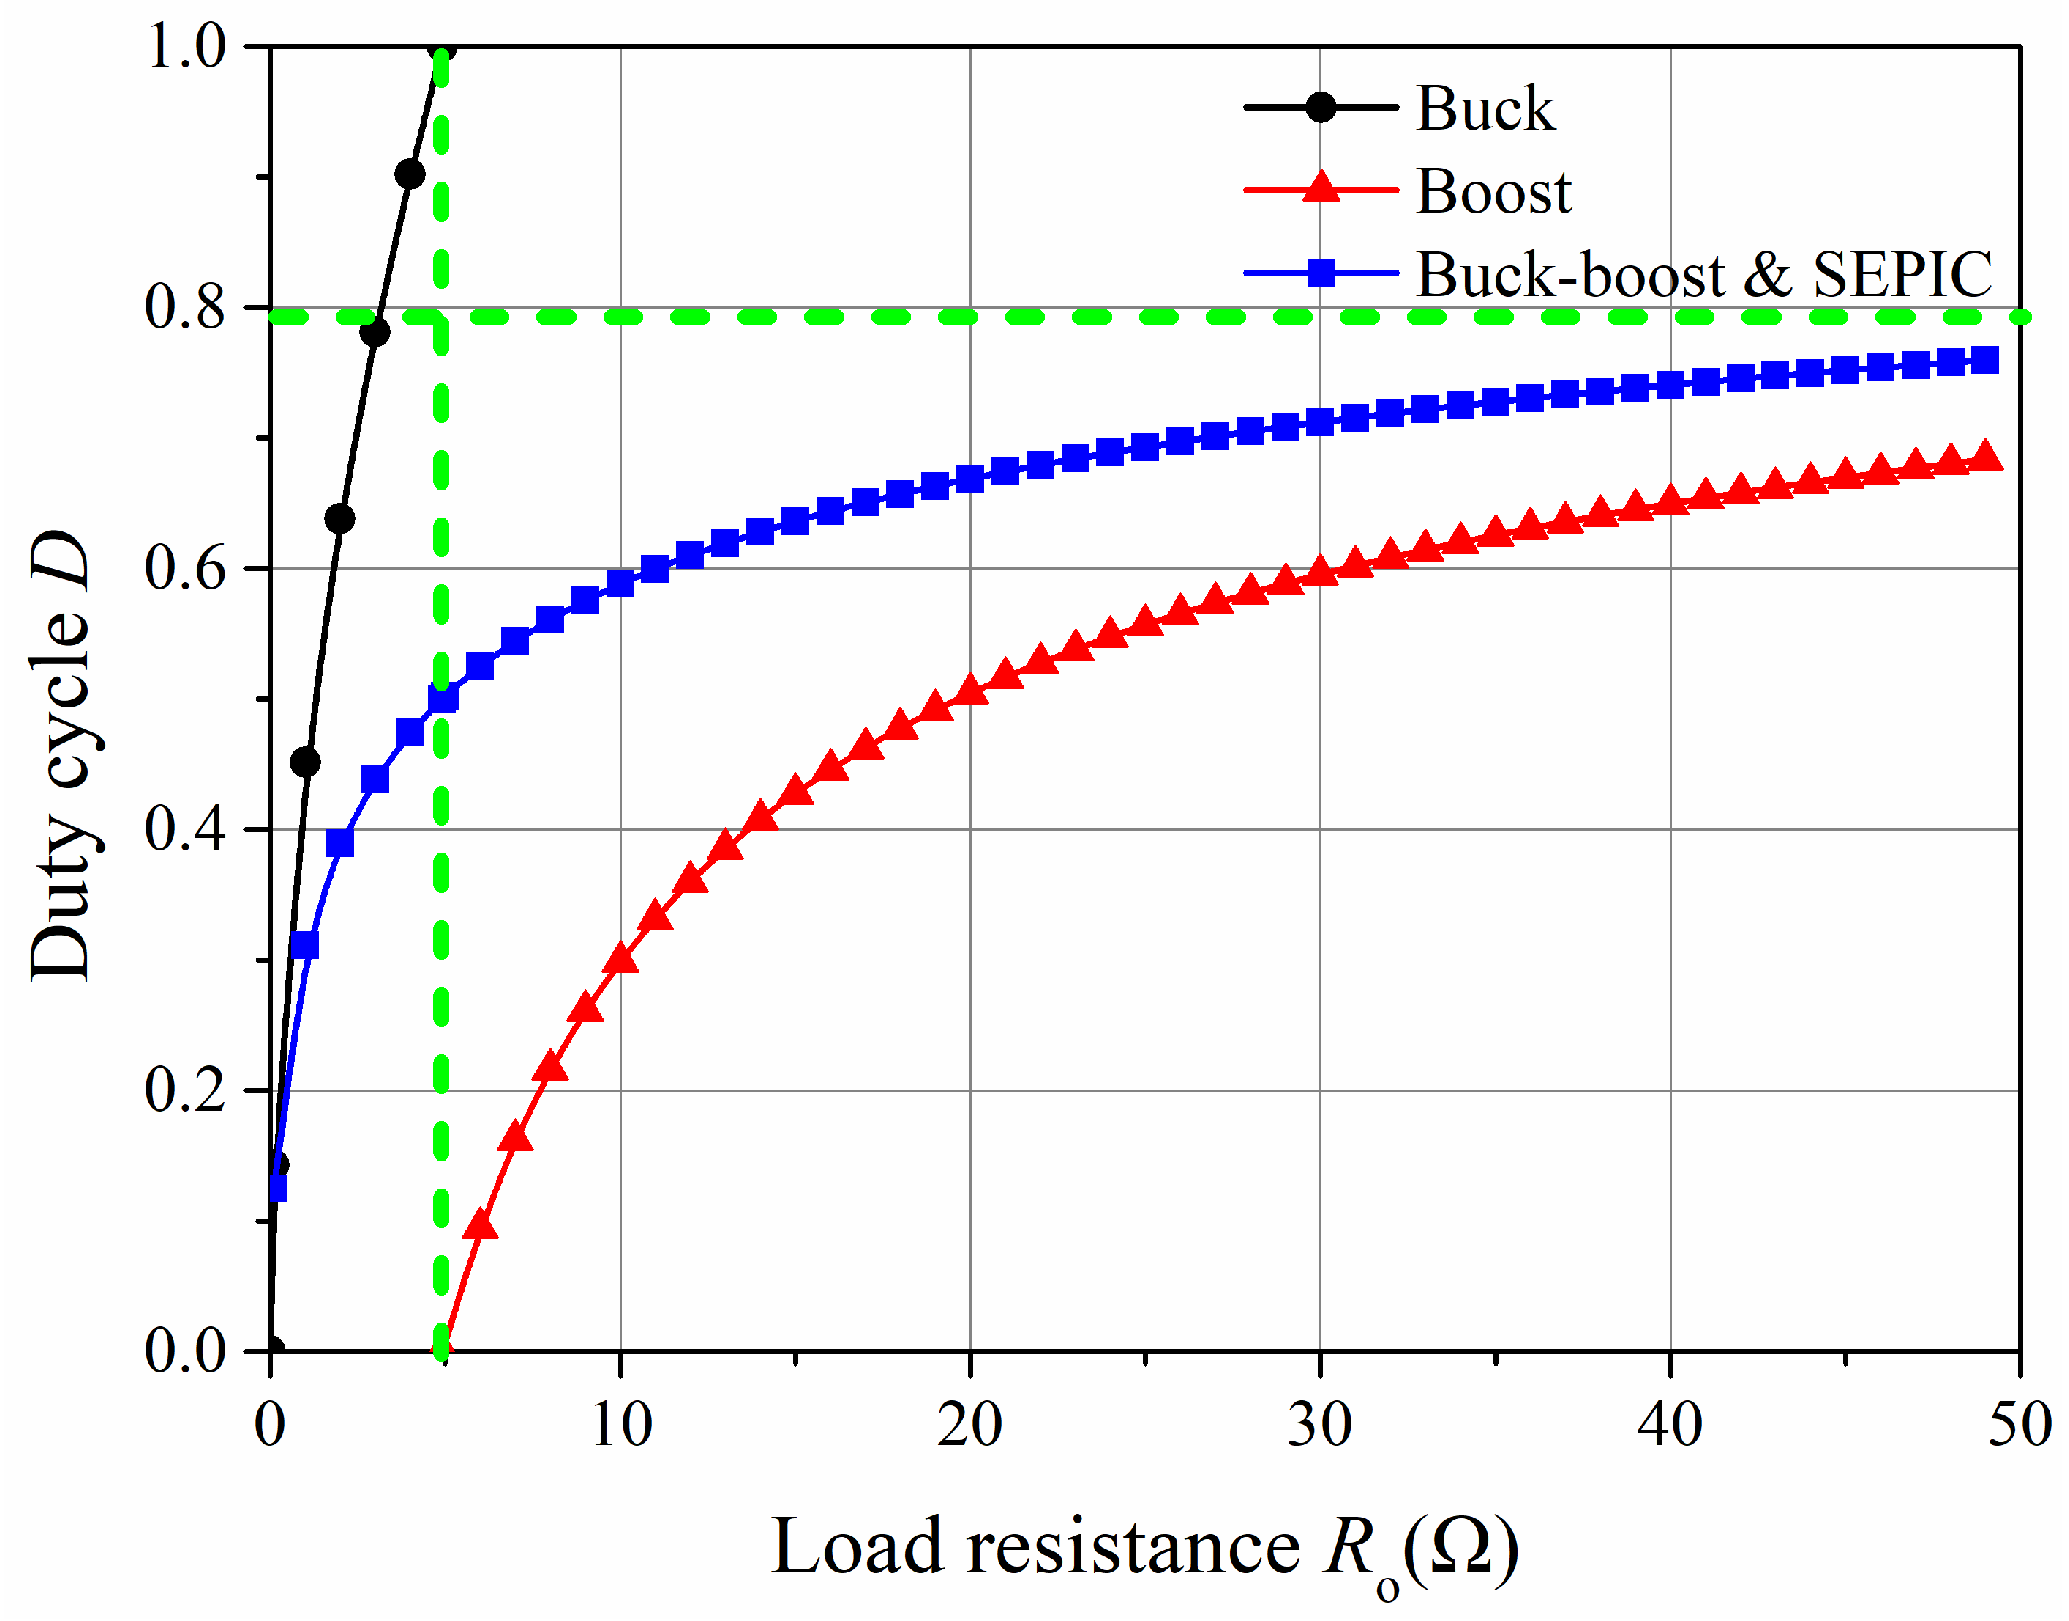
2.3. Analysis of Load Transformation

As analyzed in Section 2.2, the power division depends on the load RL when the coupling coefficient of the system is fixed. From previous research [13], we found that the DC-DC converters can be used to transform equivalent load resistance. In Figure 4, the equivalent resistance RLi looking from the rectifier was adjusted by the duty cycle D of the converter. The three equations in Figure 4 represent the process of impedance. For the Buck converter, assuming that the loss can be ignored, it was found that:
U o = D U i n
where Uo and Uin are the input and output voltages. The equivalent input resistance for the converter looking forward rectifier can be expressed as:
R L i = 8 π 2 R i _ d c d c = 8 π 2 D 2 R o i
With the adjustment of duty cycle D, Roi is regulated to the required RLi calculated by Equation (36) and then the power of the receiver can be fixed. The characteristics of other DC-DC converters used to regulate the equivalent input resistance are listed in Table 1.
As shown in Table 1, the constant duty cycle control obtains a different transformation range of the load with different DC-DC converters. Combined with the system parameters listed in Table 2 and Table 3(A), Figure 5 shows the relationship of the duty cycle D and load resistance Ro, when the equivalent input resistance is the optimal load.
In practice, the adjustment of the range of RLi depends not only on the range of Ro, but also the available duty cycle D, affected by the accuracy of the controller and MOSFET driver. From the viewpoint of previous research, the boost and single-ended primary inductance converter (SEPIC) are suitable and easy to control, as their input currents are continuous.
The SEPIC is a type of DC-DC converter that has been widely used in battery-charging applications. Similar to the buck-boost converter, it has a wide output voltage range. However, the SEPIC has a low input current harmonic achieved through the proper selection of the inductor [23,24].

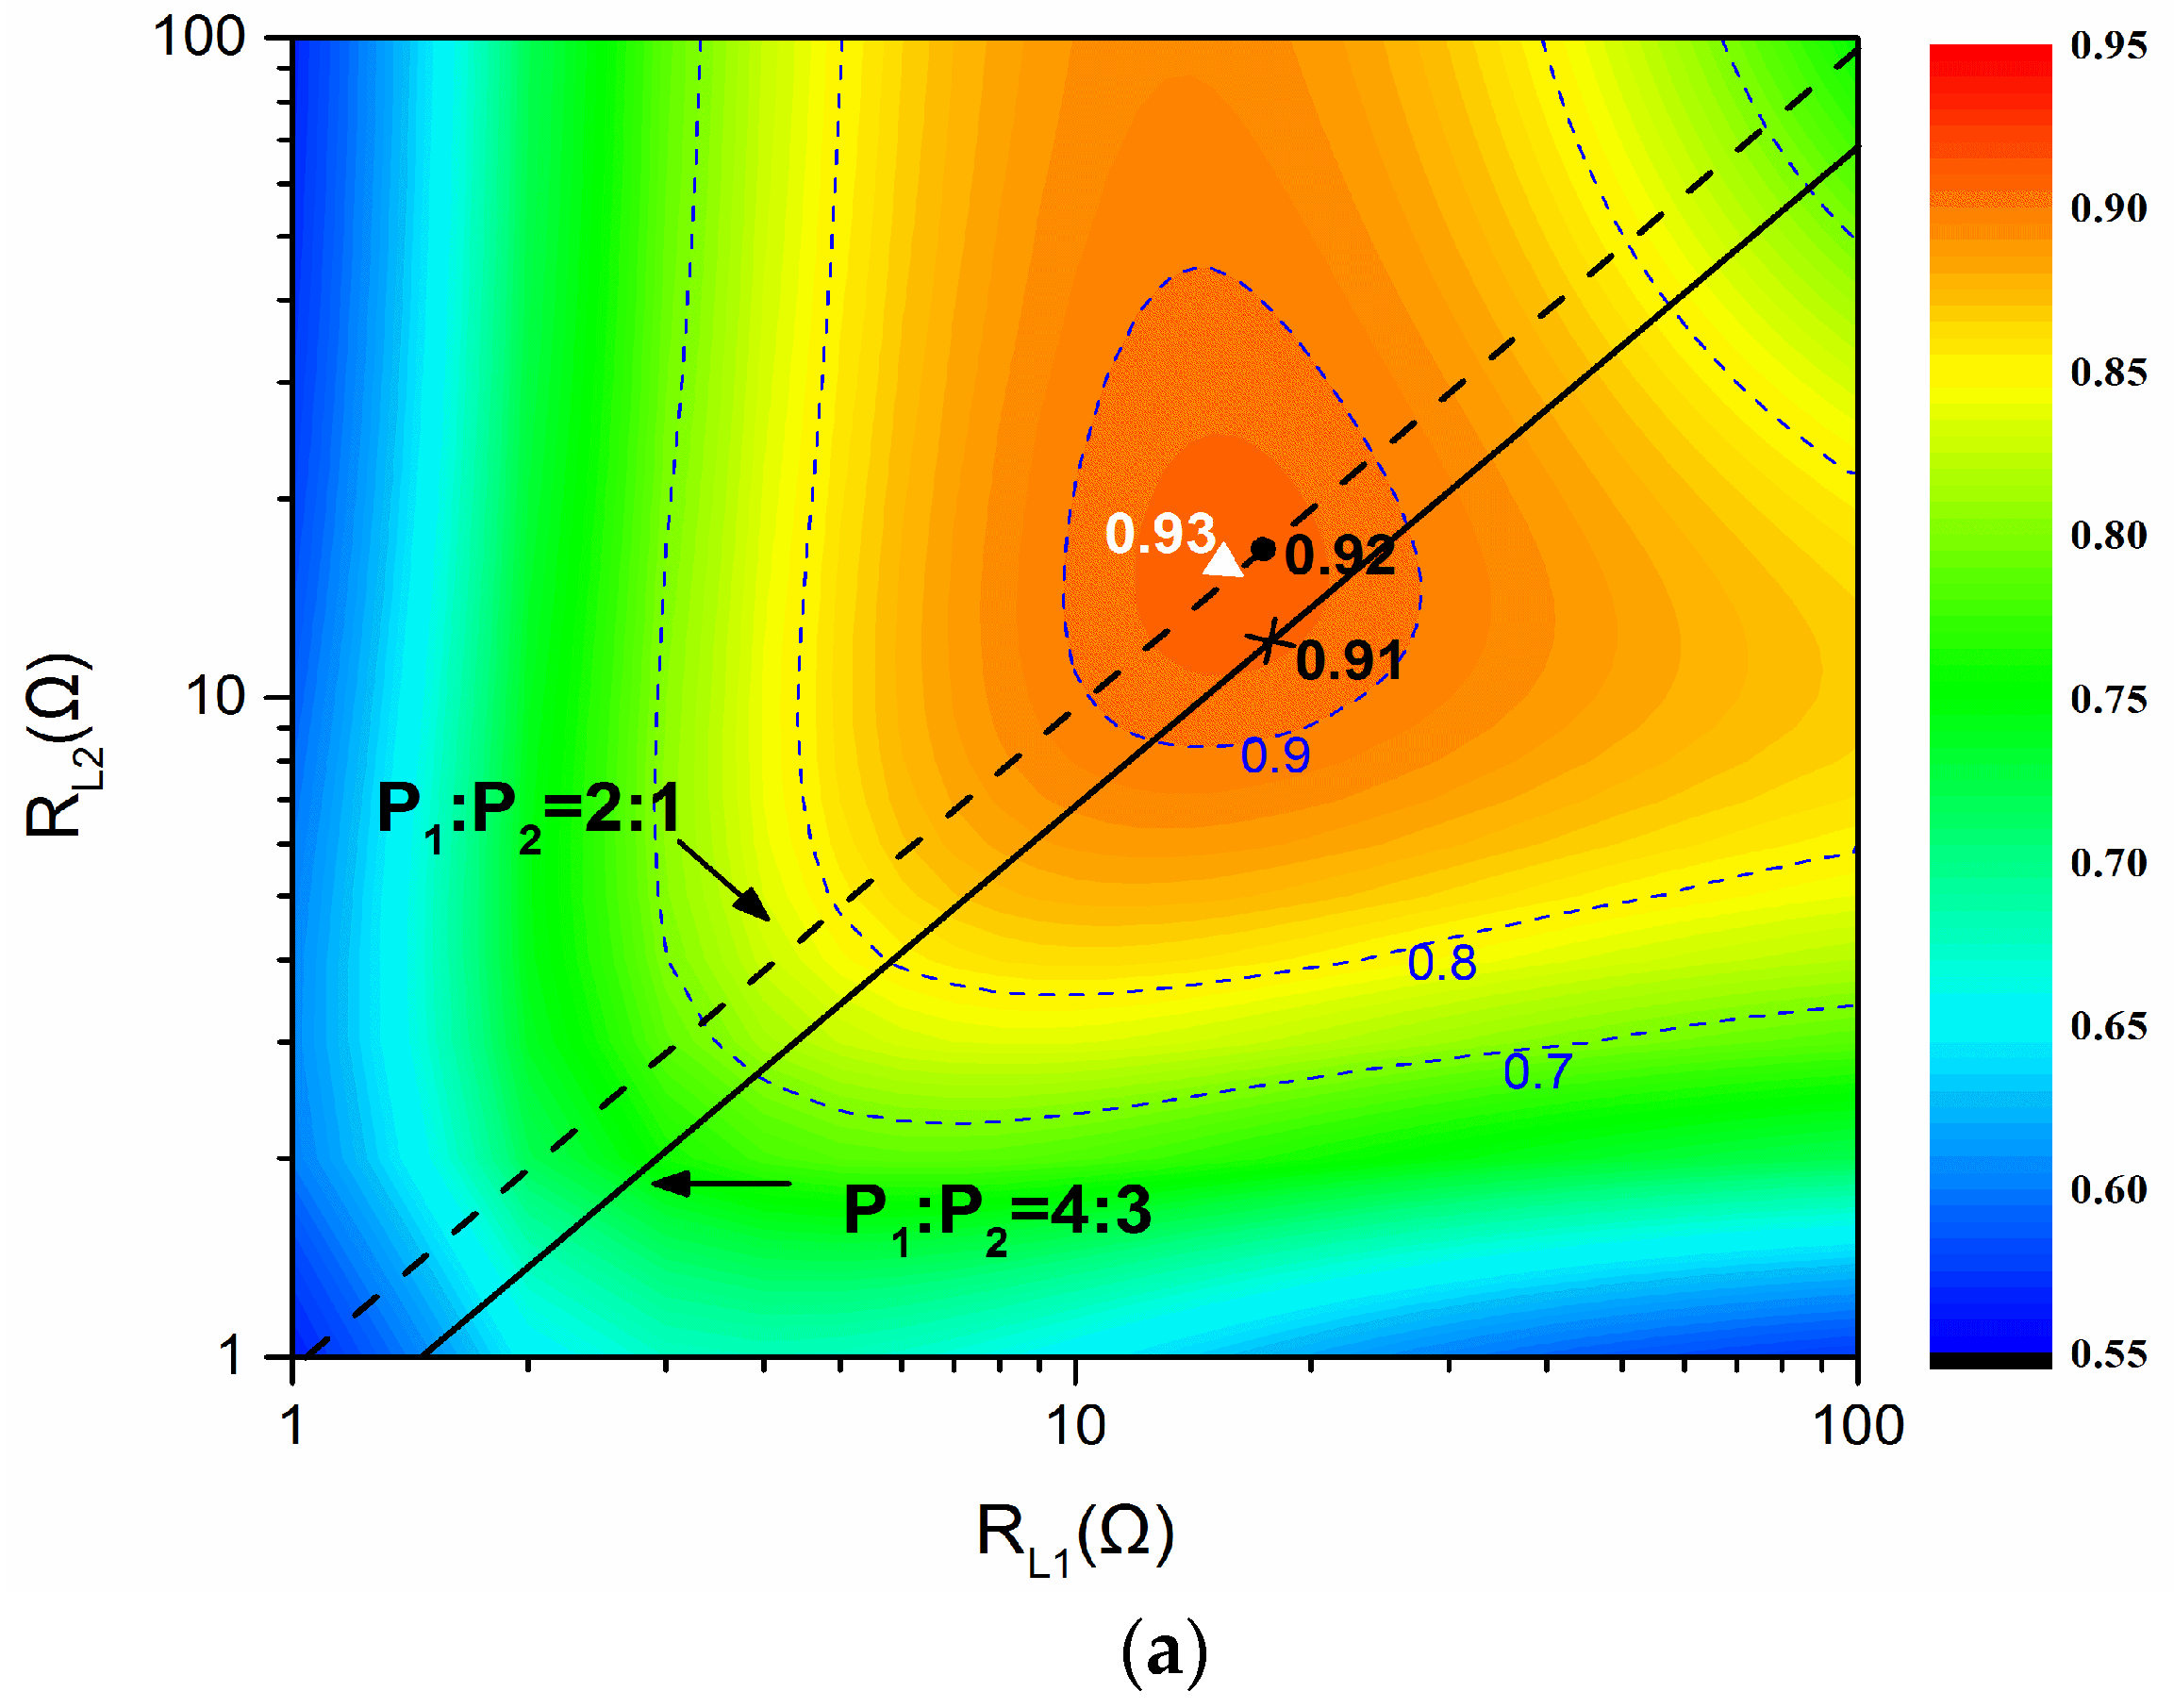
3. Analysis of the Power Division and Efficiency Evaluation Method

As analyzed in Section 2, when the receivers obtain the optimal load, the optimal efficiency can be reached. Compared with Equation (28), we can see that the optimal system efficiency is the sum of each optimal load efficiency. With a given input power Pin, the power ratio between any two receivers is expressed as:
P i : P j = η i : η j   f o r   i , j = 1 , 2 , , n   a n d   i j
However, the power division among the receivers cannot be controlled except to change the mutual inductance and resistance of the coil. In practice, the working power of the load cannot be arbitrarily changed. Therefore, the power division ratio is usually determined by the required power of the load. Based on this rule, it is not practical to use optimal load transformation to achieve the maximum efficiency of the system. When the power division ratio is determined, the optimal of each receiver cannot necessarily satisfy the power distribution ratio. In this time, the maximum efficiency of the system should be the optimum efficiency with the constant reflected impedance ratio η%_opt (≤η_opt). It is obvious that there will be an optimal total reflected impedance that can reach the maximum system efficiency in a constant reflected impedance ratio condition.
As shown in Equation (25), the power division ratio is the same as the reflected impedance ratio of the receivers. With the adjustment of D, it can not only transform the load to change the power of the receivers, but also regulate the power division ratio. Therefore, according to the analysis in the last section, the output current on the load can be regulated to obtain the required power and power division ratio by controlling the DC-DC converter. However, in order to improve the system efficiency, a more adjustable degree is required. Therefore, the current regulation controller was introduced to adjust the input power of the transmitter.
I o i = 8 ( 1 D i ) π 2 ω M i R r i + 8 ( 1 D i ) 2 ( π D i ) 2 R o i | I t |   f o r   i = 1 , 2 , , n
η = i = 1 n ω 2 M i 2 8 ( 1 D i ) 2 ( π D i ) 2 R o i ( R r i + 8 ( 1 D i ) 2 ( π D i ) 2 R o i ) 2 R t + i = 1 n 8 ( 1 D i ) 2 ( π D i ) 2 R o i
From Equations (38) and (39), it can be seen that Ioi and η are the functions of Di and Roi. It is obvious that the system efficiency is related to the transmitter input current and the output current of the receiver load, respectively. In order to achieve optimal efficiency, the transmitter and the receivers should work cooperatively. Assuming that the load Roi is stable in the meantime, the calculation of the load power can be realized by measuring the current Ioi flowing into the load. Based on the constant power charging of the receivers, the optimal efficiency η_opt is tracked by measuring the minimum Pdc at the transmitter. In this paper, the perturbation and observation (P&O) algorithm was introduced to design the control scheme of the system. The method is widely used in applications of photovoltaic power generation to track the maximum power points, and its correctness and practicability have already been effectively verified [25]. A detailed analysis on the proposed control method is illustrated in the following.

4. Analysis of the Proposed Control Scheme

4.1. Structure of Proposed Control Scheme

The control flow chart of the system is shown in Figure 6. On the transmitter, the voltage and current sensors were used to collect the DC input voltage and current of the power amplifier, and then the P&O algorithm was used to adjust the input power in real time by controlling the input current of the power amplifier to track the best efficiency of the system. At the receiving end, through the real-time acquisition of the input current of the load, the constant current charging was realized by the simplified PI control.

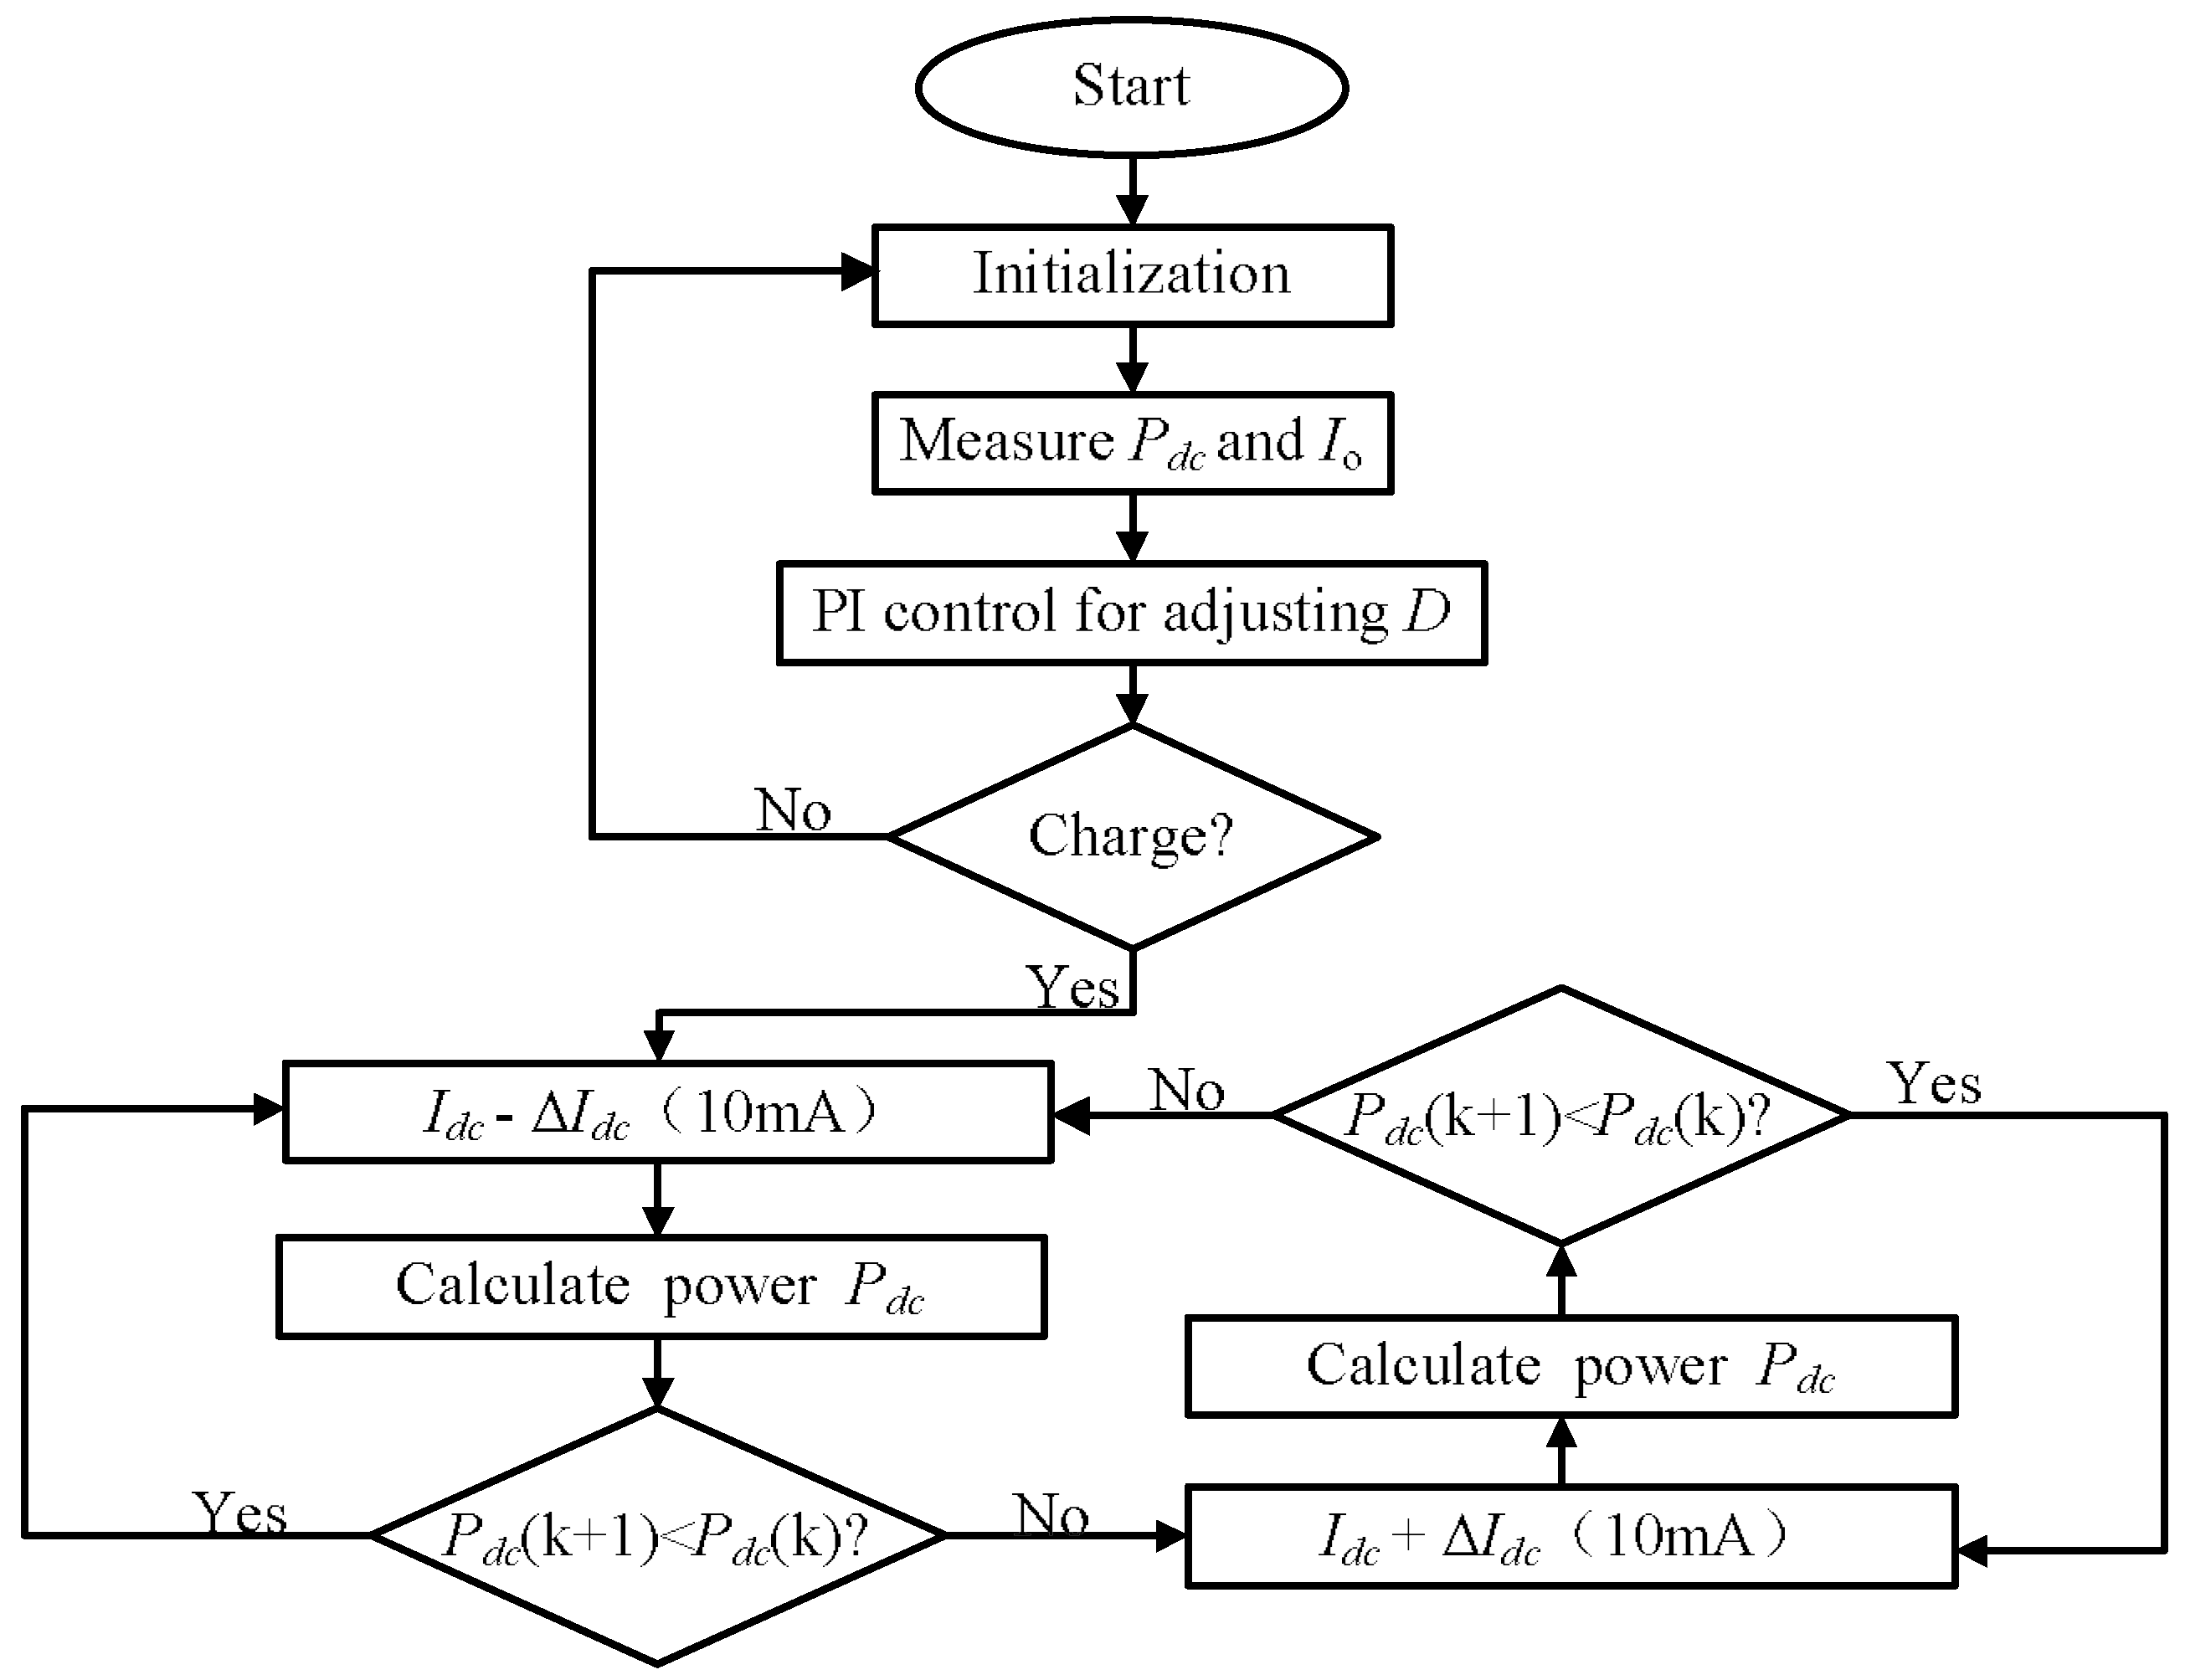
4.2. Operating Principle Analysis

Assuming that the load impedance is fixed for a period of time when it is charged, the constant current charging by the SEPIC fixed the output power of the load during this time. When tracking the minimum input power by adjusting the input power Idc of the power amplifier, the optimal efficiency of the system tracking under the stable output power division can be obtained. However, the premise behind the system working properly is that the system must meet the power requirement of all loads when the system is initialized. The detail description of Figure 7 is as follows:
  • In the initialization phase, the initial output power of the transmitter is determined by the number of loads and power requirements. The duty cycle D is adjusted by the PI controlled DC-DC converter so that the current Io at the receiving end reaches the required current.
  • The input power Pdc of the transmitter is recorded after initialization and the corresponding change of the input power is calculated in real time by increasing or decreasing the DC input current Idc of the power amplifier. When the change of Idc is ΔIdc, the new value of Idc is expressed as Idc1 = Idc0 − ΔIdc or Idc1 = Idc0 + ΔIdc. The new value of the input power is expressed as Pdc1 = Pdc0 + ΔPdc or Pdc1 = Pdc0 + ΔPdc. As the transmitter’s power varies, the output current Io of the receiver will also change due to the variation in power received by the load.
  • After storing the new current Idc1 and input power Pdc1 of the transmitter, the receiver adjusts D again to restore the output current Io to the set value.
  • Finally, the new input power Pdc1 obtained by adjusting the Idc is compared with the Pdc. If the Pdc1 is less than the Pdc, the current Idc should continue to be adjusted in the forward direction, and steps 2 and 3 repeated until the Pdc1 increases. Otherwise, if Pdc1 is greater than Pdc, the adjustment direction of Idc should be reversed and steps 2 and 3 repeated until the Pdc1 no longer decreases. At this point, the maximum efficiency of the system is tracked.
In the process of tracking the maximum efficiency, steps 2 to 3 may be repeated several times. This process will eventually achieve a dynamic balance, and it can also track the optimal efficiency with the variation parameters of the system.

5. Experimental Verification

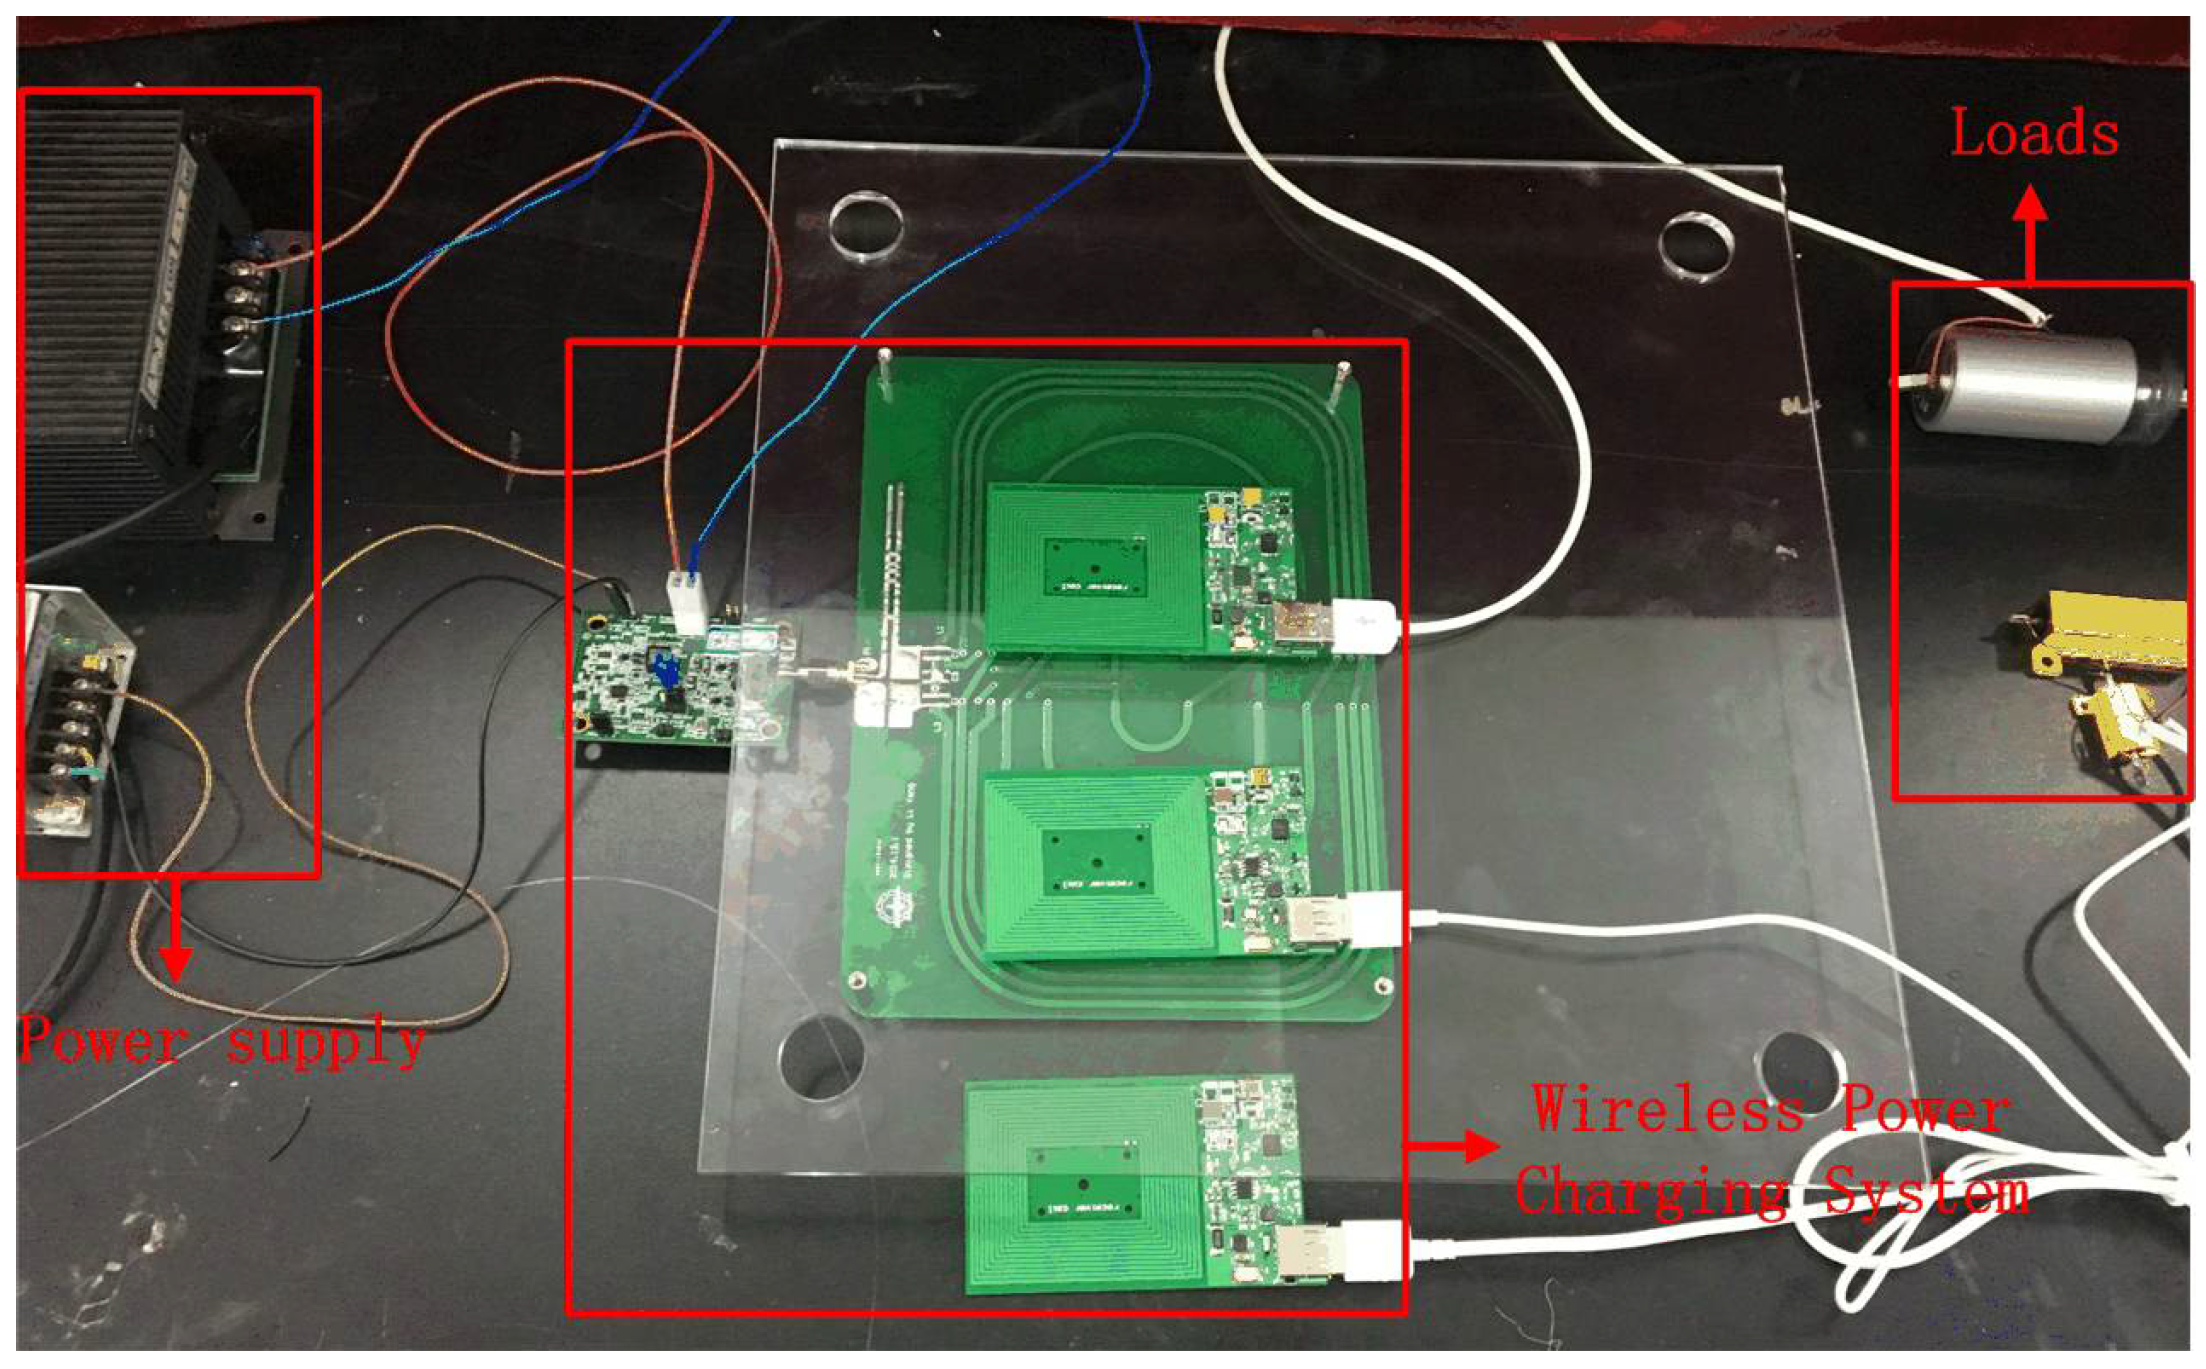
5.1. Experimental Setup

Based on the proposed control scheme, an experimental system was designed. Figure 8 shows the implemented structure of a single-receiver WPT system operating at 6.78 MHz. This system was composed of a Class D power amplifier with a maximum power of 35 W, and a receiver with a full-bridge rectifier and a DC-DC converter. On the transmitter, the P&O algorithm was realized by the stepdown controller (LT3741) that could decrease or increase the current at intervals of 10 mA using an 8-bit Digital-to-Analog Converter (DAC) controlled by microcontroller units (MCU) via I2C communication. On the receiver, the MCU controller generates a PWM signal with variation duty cycle D for the SEPIC under PI control.
The transmitting and receiving resonant coils were fabricated on FR4 (thickness 1.2 mm, relative permittivity 4.6, tangent loss 0.015) compliant with the A4WP standard [26]. The transmitting coil was 205 mm × 141 mm in size, had an inductance Lt of 2.13 μH, and an equivalent series resistance Rt of 0.53 Ω. The receiving coil had a size of 63 mm × 45 mm, an inductance Lr of 3.73 μH, and the equivalent series resistance Rr1 of 0.76 Ω. As shown in Figure 9, the coupling coefficient of the two coils at different axial distances and plane distances were simulated by Ansoft Maxwell 14.

5.2. Experiment Results of the Proposed Control Method

Figure 10 illustrates the experimental setup. It is a schematic diagram of the experiment. For the experiment, the input DC voltage was supplied by an external power supply, and the battery and resistive load were used as the load separately. Table 3 shows the optimal efficiency and measured efficiency with a fixed power division ratio in three positions between the transmitter and two receivers including the coupling coefficients (k1, k2, and k3) and those of mutual inductance (M1, M2, and M3). Table 3 presents the variable parameters of the DC load and frequency.
Under the system configuration of Table 3(A), the coupling coefficient between the transmitter and the receiver were 0.089 and 0.062, respectively. Figure 11a shows the efficiency with sweeping RL1 and RL2. The optimal point was RL1 = RL2 = 17 Ω, and η_opt = 93%. The maximum efficiency η%_opt was 92% and 91% when the power distribution ratio was fixed at 2:1 and 4:3, respectively. The actual efficiency achieved through maximum efficiency tracking was 84.3% and 83.5%, respectively.
In contrast to Table 3(A), in Table 3(B) the position of the two receivers with the transmitting coil was changed. Figure 11b shows the efficiency of position 2 with sweeping RL1 and RL2. The optimal efficiency η_opt = 92% and the optimal point was RL1 = RL2 = 18 Ω. The maximum efficiency with a fixed power distribution ratio at 2:1 and 4:3 was 86% and 88%, respectively. The measured maximum efficiency η%_opt with the maximum efficiency tracking was 77.8% and 78.2%.
Figure 11c demonstrates the relationship between efficiency and RL1, RL2 in Table 3(C). The distance between the transfer coil and the receiving coils changed, and the coupling coefficient and mutual inductance are shown in Table 3(C). The optimal efficiency reached 0.886, when the RL1 = RL2 = 12 Ω. The efficiency was 87.4% and 88.2% when the power distribution ratio was 2:1 and 4:3, respectively. This was nearly the same as the optimal efficiency. The actual measured efficiency with maximum efficiency tracking was 78.6% and 79.4%.
According to Table 3, the calculated results of the optimal efficiency and the efficiency with a fixed power division ratio are shown in Figure 11; with a different power division ratio, the efficiency sweep line was fixed by the constant ratio of loads in each receiver. When the measured efficiency used the proposed maximum efficiency tracking method, the efficiency of the system was more than 80%, although it was lower than the calculated efficiency. The reason for this is that the efficiency we measured from the power amplifier to the DC load was an end-to-end efficiency of the system (system efficiency ηsystem in Figure 1). Compared with Figure 3, to more easily analyze the relationship between the power distribution of the multiple receivers and the optimization of transmission efficiency, the losses in the DC-DC converters and the switching loss of the power amplifier were not taken into account in the calculation.

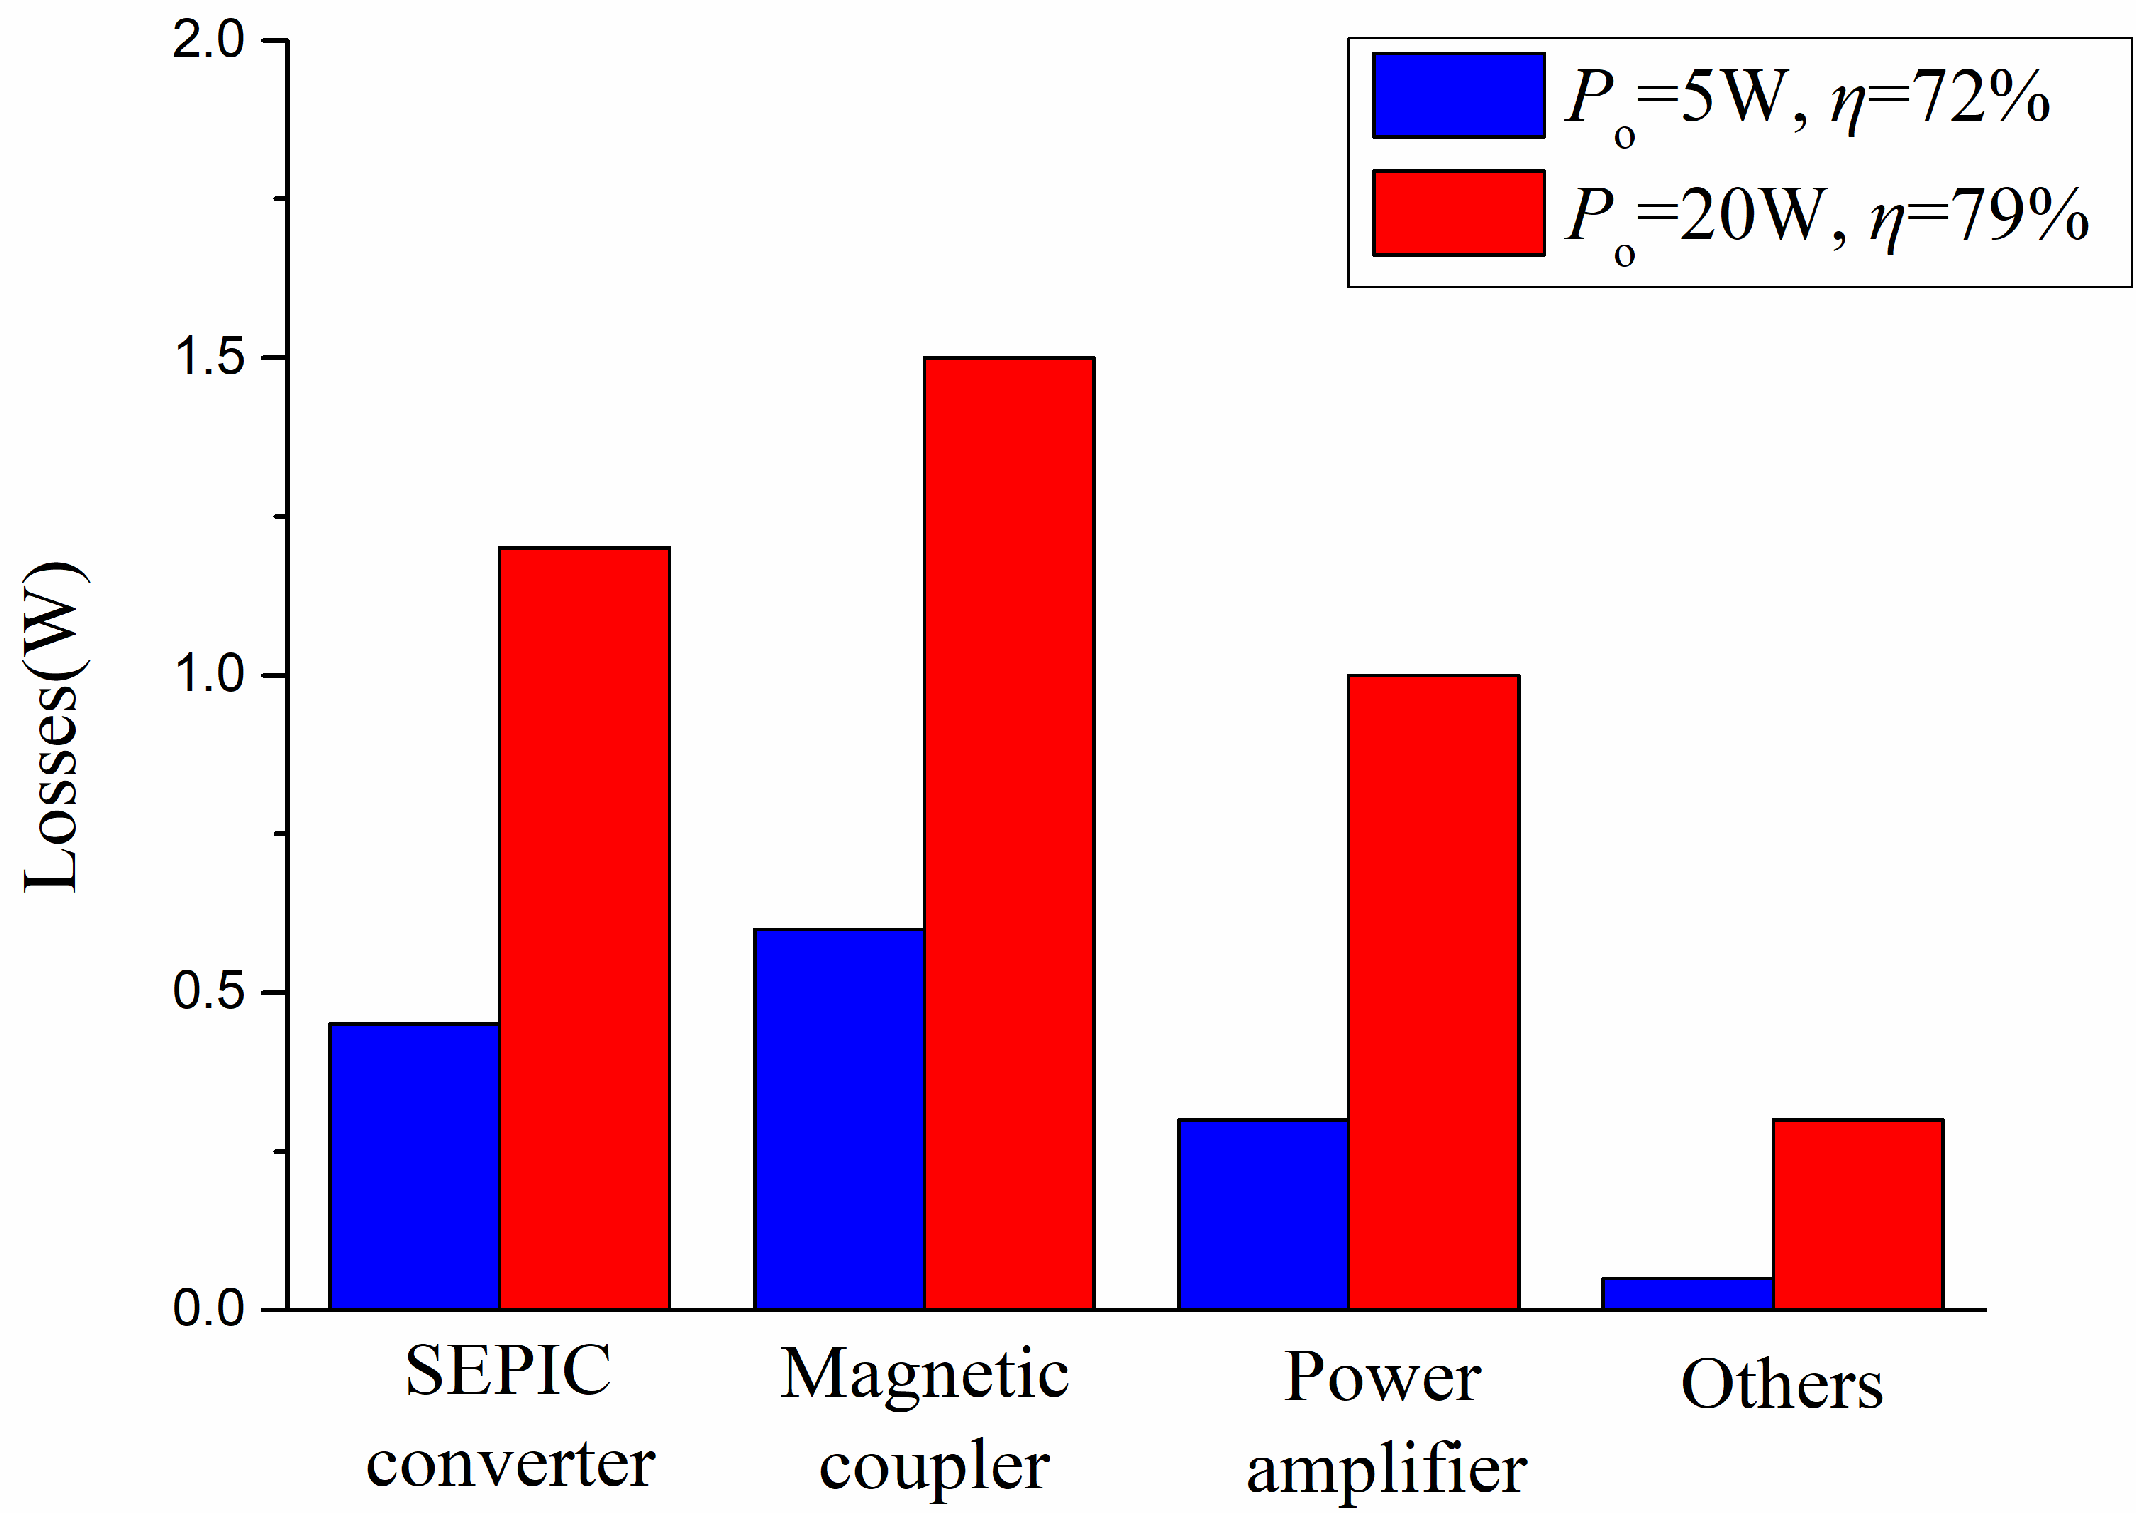
5.3. Discussion of System Loss

From the experiments, we found that the losses could not be ignored in the system. The system losses consisted of Class-D power amplifier losses, SEPIC losses, magnetic coupling losses, and other losses.
Compared with the result of the calculated maximum efficiency with the fixed power division ratio in Table 3(A) (92% and 91% with the optimized load resistance at 2:1 and 4:3, respectively), the measured efficiency tracked by the proposed method was only 84.3% and 83.5%. The system power loss was nearly 10%. Therefore, we set up an experiment that only kept a single receiver to analyze the composition of the system’s losses. The measured results are shown in Figure 12. Po denotes the output power of the receiver, and η is the efficiency of the system. It can be seen that the loss mainly came from the conduction loss, followed by the loss of the SEPIC and the loss of the power amplifier. The magnetic coupling loss was caused by power dissipation in the internal resistance of the coupled coils and resonant capacitor. Compared with the loss of the power amplifier, the loss of the SEPIC included not only the switching loss of the MOSFET, but also the internal resistance loss of the converter inductance. Therefore, in practice, low distributed parameters and low resistivity switching devices are needed to decrease these losses; for example, using a gallium nitride (GaN) MOSFET can effectively reduce the switching loss [27].

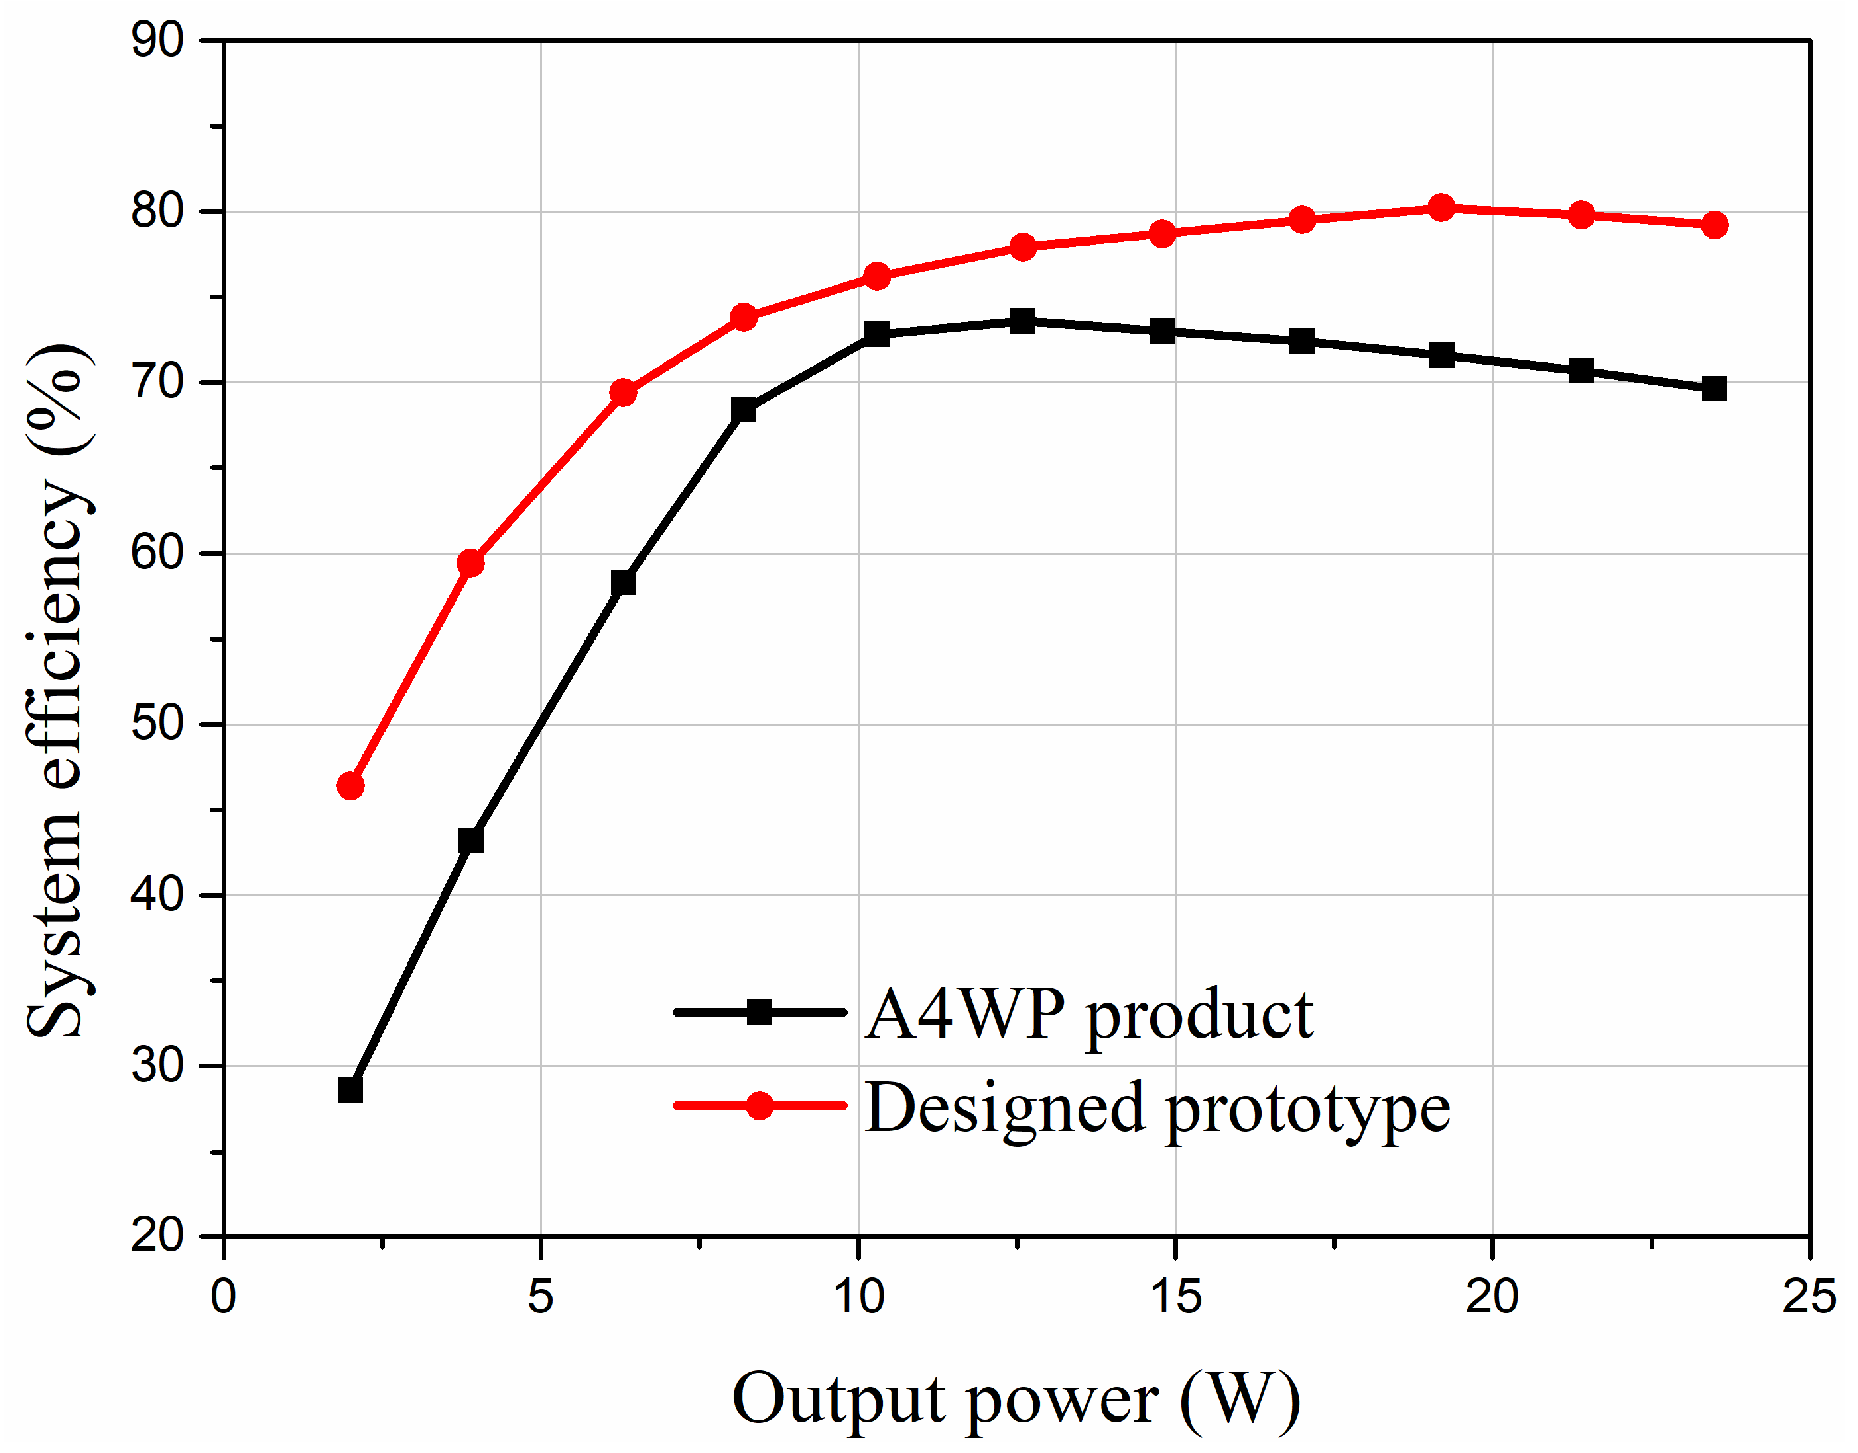
5.4. Comparison to Previous Methods

In practice, there have been many low power applications suitable for portable terminals. Taking the A4WP product as an example, the A4WP standard does not include the method of tracking optimal efficiency under power division conditions, especially under multi-receiver conditions. With the increased number of electrical appliances, introducing power distribution and maximum efficiency tracking for A4WP products to improve system performance will undoubtedly make products more attractive to consumers [28]. As shown in Figure 13, the A4WP system and the proposed system scheme were compared under the same position of the two receivers and the transmitter. Table 4 shows the system parameters of the A4WP system and proposed scheme. For a convenient comparison of system efficiency, the parameters of the two systems were made as similar as possible. The results showed that the maximum efficiency of A4WP products was 72%, while with the proposed control method, the system efficiency exceeded 80%.
In future work, we need to further optimize the system for practical applications. By improving the P&O algorithm and its controller, the response speed of the optimal efficiency tracking under stable power division control will be further optimized.

6. Conclusions

Based on the research of traditional single-receiver wireless power transfer systems, this paper deeply analyzed the relationship between load impedance and system efficiency in a multiple-receiver WPT system. Furthermore, we analyzed the optimal efficiency with a fixed power division ratio. An efficiency evaluation method with a fixed power division ratio was presented. The “maximum efficiency” at a fixed power division ratio did not reflect the efficiency with optimal loads, but reflected that with a fixed reflected impedance ratio. According to the results, a maximum efficiency tracking method with a fixed power division ratio was proposed. Combining the stepdown controller that is controlled by the P&O algorithm in the transmitter with the PI-controlled SEPIC in the receivers, the validity of the proposed system control method was confirmed by simulation and experimental results. Although losses occurred in the system with the proposed control scheme, it achieved a higher efficiency over the wide range of coupling coefficients and load impedances while maintaining a stable power output.

Author Contributions

All authors have worked on this manuscript together and all authors have read and approved the final manuscript.

Funding

This research was supported by the National Natural Science Foundation of China under Grant No. 51677032 and No. 51577034, Natural Science Foundation of Heilongjiang Province No. E2017045, Harbin Science and Technology Innovation Talents Special Fund Project under Grant No. 2016RAQXJ002 and No. 2016FX2GJ013.

Conflicts of Interest

The authors declare no conflict of interest.

References

  1. Kim, J.; Kim, D.; Choi, J.; Kim, K.; Park, Y. Free-Positioning Wireless Charging System for Small Electronic Devices Using a Bowl-Shaped Transmitting Coil. IEEE Trans. Microw. Theory Tech. 2015, 63, 791–800. [Google Scholar] [CrossRef]
  2. Covic, G.A.; Boys, J.T. Modern trends in inductive power transfer for transportation applications. IEEE J. Emerg. Sel. Top. Power Electron. 2015, 1, 28–41. [Google Scholar] [CrossRef]
  3. Chen, C.-J.; Chu, T.H.; Lin, C.L.; Jou, Z.C. A study of loosely coupled coils for wireless power transfer. IEEE Trans. Circuits Syst. II Exp. Briefs 2010, 57, 536–540. [Google Scholar] [CrossRef]
  4. Campi, T.; Cruciani, S.; Palandrani, F.; de Santis, V.; Hirata, A.; Feliziani, M. Wireless Power Transfer Charging System for AIMDs and Pacemakers. IEEE Trans. Microw. Theory Tech. 2016, 64, 633–642. [Google Scholar] [CrossRef]
  5. Montgomery, K.L.; Yeh, A.J.; Ho, J.S.; Tsao, V.; Iyer, S.M.; Grosenick, L.; Ferenczi, E.A.; Tanabe, Y.; Deisseroth, K.; Delp, S.L.; et al. Wirelessly powered, fully internal optogenetics for brain, spinal, and peripheral circuits in mice. Nat. Med. 2015, 12, 969–974. [Google Scholar] [CrossRef] [PubMed]
  6. Agrawal, D.R.; Tanabe, Y.; Weng, D.; Hsu, A.S.; Liao, S.-Y.; Zhen, Z.; Zhu, Z.-Y.; Sun, C.; Dong, Z.; Yang, F.; et al. Conformal phased surfaces for wireless powering of bioelectronic microdevices. Nat. Biomed. Eng. 2017. [Google Scholar] [CrossRef] [PubMed]
  7. Tanaba, Y.; Ho, J.S.; Liu, J.; Liao, S.-Y.; Zhen, Z.; Hsu, S.; Shuto, C.; Zhu, Z.-Y.; Ma, A.; Vassos, C.; et al. High-performance wireless powering for peripheral nerve neuromodulation systems. PLoS ONE 2017, 12, e0186698. [Google Scholar] [CrossRef] [PubMed]
  8. Sample, A.P.; Meyer, D.A.; Smith, J.R. Analysis, experimental results, and range adaptation of magnetically coupled resonators for wireless power transfer. IEEE Trans. Ind. Electron. 2011, 58, 544–554. [Google Scholar] [CrossRef]
  9. Kurs, A.; Moffatt, R.; Soljacic, M. Simultaneous mid-range power transfer to multiple devices. Appl. Phys. Lett. 2010, 96. [Google Scholar] [CrossRef]
  10. Kim, J.W.; Son, C.; Kim, D.H.; Kim, K.H.; Park, Y.J. Analysis of wireless energy transfer to multiple devices using CMT. In Proceedings of the Asia Pacific Microwave Conference Proceedings, Yokohama, Japan, 7–10 December 2010. [Google Scholar]
  11. Cannon, B.L.; Hoburg, J.F.; Stancil, D.D.; Goldstein, S.C. Magnetic Resonant Coupling As a Potential Means for Wireless Power Transfer to Multiple Small Receivers. IEEE Trans. Power Eletcron. 2009, 24, 1819–1825. [Google Scholar] [CrossRef]
  12. Koh, K.E.; Beh, T.C.; Imura, T.; Hori, Y. Impedance Matching and Power Division Using Impedance Inverter for Wireless Power Transfer via Magnetic Resonant Coupling. IEEE Trans. Ind. Appl. 2014, 50, 2061–2070. [Google Scholar] [CrossRef]
  13. Fu, M.; Yin, H.; Ma, C. Megahertz Multiple-Receiver Wireless Power Transfer Systems with Power Flow Management and Maximum Efficiency Point Tracking. IEEE Trans. Microw. Theory Tech. 2017, 65, 4285–4293. [Google Scholar] [CrossRef]
  14. Yin, H.; Fu, M.; Liu, M.; Song, J.; Ma, C. Autonomous Power Control in A Reconfigurable 6.78 Megahertz Multiple-receiver Wireless Charging System. IEEE Trans. Ind. Electron. 2018, 65, 6177–6187. [Google Scholar] [CrossRef]
  15. Fu, M.; Zhang, T.; Ma, C.; Zhu, X. Efficiency and Optimal Loads Analysis for Multiple-Receiver Wireless Power Transfer Systems. IEEE Trans. Microw. Theory Tech. 2015, 63, 801–812. [Google Scholar] [CrossRef]
  16. Zhu, J.; Luo, B.; Zhang, X.; Hu, Y. Extendible load-isolation wireless charging platform for muti-receiver applications. IET Power Electr. 2017, 10, 134–142. [Google Scholar] [CrossRef]
  17. Tanabe, Y.; Poon, A.S.Y.; Camarillo, D.B.; Wu, L.C.; Yeh, A. Wearable Impact Measurement Device with Wireless Power and Data Communication. U.S. Utility Patent Application No. 14/256722, 23 October 2014. [Google Scholar]
  18. Tanabe, Y.; Chang, T.; Yeh, A.J.; Poon, A.S.Y. A small dual-band asymmetric dipole antenna for 13.56 MHz power and 2.45 GHz data transmission. IEEE Antennas Wirel. Propag. Lett. 2014, 13, 1120–1123. [Google Scholar] [CrossRef]
  19. Sallan, J.; Villa, J.L.; Llombart, A.; Sanz, J.F. Optimal Design of ICPT Systems Applied to Electric Vehicle Battery Charge. IEEE Trans. Ind. Electron. 2009, 56, 2140–2149. [Google Scholar] [CrossRef]
  20. Li, Z.; Zhu, C.; Jiang, J.; Song, K.; Wei, G. A 3-kW Wireless Power Transfer System for Sightseeing Car Supercapacitor Charge. IEEE Trans. Power Electron. 2017, 32, 3301–3316. [Google Scholar] [CrossRef]
  21. Mai, R.; Liu, Y.; Li, Y.; Yue, P.; Cao, G.; He, Z. An Active-Rectifier-Based Maximum Efficiency Tracking Method Using an Additional Measurement Coil for Wireless Power Transfer. IEEE Trans. Power Electron. 2018, 33, 716–728. [Google Scholar] [CrossRef]
  22. Low, Z.N.; Chinga, R.A.; Tseng, R.; Lin, J. A loosely coupled planar wireless power transfer system supporting multiple receivers. IEEE Trans. Ind. Electron. 2009, 56, 1801–1812. [Google Scholar] [CrossRef]
  23. Nithya, R.; Sundaramoorthi, R. Design and Implementation of SEPIC Converter with Low Ripple Battery Current for Electric Vehicle Applications. In Proceedings of the 1st International Conference on Emerging Trends in Engineering Technology and Science, Thanjavur, India, 24–26 February 2016. [Google Scholar]
  24. Hu, J.; Sagneri, A.D.; Rivas, J.M.; Han, Y.; Davis, S.M.; Perreault, D.J. High Frequency Resonant SEPIC Converter With Wide Input and Output Voltage Ranges. IEEE Trans. Power Electr. 2012, 27, 189–200. [Google Scholar] [CrossRef]
  25. Teng, J.; Huang, W.; Hsu, T.; Wang, C. Novel and Fast Maximum Power Point Tracking for Photovoltaic Generation. IEEE Trans. Ind. Electron. 2016, 63, 4955–4966. [Google Scholar] [CrossRef]
  26. Tseng, R.; von Novak, B.; Shevde, S.; Grajski, K.A. Introduction to the alliance for wireless power loosely coupled wireless power transfer system specification version 1.0. In Proceedings of the IEEE Wireless Power Transfer, Perugia, Italy, 21–24 May 2013. [Google Scholar]
  27. Gati, E.; Kampitsis, G.; Manias, S. Variable frequency controller for inductive power transfer in dynamic conditions. IEEE Trans. Power Electron. 2017, 32, 1–13. [Google Scholar] [CrossRef]
  28. Boztepe, M.; Guinjoan, F.; Velasco-Quesada, G.; Silvestre, S.; Chouder, A.; Karatepe, E. Global MPPT scheme for photovoltaic string inverters based on restricted voltage window search algorithm. IEEE Trans. Ind. Electron. 2014, 61, 3302–3312. [Google Scholar] [CrossRef]
Figure 1. Configuration of the wireless power transfer (WPT) system with multiple receivers.
Energies 11 01232 g001
Figure 2. Equivalent circuit of a one-transmitter and one-receiver WPT system.
Energies 11 01232 g002
Figure 3. Equivalent circuit of multiple-receiver WPT system.
Energies 11 01232 g003
Figure 4. Load impedance transformation of different DC-DC converters.
Energies 11 01232 g004
Figure 5. The range of load impedance transformation in different DC-DC converters.
Energies 11 01232 g005
Figure 6. Diagram of the proposed control scheme.
Energies 11 01232 g006
Figure 7. Flow chart of the proposed control method.
Energies 11 01232 g007
Figure 8. Implementation of a 6.78 MHz single-receiver WPT system.
Energies 11 01232 g008
Figure 9. Coupling coefficient with different distances.
Energies 11 01232 g009
Figure 10. Experimental setup.
Energies 11 01232 g010
Figure 11. Influence of several positions on efficiency with different power division ratios: (a) position 1 in Table 3(A); (b) position 2 in Table 3(B); (c) position 3 in Table 3(c).
Energies 11 01232 g011aEnergies 11 01232 g011b
Figure 12. Losses analysis with different powers of the system.
Energies 11 01232 g012
Figure 13. Comparison of system efficiency between the designed system and the A4WP system.
Energies 11 01232 g013
Table 1. Characteristics of different basic DC-DC converters.
Converter TypeVoltage Gain (Uout/Uin)Load Resistance Transformation (RLi/Roi)The Range of RLi
Boost 1 ( 1 D ) 8 ( 1 D ) 2 π 2 0~Roi
Buck D 8 ( π D ) 2 Roi~+∞
Buck-Boost D ( 1 D ) 8 ( 1 D ) 2 ( π D ) 2 0~+∞
Single-Ended Primary Inductance Converter (SEPIC) D ( 1 D ) 8 ( 1 D ) 2 ( π D ) 2 0~+∞
Table 2. Parameters of the experimental system.
SymbolQuantityValue
LtPrimary-side coil inductance2.13 μH
RtPrimary-side coil resistance0.53 Ω
LriSecondary-side coil inductance3.73 μH
RriSecondary-side coil resistance0.76 Ω
fsSystem operating frequency6.78 MHz
IoiCharging current0.1 A~2 A
Table 3. Power division ratio and efficiency with different receiver positions in a two-receiver system.
Symbol(A) Position 1(B) Position 2(C) Position 3
k10.0890.0480.051
k20.0620.0890.048
M10.2510.1350.144
M20.1750.2510.135
Ƞ_opt93%92%88.6%
P1:P22:14:32:14:32:14:3
Ƞ%_opt92%91%86%88%87.4%88.2%
Ƞmea84.3%83.5%77.8%78.2%78.6%79.4%
Table 4. System parameters of the proposed system scheme and the A4WP system in an efficiency comparison process.
SymbolA4WPDesigned Prototype
P1:P21:11:1
k10.0640.065
k20.0580.056
M10.180.183
M20.1630.158
Ioi0.1 A~2 A0.1 A~2 A

