Article

Natural Ventilation Effectiveness of Round Wall-Mounted Vent Caps in Residential Kitchens

1
Department of Creative Design, National Yunlin University of Science and Technology, Douliu 640, Taiwan
2
Department of Architecture and Architectural Engineering, Kyoto University, Kyoto 606-8501, Japan
3
Department of Civil Engineering, National Cheng Kung University, Tainan 701, Taiwan
*
Author to whom correspondence should be addressed.
Energies 2018, 11(5), 1230; https://doi.org/10.3390/en11051230
Submission received: 21 March 2018 / Revised: 6 May 2018 / Accepted: 8 May 2018 / Published: 11 May 2018
(This article belongs to the Section D: Energy Storage and Application)

Abstract

:
This study explores the effect of different numbers of wall-mounted vent caps and their installation locations on the indoor air environment in residential kitchens, for which limited information is available. Wind tunnel tests were performed to study the induced ventilation rates of a vent cap, and the impact of vent caps on the natural ventilation efficiency in residential kitchens was examined using computational fluid dynamics (CFD) numerical simulations. The results were then applied to determine the appropriate quantity of vent caps and their proper installation location. The wind tunnel test results indicated that outdoor winds with speeds of 0–6 m/s that flow parallel to the wall with a vent cap induce indoor air to exit through the cap with ventilation rates of 0–20 m3/h; when the wind blows perpendicular to the wall, outdoor air with 0–31.9 m3/h flows indoors. CFD numerical simulations showed that the installation of kitchen vent caps can reduce the average carbon monoxide concentration in the cook’s breathing zone. A sufficient quantity of vent caps and the proper installation location are required to ensure the natural ventilation effectiveness of wall-mounted vent caps.

1. Introduction

Asian cuisine involves pan-frying, boiling, sautéing, and frying as the main cooking practices. These cooking methods tend to produce large amounts of fumes and high temperatures, which will decrease the indoor air quality if the cooking occurs in a closed kitchen or an area with poor ventilation. Women in Taiwan spend 3.5 to 4 h per day cooking, which accounts for one-quarter of their daily activity. Therefore, maintaining good air quality in a kitchen is important. The female smoking rate in Taiwan is lower than the female smoking rate in the United States (U.S.) and Australia. However, a relatively high percentage of the female population in Taiwan suffers from lung cancer; only 9–10% of these female lung cancer patients have a smoking habit. Since Taiwan has a low smoking rate, other hidden pathogenic factors must be related to the increase of the female lung cancer population in addition to the exposure to cigarette smoke.
Ko et al. [1] indicated three important factors that may cause lung cancer in nonsmoking Taiwanese females, including cooking activity, spatial fume elimination efficiency, and breathing zone exposure. The inhalation of large amounts of kitchen fumes and a poor diet may also have a role in causing lung cancer; therefore, maintaining good kitchen air quality can effectively improve the health benefits of the female population in Taiwan. Cheng et al. [2] measured 18 carbonyl species for C1-C10 in the dining rooms, kitchens, and exhaust ducts of six different restaurant types in Taiwan. It indicated that the kitchens in Chinese–Western mixed restaurants had high total carbonyl concentrations (45.48 ppb). Wan et al. [3] indicated that cooking increased the average concentrations of ultrafine particles by 20–40 times the background level during and after Chinese-style cooking activities in 12 naturally ventilated homes of nonsmokers in Hong Kong.
Mechanical ventilation (by the operation of a hood or an exhaust fan) [4,5,6,7,8,9,10,11,12,13,14] or natural ventilation (e.g., opening the kitchen window) [15,16,17,18,19] can usually be employed to control kitchen air quality. The contrasting needs for thermal comfort and indoor air quality management by ventilation should be taken into consideration [20]. Kosonen [4] evaluated the containment removal efficiency of mechanical ventilation using laboratory measurements in a case-study commercial kitchen with a ventilation ceiling. Li et al. [5] evaluated the influence of ventilation systems with range hoods in four commercial kitchens in China on the indoor thermal environment. It indicated that the ventilation systems in Chinese commercial kitchens cannot effectively remove the waste, heat, and air pollutants. Gao et al. [6] experimentally and numerically investigated the dynamic intake fractions of fume particles from a specific cooking process in different mechanical ventilations in residential kitchens. The results indicated that the ventilations of a kitchen greatly affect the exposure level, because the particle dispersion is sensitive to the air distribution. Smith and Svendsen [7] established moisture balance equations for a single-room ventilation with a non-hygroscopic rotary heat exchanger, and showed that the rotary heat exchanger recovered excessive moisture from kitchens and bathrooms, which reduced the risk of mold. Pinto and Viegas [8] examined the effect of combined natural and mechanical ventilation in a kitchen on the exhaust of the appliance’s combustion products. The field tests revealed that the combination, interconnected by ducts, may cause dangerous situations when gas appliances are operated.
Zhou et al. [9] combined range hood operation and air supply through a slot air curtain to propose the push-pull ventilation system. Both numerical simulation and field tests were conducted to investigate its performance. It is shown that by using the push-pull ventilation, the air pollutant concentration can be reduced with the improved air distribution. Li et al. [10] observed flow characteristics in the central cooking exhaust shaft of a high-rise residential building, using computational fluid dynamics (CFD) simulations and field tests. The results showed that the locations of maximum static pressure presented a low-high-low distribution. Singer et al. [11] measured combustion pollutant concentrations from natural gas cooking burners with and without range hood exhaust ventilation or air mixing via a forced air system in nine California homes. The results showed that awareness of ventilation need and adequate range hood flow rates could reduce exposures to NO2 and ultrafine particles. Huang et al. [12] experimentally investigated the performance of both the local and the general exhausts to remove the transient air contaminants, and the ventilation performance was compared between two local exhaust hoods. It showed that the minimum dynamic evaluation index for the improved exhaust hood was greater than that for the existing one. Dobbin [13] experimentally evaluated the benefit of kitchen exhaust fan use after cooking, and suggested that one can partially compensate for an exhaust fan with a low flow rate by continuing to operate the fan after cooking.
Comprehensive reviews on building ventilation performance, including state-of-the-art ventilation systems (mixing, displacement, personalized, hybrid, stratum, protected occupied zone, local exhaust, and piston ventilations), an assessment index for ventilation performance (effectiveness of contamination removal, air exchange effectiveness, efficiency of heat removal, and exposure effectiveness), assessment of the air distribution system (air diffusion performance index and air distribution index), and assessment of different ventilation systems (scales of the ventilation systems, effectiveness, and efficiency of different ventilation methods, energy-saving potential of different ventilation systems, and application of ventilation methods with different contaminant sources), can be found in the literature [14].
To avoid the noise generated by the operation of the hood, many cooks do not turn on the hood during brief cooking or during regular daily cooking. Some cooks keep windows closed during cooking to prevent outdoor drafts from affecting the strength of the stove flame. In some cases, opening a window cannot effectively control the air quality. Natural ventilation could be achieved using architectural elements that are acceptable to cooks without affecting cooking practices to develop a fail-safe design (i.e., if all ventilation modes fail, an alternative mechanism exists to maintain indoor air quality). Chiang et al. [15] performed computational fluid dynamics (CFD) simulations of the air environment in kitchens. The results indicated that the closer the transom was to the region with high carbon monoxide concentrations, the better it affected the natural ventilation. An architectural design alternative, utilizing transoms, is proposed to improve indoor air environment in kitchens. d’Ambrosio Alfano et al. [16] experimentally tested the air permeability of the passive ventilation grilles in naturally ventilated buildings. The results showed a great discrepancy between the performances declared by the manufacturer and those measured.
Wang et al. [17] investigated the performance of naturally ventilated LEED-certified (Leadership in Energy and Environmental Design) townhouses in China. It shows that natural ventilation strategies were not well considered in the design stage in most of the studied cases. The changes of natural ventilation elements during the daily use reduced the ventilation performance. The authors proposed three criteria to avoid failures of natural ventilation design: localized/climate adaptive design, relationship among design elements, and design intention awareness. Elshafei et al. [18] numerically and experimentally investigated the impacts of window parameters (window size, window placement, and shades) on indoor natural ventilation in a residential building in Egypt, which is a semi-arid region. The results indicated that thermal discomfort conditions occur, due to the lack of air circulation as a result of the building geometry. After the spatial modifications, the indoor air temperature was decreased by 2.5%, while the indoor air velocity was increased by a factor of six. Southall [19] indicated that demand control could be applied on natural ventilation systems where the levels of fresh air delivered respond to a sensed parameter. In this study, the impact of an active supply-side CO2 ventilation demand control system on the ventilation regime, flow patterns, and space heating energy of a two-storey naturally ventilated building was evaluated. It shows that the proposed ventilation demand control system could provide comparable indoor air quality compared with the uncontrolled case whilst having significant reductions in space heating consumption.
Wall-mounted vent caps (Figure 1), which are used for natural ventilation, are commonly seen on exterior walls in Asian countries. However, the induced ventilation rate, proper quantity, and recommended installation location of the vent cap(s) are limited in the literature. The objective of the present study is to explore the effect of different numbers of wall-mounted vent caps and their installation locations on the indoor air environment in residential kitchens. In so doing, wind tunnel experiments were performed to study the ventilation performance of vent caps, and the impact of vent caps on the indoor ventilation efficiency in kitchens was examined using CFD numerical simulations. The results were then applied to determine the appropriate quantity of vent caps and their proper installation location.

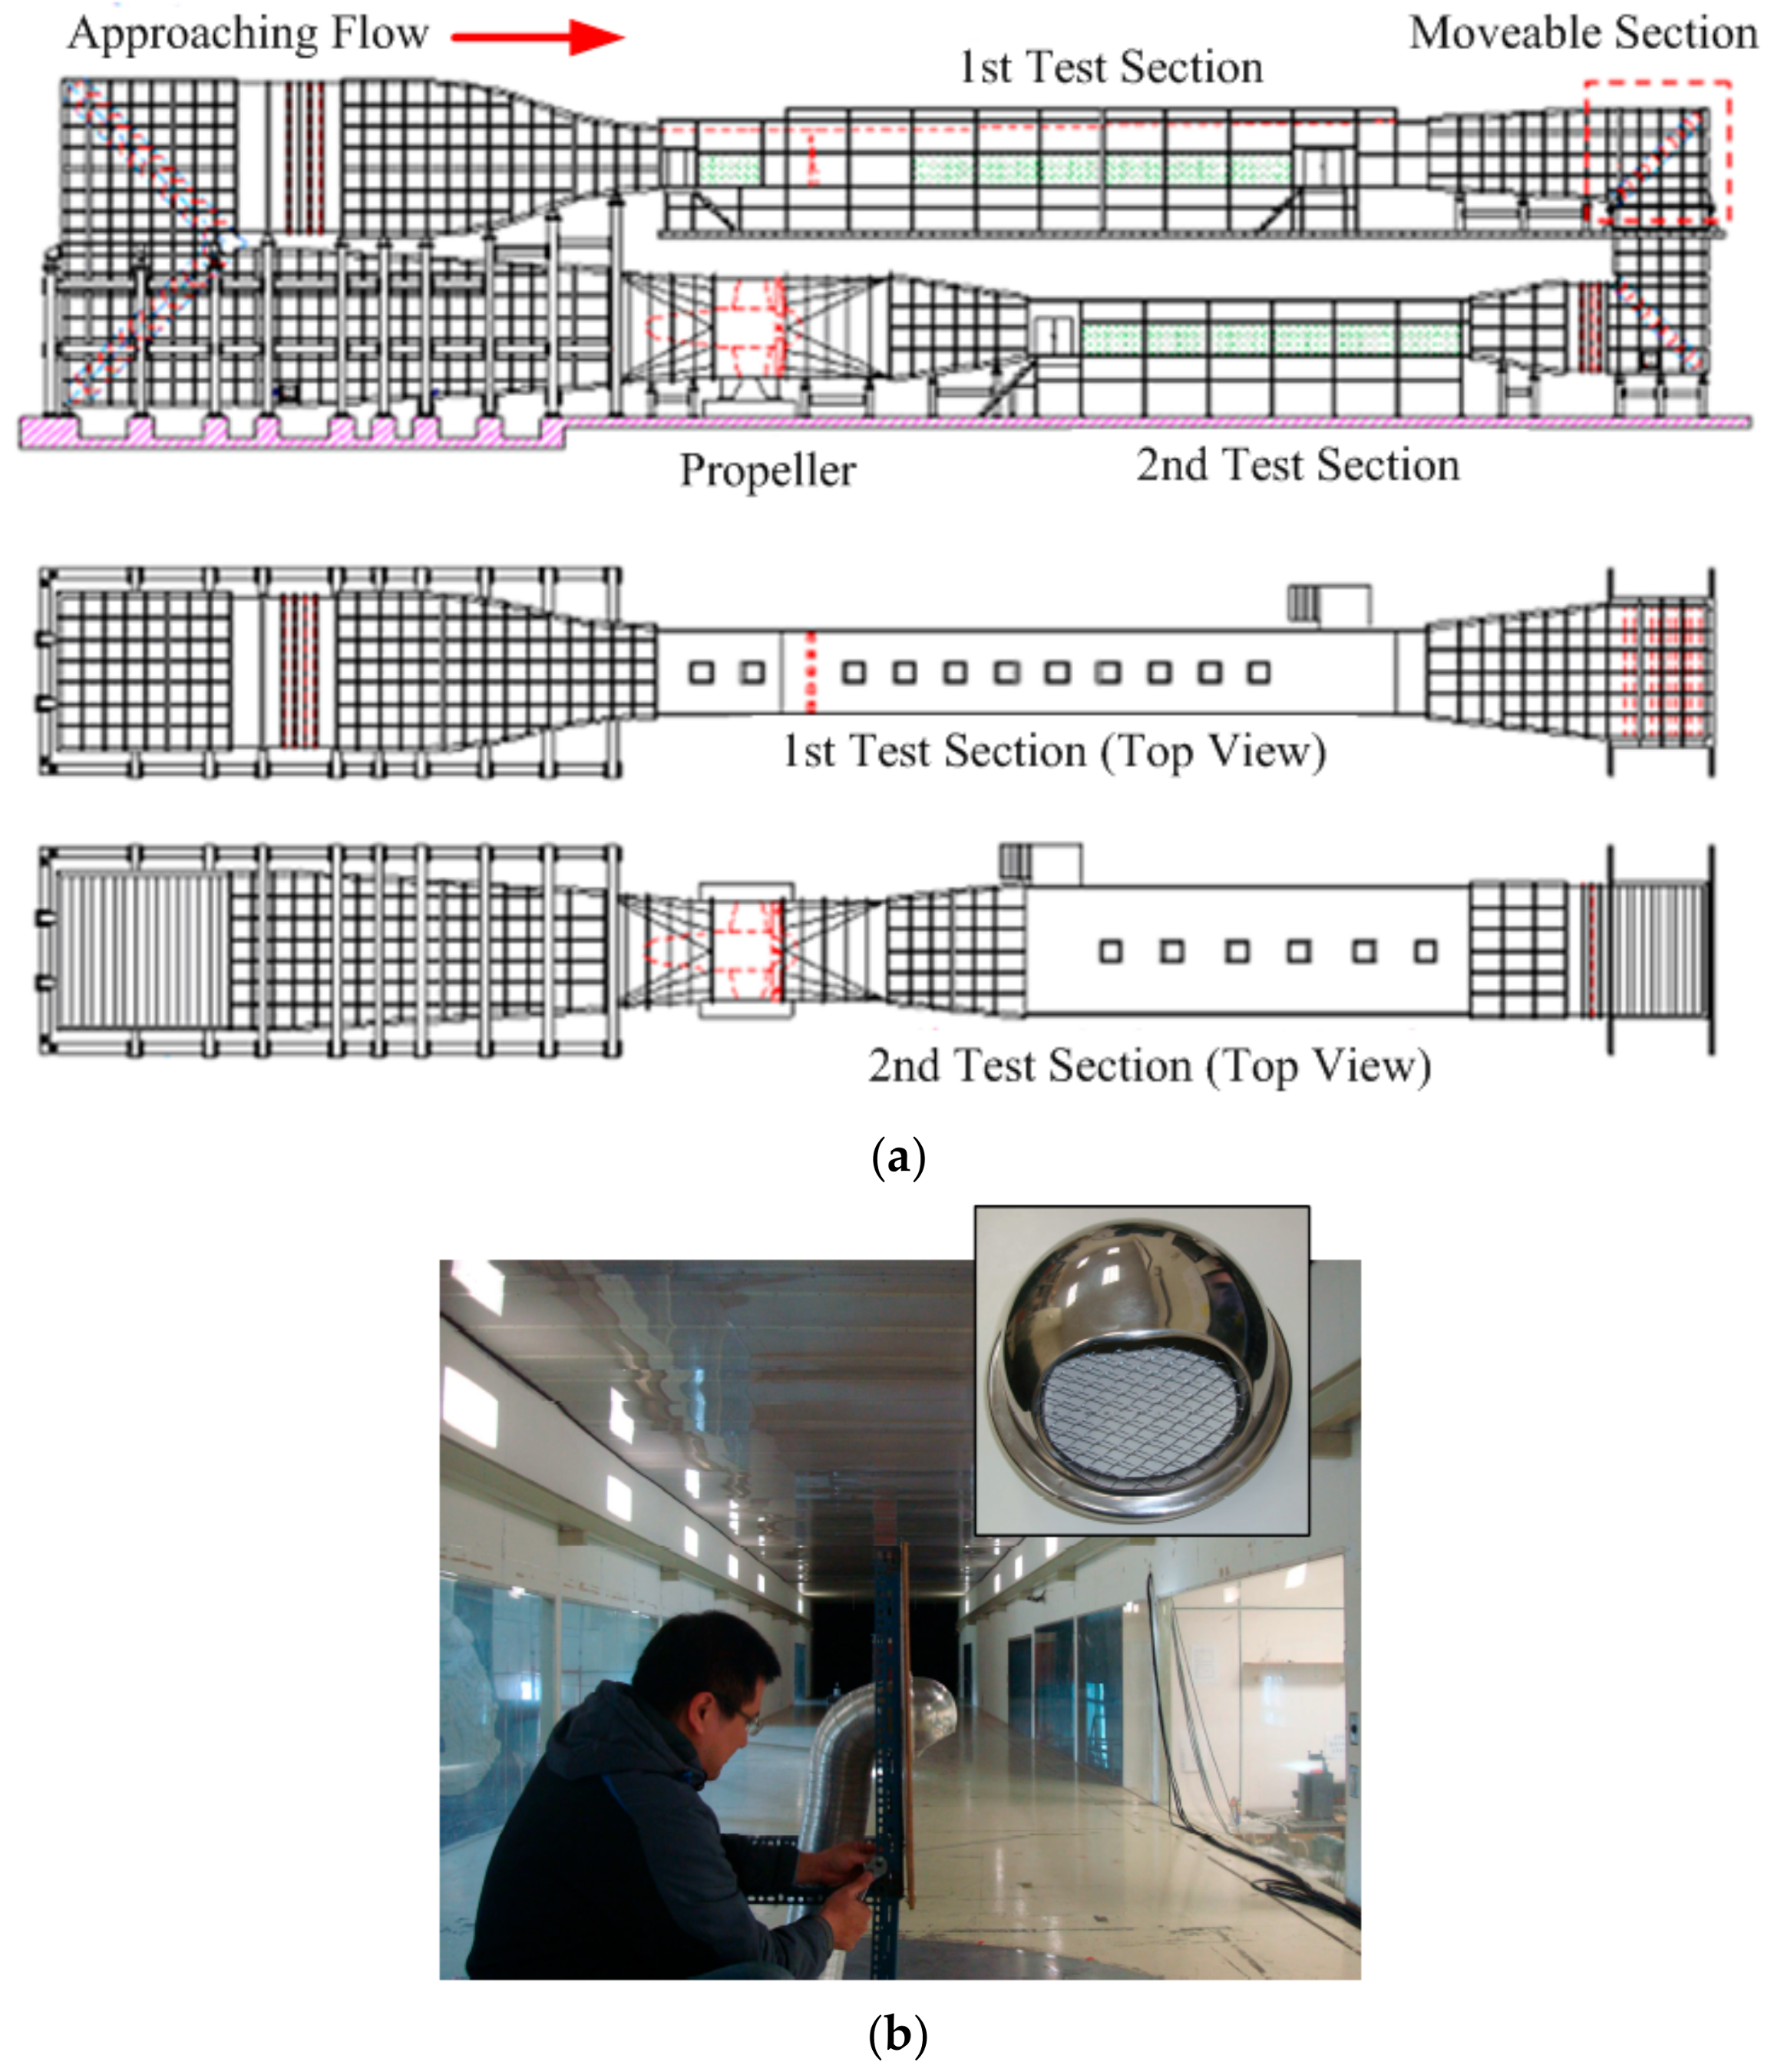
2. Wind Tunnel Tests of the Induced Ventilation Rates of Round Wall-Mounted Vent Caps

2.1. The Tested Vent Cap

Numerous factors affect the natural ventilation performance of a wall-mounted vent cap, including: (1) the orientation of the exterior wall with the vent cap and geometric extent of the adjacent wall surfaces, (2) the pollutant release rate, (3) the acceptable pollutant concentration and exposure time for cooks, (4) the type of indoor compartment, and (5) the main buoyant flow pattern; these must all be considered in deciding the proper location of a vent cap. There are many details of the geometry in real applications that could influence the airflow through wall caps. To preliminarily explore the induced ventilation rates of the vent cap, wind tunnel experiments are performed to analyze the induced ventilation rate of the vent cap (this section), followed by a discussion of Factor (1).
The measured ventilated-air speed is employed as a boundary condition for the CFD simulations in the next stage. Factors (2)–(5) are incorporated into the settings of the CFD simulations (Section 3). The vent cap has a hemispherical shape (Figure 1). The side facing the indoors has a circular opening with a diameter of 15 cm and an area of 8.84 × 10⁻³ m2. For the side that faces the outdoors, the lower half of the hemisphere is almost completely open, and has an area of approximately 6.3 × 10⁻³ m2.

2.2. Test Setup

The tests were conducted at the Wind Tunnel Laboratory, Architecture and Building Research Institute, Ministry of the Interior in Taiwan, which is located on the Gueiren Campus of National Cheng-Kung University. As shown in Figure 2, the closed-type wind tunnel has two test sections. The first test section is equipped with two rotating disks. The first rotating disk has a diameter of 1 m and is located 3 m from the entrance of the test section to collect measurements of the general fluid dynamics. The second rotating disk has a diameter of 2.6 m, and is located on a movable track between 25.5–31.5 m from the entrance. The second test section is equipped with a rotating disk that is located 15 m from the exit of the rectification section in the wind tunnel. The ventilation rate testing of the vent cap in this study was conducted using the second rotating disk in the wind tunnel’s first test section. This length, width, and height of the test section are 36.5 m, 4 m, and 2.6 m, respectively. The airflow velocities are measured using climate measuring instruments (Testo 445, Testo, Lenzkirch, Germany) with the hot-ball anemometers (range: 0–10 m/s). The induced ventilation rates of the vent cap are determined by the six points of the velocity traverse method. Uncertainties in the measured quantities for the present study were estimated to be ±0.03 m/s in the airflow velocity measured by anemometers, and ±0.005 m in length. Following the uncertainty propagation analysis, the uncertainties for the deducted test results were 4.90% to 17.0% for the volumetric airflow rates.

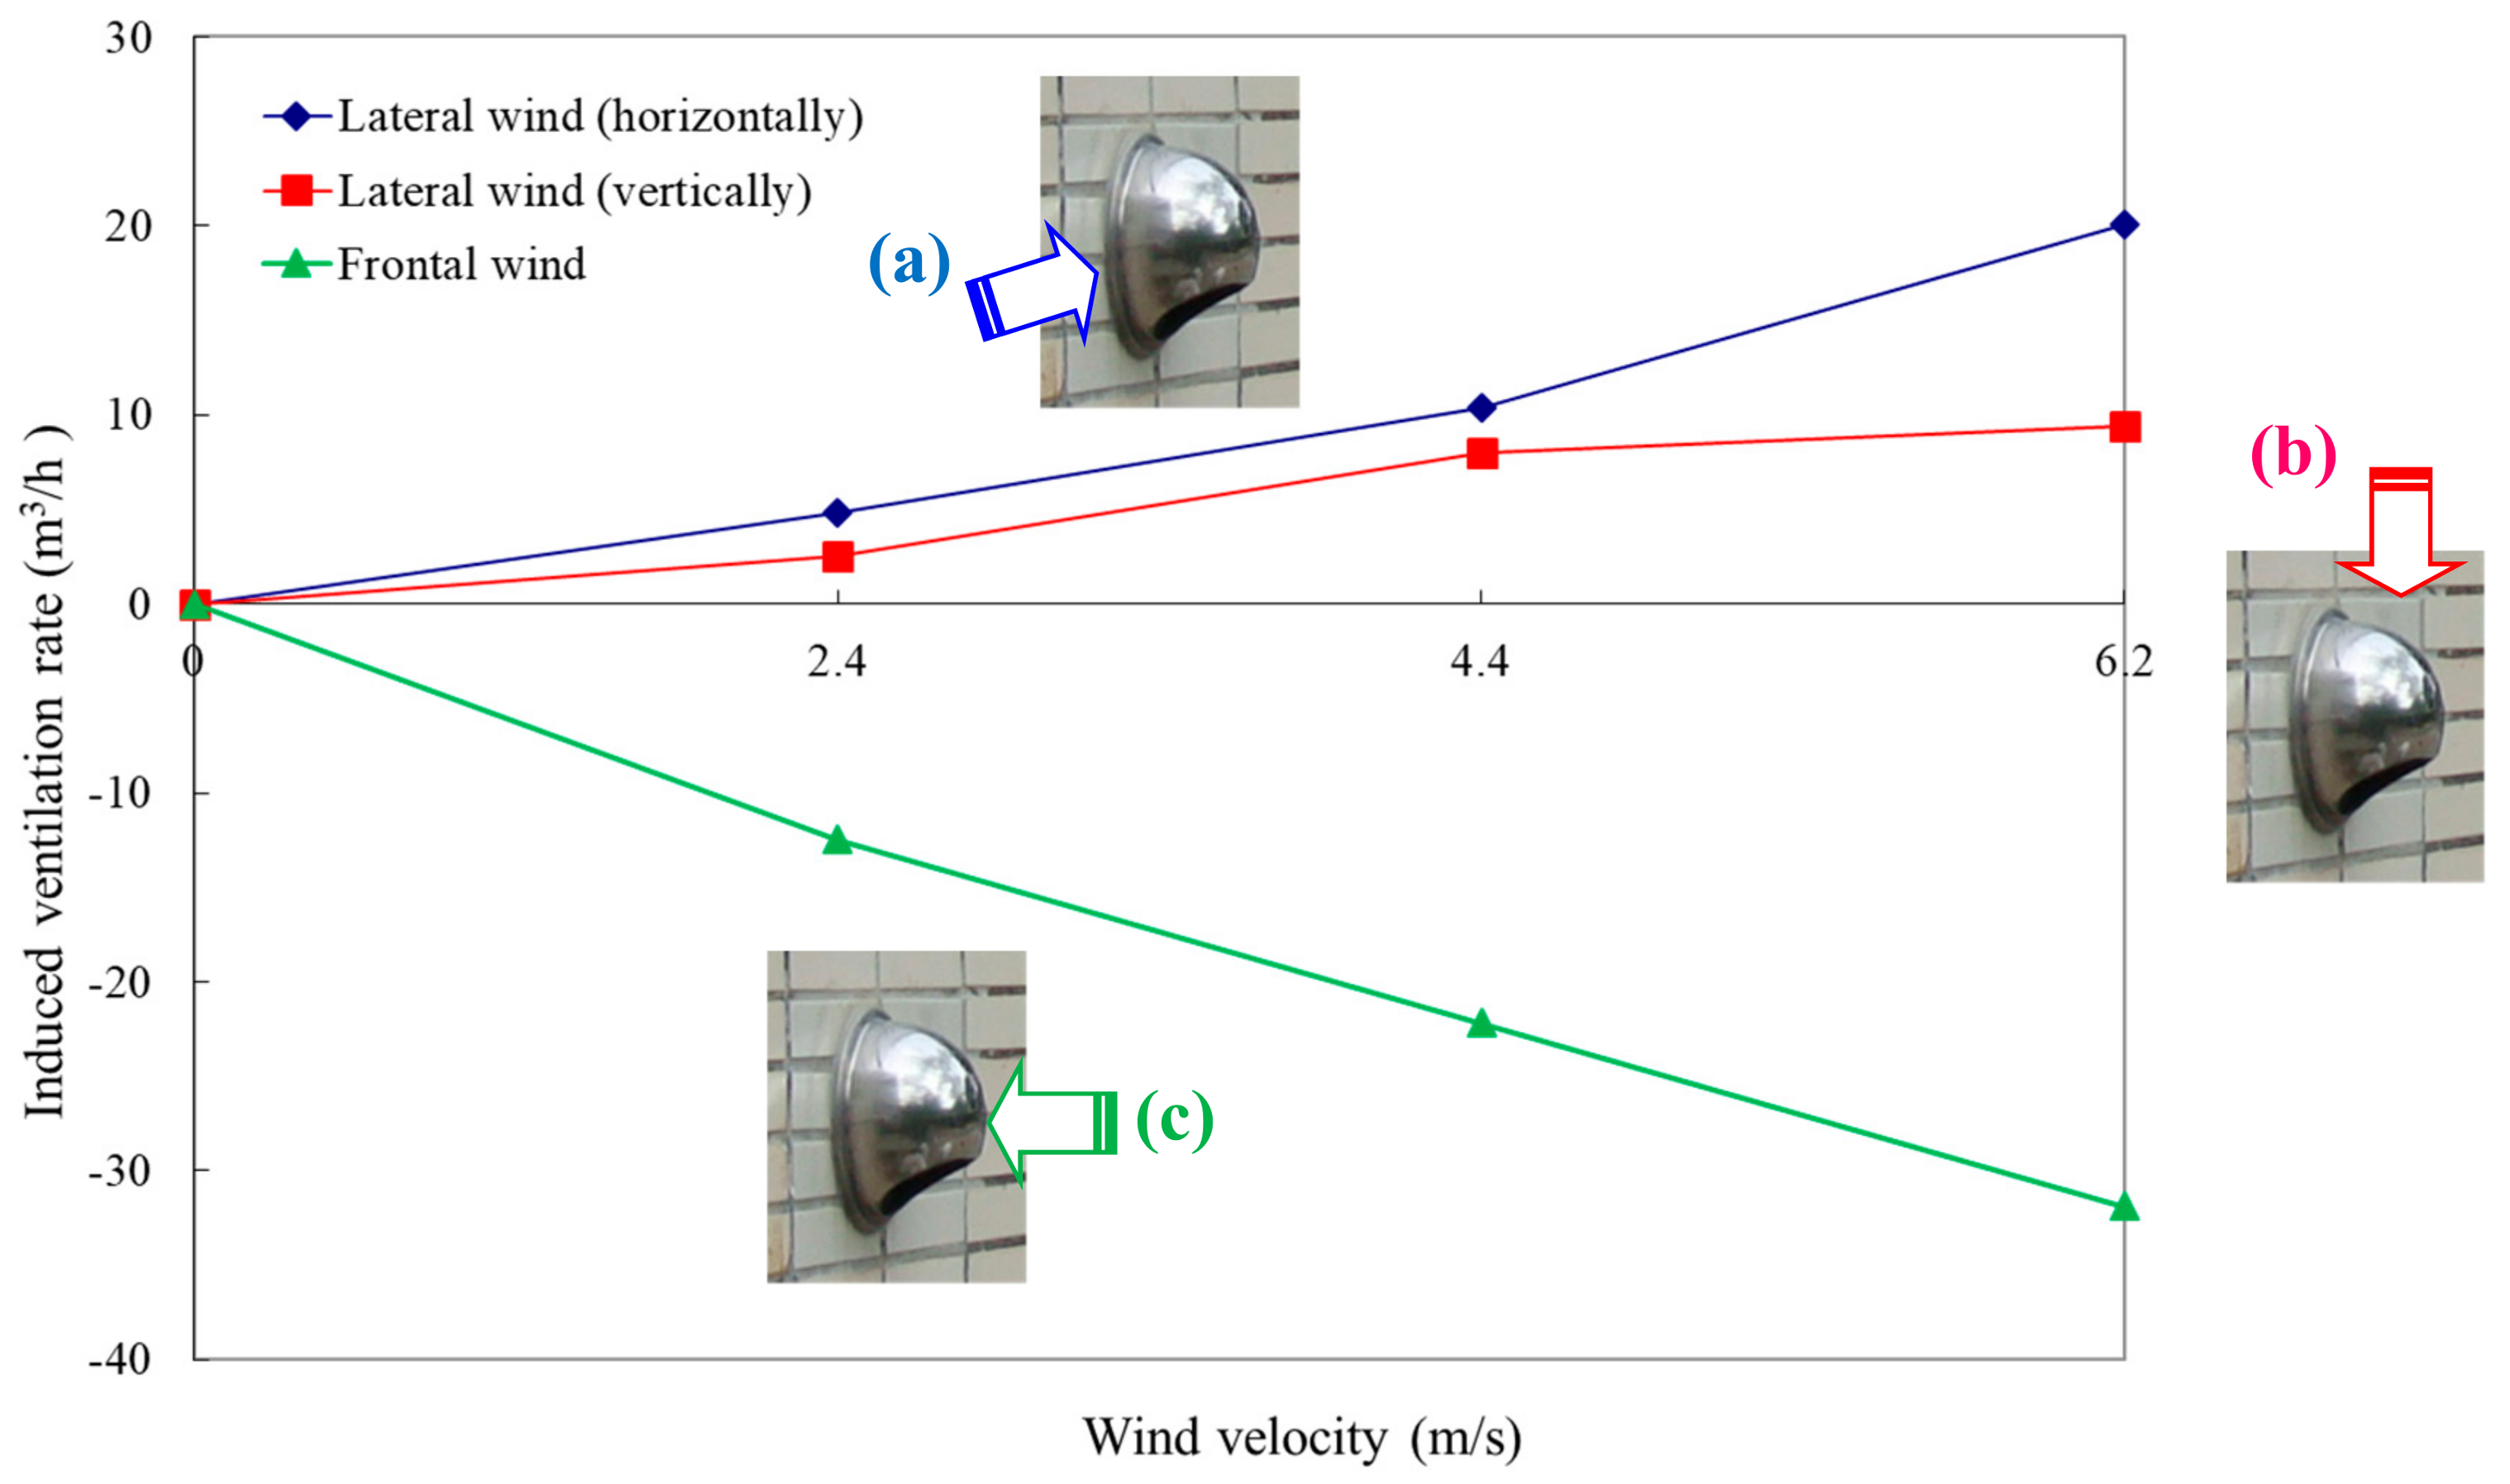
2.3. Test Results and Discussion

Since the exterior wall can be oriented in various directions, the wind can blow toward the wall in which the vent cap is installed from many directions. This study selected three typical wind directions for the wind tunnel tests (Figure 3). Please note that the negative induced ventilation rates in the figure stand for infiltrations, while positive ones are for exfiltration. Although the wind direction varies, the results indicate that the induced ventilation rate of the vent cap increases with increasing wind speed. An outdoor wind that flows parallel to the wall between 0–6 m/s (Figure 3a,b) can induce a ventilation rate between 0–20 m3/h toward the exterior. When the wind blows perpendicular to the wall between 0–6 m/s (Figure 3c), the outdoor air flows toward the interior with the ventilation rates between 0–31.9 m3/h.
When the outdoor wind blows perpendicular to the wall (Figure 3c), the outdoor air flows indoors, which will produce adverse effects in kitchen ventilation and hinder the extraction of indoor air pollutants through the vent cap. Therefore, installing a vent cap for ventilation on a wall that faces the direction of the monsoon winds should be avoided. However, installing a vent cap on a monsoon-facing outer wall is effective for introducing fresh air into the building for ventilation.
The direction of the outdoor wind may be significantly influenced by the geometric extent of the adjacent wall surfaces; such surfaces may prevent a vent cap from achieving its designed function, which is to exhaust indoor pollutants. In addition, the introduction of outdoor airflow generates uncertainty and risk into the application of a vent cap, because it has the opposite effect of its original design. A small low-power fan can be installed at the inlet of the vent cap to regulate the direction of air flow. If the outer wall with the vent cap regularly receives sunlight, the fan’s power can be supplied by a solar panel on this outer wall to form a complementary solar photovoltaic fan actuation with the wind. In high wind speed and low sunlight conditions, the vent cap can effectively work via wind-induced ventilation. When the sunlight is strong, and the wind speed is low, the solar energy-powered fan can drive the airflow in the vent cap. These complementary operations are expected to improve the ventilation efficiency of the vent cap and enable the use of renewable energy.

3. Application to Residential Kitchen Ventilation

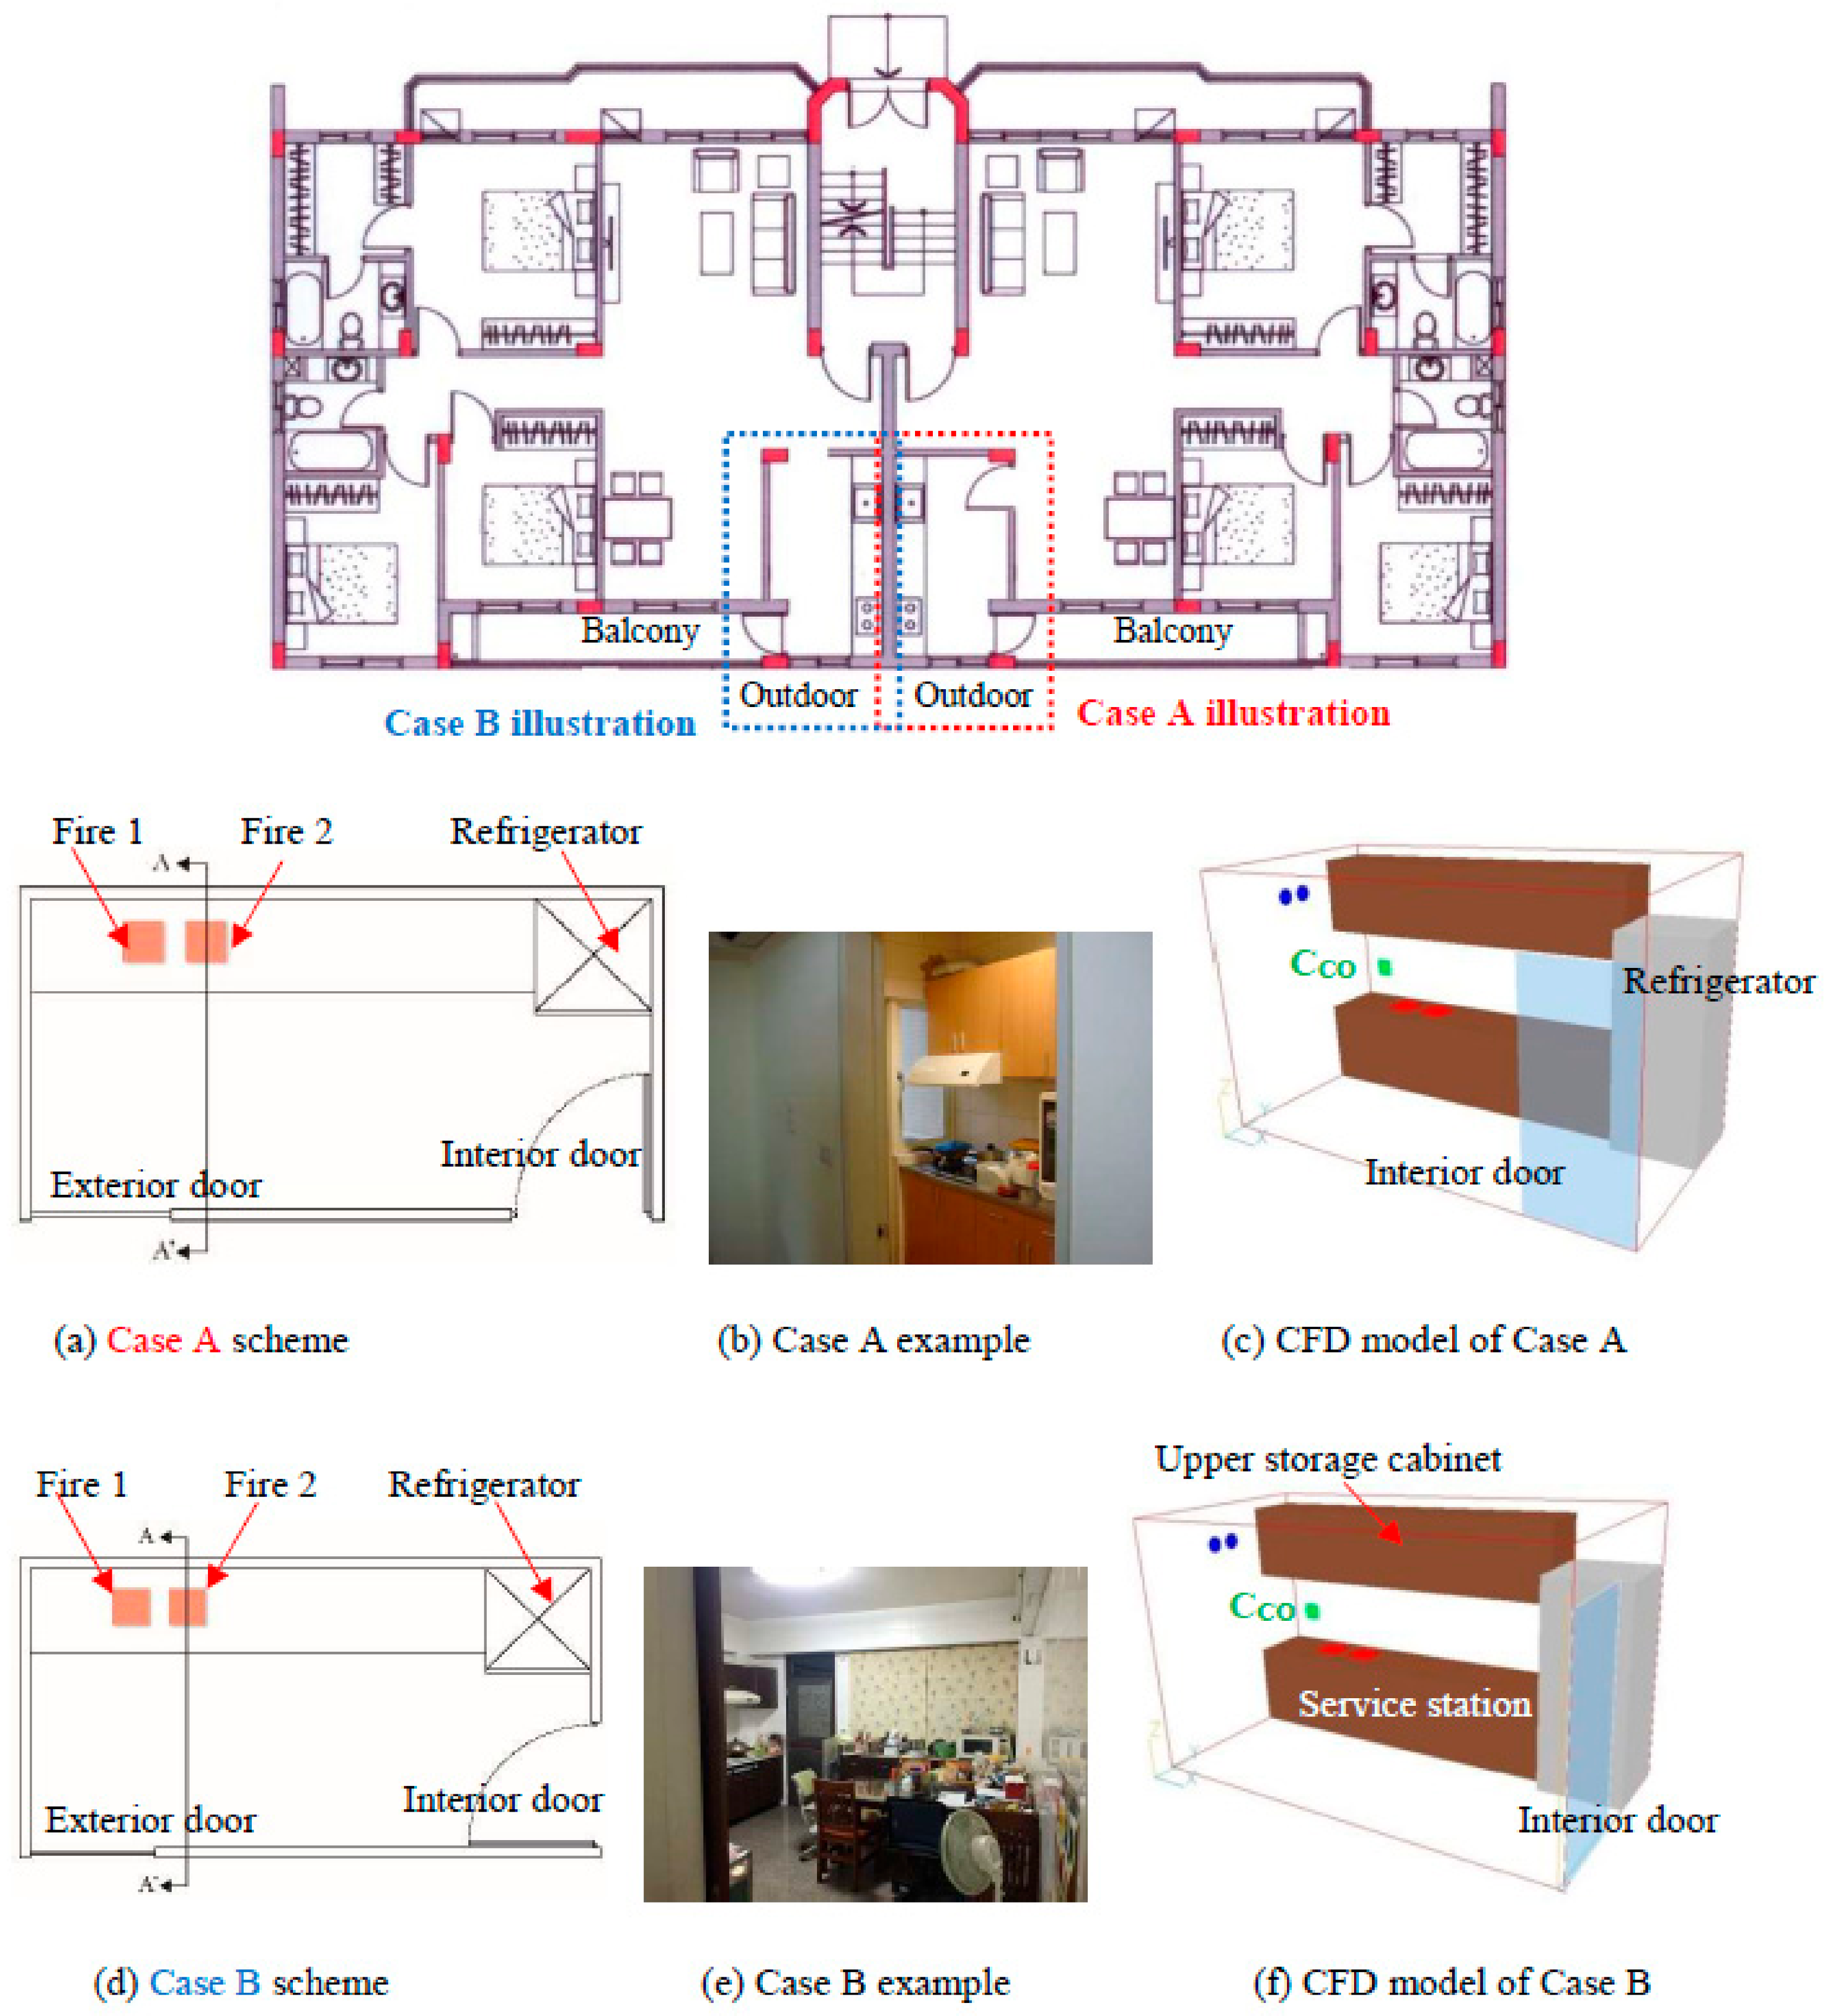
3.1. Investigated Model Kitchens

Although the spatial styles and dimensions of residential kitchens, and the size and styles of kitchenware and home appliances are diverse, basic furnishing styles and size ranges are available. Based on the results of a spatial and dimensional analysis, typical plan types were selected (Figure 4a,d), and model kitchens (Figure 4c,f) were developed based on these plans.
The only difference between the two model kitchens is the orientation of the interior door. For convenience of kitchen access, the interior door is normally open. The kitchen shown in Figure 4a,c is labeled Case A, and the kitchen shown in Figure 4d,f is labeled Case B. To avoid affecting the strength of the stove’s flame, the exterior door is normally closed. To explore the natural ventilation effects created by the investigated vent caps, the range hood is not operated during cooking. The geometric data of the investigated model are shown in Table 1.

3.2. Configurations and Effectiveness Assessment of Vent Cap Installation

Residential kitchens in Taiwan are commonly equipped with range hoods. To avoid noise during its operation or during brief periods of cooking, some cooks do not turn on the range hood. The purpose of this study is to explore whether the installation of a vent cap can reduce the exposure risk to carbon monoxide in hood-off conditions and determine the potential of vent caps as a fail-safe design for air-quality conditions in kitchens.
A vent cap(s) is (are) installed on the exterior wall of the kitchen (Figure 5; also refer to Figure 4a,d). In accordance with the preferences of residents, the vents should not be arranged in oblique rows (e.g., not ①⑤⑨ in Figure 5), and as few vents as possible should be employed. Based on the conclusions of Section 2.3, the ventilation rate capacity of each vent cap is set to 1 m/s (13.85 m3/h, Figure 3). Thus, the following cases are explored in this study:
  • Installation of one vent cap: nine locations (①–⑨);
  • Installation of two vent caps: nine horizontal layouts (①②, ②③, ①③, ④⑤, ⑤⑥, ④⑥, ⑦⑧, ⑧⑨, and ⑦⑨) and nine vertical layouts (①④, ④⑦, ①⑦, ②⑤, ⑤⑧, ②⑧, ③⑥, ⑥⑨, and ③⑨);
  • Installation of three vent caps: three horizontal layouts (①②③, ④⑤⑥, and ⑦⑧⑨) and three vertical layouts (①④⑦, ②⑤⑧, and ③⑥⑨).
The average carbon monoxide concentration CCO (PPMV: parts per million by volume) in the breathing zone of cooks was used to evaluate the effectiveness of the installed vent cap. The center of the cook’s breathing zone is set to 0.925 m, 1.2 m, and 1.45 m. When calculating CCO, the area of the average concentration of carbon monoxide was extended 0.15 m from the center position in the x and z directions; therefore, an area of 0.3 m (x direction) × 0.3 m (z direction) was employed for the assessment (green symbols in Figure 4c,f).

3.3. Numerical Methods

Numerical simulations of the problem being considered were performed via a finite volume method to solve the governing equations with the previously discussed boundary conditions (as listed in Table 2). The calculation domain is shown in Figure 4c,f. The commercial CFD code PHOENICS (2013, Concentration, Heat and Momentum Limited (CHAM), London, UK) was used to simulate the airflow and temperature distributions. The governing equations solved by PHOENICS include the three-dimensional incompressible Navier-Stokes equation, the convection diffusion equation and the k-ε turbulence equation. The formulations for these equations are listed in the PHOENICS’s manual [21], as well as in any CFD textbook, but they not provided in this study. The empirical turbulence coefficients for the k-ε turbulence equation were assigned as follows: σk = 1.0, σε = 1.22, σε1 = 1.44, σε2 = 1.92, and = 0.09. These values are widely accepted in CFD k-ε models. To bridge the steep gradients of the dependent variables near the solid surface, a general wall function was employed. The iterated calculation was continued until a prescribed relative convergence of 10−3 was satisfied for all of the field variables of this problem. When testing the grid independence of the mesh domain, the temperature distribution at the cook’s position (X = 0.925 m, Y = 1.2 m) based on different grid points was used to calculate the deviation percentages and determine a suitable grid point system for our calculations, as shown in Figure 6. The numerical simulation accuracy depends on the resolution of the computational mesh, and a finer grid produces more accurate solutions. A grid system with 230,724 (87 × 39 × 68) cells was used in the numerical simulations in this study. An increased number of cells will provide better information in addition to a significant increase in computational resources.

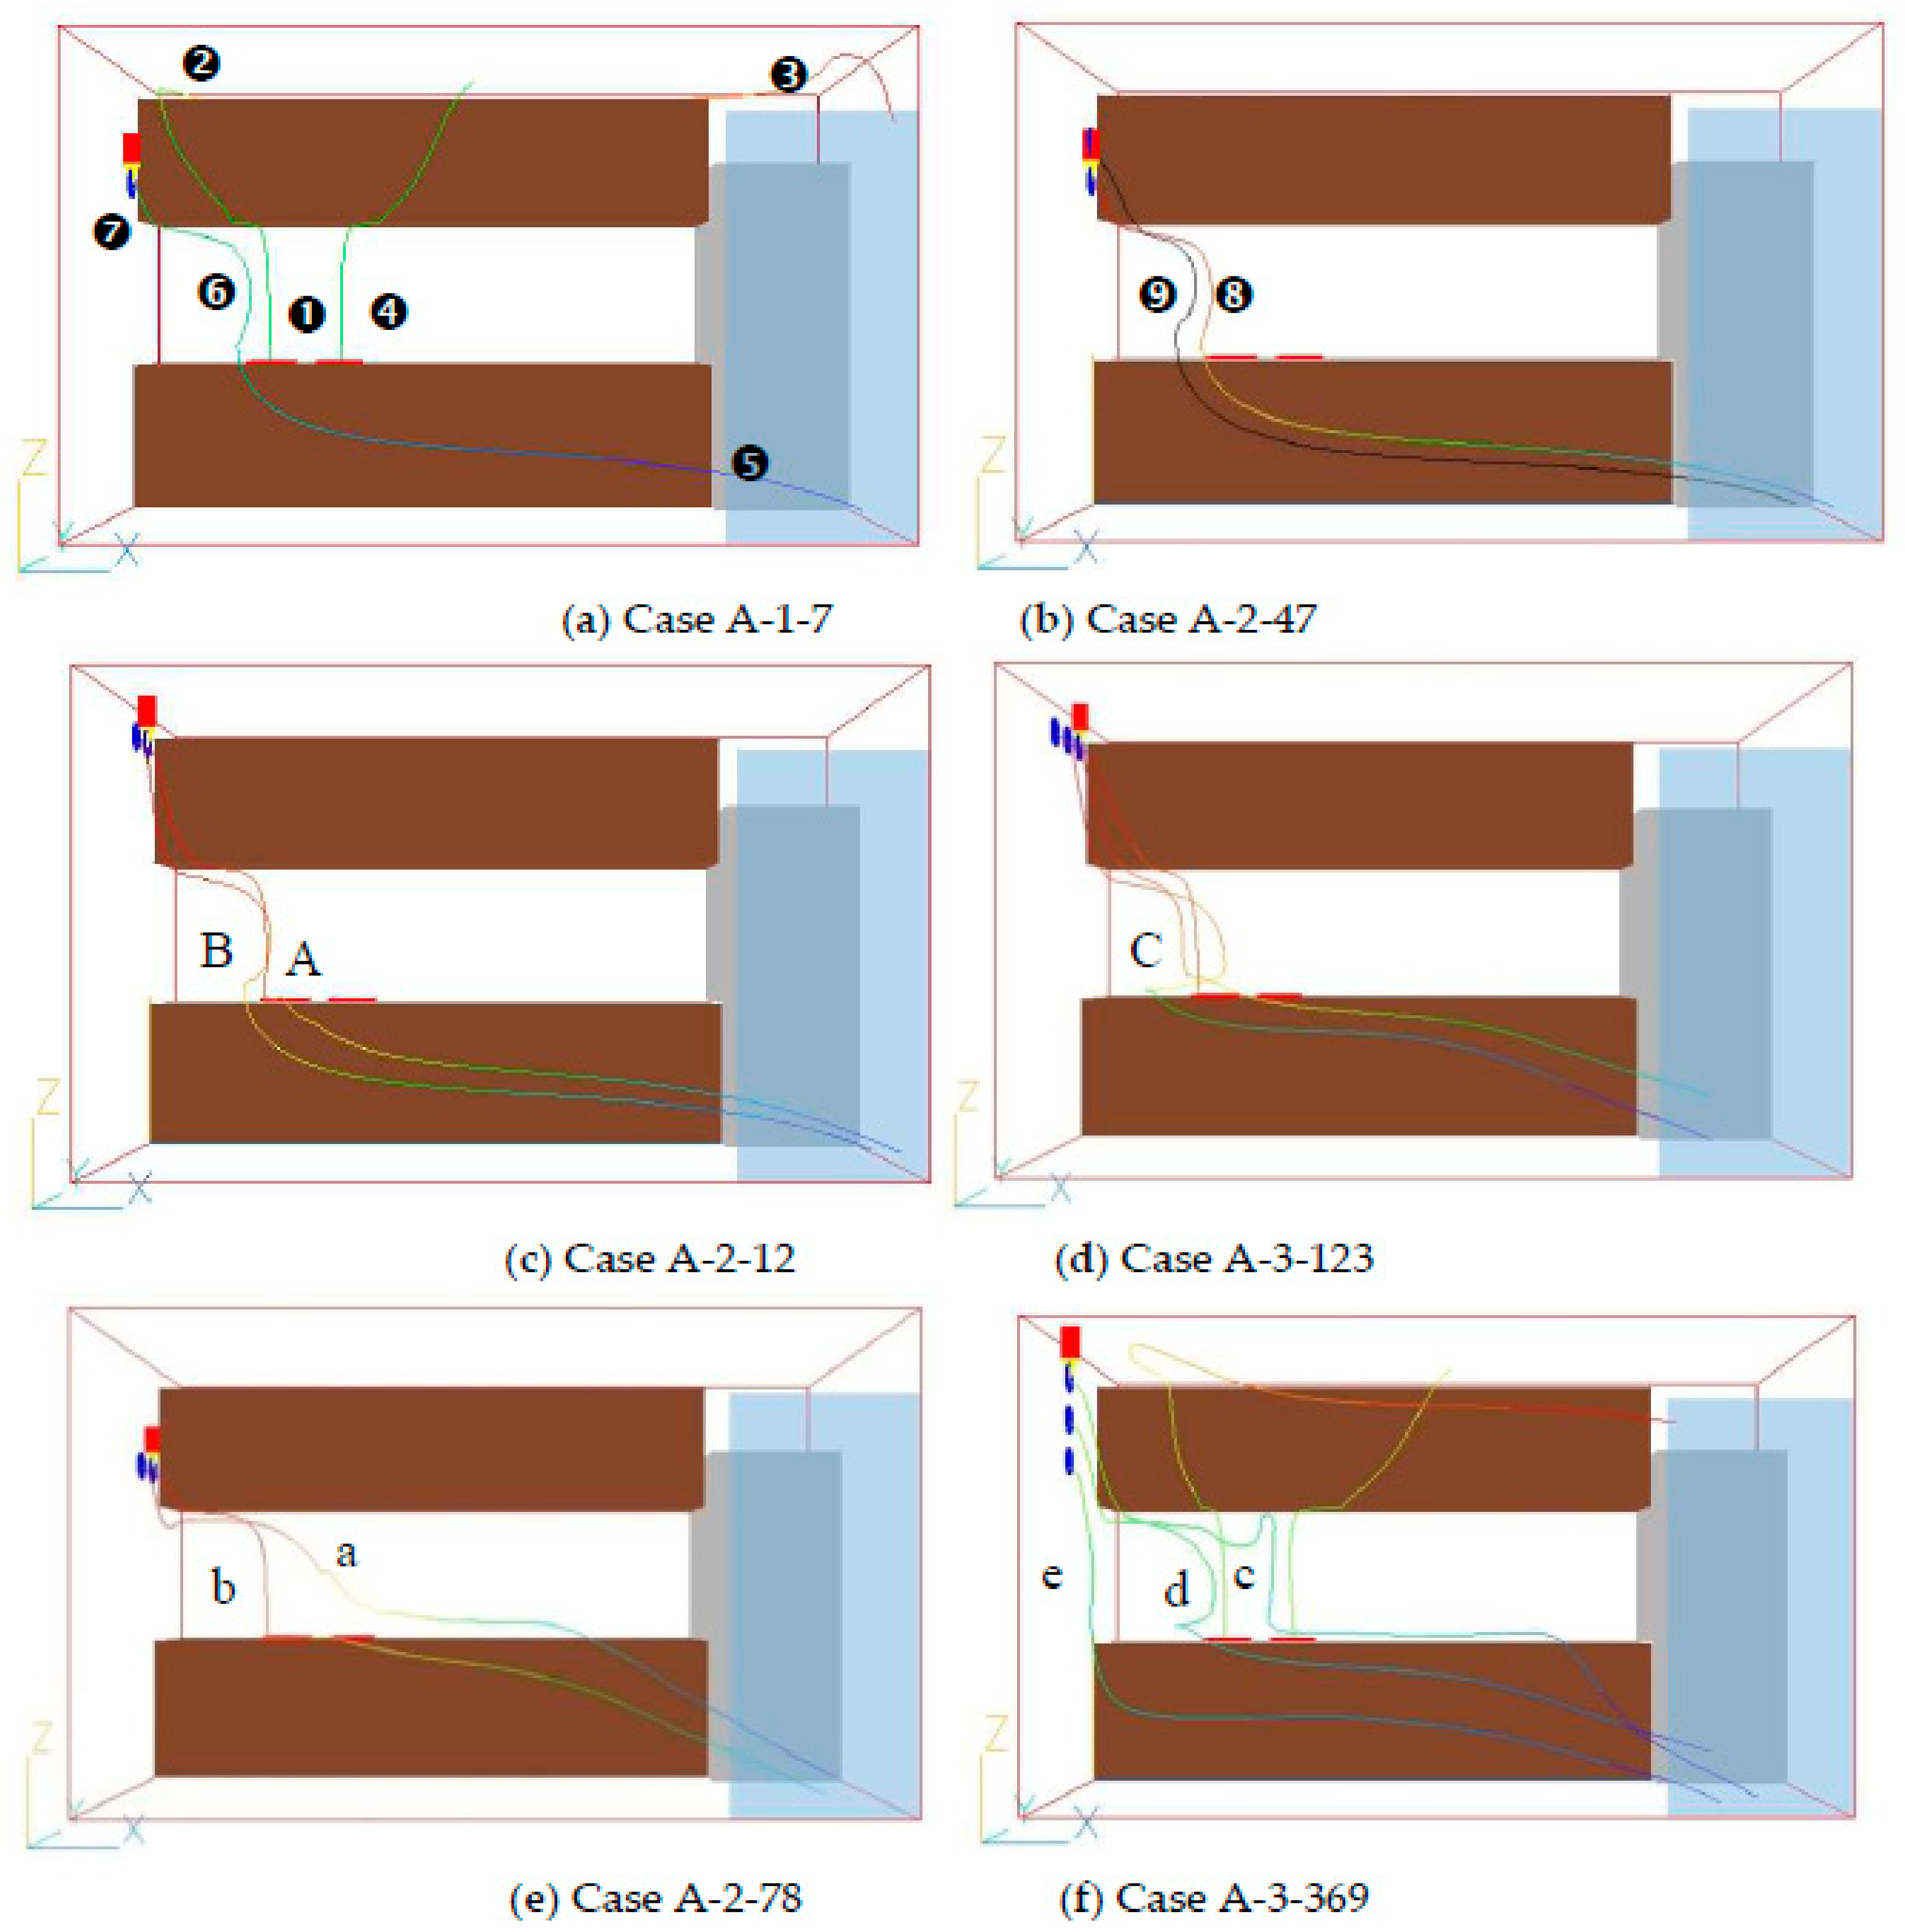
3.4. CFD Simulation Results and Discussion

The CFD simulation results for Case A are summarized in Figure 7. The average carbon monoxide concentration (Cco) in the cook’s breathing zone is distinctly lower after installation of the vent cap(s) (Case A-0: without any caps). However, when only one vent cap is installed (cases A-1-1 to A-1-9), the Cco values remained high regardless of the location of the vent cap. When two vent caps are installed, the installations with the vent caps near the upper storage cabinet (Cases A-2-12, A-2-45, A-2-14, A-2-47, and A-2-17, which are represented by the blue dotted rectangles and the yellow rectangle) yielded relatively high Cco values. The installation of three vent caps in a vertical line near the upper storage cabinet (Case A-3-147, indicated by the red dotted oval) also yields a relatively high Cco value.
Buoyancy has a similar importance as wind-induced pressures, which both affect infiltration and ventilation in residences. Buoyancy is likely to be a significant factor influencing airflow through the wall caps, and has been considered in this study. As shown in Figure 8a, when one vent cap is installed at location ⑦ (see also Figure 5), the thermal plume on the left side stove (❶) comes into contact with the upper storage cabinet, expands along the cabinet, and reaches the ceiling (❷). The plume spreads along the ceiling to the interior door (❸). The flow path of the right thermal plume (❹) is similar to the flow path of the left thermal plume. The fresh air from the indoor space will flow into the kitchen from the lower part of the interior door (❺), and continue toward the flame region (❻) until flowing outdoors (❼) through the vent cap. The two thermal plumes (❶ and ❹) and the flow path (❺-❻-❼) form the dominant flow pattern.
As shown in Figure 8b, when two vent caps are installed at locations ④ and ⑦ (see also Figure 5) (i.e., Case A-2-47), the flow structure is similar to the flow structure of the single vent cap in Figure 8a. The flow path (❽) is closer to the flame than the flow path in Figure 8a (❻); thus, it can carry away more carbon monoxide. However, due to the flow structure, flow path ❾ has difficulty approaching the flame; thus, its performance in decreasing the CO concentration is poor. This condition also occurred in cases A-2-14, A-2-17, A-2-12 (Symbols A and B in Figure 8c), and Case A-2-45. When vent caps are installed at locations ①, ②, and ③ (see also Figure 5), the three flow paths (symbol C in Figure 8d) pass by the flame, which will effectively reduce the CO concentration.
When the vent caps are installed at locations ⑦ and ⑧ (see also Figure 5), flow paths a and b extend from the indoor toward the flame, and then exit through the vent cap, which decreases the Cco value (Figure 8e). When three vent caps are installed at locations ③, ⑥, and ⑨, flow paths c and d can effectively flow above the flame (Figure 8f). However, flow path e did not pass through the pollutant region; as a result, the probability of carrying away CO was reduced. Although the number of vent caps was increased to three, the CO concentration could not be significantly decreased.
Figure 9 shows the CFD simulation results for Case B, which reveals that the Cco value remains high regardless of the installation location (cases B-1-1 to B-1-9) when one vent cap is installed. Since the air that flows in from the interior can easily pass by the kitchen, this cross-flow pattern dominates the flow field of the kitchen; thus, the number of vent caps (two or three) and the installation location do not have a significant effect on the Cco value.
As shown in Figure 7, when two vent caps are installed, installation locations ①④, ④⑦, ①⑦, ①②, and ④⑤ (see also Figure 5) are not appropriate for Case A. When three vent caps are installed, installation locations ①, ④, and ⑦ are inappropriate. After excluding these improper locations, the recommended installation location for the vent caps for Case A is in the region that is located more than 0.8 m from the wall (Y = 2) and 1.72 m above the floor (blue region in Figure 10a), and two or three vent caps can be utilized. For Case B, the installation of two or three vent caps in the blue region shown in Figure 10b is suggested. In the area of the external wall between the recommended installation locations and the exterior door, the buoyant effect causes the flow field to weaken due to the distance from the flame, which renders the vent cap ineffective. Installation in this region is not recommended.

4. Conclusions

This study investigated the ventilation performance of round wall-mounted vent caps using wind tunnel experiments, and examined the effect of vent caps in natural ventilation in residential kitchens in Taiwan using CFD numerical simulations. The following conclusions are obtained from the results:
  • Winds with speeds of 0–6 m/s that flow parallel to the wall with a vent cap cause ventilation rates of 0–20 m3/h to exit through the vent cap. When the wind blows perpendicular to the wall at speeds of 0–6 m/s, outdoor air flow indoors with the ventilation rates of 0–31.9 m3/h.
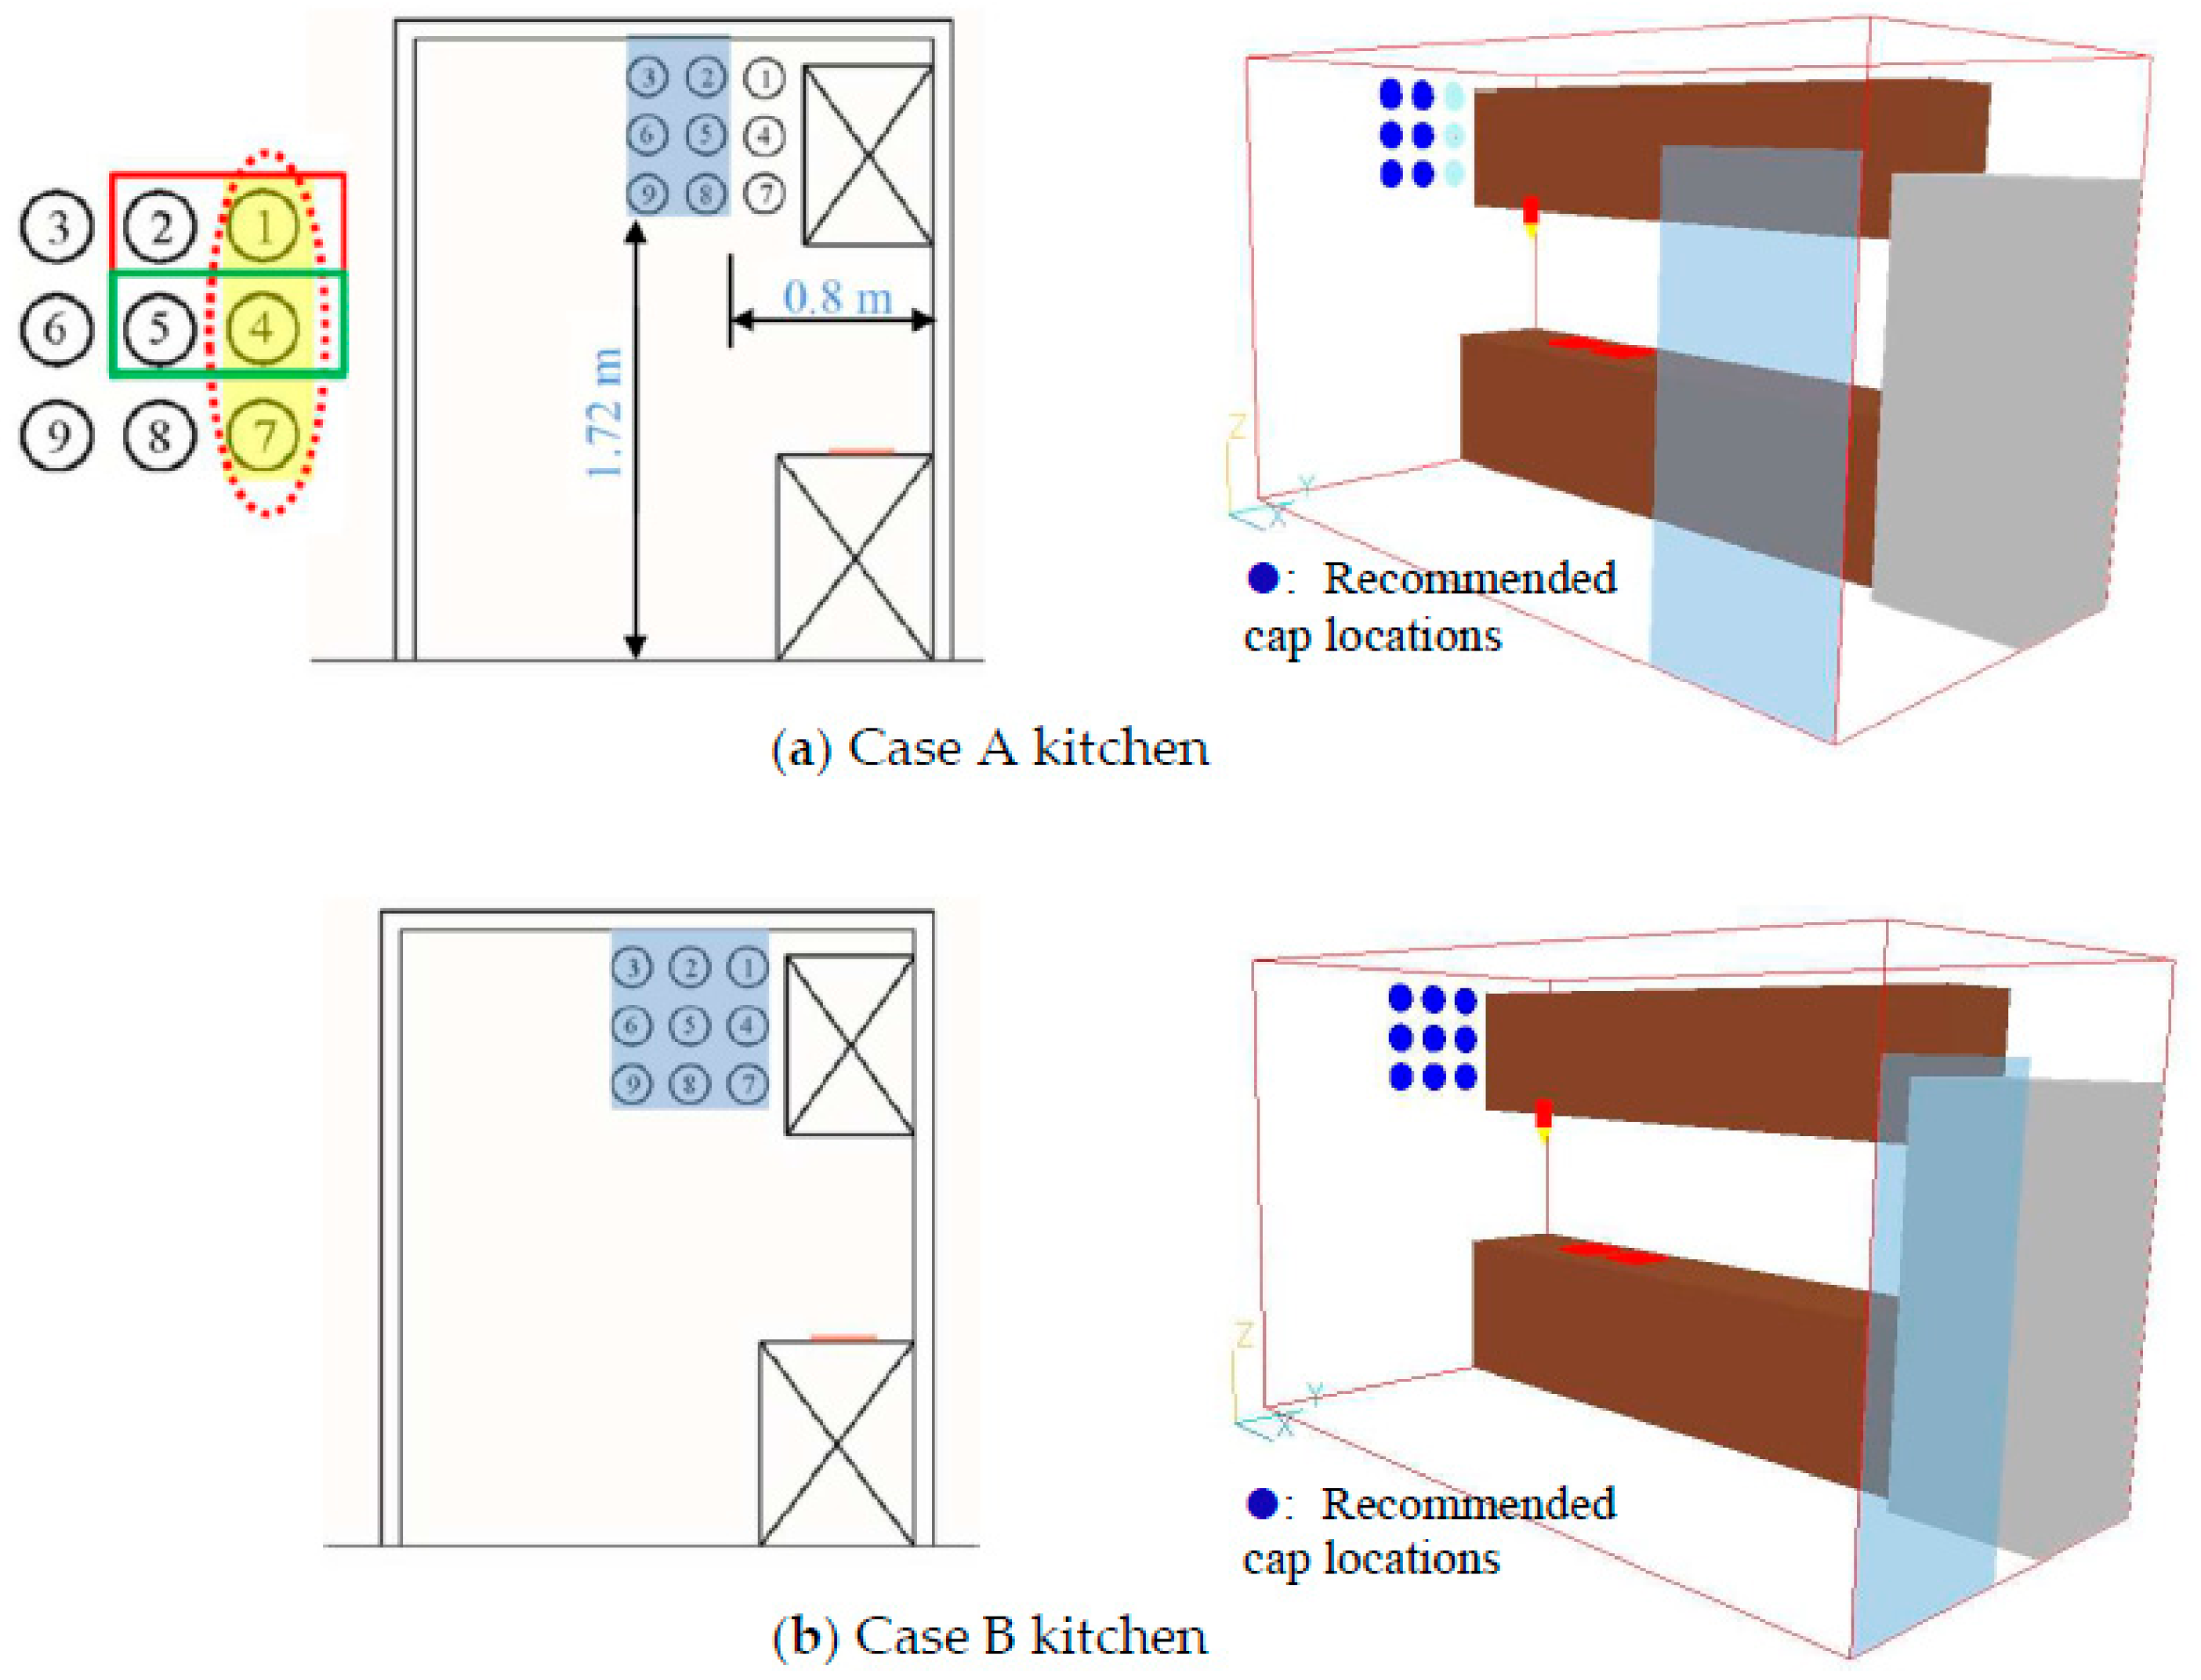
  • After the vent cap(s) is (are) installed on the exterior wall of the Case A kitchen (Figure 4a,c), the average CO concentrations of the cook are lower than the average CO concentrations prior to the installation. However, when one vent cap is installed, the average CO concentration remains high, regardless of its location. When two vent caps are installed near the upper storage cabinet, the average CO concentration remains fairly high. When three vent caps are installed, only the vertical layout closest to the storage cabinet produces a high CO concentration.
  • When one vent cap is installed on the exterior wall in the Case B kitchen (Figure 4d,f), the average CO concentration remains high, regardless of the installation location. When two or three vent caps are installed, the number and location of the vent caps do not have a significant effect on the CO concentration.
  • The direction of the typically opened interior door can influence the ventilation efficiency of the vent cap.
  • The recommended installation locations for round wall-mounted vent caps (blue areas in Figure 10) are provided.
With an open interior door, the natural convection flow induced by heat emissions from cooking or by other means (e.g., the vent cap(s) in this study) will induce considerable exchange flow between the kitchen and the adjacent interior space. Although this feature, as well as optimization and economic analyses, weather effects, and design parameter effects are not what we are exploring in this study, they are worthy of further consideration.

Author Contributions

C.-M.L. and C.I. conceived of and designed the investigated model; Y.-P.L. and C.-M.L. performed the experiments; Y.-P.L. and C.-M.L. performed the numerical simulation; Y.-P.L., C.I. and C.-M.L. analyzed the data; and C.-M.L. wrote the paper.

Conflicts of Interest

The authors have no conflicts of interest.

References

  1. Ko, Y.C.; Cheng, L.S.; Lee, C.H.; Huang, J.J.; Huang, M.S.; Kao, E.L.; Wang, H.Z.; Lin, H.J. Chinese food cooking and lung cancer in women nonsmokers. Am. J. Epidemiol. 2000, 151, 140–147. [Google Scholar] [CrossRef] [PubMed]
  2. Cheng, J.H.; Lee, Y.S.; Chen, K.S. Carbonyl compounds in dining areas, kitchens and exhaust streams in restaurants with varying cooking methods in Kaohsiung, Taiwan. J. Environ. Sci. 2016, 41, 218–226. [Google Scholar] [CrossRef] [PubMed]
  3. Wan, M.-P.; Wu, C.-L.; To, G.-N.S.; Chan, T.-C.; Chao, C.Y.H. Ultrafine particles, and PM2.5 generated from cooking in homes. Atmos. Environ. 2011, 45, 6141–6148. [Google Scholar] [CrossRef]
  4. Kosonen, R. The effect of supply air systems on the efficiency of a ventilated ceiling. Build. Environ. 2007, 42, 1613–1623. [Google Scholar] [CrossRef]
  5. Li, A.; Zhao, Y.; Jiang, D.; Hou, X. Measurement of temperature, relative humidity, concentration distribution and flow field in four typical Chinese commercial kitchens. Build. Environ. 2012, 56, 139–150. [Google Scholar] [CrossRef]
  6. Gao, J.; Cao, C.; Xiao, Q.; Xu, B.; Zhou, X.; Zhang, X. Determination of dynamic intake fraction of cooking-generated particles in the kitchen. Build. Environ. 2013, 65, 146–153. [Google Scholar] [CrossRef]
  7. Smith, K.M.; Svendsen, S. The effect of a rotary heat exchanger in room-based ventilation on indoor humidity in existing apartments in temperate climates. Energy Build. 2016, 116, 349–361. [Google Scholar] [CrossRef] [Green Version]
  8. Pinto, M.; Viegas, J. The influence of ventilation systems on domestic gas appliances: An experimental study. Build. Environ. 2013, 69, 1–13. [Google Scholar] [CrossRef]
  9. Zhou, B.; Chen, F.; Dong, Z.; Nielsen, P.V. Study on pollution control in residential kitchen based on the push-pull ventilation system. Build. Environ. 2016, 107, 99–112. [Google Scholar] [CrossRef]
  10. Li, A.; Zhang, W.; Gao, M. Field test and CFD modeling for flow characteristics in central cooking exhaust shaft of a high-rise residential building. Energy Build. 2017, 147, 210–223. [Google Scholar] [CrossRef]
  11. Singer, B.C.; Pass, R.Z.; Delp, W.W.; Lorenzetti, D.M.; Maddalena, R.L. Pollutant concentrations and emission rates from natural gas cooking burners without and with range hood exhaust in nine California homes. Build. Environ. 2017, 122, 215–229. [Google Scholar] [CrossRef]
  12. Huang, Y.; Wang, Y.; Liu, L.; Nielsen, P.V.; Jensen, R.L.; Yang, X. Performance of constant exhaust ventilation for removal of transient high-temperature contaminated airflows and ventilation-performance comparison between two local exhaust hoods. Energy Build. 2017, 154, 207–216. [Google Scholar] [CrossRef]
  13. Dobbin, N.A.; Sun, L.; Wallace, L.; Kulka, R.; Singer, B.C. The benefit of kitchen exhaust fan use after cooking—An experimental assessment. Build. Environ. 2018, 135, 286–296. [Google Scholar] [CrossRef]
  14. Cao, G.; Awbi, H.; Yao, R.; Fan, Y.; Sirén, K.; Kosonen, R.; Zhang, J. A review of the performance of different ventilation and airflow distribution systems in buildings. Build. Environ. 2014, 73, 171–186. [Google Scholar] [CrossRef]
  15. Chiang, C.-M.; Lai, C.-M.; Chou, P.-C.; Li, Y.-Y. The influence of an architectural design alternative (transoms) on indoor air environment in conventional kitchens in Taiwan. Build. Environ. 2000, 35, 579–585. [Google Scholar] [CrossRef]
  16. D’Ambrosio Alfano, F.R.; Ficco, G.; Palella, B.I.; Riccio, G.; Ranesi, A. An Experimental Investigation on the Air Permeability of Passive Ventilation Grilles. Energy Procedia 2015, 78, 2869–2874. [Google Scholar] [CrossRef]
  17. Wang, H.; Lin, H.; Ng, V.C.Y.; Yang, T.; Guan, L.Y. Failure of natural ventilation strategy in a sustainable house in China. Int. J. Low Carbon Technol. 2015, 10, 216–228. [Google Scholar] [CrossRef]
  18. Elshafei, G.; Negm, A.; Bady, M.; Suzuki, M.; Ibrahim, M.G. Numerical and experimental investigations of the impacts of window parameters on indoor natural ventilation in a residential building. Energy Build. 2017, 141, 321–332. [Google Scholar] [CrossRef]
  19. Southall, R.G. An assessment of the potential of supply-side ventilation demand control to regulate natural ventilation flow patterns and reduce domestic space heating consumption. Energy Build. 2018, 168, 201–214. [Google Scholar] [CrossRef]
  20. Li, B.; Du, C.; Yao, R.; Yu, W.; Costanzo, V. Indoor thermal environments in Chinese residential buildings responding to the diversity of climates. Appl. Therm. Eng. 2018, 129, 693–708. [Google Scholar] [CrossRef]
  21. Spalding, D.B. The PHOENICS Encyclopedia; CHAM: London, UK, 1994. [Google Scholar]
Figure 1. Example applications of wall-mounted vent caps.
Energies 11 01230 g001
Figure 2. (a) Schematics and (b) photo of the wind tunnel.
Energies 11 01230 g002
Figure 3. Results of the wind tunnel experiments with the round wall-mounted vent cap. (a) Lateral wind (horizontally); (b) Lateral wind (vertically); (c) Frontal wind.
Energies 11 01230 g003
Figure 4. Investigated model kitchens and computational fluid dynamics (CFD) models. (a) Case A scheme; (b) Case A example; (c) CFD model of Case A; (d) Case B scheme; (e) Case B example; (f) CFD model of Case B.
Energies 11 01230 g004
Figure 5. (a) Cross-section A-A’ of case A and case B (also refer to Figure 4a,d) and (b) the illustrative configuration (Case A-1-4: vertical layout ①④).
Energies 11 01230 g005
Figure 6. Grid independence test results.
Energies 11 01230 g006
Figure 7. (a) CFD simulation results for case A and (b) the illustrative result of Case A-2-78.
Energies 11 01230 g007
Figure 8. Airflow trajectories for case A (excerpts). (a) Case A-1-7; (b) Case A-2-47; (c) Case A-2-12; (d) Case A-3-123; (e) Case A-2-78; (f) Case A-3-369.
Energies 11 01230 g008
Figure 9. (a) CFD simulation results for Case B and (b) the illustrative result of Case B-2-78.
Energies 11 01230 g009
Figure 10. Recommended installation locations for vent caps (blue rectangles areas at Figure 10a). (a) Case A kitchen; (b) Case B kitchen.
Energies 11 01230 g010
Table 1. Geometric data used in the model kitchen.
Parts of the ModelGeometric Data
Model kitchen4 m (X) × 2 m (Y) × 2.4 m (Z)
Net ceiling height2.4 m (Z)
Interior doors (normally open)0.8 m × 2 m (Z)
Exterior doors (normally closed)0.8 m × 2 m (H)
Service station3.25 m × 0.6 m × 0.8 m
Upper storage cabinet3.25 m × 0.5 m × 0.7 m
Refrigerator0.75 m × 0.75 m × 1.9 m
Gas stove0.25 m (X) × 0.25 m (Y)
The circular opening on the exterior wall for installing the vent cupDiameter = 15 cm
Table 2. Parameters specified in the numerical calculations. PPMV: parts per million by volume.
Walls, Doors, Service Station, Upper Storage Cabinet, RefrigeratorAdiabatic
Gas stoveGas flow rate = 6.56 × 10⁻² m3/s
Heat release rate = 7.2 × 10⁵ W/m2
Carbon monoxide emission rate = 1.1 g/m2s
Vent capInduced airflow velocity = 1 m/s
Ambient air temperature25 °C
Ambient CO concentration1 PPMV

