Article

On the Mobile Communication Requirements for the Demand-Side Management of Electric Vehicles

Department of Information Engineering, University of Brescia, Via Branze 38, 25123 Brescia, Italy
*
Author to whom correspondence should be addressed.
Energies 2018, 11(5), 1220; https://doi.org/10.3390/en11051220
Submission received: 23 April 2018 / Revised: 4 May 2018 / Accepted: 7 May 2018 / Published: 10 May 2018

Abstract

:
The rising concerns about global warming and environmental pollution are increasingly pushing towards the replacement of road vehicles powered by Internal Combustion Engines (ICEs). Electric Vehicles (EVs) are generally considered the best candidates for this transition, however, existing power grids and EV management systems are not yet ready for a large penetration of EVs, and the current opinion of the scientific community is that further research must be done in this field. The so-called Vehicle-to-Grid (V2G) concept plays a relevant role in this scenario by providing the communication capabilities required by advanced control and Demand-Side Management (DSM) strategies. Following this research trend, in this paper the communication requirements for the DSM of EVs in urban environments are discussed, by focusing on the mobile communication among EVs and smart grids. A specific system architecture for the DSM of EVs moving inside urban areas is proposed and discussed in terms of the required data throughput. In addition, the use of a Low-Power Wide-Area Network (LPWAN) solution—the Long-Range Wide Area Network (LoRaWAN) technology—is proposed as a possible alternative to cellular-like solutions, by testing an experimental communication infrastructure in a real environment. The results show that the proposed LPWAN technology is capable to handle an adequate amount of information for the considered application, and that one LoRa base station is able to serve up to 438 EVs per cell, and 1408 EV charging points.

1. Introduction

The increasing concerns about fossil fuels depletion, global warming, and environmental pollution are strongly affecting modern transportation systems, which are progressively called for a radical shift from traditional Internal Combustion Engines (ICEs) towards greener solutions (i.e., sustainable, decarbonized, and safe). Whilst the estimates of world fossil fuel reserves seem to be able to ensure non-renewable resources for at least another dozens or even hundreds of years [1], it is apparent that their availability is limited and, therefore, inevitably destined to eventual exhaustion. On the other hand, the contribution of transportation systems to global warming is indisputable, and, especially in urban areas, not negligible. The latest assessment report of the Intergovernmental Panel on Climate Change [2] revealed that the total direct Greenhouse Gas (GHG) emissions of the transport sector represent the 14% of the global anthropogenic GHG emissions, and that road vehicles are responsible for the 72% of this share. Moreover, the emission trend of the transport sector has more than doubled in the last 40 years, rising from 2.8 GtCO2eq of 1970 to 7 GtCO2eq in 2010. It is worth noting that the main contribution of this increase is due to road vehicles, whose GHG emissions rose in the same period by almost 200% [2]. A further issue of concern is the contribution of road vehicles to the air pollution in urban centers. Recent studies demonstrated that conventional ICEs are responsible for the emission of the 73% of total urban air pollutants, and also revealed that the growth in chronic health problems in urban areas can be directly related to transportation systems [3]. As a consequence, several restrictions on ICE vehicles have been proposed in European cities, such as the progressive diesel ban in Paris (entered into force since 2015), and the Ultra-Low Emission Zone (ULEZ) that will come into force in London starting from April 2019 [4].
Electric Vehicles (EVs), in particular Battery EVs (BEVs), are generally considered the best candidates for the replacement of conventional ICE vehicles, thanks to their independence from the primary energy source, and to the total absence of direct GHG and pollutant emissions. Recent studies demonstrated that BEVs are the less carbon-intensive option if compared to other solutions, such as Plug-in Hybrid EVs (PHEVs) and Hybrid EVs (HEVs) [5], and that the large penetration of EVs could help to significantly reduce indirect GHG emissions and air pollution in urban areas [6,7].
Whilst high investment costs and low energy density of batteries are still considered as a relevant limitation to the large penetration of EVs in urban landscapes [8], continuous technology improvements and mass production prospects are leading to rapid cost declines and increases in energy density [9]. Recent studies estimated that a large part—up to 70%—of the transport energy demand in the European Union could be directly electrified by the existing technology [10], and current scenarios on electric cars deployment indicate that the worldwide diffusion of EVs will range between 40 million and 70 million by 2025 [9]. Nevertheless, several obstacles are still present, mainly concerning the spatial and temporal stochasticity of the power demand of EVs. The current opinion in the scientific literature is that existing power networks and EV management systems are not yet ready for a large penetration of EVs [8,11,12,13]. Several research streams have recently addressed this concern, by proposing advanced optimization strategies for the integration of EVs in smart grids [14,15,16,17,18], and observing that the adoption of proper Demand-Side Management (DSM) schemes will be crucial for the successful integration of EVs in future urban energy systems [19].
In this context, Information and Communication Technology (ICT) has a central role, by providing the communication infrastructures and services required for the management and control of heterogeneous distributed resources [20,21]. Different ICT solutions have been proposed in the literature for the communication among EVs and the power grid [12,16,22,23], by forming the so-called Vehicle-to-Grid (V2G) concept. However, it must be noted that most of these studies have focused on the communication among EVs and electric utilities, when the former are connected to EV charging stations.
On the other hand, despite the development of Vehicle-to-Everything (V2X) solutions is gaining momentum as a 5G-based umbrella for covering all the needs of vehicular communications [24], it seems that the proposed technologies are somehow excessive for most of V2G applications, which can be implemented using already available standard solutions. However, according to the best of the authors’ knowledge, there are no studies that offer a comprehensive investigation of V2G application requirements when EVs are moving (especially inside urban areas) that could help in discussing pros and cons of different communication solutions in order to select possible candidates. Indeed, V2G solutions are generally short range and intended for connecting the vehicle when it reaches or it is in proximity of a charging station [25]. On the contrary, mobility is addressed by Vehicle-to-Infrastructure (V2I) communications, which takes care of information and safety–related services or group motion control, but does not consider DSM activities [24].
For this reason, we argue that further research should be done in this direction, by exploiting the potential benefits offered by mobile communication solutions for the management of EVs in smart grids. The authors try to fill this gap in this paper, paying great attention to intraday V2G DSM schemes involving mobile communication among EVs and service providers.
The main original contributions of the paper include:
  • the proposal of a specific system architecture, including a proper data exchange procedure for the DSM of EVs moving inside urban areas;
  • the analysis of such an architecture in terms of communication requirements (e.g., the latency and data throughput);
  • the evaluation of the feasibility of such an architecture for a real use case of EV management, by means of the experimental evaluation of a real-world test bed.
Starting from the lesson learnt in [26], the use of a low-cost communication infrastructure—the Low-Power Wide-Area Network (LPWAN)—for the mobile communication among EVs and service providers is suggested as a possible alternative to cellular-like solutions. In particular, an example of a LPWAN communication infrastructure based on the Long-Range Wide Area Network (LoRaWAN) technology is proposed and tested in a real environment, by evaluating its feasibility for intraday DSM applications.
The structure of the paper is organized as follows: in Section 2 the theoretical background of the study is outlined, by describing the interaction among EVs and power grids, and introducing the “smart charging” concept. Based on the definition of the main objectives and of the operational time scales of smart charging strategies, in Section 3 the DSM schemes proposed by the literature in V2G applications are described, and the related communication requirements are discussed. In Section 4, a specific system architecture, including the related data exchange procedure for the DSM of EVs moving inside urban areas is proposed, and the related communication requirements are discussed. In Section 5, the architecture of a LPWAN communication infrastructure based on the LoRaWAN technology is defined, while in Section 6 the experimental set-up for the validation of the proposed LPWAN solution is described, and the experimental results are then presented. Finally, in Section 7 the main contributions and results of the study are summarized, and the final remarks are discussed.

2. Interaction among Electric Vehicles (EVs) and Power Grids

2.1. Electric Vehicle (EV) Batteries Power Supply Systems

Electric vehicles need an electric power source for the charging of on-board batteries. The power supply of EV charging systems is usually provided by power grids through the so-called EV Supply Equipment (EVSE). Different types of EVSE exist, depending on the power distribution standard implemented by each country, and on the type of use (e.g., for domestic or public charging). The Electric Power Research Institute (EPRI, Palo Alto, CA, USA) and the Society of Automotive Engineers (SAE, Warrendale, PA, USA) categorize EVSE in four different levels, which are in turn divided into two categories: Alternating Current (AC) charging systems (comprising AC Level 1 and AC Level 2), and Direct Current (DC) charging systems (including DC Level 1 and DC Level 2) [8]. In AC charging systems, EVs must be equipped with an on-board AC/DC power converter, and the maximum AC power supplied to EVSE ranges within 1.92 kW and 25.6 kW (in case of AC Level 1 and AC Level 2 charging systems, respectively). Conversely, in DC charging systems, the electric power is supplied to EVs directly in DC, therefore on-board AC/DC power converters on EVs are not required. The maximum AC power supplied to DC EVSE ranges within 38.4 kW and 96 kW (in case of DC Level 1 and DC Level 2 charging systems, respectively). A summary of the main technical features of EV charging systems defined by the SAE standard is reported in Table 1.
Based on the maximum power supplied to EVSE, charging systems can be further classified as slow and fast charging systems. AC Level 1 and single-phase AC Level 2 are usually considered slow charging systems, while three-phase AC Level 1 and DC Level systems (also formerly known as Level 3 charging systems) are commonly referred to as fast charging systems. A schematic representation of the type of charging systems, and of their typical use and interaction within electric distribution networks is depicted in Figure 1.
AC Level 1 systems are conceived for home or office use, where a limited number of homogeneous users (e.g., family members or office workers) charge their EVs during long rest periods (i.e., during nights, when at home, or during the day when at office). In this case, fast charging speeds are usually not required, and the impact on the power grid (in terms of power demand) is limited.
AC Level 2 systems are typically considered as the primary method for private and public applications, such as shopping mall areas, governmental facilities, restaurants, and airports. These systems allow both slow charging and fast charging modes (up to 7.7 kW in single-phase AC, and up to 25.6 kW in three-phase AC, respectively) and are intended to serve heterogeneous groups of users. Particularly in the case of fast charging stations (i.e., three-phase AC Level 2), their impact on the operation and management of distribution grids may be relevant.
DC Level 1 and DC Level 2 systems are dedicated to large commercial and public applications, such as highway rest areas and city charging points. Their use is intended to provide heterogeneous groups of consumers an experience similar to a conventional filling station, by allowing short charging times with high power supply capabilities (up to 96 kW). As a consequence, in case of large scale applications, their impact on distribution grids is expected to be critical.
Considering the scenario described above, it is apparent that public outlets and commercial stations will be probably the most critical application in terms of the expected impact on power grids, due to the large number of heterogeneous users (and thus the high stochasticity of power demand profiles) and to the high level of power supply. Several studies recently addressed this concern, by concurring that the large and uncontrolled penetration of EVs would cause relevant issues to the management and operation of distribution networks [4,8,11,12,15]. The main expected adverse impacts include: voltage instability, increase of peak demand, power quality issues (e.g., harmonics and voltage variations), increase of power losses, and degradation of grid equipment (e.g., increase of thermal aging effects in transformers, due to overloading) [8]. To overcome these drawbacks, the adoption of proper EV charging management strategies have been proposed, by forming the so-called “smart charging” concept, as discussed in the next subsection.

2.2. The Smart Charging Concept

Three main types of strategies are currently considered when evaluating the electrical interaction among EVs and distribution networks: uncoordinated charging, unidirectional smart charging, and bidirectional smart charging [19]. In the uncoordinated charging mode, when the EV is connected to the EVSE, the charging process starts immediately, and the power supply is provided by the grid at the maximum allowed power (depending on the requests of the EV battery charger), until EV batteries reach their maximum capacity. Conversely, in the unidirectional smart charging mode, a supervisor (who may be the distribution system operator or an independent operator) controls the time of activation of the charging process, as well as the maximum power supply and, thus, the overall duration of the charging process. Similarly to the unidirectional smart charging mode, in the bidirectional smart charging mode the process is controlled by a supervisor, who is also allowed to decide whenever the EV batteries must be charged (i.e., by taking energy from the grid) or discharged (i.e., by feeding energy to the grid).
The objective of unidirectional smart charging and bidirectional smart charging is to determine and implement the temporal and spatial operational schedules (viz., the specific power profile of each EVSE in the supervised network, over a given time horizon) for, respectively, the power supply of EVs, and the management of power flows among EVs and the power grid. Whilst the objectives and optimization techniques of unidirectional smart charging and bidirectional smart charging are quite different, it is worth noting that the technical requirements for the exchange of information among the actors involved in these processes are almost the same. For this reason, in this study we will refer to smart charging for both unidirectional and bidirectional modes.
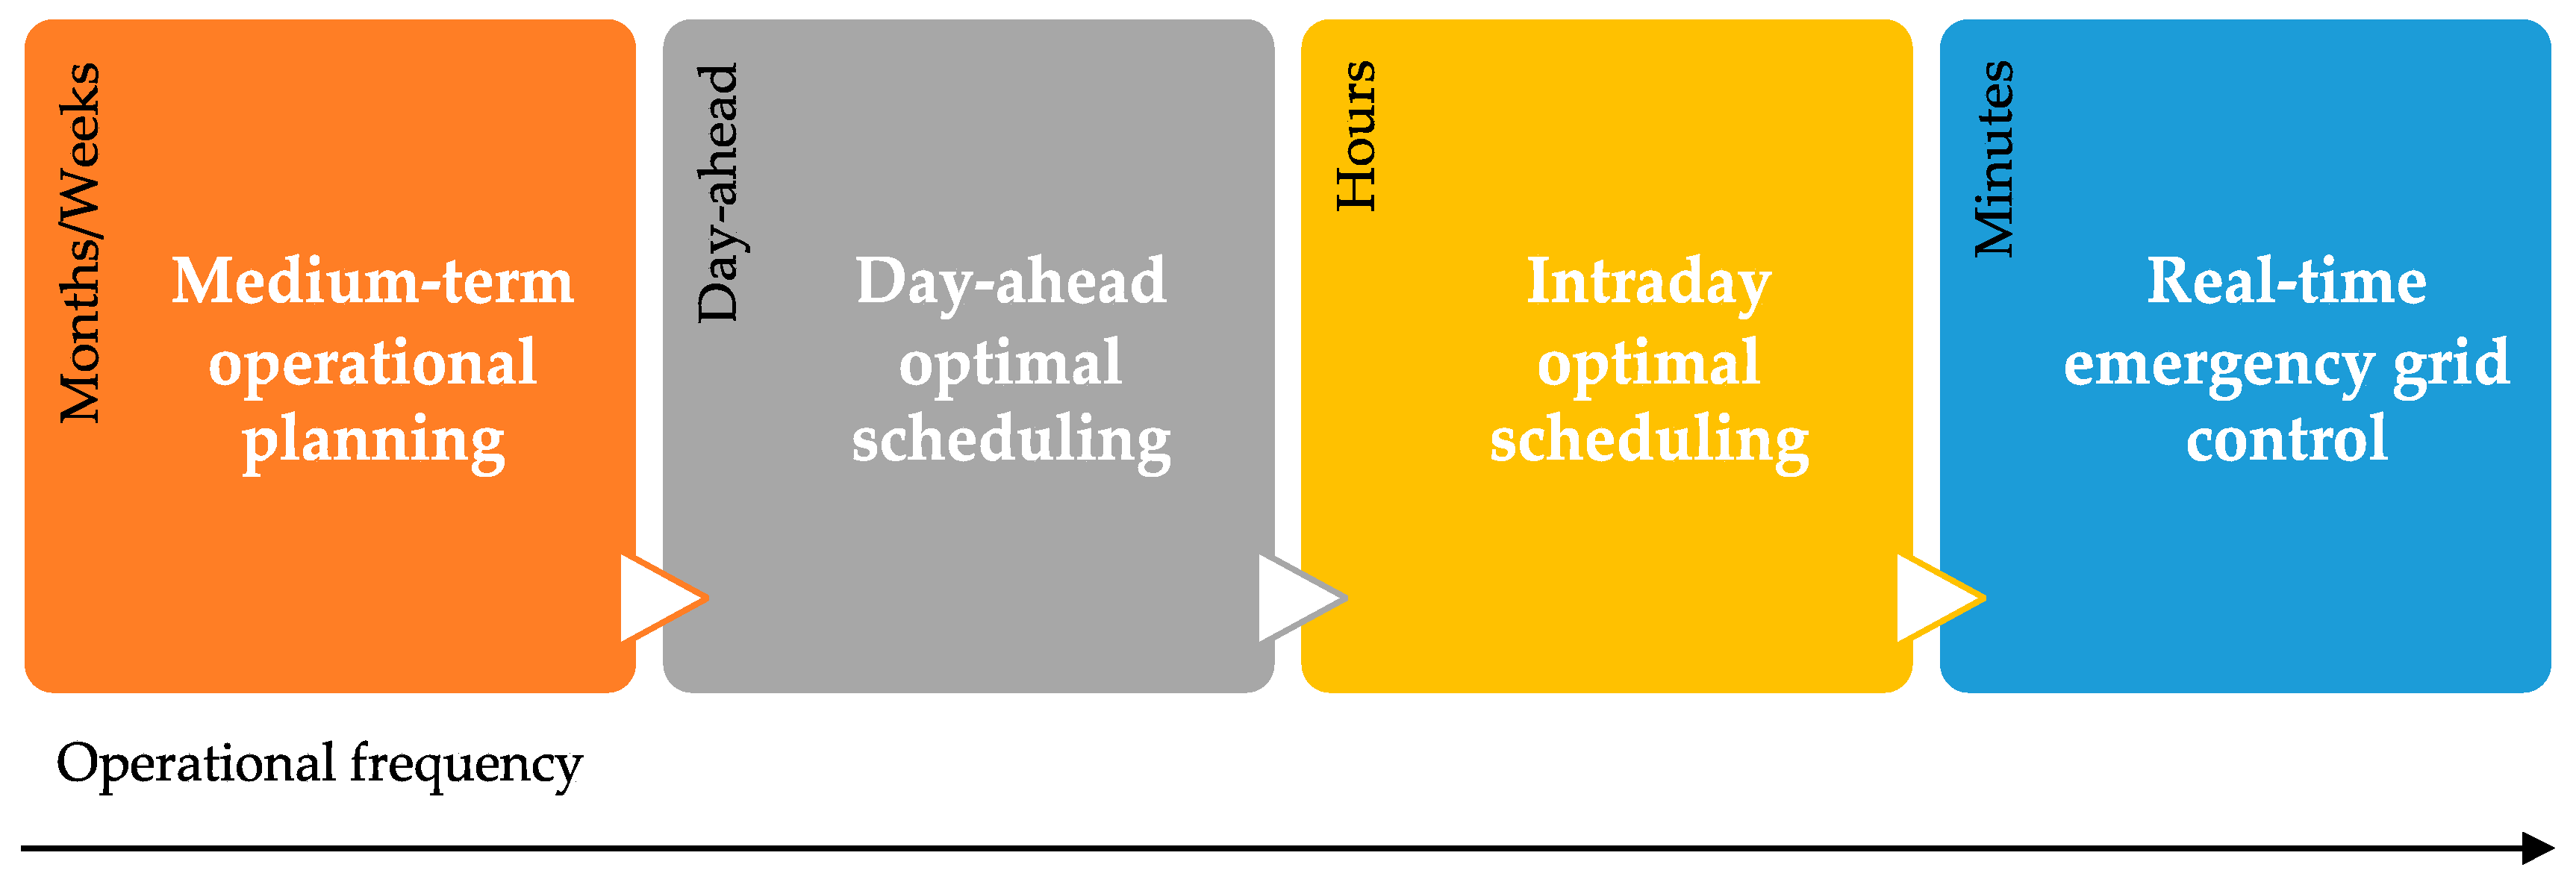
As depicted in Figure 2, the objectives and strategies of smart charging techniques can be classified on the basis of the time horizon of the decisional process. Four main groups can be identified, namely: medium-term operational planning, day-ahead optimal scheduling, intraday optimal scheduling, and emergency real-time grid control. In Figure 2, the aforementioned groups are represented, from left to right, according to the increasing operational frequency.
In medium-term operational planning, operational plans are determined over medium-term time horizons (e.g., weeks or even months) depending on the forecasted availability or programmable schedules of distributed and centralized power generators, and on the expected power demand profiles of EVs. With respect to the latter, stochastic methods [27] and sensitivity analyses over predefined scenarios [28] are usually applied to cope with the spatial and temporal uncertainty of the power demand of EVs. Statistical information on the mobility patterns and charging behaviors of EVs is usually derived from census data, based on either conventional ICE vehicles or EVs [29,30]. In day-ahead optimal scheduling, optimal schedules of the power flows among EVs and the power grid are determined over a short-term time horizon, of usually 24 h. The expected power demand profiles of EVs are usually computed by applying statistical methods, which take into account probability distributions of the time of arrival and departure of EVs, and the related State Of Charge (SOC) of on-board batteries [31,32,33]. The aim of intraday optimal scheduling is to determine optimal operation plans over short-time periods, of usually few hours. In this case, both stochastic and model predictive control techniques can be applied to forecast the power demand profiles of EVs, based on the information gathered when EVs are connected to EVSE [32,34,35]. Finally, the emergency real-time grid control is applied if emergency signals are provided by the Distribution System Operator (DSO). In this case, the supervisor of the system is allowed to take the full control of the EVSE, by implementing ancillary services, such as the real-time control of active and reactive power [36,37].

2.3. Discussion

The interaction among EVs and power grids have been extensively discussed in the scientific literature. However, according to the presented literature review, all the examined studies mainly discussed the integration of EVs in urban energy systems and smart grid environments by solely focusing on the management of EVs when the latter are connected to charging infrastructures. In most cases, in fact, the optimization techniques proposed by the literature are based on data available when EVs are connected to EVSE, and statistical approaches (including the use of historical data, simulated scenarios, and statistical models) are exploited to compute the expected power demand profiles and the time of arrival of EVs over the considered time horizons [15,35,38,39].
If this approach can be considered reasonable for applications where the operational time scale ranges from several hours, as for day-ahead scheduling, to months, or even years, as for medium-term operational scheduling or system planning, its application for the intra-day optimal management of EV charging requirements is at least doubtful. It is apparent that, in this case, the continuous monitoring of EVs moving inside urban areas would help system operators to implement more reliable operational decisions, thanks to the improved estimation of the location and state of charge of EVs. The information dynamic update in fact helps to better estimate the power profile requests and the time of arrival of EVs at specific charging stations. On the other hand, the so-called “range anxiety” and the risk of queueing at EVSE are emerging as one of the main concerns of EV customers and fleet operators [4], who are calling for improved systems able to provide reliable information about available sockets, before their arrival to charging stations.
For this reason, in this study we examined the potential benefits offered by mobile communication solutions for the management of EVs in smart grids, by focusing on intraday V2G DSM schemes involving mobile communication among EVs and service providers, as discussed in the following sections.

3. Demand-Side Management (DSM) Schemes for EV Smart Charging

3.1. Demand-Side Management (DSM) Schemes in Vehicle-to-Grid (V2G) Applications

The concept of demand-side management embraces all the activities which are designed to influence or directly modify the power profiles of electricity customers, in order to ensure a more reliable and efficient operation of electrical grids. The application of DSM models has been proposed since the early 1980s by energy utilities to influence the load profiles of electricity customers [40]. The DSM concept has evolved rapidly during the last decade, mainly due to the improved communication and control capabilities offered by modern ICT solutions. In particular, the load management concept evolved into the so-called Demand Response (DR) [41,42].
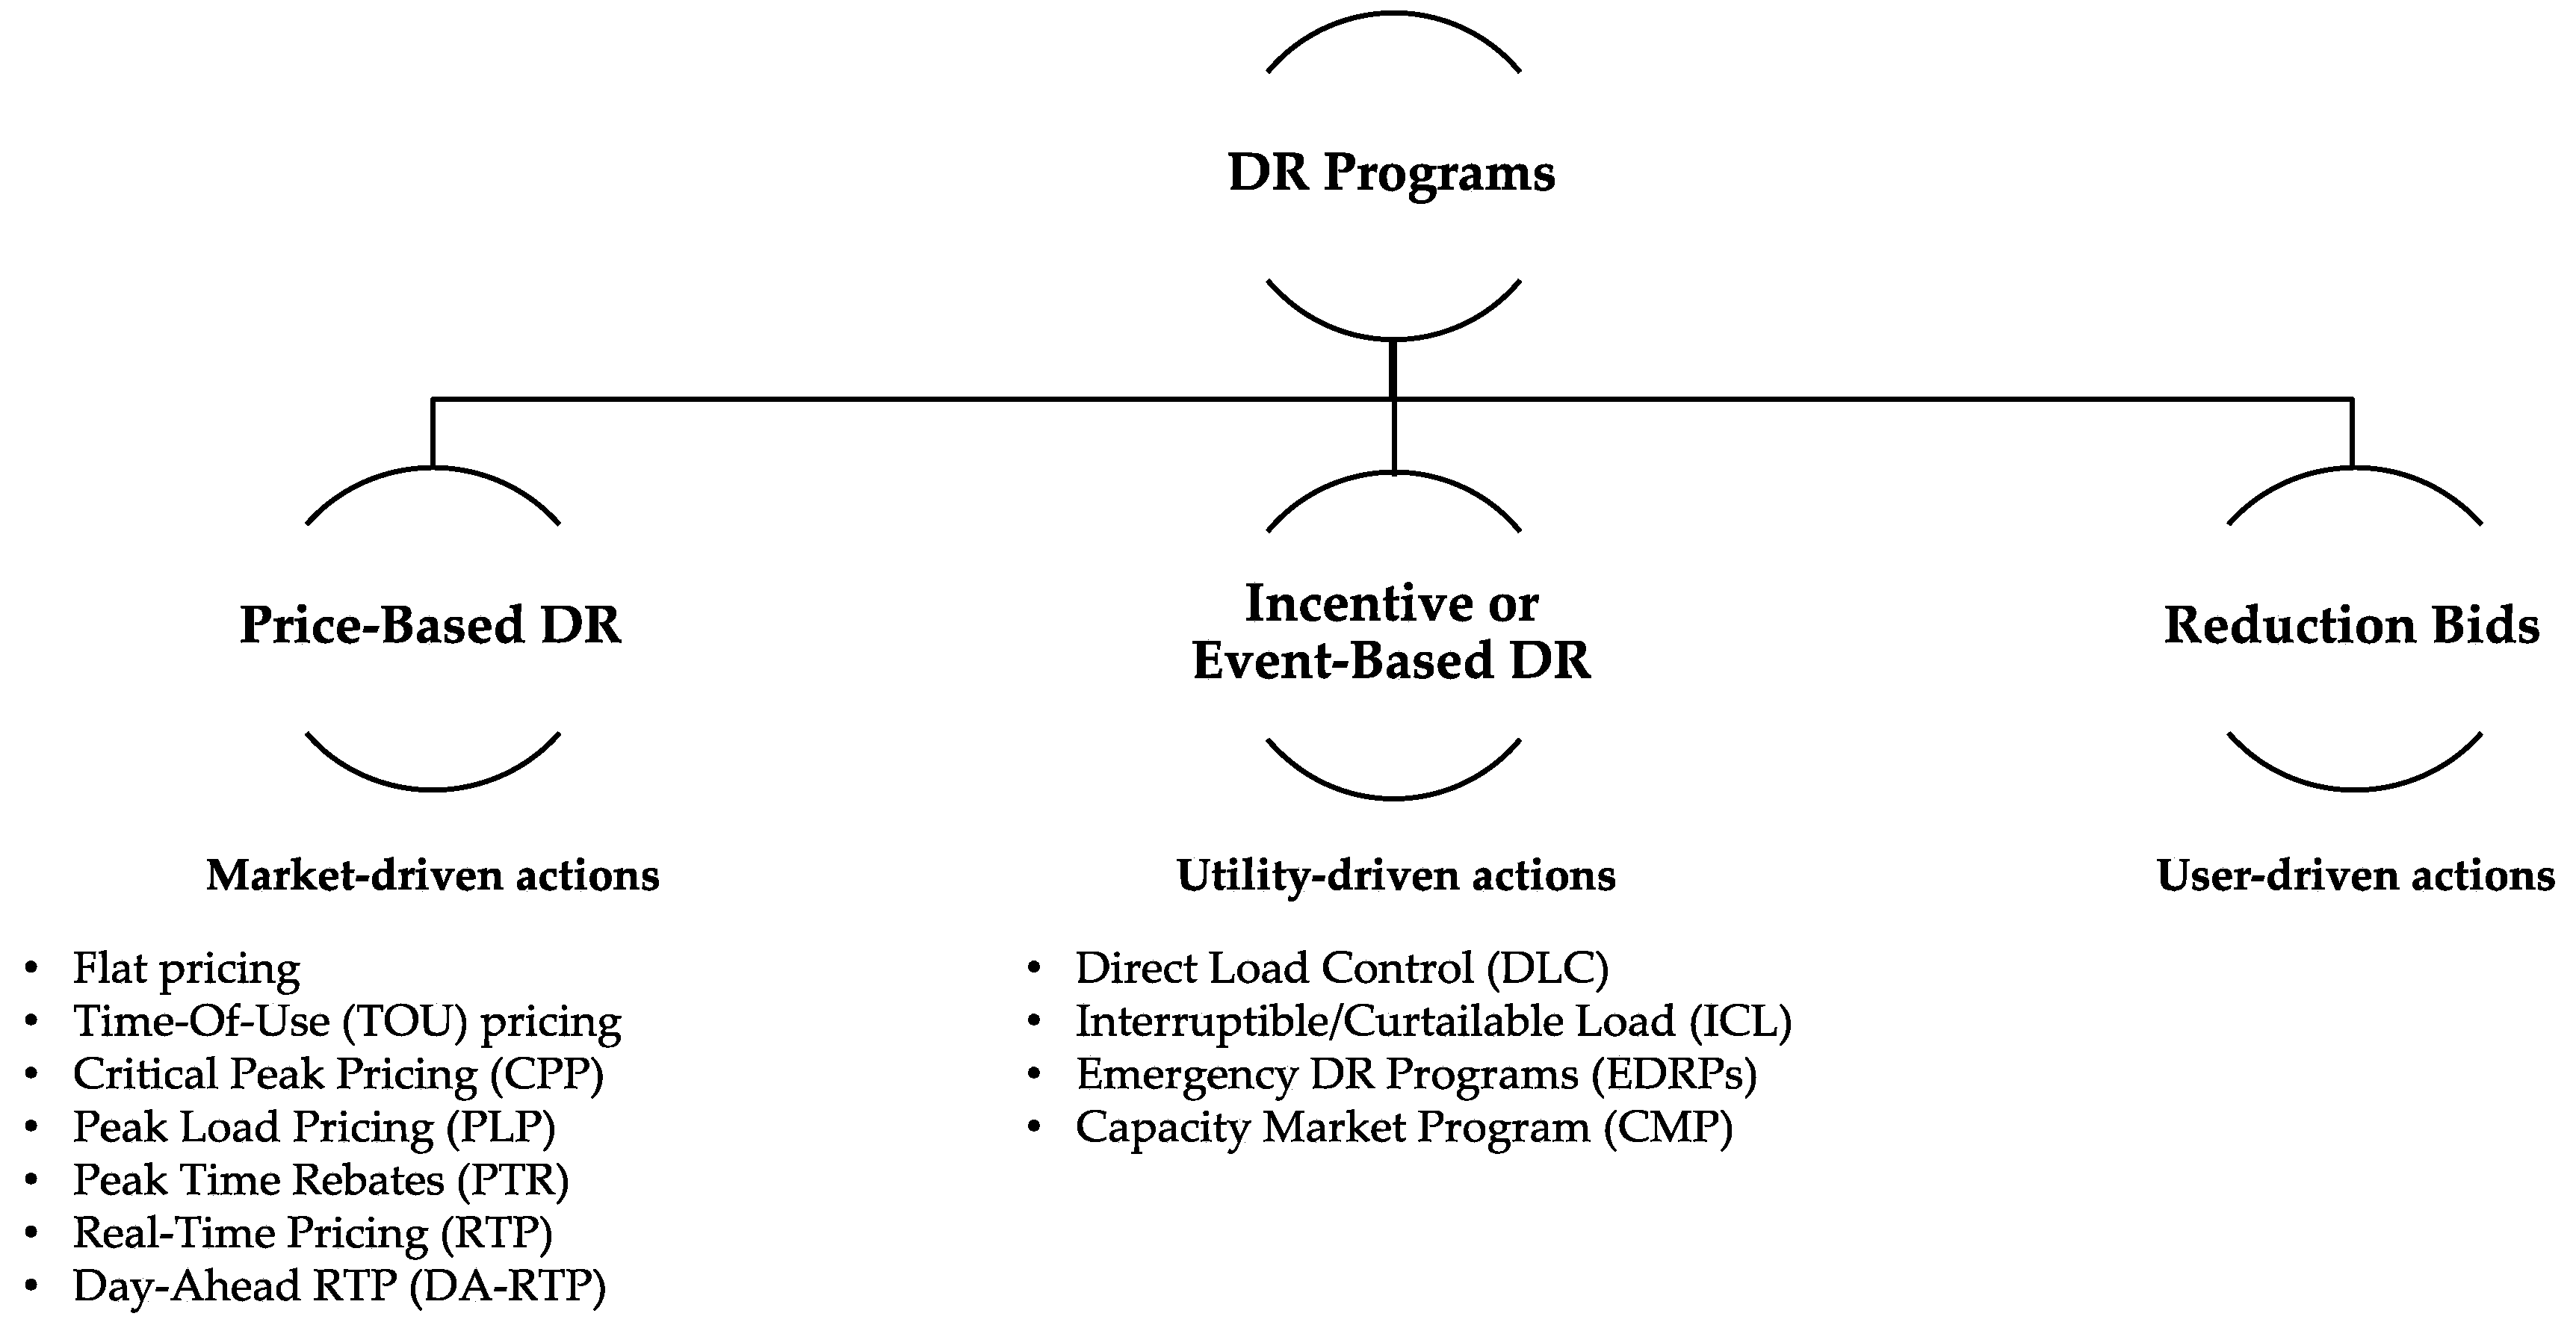
An interesting metric for the classification of current DR schemes, based on the entity that initiates the DR request, is provided in [43]. As depicted in Figure 3, DR schemes can be categorized as: price-based DRs, incentive or event-based DRs, and reduction bids. In price-based DRs the market initiates the DR event by offering customers static or dynamic pricing schemes to influence the load profiles of end-users. In incentive or event-based DRs, the utility sends specific DR requests (typically active power limitations), and customers are offered fixed or time-varying payments in case of acceptance and execution of the given request. In reduction bids, customers initiate the DR request and send demand reduction bids to the utility, by offering an available demand reduction capacity and the requested price.
The application of both price-based and incentive-based DR schemes has been recently proposed also for V2G applications [16,19,22,36,45]. In this case, differently from the classical DR schemes used for the management of distributed energy resources in smart grids, a new business entity, usually referred to as EV aggregator, has been proposed as service provider among EV users and system operators. In this perspective, the EV aggregator—who may be independent or integrated in existing business function of system operators—is responsible for the integration and coordination of all the required information and operational activities involved in the application of V2G DSM schemes.
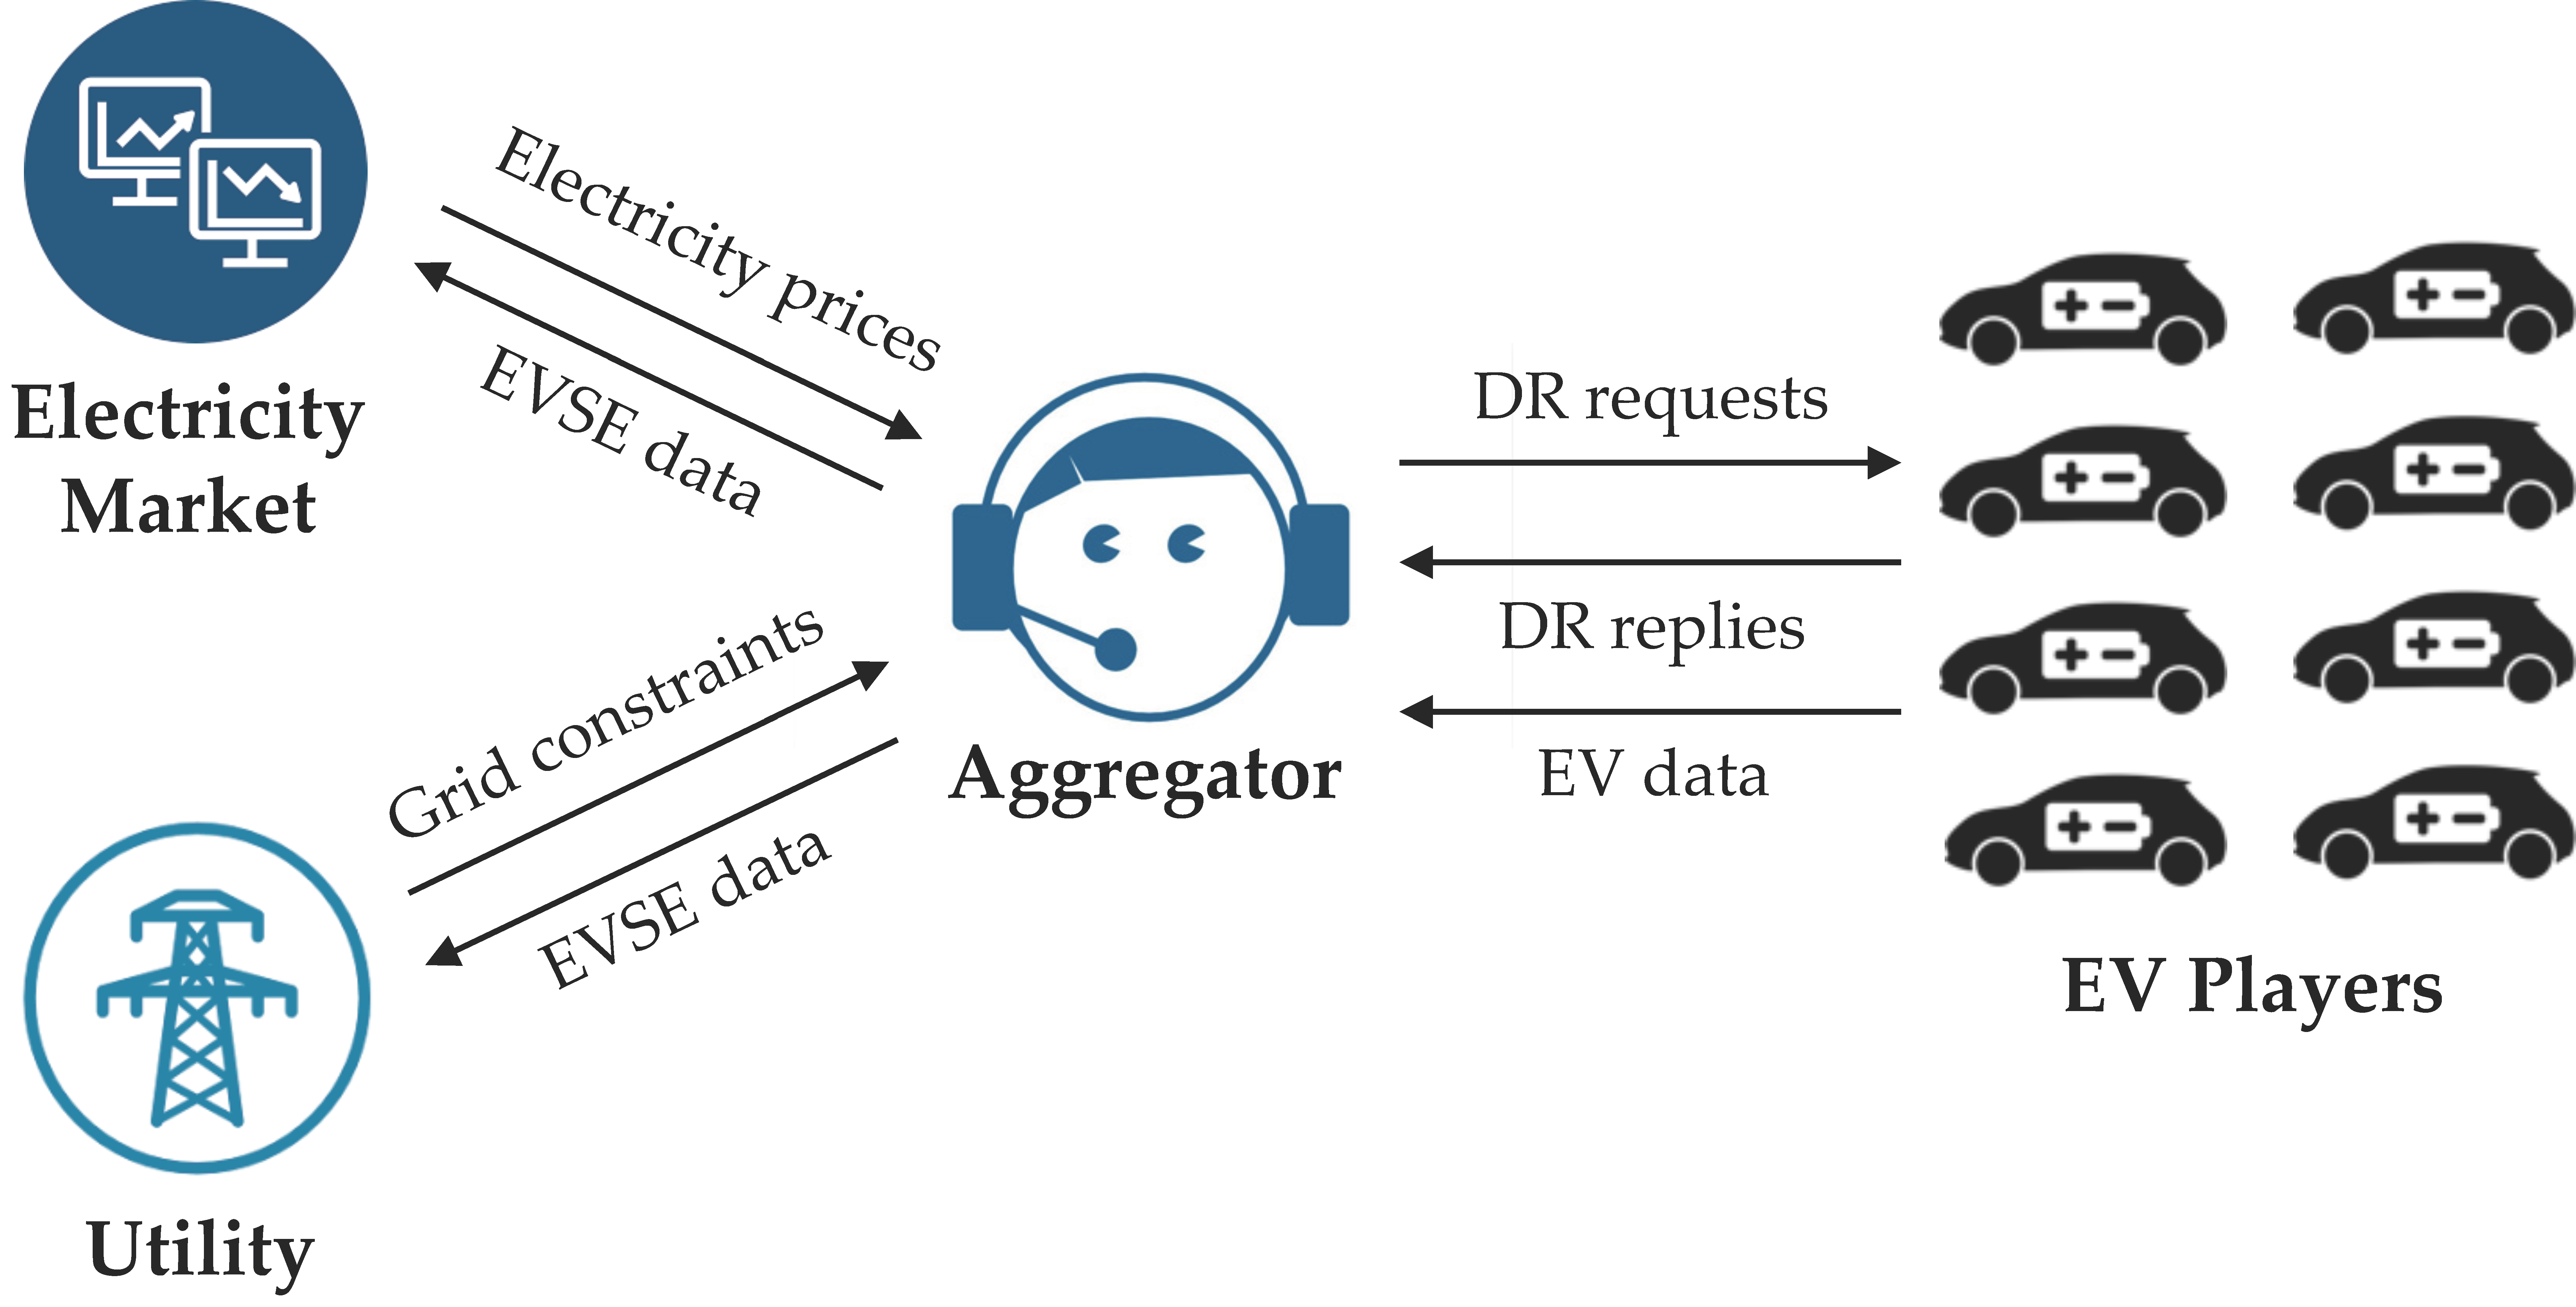
In the application of V2G DSM schemes, two main control strategies are currently considered, namely the price-based control and the transactive control [19]. Similarly to price-based DR actions, in price-based control strategies the aggregator collects information from the electricity market and sends price signals (which may be referred to short-term or long-term time plans) to EV owners or EV fleet operators. In this case, EV players are expected to respond to the DR signals by independently modifying their power demand profiles on the base of the proposed electricity prices, without providing any kind of information to the EV aggregator about the acceptance or denial of the proposed DR. Conversely, in transactive control strategies, the operational planning is achieved through coordinated decisions among the aggregator and EV players. Similarly to incentive-base DR actions, the aggregator collects information from the electricity market and from the DSO, and sends DR requests to EV players. The latter are then required to explicitly respond to the aggregator by providing information about the acceptance or denial of the proposed DR, possibly including additional data, such as the desired time of departure or the expected energy consumption (i.e., the desired value of SOC at the end of the charging process).
The schematic representation of price-based and transactive control schemes in V2G DSM are depicted in Figure 4 and Figure 5, respectively.

3.2. Communication Requirements

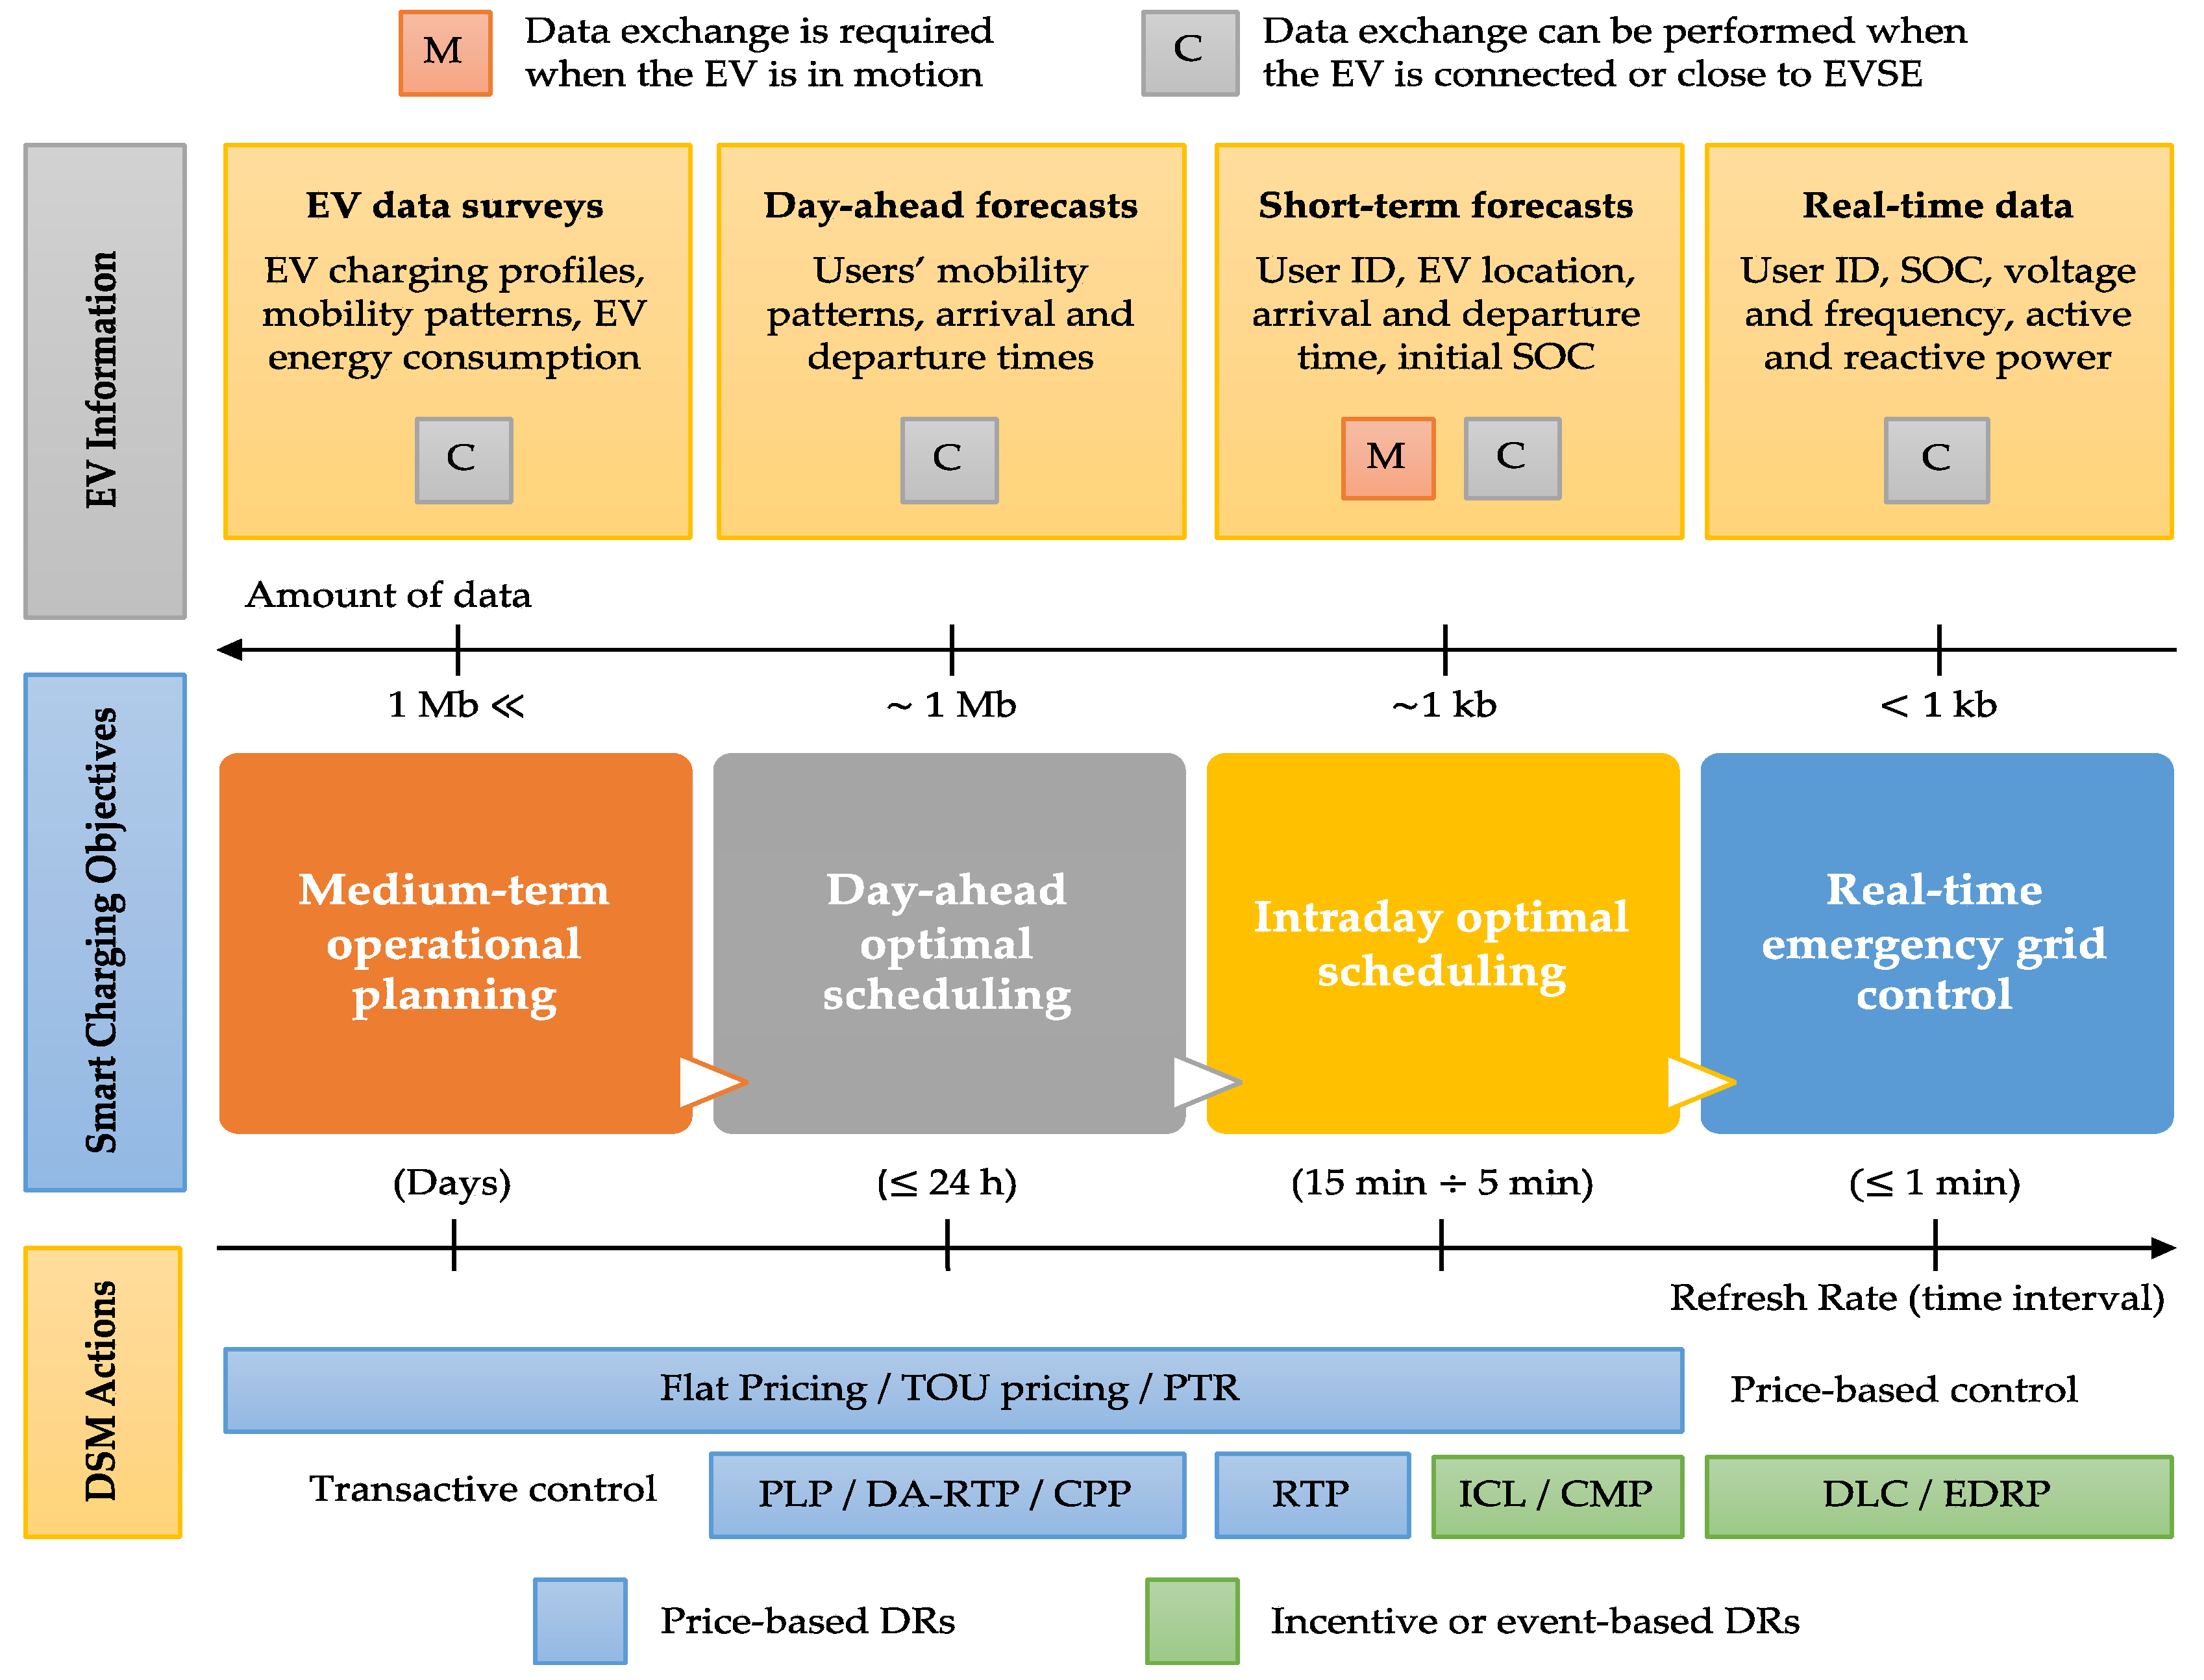
For the sake of the comparison of the communication capabilities required by the different V2G DSM schemes applied in smart charging strategies, in Figure 6 the key elements discussed in the previous sections (viz., smart charging objectives and DSM strategies) have been summarized and related to the EV and EVSE information required by each specific application.
In detail, in medium-term, day-ahead, and intraday applications, the amount of data is reported as the sum of the information exchanged between aggregators and EVSE, and of the information exchanged between EVs and aggregators, per each charging station (which may comprise several EVSE), and per each monitored EV, respectively. In real-time applications, the amount of data is referred to the information exchanged between aggregators and EVSE, per each monitored EVSE.
In medium-term operational planning, time-based control strategies are usually implemented to influence the power demand profiles of EV customers. Typical price programs include flat pricing, Time-Of-Use (TOU) pricing, and Peak Time Rebates (PTR). In most cases, users are required to participate to specific DSM schemes by means of subscriptions with time durations from one to several weeks. Price signals, usually in the form of daily price profiles, with time steps not less than 1 h, are communicated by the aggregator to EV customers well in advance. In this case, the required transmission capability is limited to unidirectional communication (i.e., from the aggregator to EV customers), and the amount of exchanged data is on the order of few kb per each charging station (which may comprise more than one EVSE). On the other hand, the refresh time interval (i.e., the time interval among two consecutive signals) is on the order of days, considering that DR pricing schemes are usually updated no more than once a week. From the EV side, several types of EV data are required by the aggregator to forecast the power demand profiles of EVs. Extensive EV data surveys on users’ driving habits, such as daily paths and energy consumption, are usually carried out by means of on-board EV data loggers. Similarly, EVSE information is used to record typical power demand profiles of EVs, when the latter are connected to EVSE. In both the cases, the amount of data (especially for long periods surveys) may be relevant, on terms of several Mb per each EV and per each EVSE, while the refresh rate is typically very low (i.e., new data can be transferred only once a week). For both time-based DSM strategies and EV data surveys, the exchange of data between aggregators and EVs can be performed when the EV is connected or close to EVSE (e.g., by means of local wireless networks), and mobile communication capabilities are not usually required.
In day-ahead optimal scheduling, both price-based control and transactive control strategies can be applied. Transactive control schemes are usually implemented through market-driven DR actions, such as Peak Load Pricing (PLP), Day-Ahead Real Time Pricing (DA-RTP), and Critical Peak Pricing (CPP). In this case, price signals are sent to EV users at least 24 h before the application of the DSM program. As for medium-term operational planning, price signals are sent as daily price profiles with time steps not less than 1 h. However, differently from price-based control strategies, in transactive control schemes EV users are required to respond to DR requests by providing information about the acceptance or denial of the specific DR program, thus calling for bidirectional communication capabilities. The amount of exchanged data is on the order of few kb per each charging station, while the refresh time interval is less than 24 h. From the EV side, additional information may be required, such as mobility patterns planned by customers, arrival and departure times, or charging reservation requests. In this case, the communication among aggregators and EV users is usually achieved by means of cloud-based applications, and specific communication capabilities when EVs are in motion are not usually required. The amount of exchanged data is expected to be on the order of hundreds of kb per each EV user, and the related refresh time interval is less than 24 h.
In intraday optimal scheduling, both price-based control and transactive control strategies can be applied. In particular, transactive control schemes may include both Real-Time Pricing (RTP) schemes and incentive-based DRs, such as Interruptible/Curtailable Load (ICL) requests, and Capacity Market Programs (CMPs). In this case, short-term notifications (in the form of price and/or power capacity profiles) are sent to the EV customers, who are required to respond to the DR requests within short time intervals. The amount of exchanged data is on the order of hundreds of bits per each charging station and per each EV, and the refresh time interval is on the order of 15 min (i.e., equal to the typical scheduling interval of distribution grids in normal operating mode [46]). Compared to medium-term operational planning and day-ahead optimal scheduling, where local wireless networks or cloud-based (i.e., network agnostic) applications are usually sufficient for the exchange of data between EVs and aggregators, in intraday optimal scheduling—as already discussed in Section 2.3—the use of mobile communication infrastructures could represent a key enabling factor. In the latter, in fact, the application of short-term DR notifications could require the communication between aggregators and EVs, when the latter are in motion, i.e., not yet connected to local EVSE communication networks. In addition, the monitoring of EVs moving inside urban areas could represent a relevant instrument for the implementation of smart charging strategies. The amount of data required for the monitoring of EV data (i.e., from EV users to aggregators) and for the provisioning of EVSE information to EV users is on the order of hundreds of bits per each vehicle and per each charging station. In both EV and EVSE monitoring systems, the refresh time interval is expected to be on the order of few minutes.
Finally, in real-time emergency grid control, event-based DR actions are usually considered, including Direct Load Control (DLC) and Emergency DR Programs (EDRPs). In this case, when specific control or emergency signals are sent by the DSO, aggregators implement real-time control strategies (including active and reactive power control, as well as frequency and voltage regulations) over EVs connected to EVSE. The amount of data involved in these processes is relatively low, on the order of hundreds of bits per each monitored EVSE (including the connected EV), while the refresh rate is high, with time intervals usually below 1 min [46]. In this kind of applications, the communication among aggregators and EVs is expected only when EVs are connected to EVSE, thus mobile communication capabilities are not required.

4. The Proposed System Architecture for the Intraday DSM of EVs

In this section, a system architecture, and the related data exchange procedure for the communication among aggregators and EV users in intraday V2G DSM applications is proposed, and its implementation is then discussed, by analyzing the related communication requirements. In Section 4.1, the system architecture is presented, by introducing the role of the EV Mobile Service Provider, and describing the relationship between the latter and all the players involved in V2G DSM schemes. In Section 4.2, a specific data exchange procedure for intraday V2G DSM applications is proposed (including EV and EVSE monitoring capabilities, as well as both price-based and transactive DRs), and the required data throughput is computed.

4.1. System Architecture

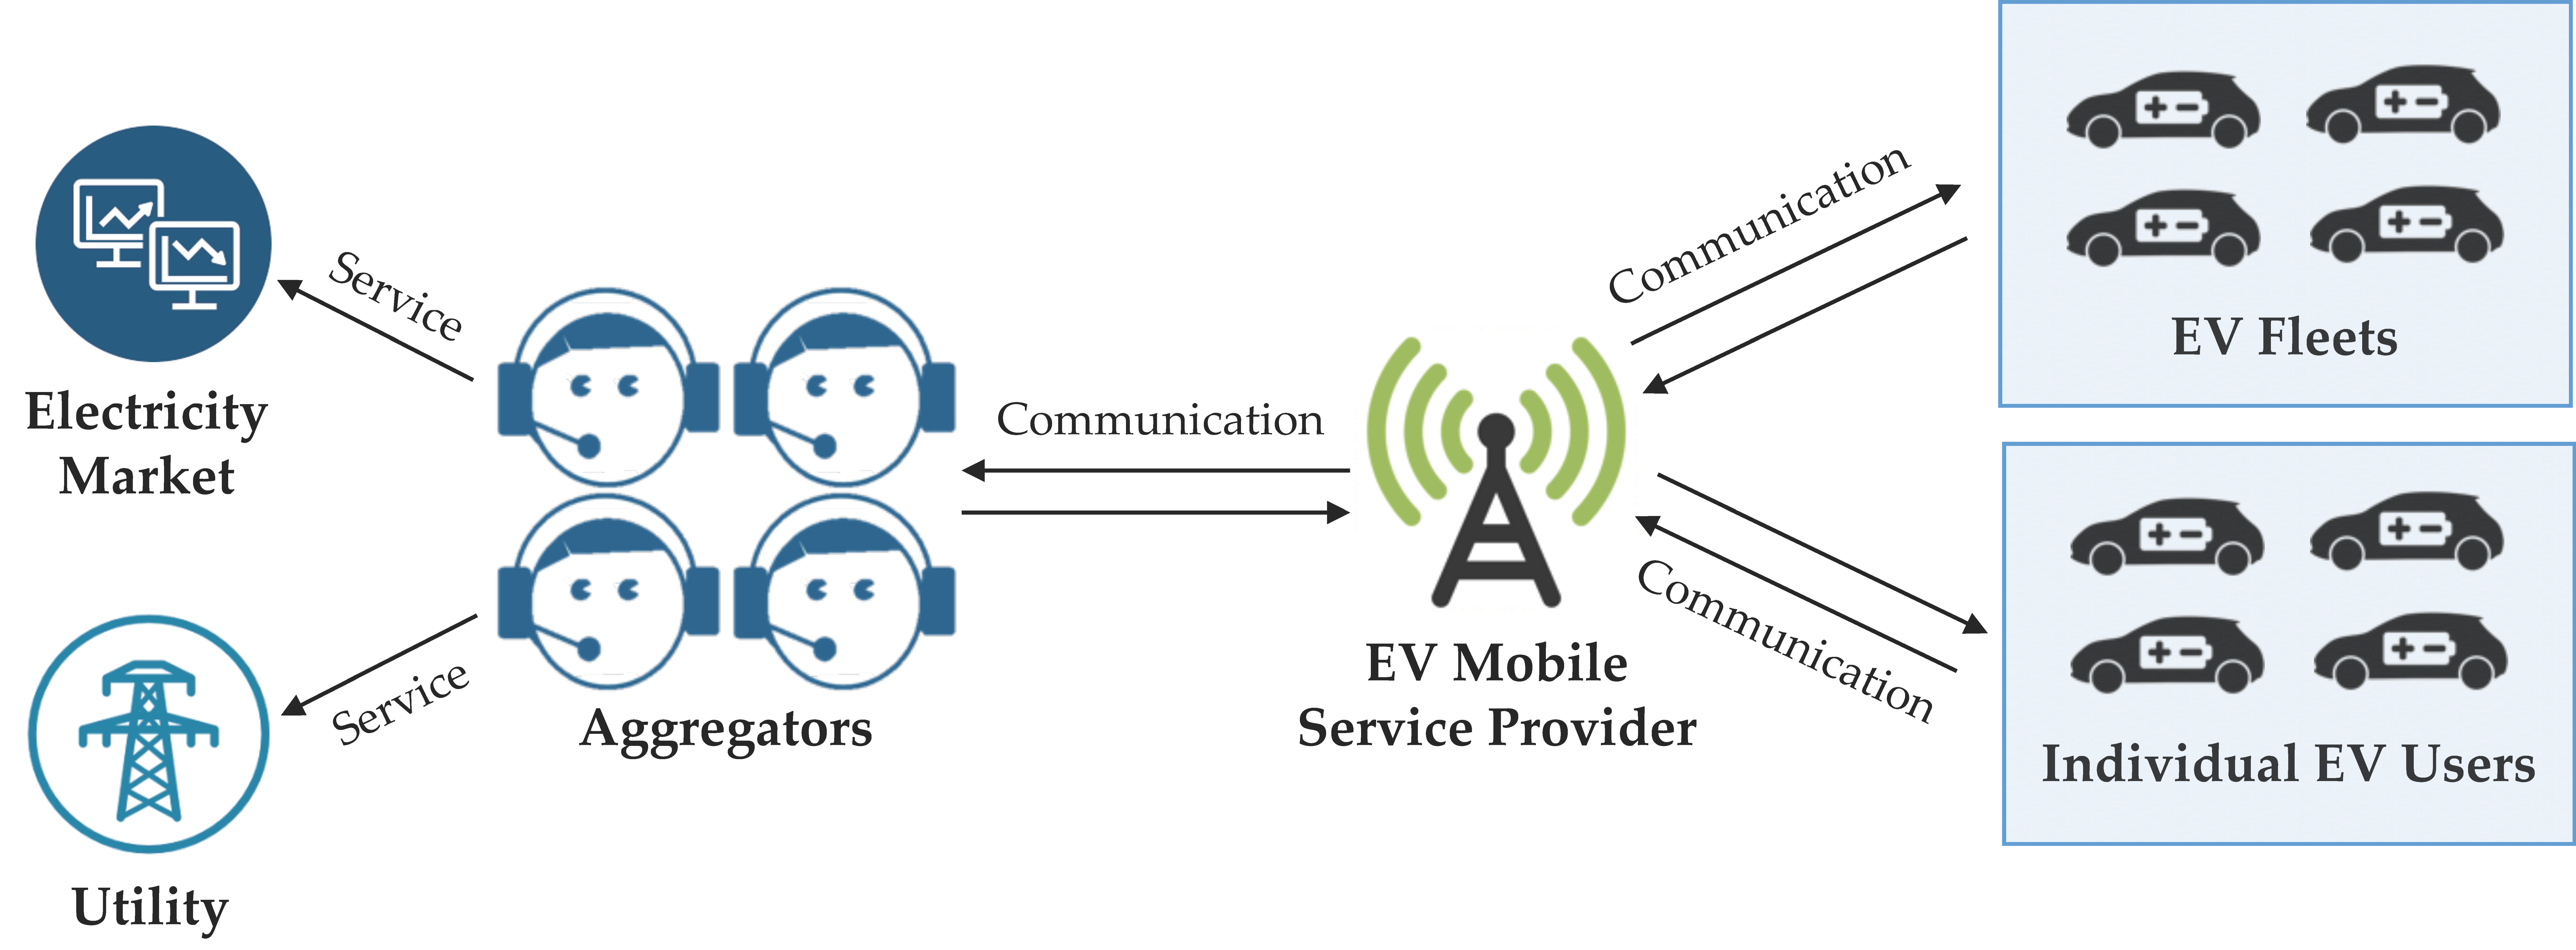
In this study, a new entity, namely the EV Mobile Service Provider (EV-MSP), is proposed, who is in charge for the installation, operation, and management of the V2G mobile communication infrastructure. The EV-MSP is responsible for the bidirectional communication with EVs, and provides communication services to aggregators, such as the monitoring of EV data, the provisioning of EVSE information and DR requests to EV users, and the related DR replies. Aggregators are then in charge for the provisioning of DSM requests and decisions to all the players involved in V2G DSM schemes, including EV users, market aggregators and utilities.
In particular, different schemes may be applied considering the specific location of EVs (e.g., differentiated price signals, that may be used to overcome the risk of rebound effects in power peak demands), or sent to specific users or groups of users, if participating to special DR programs or belonging to specific EV fleets. A schematic representation of the proposed system architecture is provided in Figure 7.

4.2. Data Exchange Procedure

From the point of view of the communication process, three main functions can be identified in intraday V2G DSM applications, namely: the EV monitoring, the provisioning of EVSE information to EV users, and the management of V2G DR requests (including the provisioning of DR requests to EV users, and the management of transactive DSM actions). In the following, a specific data exchange procedure is defined for each function, by defining all the information involved in the communication process, and the required data throughput.

4.2.1. EV Monitoring

The aim of the EV monitoring function is to provide aggregators an improved state of estimation of EVs moving inside urban areas. The set of required information includes, for each monitored EV: the acquisition time of the set of information, the user Identification (ID) code, the EV ID code, the EV model ID code, the current GPS location, and the current SOC of the EV. If a specific destination has been set by the user on the on-board satellite navigation system of the EV, the following additional data may be included: the GPS position of the final destination, and the Estimated Time of Arrival (ETA).
If the EV and the user (i.e., the person who is actually using the vehicle) are subscribed to existing V2G services, the related identification codes can be used to retrieve additional information for the application of DSM strategies. The EV ID can be used, for instance, to retrieve data on the EV model (e.g., the nominal capacity of on-board batteries, the list of supported charging systems, the nominal consumption of the EV, etc.), as well as detailed information on the specific vehicle (such as typical power demand profiles or actual consumption data), which can be retrieved from historical data. The EV ID could be also used to provide additional information on the specific use of the vehicle, e.g., if it is intended for commercial or private use, if it is a private vehicle or it belongs to a specific fleet operator, or if it is subscribed to specific car sharing programs. On the other hand, the user ID code can be used to retrieve information on the user’s driving habits (e.g., typical routes, preferred charging stations, etc.), and on his subscription to specific DSM programs. Moreover, it must be noted that the different driving habits of EV users may be also used to compute the expected energy consumption of the EV, which may be sensibly affected by the typical driving behavior of the user. Conversely, if the EV and the user are not subscribed to existing V2G services (or if they are outside the area of application of the subscribed V2G services), the EV model ID code is used to retrieve the nominal specifications of the EV (e.g., the nominal capacity of on-board batteries, the list of supported charging systems, etc.), as well as typical power demand profiles or actual consumption data, which can be retrieved from the information provided by similar EV models participating in existing V2G programs. The current GPS location of the EV could be provided by on-board navigation systems, or by a dedicated GPS device which may be installed as part of the EV mobile V2G communication system. In this case, a resolution of about 10 m is assumed to be sufficient for the specific application. The current SOC of the EV can be provided by on-board trip computers, or by additional data loggers connected to existing on-board diagnostic systems. In this case, a resolution of 1% for SOC measurements is assumed to be adequate for the considered application. If the EV is equipped with an on-board navigation system, and a specific destination has been set by the user, the GPS position of the final destination, and the related ETA, can be used (along with EV consumption data, users’ habits, and current SOC) to compute the expected next charging request of the EV (i.e., the expected charging station and the related time of arrival). Finally, the acquisition time of the set of information must be provided, to ensure proper temporal monitoring functions. In this study, a time resolution of 1 s is assumed adequate for EV monitoring applications.
As detailed in Table 2, the maximum size of each sample transferred by EVs to the EV-MSP is equal to 31 B, per each monitored EV. If the information on the planned destination of the EV is not provided to the EV-MSP, the size of each sample is reduced to 22 B.
The evaluation of the proper sampling interval of EV monitoring applications must take into account the perspective of aggregators, who are in charge for the computation of the expected spatial and temporal distribution of charging requests of EVs moving inside urban areas. From this perspective, two main time-dependent variables must be considered, namely: the current SOC of on-board batteries, and its variation between two consecutive samples. It can be assumed, in fact, that, without any additional information about the destination of the EV or about the acceptance of a specific DR request, the expected charging request of an EV can be computed by considering the current value of the SOC of the EV and its average energy consumption (based on historical data or computed by using the last measured samples). It is apparent that, in this case, the lower is the SOC, the higher is the probability that the monitored EV will stop to charge at the nearest available charging station. Additionally, the higher is the SOC variation (i.e., the speed of the decrease of the remaining driving distance), the higher is expected to be the user’s “range anxiety”, and thus the probability that the user will stop soon to charge the EV batteries. Based on these assumptions, the minimum value of the sampling interval, Δ t min , can be computed as follows:
Δ t m i n = S O C r e s C n o m S m a x E a v g ,
where S O C res is the resolution of SOC measurements, C nom is the average nominal capacity of the EV (expressed in kWh), S max is the maximum expected average speed of the EV (expressed in km/h), and E avg is the average energy consumption of the EV (expressed in kWh/km). The value computed by Equation (1) is equal to the minimum time interval for which the variation of the SOC of the EV is expected to be greater (or equal) to the resolution displayed by on-board trip computers. From this perspective, sampling intervals lower than Δ t min are not considered useful for the evaluation of the expected charging requests of monitored EVs, since, in this case, the variation of the SOC of the EV is expected to be lower than the minimum difference that can be detected by EV users. Considering that the average speed of road vehicles in urban areas is usually limited to 50 km/h and that the resolution of SOC measurements is typically of 1%, and assuming that the average nominal capacity and energy consumption of commercially available EVs are on the order of 25 kWh and 0.15 kWh/km [12,47], respectively, the minimum sampling interval is expected to be not less than 2 min.
In this study, a sampling interval of 5 min (corresponding to a maximum expected SOC variation of 2.5%) is assumed to be adequate for the monitoring of EVs moving inside urban areas, and the related data throughput is thus expected to range within 0.073 and 0.103 B/s, per each monitored EV.

4.2.2. Provisioning of EV Supply Equipment (EVSE) Information to EV Users

The aim of the EVSE monitoring function is to provide EV users reliable information about available sockets close to their location or to their final destination, over a time horizon of three hours, with a granularity of 15 min. The set of required information includes, for each monitored charging station: the acquisition time of the set of information, the ID code of the charging station and its GPS location, and the number of available (expected or not booked) EVSE over the next three hours, with a time step of 15 min. In this study, we assumed that the set of information about the availability of EVSE can be limited to AC Level 2 and DC Level EVSE, since AC Level 1 EVSE are usually intended only for home or private use. As detailed in Table 3, the maximum size of each sample transferred by the EV-MSP to EVs is equal to 47 B, per each monitored charging station.
The evaluation of the proper sampling interval of EVSE monitoring applications must take into account the perspective of EV users, who are mainly concerned about the availability of EVSE, particularly if the remaining driving distance of their vehicle is very low. In this case, considering the same observations discussed in the previous subsection, a sampling interval of 5 min is assumed to be adequate, and the related data throughput is thus expected to be equal to 0.15 B/s, per each monitored charging station.

4.2.3. Management of Vehicle-to-Grid (V2G) Demand Response (DR) Requests

The aim of the DR management function is to provide aggregators the ability to implement and manage V2G DR requests, including the provisioning of DR requests to EV users, and the management of transactive DSM actions. The set of required information can be subdivided into two groups: the delivery of DR requests to EV users, and the response of EV users to specific DR requests.
The set of required information for the provisioning of DR requests to EV users includes, for each charging station participating in V2G DSM schemes: the acquisition time of the set of information, the ID code of the charging station and its GPS location, the ID code of the DR signal sent to EV customers, the price profile of energy (i.e., the price-based control signal) over a time horizon of three hours, with a granularity of 15 min, the power limitation profile (i.e., the transactive control signal) over a time horizon of three hours, with a granularity of 15 min, and the offered incentive related to the power limitation DR request. In order to reduce the amount of data throughput, the required set of information can be appended to EVSE monitoring messages, thus reducing the number of transmitted data to the set of information detailed in Table 4. In this case, the required refresh time interval is assumed to be equal to 15 min, and the related data throughput is equal to 0.028 B/s.
The set of required information for the management of transactive DSM actions (i.e., the response of EV users to specific DR requests) includes, for each monitored EV: the acquisition time of the set of information, the user ID code, the EV ID code, the EV model ID code, the current GPS location of the EV and its current SOC, the ID code of the DR signal, and the response to the DR signal (i.e., accept or deny). If the specific DR request has been accepted by the EV user, the following information related to the booking request of the EVSE is also considered: the Estimated Time of Arrival (ETA), the Estimated Time of Departure (ETD), and the total amount of required energy. The required set of information can be appended to EV monitoring messages, thus reducing the number of transmitted data to the set of information detailed in Table 5. The required refresh time interval is assumed to be equal to 15 min, and the related data throughput is equal to 0.016 B/s.
If provided, the ETA can be computed by on-board navigation systems, based on the location of the selected charging station, or directly proposed by the EV user. Analogously, the ETD can be proposed by the EV user, or computed by on-board automated devices, by taking into account the available EVSE power profile and the required SOC at the end of charging process. Finally, the latter can be also used to compute the total amount of required energy.
Differently from price-based control schemes, in transactive control applications the use of on-board EV intelligent devices is required to provide optimal charging strategies and economic evaluations of the proposed DR requests. However, whilst optimal solutions can be automatically computed and proposed by on-board automated devices, in the case of DR acceptance signals or booking requests, proper Human-Machine Interfaces (HMIs) must be taken into account.

5. The Communication Infrastructure

4G and 5G technologies represent the best candidates for the implementation of the mobile communication framework required by the herein proposed system architecture. Indeed, the very different technologies under the 5G mobile communication umbrella have been already proposed as a possible solution in V2G applications [12,22]. However, these technologies may present some drawbacks, particularly concerning their implementation and management in large scale and low-cost applications. The development of 5G standards, for instance, is not yet finalized, and only research-grade devices have been announced to date. On the other hand, older—and widely diffused—technologies, such as 4G, require the subscription to dedicated services, that may hinder the diffusion of low-cost applications. These technologies, in fact, operate in licensed bands and are based on privately owned infrastructures, thus requiring the payment of a fee to the operator. Additionally, the lack of virtual Subscriber Identity Modules (SIMs), announced in the recent past but poorly diffused, makes the SIM management tricky for large scale applications.
In this context, the adoption of LPWAN solutions exploiting a cellular-like architecture could represent a possible low-cost alternative to 4G and 5G solutions. LPWANs, in fact, are able to serve a large number of nodes by making use of a limited number of base stations (up to hundreds of nodes can be served by a single base station), thus reducing the overall costs of installation of the communication infrastructure. It must be noted that, in this case, LPWANs are not intended to substitute 4G and 5G networks, where available. Indeed, some studies exploiting the possible integration of LPWAN solutions with 5G system have been already presented in the literature [48,49]. In particular, it has been demonstrated that LPWANs can be used as viable complement to existing solutions when the refresh time interval is relatively long (on the order of 1 min), and when low throughput values (on the order of 1 kb/s) are tolerated.
A large number of diversified LPWAN solutions have been recently proposed at both the research and commercial stage. Despite the diversity of the adopted technical solutions, some common features can be identified, as briefly summarized in the following:
  • the long-range capability, allowed by the use of unlicensed sub-GHz bands, and by the adoption of simple modulation techniques, offering very high receiver sensitivity;
  • the low power consumption of nodes, allowed by the star topology configuration, and by the low duty-cycle of each node;
  • the high scalability, allowed by the exploitation of several diversity techniques and complemented by adaptive channels and data rate selection;
  • the low cost of nodes, allowed by the use of simple radio technologies, and by the lightweight protocol stack on the node side, which offloads most of the complexity to a network manager.
LoRaWAN is currently one of the most diffused LPWAN technology worldwide, boasting a large number of adopters from both the industrial and the academic sector, also thanks to the commercial availability of modules and development kits. For this reason, in this study the use of LoRaWAN has been proposed as a possible solution for the mobile communication among aggregators and EV users for the intraday V2G DSM inside urban areas, due to the relatively low data rates and duty-cycles of this kind of applications.
The aim of this section is to provide an overview of the LoRaWAN technology, by focusing on the architecture arrangement and on the communication protocol stack. The physical (PHY, i.e., LoRa) and the data link (DL, i.e., LoRaWAN) layers are firstly introduced, while some considerations about the scalability of the proposed integration are finally discussed.

5.1. The Long-Range Wide Area Network (LoRaWAN) Architecture

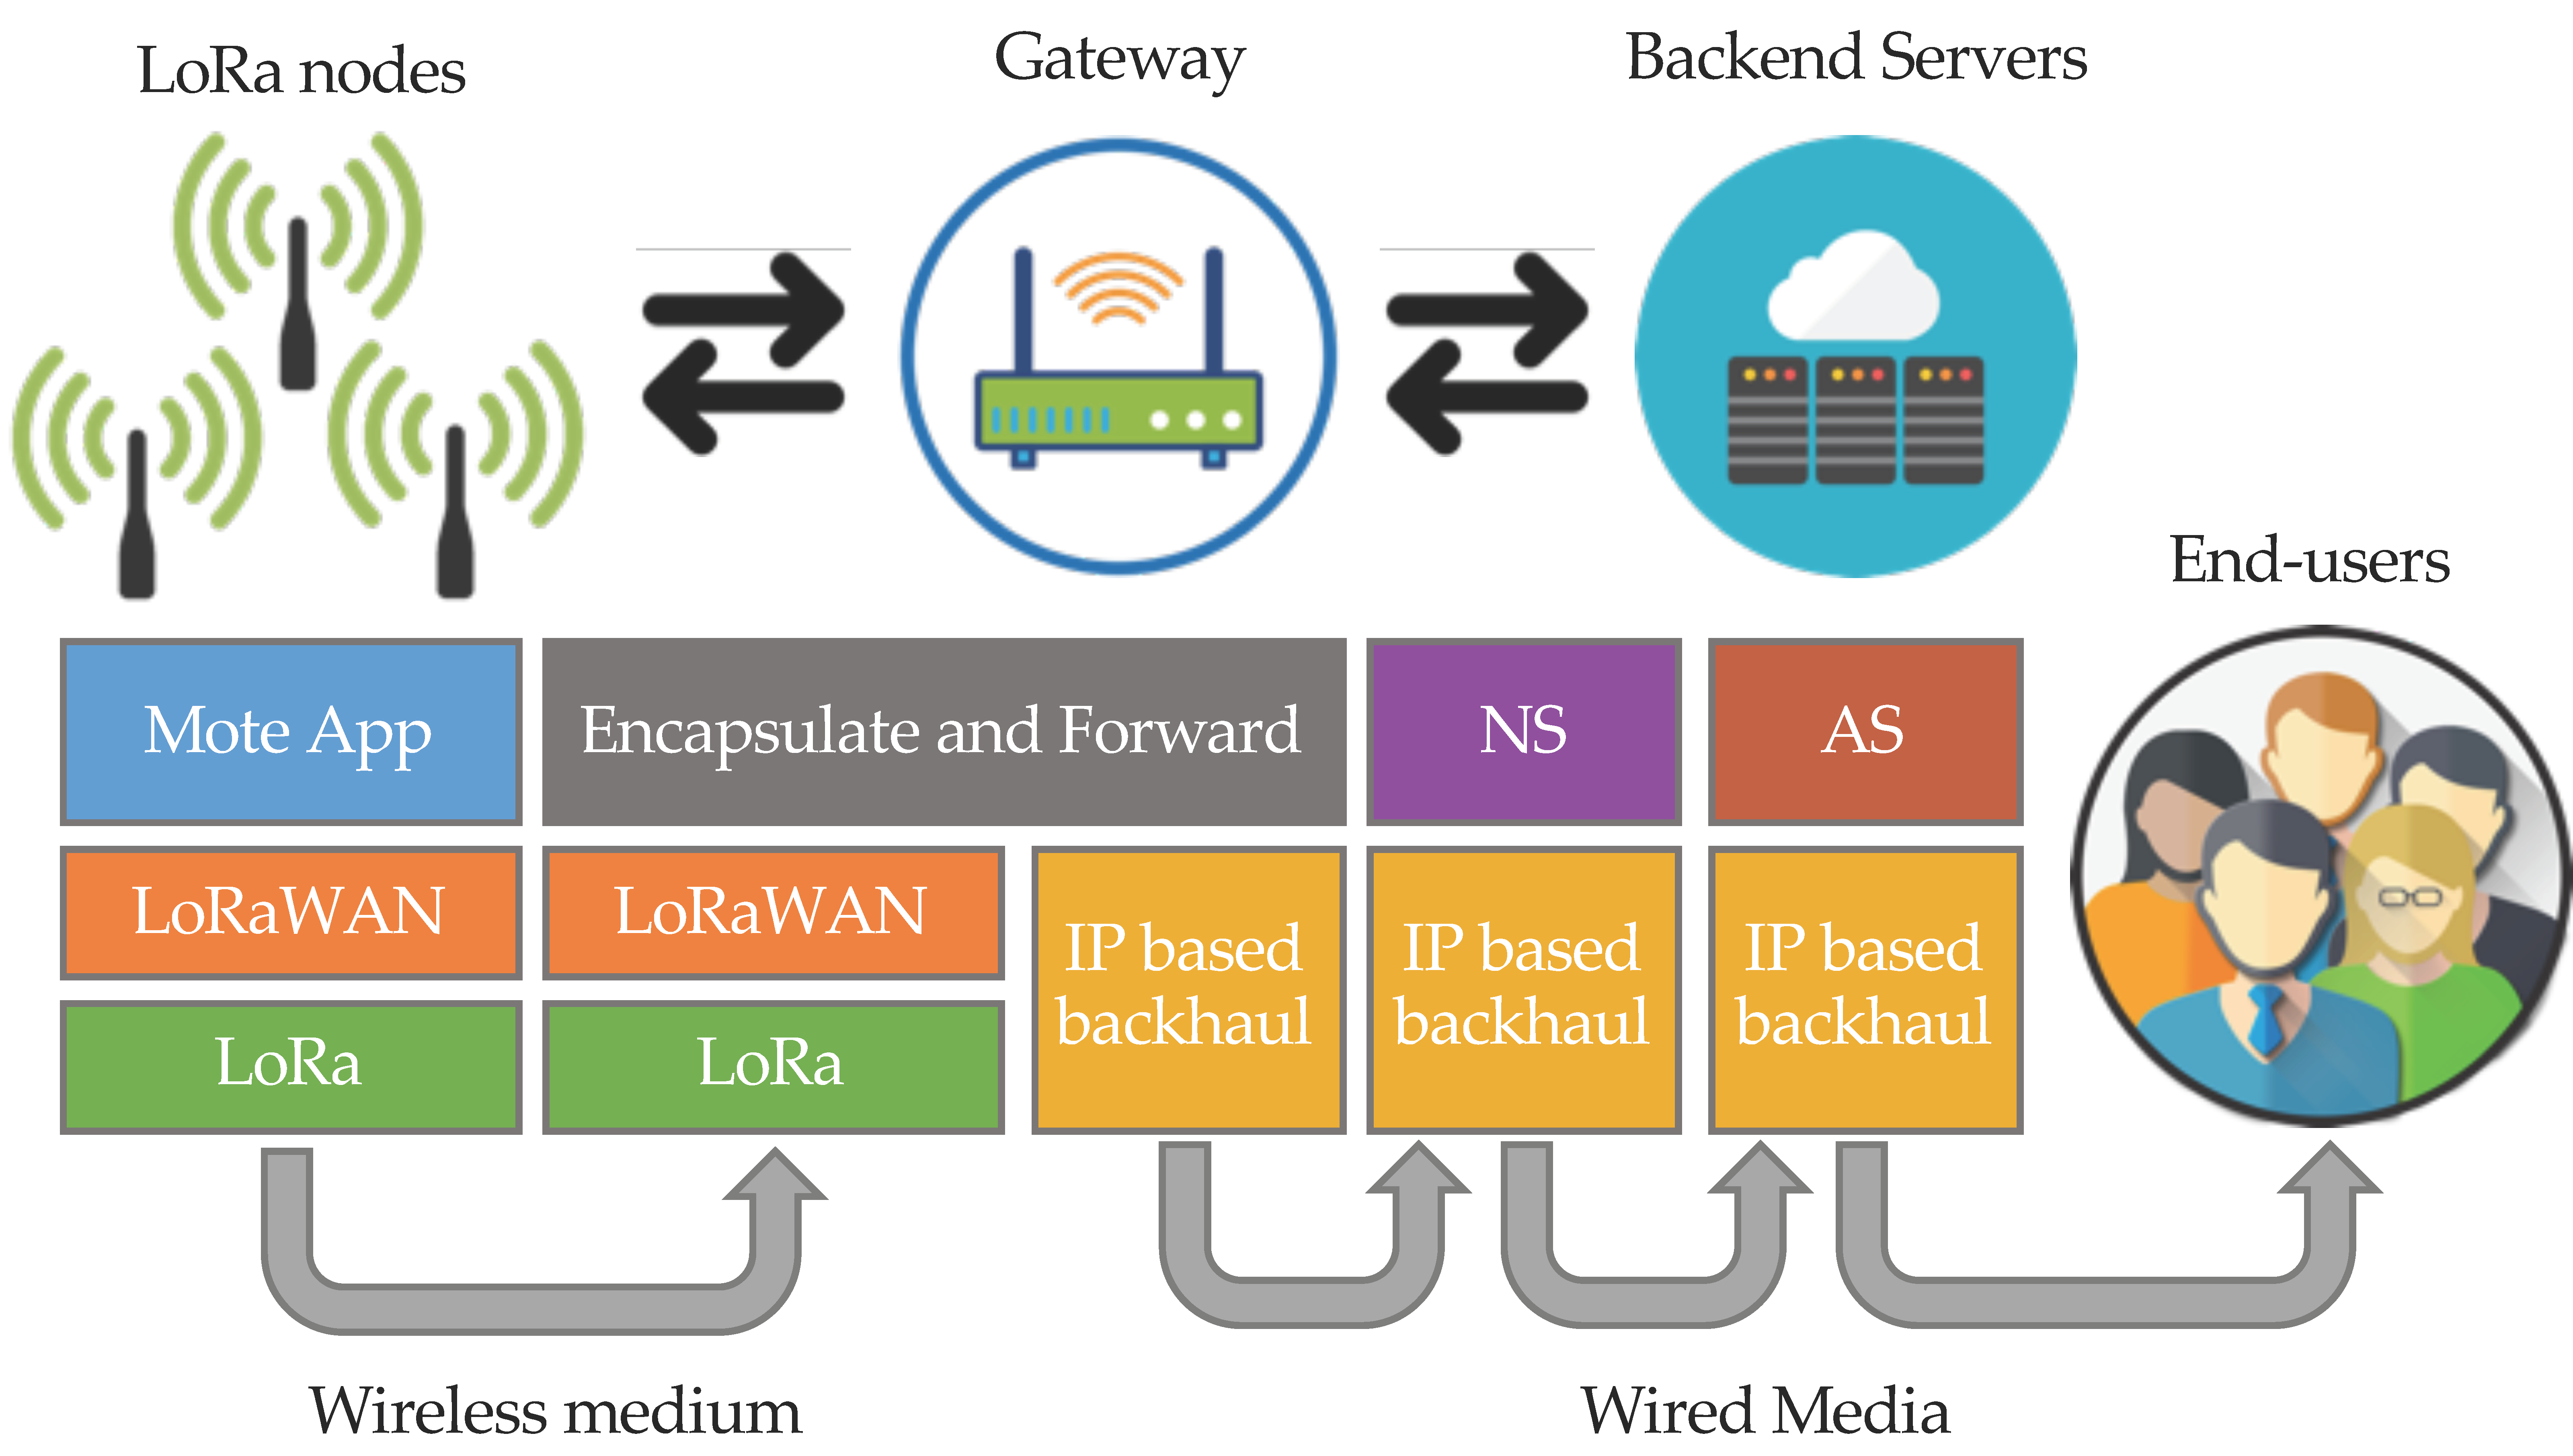
LoRaWAN networks implement a star topology, where the star center, i.e., the base station—usually referred as Gateway (GW)—is a relatively simple device which tunnels each incoming wireless message into the backhaul network, and vice versa (as shown in Figure 8). More than one GW can be connected on the IP-based backhaul towards a Network Server (NS), which is in charge for the management of the network infrastructure, e.g., by admitting individual motes and assigning communication parameters. GWs do not manipulate user data (i.e., data are opaque), but they only convey messages from the wireless side to the wired backhaul, and vice versa. The user payload data integrity is verified by the NS by means of a Message Integrity Code (MIC), appended to the message by the mote (in case of uplink messages, and the opposite in case of downlink messages). The user payload is then propagated to the Application Server (AS), which deciphers the content of the message on an end-to-end basis, by thus decoupling user data from the communication infrastructure. Noteworthily, starting from the latest release of the LoRaWAN specs (v. 1.1), some substantial amendments have been introduced. In particular, both passive and active roaming is permitted, and messages can be propagated over multiple NSs.
Security is of main concern in all LPWANs applications. In the latest specs, a Join Server (JS) has been introduced, which manages the Join-requests of motes, and provides the Join Accept messages if the end-device is permitted to join the network. LoRaWAN typically relies on an Over The Air Activation (OTAA) procedure, which requires that the end-device is personalized with a Device Extended Unique Identifier (DevEUI) (i.e., a univocal mote identifier, according to IEEE EUI64), a JoinEUI (another IEEE EUI64 identifier, which univocally addresses the intended JS), and two root ciphering keys. The NwkKey and the AppKey are used to compute session keys, each time the mote joins a network. The actual application session key (which protects the end-to-end data exchange) is then derived from the AppKey, while the NwkKey is provided to the network operator to manage the join procedure, thus avoiding the operator to eavesdrop on the application payload data.
LoRaWAN node capabilities are classified into three different classes, namely: Class A (compulsory), Class B, and Class C. In Class A, transmissions are started by the node (i.e., in uplink direction) on a certain channel, by using a determined data rate. Two reception windows—from the GW to nodes, i.e., in downlink direction—are opened after the transmission, typically after one and two seconds, respectively: the first uses the same communication parameters of the uplink message, whereas the second uses a fixed (but configurable) set of parameters, for the possible acknowledge or downlink messages. In Class B, the nodes behave as in Class A, but also open additional receive windows at scheduled times (time dissemination is performed by the Gateway sending Beacon messages every 128 s). Finally, in Class C, devices transmit as in Class A, but nearly continuously extend the second receive window, thus increasing the power consumption, but also reducing the end-to-end latency.
The application of intraday V2G DSM schemes can be implemented by using a Class A LoRaWAN network, where uplinks (i.e., transmissions from EVs to GWs) always follow downlinks (i.e., transmissions from GWs to EVs). Whilst power consumption is not a real limit for the considered application, the use of Class B or Class C devices have not been considered, since they do not offer any real advantage in terms of communication performance.

5.2. The LoRaWAN Communication Protocol Stack

The PHY is based on the LoRa proprietary solution originally developed from Semtech. Differently from typical spread spectrum approaches, the Chirp Spread Spectrum (CSS) modulation is exploited. LoRa symbols are coded by chirps having a fixed bandwidth B, depending on regional regulations (in Europe B ϵ [125, 250] kHz), and different duration TC, depending on the tunable Spreading Factor, SF (with SF ϵ [7÷12], and TC = 2SF/B). According to well-known CSS properties, noise/interference immunity can be improved by increasing the time-frequency occupation (i.e., the SF in LoRa). In particular, a SF-bit symbol can be coded into a single chirp, by assigning a unique frequency trajectory across the available bandwidth (each one is represented by the cyclic rotation of a reference chirp signal). Forward error correction (FEC) is applied as well, since each user data nibble is coded with a coding rate CR = N/M, where M ϵ [5,8] is the codeword length, and N = 4 is the data block length. Consequently, the raw bit rate Rb (B/s) over-the-air can be computed by Equation (2):
R b = S F B 2 S F C R .
Adaptive Data Rate (ADR) strategies can also be implemented trading the rate Rb and the sensitivity S, e.g., by moving the rate from DR = 0 (which corresponds to Rb = 360 bps and S = −136 dBm, with CR = 4/5, SF = 12, and B = 125 kHz) to DR = 6 (which corresponds to Rb = 11 kbps and S = −123 dBm, with CR = 4/5, SF = 7, and B = 250 kHz).
Unfortunately, despite the spreading factors are sometimes considered as virtual channels, they are not orthogonal, and thus they only provide a certain level of isolation, which means that frames transmitted with SF = i and SF = j (with ij) can be correctly decoded only if the received packet Signal to Interference plus Noise Ratio (SINR) is above the isolation threshold (which is a function of i and j). In particular, increasing by one the SF, provides an additional 3 dB of processing gain. Since the higher is the SF, the better is the sensitivity, SF values are usually assigned depending on the distance among the node and the base station. In mobile applications, where the distance is not a priori known, SF values can be randomly assigned between 7 and 9.
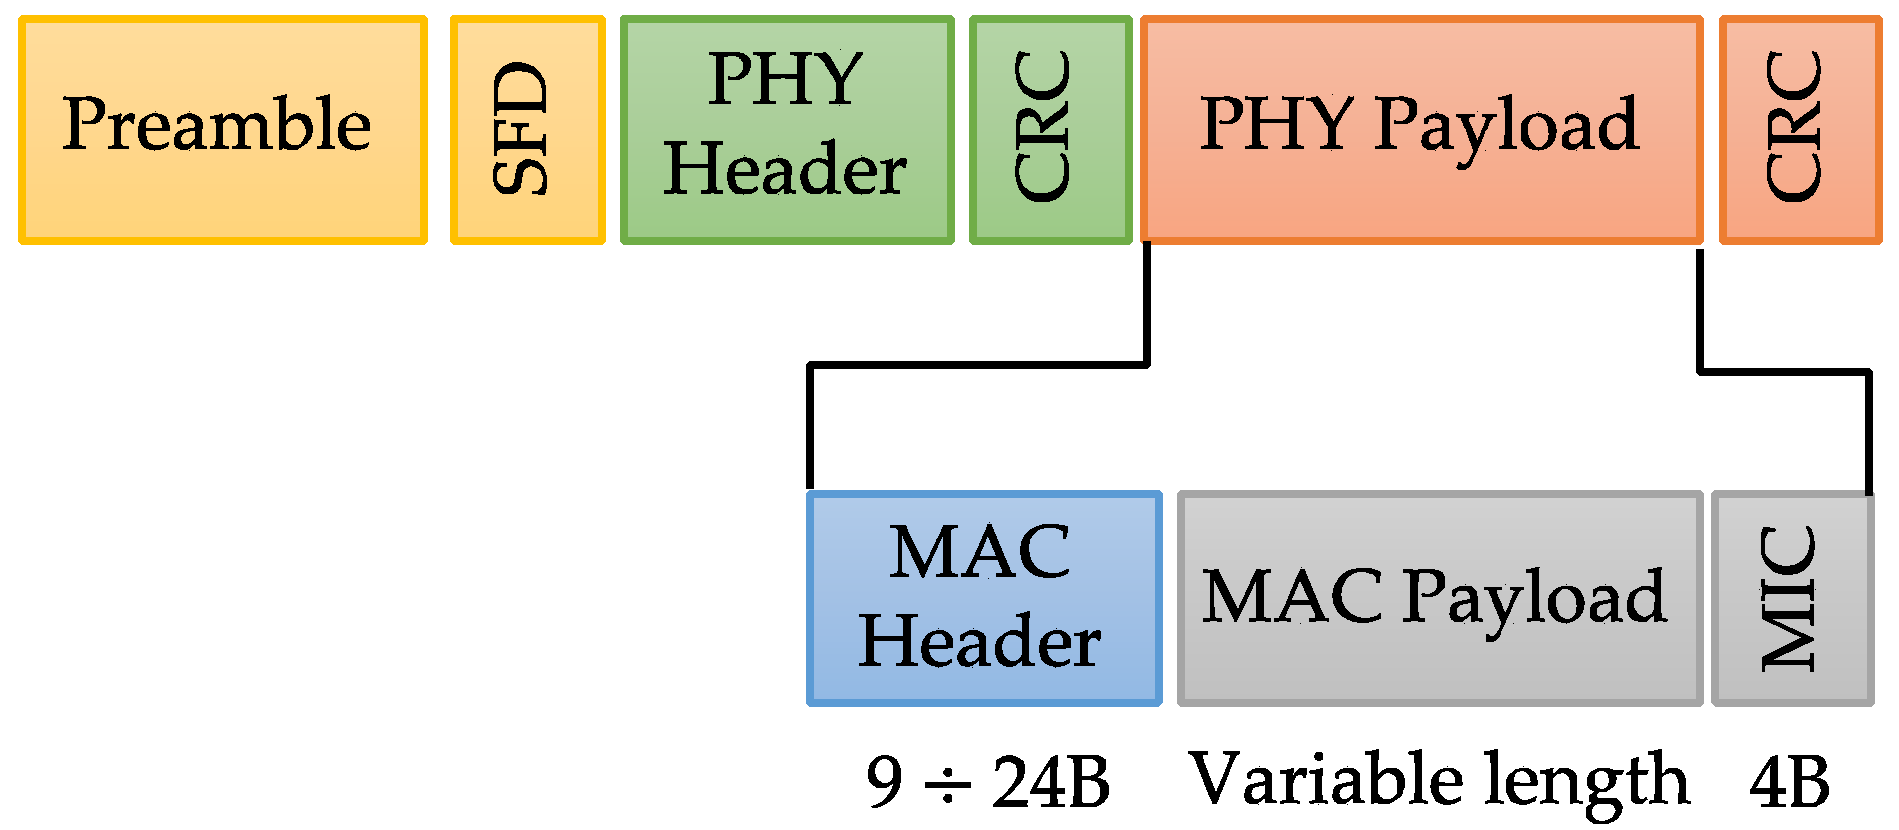
As shown in Figure 9, The LoRa frame starts with a preamble, followed by the Start of Frame Delimiter (SFD), and contains the PHY Header, the PHY payload, and the PHY Trailer, which consists of a Cyclic Redundancy Code (CRC) signature.
The PHY payload resembles the same structure and is further segmented into the MAC Header, the MAC payload, and the MAC trailer, which consists of a Message Integrity Code (MIC). According to the LoRaWAN specs, the maximum MAC payload length ranges from 242 B at SF = 7, down to 51 B at SF = 12 (in order to limit the effect of clock drift between the transmitter and the receiver).
The medium access policy is based on the plain ALOHA technique [50,51,52,53]. Optionally, clear channel assessment is permitted to improve the goodput. If the isolation provided by different SF values is able to ensure the reception of incoming messages, the overall network capacity per channel is the superposition of up to six independent ALOHA-based networks, depending on the actual number of SF adopted. However, depending on the region of operation, additional duty-cycle related limits may exist.

5.3. Scalability of the Proposed Low-Power Wide-Area Network (LPWAN) Infrastructure

Some simple analyses can be carried out to estimate the scalability of the proposed LPWAN infrastructure, by computing the maximum value of EVs that can be managed by a single LoRa base station. Referring to the data exchange procedure described in Section 4.2, it can be assumed that during uplink transmissions, 31 B messages are exchanged every 5 min, and additional 14 B are added every 15 min (i.e., every three transactions). Similarly, during downlink transmissions, 45 B messages are exchanged every 5 min, and additional 25 B are added every 15 min (i.e., every three transactions). If the additional 13 B required by the LoRaWAN headers and trailers are taken into account, the average uplink message is 49 B long, whereas the average downlink message is 67 B long. If we consider the sum of the maximum uplink and downlink messages (per each charging station and per each EV), including the LoRaWAN headers and trailers, about 116 B are exchanged every 5 min, which means that the duty-cycle limitation of LoRaWAN is always satisfied.
In the following, the theoretical capacity of a single LoRa base station is computed by assuming a charging station density equal to one station per each cell of 3 km side, i.e., corresponding to an average distance between two adjacent stations of about 4 km, and to an expected average EV battery consumption of about 2.5%. According to the proposed data exchange procedure, which accounts for up to 128 EVSE per charging station (i.e., up to 32 EVSE per each of the considered charging levels), one charging station per each cell of 3 km side corresponds to about 14 EVSE/km2, which is more than three times the maximum density of EVSE currently installed in urban areas [54].
In this study, a typical urban size of about 100 km2 is taken into consideration. It is in fact assumed that urban areas greater than 100 km2 can be subdivided into multiple monitored clusters of 100 km2 each, i.e., corresponding to an expected travelled distance comparable to the average driving range of commercial EVs [8,12]. Based on these assumptions, the number of expected charging stations per each monitored cluster is on the order eleven. The theoretical capacity of a single base station (reported in Table 6) can thus be computed by assuming than each cell must be able to manage up to eleven downlink messages with a length of 67 B each, and one uplink message with a length of 49 B, per each served node, including the LoRaWAN headers and trailers. In this study, three different channels have been taken into account, by considering a Spreading Factor SF from 7 to 9, in order to avoid message fragmentation.
Under perfect synchronization, the number of motes is given by N = T/TOA, where T is the aforementioned refresh period, and TOA is the message over-the-air time duration. If we consider that the actual throughput of ALOHA access is about 18% of the synchronized scenario [53], the maximum number of EVs that can be managed by a single LoRa base station is on the order of 146 EVs per channel, which corresponds to about 438 EVs per cell, when the three compulsory channels are adopted. In conclusion, if a maximum traffic density of about 400 EV/km2 is considered [55], the minimum number of LoRa base stations required to serve all the EVs moving inside the urban area is then on the order of about one cell per square km (i.e., equal to 0.91 cell/km2).

6. Experimental Validation

The feasibility of the proposed V2G LPWAN infrastructure has been demonstrated by testing the mobile communication between an EV and the LoRaWAN infrastructure of A2A Smart City installed in the city of Brescia, Italy. In the following subsections the real-world testbed and the obtained results are presented.

6.1. Experimental Set-up

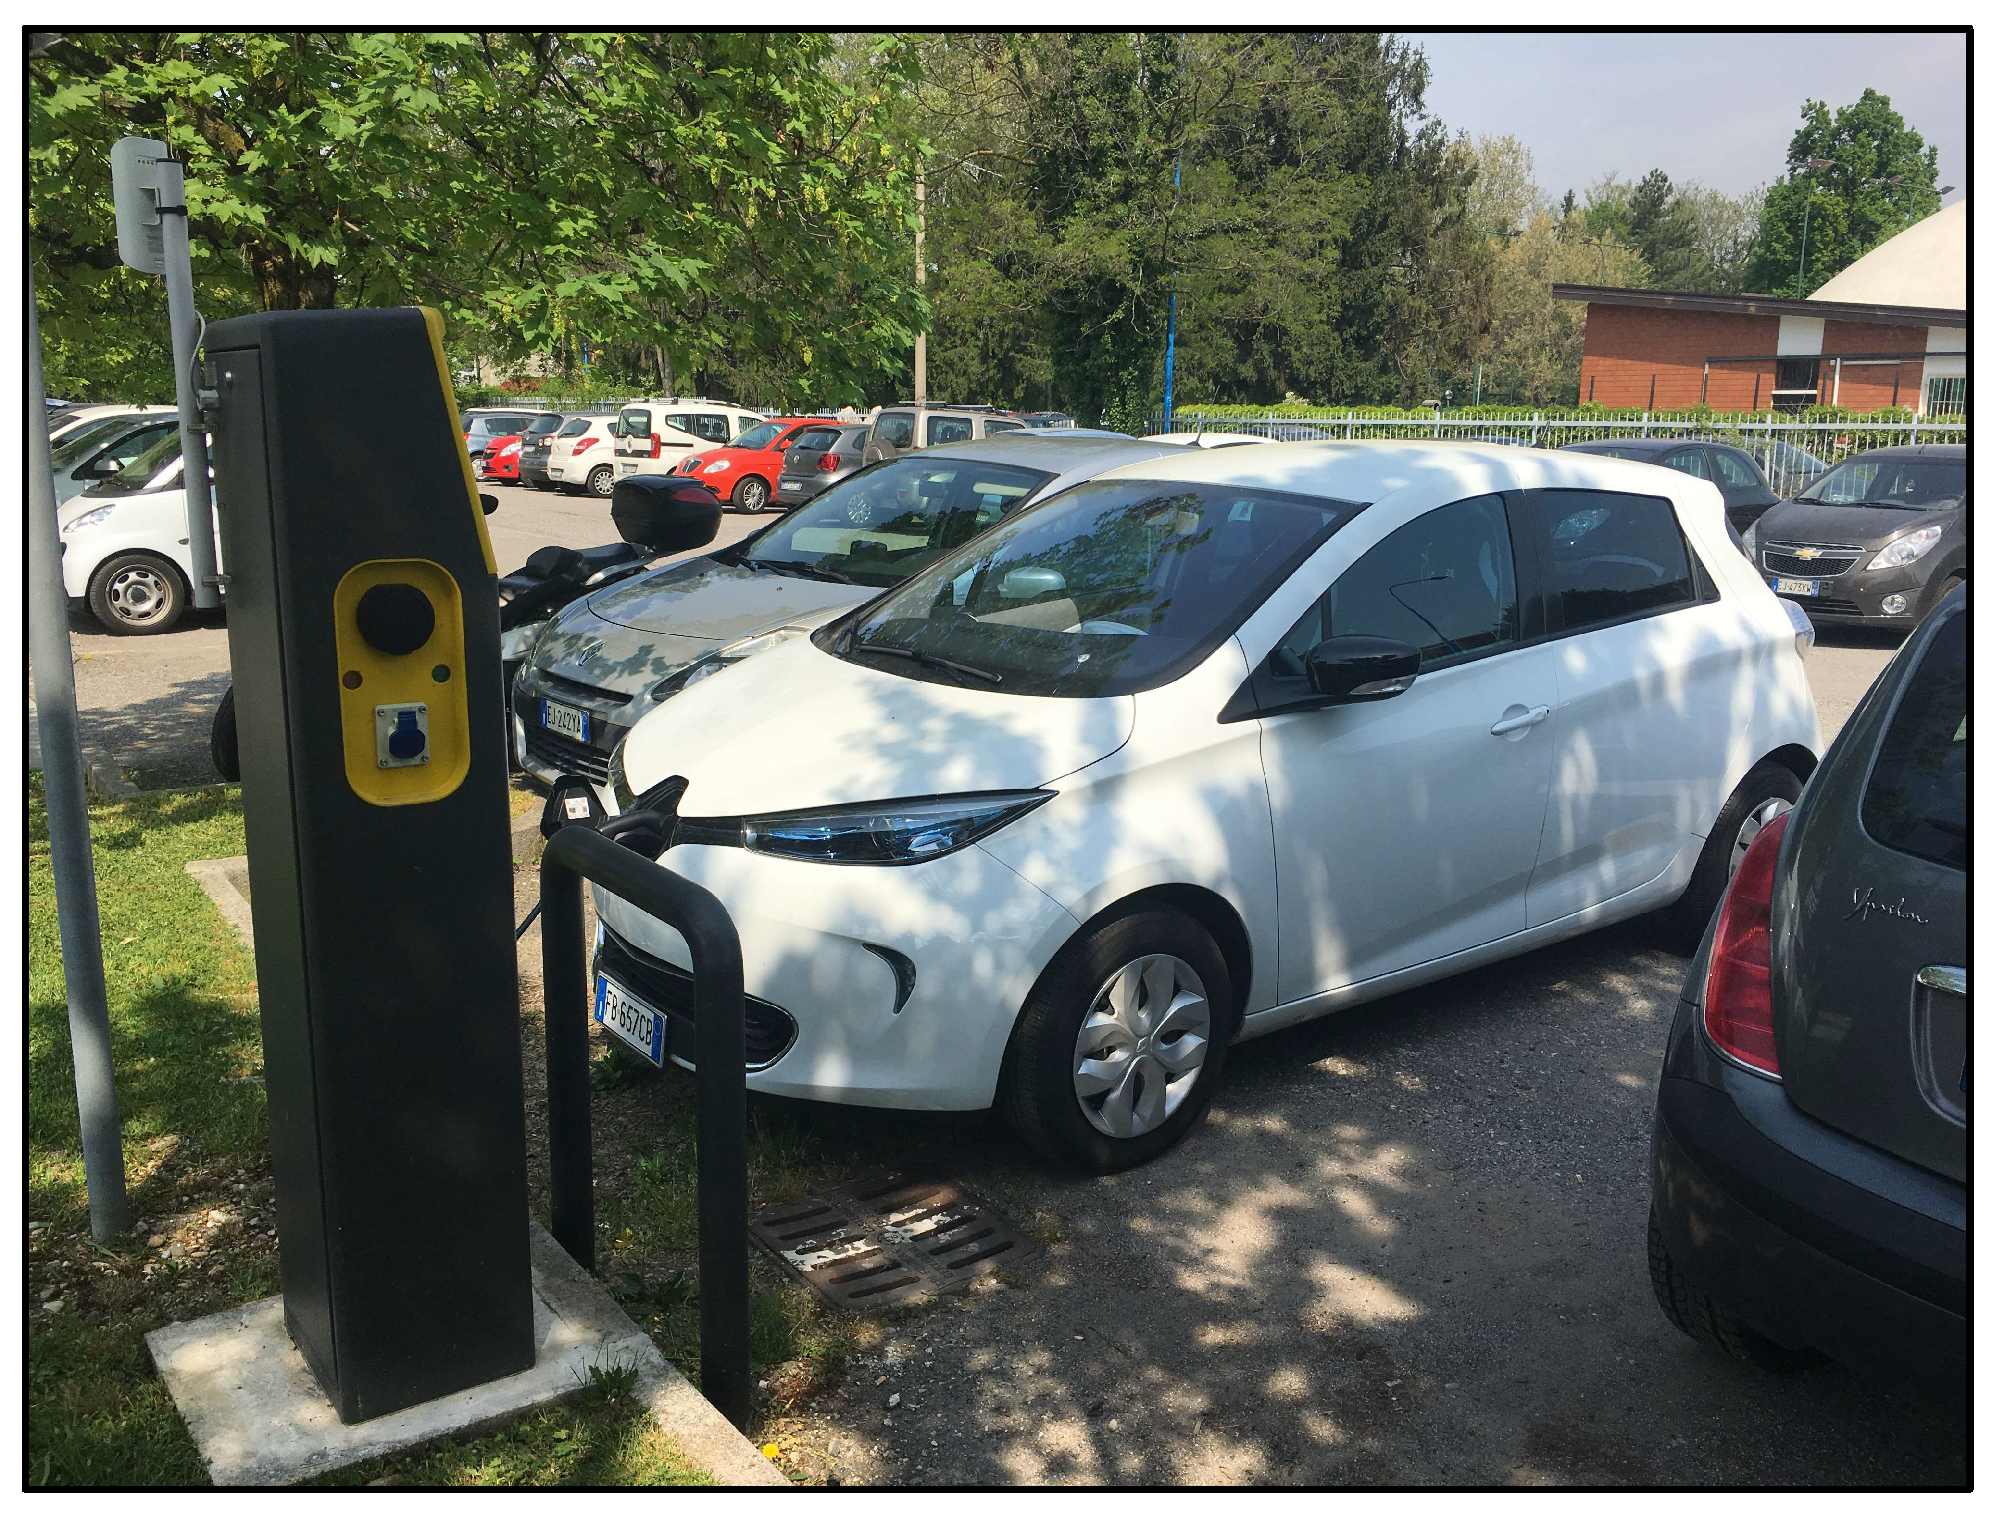
A full-electric vehicle, the Renault Zoe R240, powered by a 68 kWp engine and equipped with a lithium-ion battery energy storage with a net (i.e., usable) capacity of about 22 kWh, has been used as test vehicle. The experimental test has been carried out by using the EV in the urban area of the city of Brescia, which is equipped with a LoRaWAN communication infrastructure—made up of about 80 LoRa base stations installed throughout the city area, and with an EV charging infrastructure, both owned and managed by A2A Smart City [56]. The EV charging infrastructure is made up of 18 public AC Level 2 EVSE. Each of the EVSE, which is equipped with two three-phase power sockets, is capable to provide a maximum active power of 22 kW, per each socket. An additional private EVSE, owned by the University of Brescia, has been included in the experimental campaign. A picture of the test EV and of the private EVSE is provided in Figure 10.
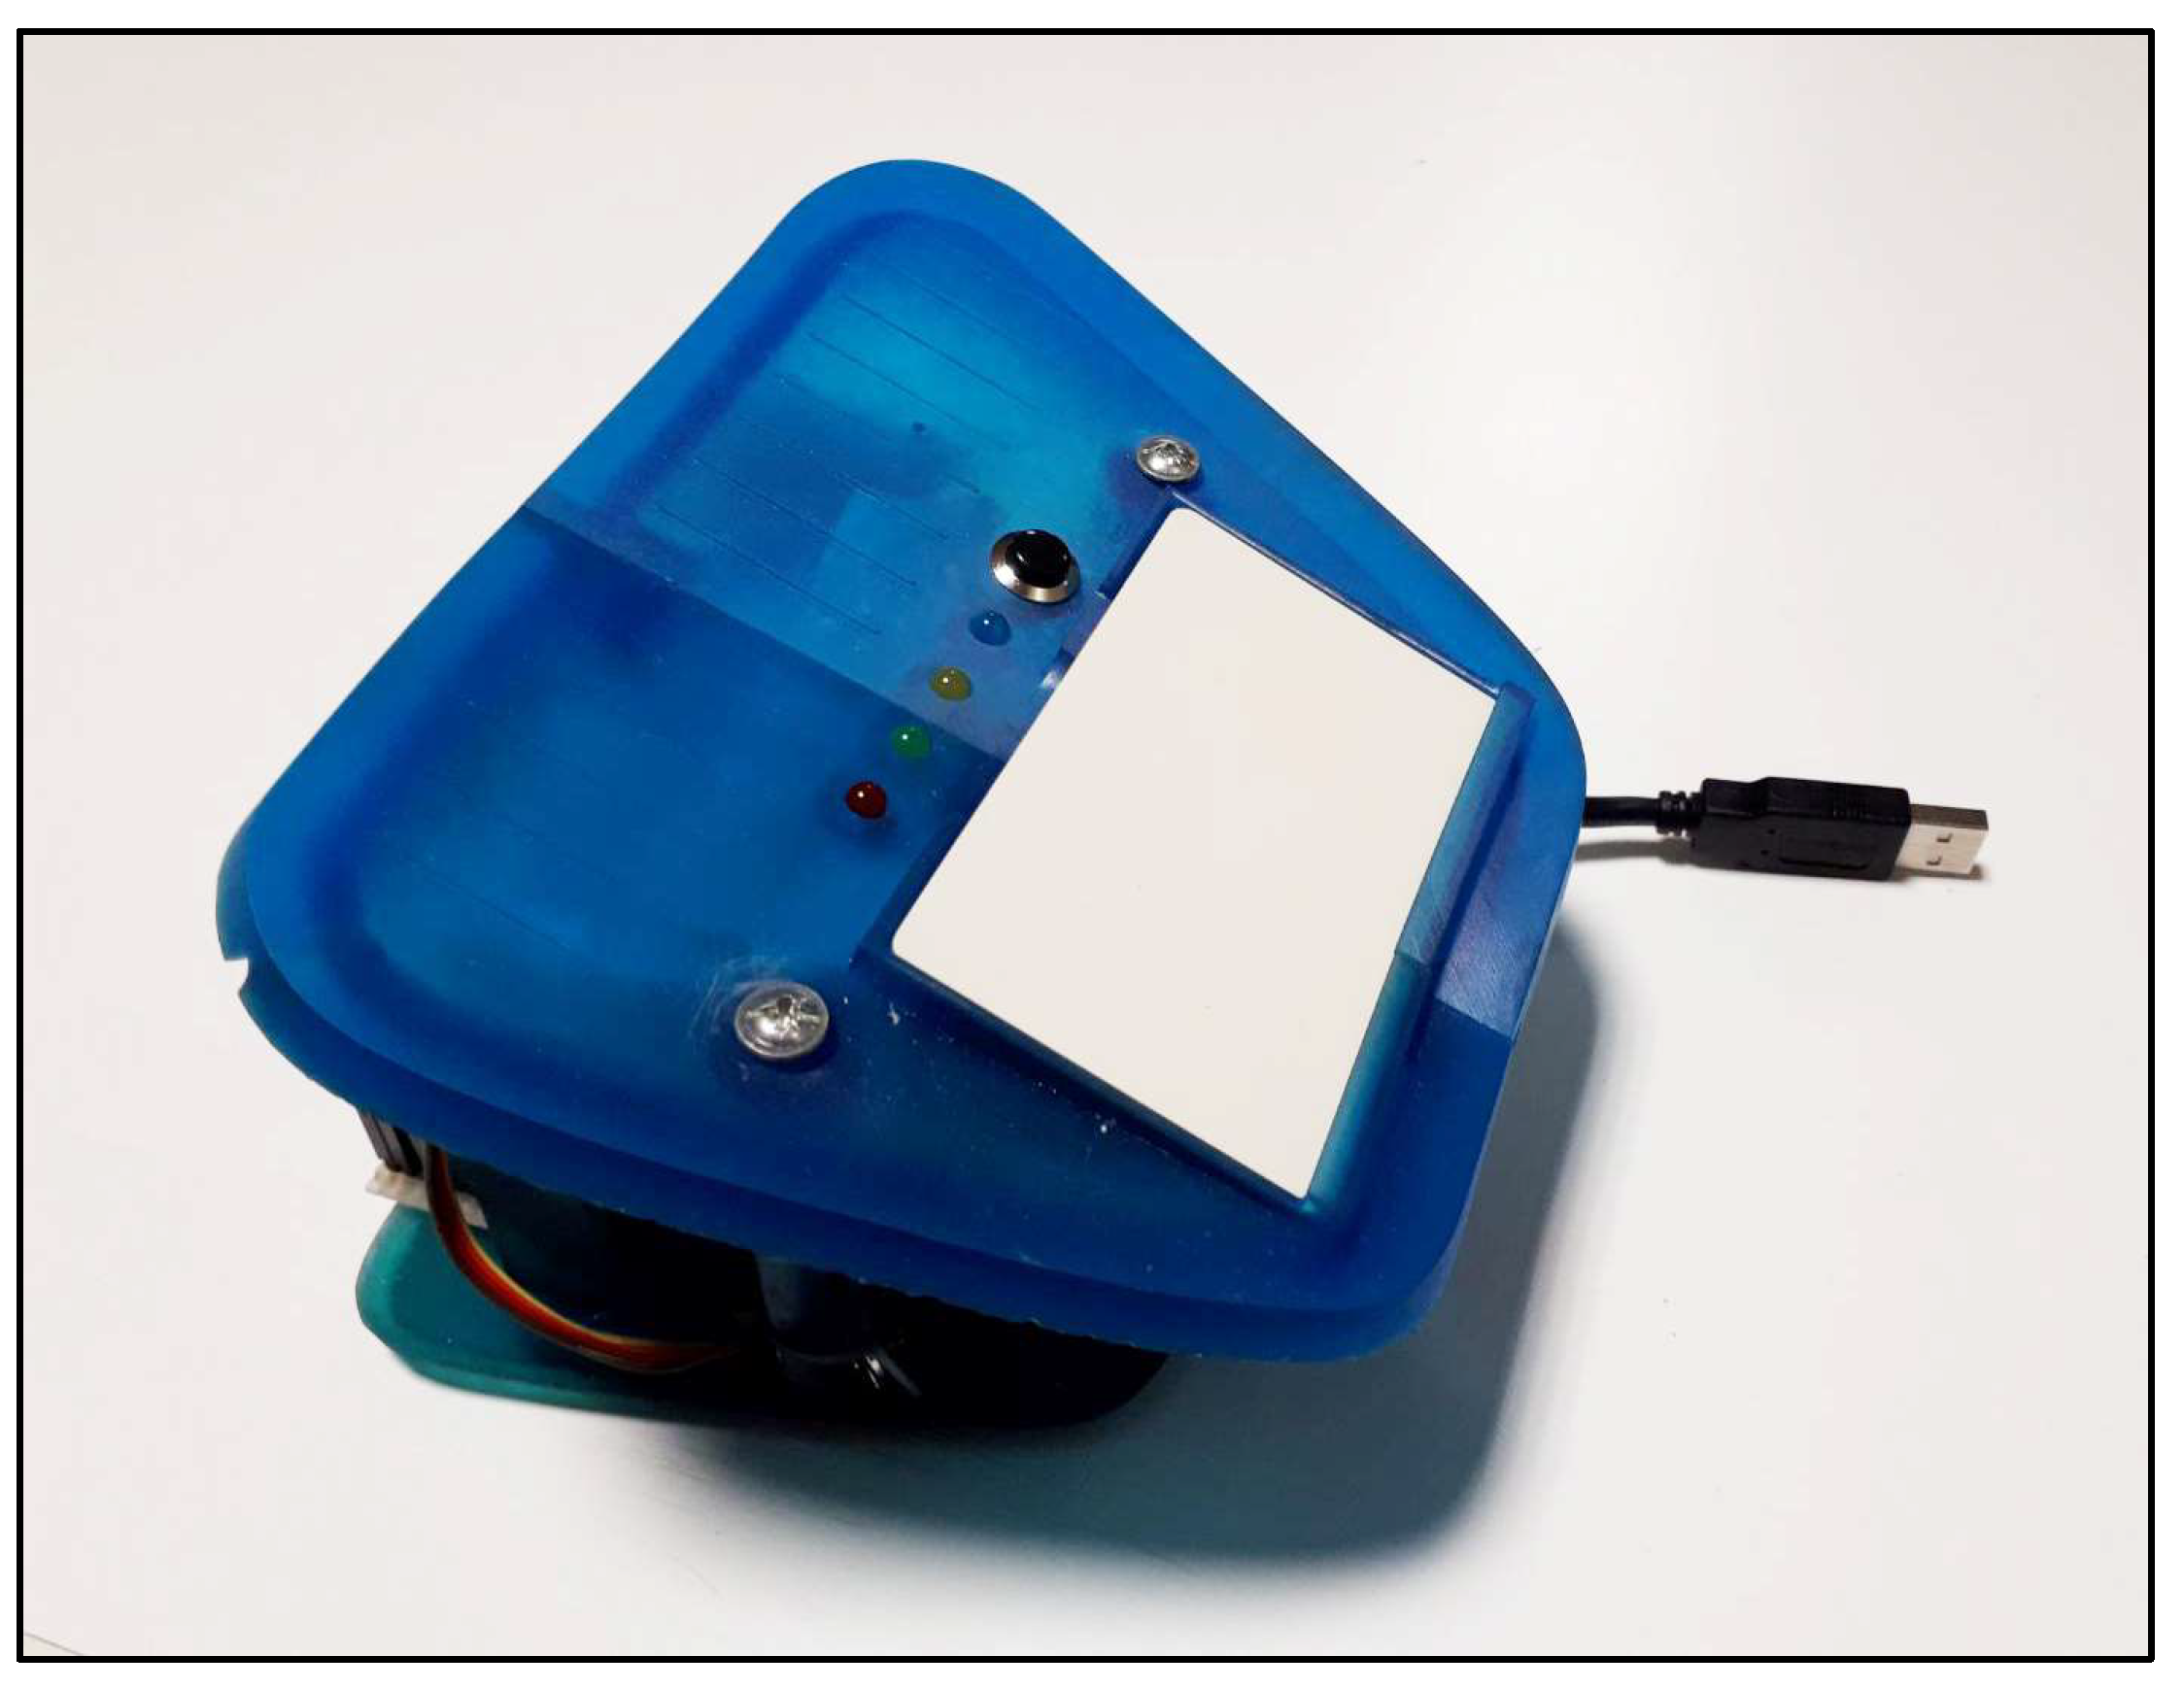
The EV has been equipped with an experimental data logger developed by the eLUX laboratory of the University of Brescia. The EV data logger (EV-DL) recovers the telemetry data of the EV by using a Bluetooth On-Board Diagnostic (OBD) device, which is directly connected to the EV internal communication vehicle (i.e., the vehicle bus). More information about the experimental data logger can be found in [40]. The EV-DL logs the parameters provided by the Engine Control Unit (ECU) with a sampling interval of 1 s. The set of sampled data includes the State of Charge (SOC) and the State of Health (SOH) of the battery, the speed and acceleration of the EV, the temperature of the battery pack, and many mores. The geographic coordinates of the EV are also logged by the EV-DL by means of an additional Global Positioning System (GPS) device. The system time of the data logger (which is used to define the timestamp of recorded measurements) is aligned to the Coordinated Universal Time (UTC) by means of a GPSd daemon, thus allowing a time synchronization accuracy on the order of milliseconds. A predefined (and configurable) subset of information provided by the data logger is then transmitted every 5 min to the LoRaWAN infrastructure by means of a Mbed SX1272 LoRa modem. The data transmitted by the LoRa modem are then made available through a Message Queue Telemetry Transport (MQTT) queue. A picture of the experimental data logger used during the experiments is provided in Figure 11.

6.2. Experimental Results

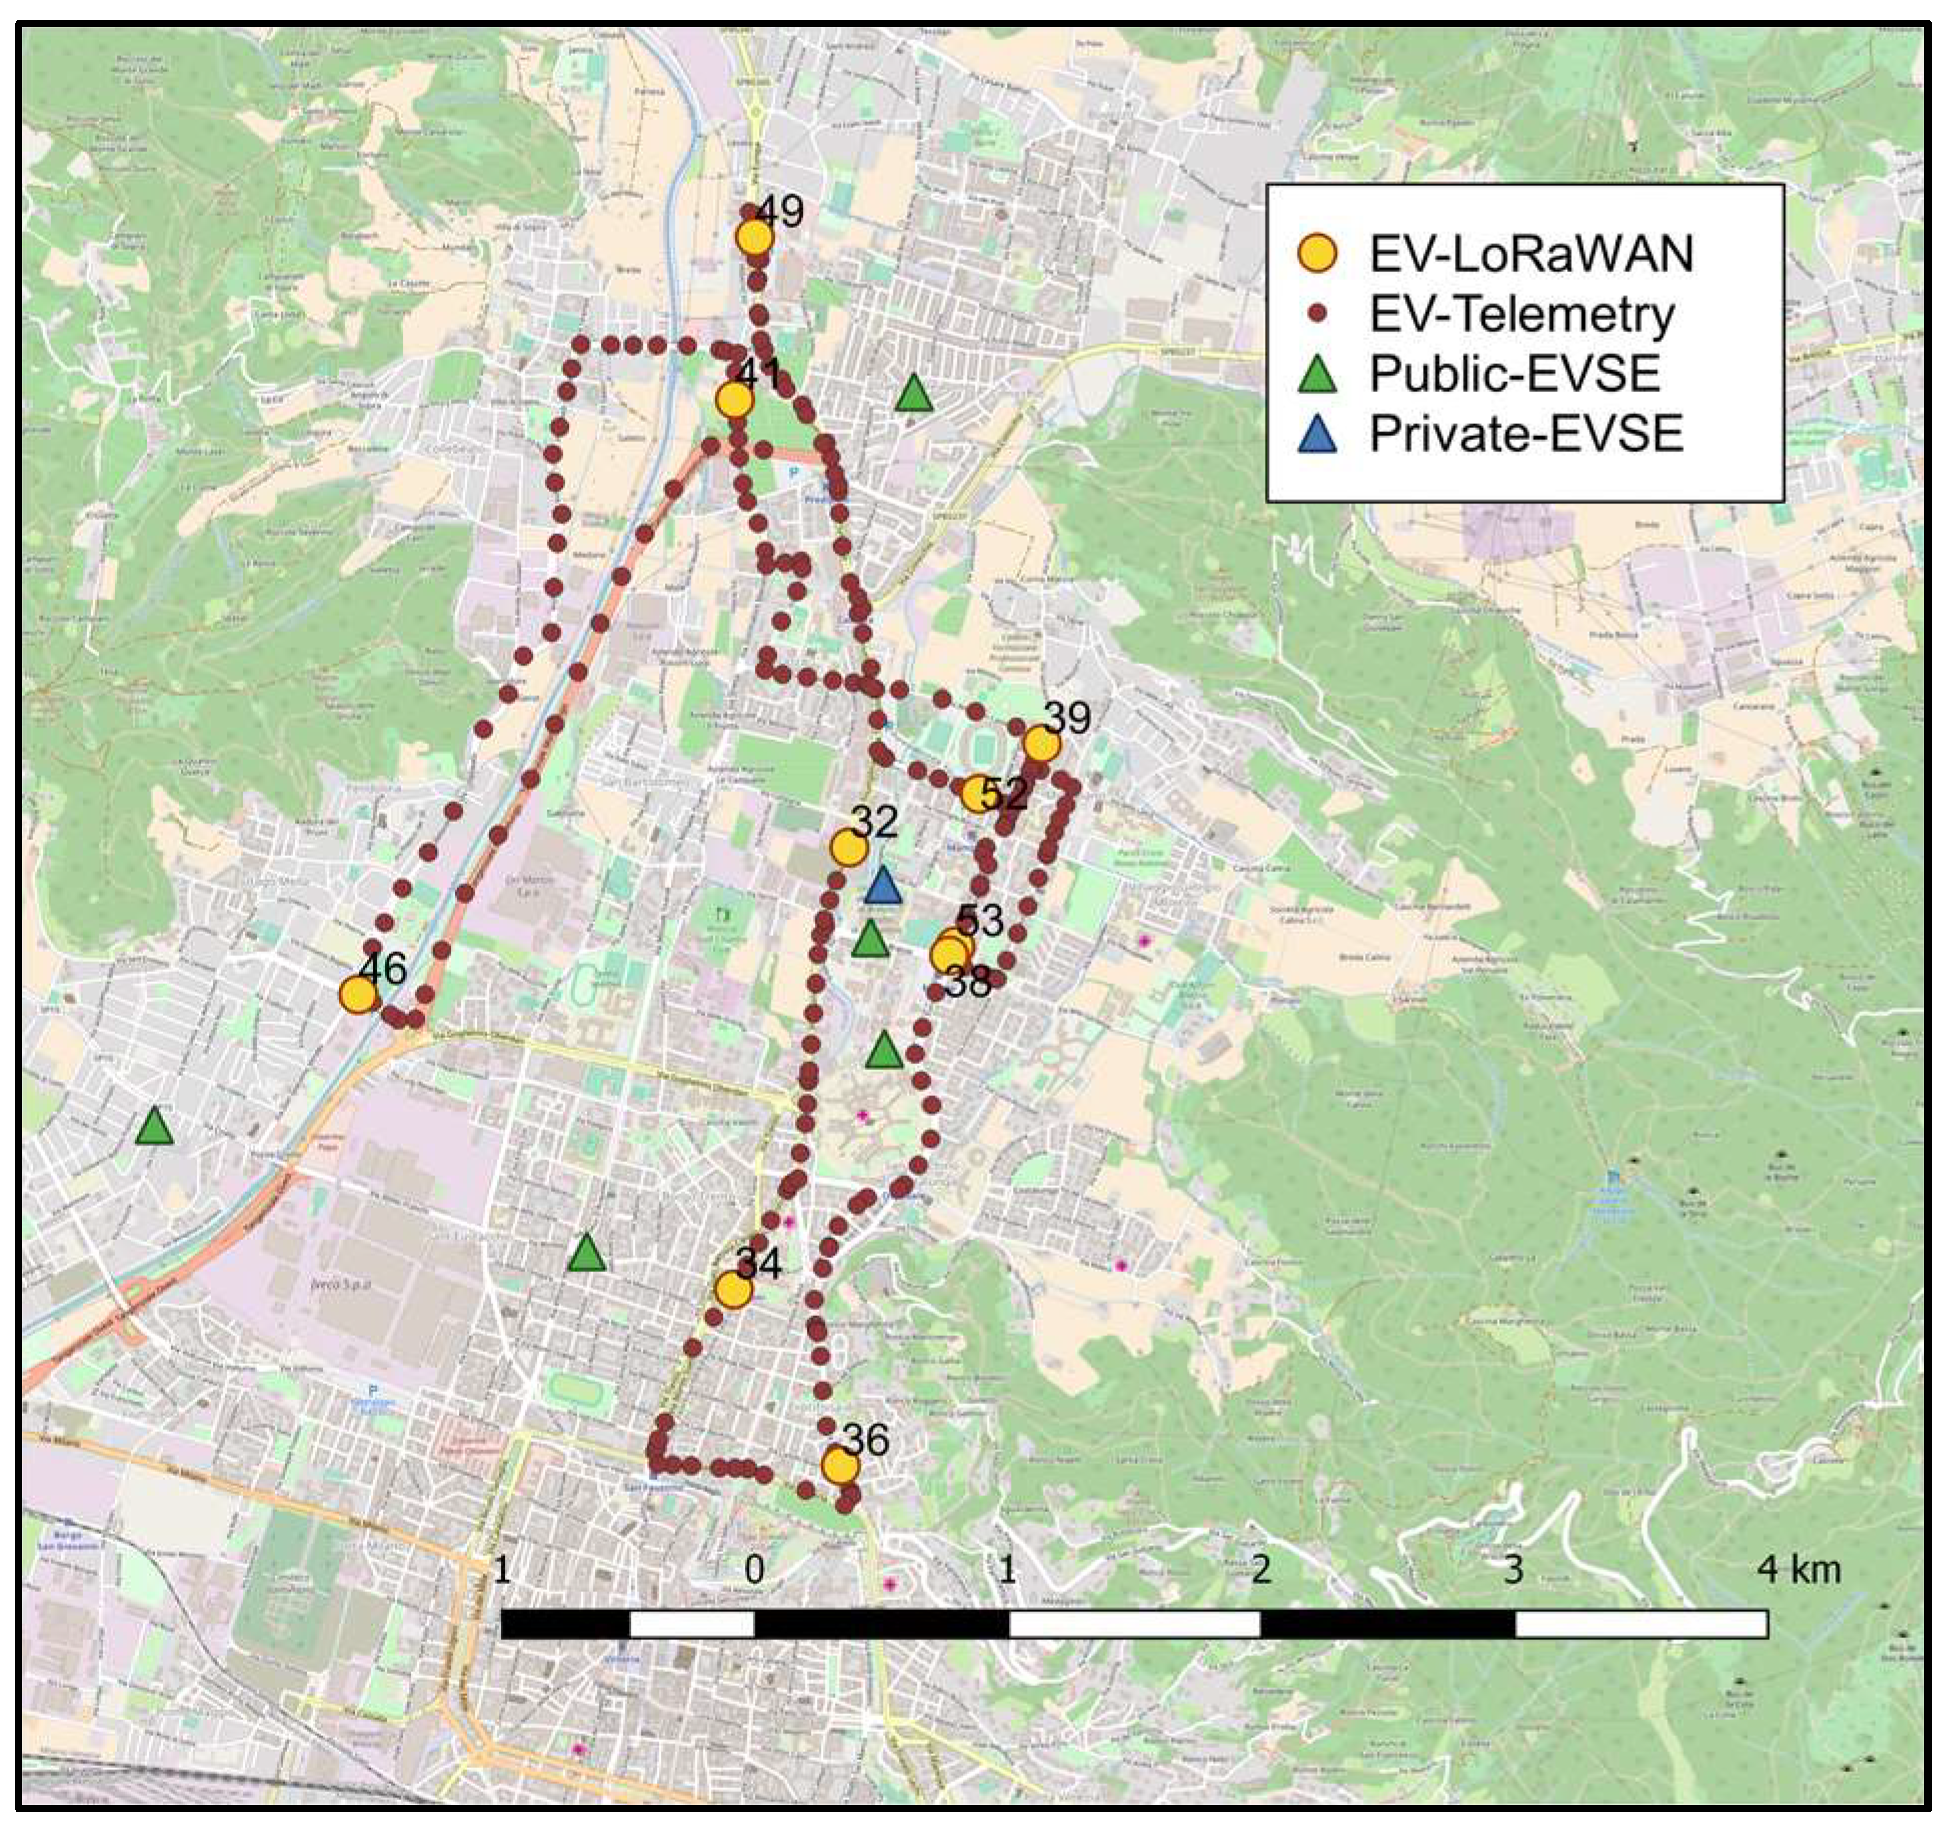
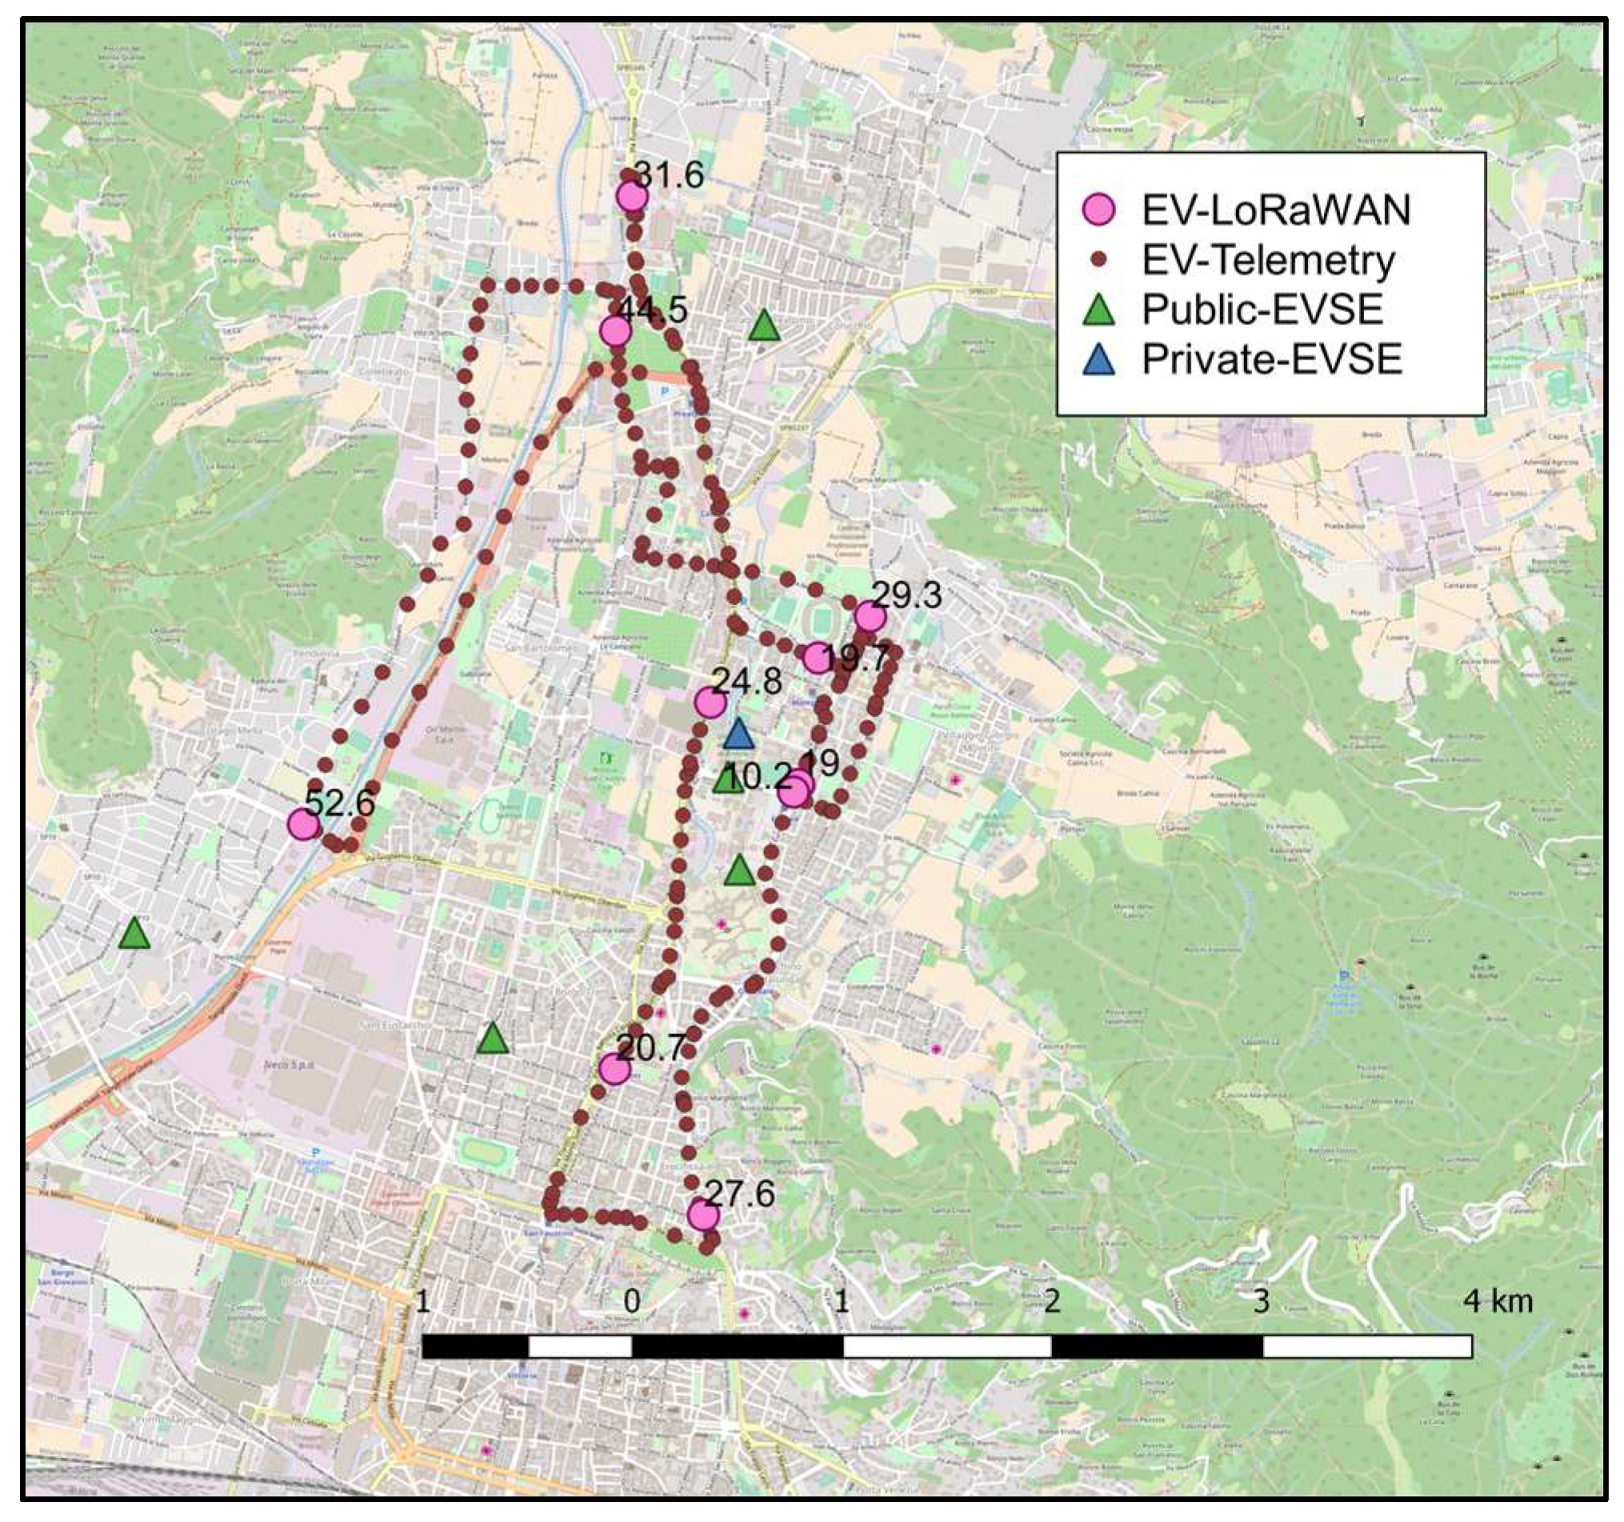
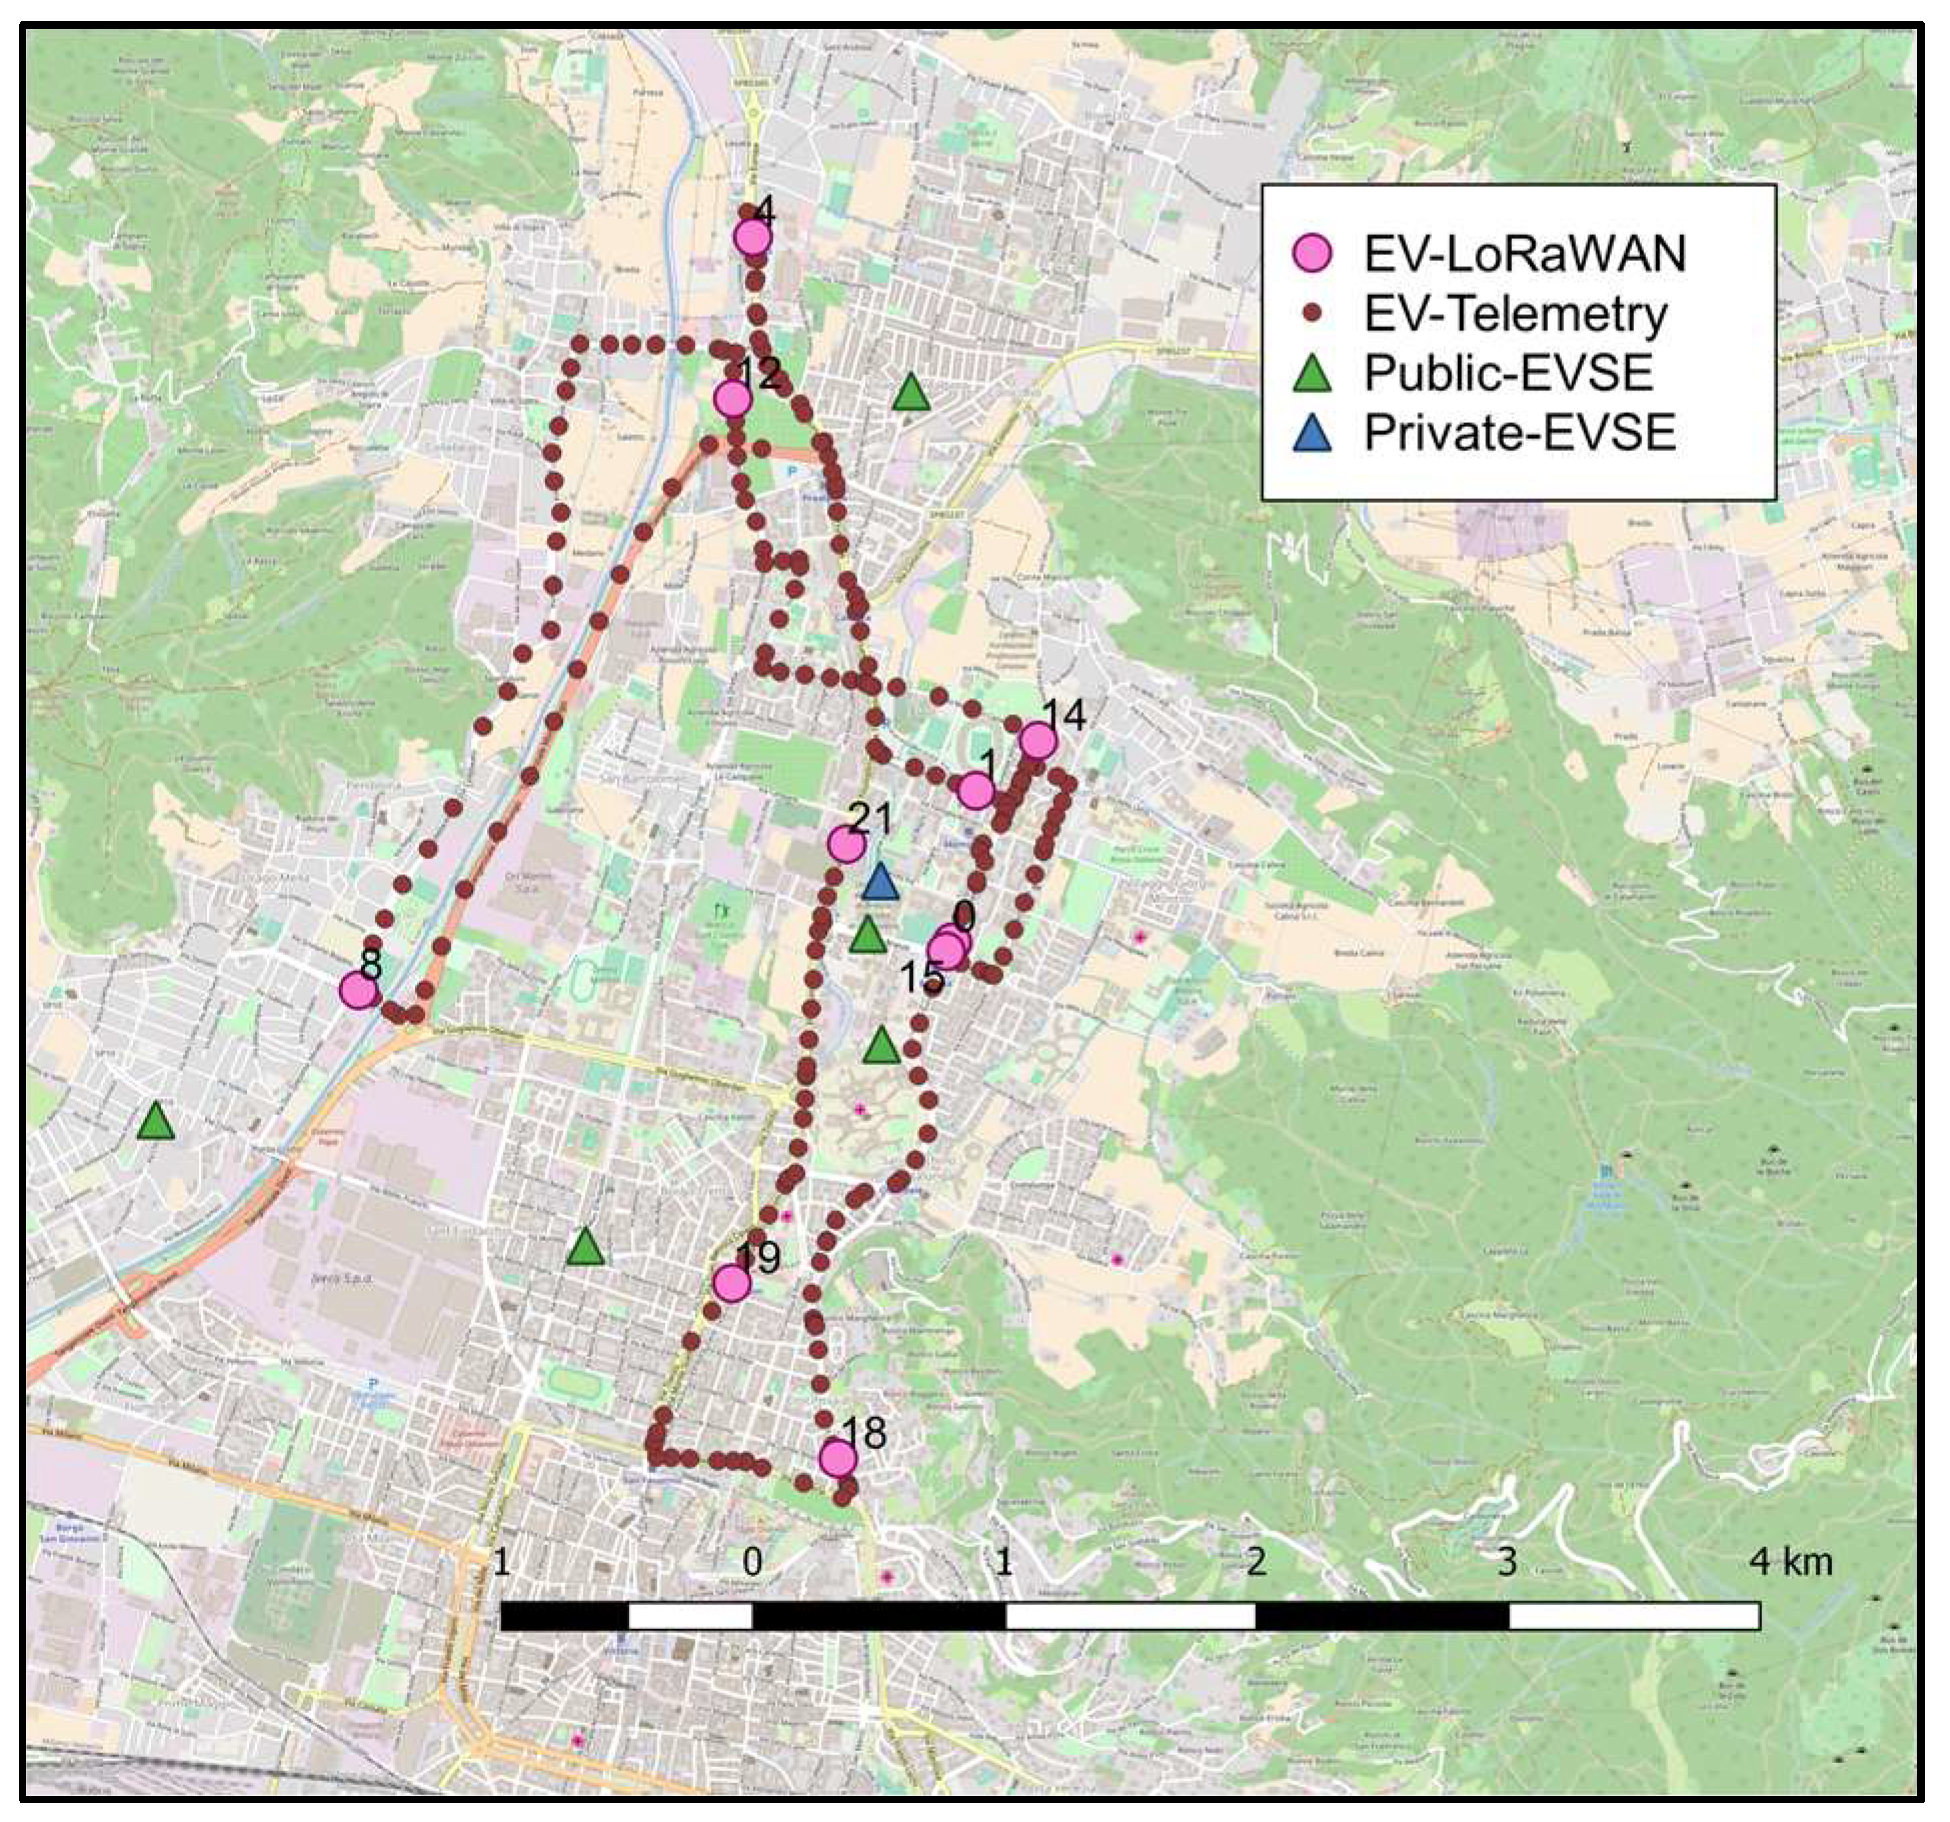
The experimental test was carried out by driving the EV on a predefined route, corresponding to a typical trip in an urban area. The data transmitted by the LoRa modem have been reported in the following figures, which show the georeferenced data about the SOC, the average speed, and the distance travelled by the EV, as depicted in Figure 12, Figure 13 and Figure 14, respectively.
The data transmitted by the LoRa modem have been represented by means of a Geographic Information System (GIS). In this study, QGIS [57] has been used to represent and interpret the information gathered by the LoRaWAN infrastructure. Each of the points depicted in the GIS maps represents a set of information transmitted by the EV at the specified geographical coordinates. As already mentioned in the previous section, the LoRa modem was configured to transmit the information recovered by the EV-DL every 5 min, while single samples were logged by the EV-DL with a higher granularity, i.e., every 1 s. Such information was downloaded at the end of the experiment, and then displayed on the maps for sake of clarity.

7. Conclusions

In this paper, the communication requirements for the demand-side management (DSM) of electric vehicles (EVs) in urban environments have been discussed, by focusing on the mobile communication among EVs and smart grids. Based on the analysis of the information provided by the literature on the matter, the interaction among EVs and power grids has been discussed, by mainly focusing on the DSM schemes proposed for the smart charging of EVs, and on the vehicle-to-grid (V2G) concept.
Four main operation and management objectives have been identified and discussed, namely: the medium-term operational planning, the day-ahead optimal scheduling, the intraday optimal scheduling, and the real-time emergency grid control. For each of the aforementioned scenarios, the communication requirements for the application of V2G DSM schemes have been analyzed in detail, by defining the required volume of data, the related refresh time intervals, and the type of communication, i.e., if the data exchange is required when EV is in motion, or if it can be performed when the EV is connected or close to EV Supply Equipment (EVSE). Starting from this analysis, a specific system architecture for the intraday DSM of EVs moving inside urban areas has been introduced and discussed in terms of the required data throughput.
A new entity, namely the EV Mobile Service Provider (EV-MSP), has been proposed, who is responsible for the bidirectional communication with EVs, and provides communication services to EV aggregators, such as the monitoring of EV data, the provisioning of EVSE information and demand response (DR) requests to EV users, and of the related DR replies. Based on the aforementioned system architecture, a detailed data exchange procedure has been proposed, by defining the content and size of the transmitted information, as well as the required refresh time intervals. Three main functions have been identified and described, namely: the EV monitoring, the provisioning of EVSE information to EV users, and the management of V2G DR requests. The data throughput of each function has been also estimated, concluding that up to 0.103 B/s is required for the EV monitoring, for each monitored EV, while up to 0.15 B/s is required for the provisioning of EVSE information to EV users, for each monitored EV charging station (EVCS). In addition, it has been estimated that the required data throughput for the management of V2G DR requests is on the order of 0.016 B/s per each monitored EV, and of 0.028 B/s per each monitored EVCS.
Subsequently, the use of a Low-Power Wide-Area Network (LPWAN) for the mobile communication among EVs and aggregators in intraday V2G DSM applications has been proposed as possible alternative or viable complement to existing cellular-like solutions, by suggesting the application of a commercially available technology, i.e., LoRaWAN. A specific communication architecture based on the LoRaWAN technology has been proposed, and its scalability has been discussed, based on the communication requirements defined in the aforementioned V2G DSM data exchange procedure. The results showed that, in the proposed solution, each LoRa base station is able to serve up to 438 EVs and 1408 EVSE. In addition, if a maximum traffic density of 400 EV/km2 is considered, the minimum number of LoRa base stations required to serve all the EVs moving inside the urban area resulted to be on the order of one cell per square km, i.e., equal to 0.91 cell/km2.
Finally, the feasibility of the proposed V2G LPWAN solution has been demonstrated within an existing LoRaWAN infrastructure, by driving a commercial EV, equipped with an experimental data logger and a Mbed SX 1272 LoRa modem, in an urban area of about 20 km2, and by transmitting the data about the State Of Charge (SOC) of the EV batteries, the Identification (ID) code of the vehicle, the ID code of the user, the geographic coordinates of the EV, and the acquisition timestamp of measurements.

Author Contributions

E.S. and A.F. conceived the application of the LoRaWAN technology for the mobile communication among EVs and smart grids. M.P. provided the theoretical background of the study, by describing the existing EV power supply infrastructures and the DSM strategies for the integration of EVs in smart grids, and then discussed the related communication requirements. E.S. and M.P. conceived the system architecture, and the related data exchange procedure for V2G intraday DSM applications. P.F. and E.S. introduced the LoRaWAN technology and discussed the communication infrastructure of the proposed LPWAN solution. S.R., F.B., and M.R. prepared the experimental set-up and provided the results of the experiments. All the authors contributed to the writing and revising of the manuscript.

Acknowledgments

This research activity has been partially funded by the Italian Ministry of Education, University, and Research (MIUR, Rome, Italy), under the research grant SCN00416 “BSL—Brescia Smart Living: Integrated energy and services for the enhancement of the welfare”, and by the University of Brescia, as part of the research activities of the “energy Laboratory as University eXpo—eLUX”. The authors would also like to thank A2A Smart City, who provided the access to the LoRaWAN infrastructure which has been used during the experimental campaign.

Conflicts of Interest

The authors declare no conflict of interest.

References

  1. Beretta, G.P. World energy consumption and resources: An outlook for the rest of the century. Int. J. Environ. Technol. Manag. 2007, 7, 99–112. [Google Scholar] [CrossRef]
  2. Intergovernmental Panel on Climate Change (IPCC). Climate Change 2014: Mitigation of Climate Change. Contribution of Working Group III to the Fifth Assessment Report of the Intergovernmental Panel on Climate Change; Edenhofer, O., Pichs-Madruga, R., Sokona, Y., Farahani, E., Kadner, S., Seyboth, K., Adler, A., Baum, I., Brunner, S., Eickemeier, P., et al., Eds.; Cambridge University Press: Cambridge, UK, 2014; ISBN 9781107415416. [Google Scholar]
  3. Fraile-Ardanuy, J.; Castano-Solis, S.; Álvaro-Hermana, R.; Merino, J.; Castillo, Á. Using mobility information to perform a feasibility study and the evaluation of spatio-temporal energy demanded by an electric taxi fleet. Energy Convers. Manag. 2018, 157, 59–70. [Google Scholar] [CrossRef]
  4. Morganti, E.; Browne, M. Technical and operational obstacles to the adoption of electric vans in France and the UK: An operator perspective. Transp. Policy 2018, 63, 90–97. [Google Scholar] [CrossRef]
  5. Onat, N.C.; Kucukvar, M.; Tatari, O. Conventional, hybrid, plug-in hybrid or electric vehicles? State-based comparative carbon and energy footprint analysis in the United States. Appl. Energy 2015, 150, 36–49. [Google Scholar] [CrossRef]
  6. Ferrero, E.; Alessandrini, S.; Balanzino, A. Impact of the electric vehicles on the air pollution from a highway. Appl. Energy 2016, 169, 450–459. [Google Scholar] [CrossRef]
  7. Buekers, J.; Van Holderbeke, M.; Bierkens, J.; Panis, L.I. Health and environmental benefits related to electric vehicle introduction in EU countries. Transp. Res. Part D Transp. Environ. 2014, 33, 26–38. [Google Scholar] [CrossRef]
  8. Shareef, H.; Islam, M.M.; Mohamed, A. A review of the stage-of-the-art charging technologies, placement methodologies, and impacts of electric vehicles. Renew. Sustain. Energy Rev. 2016, 64, 403–420. [Google Scholar] [CrossRef]
  9. International Energy Agency (IEA). Global EV Outlook 2017: Two Million and Counting; IEA: Washington, DC, USA, June 2017. [Google Scholar]
  10. Dominković, D.F.; Bačeković, I.; Pedersen, A.S.; Krajačić, G. The future of transportation in sustainable energy systems: Opportunities and barriers in a clean energy transition. Renew. Sustain. Energy Rev. 2018, 82, 1823–1838. [Google Scholar] [CrossRef]
  11. Habib, S.; Kamran, M.; Rashid, U. Impact analysis of vehicle-to-grid technology and charging strategies of electric vehicles on distribution networks—A review. J. Power Sources 2015, 277, 205–214. [Google Scholar] [CrossRef]
  12. Mahmud, K.; Town, G.E.; Morsalin, S.; Hossain, M.J. Integration of electric vehicles and management in the internet of energy. Renew. Sustain. Energy Rev. 2018, 82, 4179–4203. [Google Scholar] [CrossRef]
  13. Godina, R.; Paterakis, N.G.; Erdinç, O.; Rodrigues, E.M.G.; Catalão, J.P.S. Impact of EV charging-at-work on an industrial client distribution transformer in a Portuguese Island. In Proceedings of the Australasian Universities Power Engineering Conference (AUPEC), Wollongong, Australia, 27–30 September 2015; IEEE: Wollongong, Australia, 2016. [Google Scholar]
  14. Rahman, I.; Vasant, P.M.; Singh, B.S.M.; Abdullah-Al-Wadud, M.; Adnan, N. Review of recent trends in optimization techniques for plug-in hybrid, and electric vehicle charging infrastructures. Renew. Sustain. Energy Rev. 2016, 58, 1039–1047. [Google Scholar] [CrossRef]
  15. Liu, L.; Kong, F.; Liu, X.; Peng, Y.; Wang, Q. A review on electric vehicles interacting with renewable energy in smart grid. Renew. Sustain. Energy Rev. 2015, 51, 648–661. [Google Scholar] [CrossRef]
  16. Tan, K.M.; Ramachandaramurthy, V.K.; Yong, J.Y. Integration of electric vehicles in smart grid: A review on vehicle to grid technologies and optimization techniques. Renew. Sustain. Energy Rev. 2016, 53, 720–732. [Google Scholar] [CrossRef]
  17. Schuller, A. Charging coordination paradigms of electric vehicles. Power Syst. 2015, 88. [Google Scholar] [CrossRef]
  18. Ziekow, H.; Goebel, C.; Strüker, J.; Jacobsen, H.A. The potential of smart home sensors in forecasting household electricity demand. In Proceedings of the International Conference on Smart Grid Communications (SmartGridComm), Vancouver, BC, Canada, 21–24 October 2013; pp. 229–234. [Google Scholar] [CrossRef]
  19. Hu, J.; Morais, H.; Sousa, T.; Lind, M. Electric vehicle fleet management in smart grids: A review of services, optimization and control aspects. Renew. Sustain. Energy Rev. 2016, 56, 1207–1226. [Google Scholar] [CrossRef] [Green Version]
  20. Rinaldi, S.; Pasetti, M.; Ferrari, P.; Massa, G.; Della Giustina, D. Experimental characterization of communication infrastructure for virtual power plant monitoring. In Proceedings of the IEEE International Workshop on Applied Measurements for Power Systems (AMPS), Aachen, Germany, 28–30 September 2016; IEEE: Aachen, Germany, 2016; pp. 1–6. [Google Scholar]
  21. Rinaldi, S.; Della Giustina, D.; Ferrari, P.; Flammini, A.; Sisinni, E. Time synchronization over heterogeneous network for smart grid application: Design and characterization of a real case. Ad Hoc Netw. 2016, 50, 41–57. [Google Scholar] [CrossRef]
  22. Mwasilu, F.; Justo, J.J.; Kim, E.-K.; Do, T.D.; Jung, J.-W. Electric vehicles and smart grid interaction: A review on vehicle to grid and renewable energy sources integration. Renew. Sustain. Energy Rev. 2014, 34, 501–516. [Google Scholar] [CrossRef]
  23. Kiokes, G.; Zountouridou, E.; Papadimitriou, C.; Dimeas, A.; Hatziargyriou, N. Development of an Integrated Wireless Communication System for Connecting Electric Vehicles to the Power Grid. In Proceedings of the International Symposium on Smart Electric Distribution Systems and Technologies (EDST), Vienna, Austria, 8–11 September 2015; IEEE: Vienna, Austria, 2015; pp. 296–301. [Google Scholar]
  24. Siegel, J.E.; Erb, D.C.; Sarma, S.E. A Survey of the Connected Vehicle Landscape—Architectures, Enabling Technologies, Applications, and Development Areas. IEEE Trans. Intell. Transp. Syst. 2017, 1–16. [Google Scholar] [CrossRef]
  25. Saltanovs, R.; Krivchenkov, A.; Krainyukov, A. Analysis of effective wireless communications for V2G applications and mobile objects. In Proceedings of the 58th International Scientific Conference on Power and Electrical Engineering of Riga Technical University (RTUCON), Riga, Latvia, 12–13 October 2017; IEEE: Riga, Latvia, 2017. [Google Scholar]
  26. Rizzi, M.; Ferrari, P.; Flammini, A.; Sisinni, E.; Gidlund, M. Using LoRa for industrial wireless networks. In Proceedings of the IEEE International Workshop on Factory Communication Systems (WFCS), Trondheim, Norway, 31 May–2 June 2017; IEEE: Trondheim, Norway, 2017. [Google Scholar]
  27. Wang, L.; Sharkh, S.; Chipperfield, A. Optimal decentralized coordination of electric vehicles and renewable generators in a distribution network using A∗ search. Int. J. Electr. Power Energy Syst. 2018, 98, 474–487. [Google Scholar] [CrossRef]
  28. Bahramara, S.; Golpîra, H. Robust optimization of micro-grids operation problem in the presence of electric vehicles. Sustain. Cities Soc. 2018, 37, 388–395. [Google Scholar] [CrossRef]
  29. Ul-Haq, A.; Cecati, C.; El-Saadany, E. Probabilistic modeling of electric vehicle charging pattern in a residential distribution network. Electr. Power Syst. Res. 2018, 157, 126–133. [Google Scholar] [CrossRef]
  30. Mureddu, M.; Facchini, A.; Scala, A.; Caldarelli, G.; Damiano, A. A Complex Network Approach for the Estimation of the Energy Demand of Electric Mobility. Sci. Rep. 2018, 8, 1–8. [Google Scholar] [CrossRef] [PubMed]
  31. Shao, C.; Wang, X.; Shahidehpour, M.; Wang, X.; Wang, B. Partial Decomposition for Distributed Electric Vehicle Charging Control Considering Electric Power Grid Congestion. IEEE Trans. Smart Grid 2017, 8, 75–83. [Google Scholar] [CrossRef]
  32. Morshed, M.J.; Hmida, J.B.; Fekih, A. A probabilistic multi-objective approach for power flow optimization in hybrid wind-PV-PEV systems. Appl. Energy 2018, 211, 1136–1149. [Google Scholar] [CrossRef]
  33. Zhu, J.; Jiang, P.; Gu, W.; Sheng, W.; Meng, X.; Gao, J. Finite Action-Set Learning Automata for Economic Dispatch Considering Electric Vehicles and Renewable Energy Sources. Energies 2014, 7, 4629–4647. [Google Scholar] [CrossRef]
  34. Wei, Z.; Li, Y.; Zhang, Y.; Cai, L. Intelligent parking garage EV charging scheduling considering battery charging characteristic. IEEE Trans. Ind. Electron. 2018, 65, 2806–2816. [Google Scholar] [CrossRef]
  35. Ji, Z.; Huang, X.; Xu, C.; Sun, H. Accelerated Model Predictive Control for Electric Vehicle Integrated Microgrid Energy Management: A Hybrid Robust and Stochastic Approach. Energies 2016, 9, 973. [Google Scholar] [CrossRef]
  36. Milanés-Montero, M.I.; Martínez, M.A.G.; González-Romera, E.; Romero-Cadaval, E.; Barrero-González, F. Active and Reactive Power Control Strategies for Electric Vehicles in Smart Grids. In Proceedings of the 10th International Conference on Compatibility, Power Electronics and Power Engineering (CPE-POWERENG), Bydgoszcz, Poland, 29 June–1 July 2016; pp. 114–119. [Google Scholar]
  37. Knezović, K.; Martinenas, S.; Andersen, P.B.; Zecchino, A.; Marinelli, M. Enhancing the Role of Electric Vehicles in the Power Grid: Field Validation of Multiple Ancillary Services. IEEE Trans. Transp. Electr. 2017, 3, 201–209. [Google Scholar] [CrossRef]
  38. Cheng, Y.-H.; Lai, C.-M. Control Strategy Optimization for Parallel Hybrid Electric Vehicles Using a Memetic Algorithm. Energies 2017, 10, 305. [Google Scholar] [CrossRef]
  39. Peng, J.; Fan, H.; He, H.; Pan, D. A rule-based energy management strategy for a plug-in hybrid school bus based on a controller area network bus. Energies 2015, 8, 5122–5142. [Google Scholar] [CrossRef]
  40. Gellings, C.W. The Concept of Demand-Side Management for Electric Utilities. Proc. IEEE 1985, 73, 1468–1470. [Google Scholar] [CrossRef]
  41. Gelazanskas, L.; Gamage, K.A.A. Demand side management in smart grid: A review and proposals for future direction. Sustain. Cities Soc. 2014, 11, 22–30. [Google Scholar] [CrossRef]
  42. Vardakas, J.S.; Zorba, N.; Verikoukis, C.V. A Survey on Demand Response Programs in Smart Grids: Pricing Methods and Optimization Algorithms. IEEE Commun. Surv. Tutor. 2015, 17, 152–178. [Google Scholar] [CrossRef]
  43. Siano, P. Demand response and smart grids—A survey. Renew. Sustain. Energy Rev. 2014, 30, 461–478. [Google Scholar] [CrossRef]
  44. Pasetti, M.; Rinaldi, S.; Manerba, D. A Virtual Power Plant Architecture for the Demand-Side Management of Smart Prosumers. Appl. Sci. 2018, 8, 432. [Google Scholar] [CrossRef]
  45. Yong, J.Y.; Ramachandaramurthy, V.K.; Tan, K.M.; Mithulananthan, N. A review on the state-of-the-art technologies of electric vehicle, its impacts and prospects. Renew. Sustain. Energy Rev. 2015, 49, 365–385. [Google Scholar] [CrossRef]
  46. Pahwa, A.; DeLoach, S.A.; Natarajan, B.; Das, S.; Malekpour, A.R.; Shafiul Alam, S.M.; Case, D.M. Goal-Based Holonic Multiagent System for Operation of Power Distribution Systems. IEEE Trans. Smart Grid 2015, 6, 2510–2518. [Google Scholar] [CrossRef]
  47. Rinaldi, S.; Pasetti, M.; Trioni, M.; Vivacqua, G. On the Integration of E-Vehicle Data for Advanced Management of Private Electrical Charging Systems. In Proceedings of the IEEE International Instrumentation and Measurement Technology Conference (I2MTC), Turin, Italy, 22–25 May 2017; IEEE: Turin, Italy, 2017. [Google Scholar]
  48. Yasmin, R.; Petäjäjärvi, J.; Mikhaylov, K.; Pouttu, A. On the Integration of LoRaWAN with the 5G Test Network. In Proceedings of the 28th Annual International Symposium on Personal, Indoor, and Mobile Radio Communications (PIMRC), Montreal, QC, Canada, 8–13 October 2017; IEEE: Montreal, QC, Canada, 2017. [Google Scholar]
  49. Navarro-Ortiz, J.; Sendra, S.; Ameigeiras, P.; Lopez-Soler, J.M. Integration of LoRaWAN and 4G/5G for the Industrial Internet of Things. IEEE Commun. Mag. 2018, 56, 60–67. [Google Scholar] [CrossRef]
  50. Adelantado, F.; Vilajosana, X.; Tuset-Peiro, P.; Martinez, B.; Melia-Segui, J.; Watteyne, T. Understanding the Limits of LoRaWAN. IEEE Commun. Mag. 2017, 55, 34–40. [Google Scholar] [CrossRef]
  51. Bankov, D.; Khorov, E.; Lyakhov, A. On the limits of LoRaWAN channel access. In Proceedings of the International Conference on Engineering and Telecommunication (EnT), Moscow, Russia, 29–30 November 2016; IEEE: Moscow, Russia, 2017; pp. 10–14. [Google Scholar]
  52. Van Den Abeele, F.; Haxhibeqiri, J.; Moerman, I.; Hoebeke, J. Scalability Analysis of Large-Scale LoRaWAN Networks in ns-3. IEEE Internet Things J. 2017, 4, 2186–2198. [Google Scholar] [CrossRef]
  53. Mikhaylov, K.; Petäjäjärvi, J.; Hänninen, T. Analysis of Capacity and Scalability of the LoRa Low Power Wide Area Network Technology. In Proceedings of the European Wireless 2016, Oulu, Finland, 18–20 May 2016; IEEE: Oulu, Finland, 2016; pp. 119–124. [Google Scholar]
  54. Hall, D.; Lutsey, N. Emerging Best Practices for Electric Vehicle Charging Infrastructure; The International Council on Clean Transportation (ICCT): Washington, DC, USA, 2017. [Google Scholar]
  55. Sanguesa, J.A.; Naranjo, F.; Torres-Sanz, V.; Fogue, M.; Garrido, P.; Martinez, F.J. On the Study of Vehicle Density in Intelligent Transportation Systems. Mob. Inf. Syst. 2016, 2016, 8320756. [Google Scholar] [CrossRef]
  56. A2A Smart City. Available online: http://www.a2asmartcity.io (accessed on 19 April 2018).
  57. QGIS Development Team QGIS Geographic Information System. Available online: https://www.qgis.org (accessed on 16 February 2018).
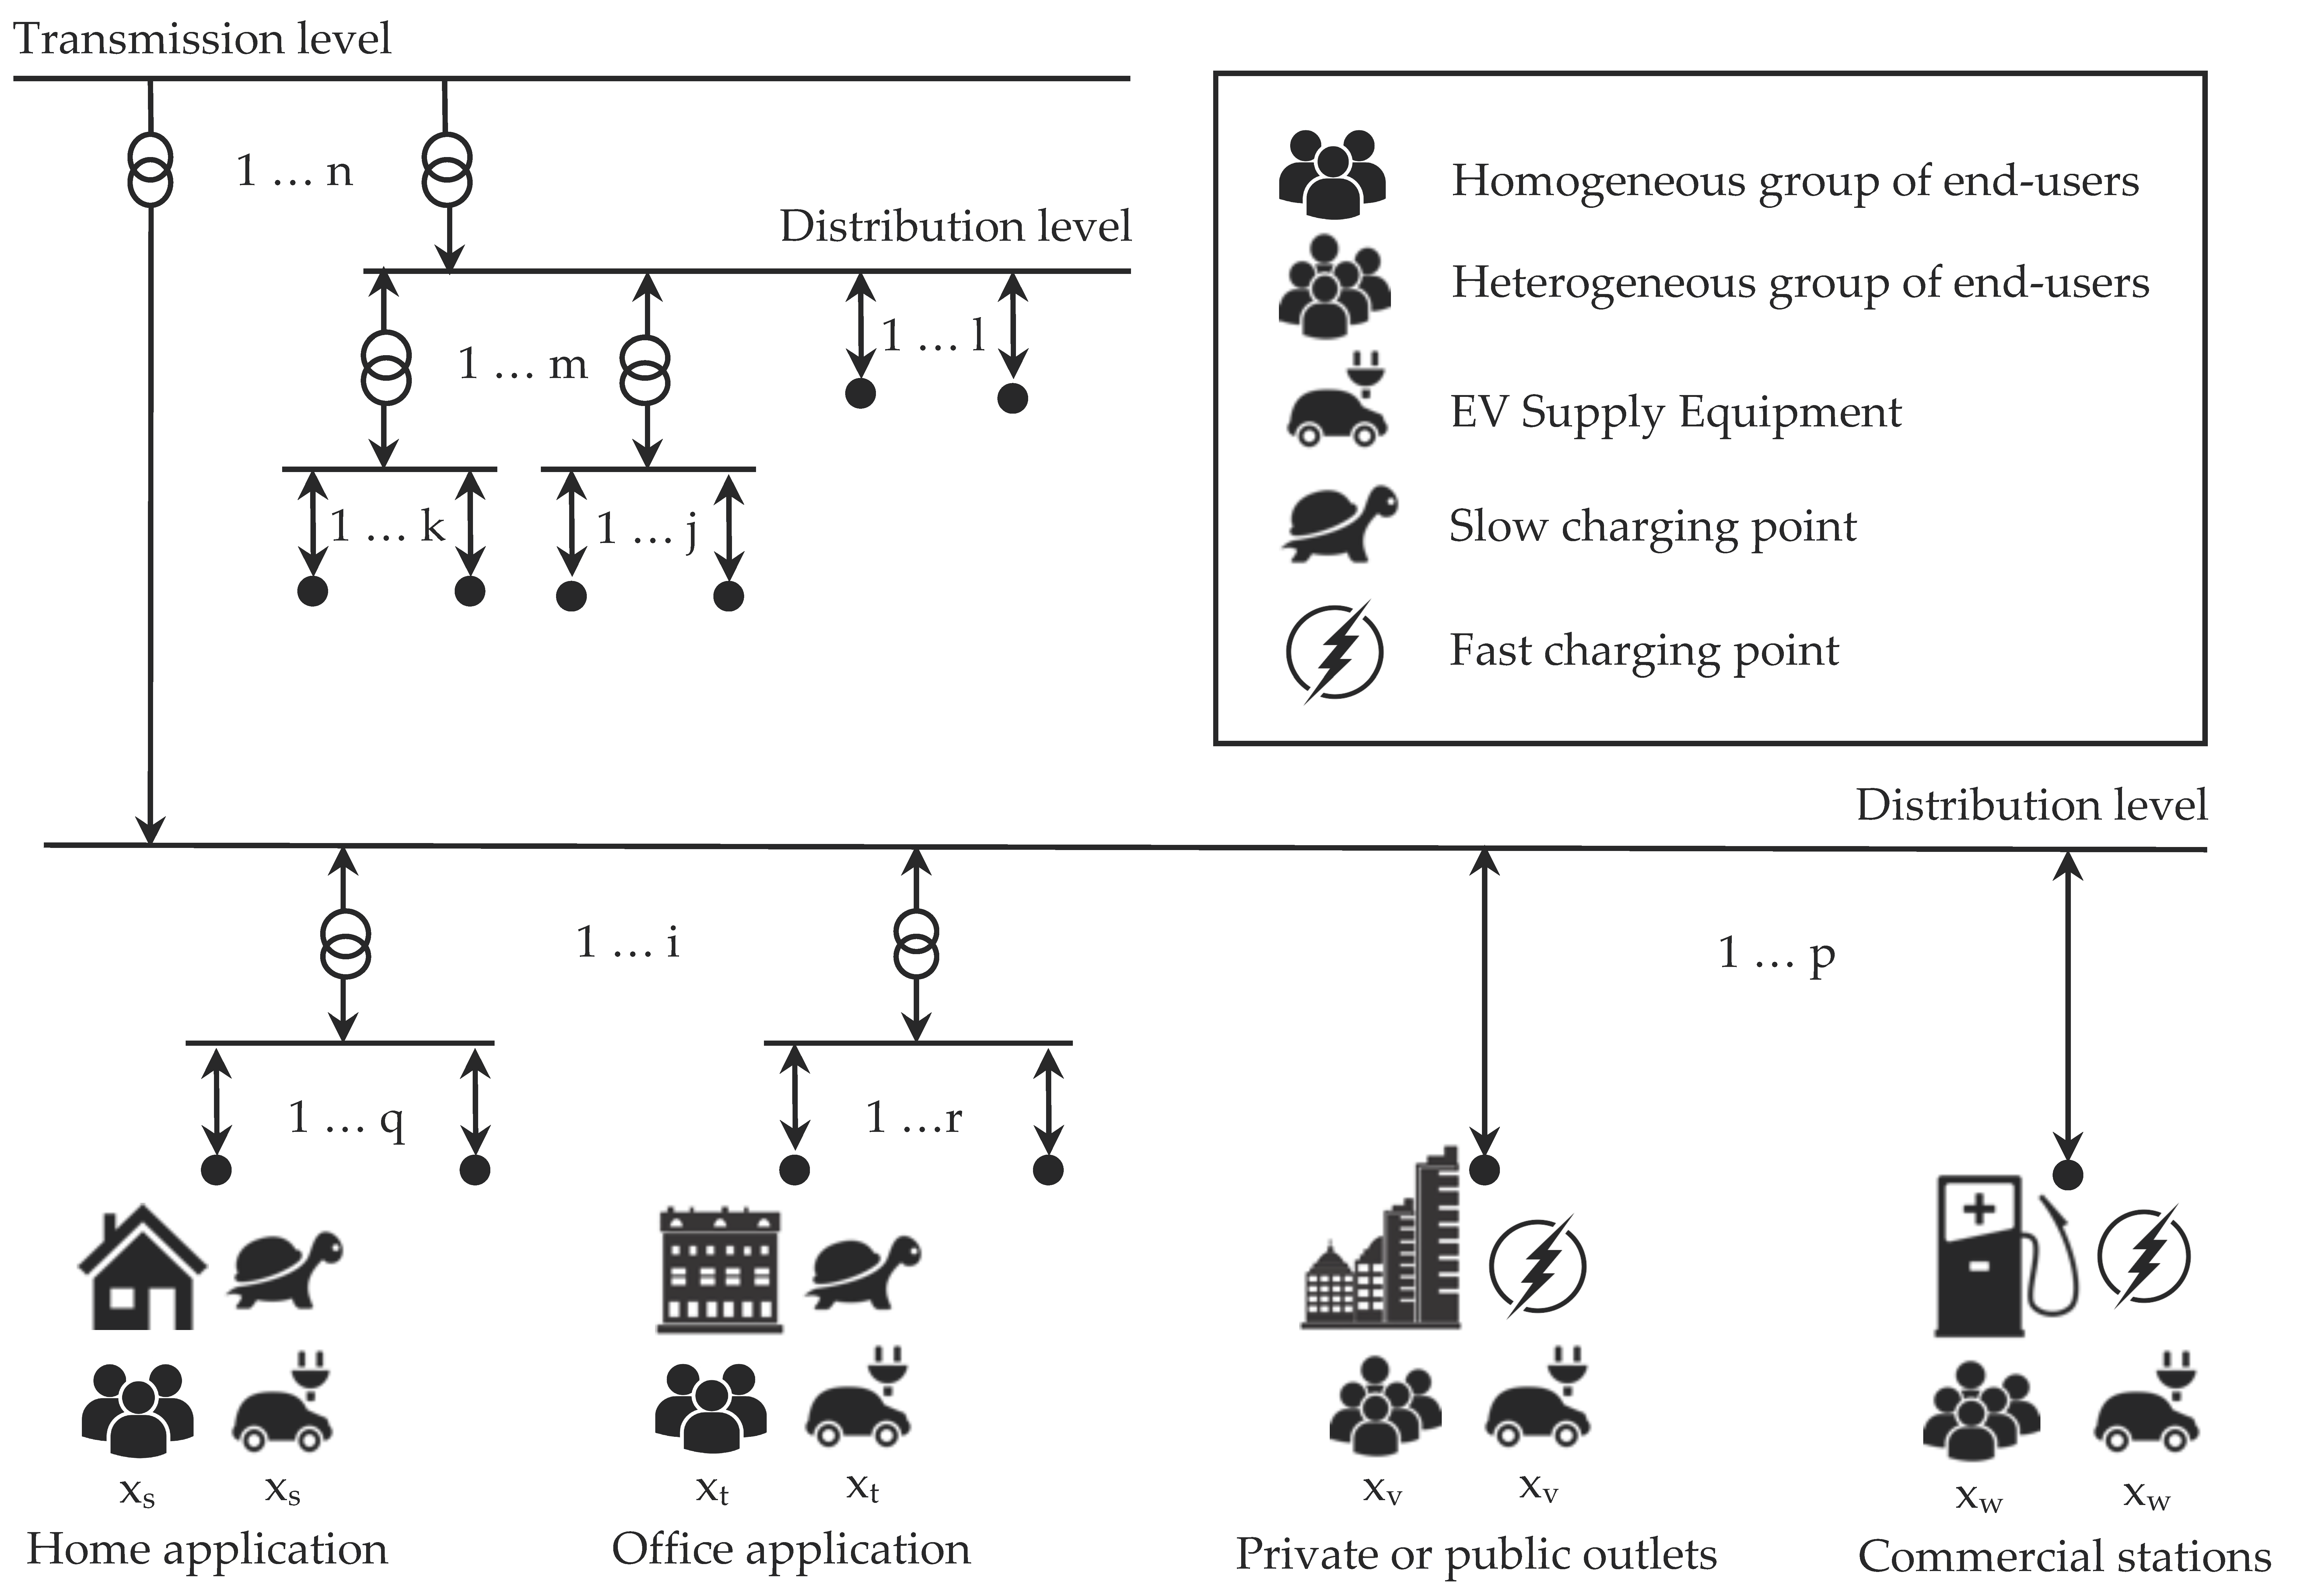
Figure 1. Schematic representation of the type of charging systems, and of their typical use and interaction within electric distribution networks. EV: Electric Vehicle.
Energies 11 01220 g001
Figure 2. Schematic representation of the main objectives of smart charging strategies.
Energies 11 01220 g002
Figure 3. Classification of Demand Response (DR) programs in smart grids, according to the party that initiates the demand reduction action [44].
Energies 11 01220 g003
Figure 4. Schematic representation of the price-based control scheme in V2G Demand-Side Management (DSM) applications. EV: Electric Vehicle, EVSE: EV Supply Equipment.
Energies 11 01220 g004
Figure 5. Schematic representation of the transactive control scheme in Vehicle-to-Grid (V2G) DSM applications. DR: Demand Response, EV: Electric Vehicle, EVSE: EV Supply Equipment.
Energies 11 01220 g005
Figure 6. Schematic representation of the communication requirements of DSM schemes for smart charging applications. EV: Electric Vehicle, EVSE: EV Supply Equipment, ID: Identification, SOC: State Of Charge, DR: Demand Response, PLP: Peak Load Pricing, DA-RTP: Day-Ahead Real-Time Pricing, CPP: Critical Peak Pricing, RTP: Real-Time Pricing, ICL: Interruptible/Curtailable Load, CMP: Capacity Market Program, DLC: Direct Load Control, EDRP: Emergency DR Program, TOU: Time-Of-Use, PTR: Peak Time Rebates.
Energies 11 01220 g006
Figure 7. Schematic representation of the proposed system architecture for the provisioning of V2G mobile communication services among aggregators and EV users. EV: Electric Vehicle.
Energies 11 01220 g007
Figure 8. The LoRaWAN network architecture. NS: Network Server, AS: Application Server.
Energies 11 01220 g008
Figure 9. Schematic diagram of the LoRaWAN message fields. SFD: Start of Frame Delimiter, PHY: Physical Layer, CRC: Cyclic Redundancy Check, MAC: Medium Access Control, MIC: Message Integrity Code.
Energies 11 01220 g009
Figure 10. The test EV (Renault Zoe R240) and the private EVSE (provided by Ducati Energia) involved in the experimental characterization. EV: Electric Vehicle, EVSE: EV Supply Equipment.
Energies 11 01220 g010
Figure 11. The prototype of the experimental data logger used to test the mobile communication among the EV and the LoRaWAN infrastructure of A2A Smart City. The data logger recovers the telemetry data from the OBD device installed on the EV bus and transmits the required information through a LoRa modem. EV: Electric Vehicle, OBD: On-Board Diagnostic.
Energies 11 01220 g011
Figure 12. The georeferenced State of Charge (SOC) of the EV, expressed as percentage of the net battery capacity. The yellow circles represent the value of the SOC transmitted to the LoRaWAN infrastructure every 5 min, while the red circles represent the value of the SOC recorded by the on-board telemetry system every 1 s. The experiment was carried out in the city of Brescia, north part of Italy. EV: Electric Vehicle, EVSE: EV Supply Equipment.
Energies 11 01220 g012
Figure 13. The georeferenced average speed (km/h) of the EV. The pink circles represent the value of the average speed of the EV estimated from the geographical coordinates transmitted to the LoRaWAN infrastructure every 5 min, while the red circles represent the speed of the EV recorded by the on-board telemetry system every 1 s. The experiment was carried out in the city of Brescia, north part of Italy. EV: Electric Vehicle, EVSE: EV Supply Equipment.
Energies 11 01220 g013
Figure 14. The georeferenced distance (km) travelled by the EV. The pink circles represent the value of the total distance travelled by the EV during the test, estimated from the geographical coordinates transmitted every 5 min, while the red circles represent the measured value recorded by the on-board telemetry system every 1 s. The experiment was carried out in the city of Brescia, north part of Italy. EV: Electric Vehicle, EVSE: EV Supply Equipment.
Energies 11 01220 g014
Table 1. Classification of electric vehicles charging systems according to the SAE standard J1772 [8].
SAE LevelAC/DC Power ConverterMaximum AC Power Supplied to EVSE (kW)Charging Speed LevelTypical Use
AC Level 1On-board1.44 ÷ 1.92/single-phaseslowHome or office
AC Level 2On-board7.7/single-phaseslowPrivate or public
25.6/three-phasefast
DC Level 1Off-board13.3 ÷ 38.4/three-phasefastPublic or commercial
DC Level 2Off-board33.3 ÷ 96/three-phasefastPublic or commercial
Table 2. List of information packed into each data sample transferred by the EV to the EV-MSP for EV monitoring applications. EV: Electric Vehicle, EV-MSP: EV Mobile Service Provider.
InformationResolutionSize (bit)
Timestamp of the set of information1 s38
Identification code of the EV-32
Identification code of the EV model-20
Identification code of the EV user-32
Current GPS position of the EV11 m43
Current state of charge of EV on-board batteries1%7
GPS position of the planned destination (if available)11 m43
Estimated time of arrival at the destination (if available)1 min32
Table 3. List of information packed into each data sample transferred by the EV-MSP to EVs for EVSE monitoring applications, per each monitored charging station. EV: Electric Vehicle, EV-MSP: EV Mobile Service Provider, EVSE: EV Supply Equipment, AC: Alternating Current, DC: Direct Current.
InformationResolutionSize (bit)
Timestamp of the set of information1 s38
Identification code of the charging station-32
GPS position of the charging station11 m43
Number of available slow AC Level 2 EVSE within the next 3 h * 60
Number of available fast AC Level 2 EVSE within the next 3 h *-60
Number of available DC Level 1 EVSE within the next 3 h *-60
Number of available DC Level 2 EVSE within the next 3 h *-60
* With a granularity of 15 min, assuming a maximum of 32 monitored EVSE per each level.
Table 4. List of information packed into each data sample transferred by the EV-MSP to EVs for the application of Vehicle-to-Grid (V2G) DR requests, per each monitored charging station. EV: Electric Vehicle, EV-MSP: EV Mobile Service Provider, V2G: Vehicle-to-Grid, DR: Demand Response.
InformationResolutionSize (bit)
Identification code of the DR signal-32
Price profile over the next 3 h *1 € cent/kWh72
Power limitation profile over the next 3 h *1 kW84
Value of the incentive related to the power limitation DR request1 € cent12
* With a granularity of 15 min.
Table 5. List of information packed into each data sample transferred by the EV to the EV-MSP as reply to V2G DR requests. EV: Electric Vehicle, EV-MSP: EV Mobile Service Provider, V2G: Vehicle-to-Grid, DR: Demand Response, ETA: Estimated Time of Arrival, ETD: Estimated Time of Departure.
InformationResolutionSize (bit)
Identification code of the DR signal-32
EVSE booking request: ETA *1 min32
EVSE booking request: ETD *1 min32
EVSE booking request: total amount of required energy *0.1 kWh10
Acceptance of the power limitation defined by the DR request-1
* If available.
Table 6. Capacity of a single LoRa base station (reported as number of allowed motes per channel) corresponding to one uplink message of 49 B, and eleven consecutive downlink messages of 67 B each, with a Coding Rate value CR of 4/5. EU regional specifications have been considered.
Communication ParametersAverage Message Duration (TOA)Cell Capacity
Per Channel *
Cell Capacity Per Channel
(Pure ALOHA Access)
SF = 7, B = 250 kHz726 ms41374
SF = 7, B = 125 kHz1452 ms20637
SF = 8, B = 125 kHz2546 ms11721
SF = 9, B = 125 kHz3720 ms8014
* Under perfect synchronization.