Article

Evolution of Thermoelectric Properties of Zn4Sb3 Prepared by Mechanical Alloying and Different Consolidation Routes

Institute of Materials Engineering, National Taiwan Ocean University, Keelung 202, Taiwan
*
Author to whom correspondence should be addressed.
Energies 2018, 11(5), 1200; https://doi.org/10.3390/en11051200
Submission received: 30 March 2018 / Revised: 4 May 2018 / Accepted: 7 May 2018 / Published: 9 May 2018
(This article belongs to the Special Issue Materials and Devices for Waste Energy Harvesting 2017)

Abstract

:
In this research, a method combining the mechanical alloying with the vacuum sintering or hot pressing was adopted to obtain the compact of β-Zn4Sb3. Pure zinc and antimony powders were used as the starting material for mechanical alloying. These powders were mixed in the stoichiometry ratio of 4 to 3, or more Zn-rich. Single phase Zn4Sb3 was produced using a nominally 0.6 at. % Zn rich powder. Thermoelectric Zn4Sb3 bulk specimens have been fabricated by vacuum sintering or hot pressing of mechanically alloyed powders at various temperatures from 373 to 673 K. For the bulk specimens sintering at high temperature, phase transformation of β-Zn4Sb3 to ZnSb and Sb was observed due to Zn vaporization. However, single-phase Zn4Sb3 bulk specimens with 97.87% of theoretical density were successfully produced by vacuum hot pressing at 473 K. Electric resistivity, Seebeck coefficient, and thermal conductivity were evaluated for the hot pressed specimens from room temperature to 673 K. The results indicate that the Zn4Sb3 shows an intrinsic p-type behavior. The increase of Zn4Sb3 phase ratio can increase Seebeck coefficient but decrease electric conductivity. The maximum power factor and figure of merit (ZT) value were 1.31 × 10⁻³ W/mK2 and 0.81 at 600 K, respectively. The ZT value was lower than that reported in the available data for materials prepared by conventional melt growth and hot pressed methods, but higher than the samples fabricated by vacuum melting and heat treatment techniques.

1. Introduction

Thermoelectric (TE) materials that convert electrical energy into heat can be used to manufacture thermoelectric generators or thermoelectric coolers. The former directly convert heat into electrical energy, while the latter use electrical energy to disperse heat and achieve a cooling effect. For practical applications, the conversion efficiency of TE materials is often characterized according to a TE figure of merit, ZT, which is a dimensionless parameter and is conventionally defined as Equation (1).
ZT = (α2σ/κ)T
where Z is the figure of merit, T represents the absolute temperature, α is the Seebeck coefficient, σ represents electrical conductivity, and κ is total thermal conductivity with contributions from the lattice (κL) and charge carriers (κe). A larger ZT indicates higher energy conversion efficiency in a TE material. Clearly an efficient TE material with high ZT requires high α, high σ, and low κ [1,2]. Using thermoelectric materials in component manufacturing has the following advantages [3]: (1) small size, light weight, and providing localized cooling; (2) precise temperature control up to ±0.001 °C; (3) high reliability, and capability to work in any orientation or under vibration; (4) long service life of up to 200,000 h. Despite these numerous advantages, thermoelectric materials are expensive and their efficiency is smaller than 5%, far less than conventional refrigerators or generators. Therefore, the current applications of thermoelectric materials are limited within some special applications such as military or space flight applications. Improving the efficiency of thermoelectric materials is thus an important research and development issue.
Thermoelectric materials can be classified by its working temperature range: (1) room temperature range, such as Bi-Te alloys; (2) ~400 K, the Pb-Te series; and (3) ~800 K, the Si-Ge series [4,5,6,7,8]. The first type is primarily used as thermoelectric coolers, while the latter two are primarily used as thermoelectric generators. In recent years, many new compounds and alloys have been proposed, including skutterudites, clathrates, half-Heusler alloys, Zn4Sb3, SnSe, GeTe, and AgSbTe2 and some layer-structured compounds [9,10,11,12,13,14,15]. These new materials exhibit higher ZT values at high temperature ranges. Generally, Zn4Sb3 can be prepared in several ways: consolidation of powders either prepared by crushing ingots made by vacuum melting [16,17] or mechanical alloying methods [18], bulk mechanical alloying (BMA) followed by hot pressing [19]. The high defect densities in mechanically alloyed powders are expected to reduce the material’s lattice thermal conductivity, thus improving the efficiency of thermoelectric conversion [20]. Thus, the feasibility to prepare a single β-phase Zn4Sb3 thermoelectric material with a high ZT value was investigated in the present study where bulk Zn4Sb3 alloy was fabricated by combining mechanical alloying with a vacuum sintering or vacuum hot pressing approach.

2. Experimental

In the present study, mechanical alloying (MA) was used to prepare Zn4Sb3 alloy powder. The as-milled powder was then subjected to vacuum sintering or vacuum hot pressing. The as-milled powder, sintered, and hot-pressed specimens were examined by X-ray diffraction (XRD), differential scanning calorimetry (DSC), and scanning electron microscopy (SEM).
The mechanical alloying process used zinc (99.9%, <325 mesh) and antimony (99.5%, <325 mesh) pure elemental powder to synthesize the Zn4Sb3 alloy. Stoichiometric Zn4Sb3 with superfluous Zn powder up to 1.8 at. % was weighed to a total of 4 g. The mixed powder and stainless steel ball (with a powder to ball ratio of 1:5) was then sealed in a glove box under an Ar atmosphere. A SPEX 8000D (SPEX SamplePrep, Metuchen, NJ, USA) shaker ball mill was used to prepare the Zn4Sb3 alloy powder. After 5 h of MA treatment, the as-milled powder was pressed into pellets with a preload pressure of 0.098 GPa and then placed in a vacuum furnace for vacuum sintering at a temperature of 373, 473, 573, and 673 K, respectively. Vacuum hot pressing was performed under the same temperature (i.e., 373, 473, 573, and 673 K) with an applied pressure of 0.49, 0.74, and 0.98 GPa for 15, 30, and 60 min. The actual densities of the fabricated bulk samples were measured by Archimedean method. The level of porosity (%) can be estimated from the theoretical and actual densities. The sample codes and processing parameters for vacuum hot pressing were summarized in Table 1.
X-ray diffraction analysis was conducted using a PANalytical X’Pert Pro (Malvern Panalytical, Malvern, UK) diffractometer. A Dupont 2000 (DuPont, Wilmington, DE, USA) differential scanning calorimeter and a Hitachi S-4800 (Hitachi, Tokyo, Japan) scanning electron microscope were used for DSC and SEM characterization, respectively. The thermoelectric properties were conducted using the ULVAC Zem-3 (ULVAC Technologies, Tokyo, Japan) system to measure the Seebeck coefficient and electrical conductivity. Whereas the thermal conductivity was measured by the ULVAC TC9000 (ULVAC Technologies, Tokyo, Japan) laser flash thermal constant analyzer.

3. Results and Discussion

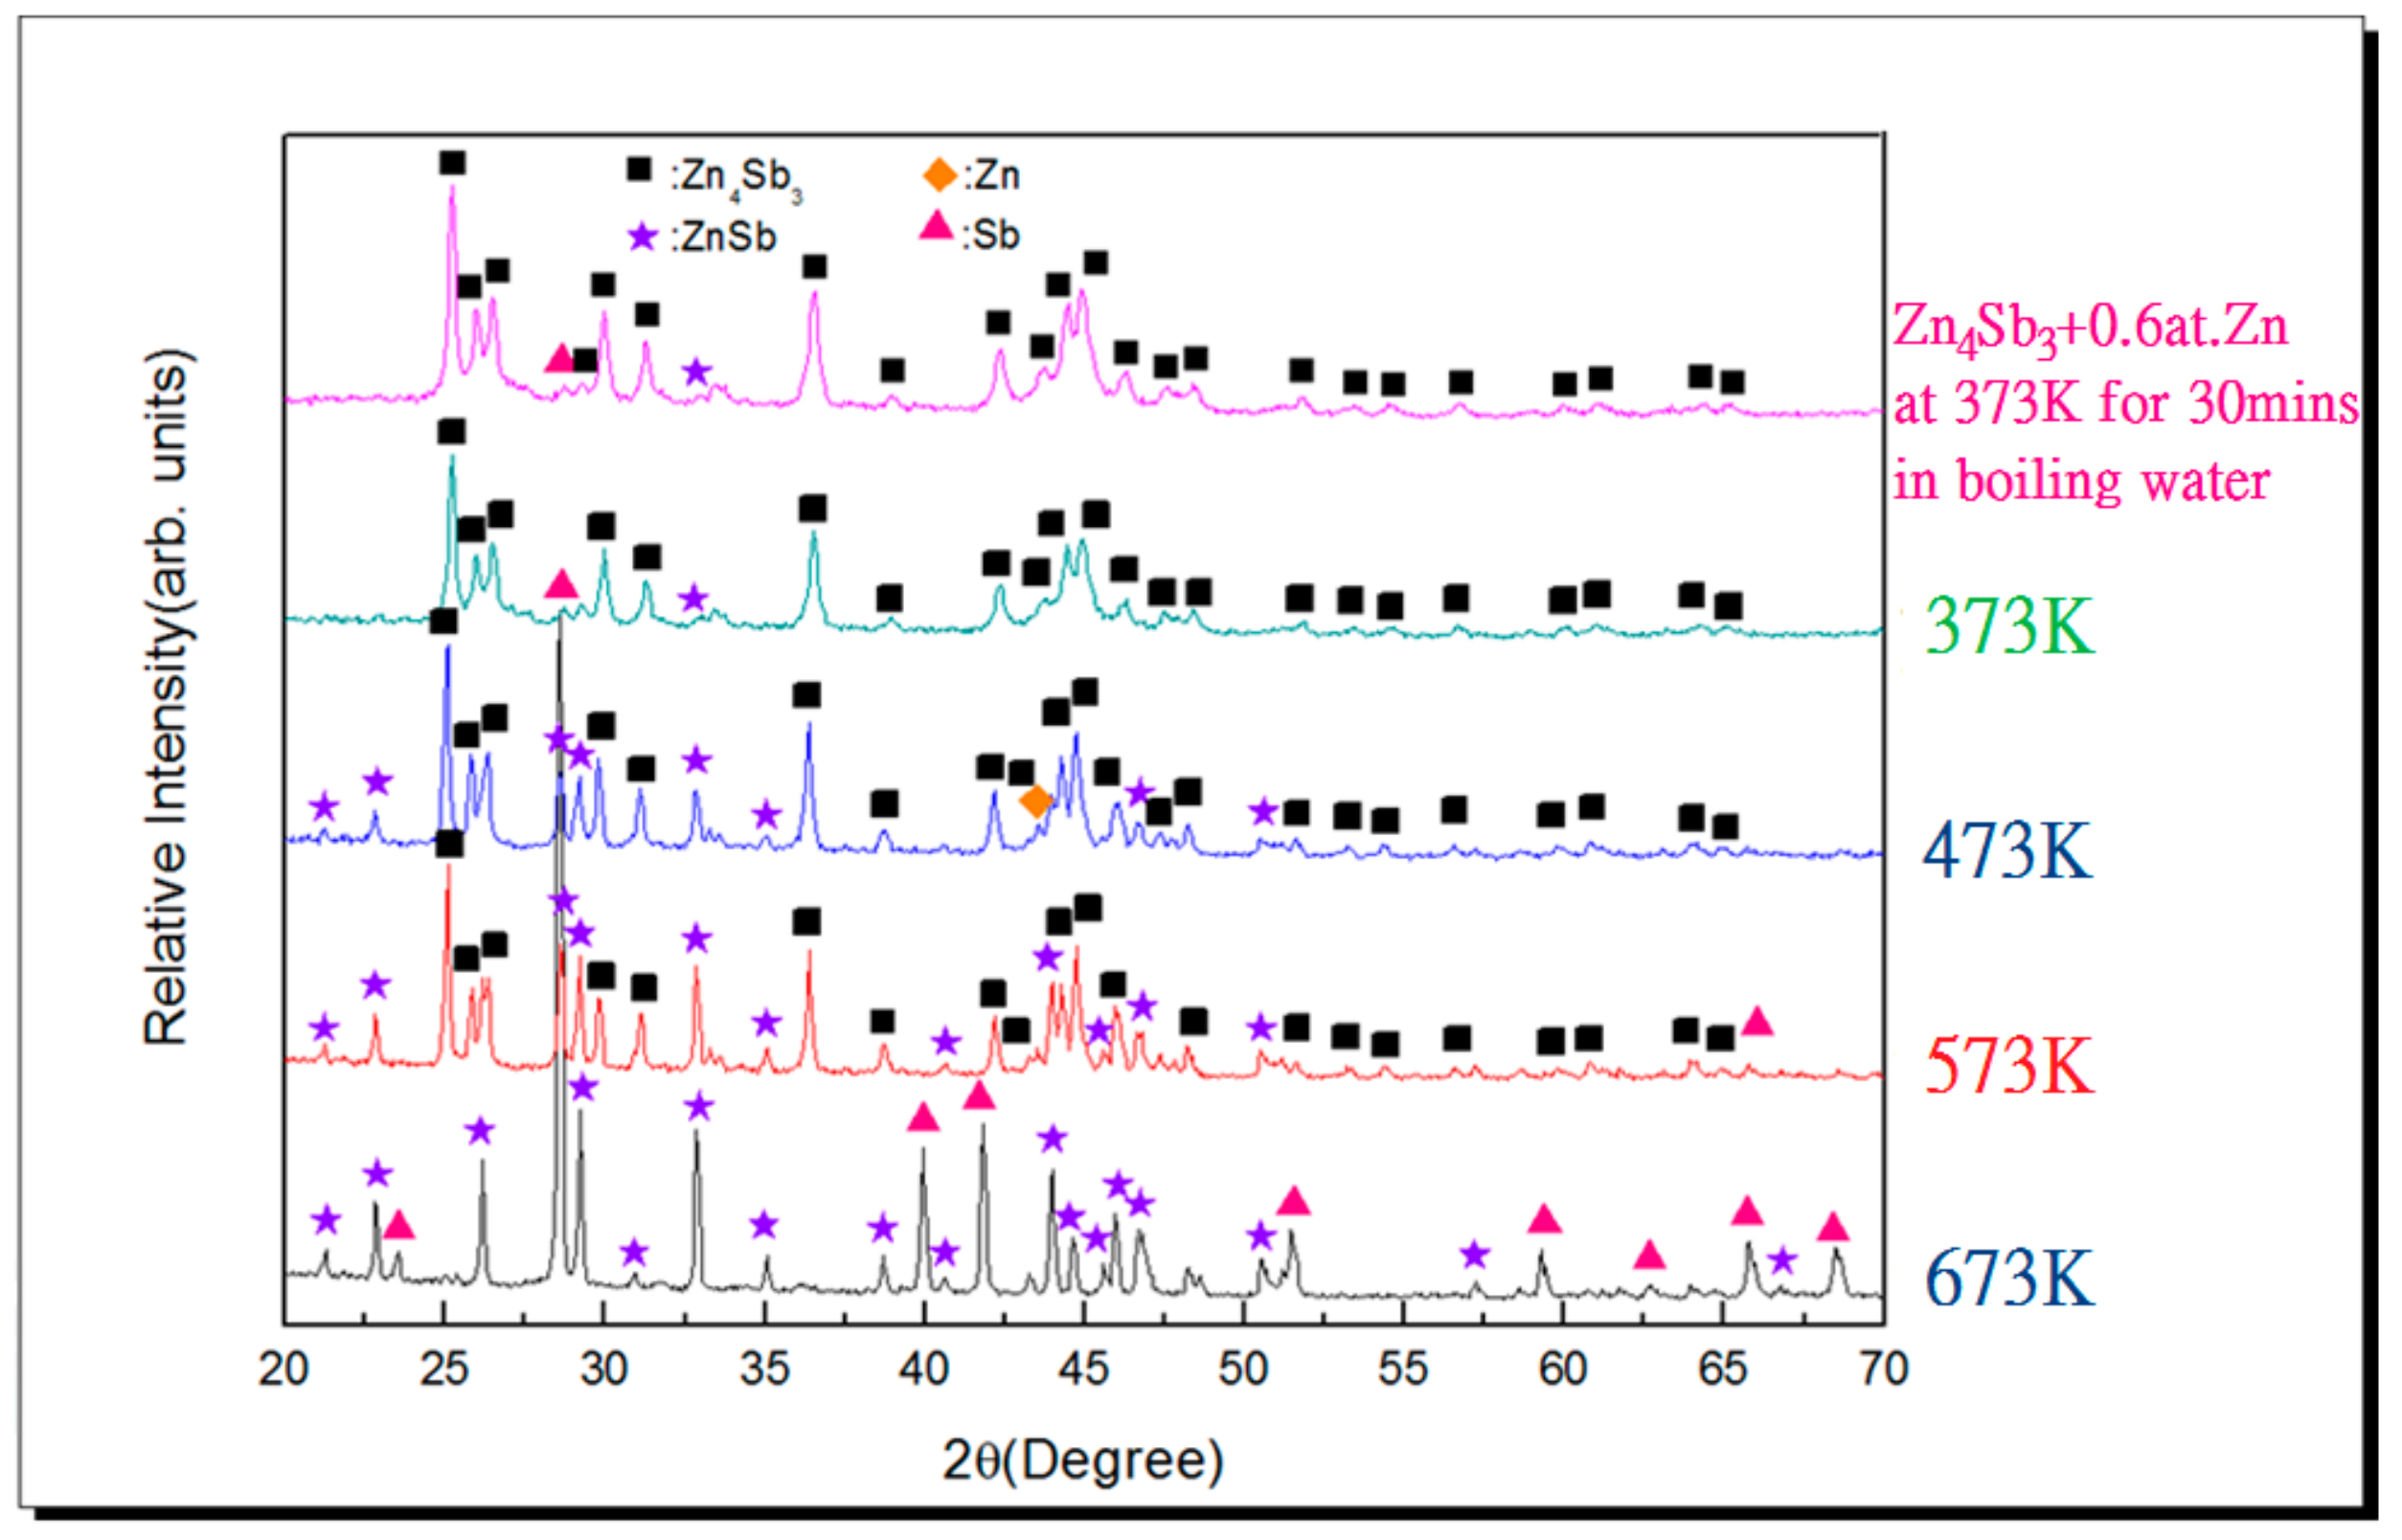
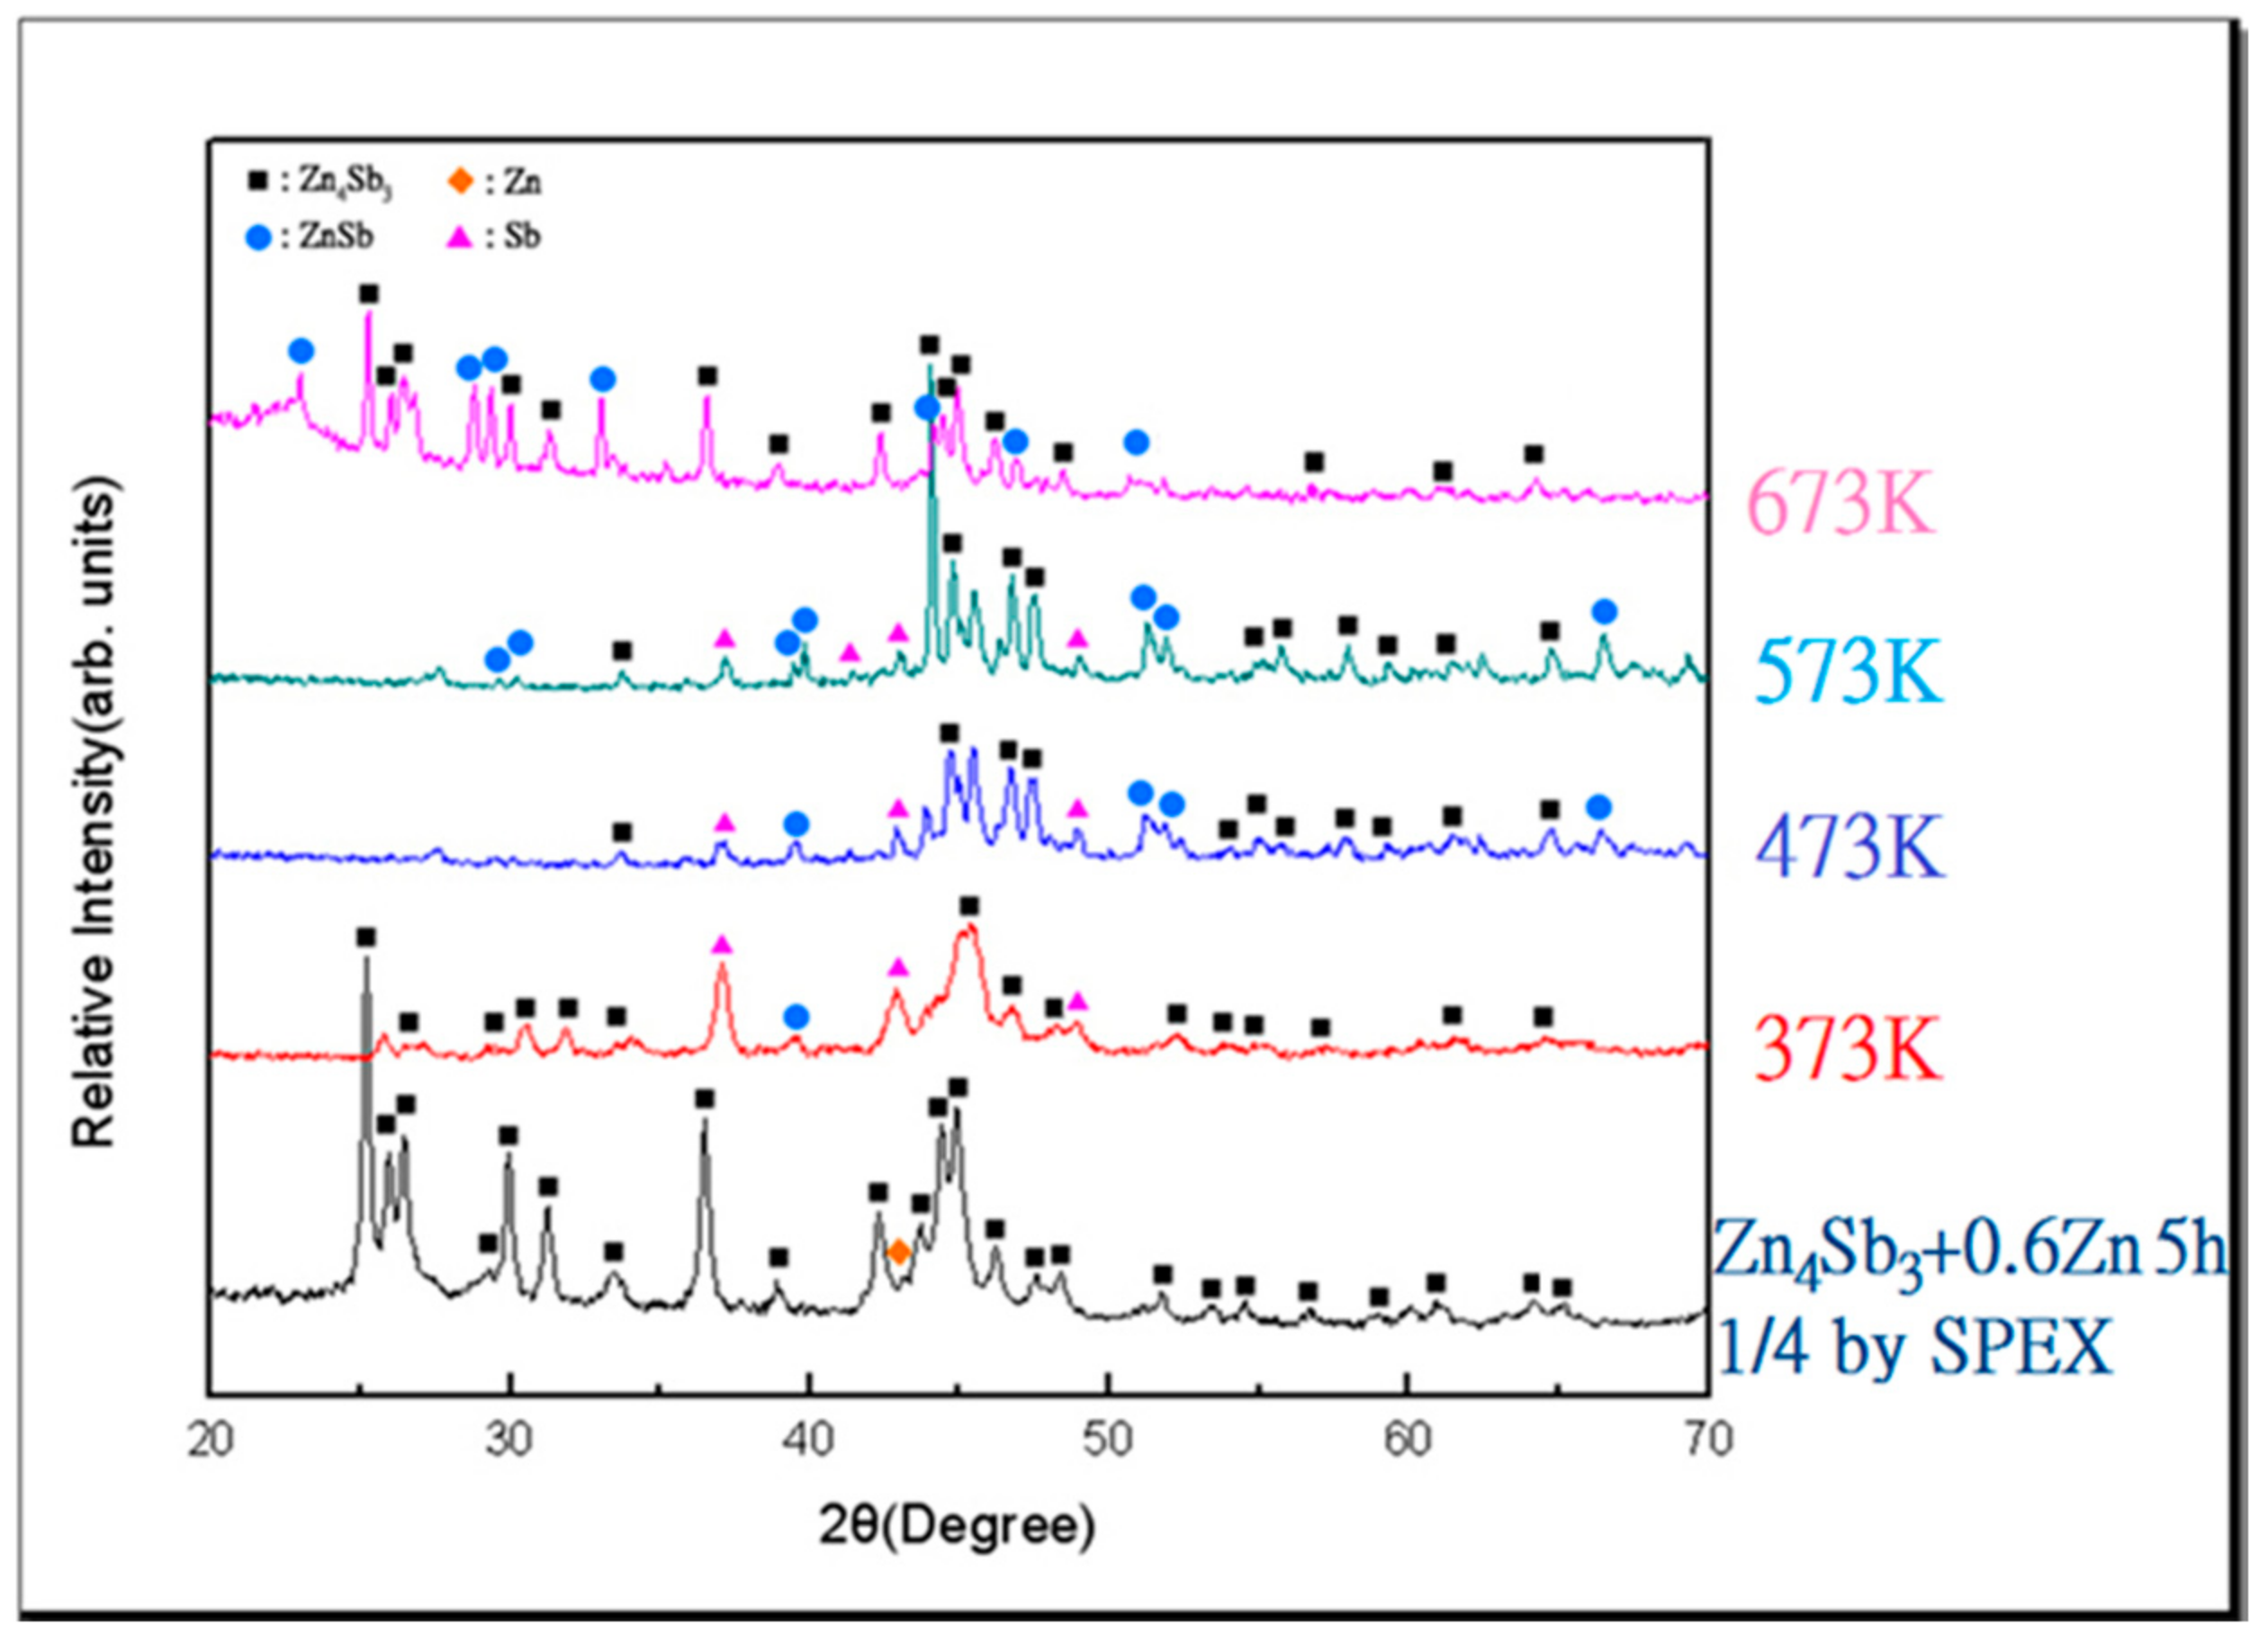
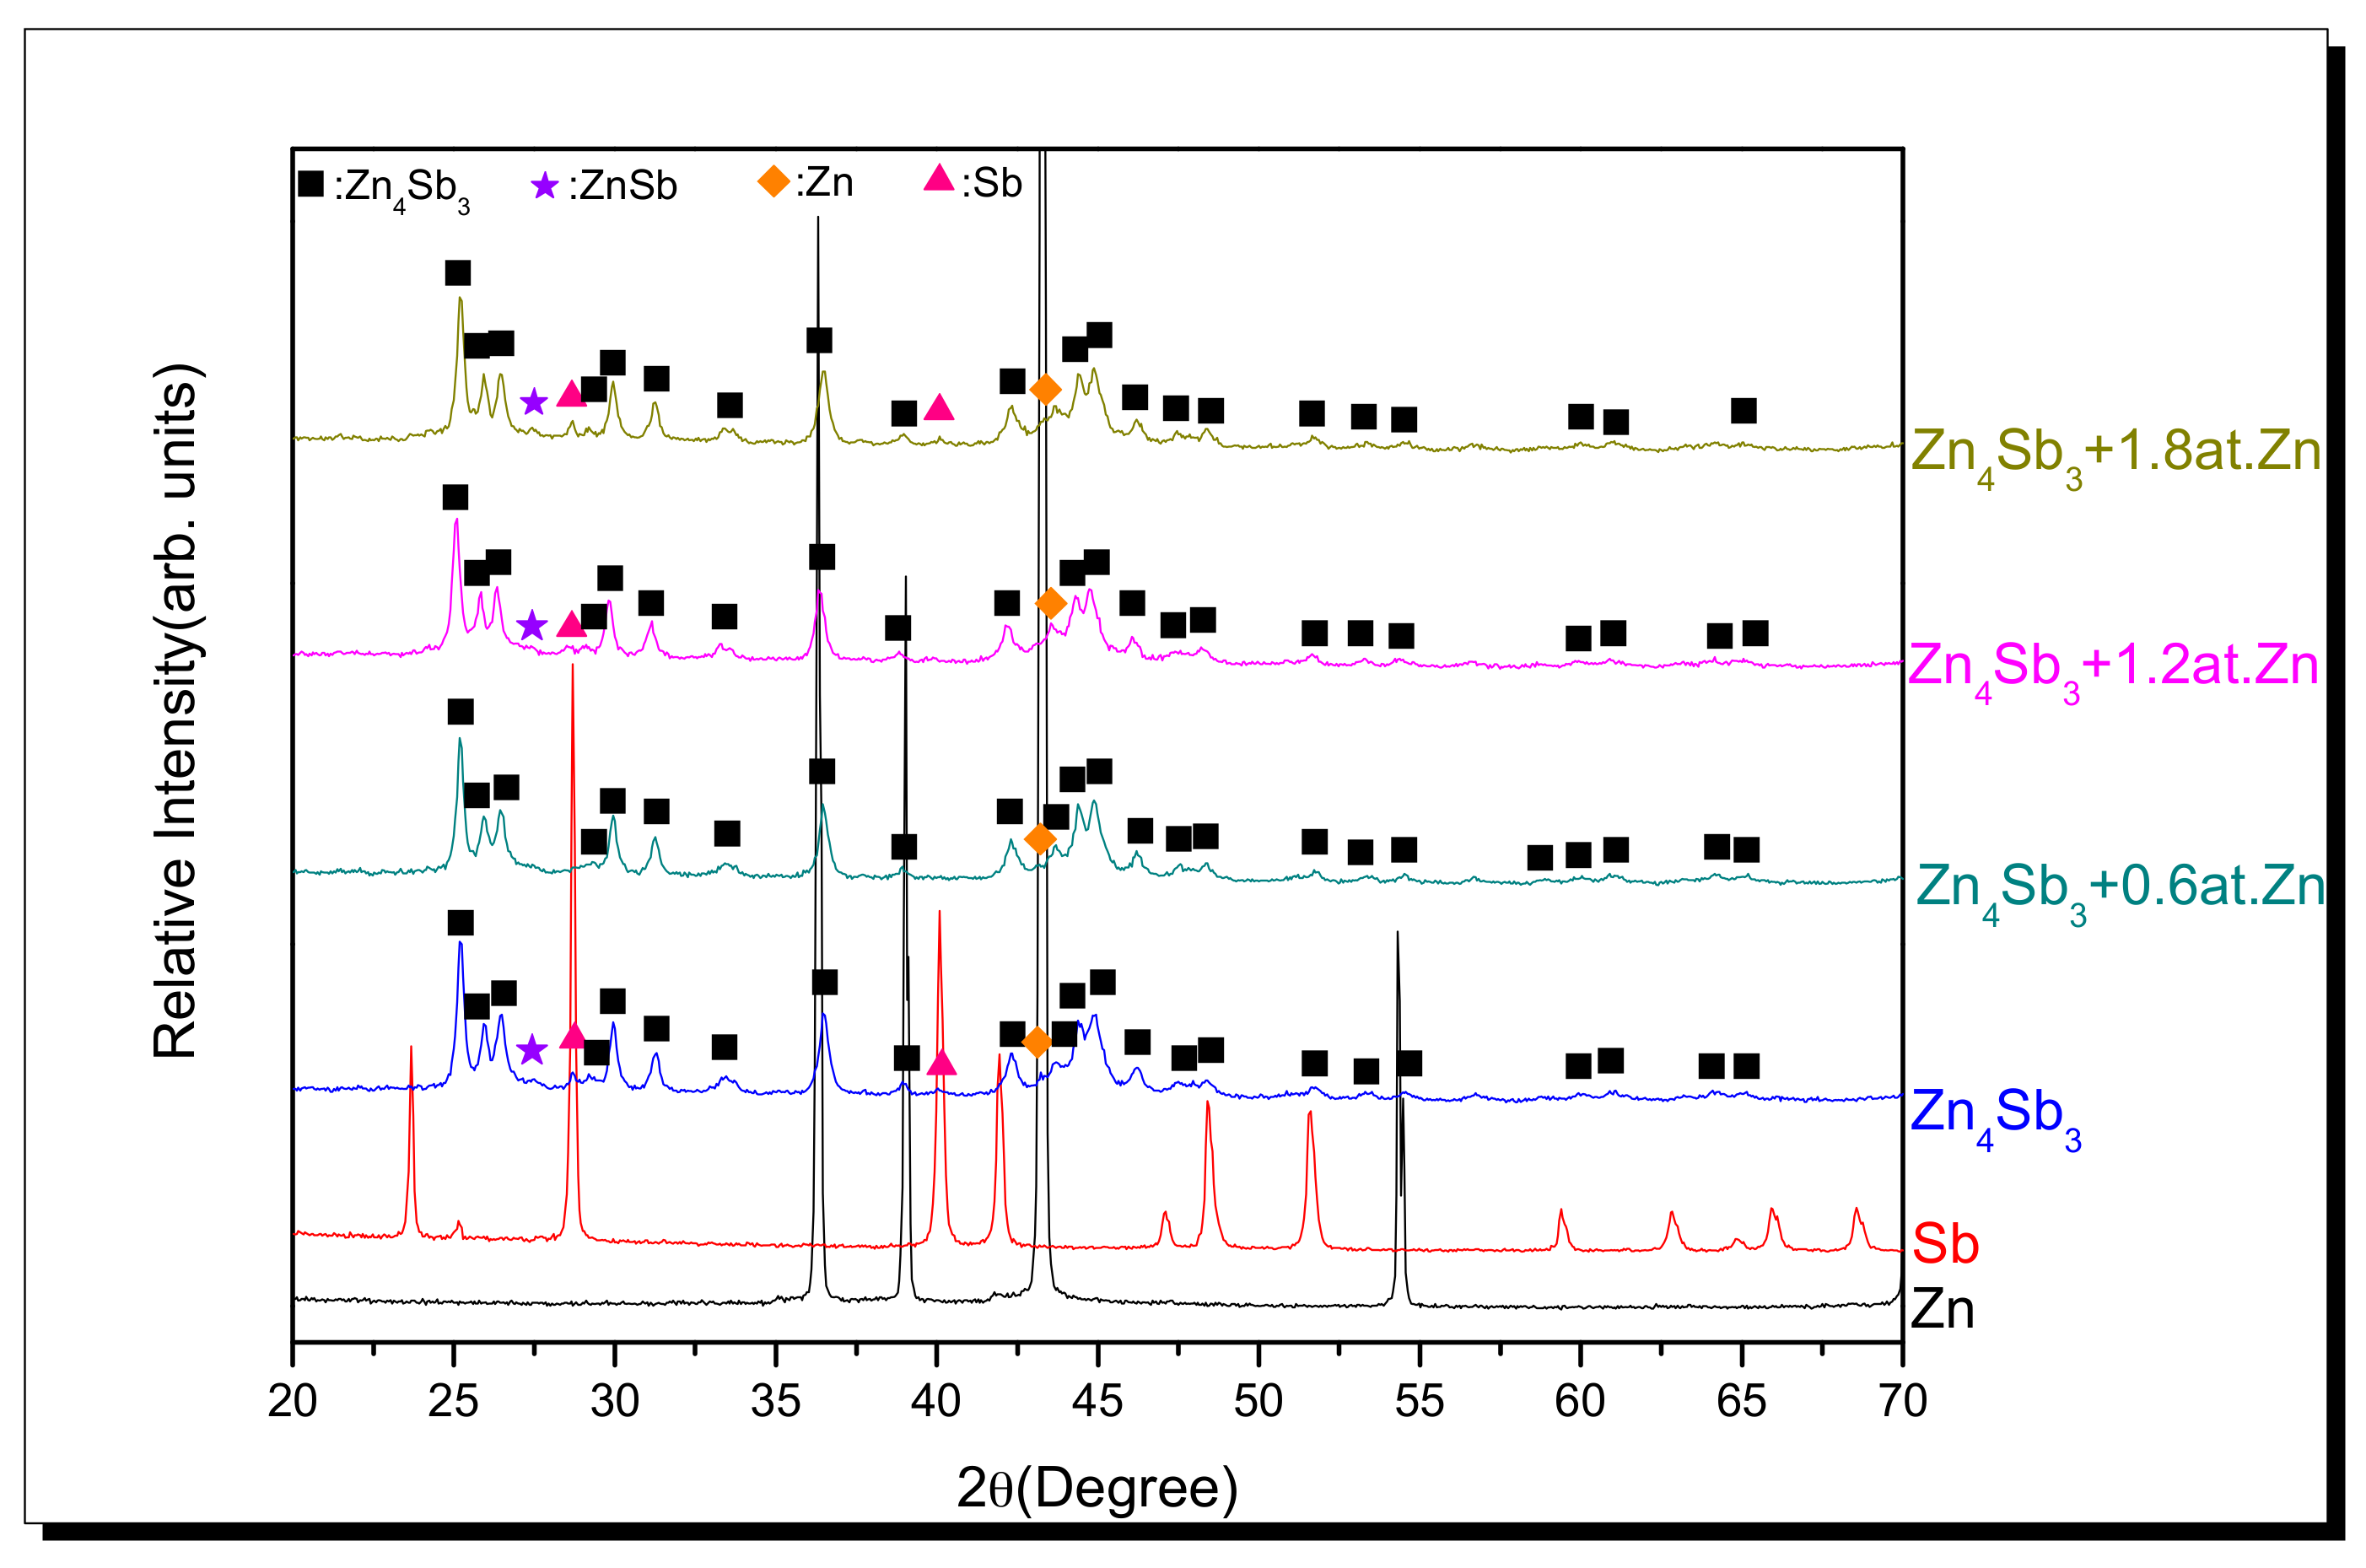
3.1. XRD Diffraction Analysis of MA Powder

Figure 1 shows the X-ray diffraction patterns of the as-milled powder after 5 h of mechanical alloying process. It can be noted that only the Zn4Sb3 with 0.6 at. % of excess Zn exhibited nearly a single β-Zn4Sb3 phase, thus this composition was used for the subsequent vacuum sintering and hot pressing. There are two more reasons for this selection: (1) this composition can be prepared to a nearly single Zn4Sb3 in a short time by SPEX shaker ball mill; and (2) Zn4Sb3 with superfluous Zn may compensate the loss of Zn evaporation during the sintering heat treatment.

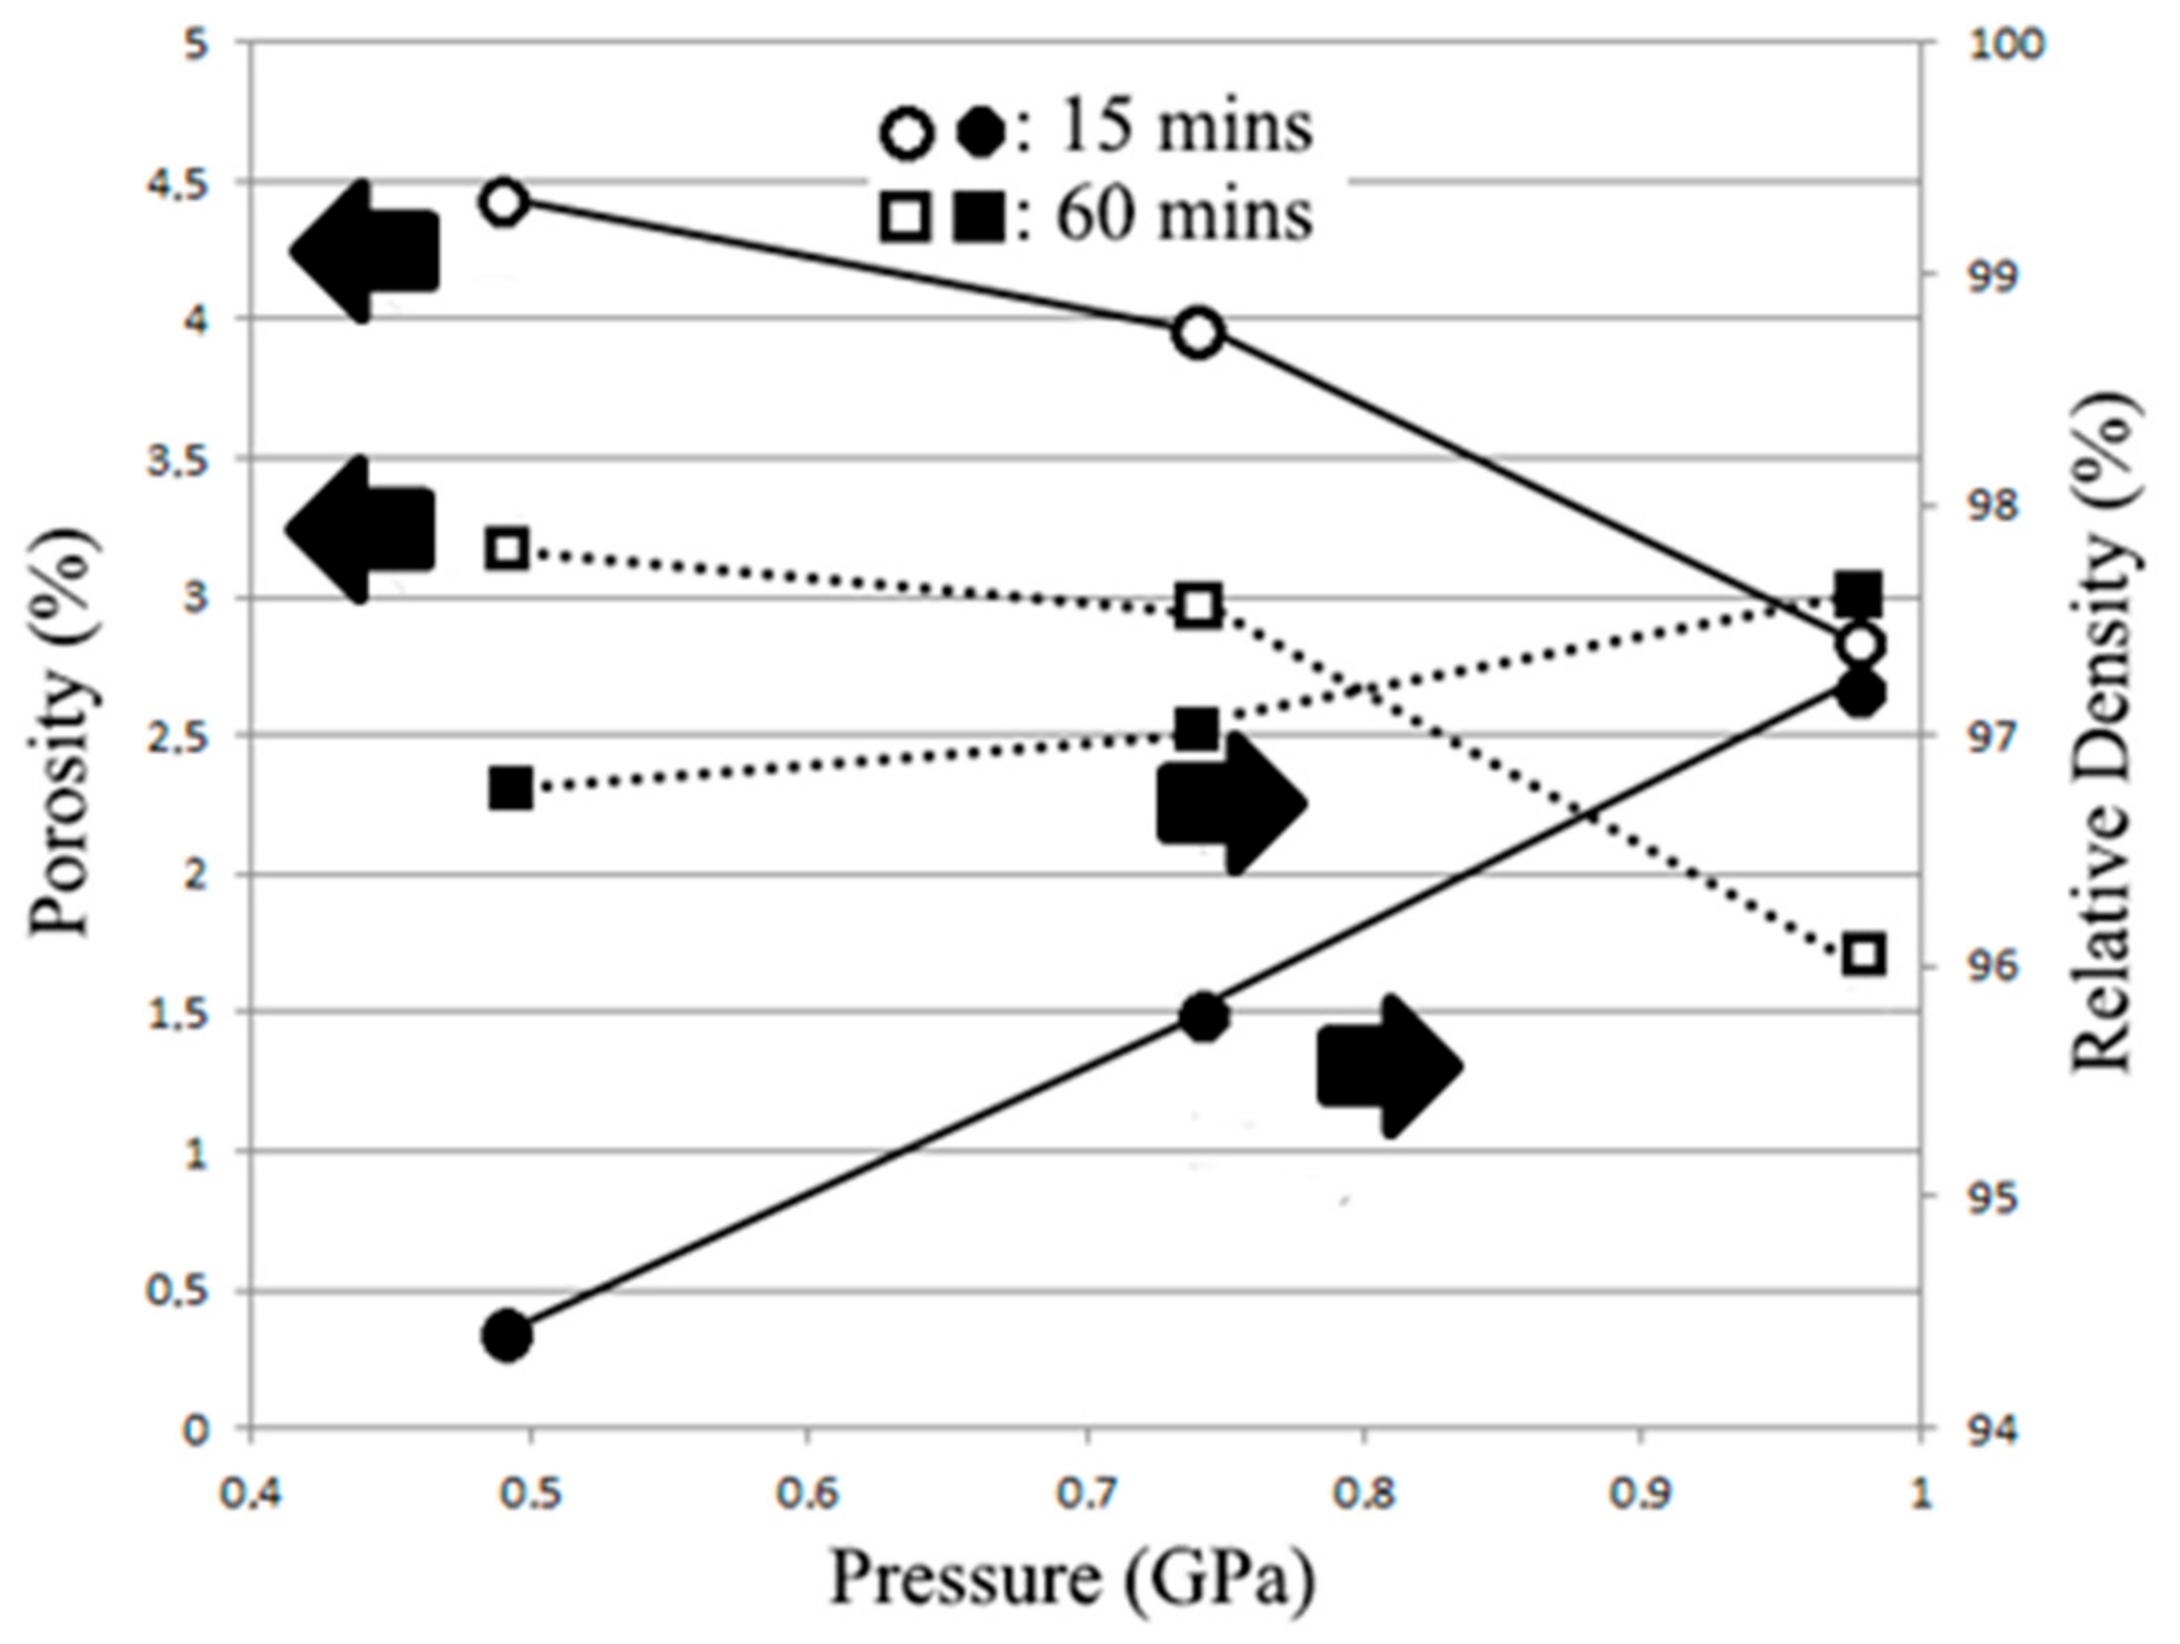
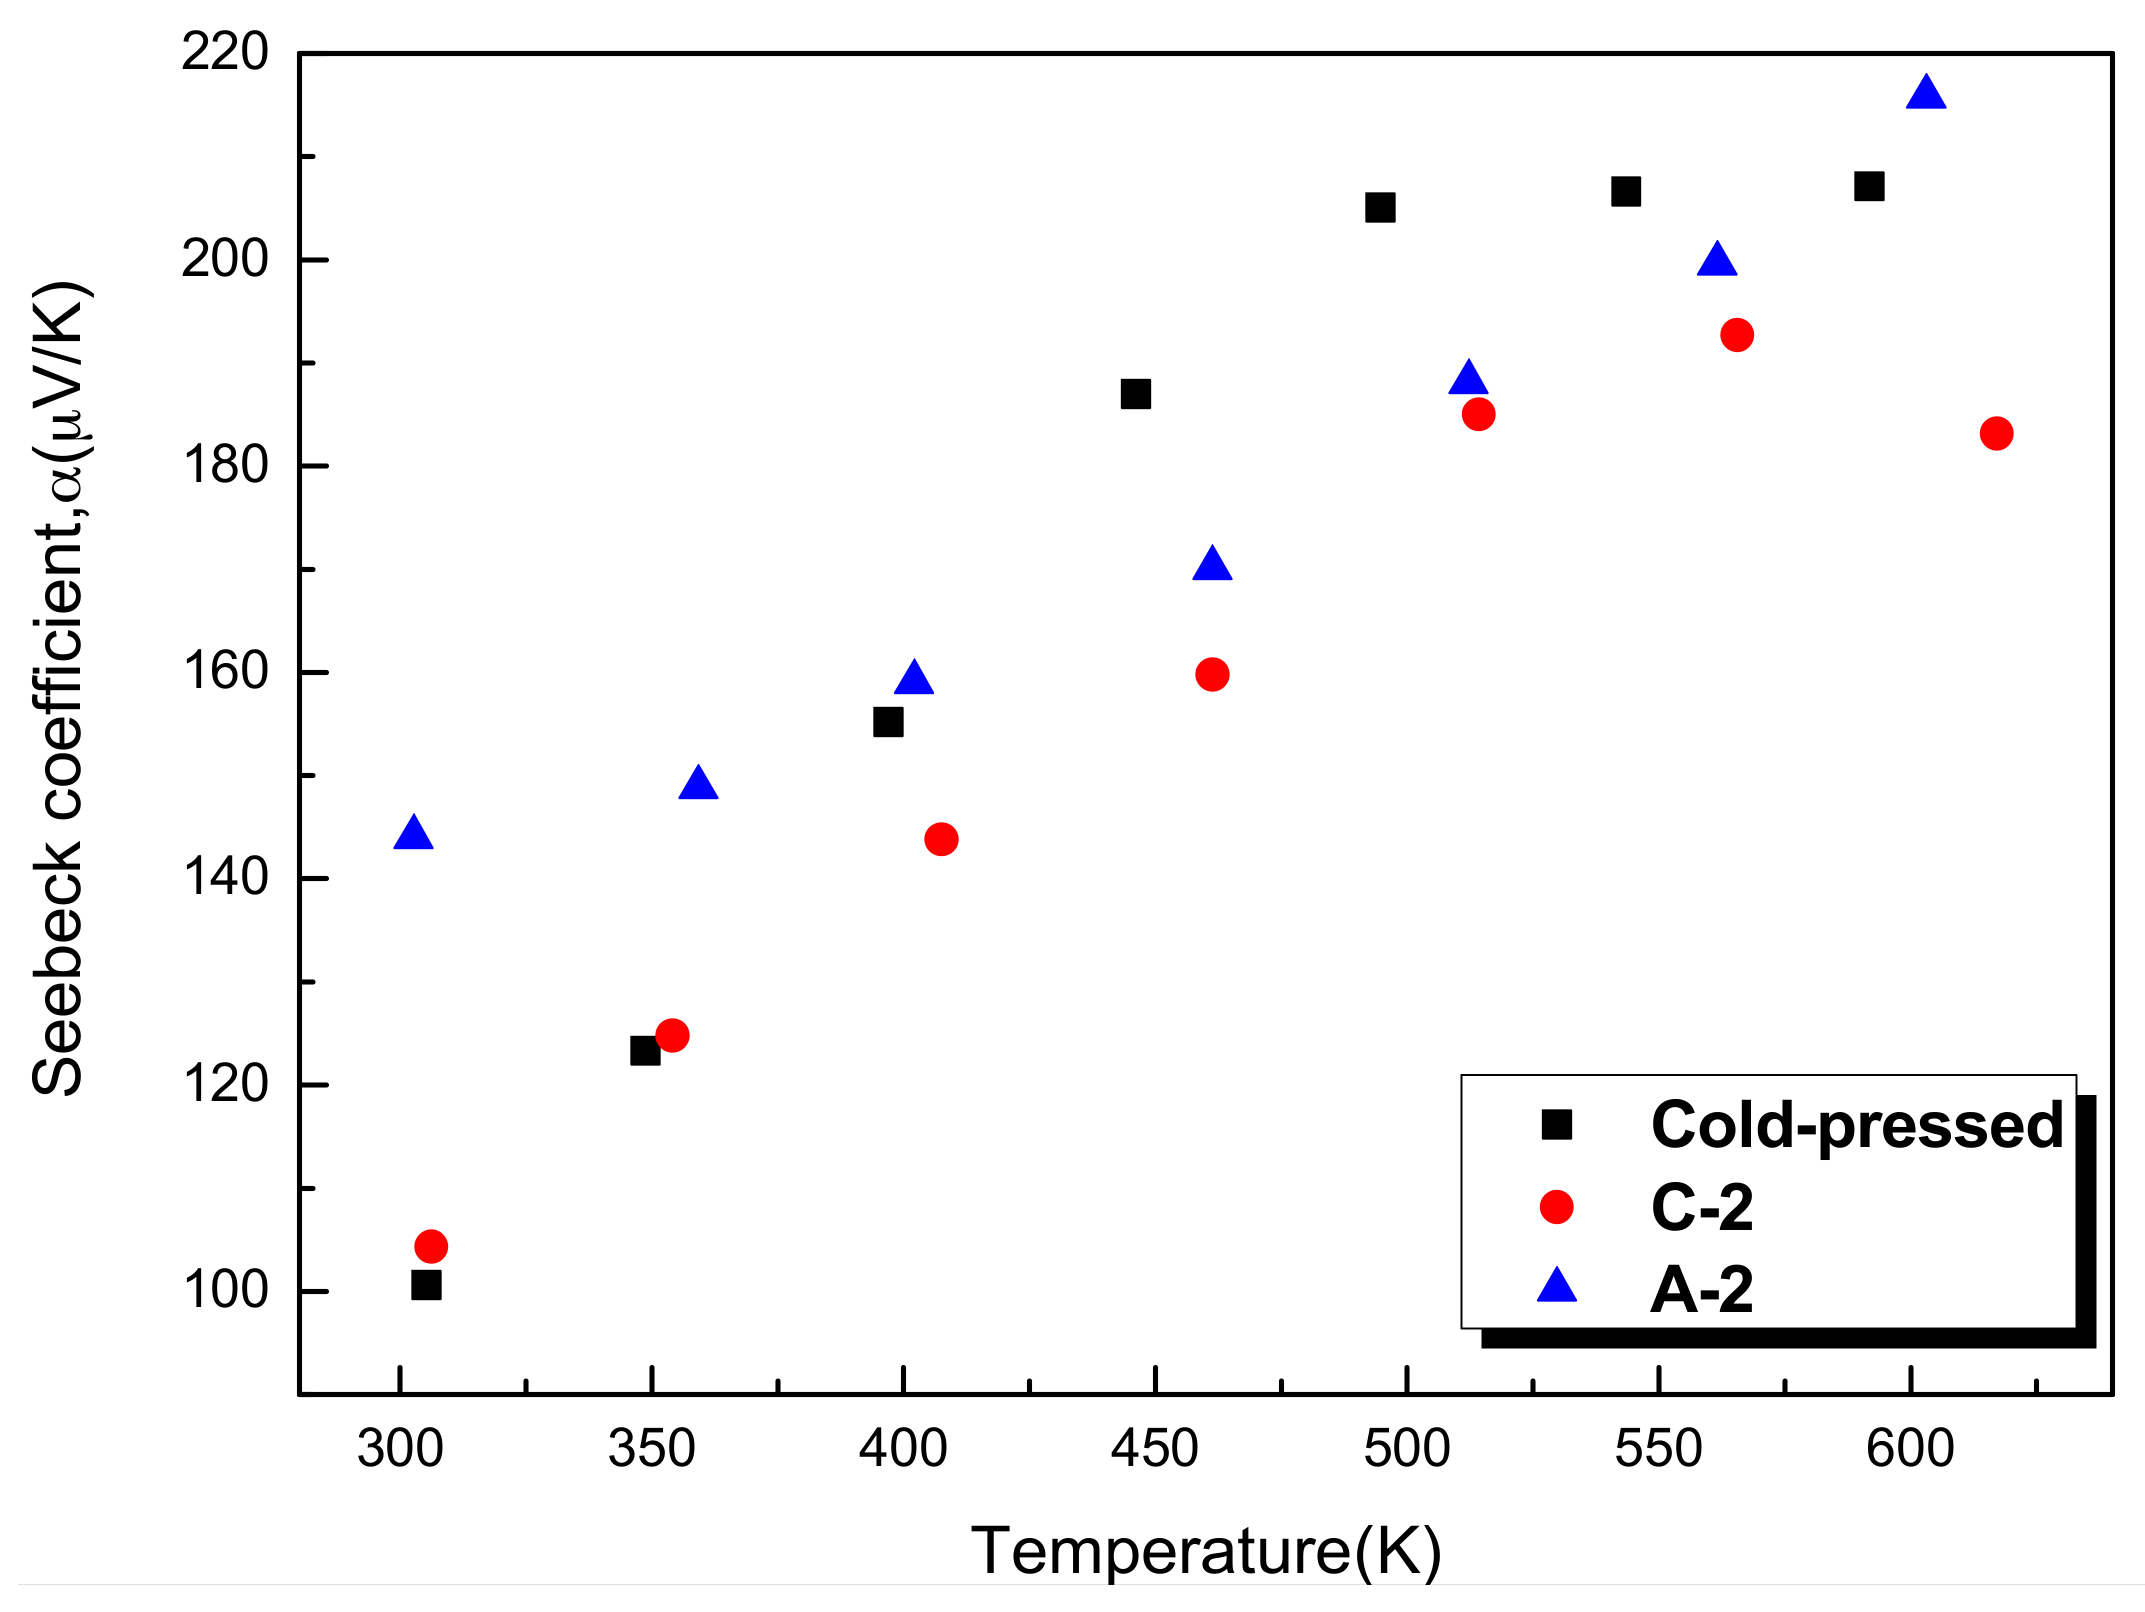
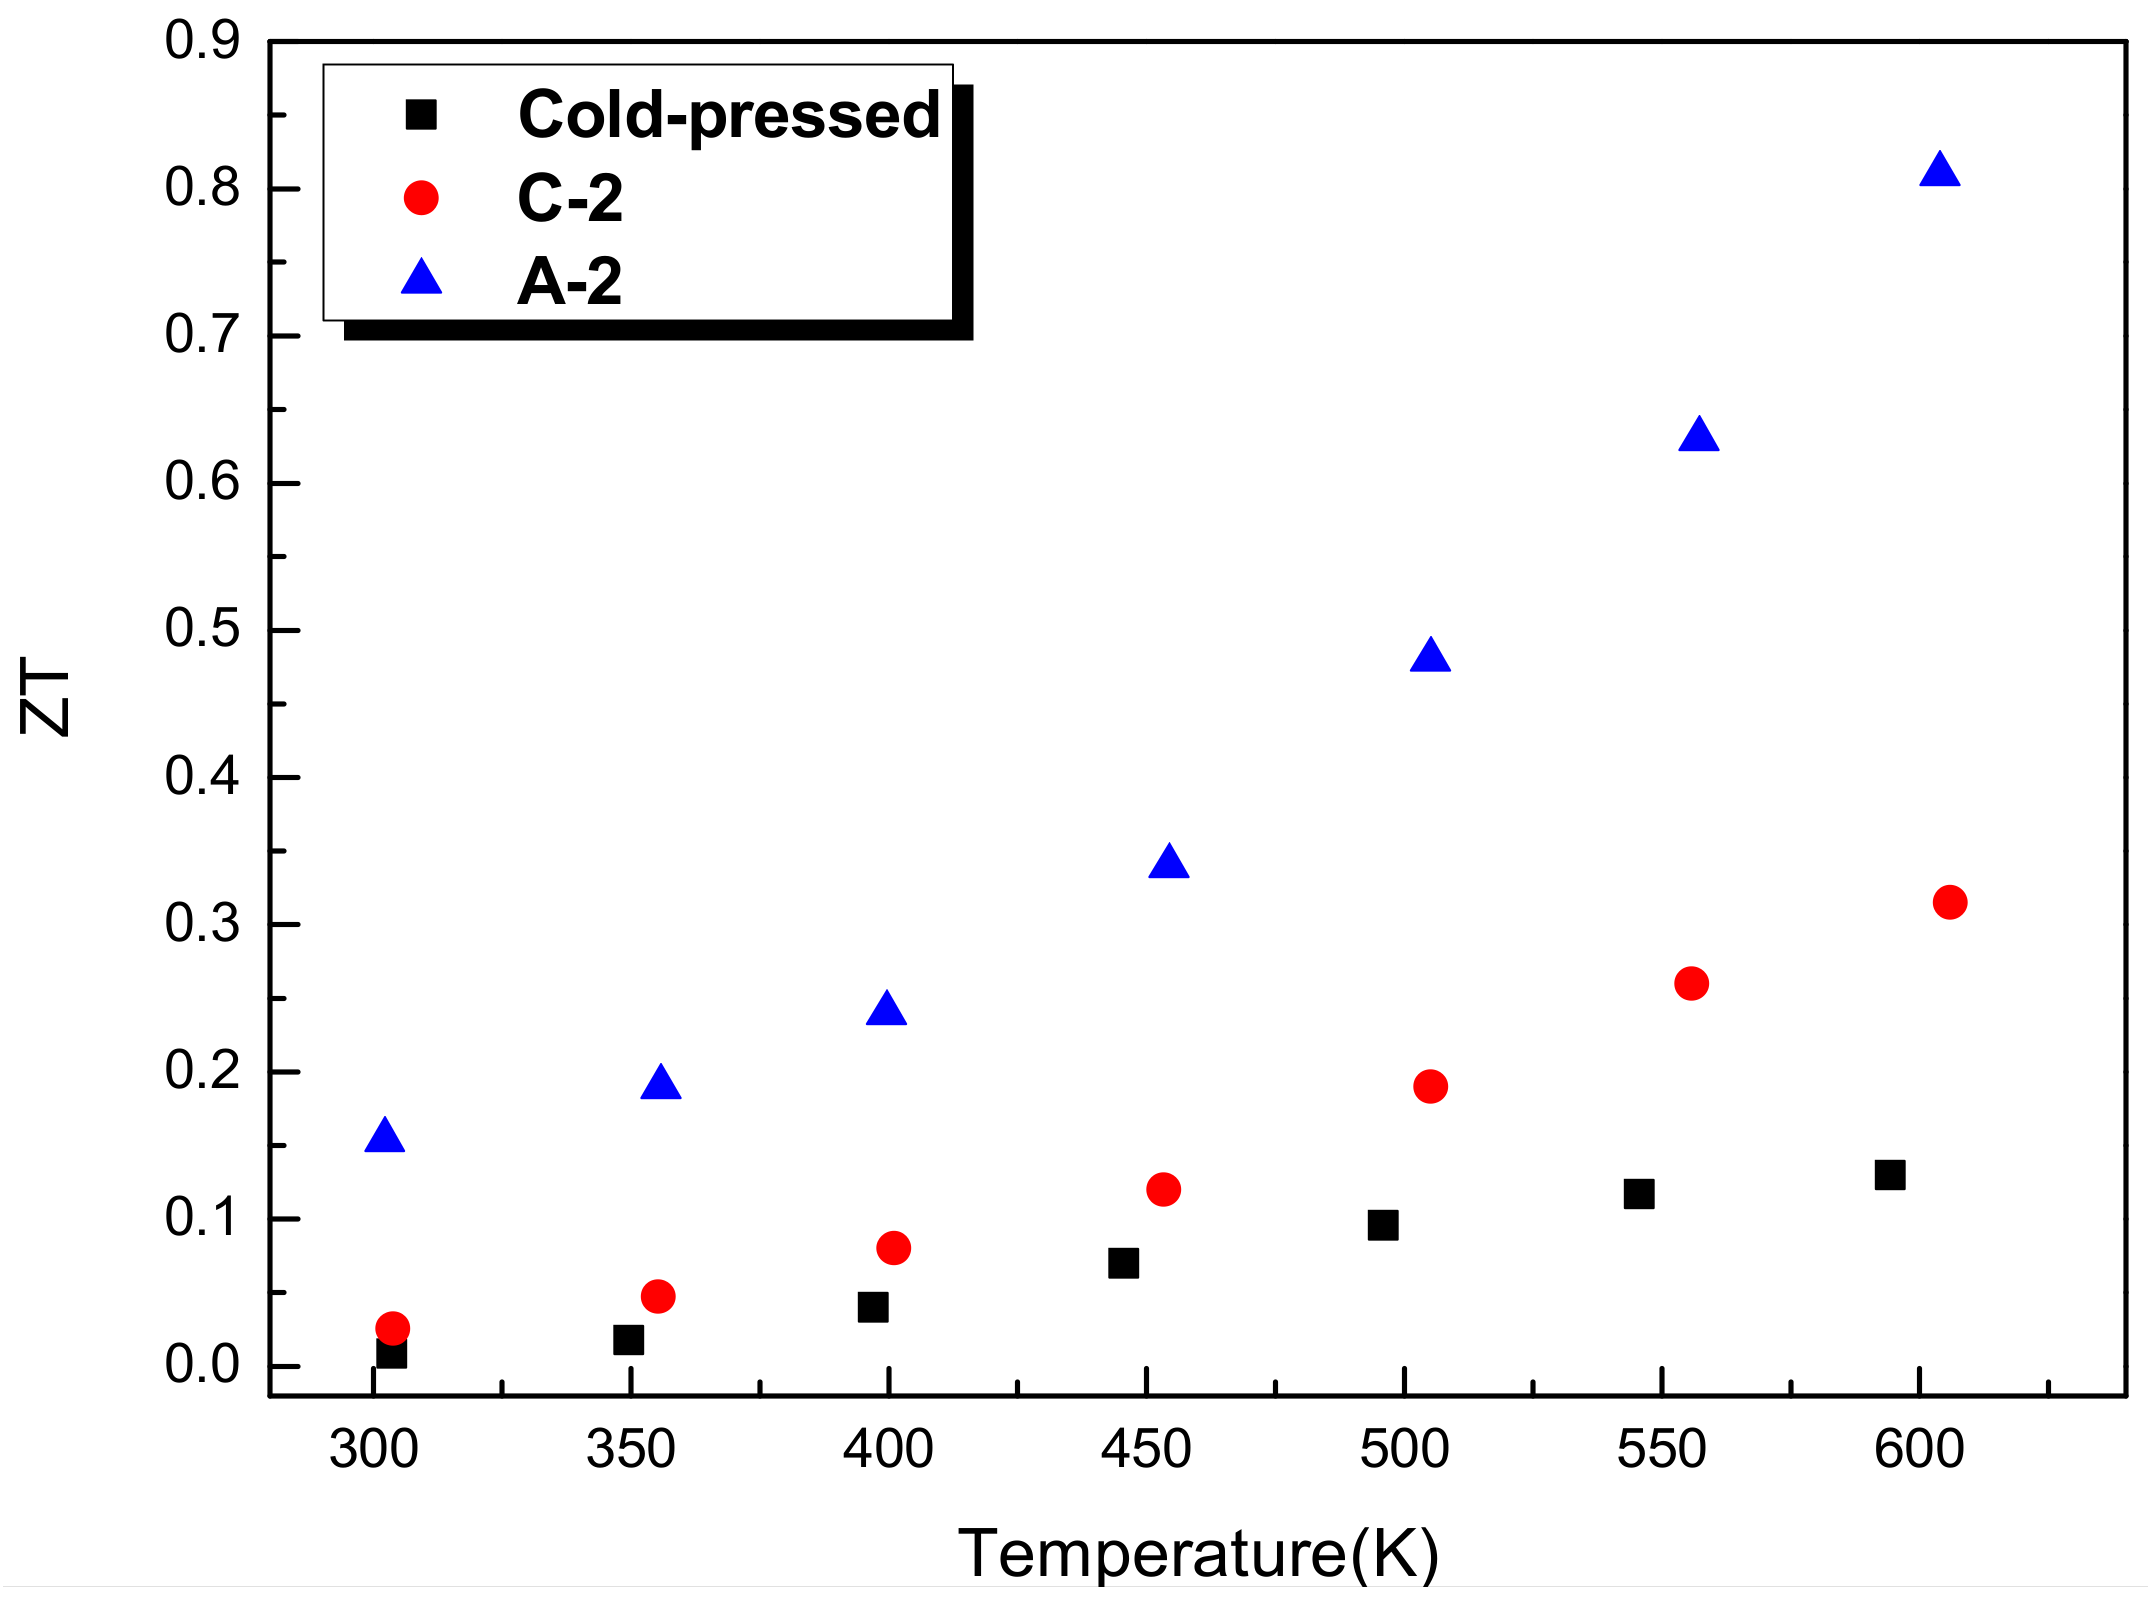
3.2. Vacuum Sintering and Vacuum Hot Pressing of Bulk Zn4Sb3 Alloy

Figure 2 shows the XRD patterns of bulk specimens with 0.6 at. % Zn rich composition vacuum sintered for 30 min at 373, 473, 573, and 673 K, respectively. Impermeable heating of the as-milled powder in 100 °C (i.e., 373 K) boiled water was also shown for comparison with that of 373 K sintered sample. As shown in the top two curves in Figure 2, no significant differences in XRD patterns can be revealed. With increasing sintering temperature, the peaks intensity of ZnSb reflections increased with gradual decrease of corresponding Zn4Sb3 phase. At 673 K, no Zn4Sb3 diffraction peaks can be observed. This can be attributed to the high-temperature sintering where evaporation of Zn occurred and resulted in the loss of Zn content. It is suggested that the Zn concentration within the 673 K sintered powder was less than 50 at. % and resulted in equilibrium Sb and ZnSb phases.
In order to obtain high-density bulk Zn4Sb3, the as-milled powder of Zn4Sb3 with 0.6 at. % of excess Zn was vacuum hot pressed into a disc with a diameter of 10 mm and a thickness of 2 mm at different temperatures and pressures for various durations. Figure 3 shows the XRD patterns of selected vacuum hot pressed samples under an applied pressure of 0.98 MPa for 30 min at different temperatures. It can be noted that the vacuum hot pressed samples exhibited different phases compared to that of as-milled powder. After vacuum hot pressing at 373 K and 473 K, the main phase is β-Zn4Sb3. However, detailed analysis revealed a decrease in lattice constant due to the evaporation of Zn during vacuum hot pressing. For 573 and 673 K samples, Sb and ZnSb phases can be observed. This phenomenon is similar to what occurred for the vacuum sintered sample at 673 K. Since major β-Zn4Sb3 phase formed at 373 and 473 K, Figure 4 shows the corresponding XRD patterns for those vacuum hot pressed at 473 K but under different applied pressures and durations. It can be noticed that most samples exhibited both Zn4Sb3 and ZnSb phases. The applied pressure and duration do not have a significant effect on the structure.
Figure 5 shows the SEM images of vacuum hot pressed samples under an applied pressure of 0.98 GPa for 30 min (i.e., the corresponding samples examined in Figure 3). It can be noted that the porosity decreased with the increase of the hot pressing temperature, hot pressing time, and pressure. The sample hot pressed at 673 K revealed almost pore-free microstructure and exhibited the highest density and smallest porosity among all hot pressed samples. Corresponding density and porosity of vacuum hot pressed samples prepared with different temperatures were shown in Figure 6, where porosity decreases with increasing temperature can be noticed. Figure 7 shows the density and porosity for the samples vacuum hot pressed at 473 K with various applied pressure and duration, i.e., the samples examined in Figure 4. It is noted that, from the perspective of constant pressure, when the duration increases from 15 to 60 min, the porosity decreases by more than 1%. Meanwhile, with the same duration at 473 K, the porosity can be reduced by increasing the applied pressure.
From the XRD results shown in Figure 3 and Figure 4, the hot pressed samples exhibited generally a mixture of Zn4Sb3 and ZnSb phases. In calculating the relative density, though the theoretical density of Zn4Sb3 (6.20 g/cm3) is used as the benchmark [21], the relative density may be overestimated due to the theoretical density of ZnSb (6.38 g/cm3) [22]. In fact, the relative density should be lower than the values obtained. For example, as shown in Figure 3, the A-3 hot pressed sample exhibited Sb phase in addition to Zn4Sb3 and ZnSb phases. The theoretical density of Sb is 6.69 g/cm3 [23,24], causing the relative density to be slightly higher than the others. Similar experimental results have been reported by Ueno and Yamamoto [25] who investigated Zn4.08Sb3 with different oxygen content. They found that the XRD analysis for hot pressed bulk materials with lower oxygen content (0.209%) showed no ZnSb or Zn phase. A relative density of 99.6% was measured. On the other hand, the one with high oxygen content (0.625%) possessed Zn4Sb3 and Sb phases and resulted in a relative density of 100.6%. Ueno suggested that, since the sample is pore free, part of the Zn4Sb3 may decompose into Sb and led to the calculated density higher than the theoretical density of Zn4Sb3.
The thermoelectric properties of selected samples, i.e., A-2, C-2, and cold-pressed (pressed at 298 K under 0.49GPa), was shown in Figure 8, Figure 9, Figure 10, Figure 11 and Figure 12. Within the test temperature range, the Seebeck coefficients (α) for all the samples are positive, indicating the p-type semiconductor behavior with holes as carriers. The Seebeck coefficient generally increases with temperature and the highest α value (215.8 μV/K) exhibits in A-2 at 603 K. Figure 9 shows the temperature dependence of electrical conductivity (σ) that slowly rises with increasing temperature, the semiconductor transport behavior might be responsible for such phenomenon. Similar behavior also has been reported in Zn-Sb based alloys by several research groups [17,22,26,27]. Using the data from Figure 8 and Figure 9, we can obtain the power factor θ (α2σ) that shows in Figure 10, where the A-2 sample exhibits the highest power factor (1.31 × 10⁻³ W/mK2) at 600 K. Figure 11 shows the correlation between thermal conductivity (κ) and temperature, with the A-2 sample at 600 K obtaining the lowest κ value (0.98 W/mK). Finally, with the data obtained from Figure 8, Figure 9, Figure 10 and Figure 11, we can calculate the ZT values according to the formula α2σT/κ and the results are shown in Figure 12. Because the A-2 sample possesses a higher power factor and lower thermal conductivity than those from either cold-pressed or C-2 specimens, it has the highest ZT value of 0.81 at 600 K.
It is interesting to note the high electrical conductivity of the A-2 samples suggests there might be significant electron contribution to the thermal conductivity reported in Figure 11. To improve this argument, the electronic thermal conductivity (κe) is calculated by the Wiedemann-Franz relation, κe = LσT (where L = 2.0 × 10⁻⁸ V2/K2 is Lorenz number, σ is electrical conductivity, and T is absolute temperature) [28]. The results indicate the estimate electronic thermal conductivity is much larger than the estimate lattice thermal conductivity (κL). The high electrical conductivity also suggests a stronger phonon-electron coupling might be observed due to quite high carrier concentration in A-2 samples. The effect of phonon-electron (p-e) scattering on κL has been investigated in Cu, Ag, Au, Al, Pt, Ni, and Si by first principle calculation [29,30]. The results indicate the κL of Pt, Ni, and Si can be reduced by p-e scattering. Specifically, a significant reduction of κL reaches up to 45% in p-type Si was obtained when the carrier concentration is around 1021 cm−3.
Table 2 summarizes the thermoelectric properties of the cold-pressed, C-2, and A-2 samples measured at 600 K. The Seebeck coefficients (α) are positive, indicating that these three bulks are p-type semiconductors. In 2003, Ur [31] et al. mentioned that α increases with the proportion of Zn4Sb3. The present results show the similar trend. Cold-pressed and A-2 possessed primarily Zn4Sb3 phase, thus the Seebeck coefficient was slightly higher than that of C-2 which contained ZnSb phase.
Table 3 summarizes the ZT values measured at 600 K by various researchers. Itoh’s [27] thermoelectric data showed that the phase formation is the key factor affecting the ZT value. Zn4Sb3 exhibits better thermoelectric properties (including electrical conductivity, Seebeck coefficient, and thermal conductivity) compared to those containing ZnSb and Zn phase. Caillat et al. [16] used the specimen’s density, heat capacity, and thermal diffusion coefficient to calculate the thermoelectric conductivity of Zn4Sb3 that was about 0.7~0.9 W/mK within 300~650 K. Since limited fluctuation of the thermal conductivities were observed from above Caillat’s calculation, Zhu [17] and Ur [32] separately referred to Caillat’s data to estimate the ZT values of their Zn4Sb3 specimens prepared by either vacuum melting or hot pressing method. Zhu’s result indicated that, due to the large number of cracks caused by quenching after melting, the electrical conductivity and the ZT value are too low. Ur used hot pressing to prepare Zn4Sb3 bulk materials. Similar Seebeck coefficient and electrical conductivity were noticed when compared to those of A-2 specimen investigated in the present study. A high ZT value of 1.2, however, was obtained and this was attributed mainly to low thermal conductivity estimated by Ur. A similar behavior was also reported by Ueno [25]. On the other hand, Cui et al. [33,34] introduced Cu and Al pure elements into Zn-Sb system expecting that doping these elements could induce lattice distortions and lower the thermal conductivity. Their results showed that, in contrast to the expectation that Cu can completely substituted some of Zn or Sb atoms, the formation of Cu2Sb phase was observed and increased the thermal conductivity. Its Seebeck coefficient, however, was almost twice that of Zn4Sb3. It has been reported that the Seebeck coefficient is primarily affected by the scatter factor and carrier concentration. The addition of Cu makes the structure more complicate, thus increasing the scatter factor and carrier concentration, leading to the final ZT value being slightly higher than that of Zn4Sb3 phase. In terms of doping Al element, the Seebeck coefficient shows a similar trend as that of doping Cu. The thermal conductivity is also lower than that of Zn4Sb3 as expected by Cui et al. Ruan et al. [35] reported that for Zn4Sb3 coated with a layer of SiO2 film, the results showed that the coating does not induce phase transformation, but SiO2 film can effectively reduce thermal conductivity and increase the ZT value.

4. Conclusions

  • The formation of complete Zn4Sb3 compound phase by mechanical alloying of pure zinc and antimony elemental powders with Zn4Sb3 composition is unsuccessful due to the partial volatility of the zinc during milling process.
  • A nearly single Zn4Sb3 compound phase can be obtained in mechanically alloyed β-Zn4Sb3 alloy powder with superfluous 0.6 at. % of Zn.
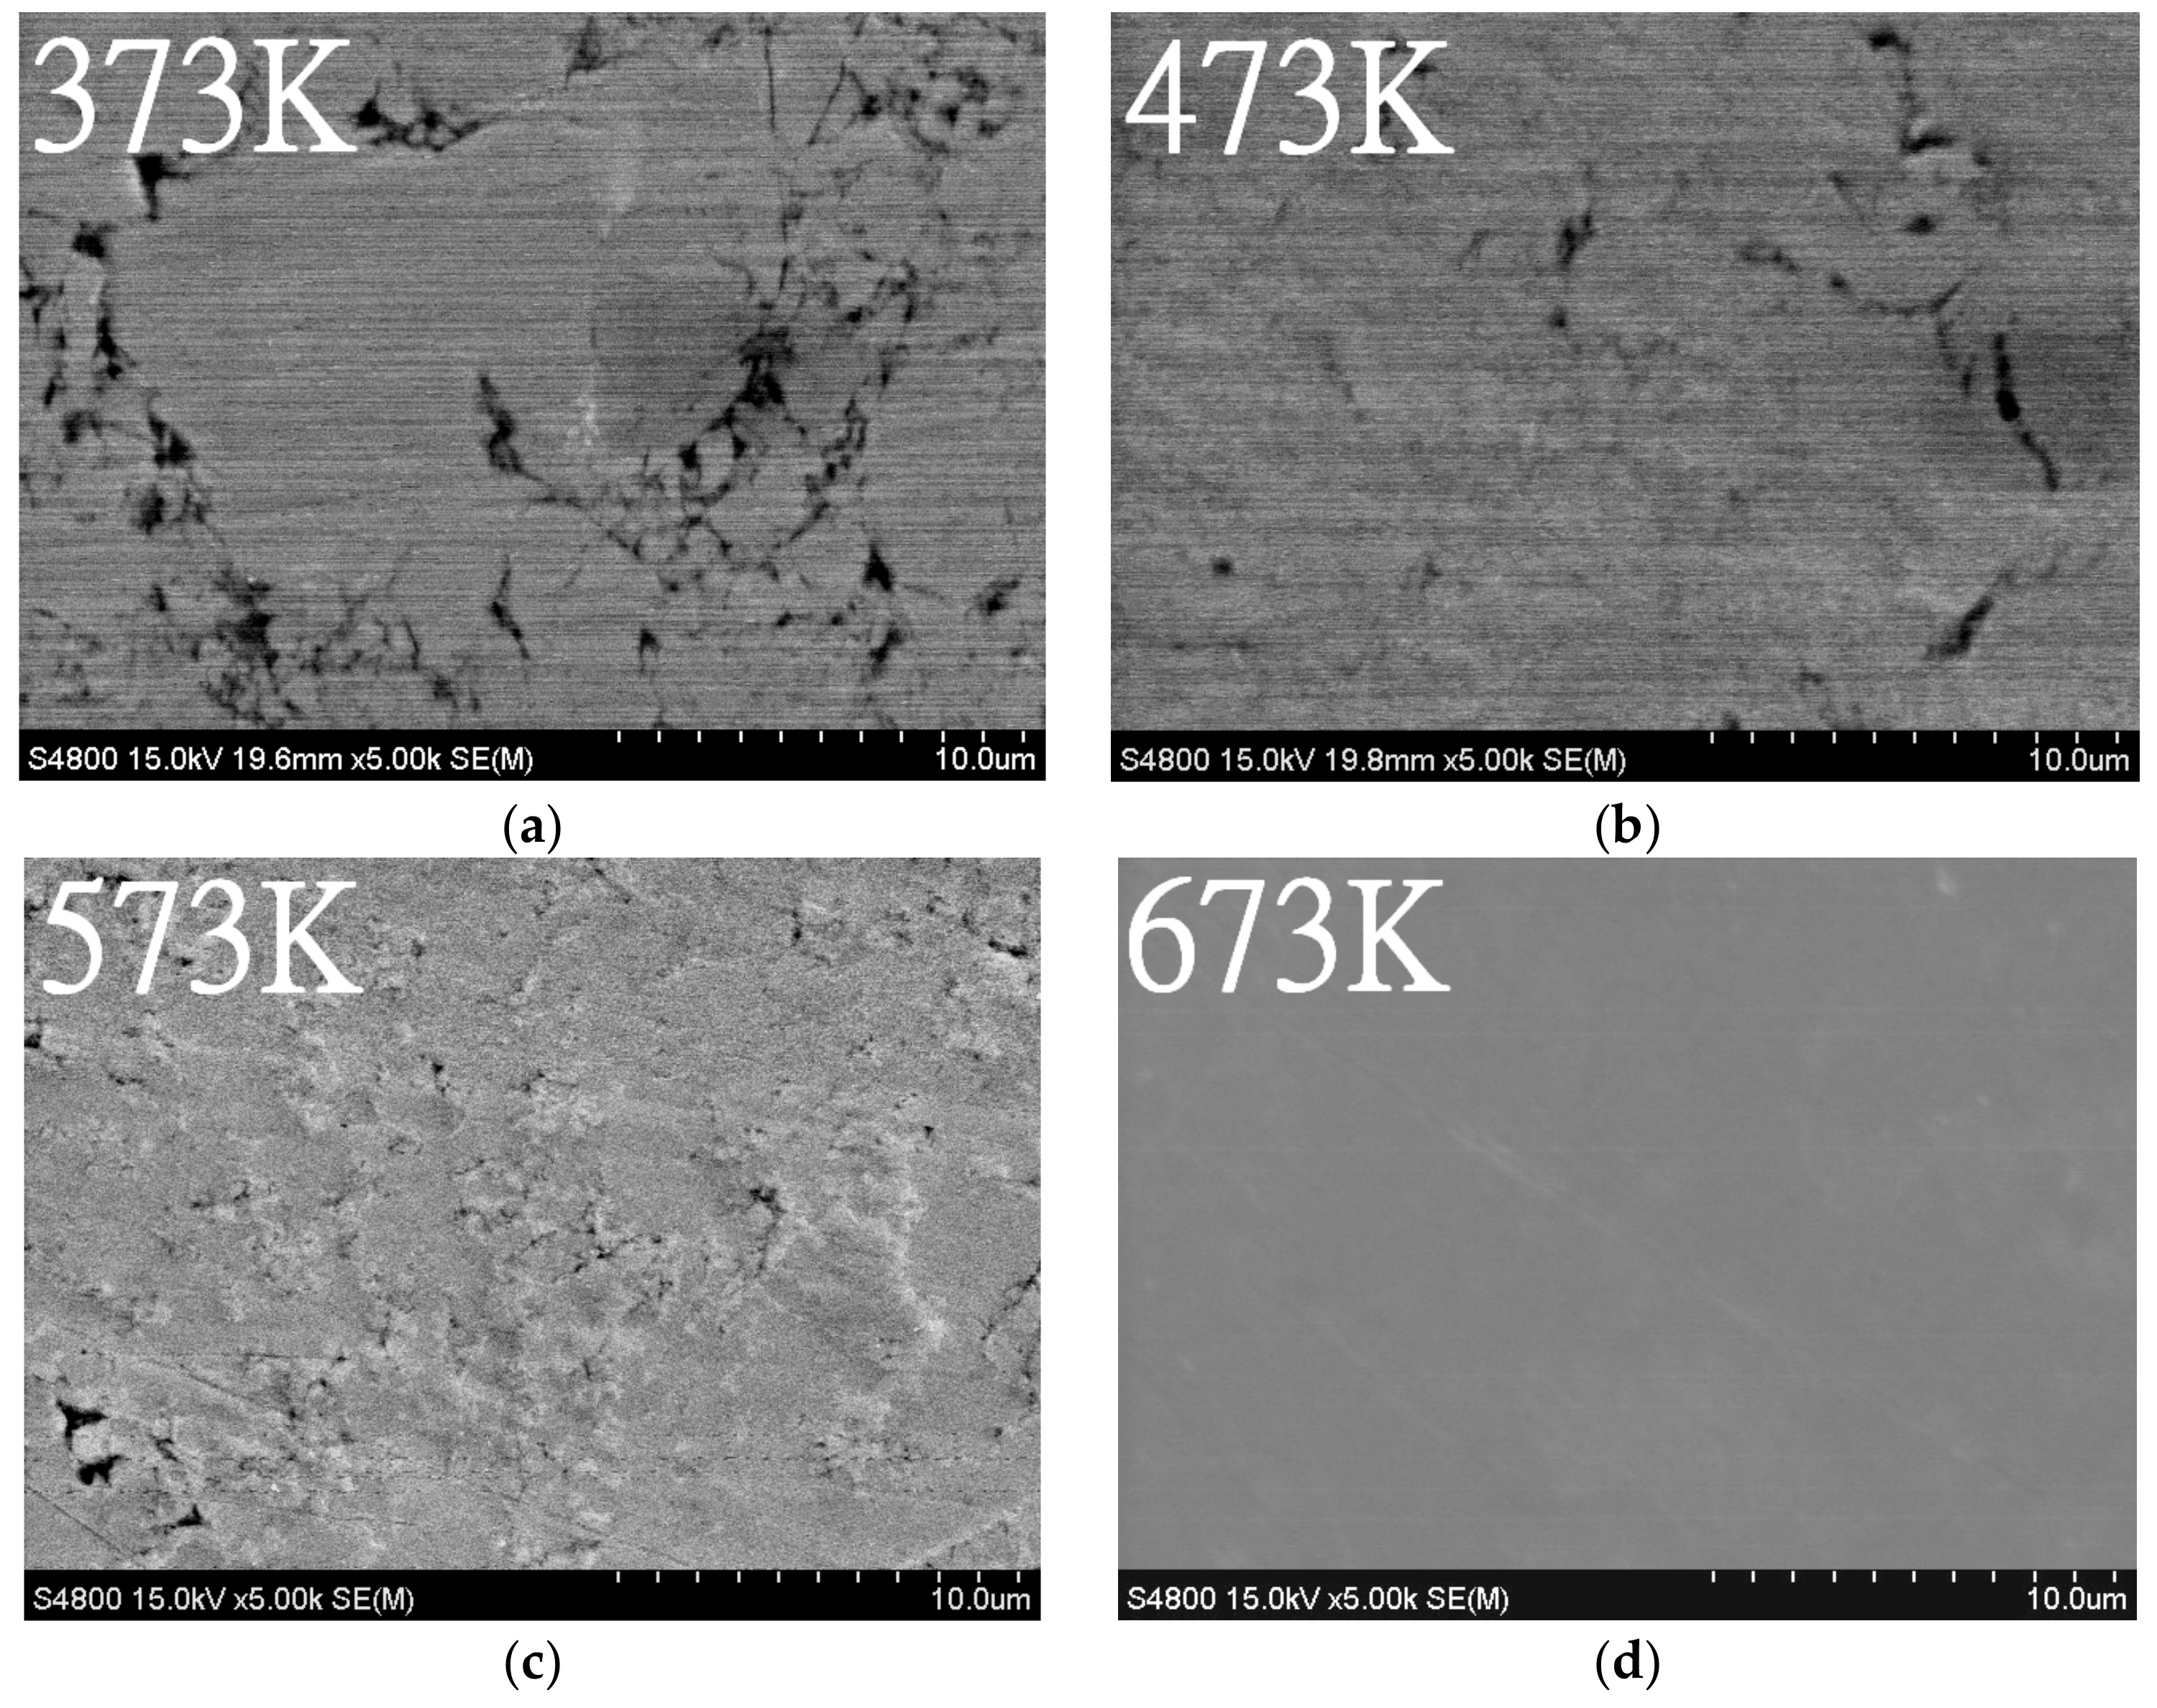
  • The β-Zn4Sb3 phase was found to be the main phase in vacuum-sintered specimens after sintering around 373–473 K. As the sintering temperature increased to 573 K, ZnSb phase gradually emerges and the amount of β-Zn4Sb3 phase gradually decreases. The evaporation of Zn during high-temperature sintering at 673 K can cause the complete disappearance of β-Zn4Sb3 phase, leading to the formation of an Sb and ZnSb equilibrium phase.
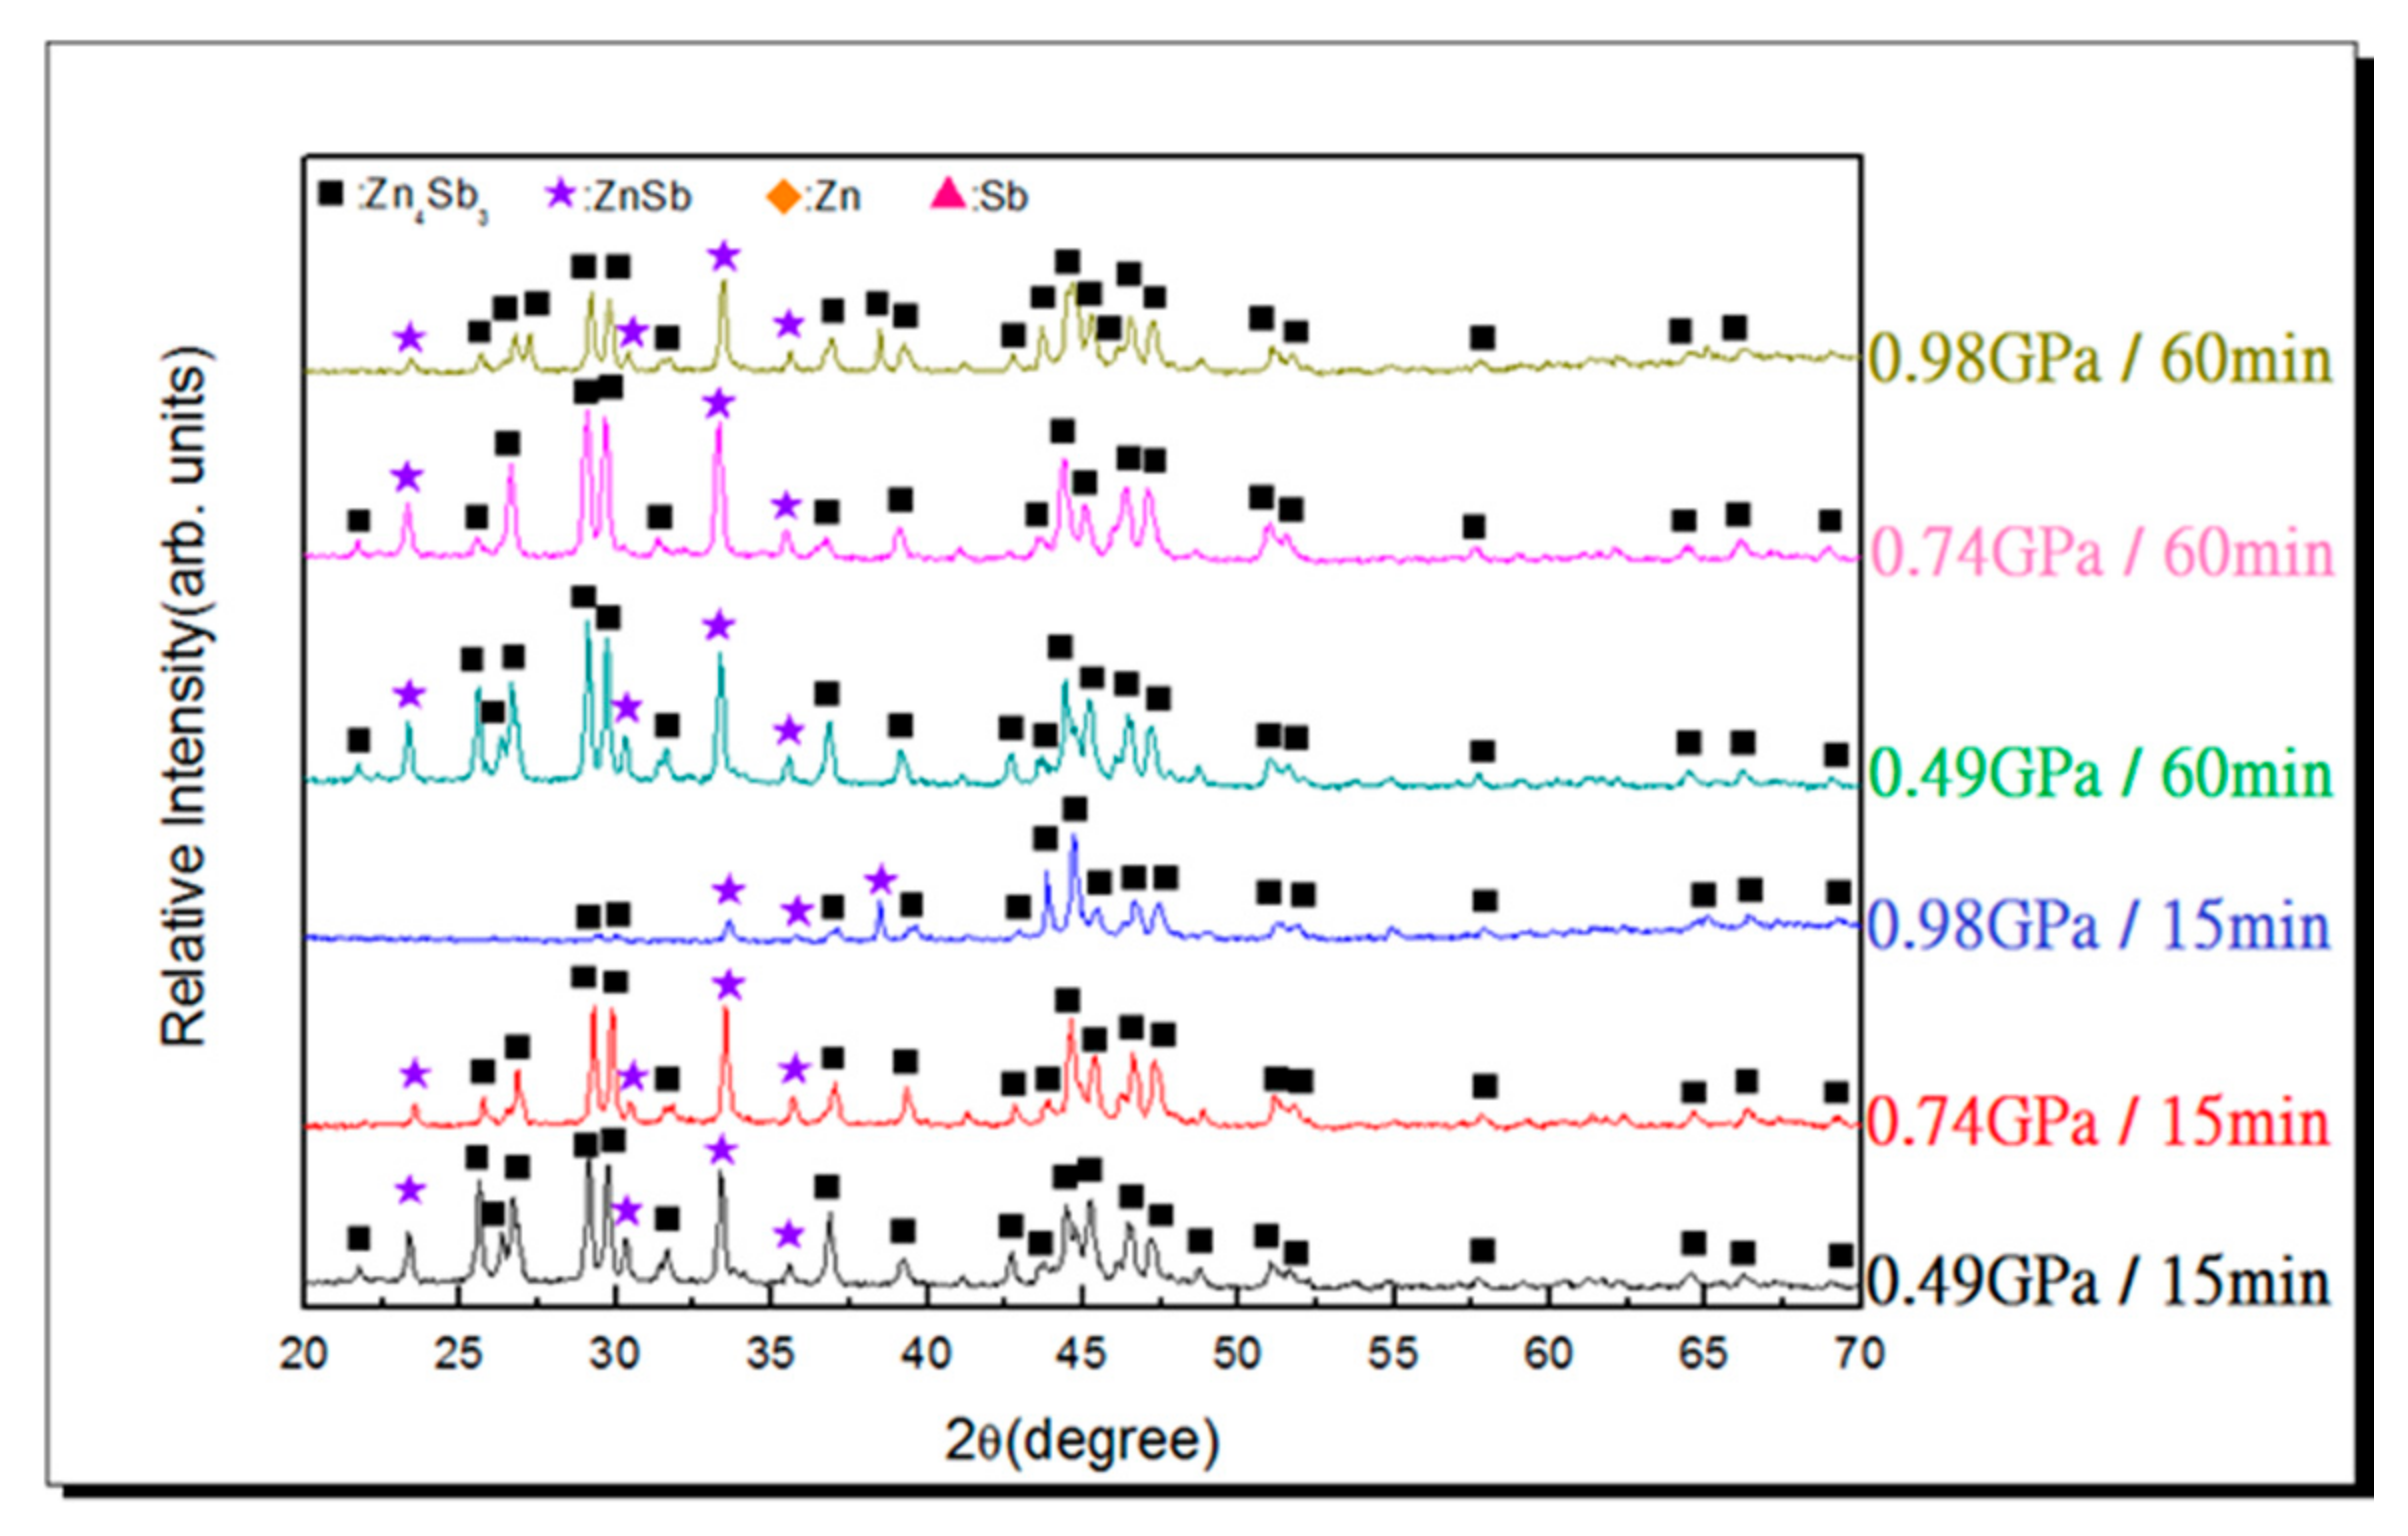
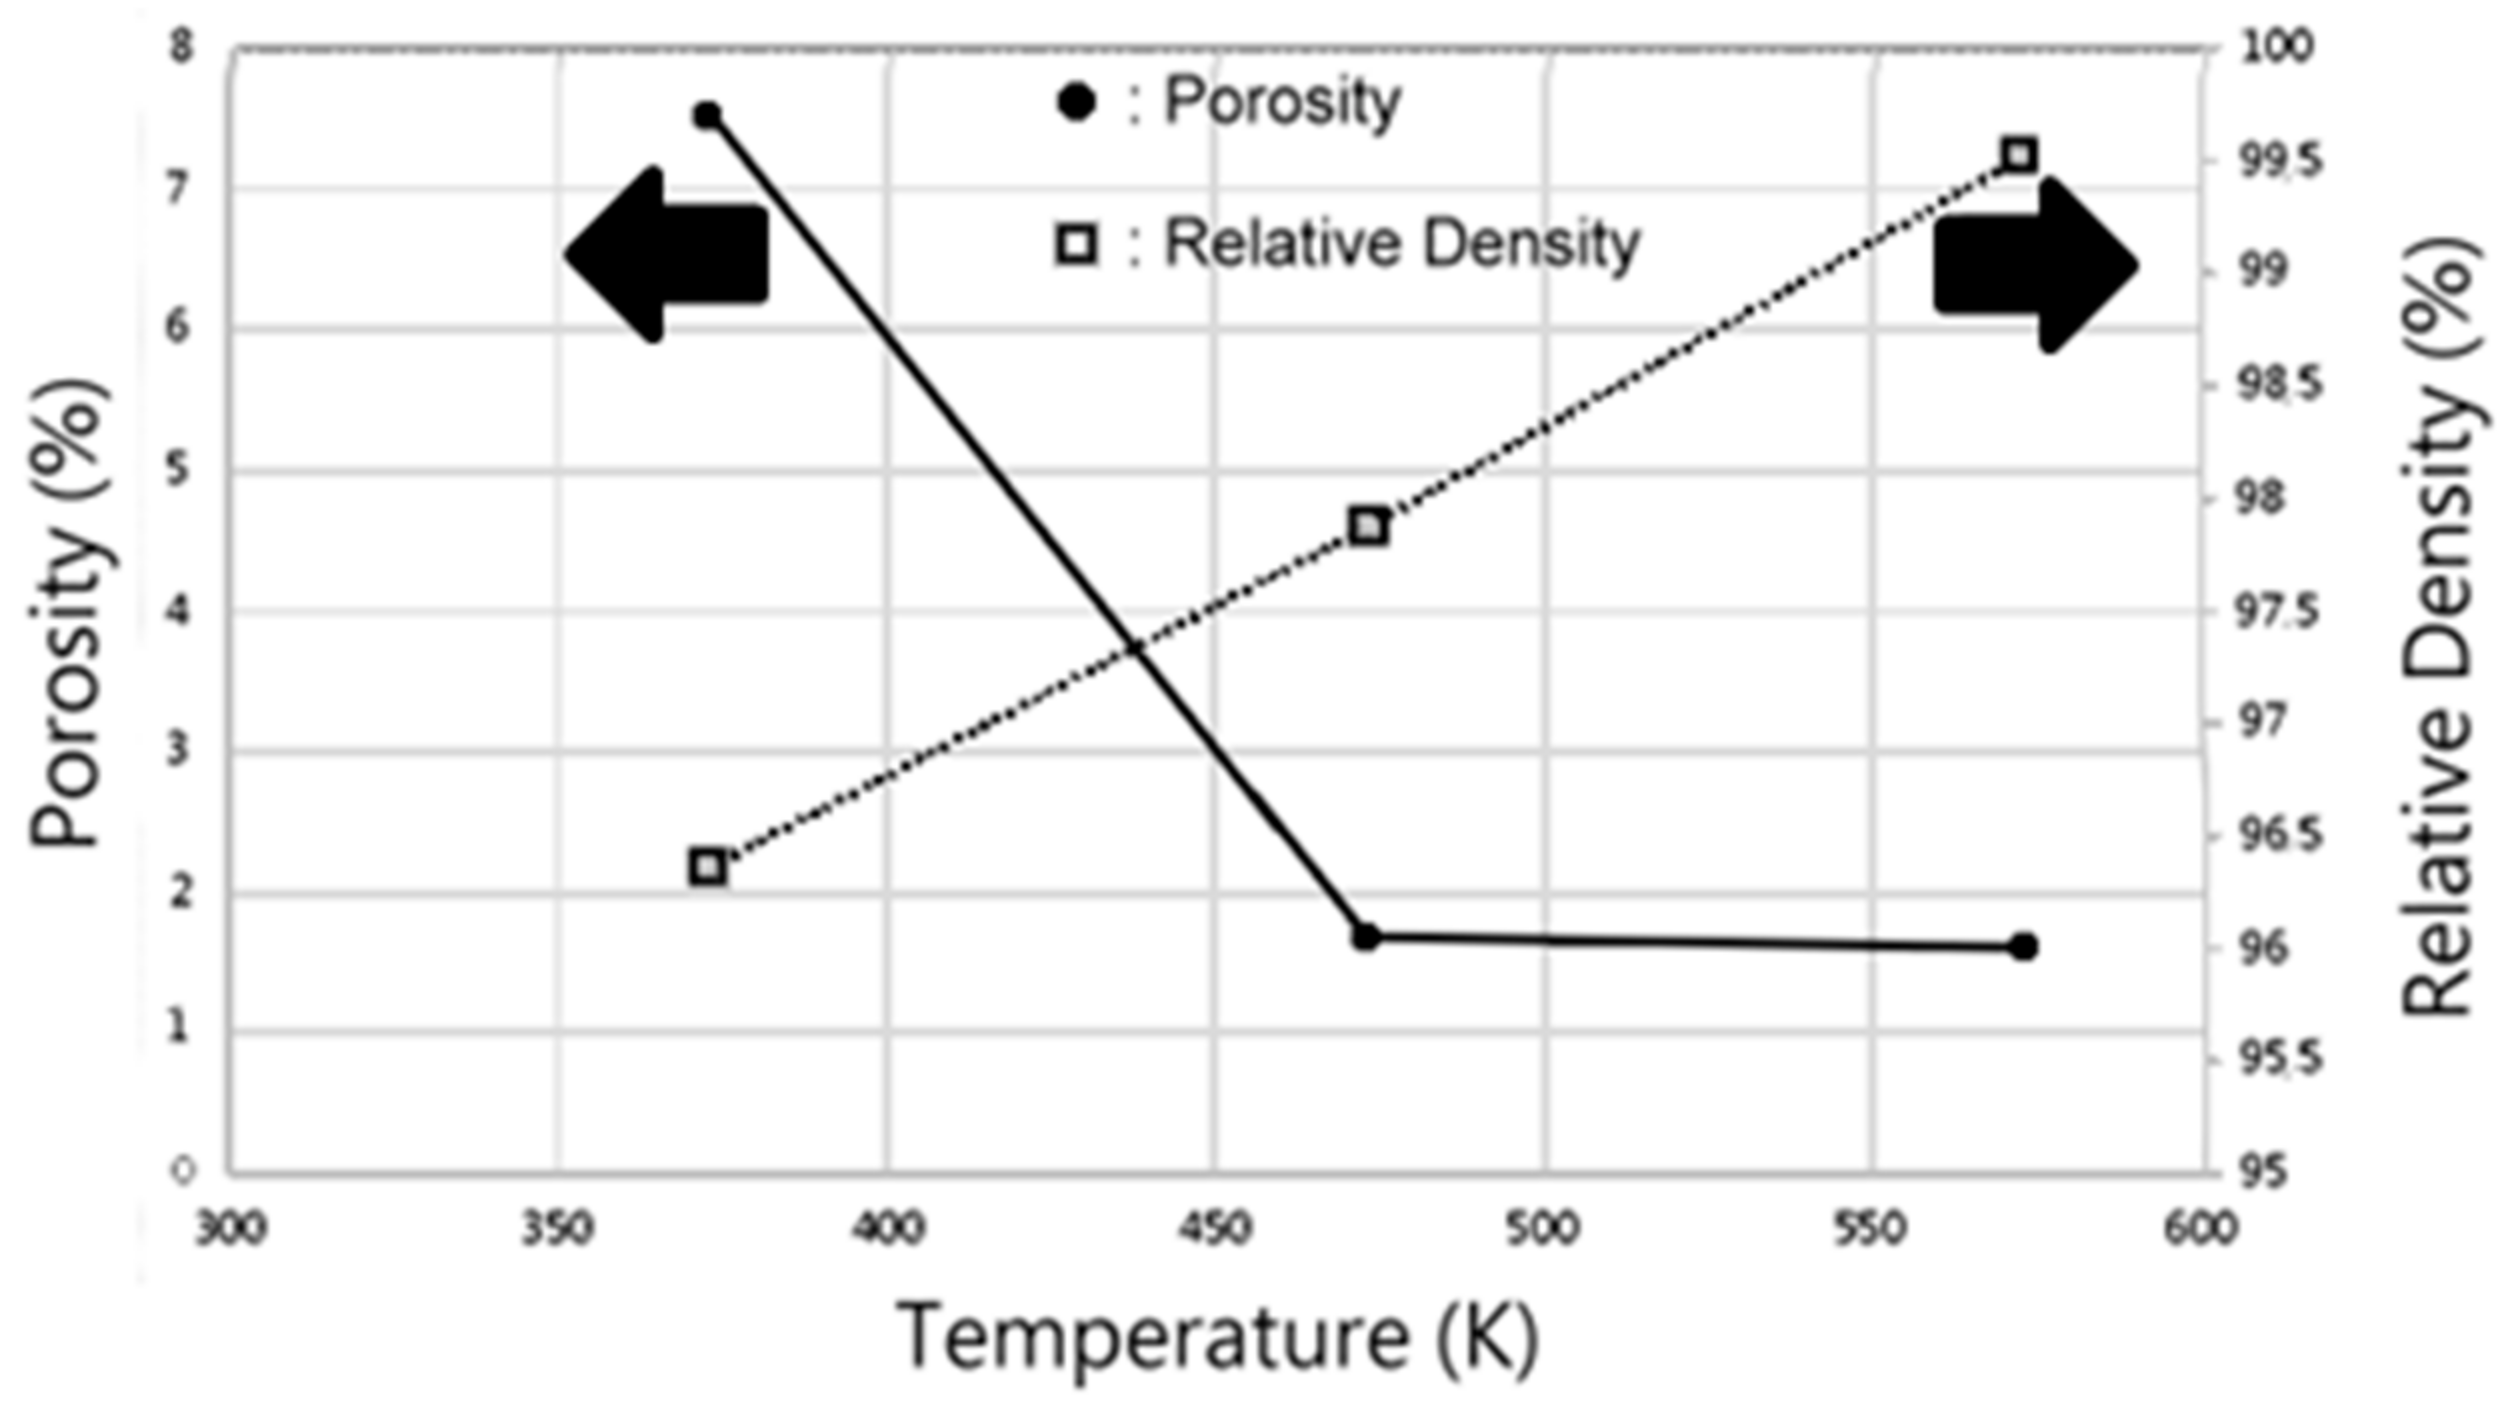
  • Under an applied pressure of 0.98 GPa at 473 K for a duration of 30 min, β-Zn4Sb3 powder can be vacuum hot pressed into a single β-Zn4Sb3 bulk with a density of 97.87%. Raising the applied pressure, duration, and temperature can moderately increase the relative density of the hot pressed bulk materials. However, excessive hot pressing temperature will reduce the proportion of the β-Zn4Sb3 phase.
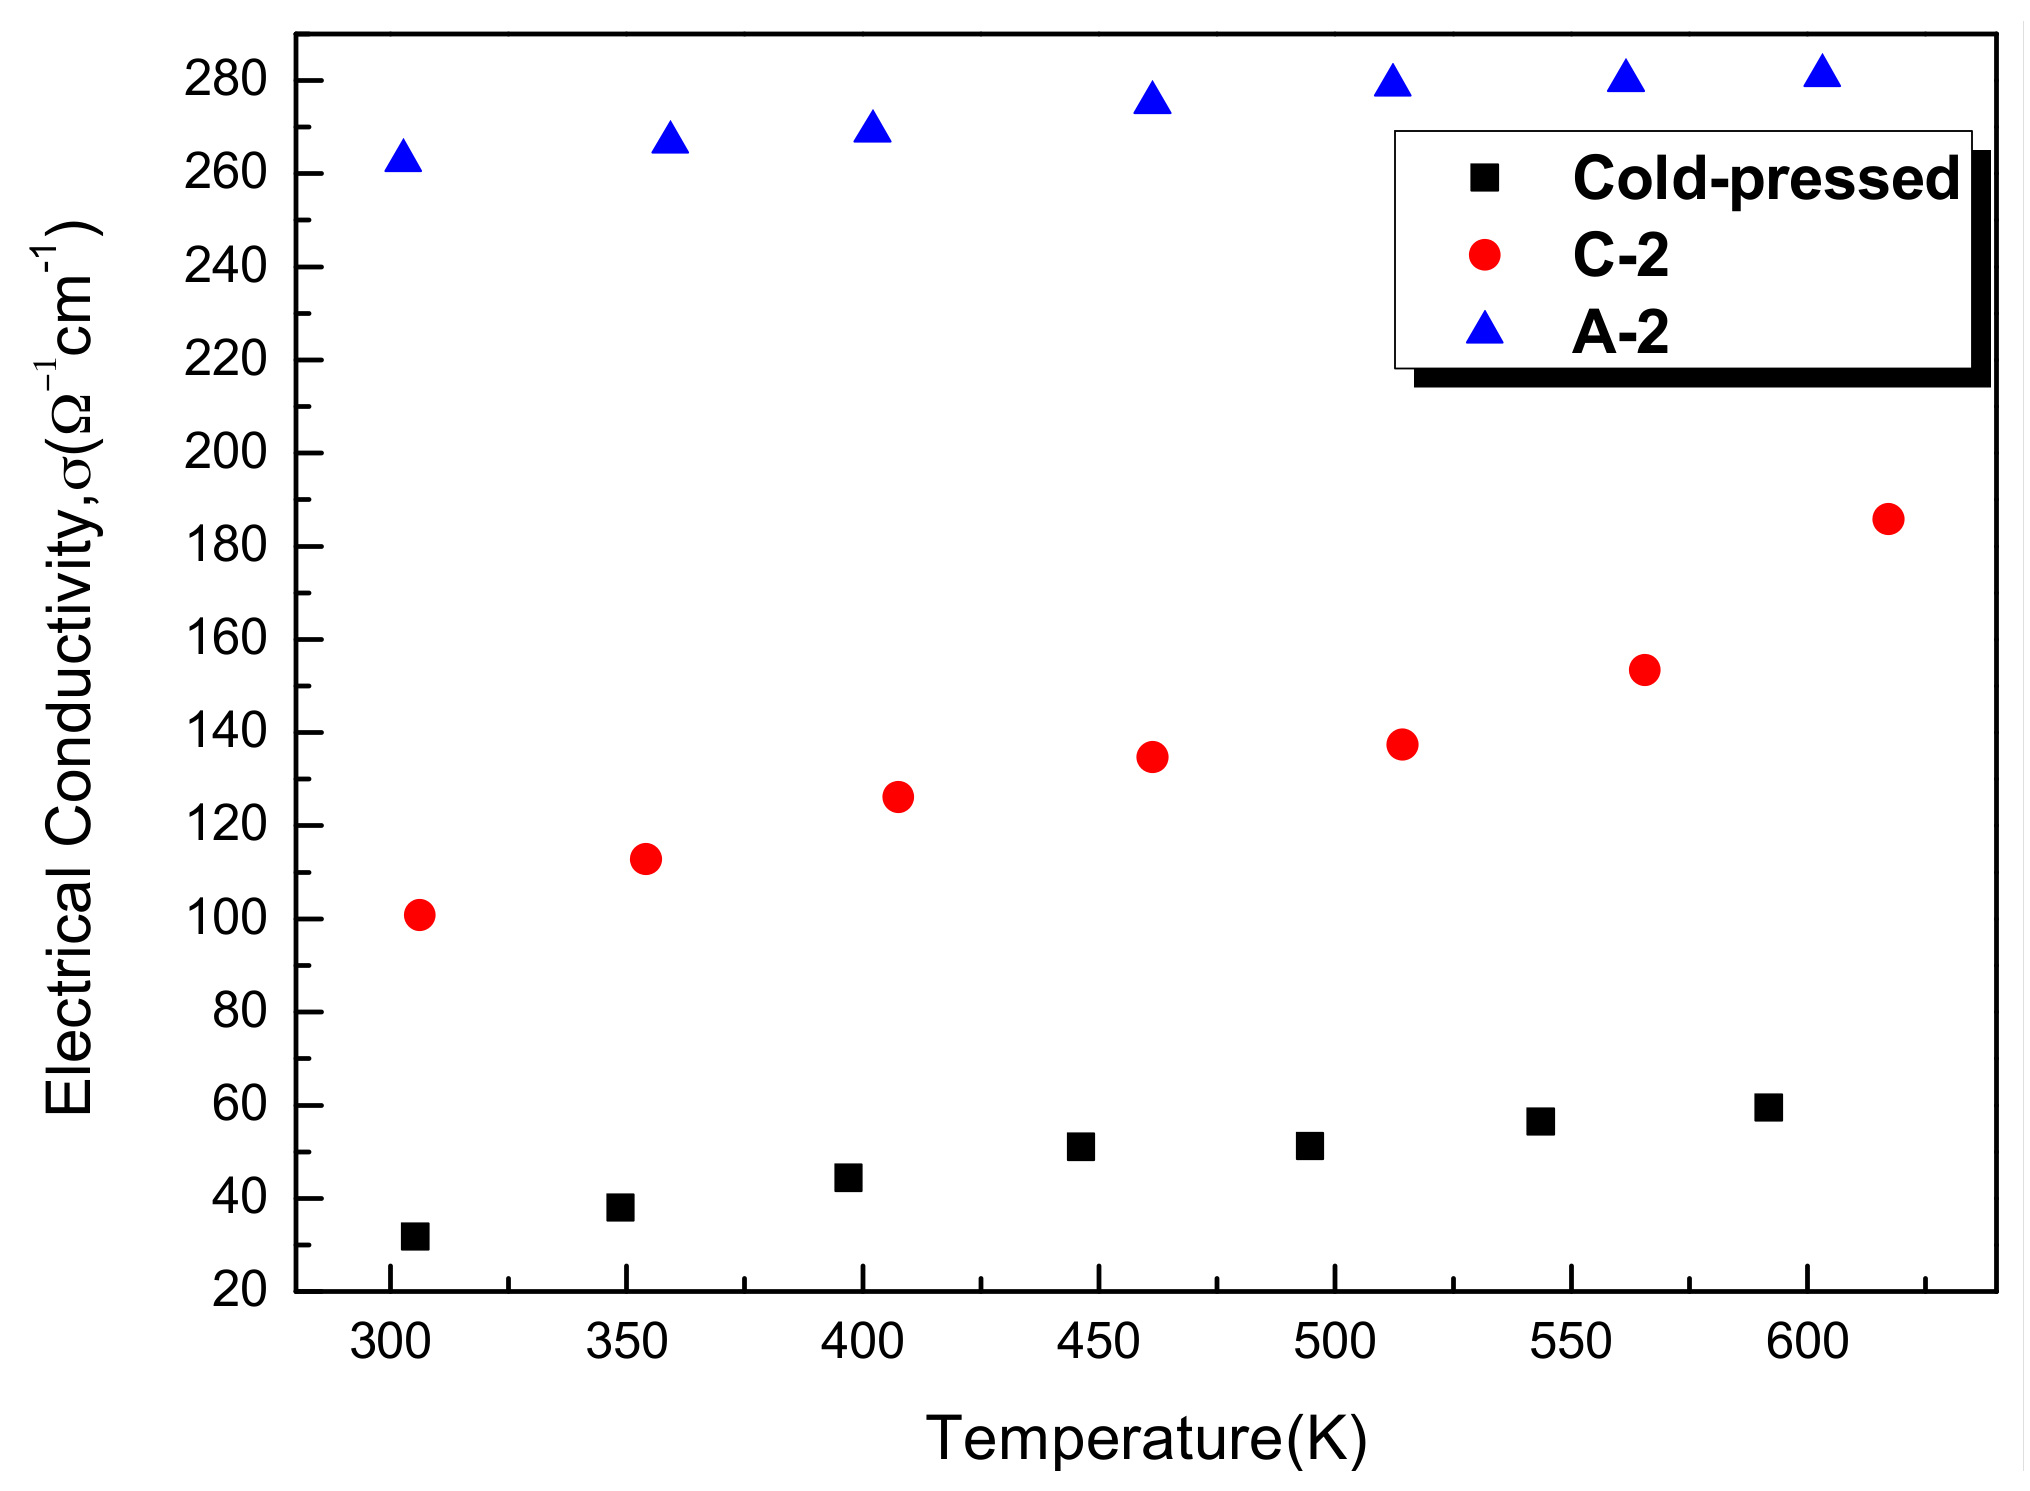
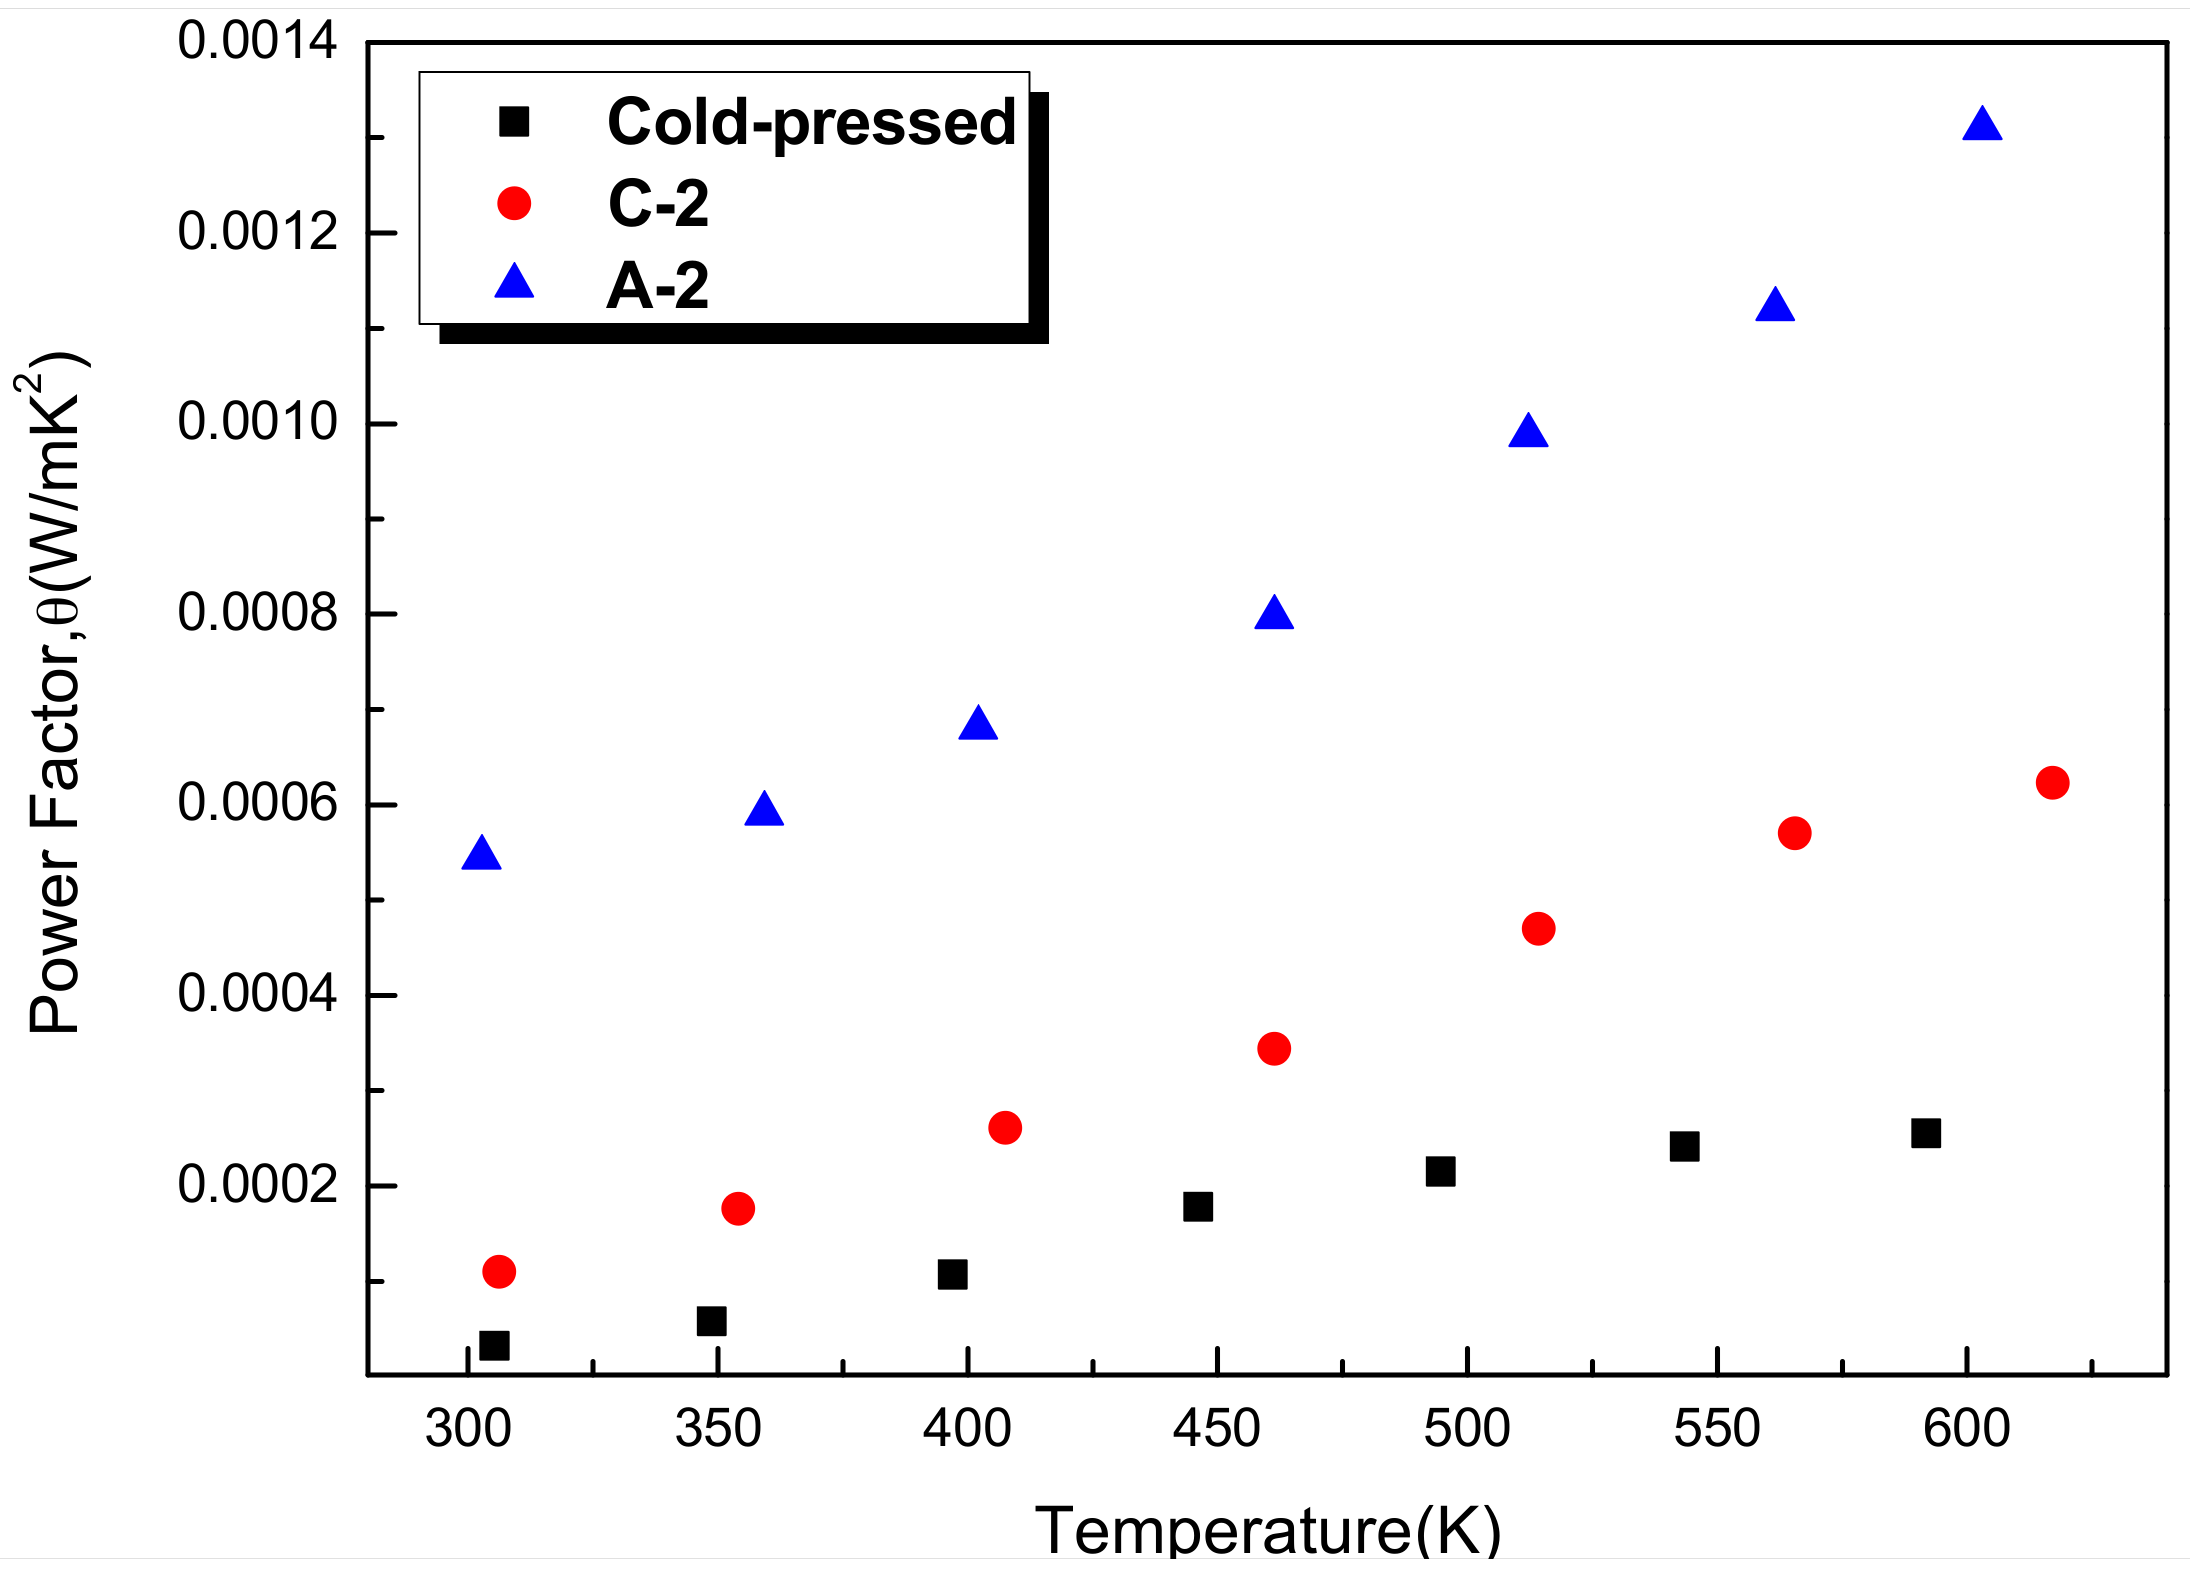
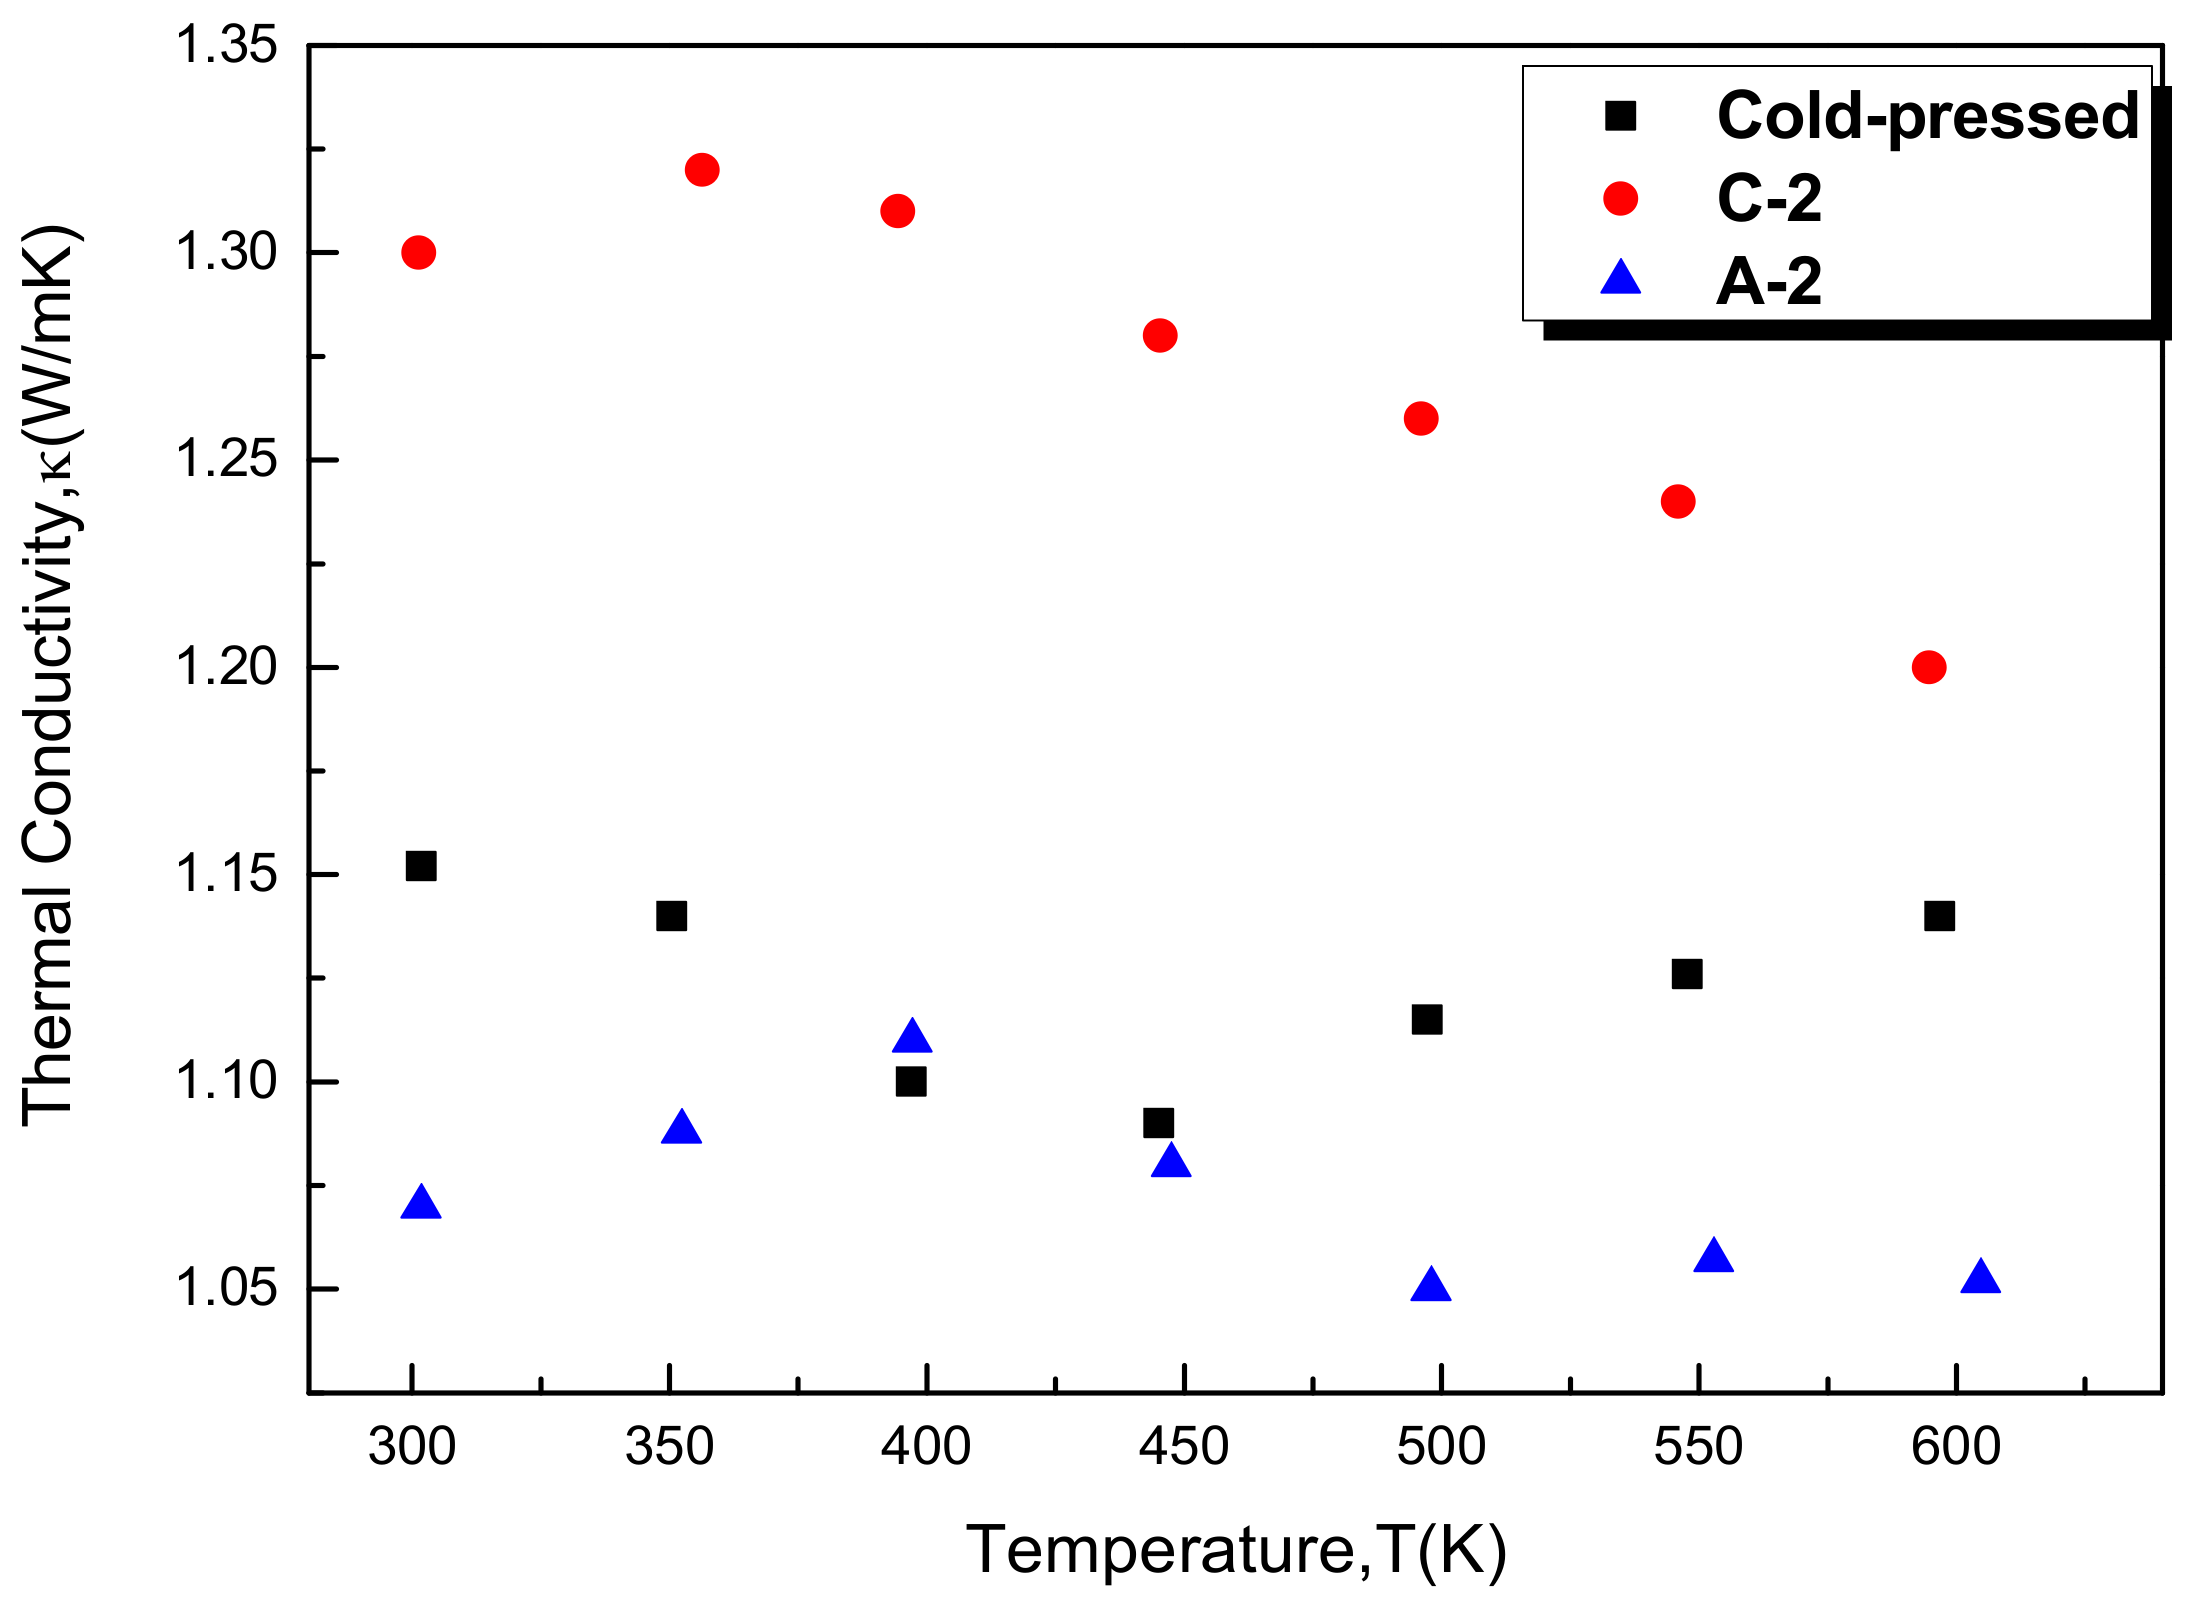
  • The β-Zn4Sb3 bulk exhibits p-type semiconducting properties. As the proportion of Zn4Sb3 increases, the Seebeck coefficient increases but the electrical conductivity decreases. The bulk specimen with single β-Zn4Sb3 phase exhibits the best thermoelectric properties with the power factor and ZT value is 1.31 × 10⁻³ W/mK2 and 0.81, respectively.

Author Contributions

P.-H.L. carried out the sample preparation and data analysis. P.-Y.L. designed the experimental procedure and prepared the manuscript.

Acknowledgments

This work was supported by the Ministry of Science and Technology of Taiwan, under grant no. MOST 105-2221-E-019-012 & 106-2221-E-019-025.

Conflicts of Interest

The authors declare no conflict of interest.

References

  1. Zhu, T.; Liu, Y.; Fu, C.; Heremans, J.P.; Snyder, J.G.; Zhao, X. Compromise and Synergy in High-Efficiency Thermoelectric Materials. Adv. Mater. 2017, 29, 1605884. [Google Scholar] [CrossRef] [PubMed]
  2. Tan, G.; Zhao, L.D.; Kanatzidis, M.G. Rationally Designing High-Performance Bulk Thermoelectric Materials. Chem. Rev. 2016, 116, 12123–12149. [Google Scholar] [CrossRef] [PubMed]
  3. DiSalvo, F.J. Thermoelectric cooling and power generation. Science 1999, 285, 703–706. [Google Scholar] [CrossRef] [PubMed]
  4. Mahan, G.; Sales, B.; Sharp, J. Thermoelectric materials: New approaches to an old problem. Phys. Today 1997, 50, 42–47. [Google Scholar] [CrossRef]
  5. Dmitriev, A.V.; Zvyagin, I.P. Current trends in the physics of thermoelectric materials. Phys. Usp. 2010, 53, 789–803. [Google Scholar] [CrossRef]
  6. Poudel, B.; Hao, Q.; Ma, Y.; Lan, Y.; Minnich, A.; Yu, B.; Yan, X.; Wang, D.; Muto, A.; Vashaee, D.; et al. High-Thermoelectric Performance of Nanostructured Bismuth Antimony Telluride Bulk Alloys. Science 2008, 320, 634–638. [Google Scholar] [CrossRef] [PubMed]
  7. Hong, M.; Chasapis, T.C.; Chen, Z.G.; Yang, L.; Kanatzidis, M.G.; Snyder, G.J.; Zou, J. n-Type Bi2Te3−xSex Nanoplates with Enhanced Thermoelectric Efficiency Driven by Wide-Frequency Phonon Scatterings and Synergistic Carrier Scatterings. ACS Nano 2016, 10, 4719–4727. [Google Scholar] [CrossRef] [PubMed]
  8. Hong, M.; Chen, Z.G.; Yang, L.; Zou, J. BixSb2−xTe3 nanoplates with enhanced thermoelectric performance due to sufficiently decoupled electronic transport properties and strong wide-frequency phonon scatterings. Nano Energy 2016, 20, 144–155. [Google Scholar] [CrossRef]
  9. Hong, M.; Chen, Z.G.; Yang, L.; Chasapis, T.C.; Kang, S.D.; Zou, Y.; Auchterlonie, G.J.; Kanatzidis, M.G.; Snyder, G.J.; Zou, J. Enhancing thermoelectric performance of SnSe1−xTex nanoplates through band engineering. J. Mater. Chem. A 2017, 5, 10713–10721. [Google Scholar] [CrossRef]
  10. Zhao, L.D.; Tan, G.; Hao, S.; He, J.; Pei, Y.; Chi, H.; Wang, H.; Gong, S.; Xu, H.; Dravid, V.P.; et al. Ultrahigh power factor and thermoelectric performance in hole-doped single-crystal SnSe. Science 2016, 351, 141–144. [Google Scholar] [CrossRef] [PubMed]
  11. Wei, T.R.; Tan, G.; Zhang, X.; Wu, C.F.; Li, J.F.; Dravid, V.P.; Snyder, G.J.; Kanatzidis, M.G. Distinct Impact of Alkali-Ion Doping on Electrical Transport Properties of Thermoelectric p-Type Polycrystalline SnSe. J. Am. Chem. Soc. 2016, 138, 8875–8888. [Google Scholar] [CrossRef] [PubMed]
  12. Li, J.; Chen, Z.; Zhang, X.; Sun, Y.; Yang, J.; Pei, Y. Electronic origin of the high thermoelectric performance of GeTe among the p-type group IV monotellurides. NPG Asia Mater. 2017, 9, e353. [Google Scholar] [CrossRef]
  13. Li, J.; Zhang, X.; Lin, S.; Chen, Z.; Pei, Y. Realizing the High Thermoelectric Performance of GeTe by Sb-Doping and Se-Alloying. Chem. Mater. 2017, 29, 605–611. [Google Scholar] [CrossRef]
  14. Hong, M.; Chen, Z.G.; Yang, L.; Zou, Y.C.; Dargusch, M.S.; Wang, H.; Zou, J. Realizing zT of 2.3 in Ge1−x−ySbxInyTe via Reducing the Phase-Transition Temperature and Introducing Resonant Energy Doping. Adv. Mater. 2018, 30, 1705942. [Google Scholar] [CrossRef] [PubMed]
  15. Hong, M.; Chen, Z.G.; Yang, L.; Liao, Z.M.; Zou, Y.C.; Chen, Y.H.; Matsumura, S.; Zou, J. Achieving zT > 2 in p-Type AgSbTe2−xSex Alloys via Exploring the Extra Light Valence Band and Introducing Dense Stacking Faults. Adv. Energy Mater. 2018, 8, 1702333. [Google Scholar] [CrossRef]
  16. Caillat, T.; Fleurial, J.P.; Borshchevsky, A. Preparation and thermoelectric properties of semiconducting Zn4Sb3. J. Phys. Chem. Solids 1997, 58, 1119–1125. [Google Scholar] [CrossRef]
  17. Zhu, T.J.; Zhao, X.B.; Yan, M.; Hu, S.H.; Li, T.; Zhou, B.C. Transport properties of β-Zn4Sb3 prepared by vacuum melting. Mater. Lett. 2000, 46, 44–48. [Google Scholar] [CrossRef]
  18. Izard, V.; Record, M.C.; Tedenac, J.C. Mechanical alloying of a new promising thermoelectric material, Zn4Sb3. J. Alloys Compd. 2002, 345, 257–264. [Google Scholar] [CrossRef]
  19. Aizawa, T.; Iwaisako, Y. Solid-state synthesis of single-phase Zn4Sb3 bulk sample on the route of the bulk mechanical alloying. In Proceedings of the IEEE 18th International Conference on Thermoelectrics, Baltimore, MD, USA, 29 August–2 September 1999; pp. 173–176. [Google Scholar]
  20. Rowe, D.M.; Schuka, V.S. The effect of phonon-grain boundary scattering on the lattice thermal conductivity and thermoelectric conversion efficiency of heavily doped fine-grained, hot-pressed silicon germanium alloy. J. Appl. Phys. 1981, 52, 7421–7426. [Google Scholar] [CrossRef]
  21. Okamura, C.; Ueda, T.; Hasezaki, K. Preparation of single phase β-Zn4Sb3 thermoelectric materials by mechanical grinding process. Mater. Trans. 2010, 51, 152–155. [Google Scholar] [CrossRef]
  22. Okamura, C.; Ueda, T.; Hasezaki, K. Preparation of single-phase ZnSb thermoelectric materials using mechanical grinding process. Mater. Trans. 2010, 51, 860–862. [Google Scholar] [CrossRef]
  23. Ueno, K.; Yamamoto, A.; Noguchi, T.; Inoue, T.; Sodeoka, S.; Takazawa, H.; Lee, C.H.; Obara, H. Optimization of hot-press conditions of Zn4Sb3 for high thermoelectric performance: I. Physical properties and thermoelectric performance. J. Alloys Compd. 2004, 384, 254–260. [Google Scholar] [CrossRef]
  24. Mozharivskyj, Y.; Pecharsky, A.O.; Bud’ko, S.; Miller, G.J. A Promising Thermoelectric Material: Zn4Sb3 or Zn6−δSb5. Its Composition, Structure, Stability, and Polymorphs. Structure and Stability of Zn1−δSb. Chem. Mater. 2004, 16, 1580–1589. [Google Scholar] [CrossRef]
  25. Ueno, K.; Yamamoto, A.; Noguchi, T.; Li, C.H.; Inoue, T.; Sodeoka, S.; Obara, H. Effect of impurity oxygen concentration on the thermoelectric properties of hot pressed Zn4Sb3. J. Alloys Compd. 2006, 417, 259–263. [Google Scholar] [CrossRef]
  26. Cui, J.L.; Mao, L.D.; Chen, D.Y.; Qian, X.; Liu, X.L.; Yang, W. Effects of a Cu-contained compound on the microstructures and thermoelectric properties of Zn–Sb based alloys. Curr. Appl. Phys. 2009, 9, 713–716. [Google Scholar] [CrossRef]
  27. Itoh, T.; Shan, J.; Kitagawa, K. Thermoelectric properties of β-Zn4Sb3 synthesized by mechanical alloying and pulse discharge sintering. J. Propul. Power 2008, 24, 353–358. [Google Scholar] [CrossRef]
  28. Lee, J.S.; Oh, T.S.; Hyun, D.B. Thermoelectric properties of the hot-press (Bi0.2Sb0.8)2Te3 alloy with addition of BN and WO3 powders. J. Mater. Sci. 2000, 35, 881–887. [Google Scholar] [CrossRef]
  29. Wang, Y.; Lu, Z.; Ruan, X. First principles calculation of lattice thermal conductivity of metals considering phonon-phonon and phonon–electron scattering. J. Appl. Phys. 2016, 119, 225109. [Google Scholar] [CrossRef]
  30. Liao, B.; Qiu, B.; Zhou, J.; Huberman, S.; Esfarjani, K.; Chen, G. Significant reduction of lattice thermal conductivity by the electron-phonon interaction in silicon with high carrier concentrations: A first-principles study. Phys. Rev. Lett. 2015, 114, 115901. [Google Scholar] [CrossRef] [PubMed]
  31. Ur, S.C.; Nash, P.; Kim, I.H. Mechanical alloying and thermoelectric properties of Zn4Sb3. J. Mater. Sci. 2003, 38, 3553–3558. [Google Scholar] [CrossRef]
  32. Ur, S.C.; Kim, I.H.; Nash, P. Thermoelectric properties of Zn4Sb3 directly synthesized by hot pressing. Mater. Lett. 2004, 58, 2132–2136. [Google Scholar] [CrossRef]
  33. Cui, J.L.; Fu, H.; Chen, D.Y.; Mao, L.D.; Liu, X.L.; Yang, W. Thermoelectric properties of Cu-added Zn-Sb based alloys with multi-phase equilibrium. Mater. Charact. 2009, 60, 824–828. [Google Scholar] [CrossRef]
  34. Cui, J.; Liu, X.; Yang, W.; Chen, D.; Mao, L.; Qian, X. Effects of Al addition on the thermoelectric properties of Zn-Sb based alloys. Chin. J. Mech. Eng. 2009, 22, 270–275. [Google Scholar] [CrossRef]
  35. Ruan, X.; Xiao, W. Preparation and thermoelectric properties of SiO2/β-Zn4Sb3 nanocomposite materials. J. Wuhan Univ. Technol.-Mater. 2009, 24, 694–697. [Google Scholar] [CrossRef]
Figure 1. X-ray diffraction (XRD) patterns of mechanically alloyed powders with different Zn rich compositions.
Energies 11 01200 g001
Figure 2. XRD patterns of bulk specimens with 0.6 at. % Zn rich composition vacuum sintered at different temperatures for 30 min.
Energies 11 01200 g002
Figure 3. XRD patterns of bulk specimens with 0.6 at. % Zn rich composition hot pressed at different temperatures. Pressure: 0.98 GPa, time: 30 min.
Energies 11 01200 g003
Figure 4. XRD patterns of bulk specimens with 0.6 at. % Zn rich composition hot pressed at 473 K under different pressures and times.
Energies 11 01200 g004
Figure 5. Scanning electron microscopy (SEM) micrographs of bulk specimen with 0.6 at. % Zn rich composition hot pressed at different temperatures. Pressure: 0.98 GPa, time: 30 min. (a) 373K; (b) 473 K; (c) 573 K; (d) 673 K.
Energies 11 01200 g005
Figure 6. Density and porosity of vacuum hot pressed samples prepared with different temperatures. Pressure: 0.98 GPa, time: 30 min.
Energies 11 01200 g006
Figure 7. Density and porosity of vacuum hot pressed samples prepared with different time and pressure. Pressure: 0.98 GPa, time: 30 min.
Energies 11 01200 g007
Figure 8. Variation of the Seebeck coefficient as a function of temperature for the hot pressed Zn4Sb3 specimens.
Energies 11 01200 g008
Figure 9. Variation of the electrical conductivity as a function of temperature for the hot pressed Zn4Sb3 specimens.
Energies 11 01200 g009
Figure 10. Variation of the power factor as a function of temperature for the hot pressed Zn4Sb3 specimens.
Energies 11 01200 g010
Figure 11. Variation of the thermal conductivity as a function of temperature for the hot pressed Zn4Sb3 specimens.
Energies 11 01200 g011
Figure 12. Variation of the ZT values as a function of temperature for the hot pressed Zn4Sb3 specimens.
Energies 11 01200 g012
Table 1. Sample designations of vacuum hot pressing samples.
Sample CodesPressure (GPa)Temperature (K)Time (min)
A-10.9837330
A-20.9847330
A-30.9857330
B-10.4947315
B-20.7447315
B-30.9847315
C-10.4947360
C-20.7447360
C-30.9847360
Table 2. Thermoelectric properties of Zn4Sb3 bulk specimens measured at 600 K.
Codeα (μV/K)σ−1cm−1)θ (W/mK2)κ (W/mK)ZTRelative Density (%)Phases
cold-pressed207.159.50.000261.140.1381.05Zn4Sb3 + Zn
C-2183.2185.80.000621.20.3197.02Zn4Sb3 + ZnSb
A-2215.8281.10.001310.9820.8197.87Zn4Sb3
Table 3. Thermoelectric properties at 600 K for Zn4Sb3 bulk specimens prepared by different methods.
Preparation Methods *κ (W/mK)ZTRelative Density (%)PhasesReferences
MA→HT (673 K)0.70.24>95ZnSb + ZnItoh [27]
MA→HT (723 K)0.451.0>95Zn4Sb3
Melting crushing HP HT 0.71.096–98Zn4Sb3Caillat [16]
Vacuum melting0.7 a0.32-Zn4Sb3Zhu [17]
HP0.7 a1.298.5Zn4Sb3Ur [32]
HP0.830.999.6Zn4Sb3Ueno [23]
Melting→MA→HT1.00.61-Zn4Sb3 + ZnSb + Cu2Sb + ZnCui [33]
0.90.47-Zn4Sb3
Melting→MA→HT0.620.5-Zn4Sb3 + ZnSb + AlSbCui [34]
Melting to MA, the ingot were coated by SiO2, then HT0.60.7-Zn4Sb3 + SiO2Ruan [35]
0.840.56-Zn4Sb3
* HP: hot pressing, HT: heat treatment, MA: mechanical alloying. a Denotes that κ was estimated from the graph of thermal conductivity as a function of temperature in [4].

