The research methodology that was used to find out the impact that environmental taxes have had on the Baltic States’ sustainable energy development goals is presented in the following sections.
4.1. Framework of Energy Indicators for Sustainable Development
Sustainable energy development is the main energy policy goal of the EU. The EU has established three main priorities for sustainable energy development: competitiveness, environmental sustainability, and energy supply security. The competitiveness is linked to the EU strategy Europe 2020, which was established in order to encourage the EU MS to be among the most competitive countries in the world regarding sustainable energy development. Another important target for the EU is to achieve the environmental sustainability of the energy sector. The main attributes of environmental sustainability in the energy sector are reducing GHG emissions, increasing the utilization of renewable energy sources, and improving energy efficiency. Energy security is a core problem for the EU; therefore, diversifying energy supplies and reducing the energy dependency of EU MS are among the sustainable development priorities for the EU’s energy sector.
Several indicator frameworks were created in order to assess sustainable energy development trends in specific countries. Among these, the Energy for Sustainable Development Indicators (ESDI) framework is the most widely applied. It was first developed by the joint efforts of five international agencies and organizations: the International Atomic Energy Agency, the United Nations Department of Economic and Social Affairs, the International Energy Agency, Eurostat, and the European Environment Agency. These organizations are recognized worldwide as leaders in energy and environmental statistics and analysis [
21]. The framework outlines general guidelines and specific methodology sheets for 30 energy indicators in order for statisticians, analysts, policymakers, and academics to analyze the effects of energy policies on the social, economic, and environmental dimensions of sustainable development. The nine indicators from the main ESDI list, which are linked to the economic, social, and environmental dimensions of sustainable energy development, were selected for this study. A comprehensive description of the selected ESDI indicators for this study, and their links to the EU’s energy and environmental policies targets, can be found in [
42]. Other empirical studies also applied some indicators from the ESDI framework. The Energy for Sustainable Development framework has also been applied to sustainability assessments of electricity market models [
43,
44,
45,
46], energy-efficiency policies [
47,
48], and the impact of corporate social responsibility on sustainable energy development [
49,
50].
Trends in the energy intensity of the economy and primary energy consumption can be analyzed by applying the economic indicators from the EISD list. Social indicators can address public health, energy independence, and trends in atmospheric pollution; renewable energy development can be analyzed by applying environmental indicators from the EISD list. These indicators are able to address the requirements of the main EU energy policy documents that are linked to the security of energy supply, promotion of renewable energy sources, and improvements in energy efficiency and climate change mitigation. The indicators framework for the comparative assessment of achievements in implementing priorities of sustainable energy development goals is given in
Table 7.
Selected indicators from the EISD list that are linked to EU sustainable energy development targets can be also linked to each other via the chain of mutual impacts. These indicators enable the creation of a comprehensive policy framework that can monitor the progress achieved by EU MS in implementing sustainable energy development goals. The framework can also track other various interacting policy measures that are linked to specific indicators of sustainable energy development. Policy makers in the energy sector can apply the EISD as they provide economic, social, and environmental data that is linked in a coherent and consistent way to sustainable energy development. This framework is very useful for making comparisons between countries, analyzing sustainable energy development trends, and providing verifiable assessments of policies and measures.
In the following sections, the changes to the most important sustainable energy development indicators in Lithuania, Latvia, and Estonia are analyzed by applying graphical analysis and methods of descriptive statistics, correlation, and regression analysis, and seeking to define the best performing country in a way that links this performance with results in implementing green budget reform.
4.2. Dynamics of Sustainable Energy Development Indicators in the Baltic States
The dynamics of sustainable energy development indicators in the Baltic States between 2005 and 2015 years are given in
Figure 6,
Figure 7,
Figure 8,
Figure 9,
Figure 10,
Figure 11,
Figure 12,
Figure 13 and
Figure 14 below. The most relevant indicator that addresses sustainable energy development trends is linked to energy efficiency, or energy intensity. Energy intensity is being assessed as the final or primary energy consumption ratio to GDP. This indicator expresses the aim of Strategy Europe 2020 and the Energy and Climate package, which is linked to energy efficiency improvement. This indicator addresses other main targets of policies that promote sustainable energy, such as: environmental sustainability, competitiveness, and security of energy supply. The reduction of the energy intensity of GDP in the Baltic States influences the reduction of atmospheric pollution and GHG emission reductions. It also increases the competitiveness of the economy, since decoupling energy consumption from GDP growth is an indicator of the increased competitiveness of the economy, as energy is expensive and has a high burden on economic activities. In addition, a decrease in energy intensity indicates an increase in energy supply security in terms of reducing energy import dependencies, as less energy is required to produce the same added value in the country [
50].
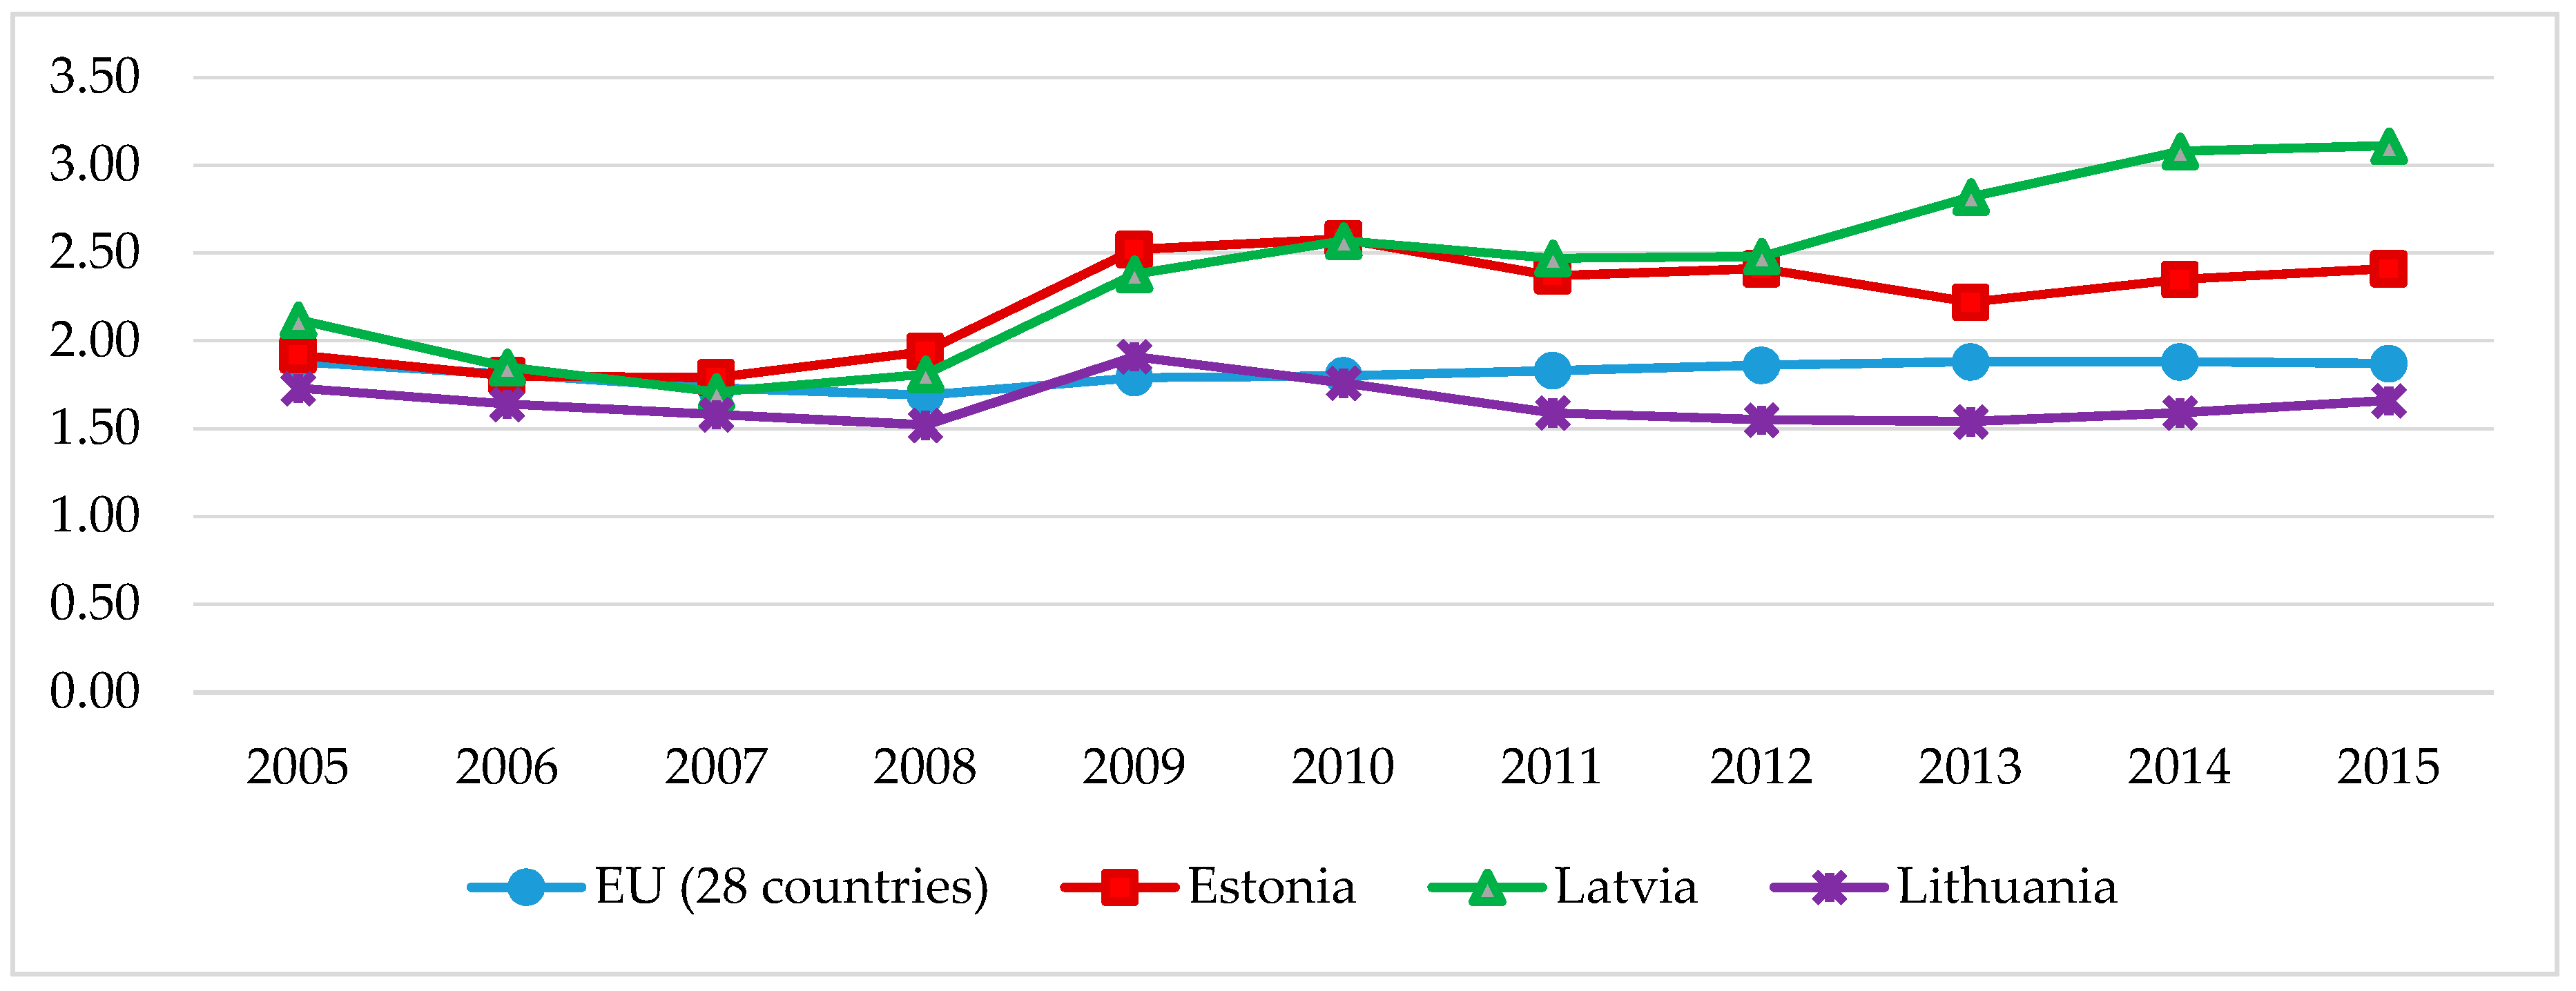
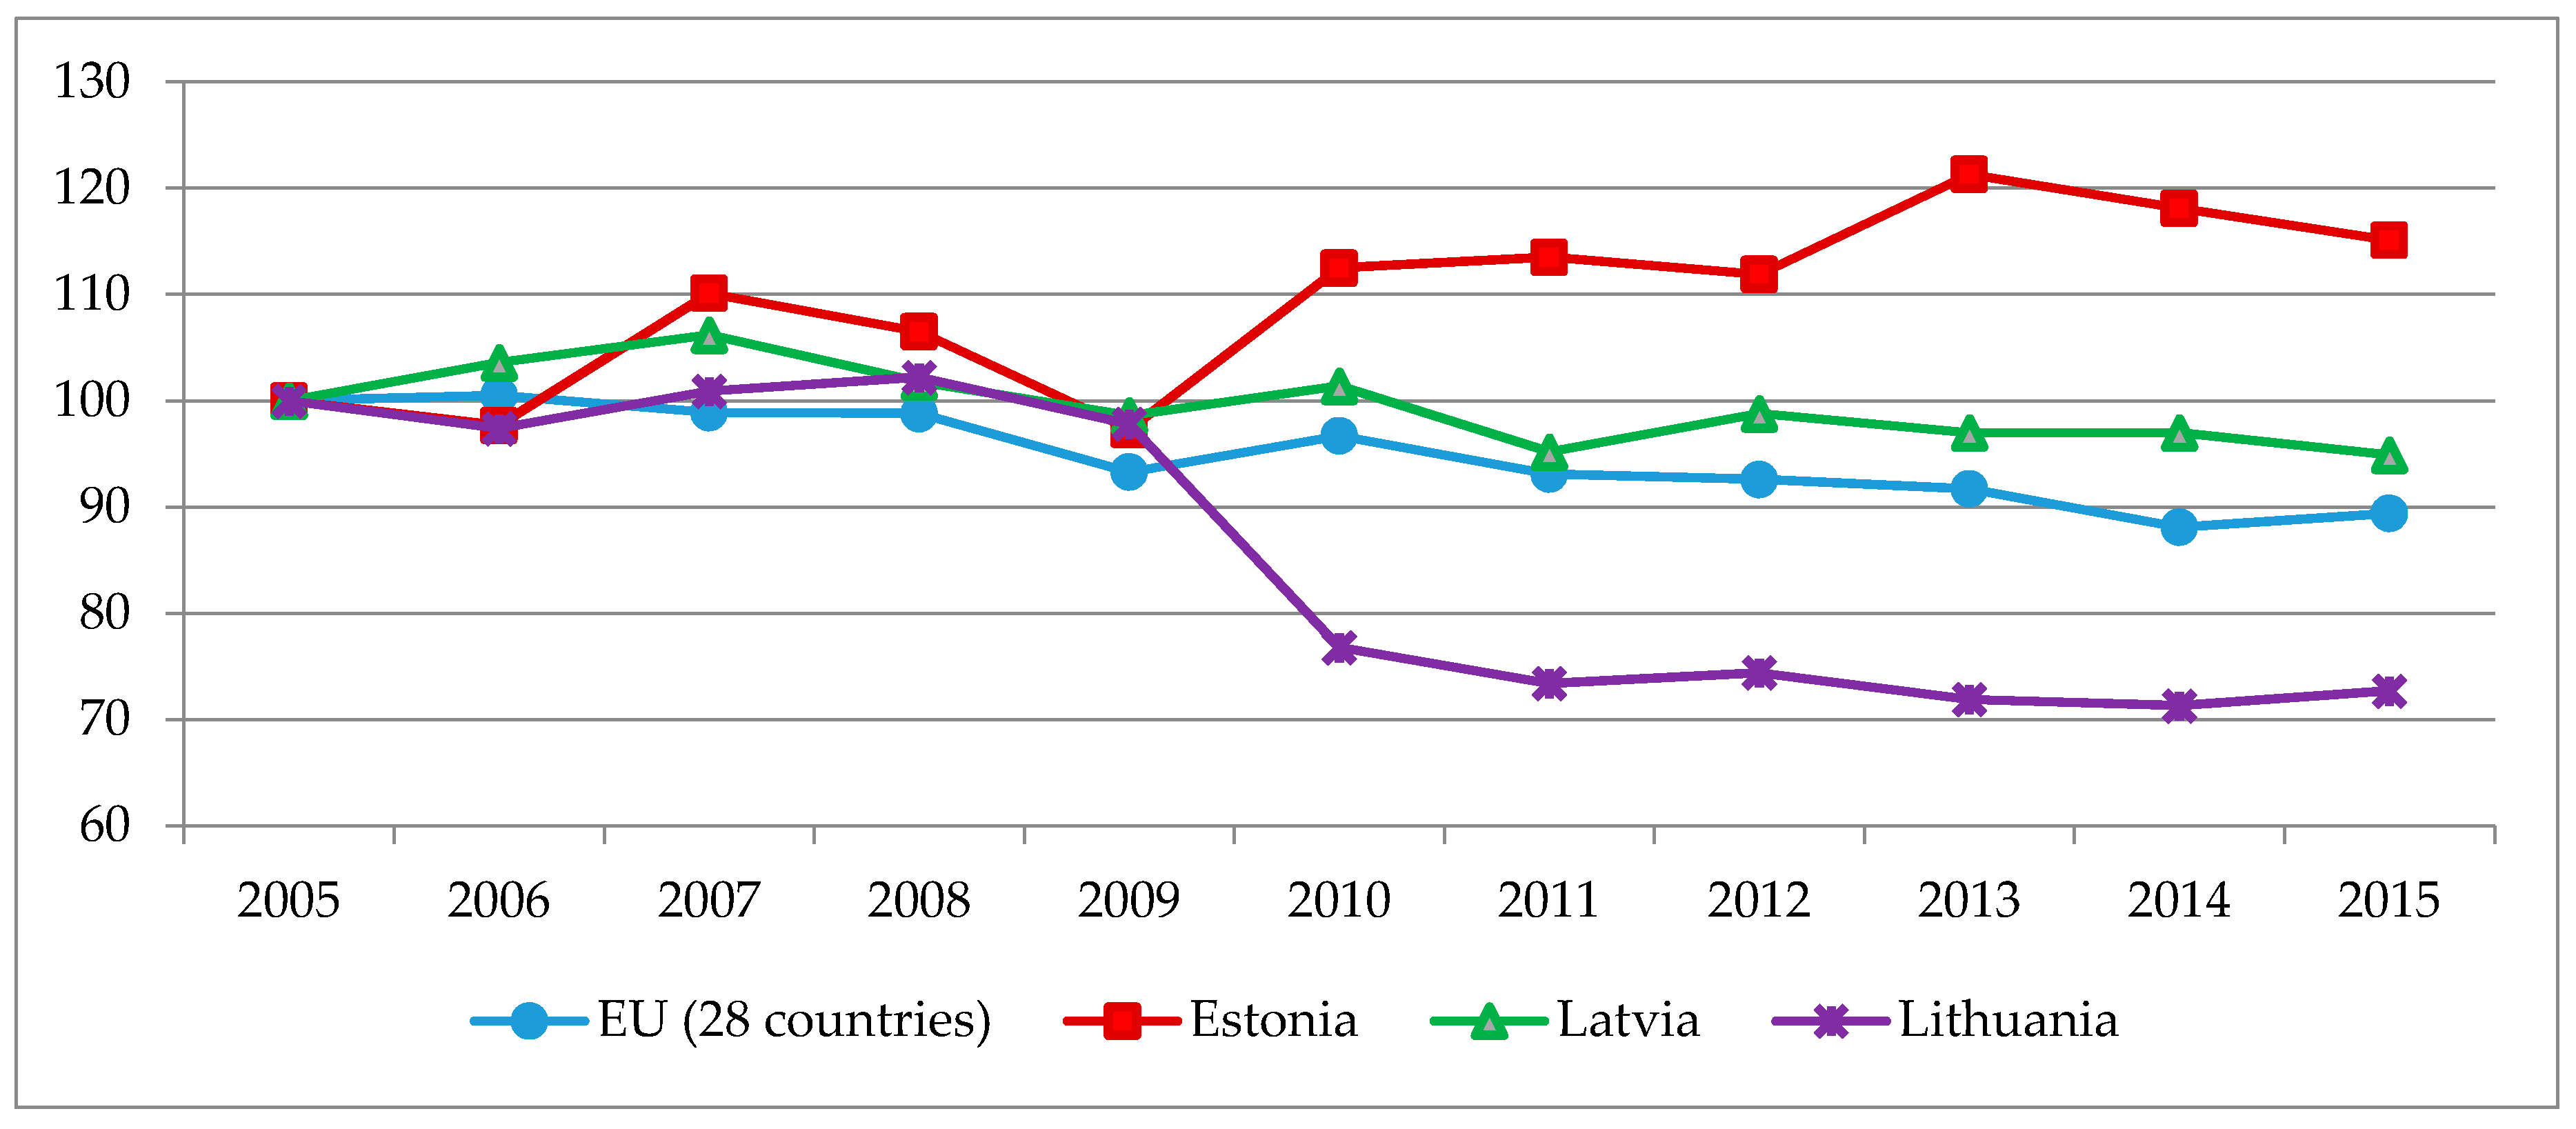
There are various drivers that reduce energy intensity in the country: restructuring the economy and increasing the share of low energy, shifting from transport and industry sectors to less energy-intensive industries, implementing advanced energy-saving production methods and technologies, using more energy-efficient appliances, and other measures. In
Figure 6, the changes in energy intensity between 2005 and 2015 are presented for Lithuania, Latvia, and Estonia.
All three Baltic States have an energy intensity of GDP that is significantly above the average level among EU MS. Estonia has the highest energy intensity in its GDP. Lithuania has the lowest energy intensity in its GDP among the Baltic States. However, energy intensity decreased in all of the Baltic States since they entered the EU. The economic recession of 2008 had an influence on energy intensity, which increased. Since 2008, Estonia’s energy intensity was increasing; however, since 2010, the energy intensity of Estonia’s GDP started to decline. In Latvia and Lithuania, the energy intensity of their GDPs started to decline in 2010, which was linked to their recovery from the economic crisis.
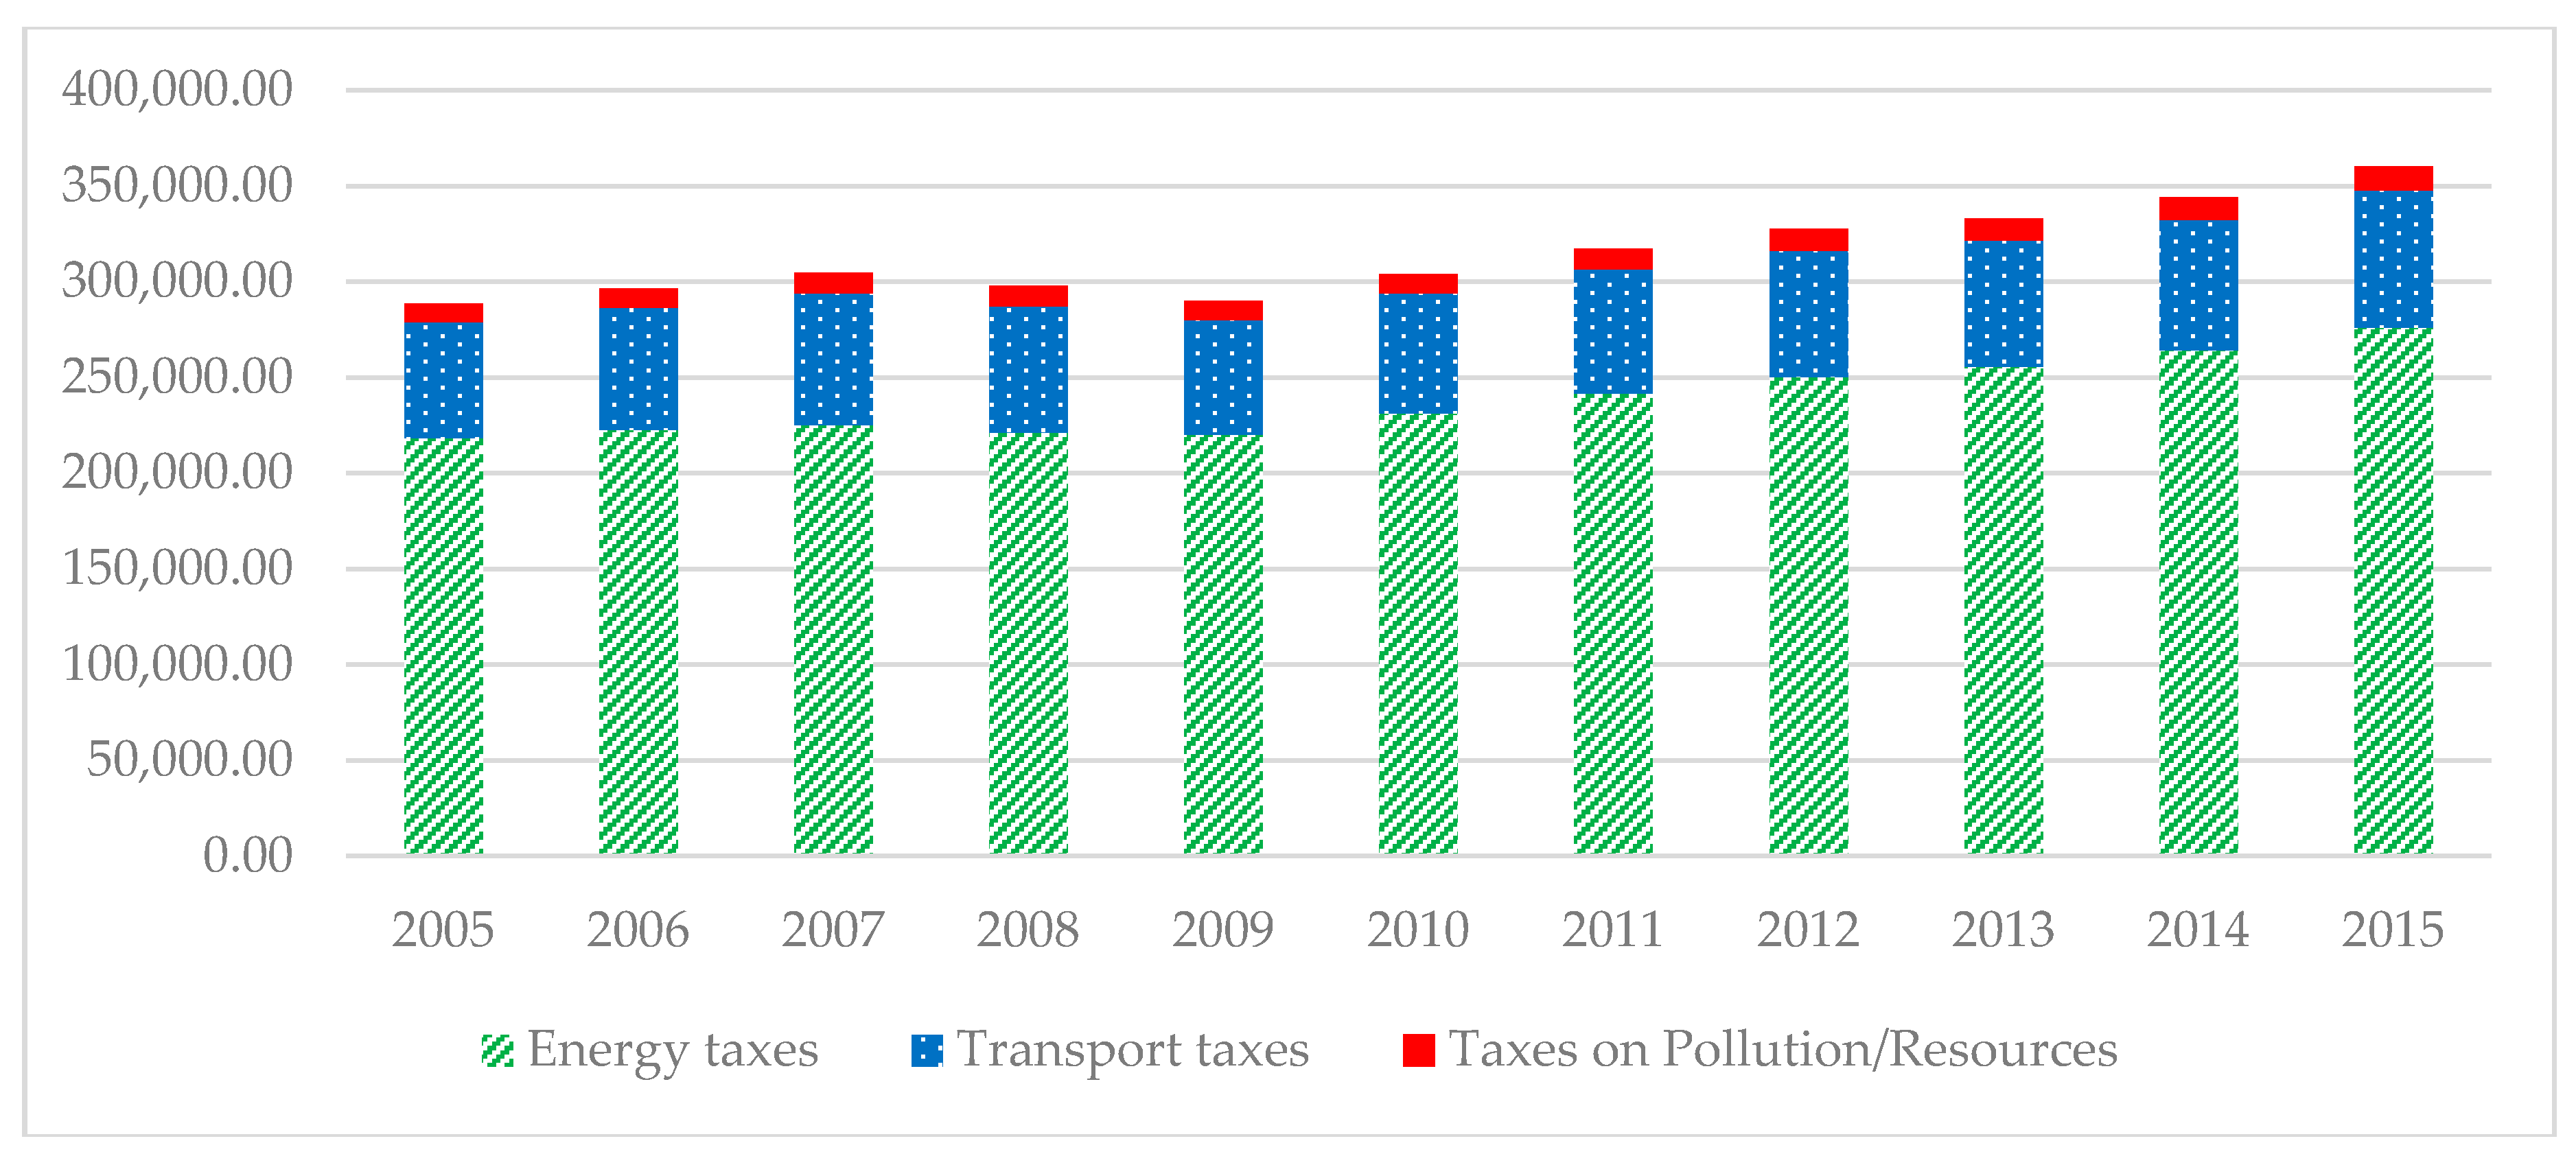
Primary energy consumption indicates the quantity of energy that is demanded to cover the total inland energy consumption of a country (
Figure 7):
In the EU, primary energy consumption in 2015 was similar to 1990 levels. Primary energy consumption in the EU decreased by more than 10% between 2005 and 2015. This was primarily linked to the economic recession, favorable conditions, and various implemented energy-efficiency improvement policies and measures. In the EU during the investigated period, fossil fuels continued to dominate the primary energy supply. However, their proportion decreased 26% between 2005 and 2015. The proportion of renewable resources in the gross final energy consumption doubled over the same period, from 9% in 2005 to 16.7% in 2015. The annual average increase rate was about 1% per year.
In 2015, Lithuanian primary energy consumption decreased by about 27% compared with 2005 levels, while in Estonia primary energy consumption increased about 15% compared with the same base year and, in Latvia primary energy consumption was almost the same compared with 2005, i.e., it decreased by only 5%.
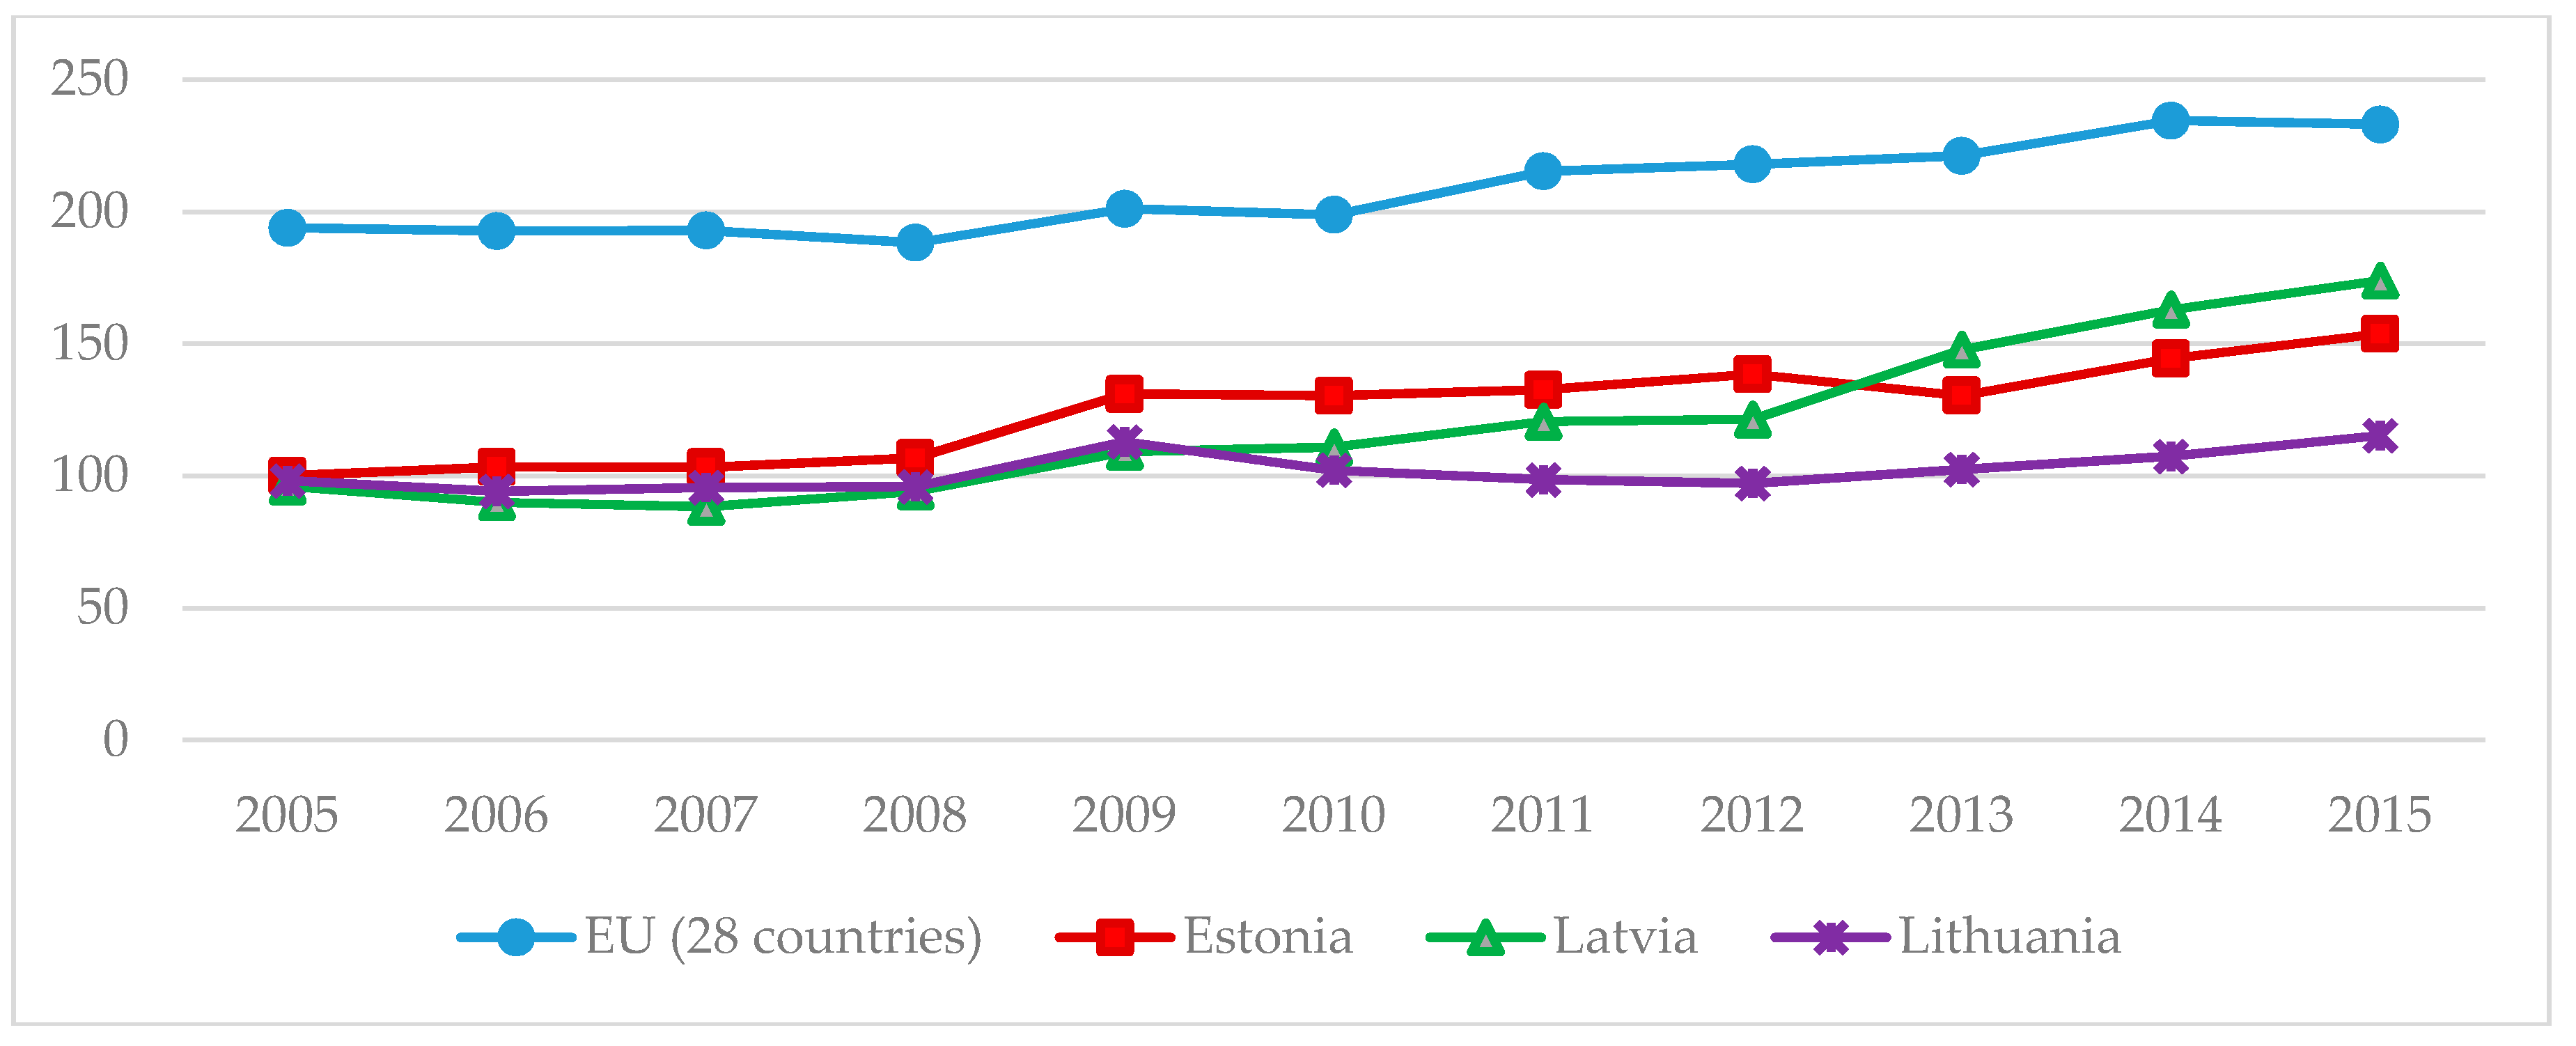
Increasing the share of renewable energy in the primary energy supply, final energy consumption and electricity and heat production are among the priorities of sustainable energy development. These targets are directly linked with environmental sustainability, as they provide for GHG emission reduction and increase the competitiveness of the economy. The increased utilization of renewable energy sources also increases energy security, since the deployment of local energy resources diminishes dependency on energy imports.
All of the EU MS have adopted national renewable energy action plans and presented all of the intended actions that are necessary to meet their renewable energy targets to the EC. These plans include renewable energy targets for: electricity, heating, cooling, transport, and final energy demand. In addition, all of the planned policies and measures to achieve the set targets are presented in national plans. Since green budget reform has promoted renewable resources, countries have also introduced additional measures, such as feed-in-prices, subsidies etc.
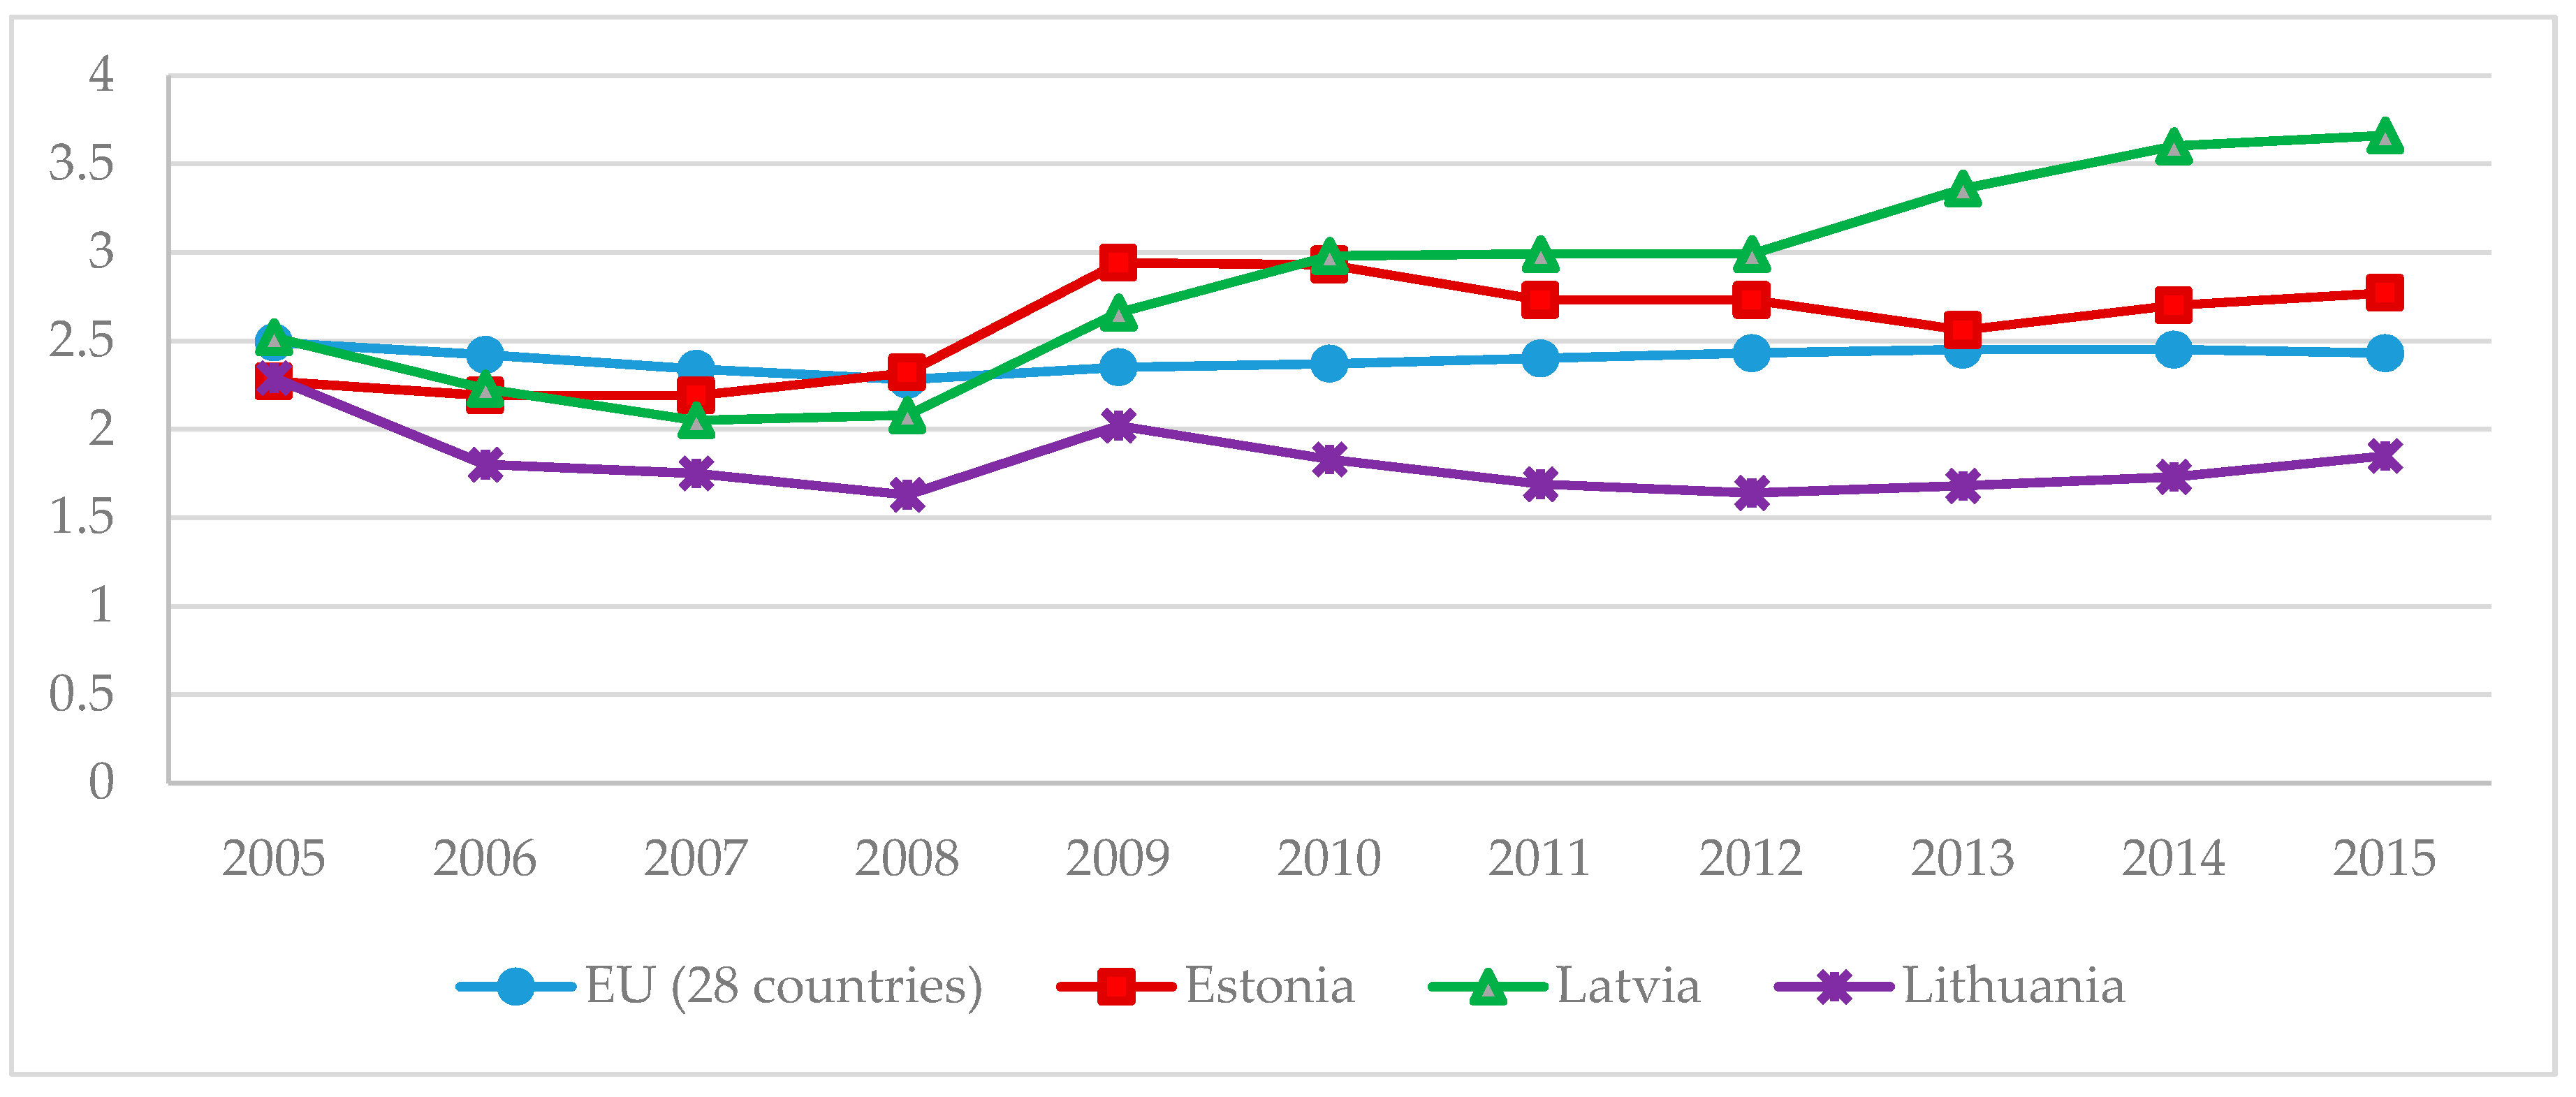
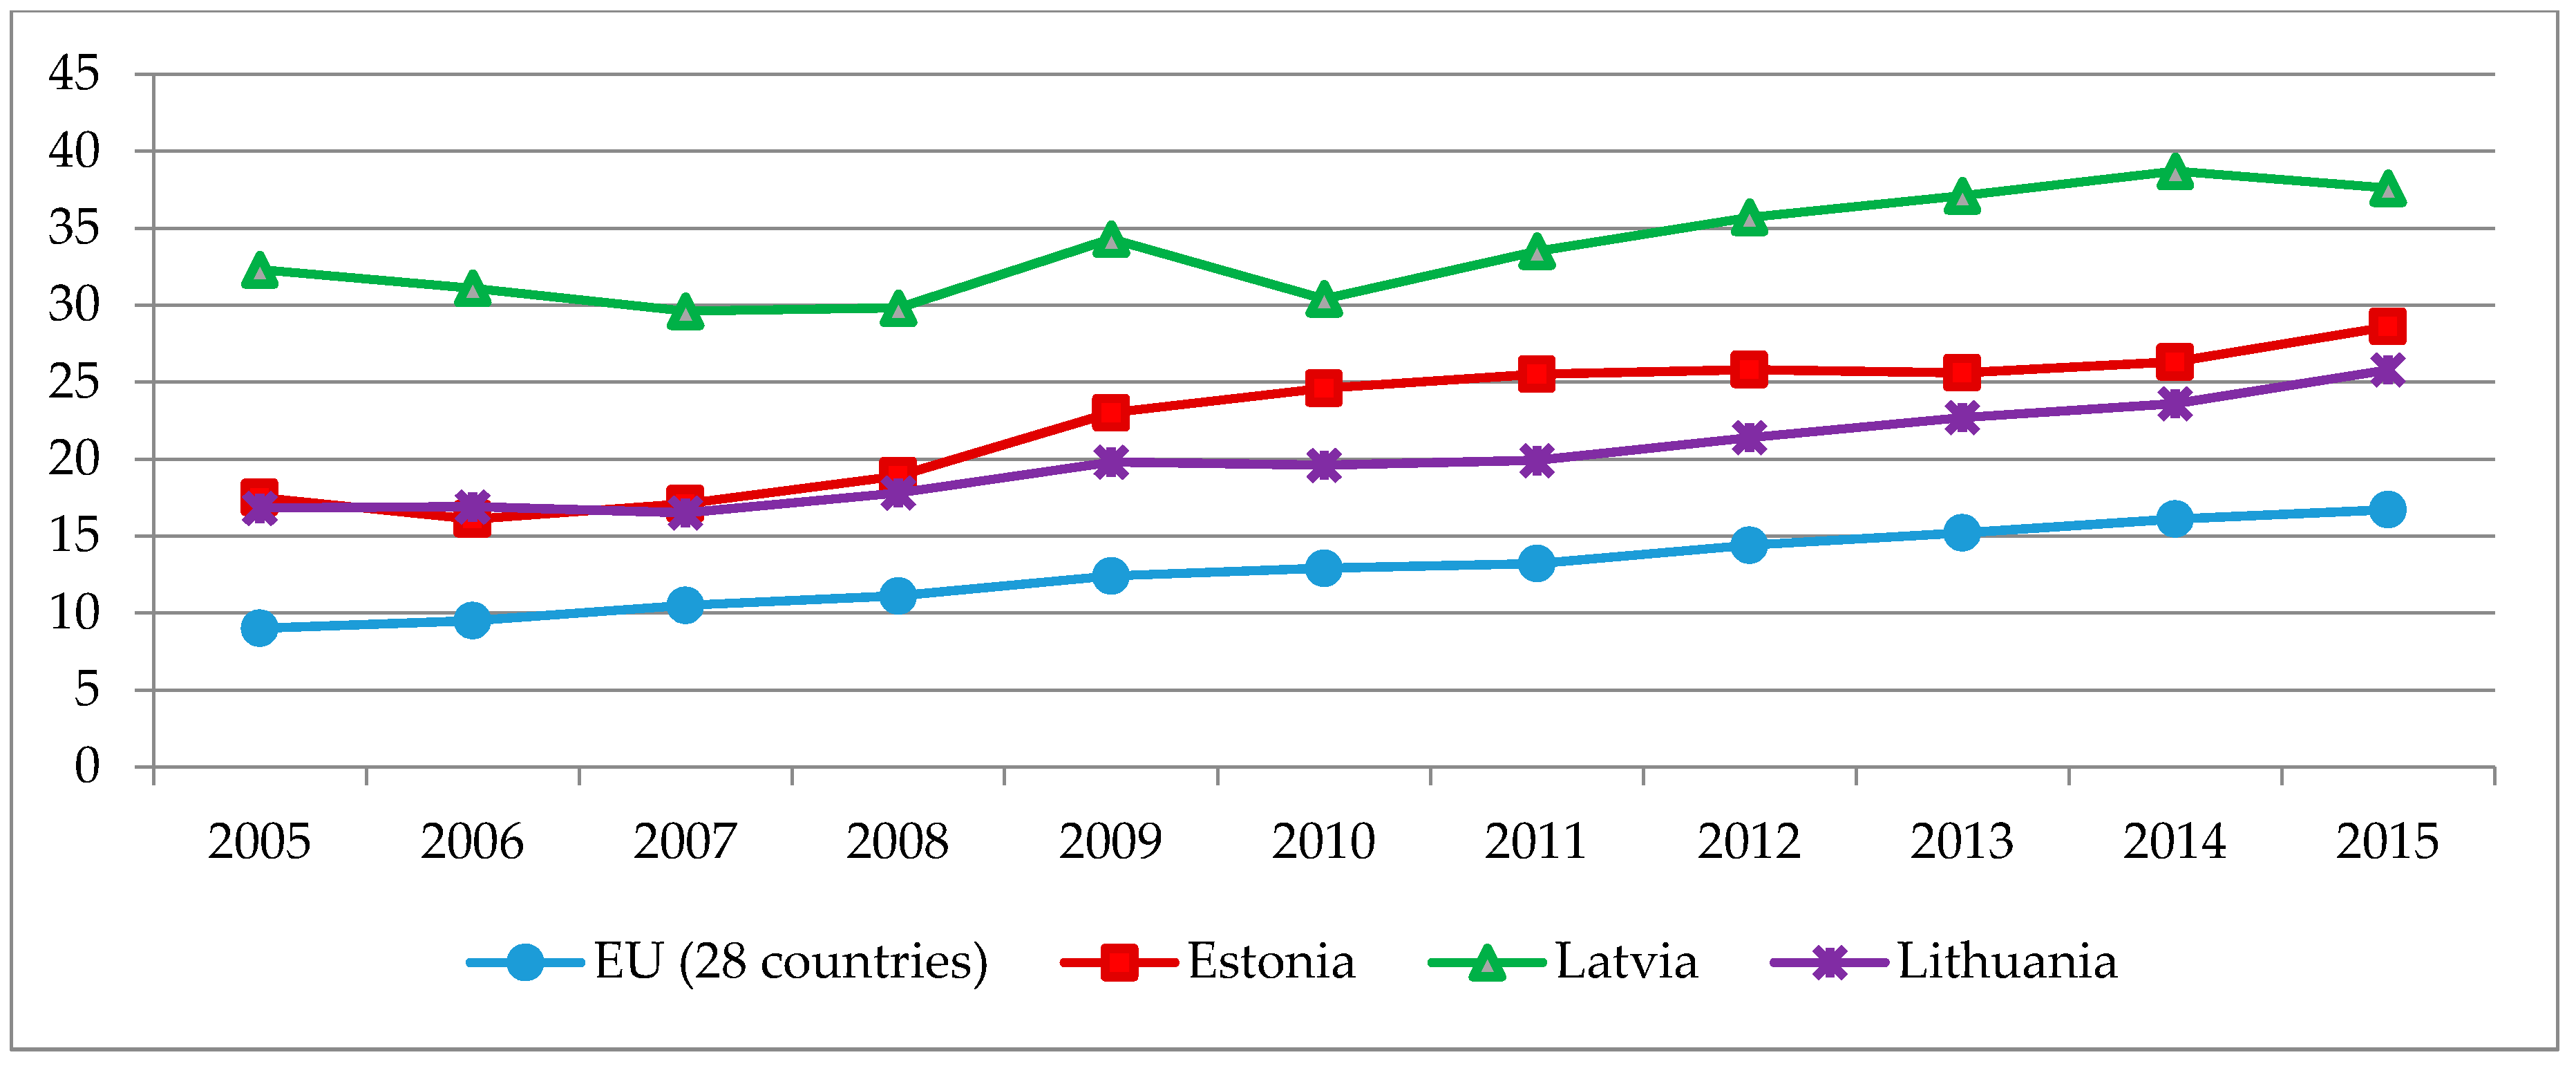
In
Figure 8, the trends of the share of renewable energy in final energy consumption in the Baltic States are given.
Once again, Latvia’s high share of renewable energy sources in its final energy consumption distinguishes it from the other Baltic States, and is also above the average EU level. However, in other Baltic States, the proportion of renewable energy sources in their final energy consumption is also above the EU average. Since their entrance into the EU in 2004, the share of renewable resources has increased by more than 60% in Estonia, and by more than 50% in Lithuania. The exceptional situation in Latvia is linked to its natural conditions and high hydro energy potential. One can notice that during the investigated period, the highest increase in the proportion of renewable resources in final energy demand was achieved in Estonia. Estonia achieved the target set for 2020 (increase the share of renewable resources in final energy consumption to 25%) in 2011, while Lithuania achieved the target (increase the share of renewable resources in final energy consumption to 23%) in 2014. The target for Latvia is to increase the share of renewable resources in final energy consumption to 40%, and it is almost reached.
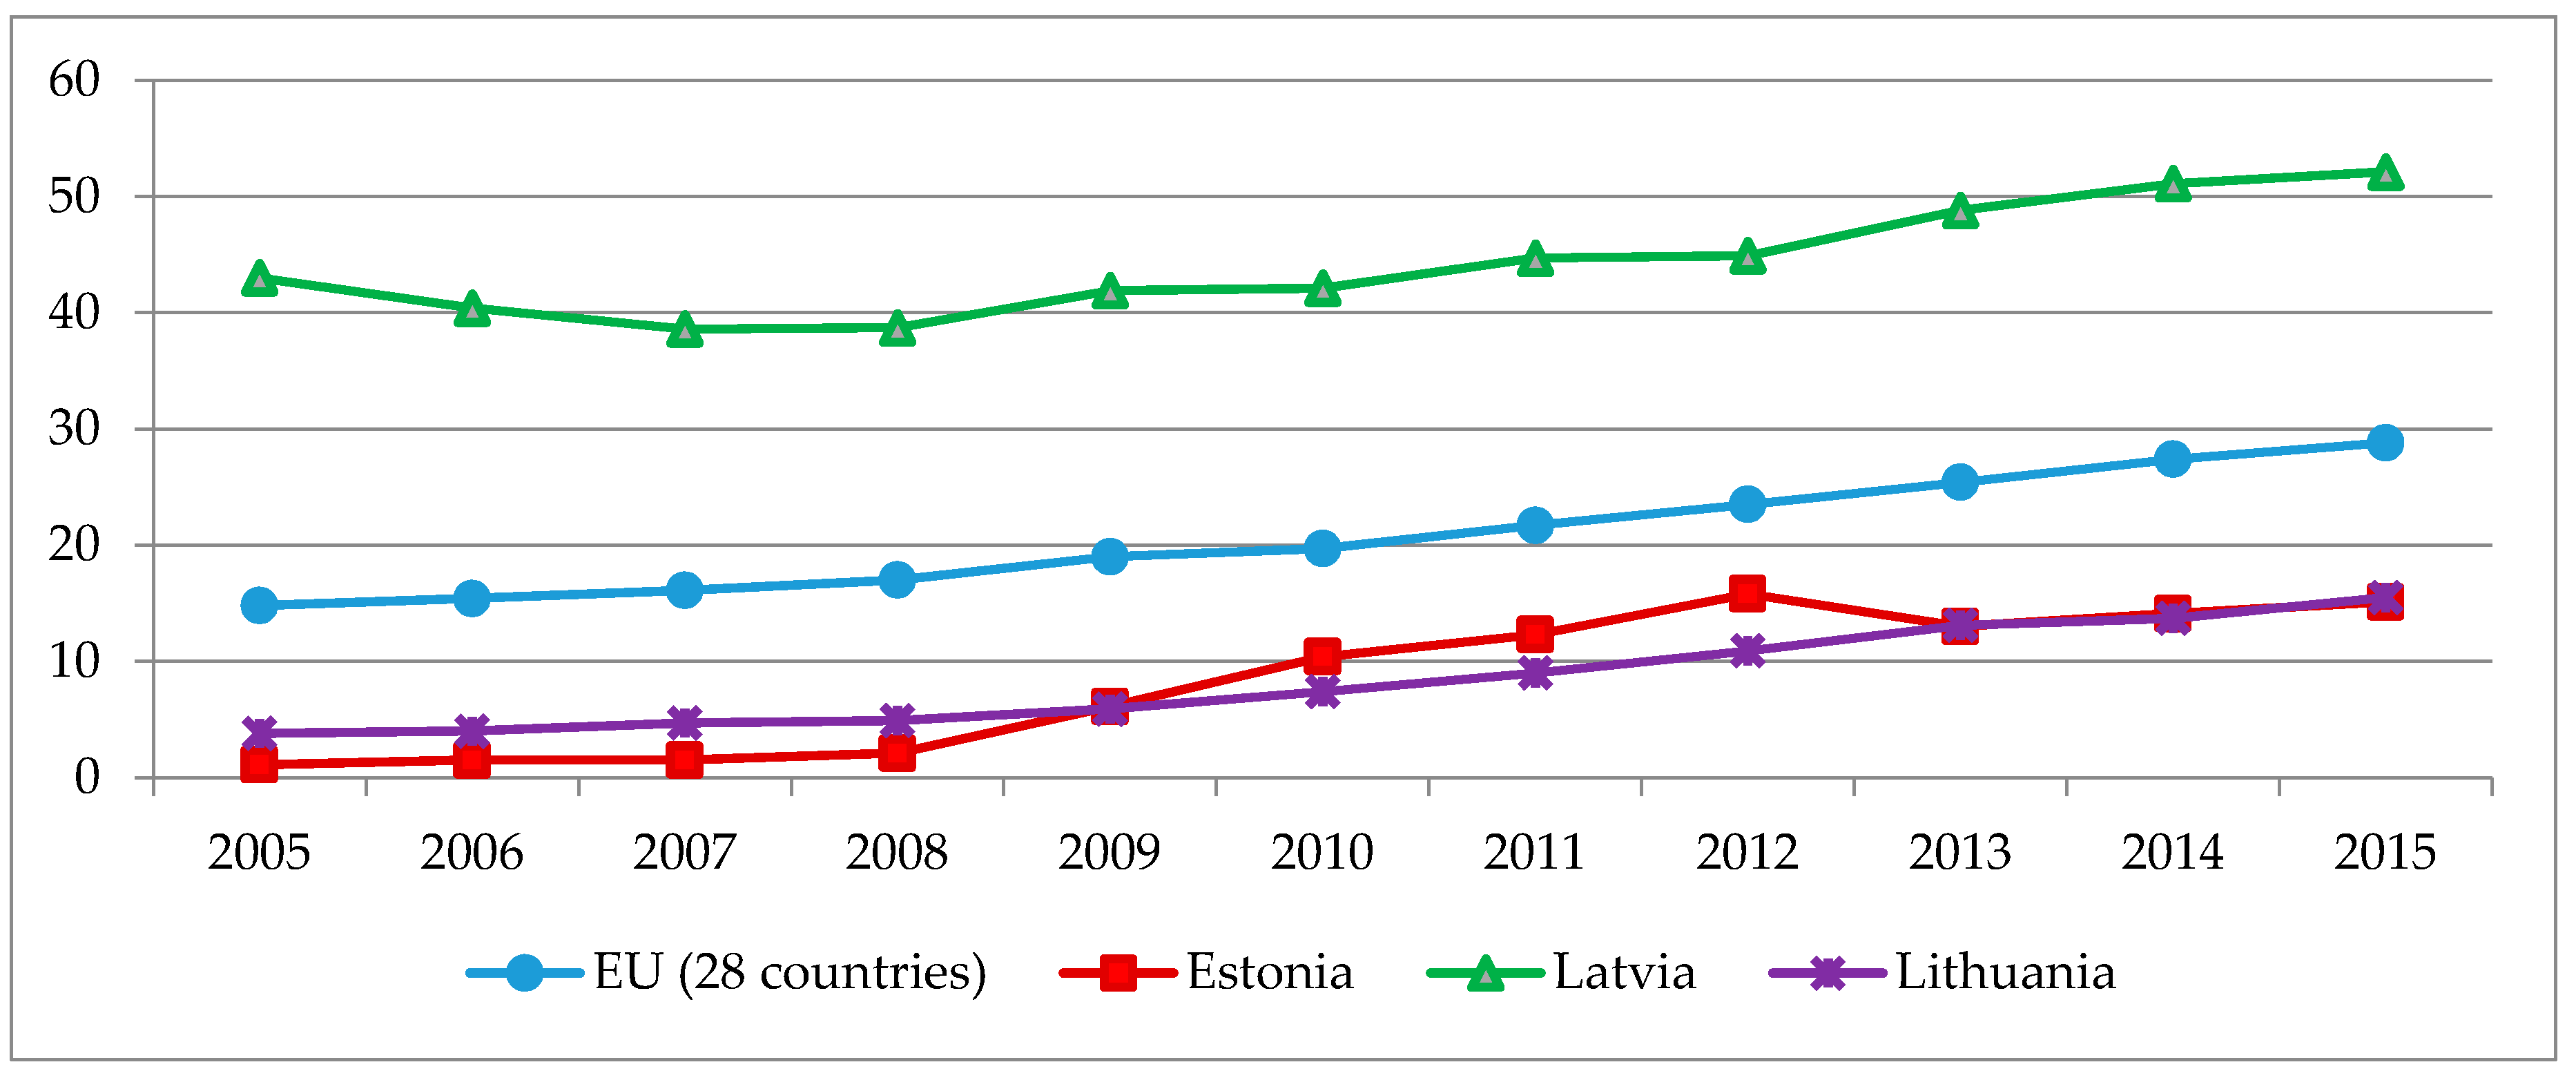
The dynamics of the share of renewable resources in electricity generation in the Baltic States is given in
Figure 9.
Latvia once again has the highest proportion of renewable energy sources in its gross electricity consumption. The share of electricity generated from renewable resources in the other Baltic States was lower than the average EU levels during the analyzed period. In all of the Baltic States, a growth trend is observed between 2005 and 2015 regarding the portion of renewable energy sources in electricity consumption. However, in 2013 and 2014, Estonia experienced a slight decline because of weather conditions linked to wind energy.
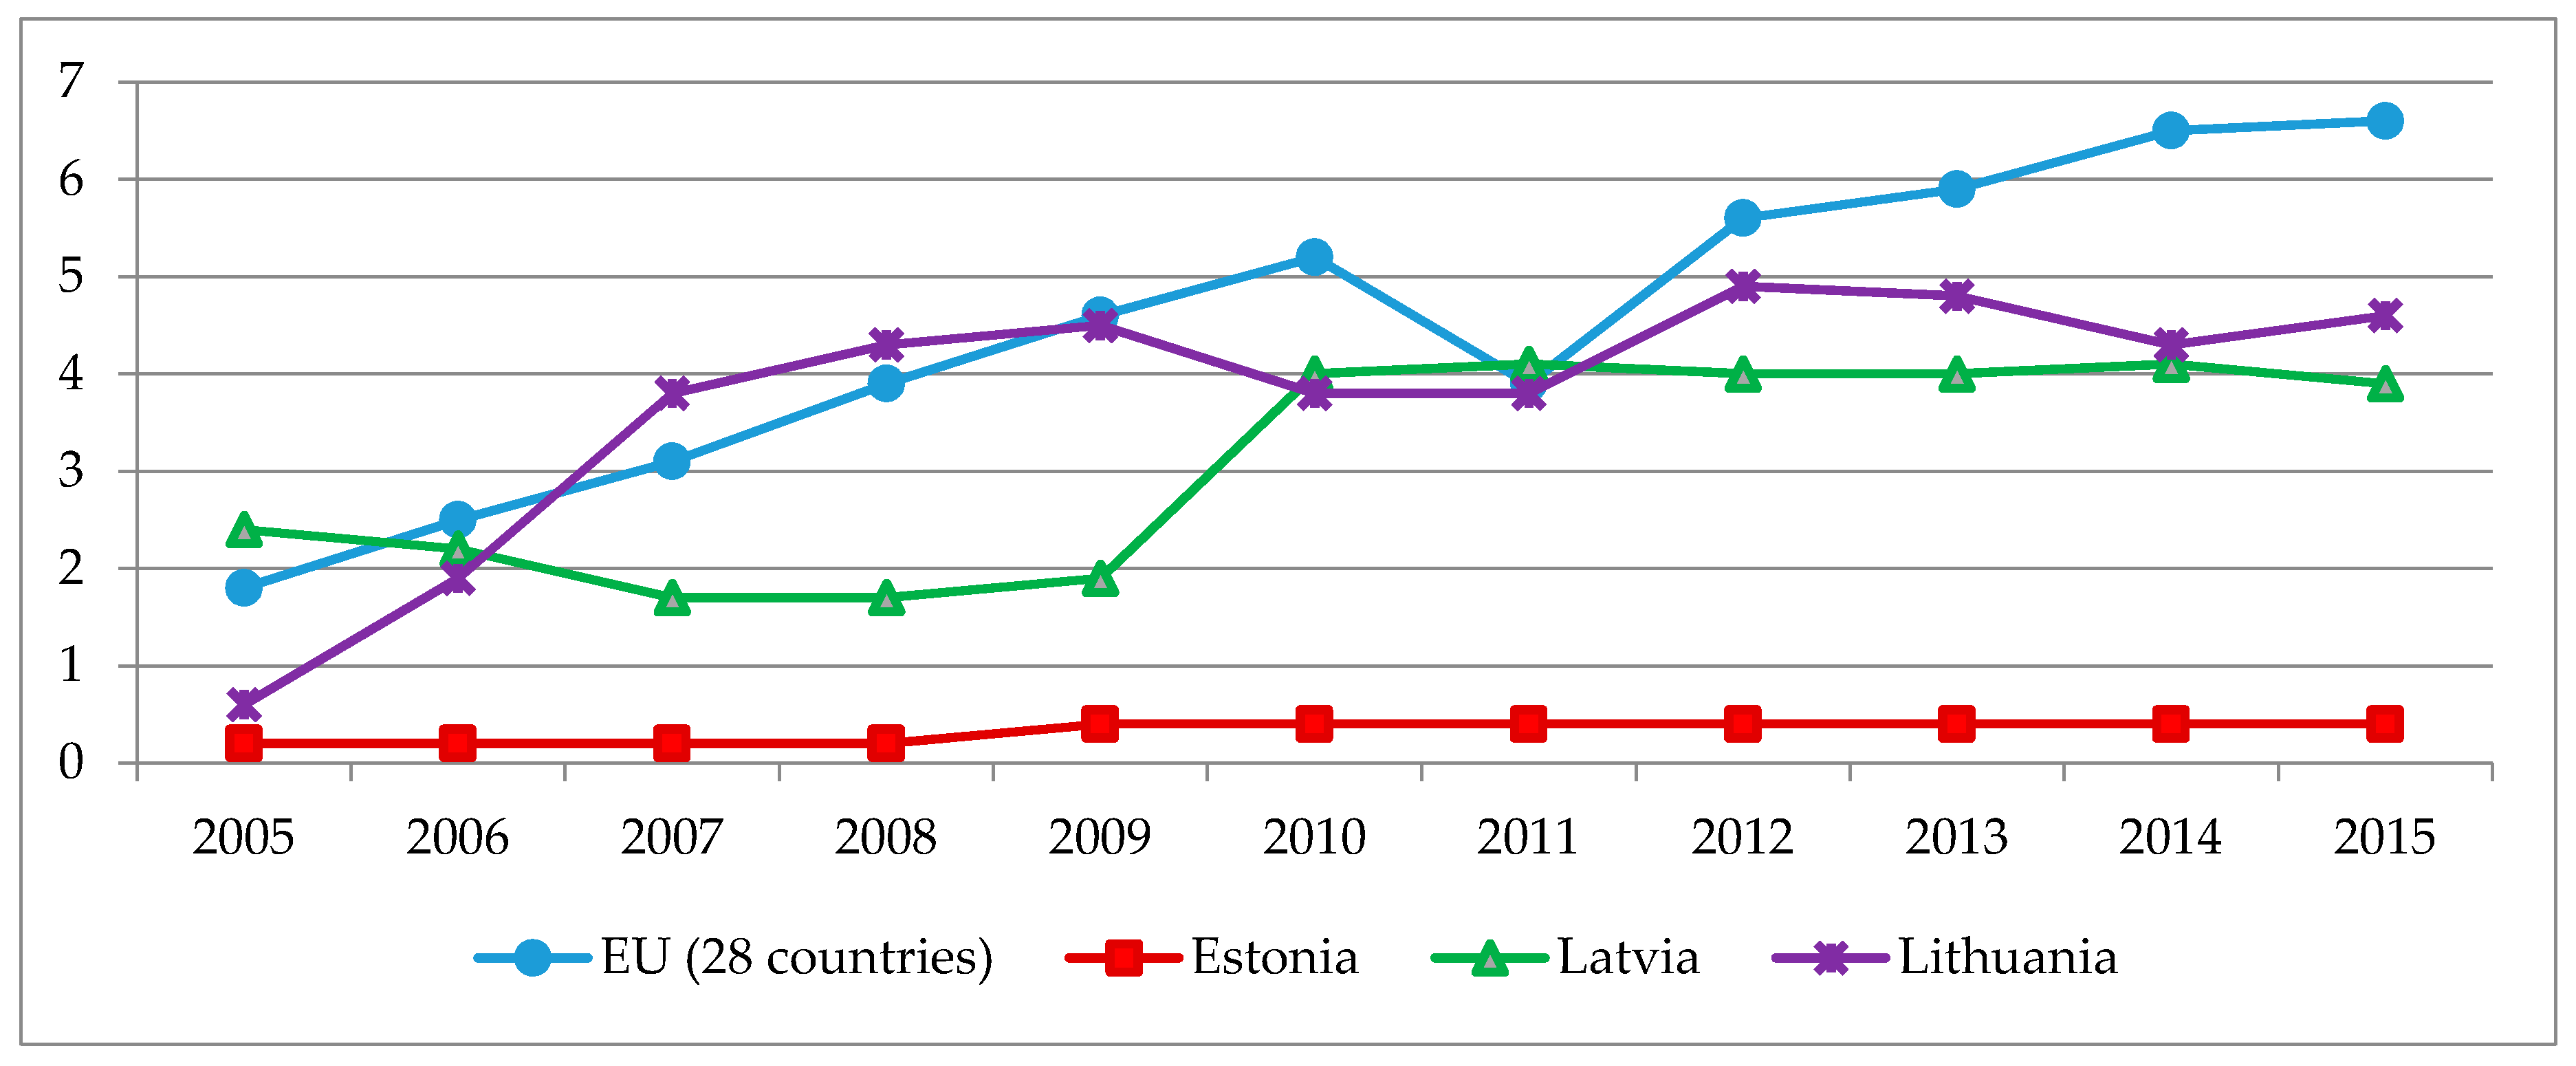
In
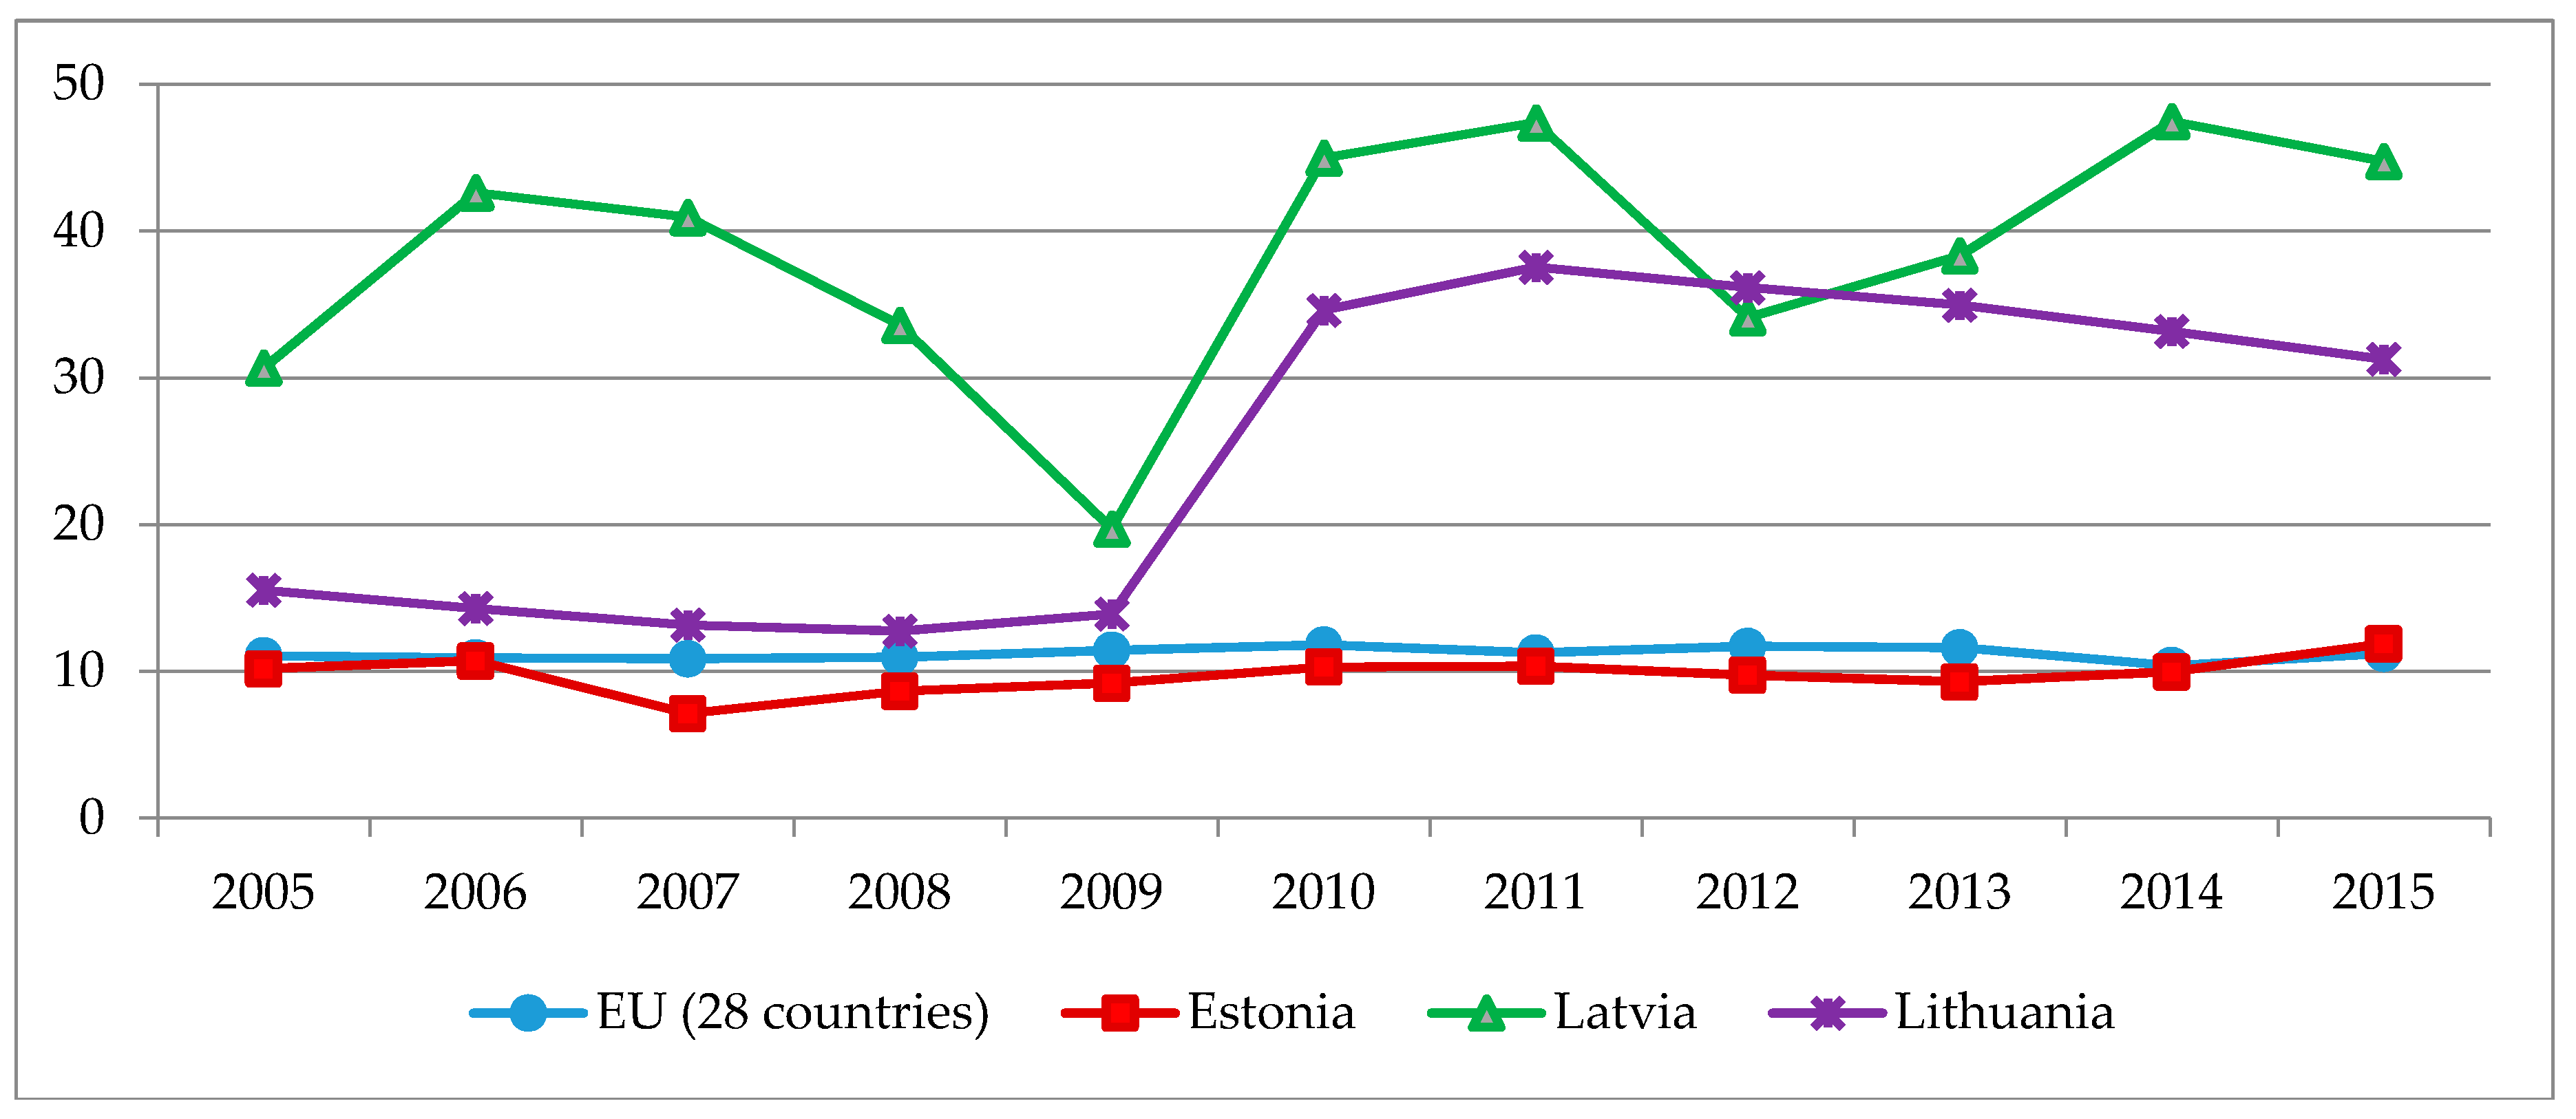
Figure 10, the use of renewable energy in the transport sectors of Lithuania, Latvia, and Estonia are provided.
In all of the Baltic States, the proportion of renewable energy sources in fuels used in transport is lower than average EU levels. Estonia has the lowest share of renewable resources in fuels used in transport (0.4%). Estonia has a very low share of renewable energy in transport, far behind its Europe 2020 target of 10%; in response, measures have been announced, but have not yet been adopted. These include a 5–7% biofuel mixing obligation for motor fuel, and financial support for producing and using biomethane in transport. Estonia is ranked last among the 28 EU countries in terms of renewable energy in transport; the EU average was 6.6% in 2015. In comparison, Lithuania reached 4.6% of renewable resources in fuel consumption in transport in 2015, which is in line with the targets set by EU Directive 2003/30/EC; it was ranked 20th in the EU in 2015. Latvia has reached 3.9% and was ranked 22nd in the EU in 2015, but despite that, Latvia is in a good position in terms of implementing the target set by the 2003/30/EC Directive.
CHP generation is linked with environmental sustainability and competitiveness, since it enables an increase in energy efficiency and a reduction in GHG emissions.
Figure 11 presents the changes in the share of CHP generation in gross electricity generation in Lithuania, Latvia, and Estonia.
Estonia has the lowest proportion of CHP in gross electricity production, which is also significantly lower than the EU average. Meanwhile, Lithuania and Latvia have higher proportions of CHP in their gross electricity generation. Due to the significant share of hydro in its gross electricity production, the proportion of CHP in Latvia’s gross electricity production has high fluctuations. In both Latvia and Lithuania, the proportion of CHP in their gross electricity generation is higher than the EU average. Lithuania also had a significant increase in the share of CHP in its gross electricity production, i.e., from 16% to 31%, during the analyzed period.
The carbon intensity of energy consumption is the most important indicator of the environmental sustainability of energy. It can be linked with the results of implementing all of the other targets of sustainable energy development, such as decreasing the energy intensity, final energy demand, and electricity consumption, and increasing the proportion of renewable energy sources in primary energy supply and the share of CHP in gross electricity consumption. Increasing energy efficiency and utilizing renewable energy sources are the main pathways to decreasing GHG emissions in the fuel combustion sector.
Figure 12 presents the changes in the ratio between GHG emissions and energy consumption in Lithuania, Latvia, and Estonia. This indicator from the ESDI list can replace the indicator of total GHG emissions from fuel combustion, as it enables a better comparison of GHG emission trends and the achieved results of climate change mitigation policies in the energy sector of the Baltic States, due to the different size of the countries and their energy sectors.
Estonia has the greatest decline of GHG emissions in its energy sector among the Baltic States. Lithuania had the worst results, which was a result of the country finally closing the Ignalina nuclear power plant in 2009. As a result, the carbon intensity of energy consumption in the country increased by 24% in 2010. The closure of the nuclear power plant had an impact on the growth of the proportion of fossil energy carriers in the primary energy supply. In Lithuania, the carbon intensity of energy decreased from 2010 onwards, as the share of renewable resources and imported electricity increased in that time. Estonia achieved the best results regarding carbon intensity decline in its energy sector among the Baltic States; the carbon intensity of its energy consumption decreased 12% between 2005 and 2015.
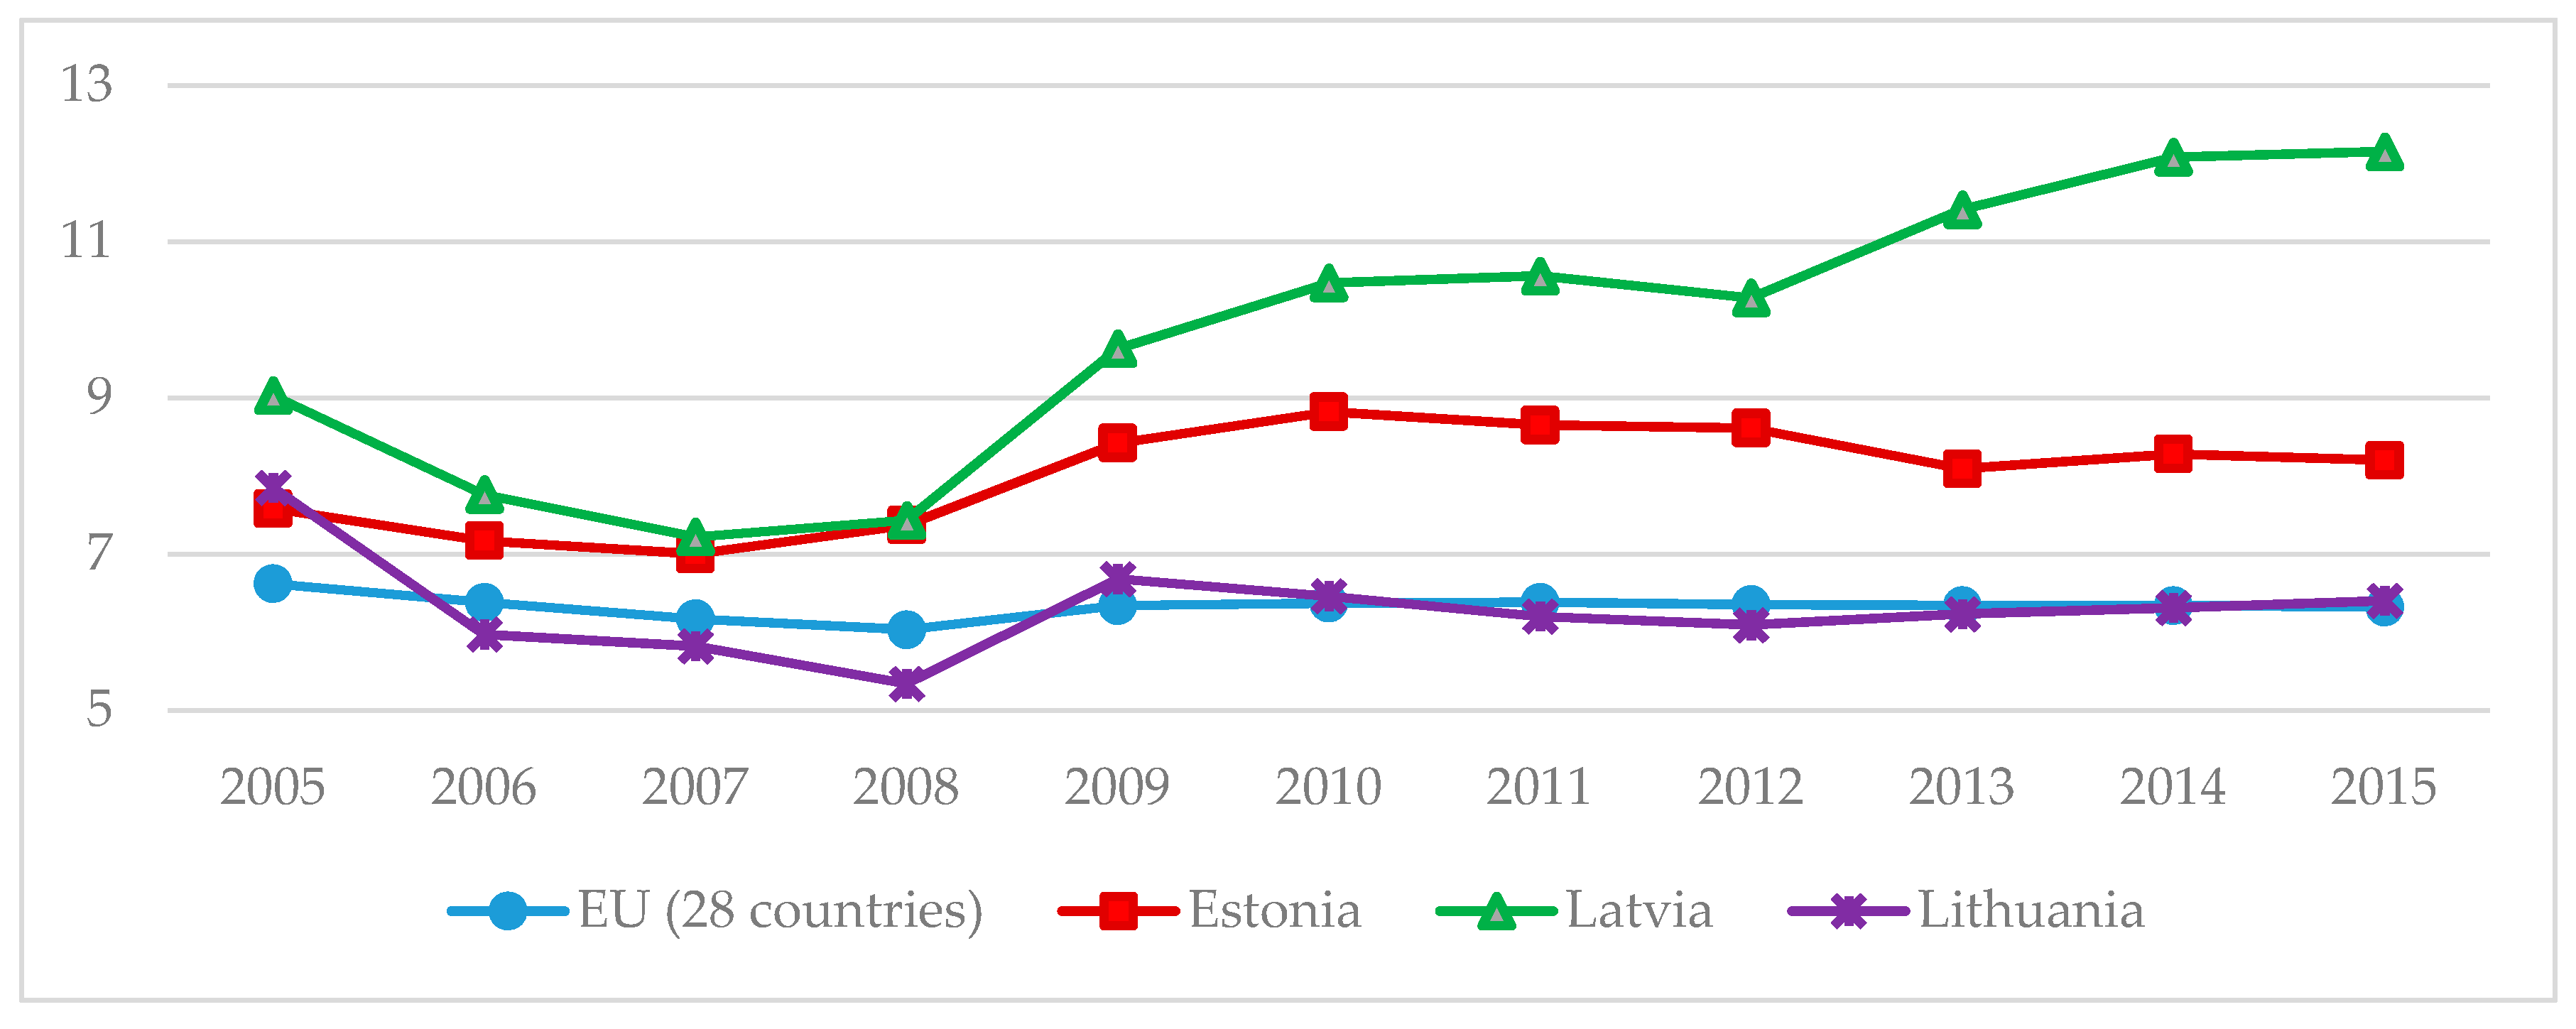
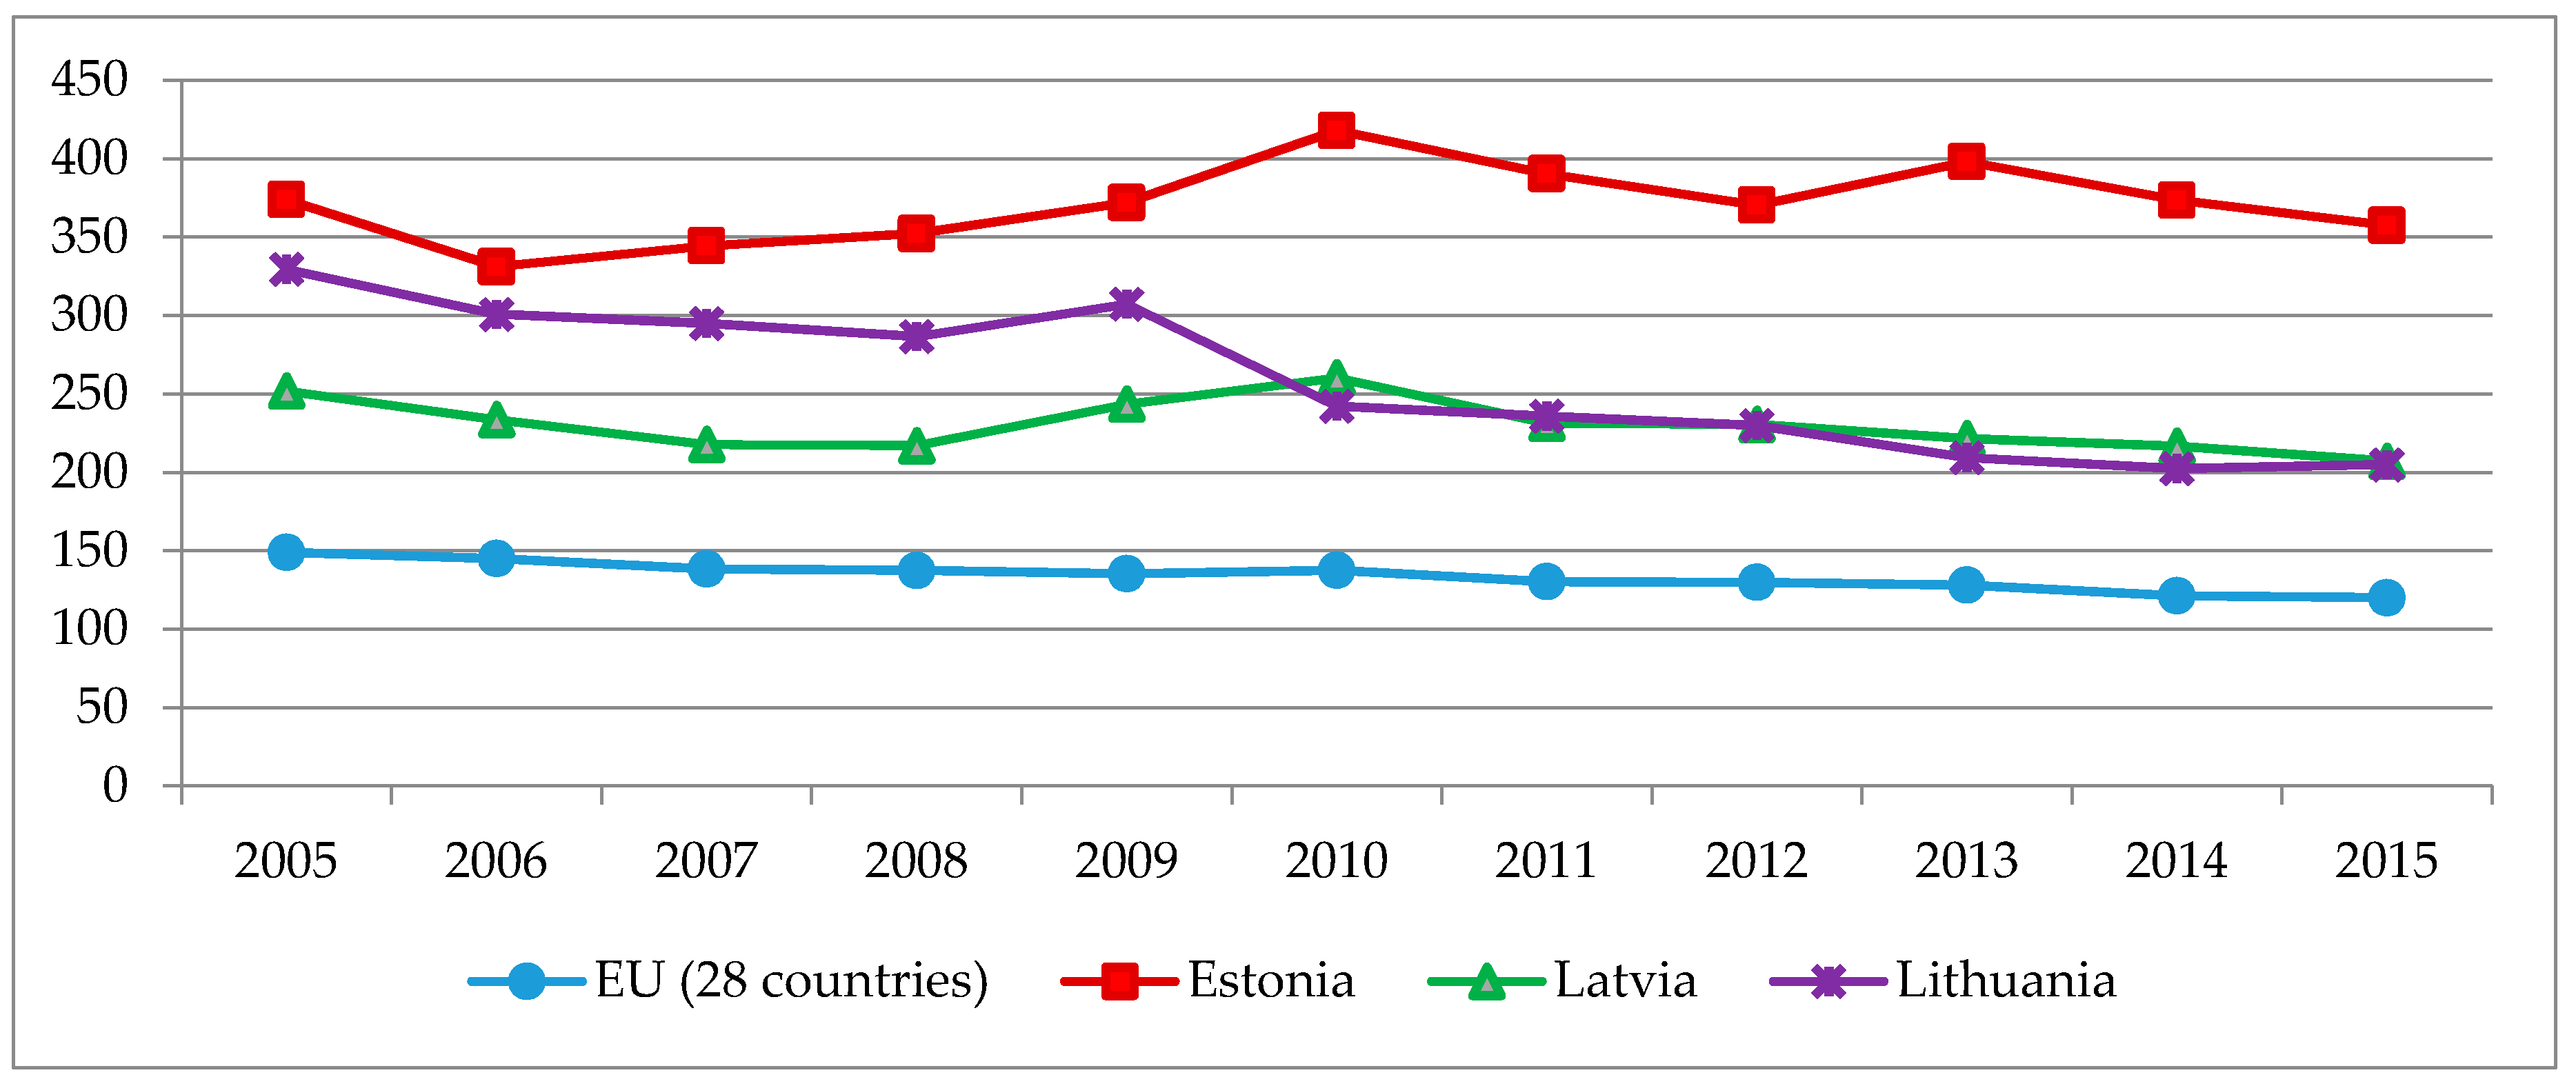
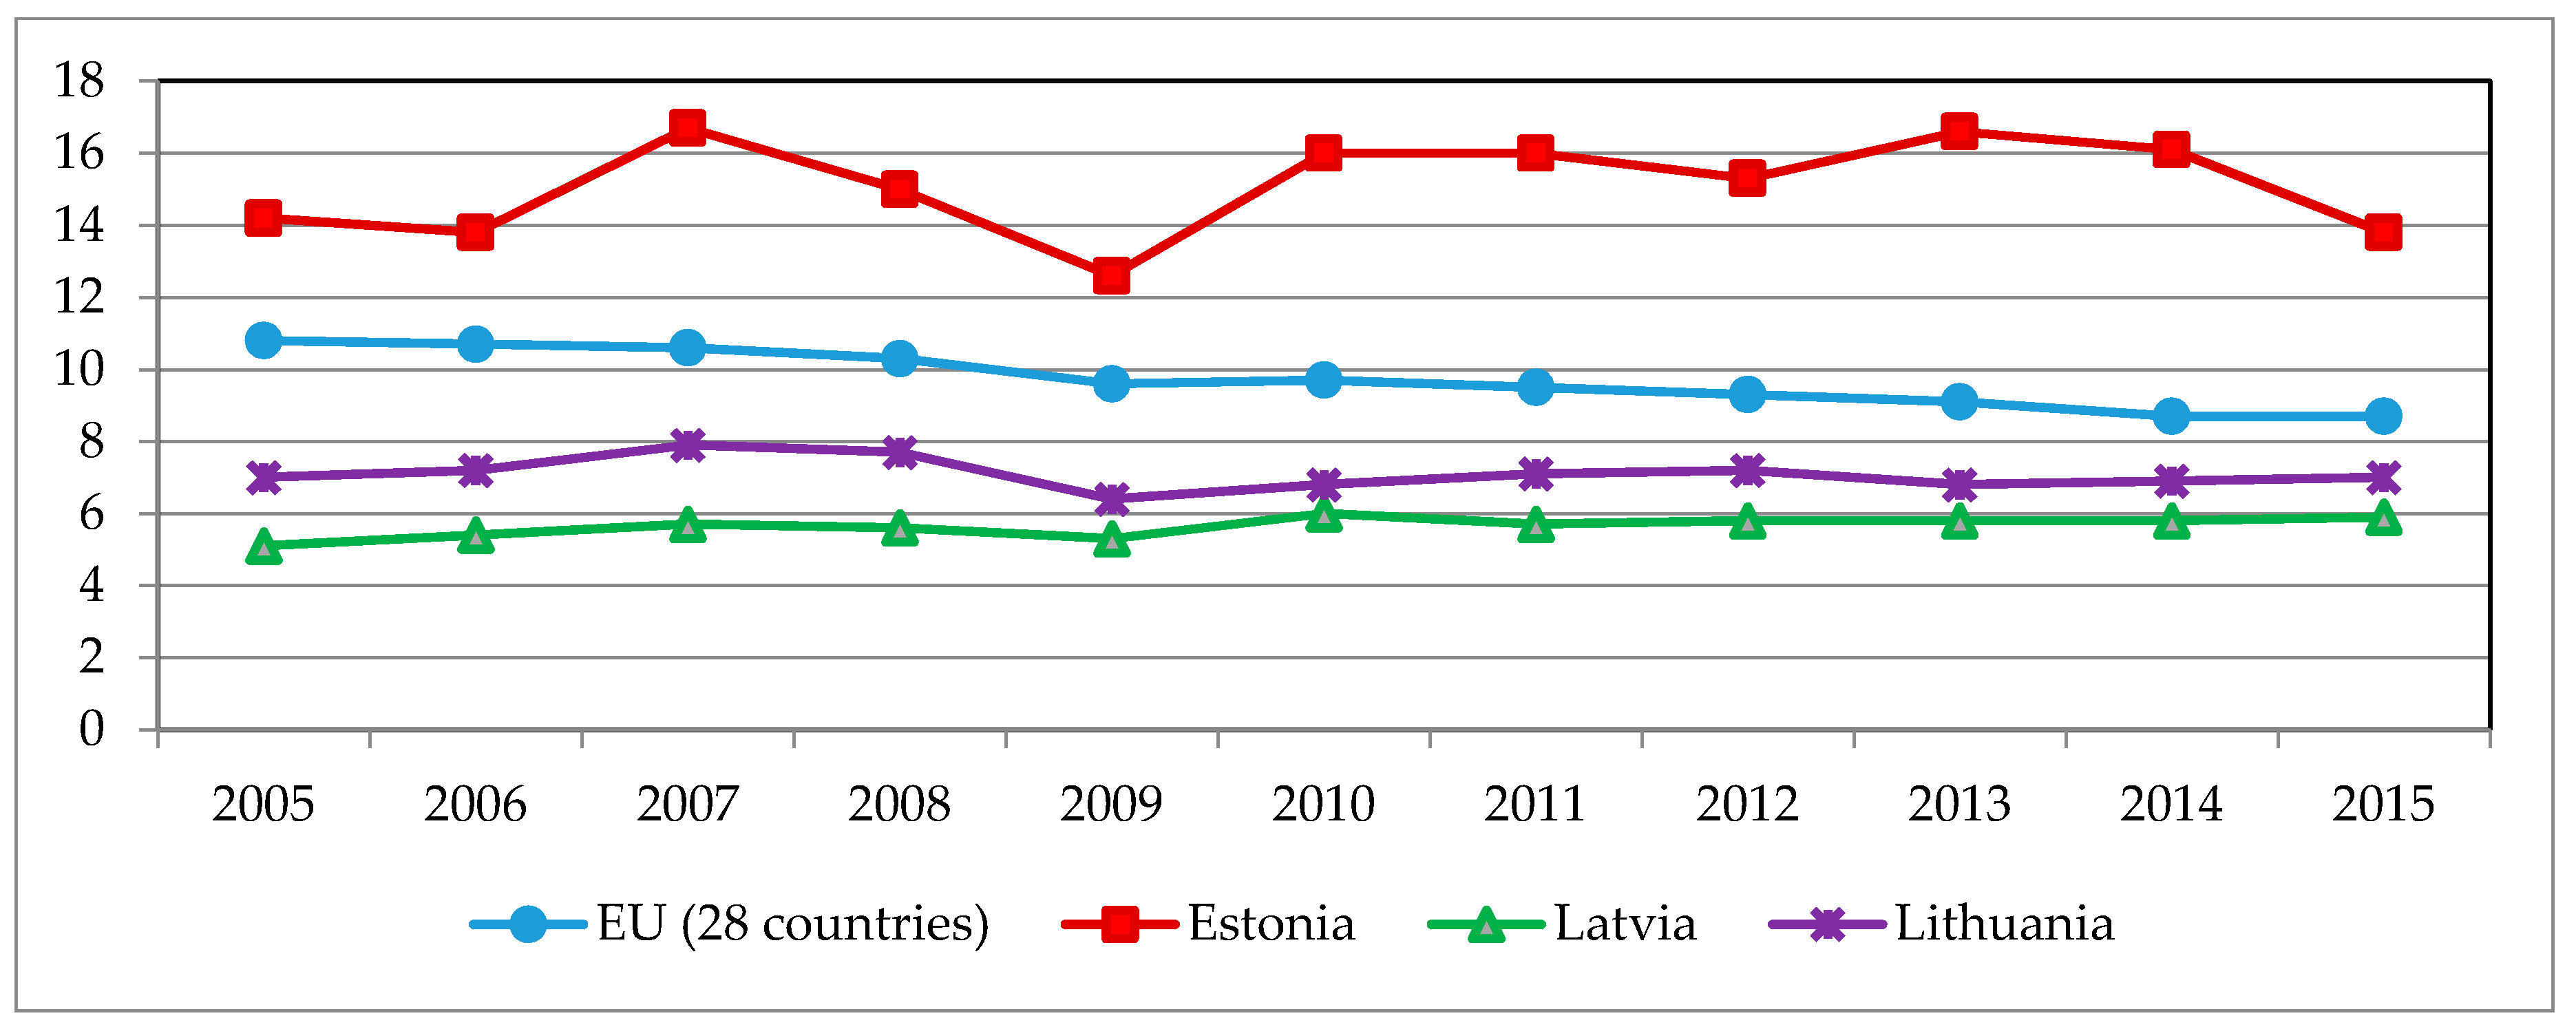
Figure 13 presents the trends of GHG emissions per capita in the Baltic States.
The GHG emissions per capita in Latvia amounted to 5.9 tons per capita, which was the third lowest in the EU. Lithuania managed to achieve a GDP growth that was faster than its growth in GHG emissions, implementing the EU Sustainable Development Strategy. In 2014, annual GHG emissions in Lithuania amount to seven tons per capita, which was among the lowest in the EU. Meanwhile, GHG emissions in Estonia amounted to about 14 tons per capita, which was the highest in the EU, and 60% bigger than the EU average (8.7 tons per capita).
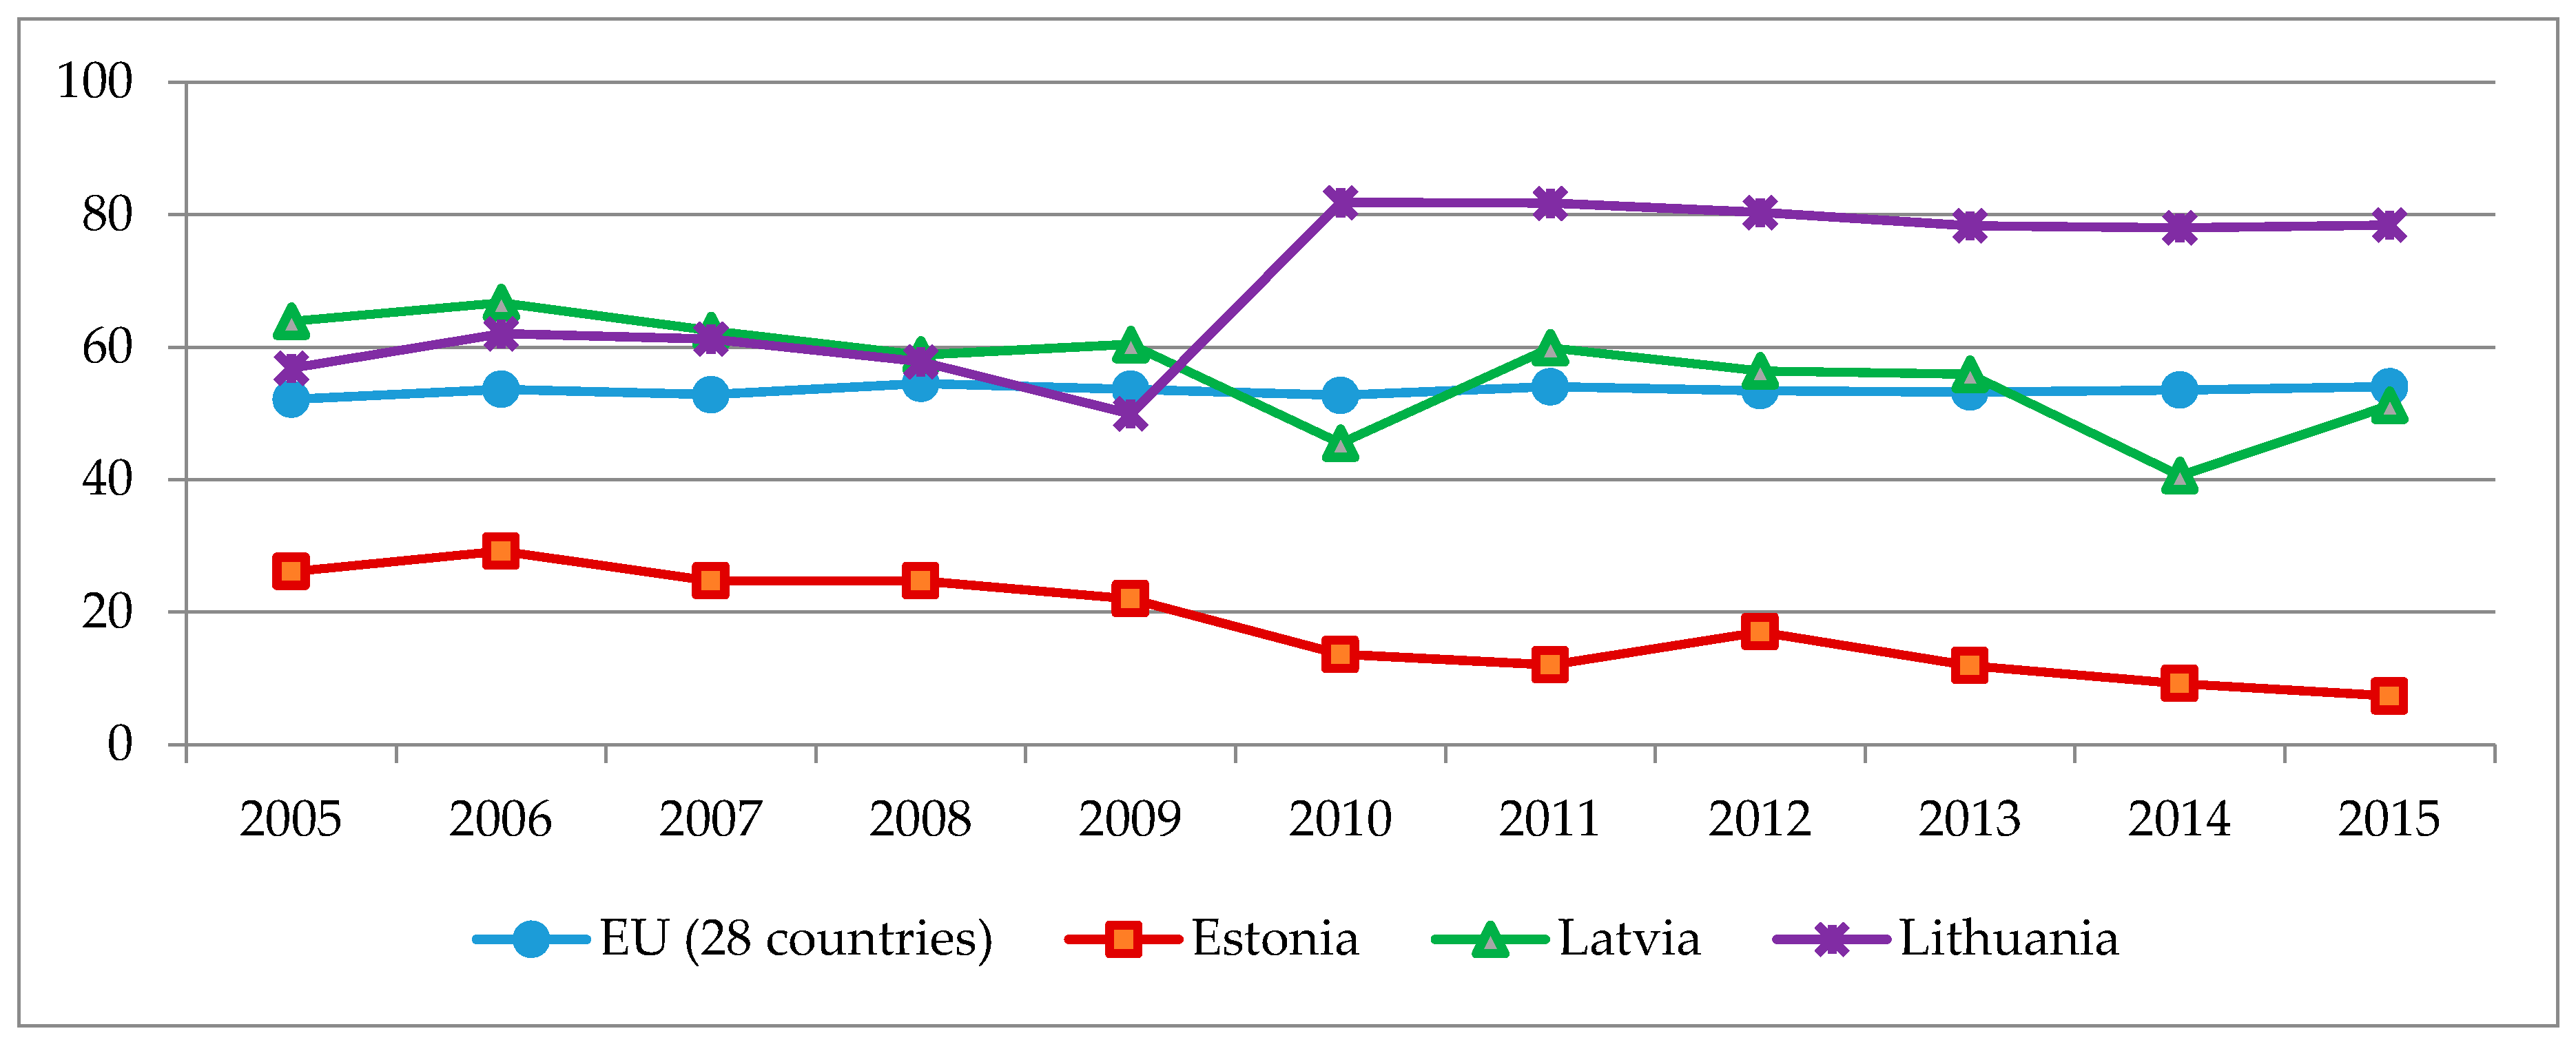
The security of energy supply can be visualized through the energy dependency rate, which is expressed by the ratio between net energy imports and gross inland energy consumption. This indicator indicates the ability of a country or region to meet all of its energy needs. In 2015, in EU MS, the highest need was for petroleum products, of which about 90% were imported. For natural gas, energy import dependency in 2015 was about 60% across all of the EU MS.
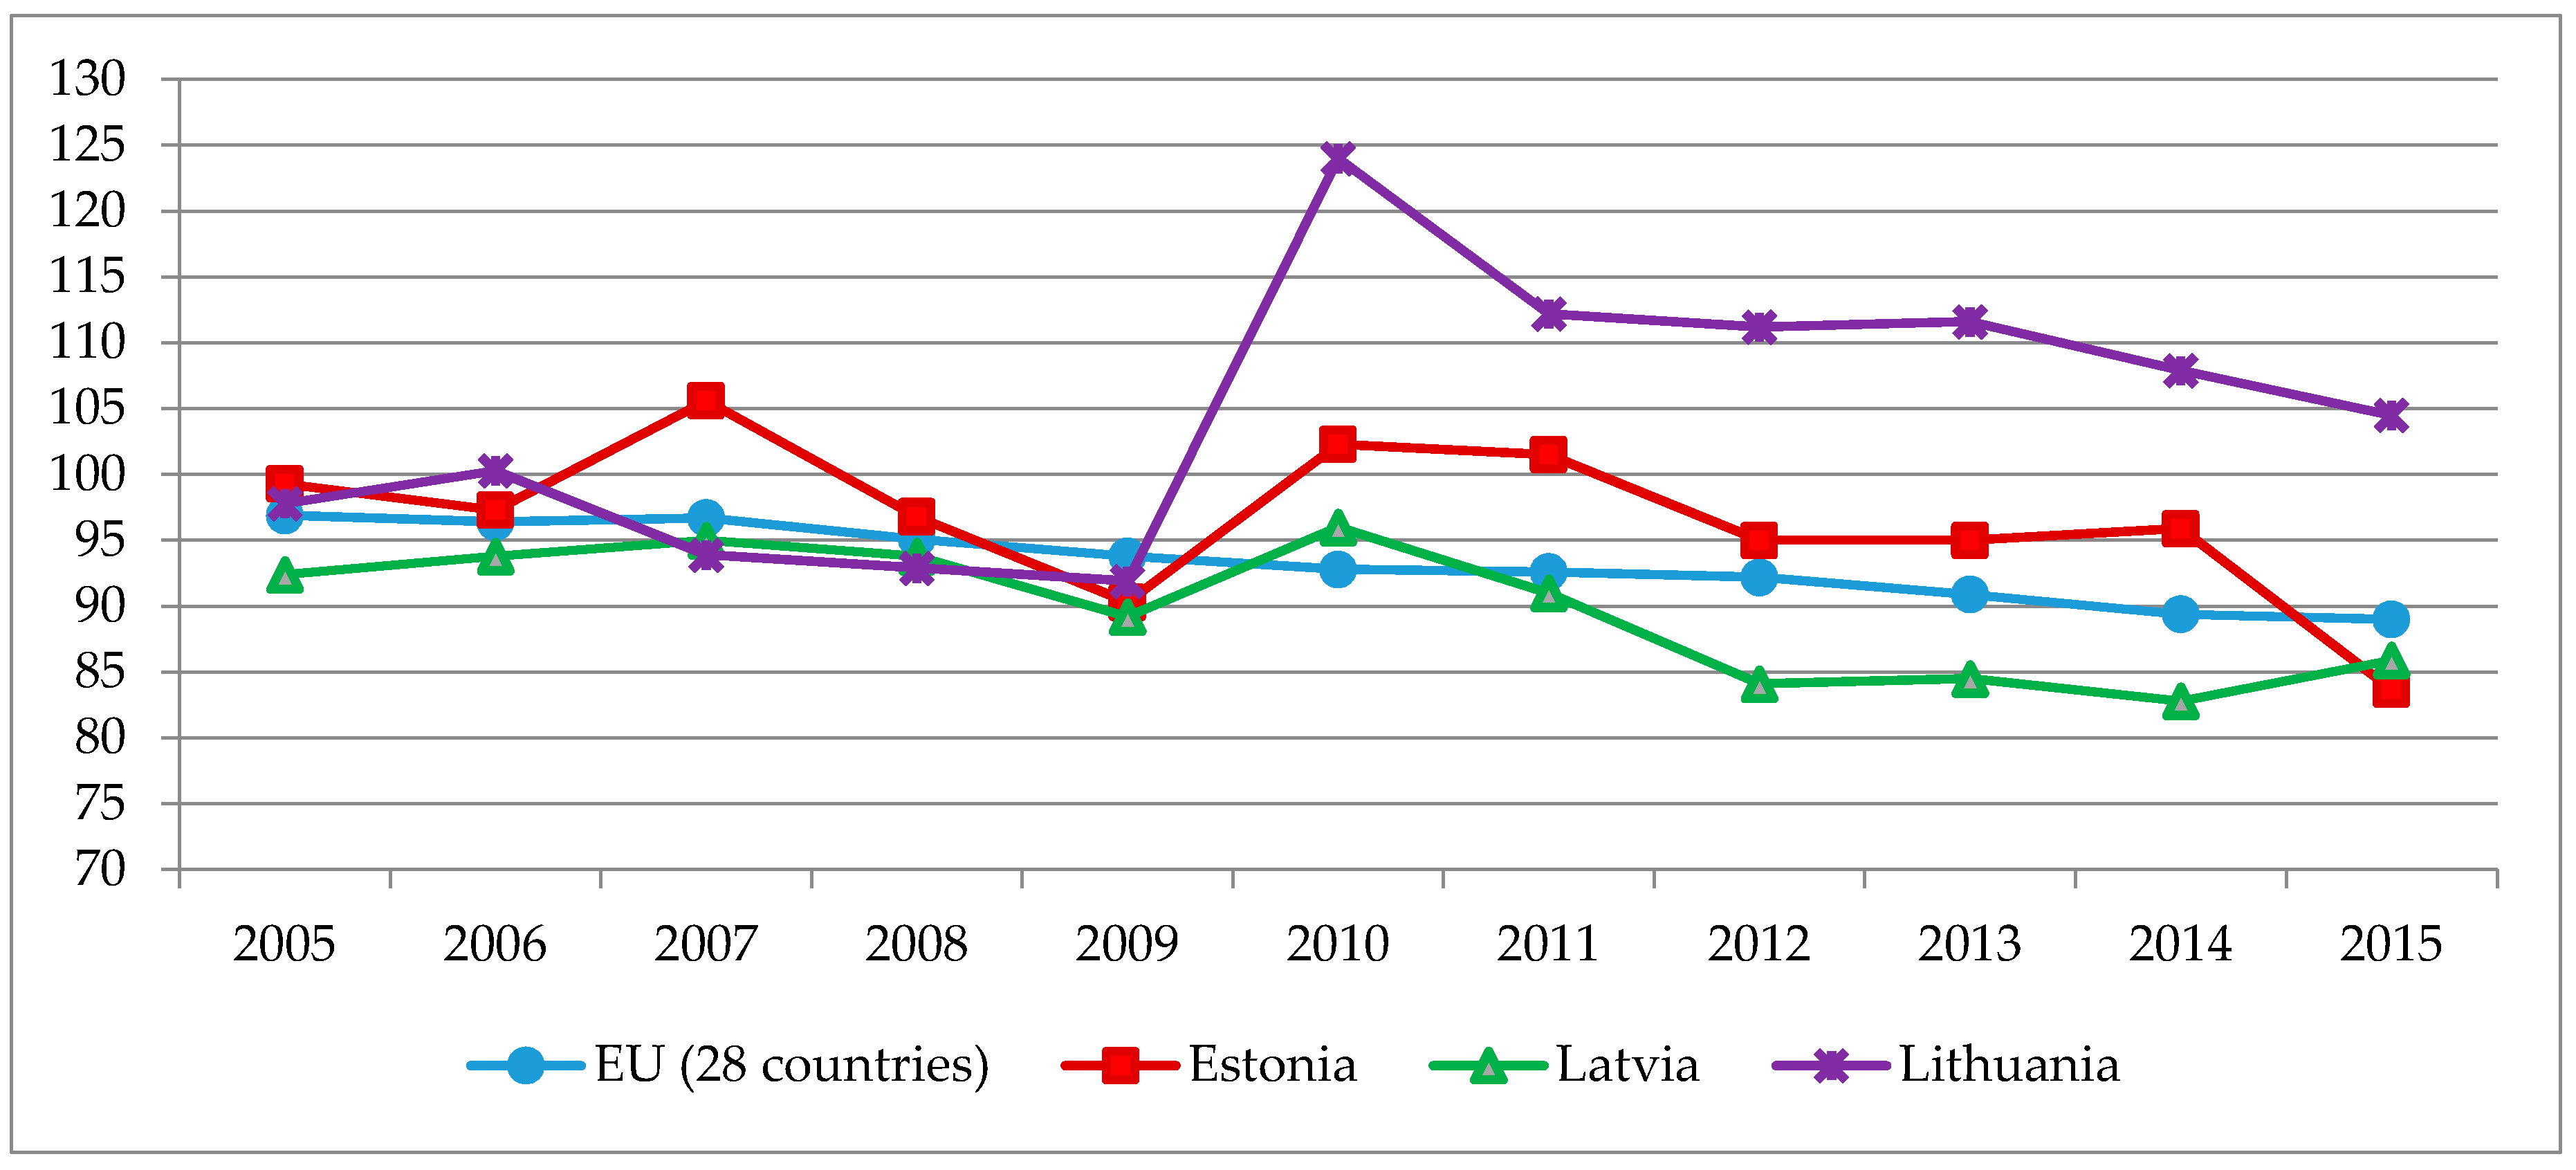
Figure 14 presents the trends of energy dependency in the Baltic States.
One can notice that Lithuania had the highest energy dependency rate in 2015 among the Baltic States. This is linked to the closure of the nuclear power plant in Lithuania in 2009, and the subsequent steep growth of its energy imports. Meanwhile, Estonia had the lowest energy import dependency rate, as the country has significant resources of oil shale, and has been using them intensively for energy generation. Estonia’s dependency rate was only 7% in 2015. Latvia had an energy dependency level that was similar to the EU average, but one can notice a positive decreasing trend regarding its energy import dependency, i.e., from 64% in 2005 to 51% in 2015, while the EU average was stable over the same period.
4.3. The Influence of Environmental Fiscal Reform on the Baltic States’ Sustainable Development Trends in the Energy Sector
Further linear equations of the temporal dynamics of the selected sustainable energy development indicators from the ESDI list for the Baltic States will be applied for the assessed period, and for future predictions in case of stable development. Linear regression establishes a relationship between ESDI indicators (dependent variables) and years (independent variable). It is represented by the equation Y = b × X + a, where Y is the dependent variable, b is the slope of the line, X is the independent variable, and a is the intercept. The determination coefficient (R2) was selected to assess the correspondence of the linear equation to the actual data. The determination coefficient showed which part of the data dissemination could be justified by the linear regression. The closer R2 is to 1, the closer the equation is to the actual data.
In practical application regressive analysis, it is required that
R2 ≥ 0.25. If
R2 ≤ 0.25, it is very unlikely that linear regression will be suitable to assess the trends of the selected sustainable energy development indicators. Based on the
R2 conditions, the linear regression equations of the selected ESDI trends for the Baltic States are presented in
Table 8. The highlighted
R2 values show that the linear regression equations are reliable, and that a prognosis for the future could be made.
Based on the results presented in
Table 8, the linear regression equation is applicable to assess trends and make a prognosis regarding the ESDI of the Baltic States, which are presented in the table. The temporal dynamics of linear regression show that during the investigated period (2005–2015), the economic dependency on energy intensity over years (
x) in Lithuania shows quite a rapid decrease (−13.255
x), and in 2020 could be about 130 kg of oil equivalent per 1000 EUR. Meanwhile, the EU average also shows a declining tendency (−2.64
x), and in 2020 could be 110 kg of oil equivalent per 1000 EUR. The primary energy consumption in Lithuania has a tendency to decrease (−3.7082
x), and according to prognosis in 2020, could be about 55% less compared to 2005 levels. The EU average also shows a declining tendency (−1.2436
x), and in 2020 could be about 17% less compared to 2005 levels. The carbon intensity of energy consumption in the EU has a slightly decreasing tendency every year (−0.8355
x); the prognosis shows that in 2020, the intensity of GHG emissions’ energy consumption in the EU will be 15% less compared to 2000 levels (11% compared to 2005). The share of renewable resources in final electricity generation shows an increasing tendency in all of the Baltic States. According to the prognosis, the share in Latvia will be more than 50%, the share in Estonia and Lithuania will be more than 20%, and the EU average will be about 30%. The share of renewable resources in final energy consumption rose during the examined period in all of the Baltic States; the prognosis shows that in 2020, the share of renewable resources in the final energy consumption will be about 35% in Estonia, about 27% in Lithuania, and about 21% on average among the EU MS.
In order to determine the strength of the connection between the selected sustainable energy development indicators and the environmental taxes, Spearman’s correlation coefficient was applied. Therefore, the strength of correlation between ESDI and the share of environmental taxes (million euro) were analyzed using Spearman’s coefficient of correlation, which shows the significance of the change of one variable to another (
Table 9).
As one can see from
Table 10, the implemented environmental tax reforms, or greening of taxes, had an impact on the achievement of sustainable energy development targets in the Baltic States.
Energy taxes in Lithuania have had a positive impact on energy intensity; the correlation between energy taxes and energy intensity is very strong (−0.825). Energy taxes in Latvia have had a positive impact on the carbon intensity of energy consumption; the correlation between indicators and energy taxes is very strong (−0.804). Correlations between energy taxes and the share of renewable resources in final electricity generation and the share of renewable resources in final energy consumption are very strong in all of the Baltic States. It can be concluded that environmental taxes undoubtedly have had a positive impact on the development of renewable energy. Due to the developed transport tax system in Latvia, transport taxes have had a positive impact, and the correlation between transport taxes and the share of renewable resources in fuel used in transport is very strong (0.824). Environmental tax reform has influenced consumers to buy less environmentally damaging products and change their behavior in general. They also provide incentives for producers to implement new technologies and innovations, and further improve products and processes.

 ,
, 


