1. Introduction
Achieving high efficiency in electrical machines is important to meet increased energy standards while preserving the environment. In order to increase motor efficiency, new topologies and manufacturing methods for electric motors have been developed by motor engineers.
Nevertheless, the conventional surface-mounted permanent magnet (SPM) motors showing the less open-circuit airgap flux (OCAF), as compared to other permanent magnet (PM) motors, have been widely used due to their simple structure and control algorithm.
In addition, motor engineers should carry out the robust optimal design which is needed to satisfy the required probability of failure (POF) caused by the variations of the uncontrollable noise factors such as the manufacturing tolerances, the operating temperature, etc., as well as the mean value of the target performance [
1].
A few previous studies have investigated how the motor performance is influenced by manufacturing tolerances in PM motors and how the robustness of PM motors can be improved, mainly in terms of the cogging torque and torque ripple.
The effectiveness of the various methods to reduce cogging torque in mass production being subject to manufacturing tolerances was validated by using the finite element method (FEM) coupled with a statistical analysis in [
2,
3,
4].
The influence of additional airgaps, which is caused by the manufacturing tolerances between segmented stator cores which is used for the higher fill factor, on the cogging torque was analyzed by using the FEM or analytical solutions in [
5,
6,
7,
8].
A few groups have carried out statistical analysis of the effects of magnet tolerance such as magnet misplacement, remanence variation, etc., on the cogging torque or torque ripple by using the FEM or analytical expressions in [
9,
10,
11,
12]. In [
13,
14,
15,
16,
17,
18,
19], the authors carried out the robust optimal design, using the Taguchi robust method or design of experiment and etc., to improve the variation of motor performance, e.g., cogging torque and torque ripple, caused by the manufacturing tolerances.
In [
20], the authors presented a torque control scheme of a PM motor considering the OCAF variation due to the manufacturing tolerances or temperature variation of the PM, which can be used in the full operation region.
However, these references analyzed the effects of the manufacturing tolerances mostly on the variations of the cogging torque and torque ripple in SPM motors by using complicated analytical equations, FEM, and statistical analyses. So it was observed that little research had been carried out on the OCAF variation caused by the manufacturing tolerances even though the OCAF is the most fundamental and important characteristics for the high-quality motor.
In addition, the FEM used in the previous studies is time-consuming and it is difficult to physically investigate the cause and effect between design variables and the OCAF.
Guo et al. presented a system level robust optimal design to achieve two target indices i.e., mean and standard deviation of an objective function by using optimization tools, FEM, and six sigma tools [
21,
22,
23,
24,
25,
26].
In [
27], the authors focused on the application of the variance-based global sensitivity analysis for a topological derivative method in order to solve a stochastic nonlinear time-dependent magneto-quasi-static interface problem, in which the objective is to provide a robust design of the rotor poles and of the tooth base in a stator for the reduction of the torque ripple and electromagnetic losses, while taking material uncertainties into account.
However, these methods also seem to be time-consuming and it is difficult to theoretically investigate the effects of the design variables on the OCAF. Therefore, this paper presents the robust optimal design method using a hybrid response surface method (H-RSM) which directly finds an optimal point satisfying a target Z-value or a probability of failure through three steps. The objective of the method is to achieve the six-sigma level of Z-value of the OCAF; the six-sigma level of Z-value corresponds to 0.00034% of the POF [
1].
First, the OCAF of the SPM motor is analyzed using the magnetic equivalent circuit (MEC) to investigate the functional relationship between OCAF and design factors; the analytical solution solving the electromagnetic field equation can be the alternative method [
28]. However, the method is difficult to study the effect of the additional airgaps and to investigate the functional relationship between OCAF and design factors, thus, the MEC method is used for the magnetic analysis in this paper.
There have been lots of studies on the MEC of the SPM motor to study more hard problems such as magnetic saturation effect and armature reaction field until recently [
29,
30,
31,
32,
33]. However, it is difficult to find out articles studying the influence of the additional airgap between the PMs and rotor back yoke. Therefore, it is modeled in the MEC in this paper and the OCAF equation is derived from the MEC in order to investigate the effects of design variables, i.e., airgap length, magnet thickness (MT), and magnet pole angle (MPA), on the OCAF and its variation due to variations of the airgap lengths. Then, the results of the MEC method are compared with those of the FEM modeled by slotless stator to validate the results.
Second, the tolerance sensitivity analysis, using the partial derivative of the OCAF equation with respect to the airgap length, is performed to investigate the effects of design variables on the variation of the OCAF. The objective of the tolerance sensitivity analysis is to preliminarily investigate design directions of the robust optimal design before performing that. Finally, the robust optimal design using the H-RSM is carried out to achieve the six-sigma level of Z-value on the OCAF, in which motor characteristics are analyzed using the FEM modeled by slotted stator.
2. Tolerance Sensitivity Analysis of the OCAF Using MEC Considering the Manufacturing Tolerances
2.1. Analysis Model Using MEC
The OCAF is one of the most important characteristics for analyzing and designing PM motors and their control strategies. Thus, it is necessary to study the OCAF from the initial design stage to the optimization stage in detail.
In this paper, the OCAF and its variation caused by variations of the airgap lengths, including the additional airgap between the PMs and the rotor back yoke, are investigated based on the MEC method and its analytical equation in order to explicitly study the functional relationship between design variables and the effective OCAF.
Table 1 shows the specifications of analysis model in this paper.
Figure 1 shows the analysis model which is composed of the fractional-slot concentrated winding (FSCW) with nine slots in the stator and the SPM with six poles in the rotor. To simplify the analysis and to investigate the trends of the effective OCAF according to the design variables, the slotted stator core in
Figure 1a is replaced with the slotless stator core and it is mathematically expressed by the carter coefficient
Kc [
29,
30,
31,
32]. In addition, the magnetic saturation effect occurred in the electrical steel is not considered in this MEC, assuming the SPM motor does operate in the linear permeability region at the open-circuit condition.
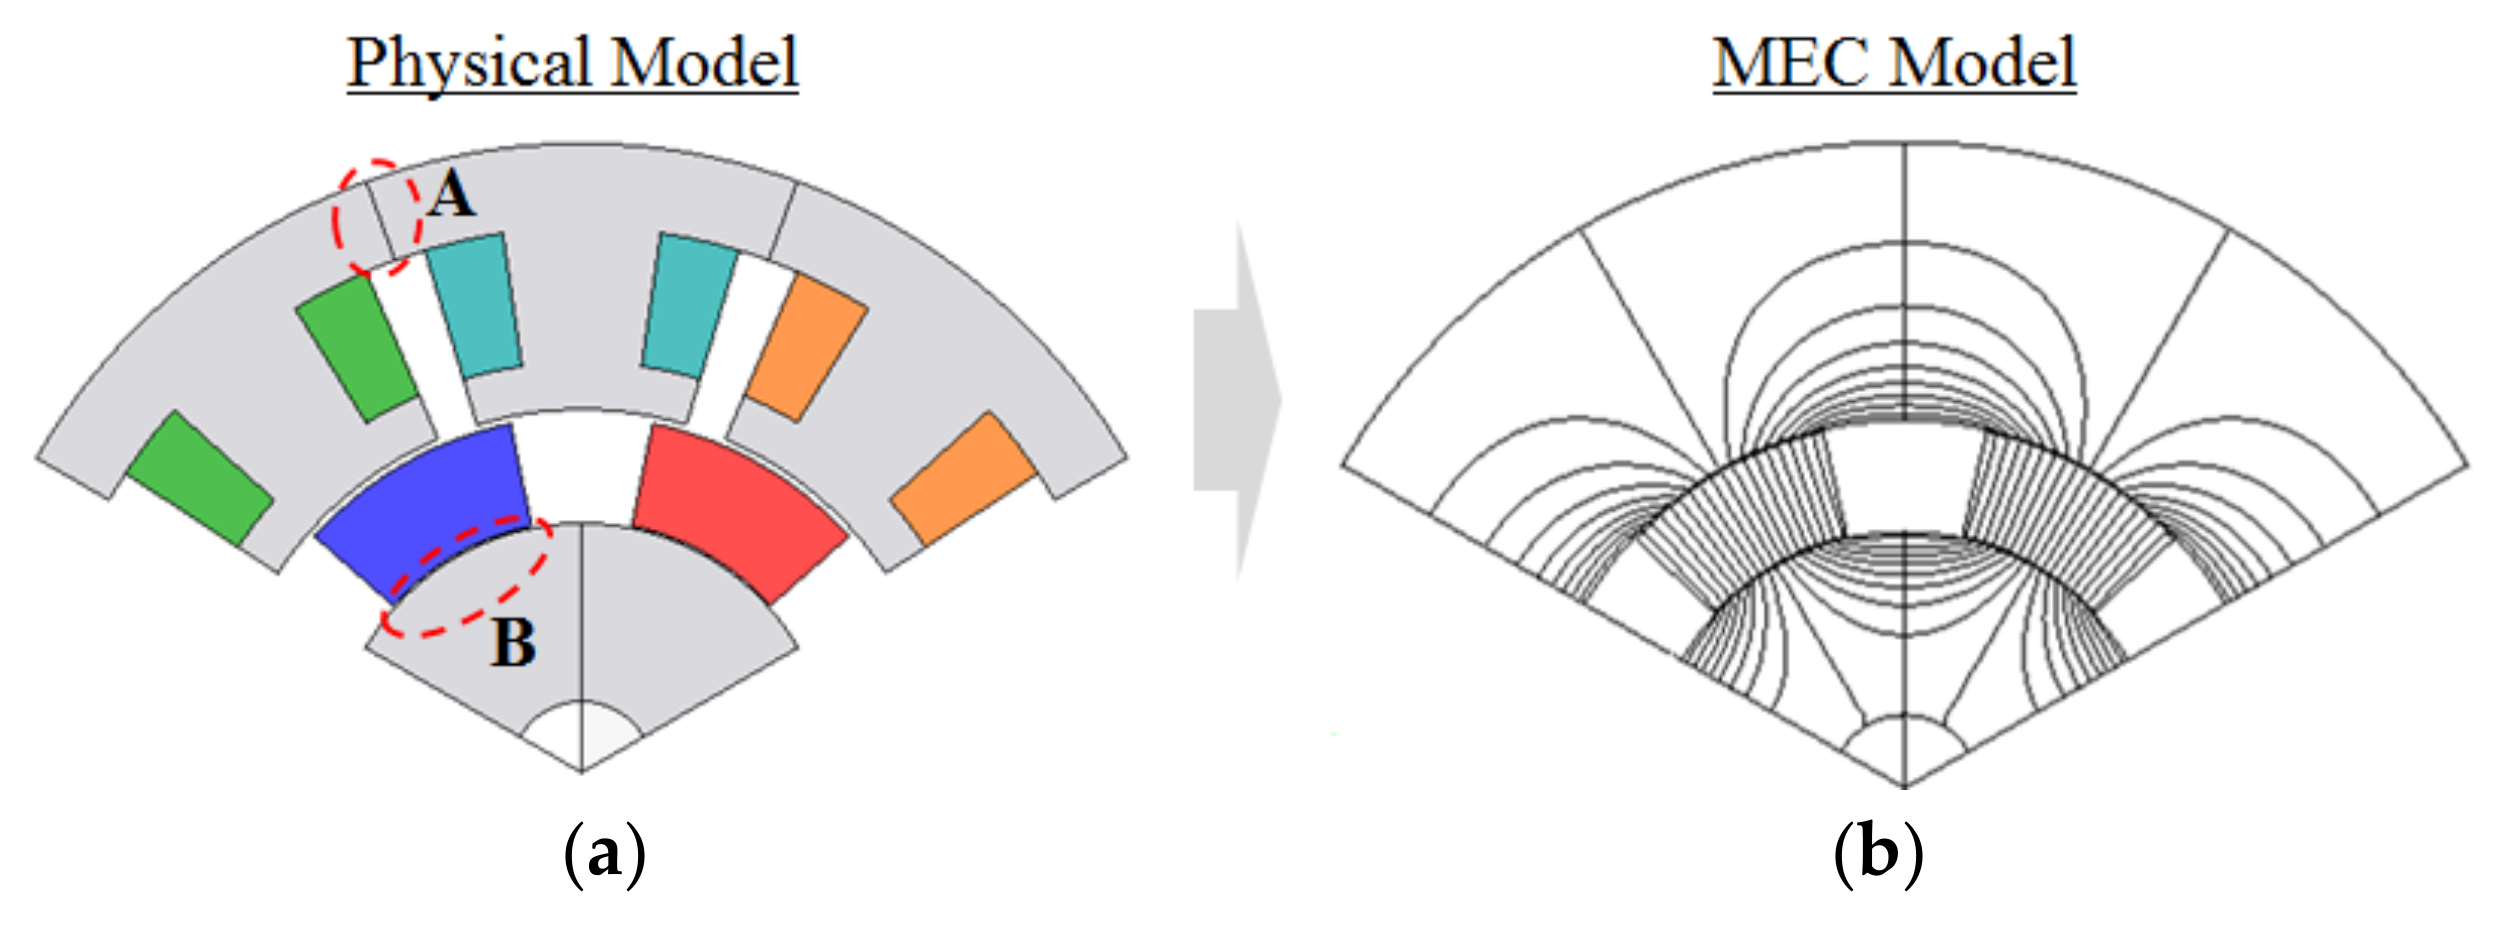
There can be two additional airgaps in the stator and rotor. One is the additional airgap between segments of the stator cores which has been used for increasing the slot fill factor and the other is that between the PMs and rotor back yoke; these are represented by A and B in
Figure 1, respectively. The two additional airgaps result in a decrease in the OCAF and motor performance; thus, they should be included in the MEC model.
2.2. Analysis of the OCAF Using MEC
Effects of the additional airgaps A and B in
Figure 1 are considered in the MEC and its derived equations. The additional airgaps A and B in
Figure 1 are expressed as
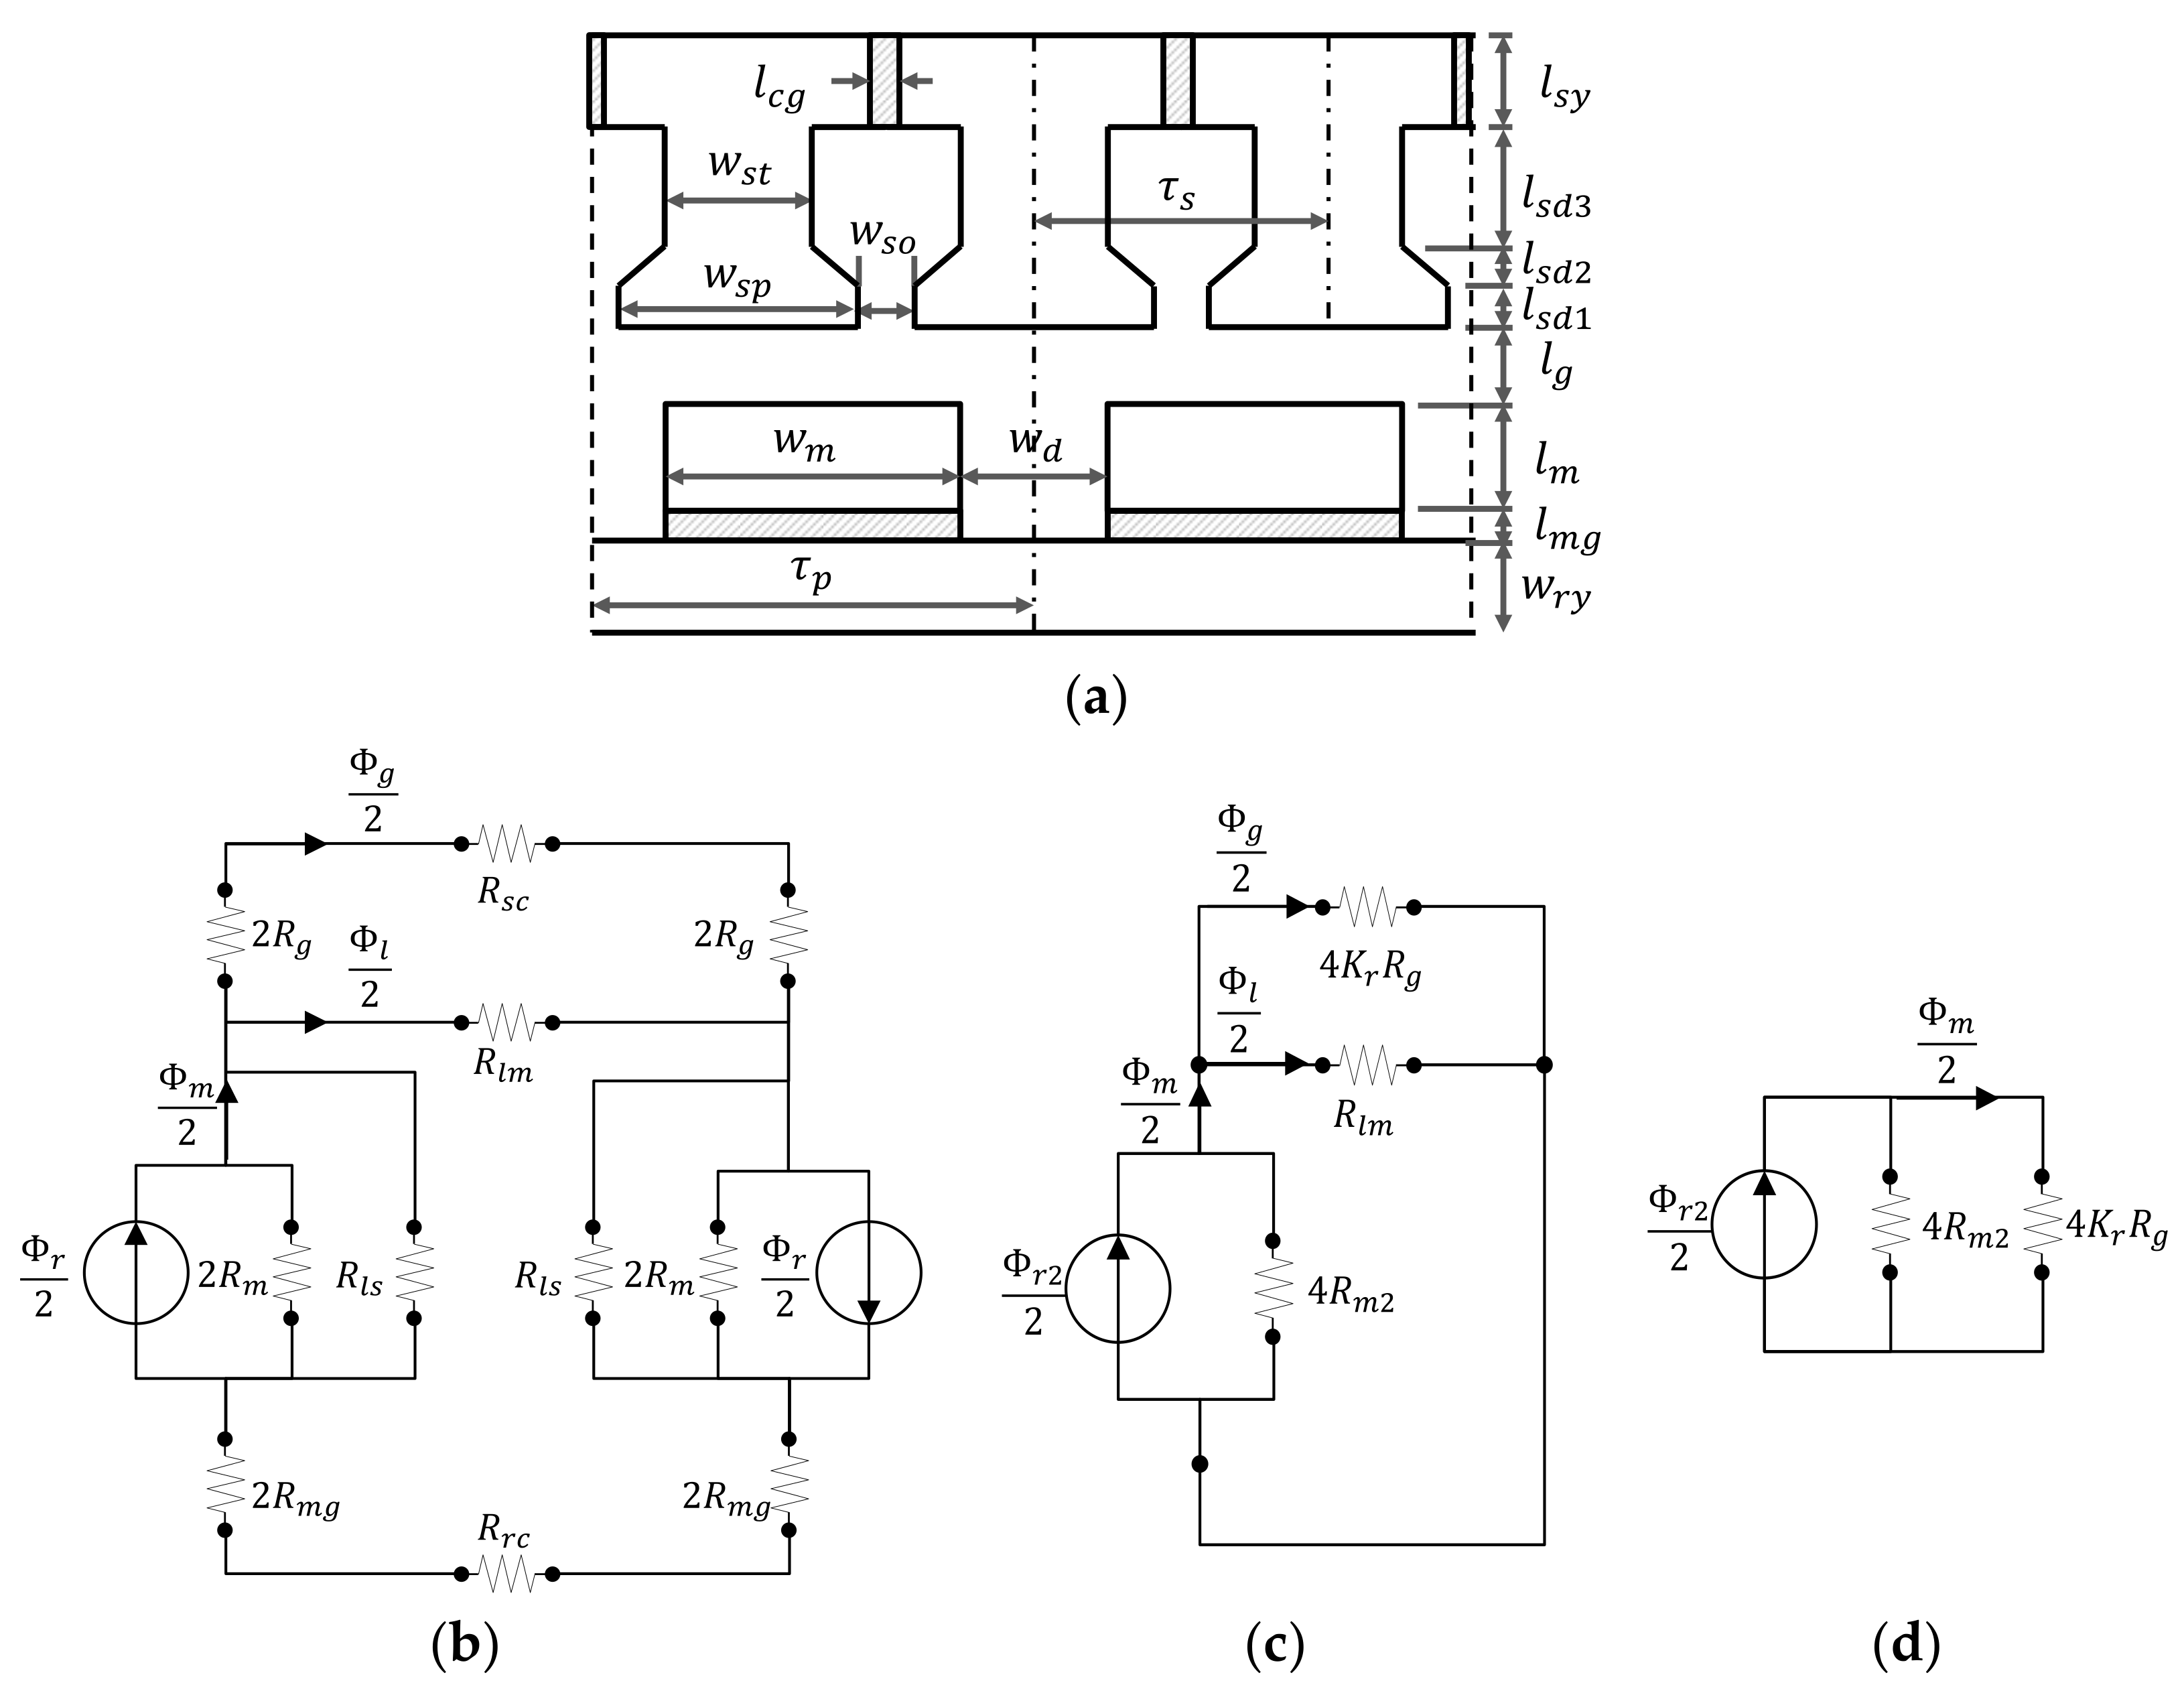
and
, respectively, in
Figure 2a which is the equivalent linear model of the SPM motor in this paper.
Figure 2b shows the initial full MEC with the ring-type stator core, in which the magnetic reluctance accounting for the additional airgap
in the stator core can be considered to be included in the stator core reluctance
and the magnetic reluctance accounting for the additional airgap
is expressed by
.
The initial MEC model depicted in
Figure 2b can be simplified as shown in
Figure 2d. The simplification procedure was explained in [
25] in detail, so, only different points are presented in this paper.
Table 2 shows all of the elements used in the MEC in
Figure 2b.
and
are ignored due to their relatively small effects on the OCAF. The effect of
can be included in the PM model by Equations (1) and (2):
is combined with
and expressed by the reluctance coefficient
written in Equation (3) [
29]. In this paper,
includes the additional airgap
between the segmented stator cores, so the value of the reluctance would be larger than that not including the additional airgap:
The effect of
is can be expressed by the leakage flux coefficient
, which is defined as Equation (4) [
29]:
The MEC in
Figure 1b is solved with respect to
, substituted into Equation (4), and then the equation is rearranged to give the OCAF:
After substituting
into Equation (2) and rearranging the equations, the OCAF and its flux density are finally expressed by Equations (6) and (7), respectively:
Here,
is the concentration coefficient defined as
in SPM motor [
29], in which
and
are the cross-sectional area of the magnet and airgap, respectively.
It can be known that
is added to the denominator of Equation (6) when taking into account the additional airgap of the PM, as compared with what was written in [
29] which did not consider the additional airgap of the PM. The effect of the
is similar to that of the
, as expressed in Equation (6); thus, its effect can be included and simulated by the
.
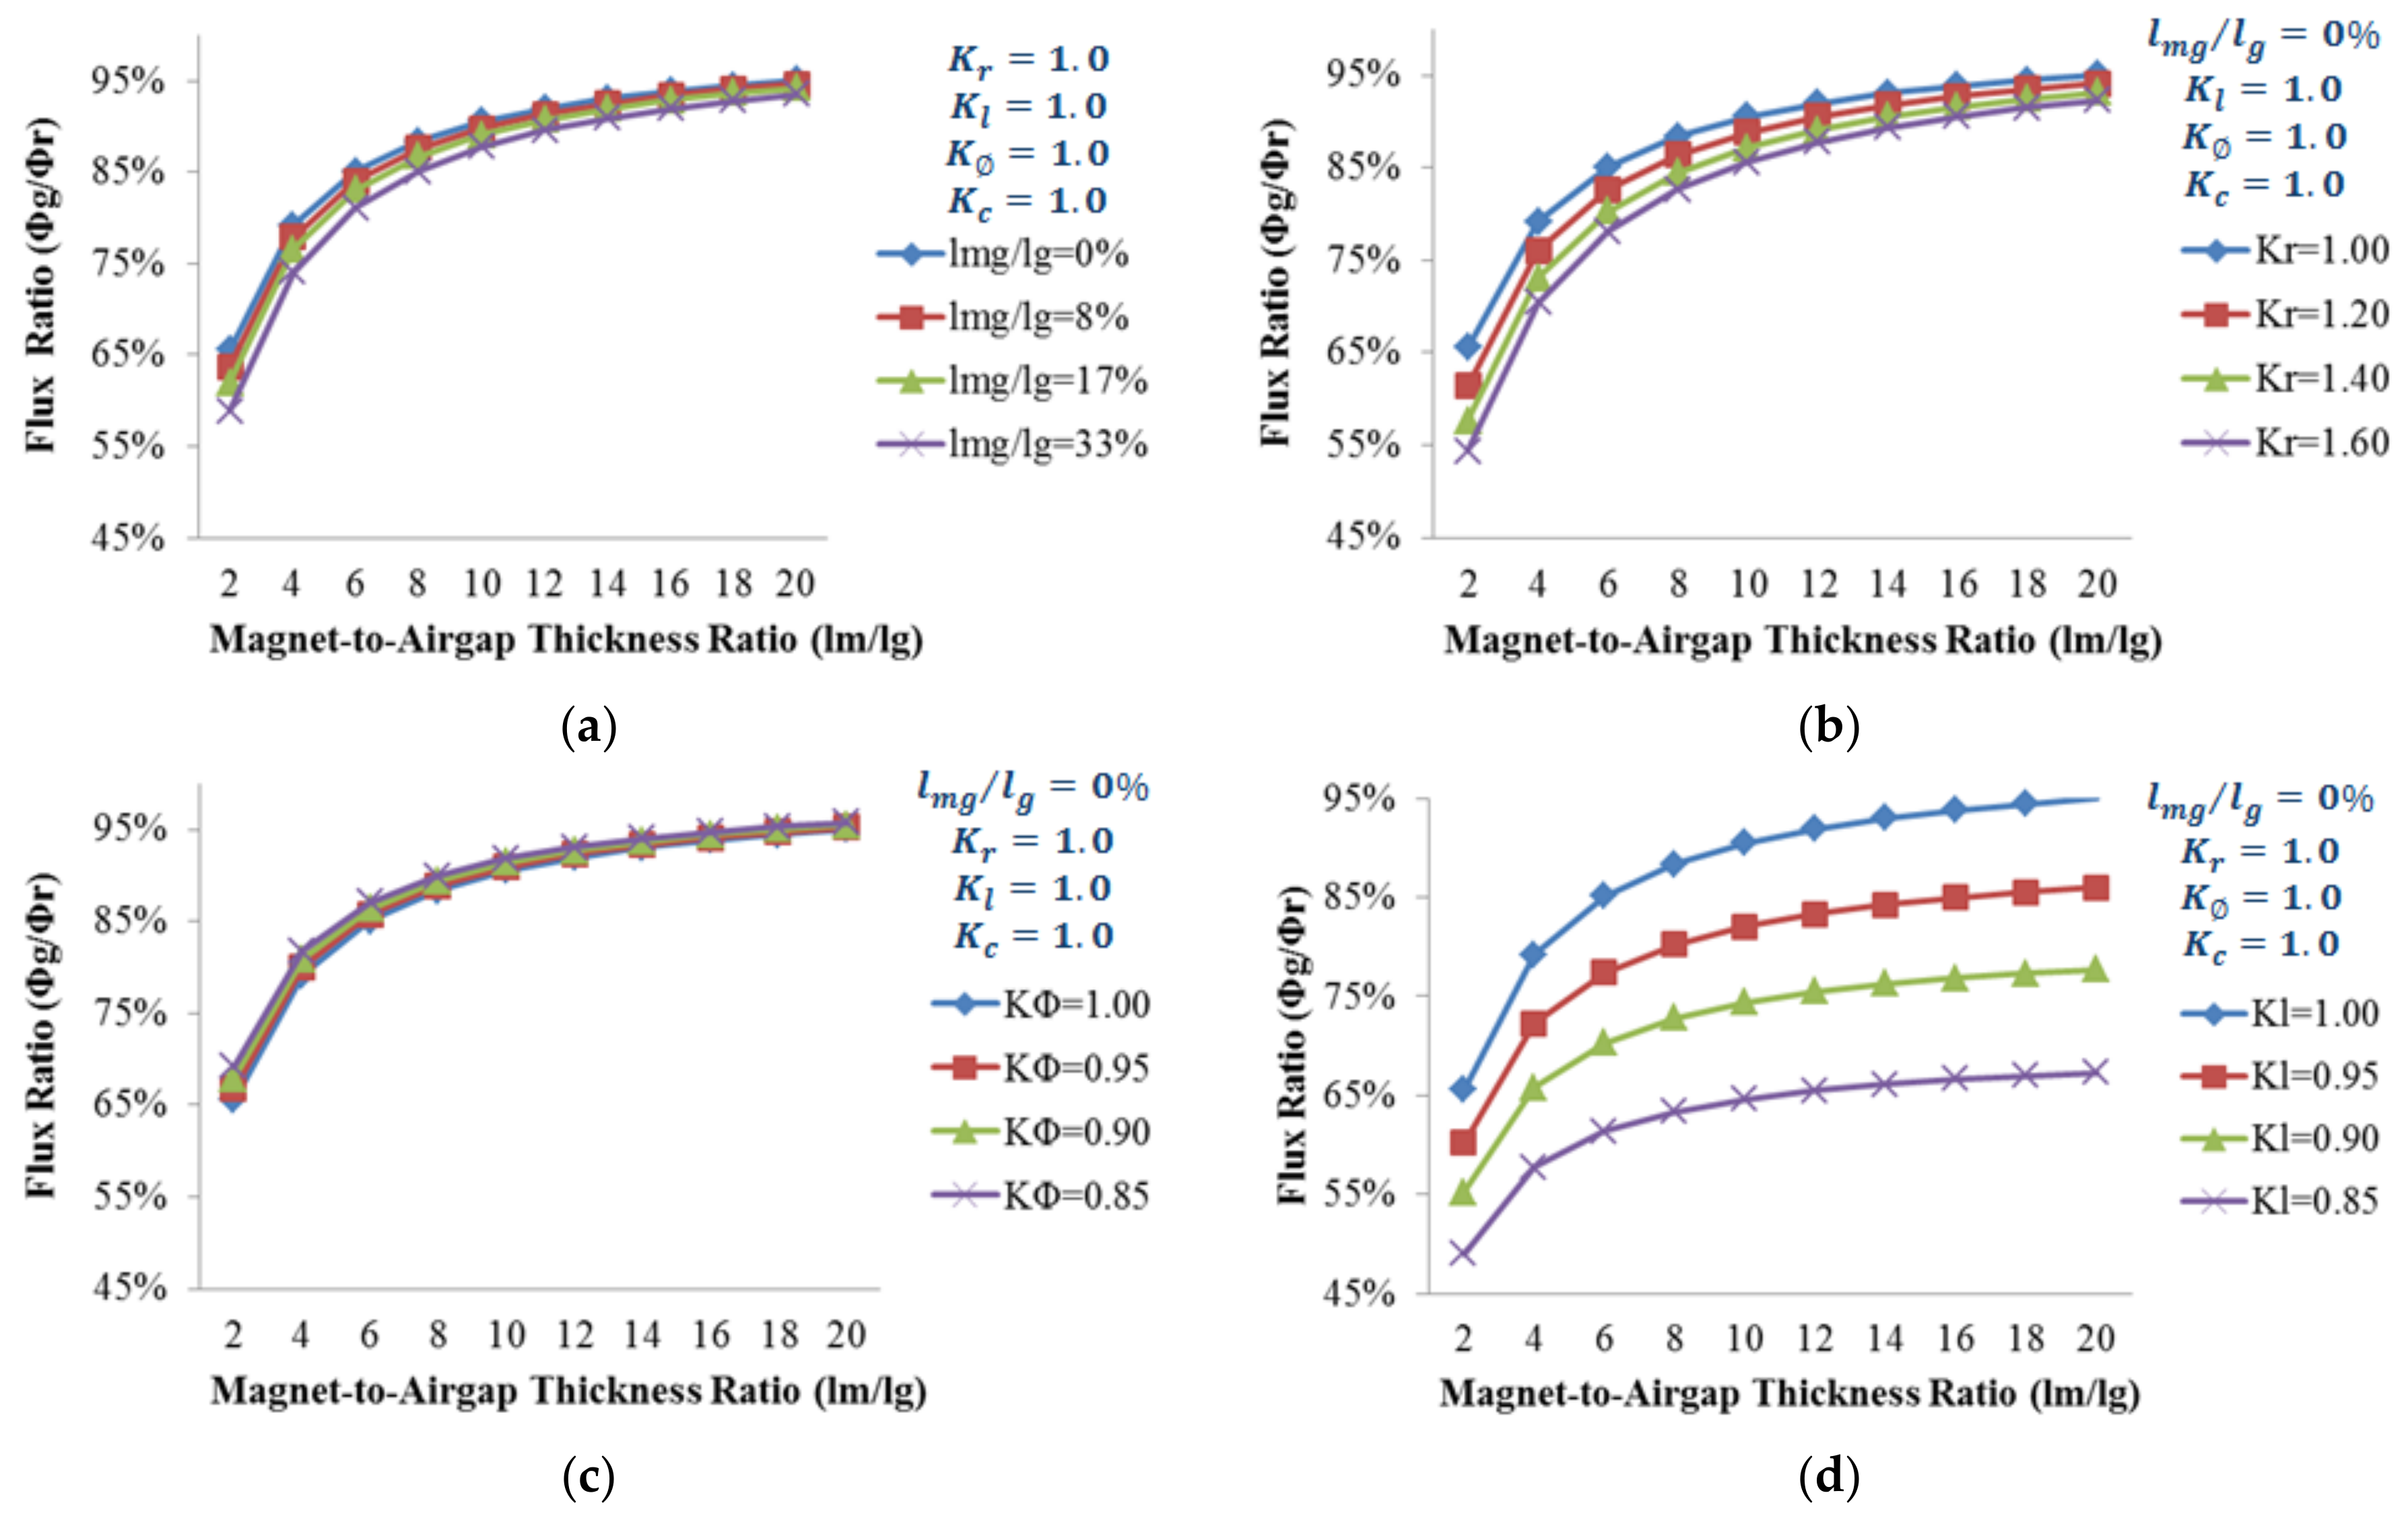
Figure 3 shows the flux ratio (FR)
as a function of magnet thickness-to-airgap length ratio
with respect to four parameters, i.e.,
,
for expressing
,
and
. As shown in
Figure 3a–c, FRs become more robust against the variations of
,
and
as
increases, respectively. On the other hand, FR becomes more sensitive against variation of
as
increases and its small variation results in larger variation of the OCAF as compared to the previous parameters as shown in
Figure 3d.
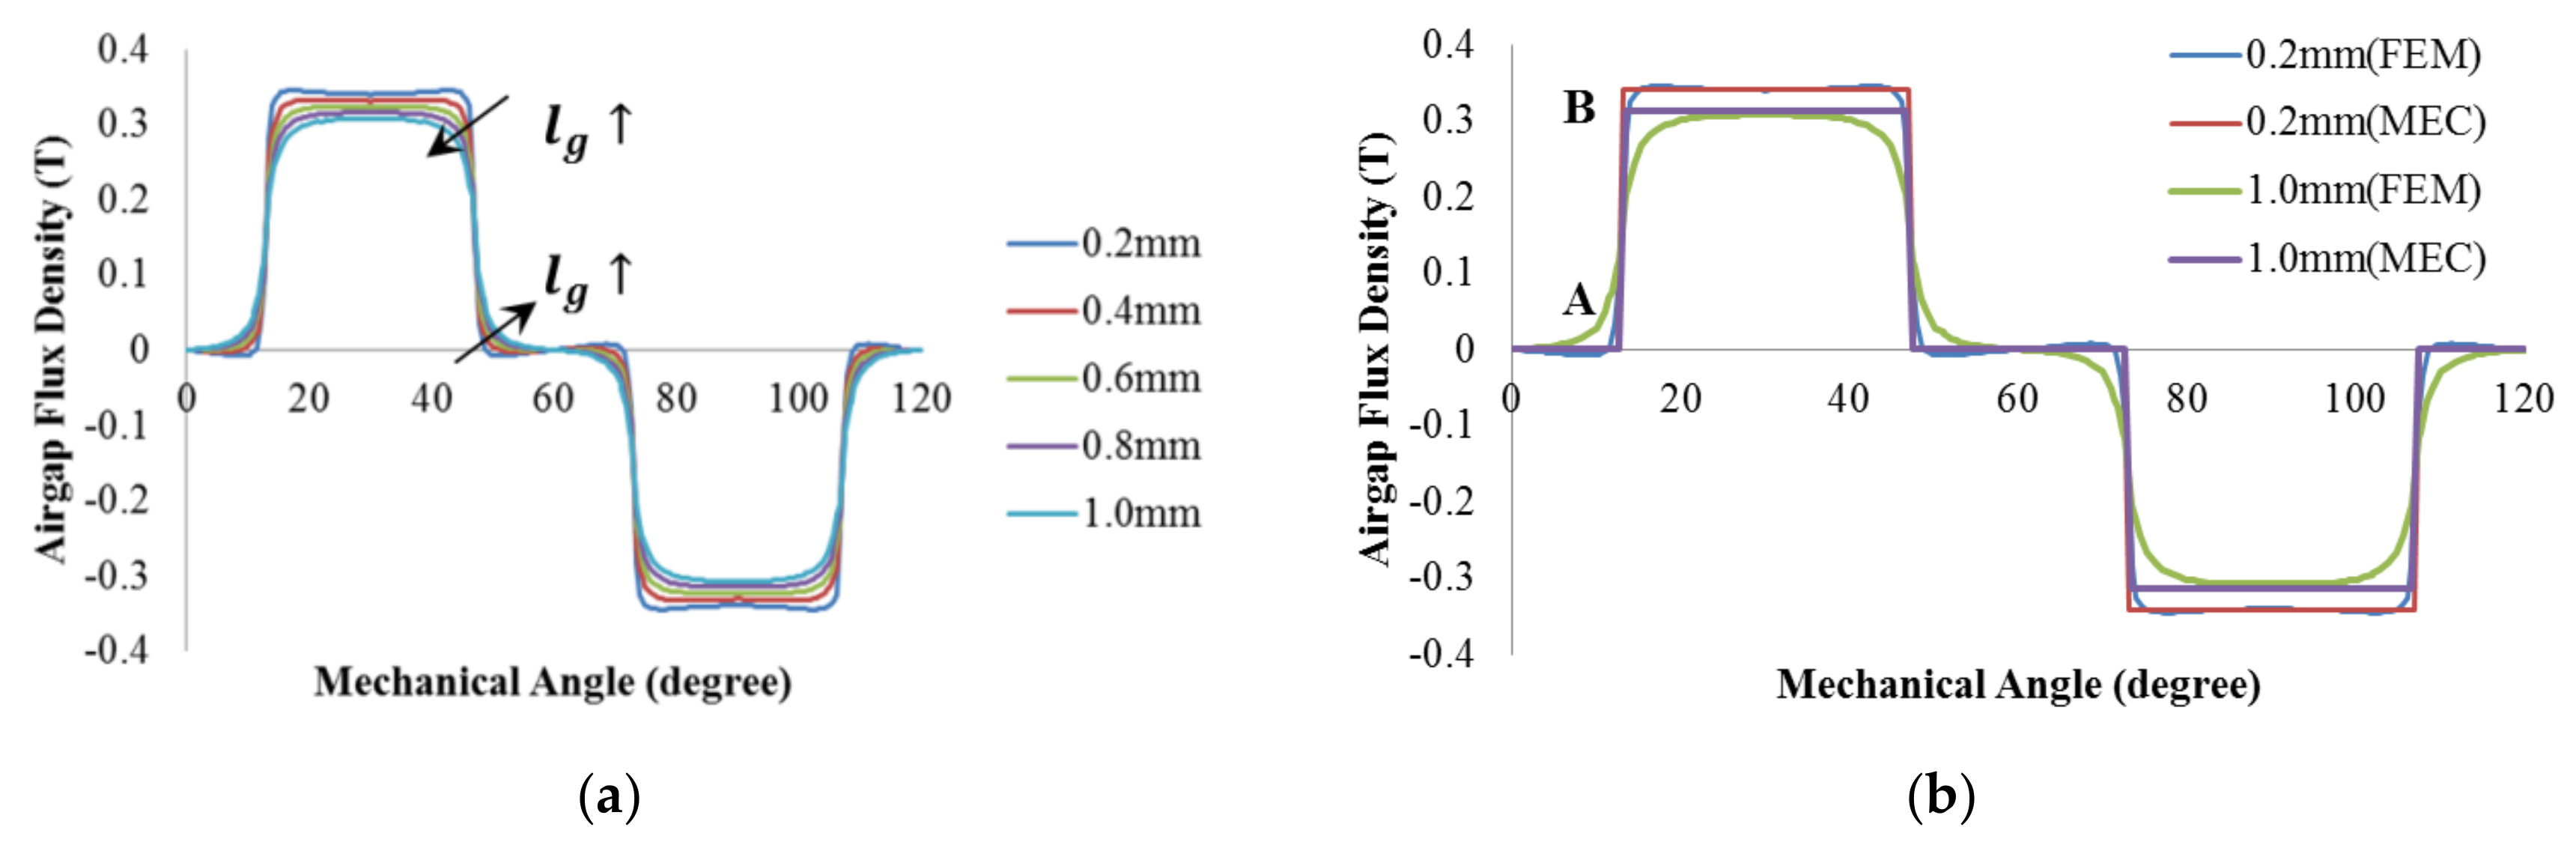
Figure 4a shows the distributions of the OCAF density analyzed by the FEM according to the airgap lengths with
= 8.8 mm,
= 0.2 mm, and MPA
°, in which the slotless stator core is used for the analysis. It can be seen that an increasing airgap length results in a little increased leakage and fringing fluxes at the edge of the PMs as well as a decrease in the average OCAF; this means that the leakage flux coefficient
depends on the airgap length. In this paper,
is assumed to be constant in order to simplify the analysis.
Figure 4b compares distributions of OCAF densities with airgap lengths = 0.2 mm and 1.0 mm, analyzed by the FEM and MEC method in which
=
=
= 1.0, and
= 0.845 on the surface of the PM, respectively. As can be seen, there are differences between the FEM and the MEC results at the rising-edge (A) and the falling-edge (B). Both errors cancel each other out, reducing the error between FEM and MEC. The maximum errors of the peak and average OCAF densities between the FEM and MEC method are 1.8% and 3.7%, respectively.
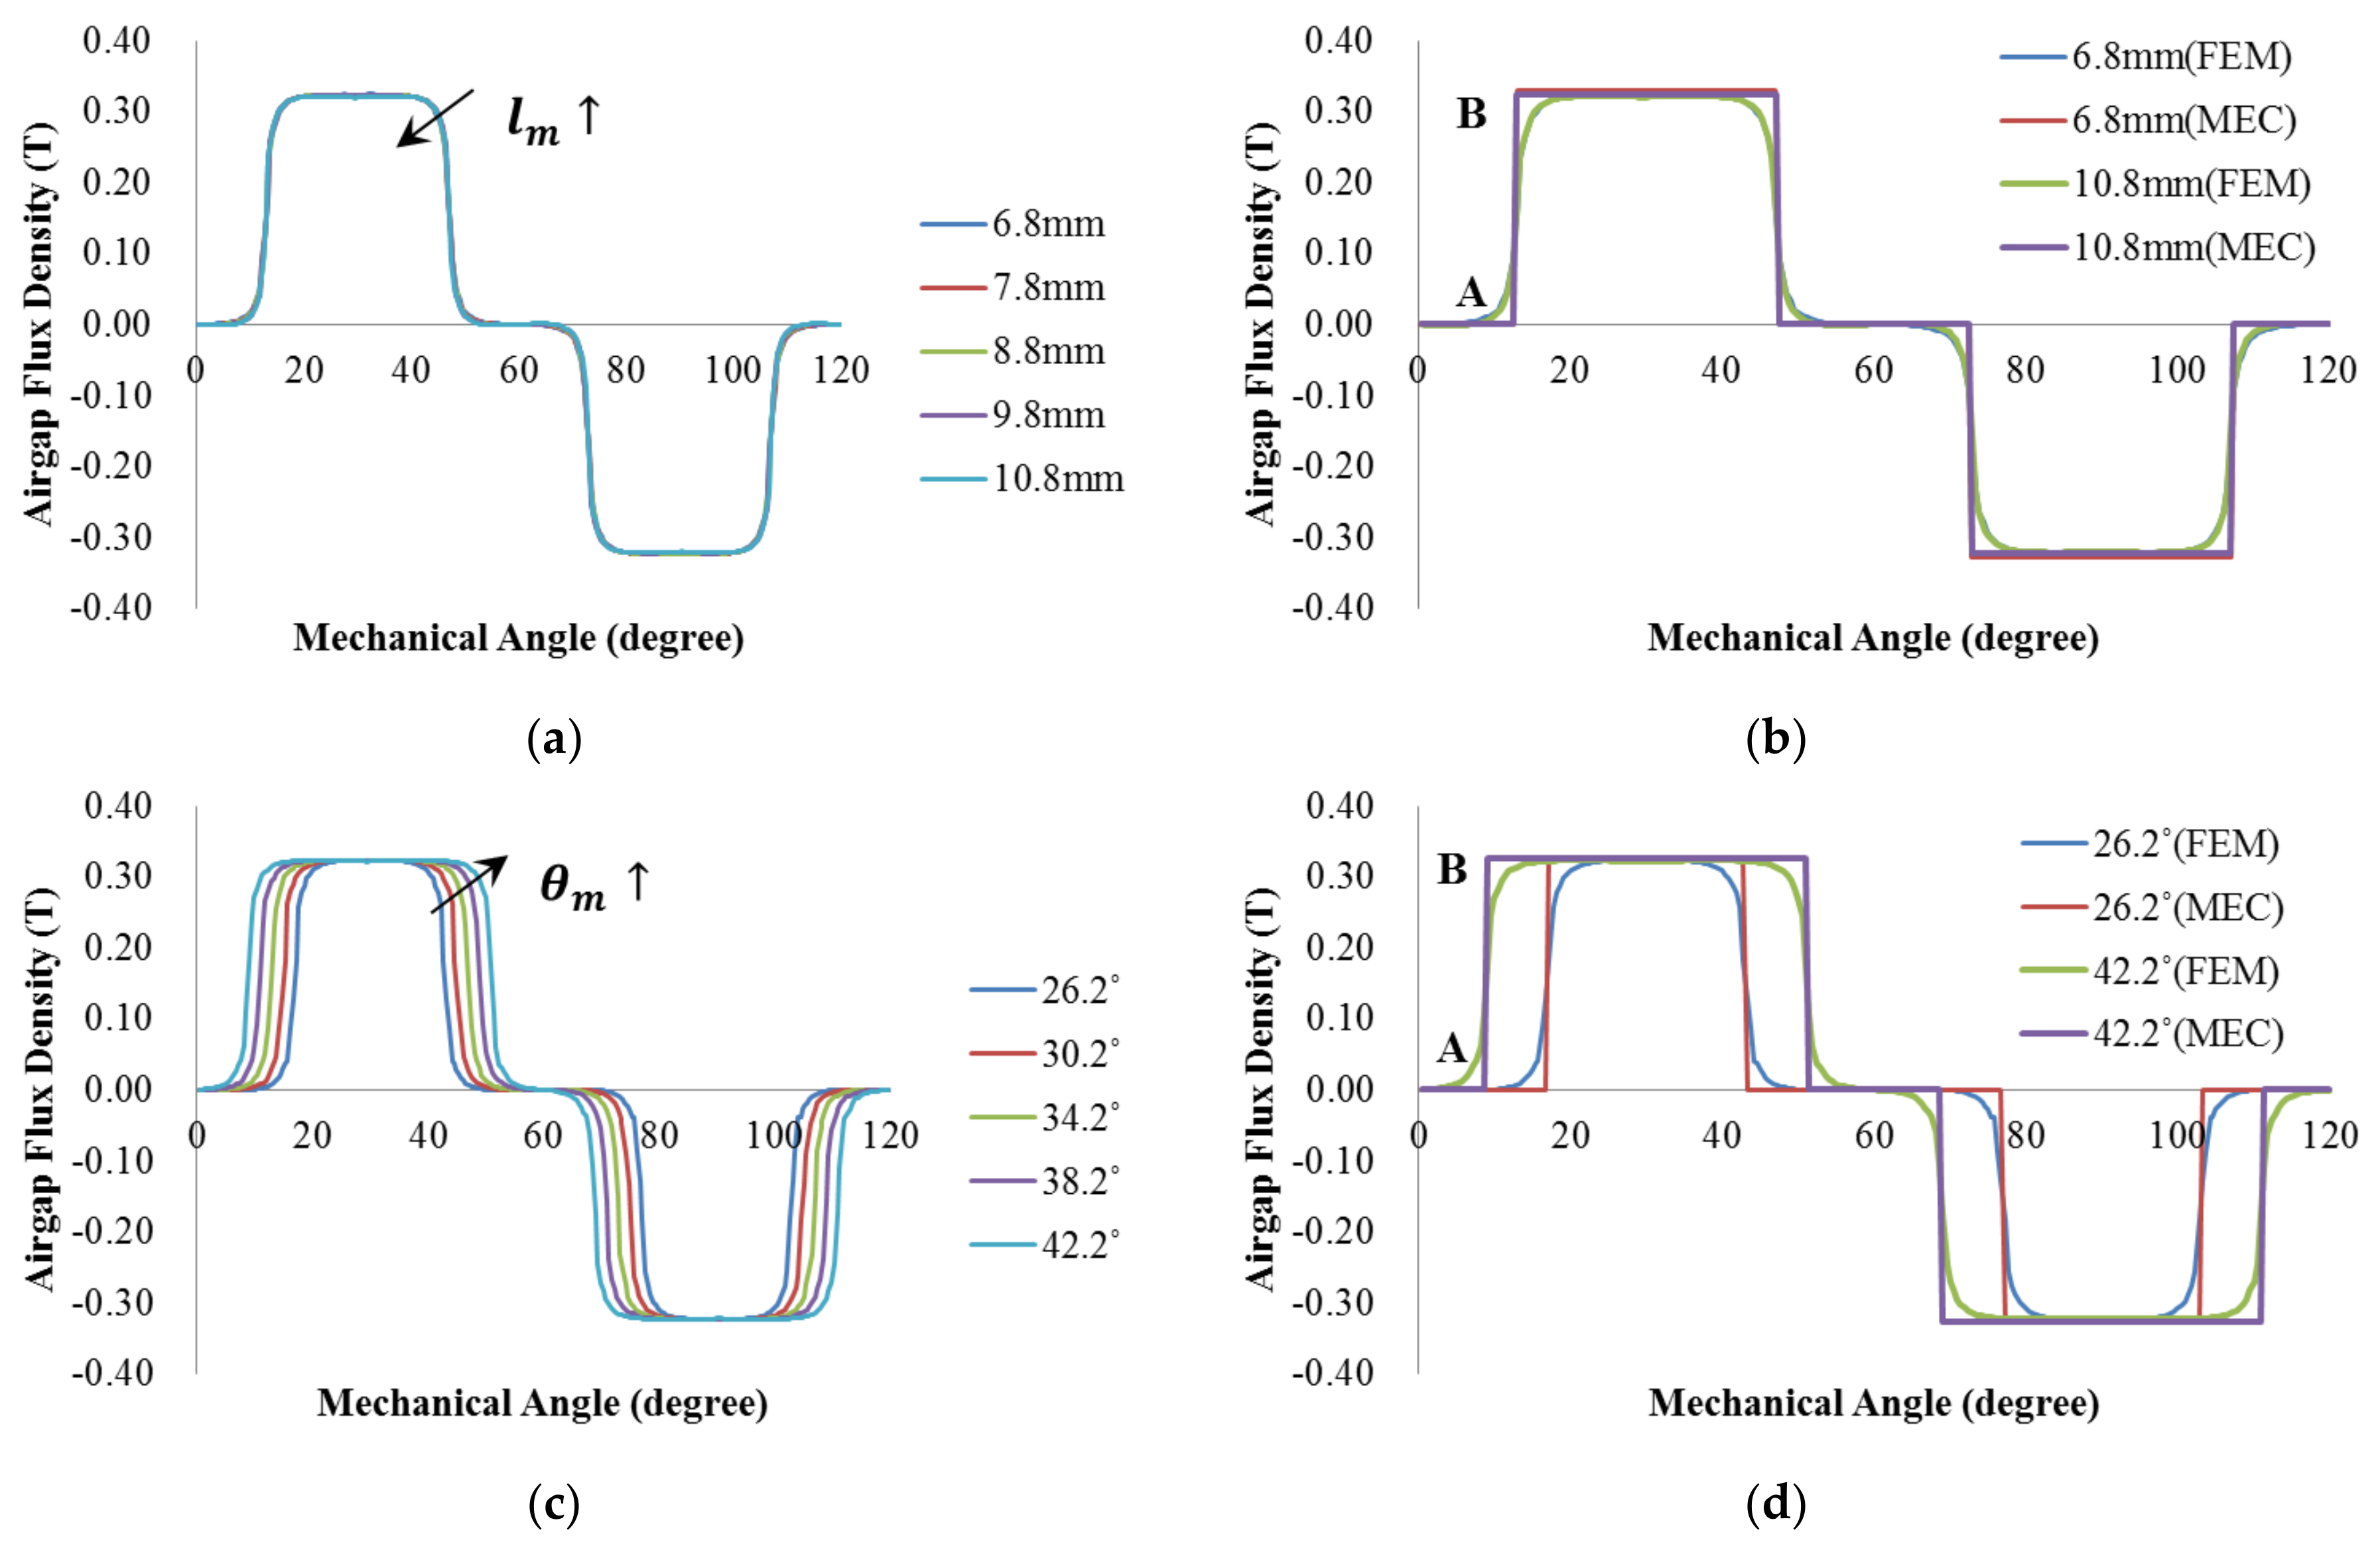
Figure 5a shows the distributions of the OCAF densities analyzed by using the FEM as a function of the MTs with
= 0.6 mm,
= 0.2 mm, and
°. The variations of the flux densities according to the MTs are very small due to the high values of the permeance coefficients.
Figure 5b compares the distributions of the OCAF densities with magnet thicknesses = 6.8 mm and 10.8 mm, analyzed by the FEM and the MEC methods in which
=
=
= 1.0, and
= 0.845 on the surface of the PM, respectively. As can be seen, the differences between the FEM and the MEC results at the rising-edge (A) and falling-edge (B) are similar to those of
Figure 4b. The maximum errors of the peak and average OCAF densities between the FEM and MEC results are 1.5% and 4.8% in
Figure 4b,c, respectively.
Figure 5c shows the distributions of the OCAF densities analyzed by using the FEM as a function of the MPA
with
= 0.6 mm,
= 8.8 mm, and
= 0.2 mm. Increasing the MPA results in a wider flat region and an almost constant fringing region in the OCAF density; thus, the leakage coefficient shows little variation, and it is assumed to be constant in this study.
Figure 5d compares the distributions of OCAF densities with MPA = 26.2˚ and 42.2˚, as analyzed by the FEM and MEC methods in which
=
=
= 1.0, and
= 0.845 on the surface of the PM, respectively. As can be seen, the differences between the FEM and the MEC results at the rising-edge (A) and the falling-edge (B) are also similar to those in
Figure 5b. The maximum errors of the peak and average OCAF densities between the FEM and MEC method are 1.2% and 4.1%, respectively.
2.3. Tolerance Sensitivity Analysis Using Partial Derivative Method
By performing the tolerance sensitivity analysis before carrying out the robust optimal design, we can efficiently investigate the effects of design variables on a response Y, so that it helps us save the design cost and time. In this paper, the partial derivative method is used to analyze effects of design variables on the OCAF.
In general, the sensitivity using the partial derivative method is defined in Equation (8):
Here, y is a response and x is a design variable. Equation (9) shows that a smaller magnitude of the sensitivity results in less variation of the response y against a variable x.
Assuming that all variables are independent on the
, the sensitivity of the OCAF with respect to the airgap length is expressed as follows:
From Equations (8) and (9), some variables such as , , , and can be deployed into more detail design variables if necessary. In this paper, the three highly significant design variables, i.e., the airgap length, MT, MPA on the OCAF and its variation are investigated in detail.
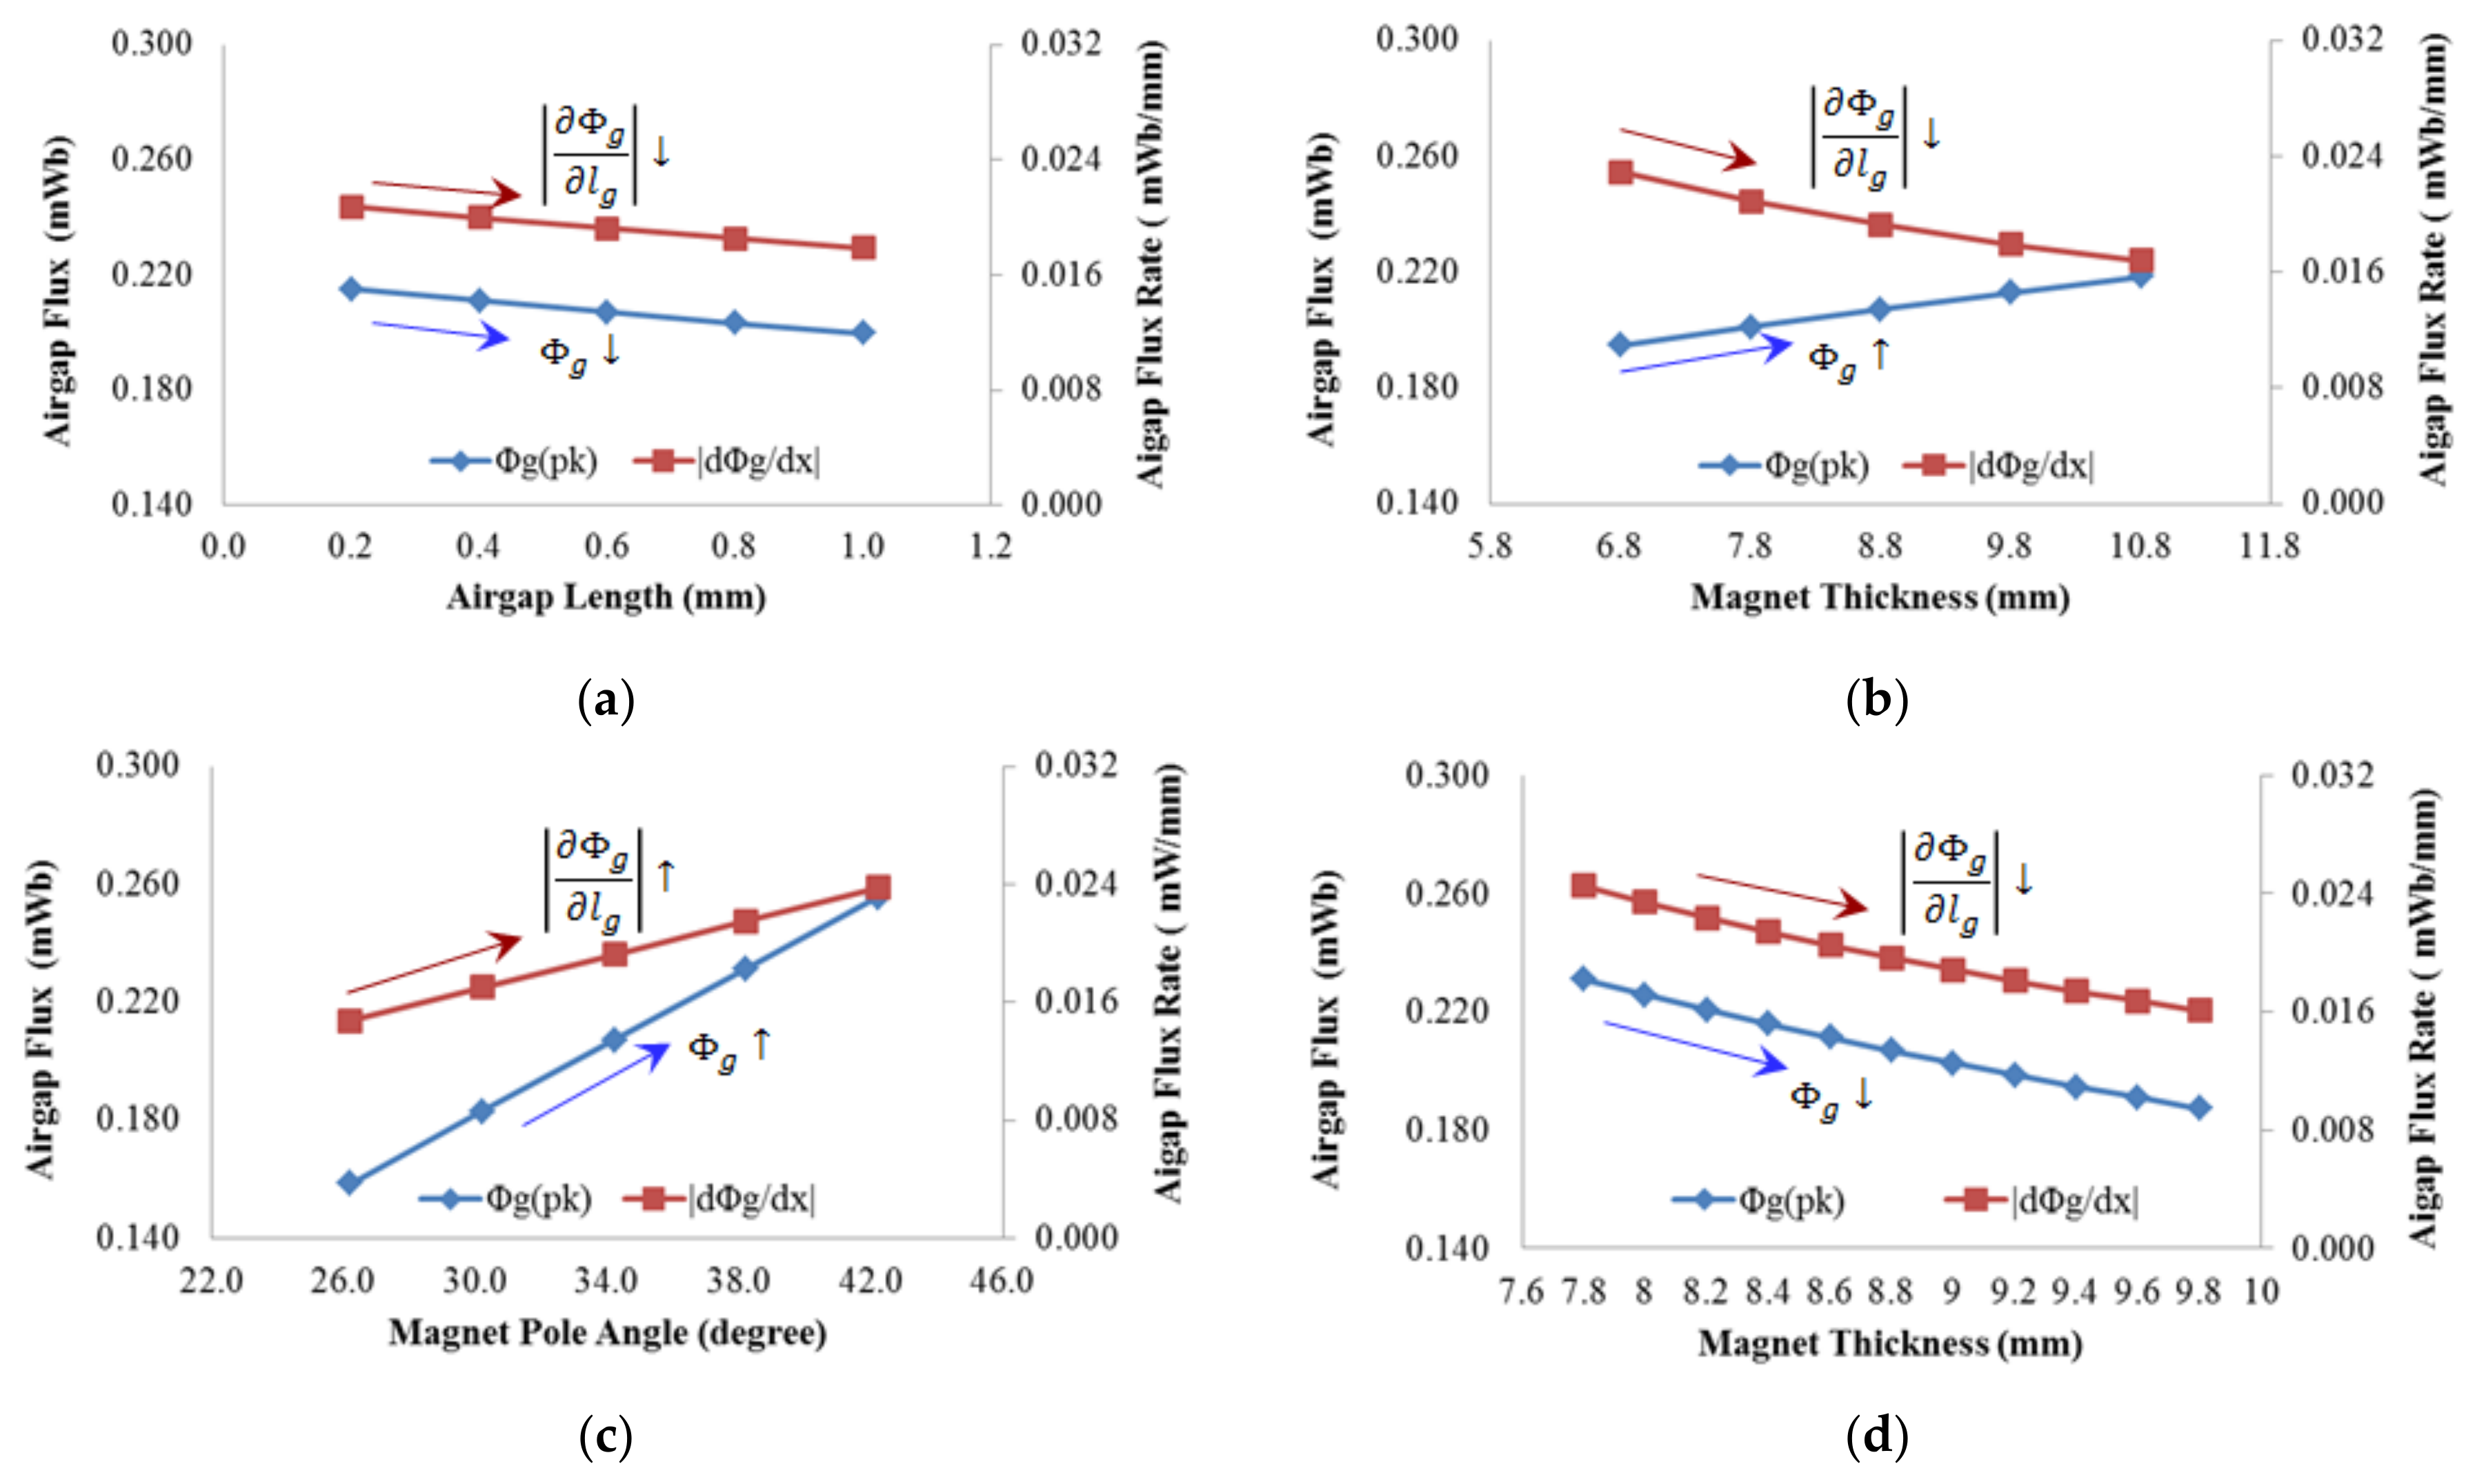
Figure 6 shows the airgap fluxes and their sensitivities according to the airgap length, MT, MPA, and the same magnet volume condition.
As the airgap length increases, both the OCAF and its sensitivity decrease, as shown in
Figure 6a. Increase of the magnet length results in an increased OCAF and a decreased sensitivity, as shown in
Figure 6b. As shown in
Figure 6c, both the OCAF and its sensitivity increase as the MPA increases.
A favorable design increases the OCAF and decreases its sensitivity; thus, increasing the MT is the simplest way to achieve these two goals simultaneously if the motor cost is not considered.
To take cost of magnet into account, the relation between
and MPA
, related to the magnet volume of the SPM motor, can be expressed as shown below:
Here,
is the volume of the PMs and
is the inside radius of PMs.
Figure 6d shows the OCAF and its sensitivity with respect to the MT, with the same magnet volume satisfying Equation (10), whose results are similar to that in
Figure 6a and different from that in
Figure 6b. Thus, we should optimize the magnet volume considering trade-off between performance, i.e., mean and standard deviation, and cost. From the results of the analysis, it is known that increasing the MT is effective for both increasing the mean of the OCAF and reducing its variation
3. Robust Optimal Design of the OCAF Using Hybrid Response Surface Method
The objective of the (deterministic) optimal design is to maximally improve mean value of a response Y and, on the other hand, the robust design is to maximize robustness or to minimize its variation, e.g., standard deviation in the quality control.
The Taguchi robust design method has been widely used for improving robustness of the target response by considering uncontrollable noise factors such as manufacturing tolerances, temperature variation, etc. [
13,
14,
16]. Taguchi robust design determines the robustness by using the signal-to-noise ratio (SNR) which is the robustness index expressed by the mean and standard deviation of the response.
However, SNR seems to have some demerits for the robust optimal design; it does not directly provide us with both the regression equation for investigating functional relationship between design variables and a response and the POF which is the ultimate goal index in the quality control.
In order to compensate for the demerits of SNR, this paper presents the H-RSM which is the hybrid of response surface method (RSM) and Taguchi robust design and directly finds the optimal point in terms of Z-value instead of SNR by using the regression equation because the target POF can be directly estimated by its corresponding Z-value [
1].
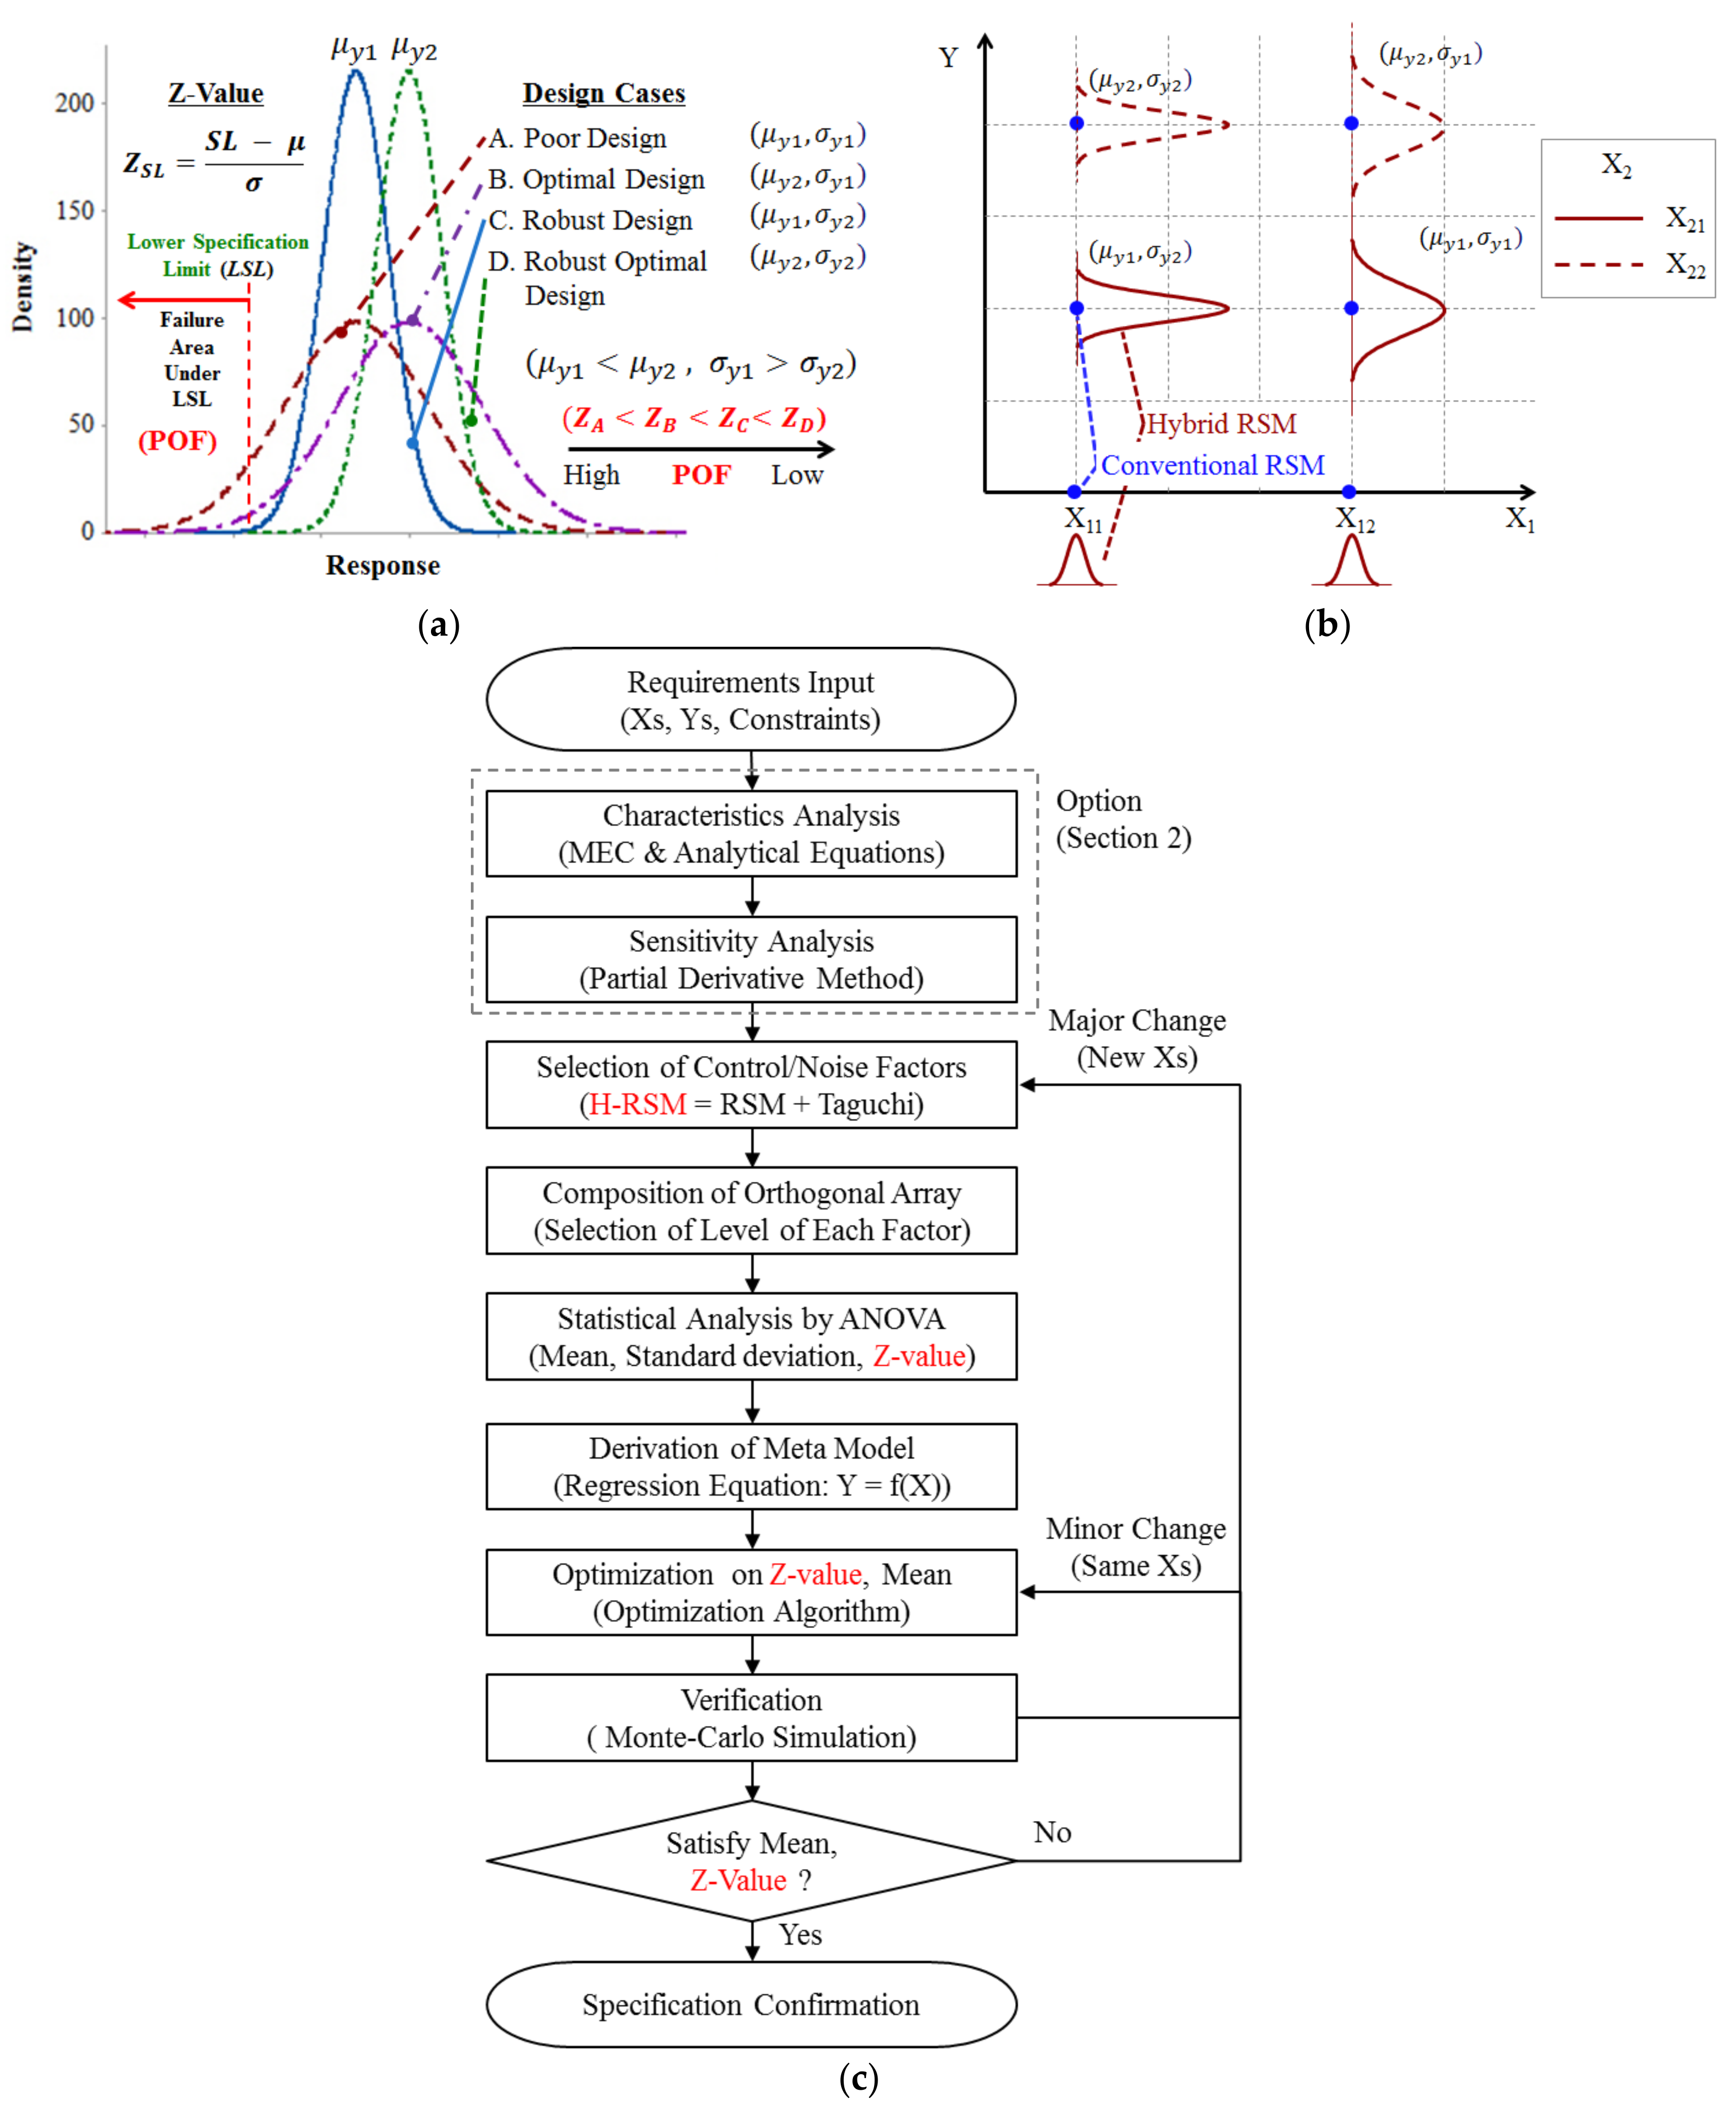
Table 3 shows some important characteristics of the Z-value and SNR.
Figure 7a shows the distributions of the responses according to means and standard deviations or Z-values, where SL is the specification limit and there are two SLs i.e., the lower SL (LSL) and the upper SL (USL). In
Figure 7a, the LSL is used for the Z-value. It can be said that the robust optimal design has been successfully performed when Z-value is larger than 6.0 in the six-sigma process [
1].
Figure 7b shows the difference between the conventional RSM and H-RSM, in which the H-RSM considers the variation of design variables and response caused by those of uncontrollable noise factors.
Figure 7c shows a flow chart of the robust optimal design procedure including the H-RSM used in this paper. To optimize the response considering the variation of the OCAF caused by those of the airgap lengths, the H-RSM uses the similar optimization procedure with that of the conventional RSM [
34] except for using the orthogonal array composed of control and noise factors used in the Taguchi robust design and using the statistic values of the response instead of the response itself; the statistic values are mean, standard deviation, and Z-value.
In addition, the H-RSM directly finds the optimal point for achieving the six-sigma level of Z-value which is inversely proportional and in one-to-one correspondence to the POF, thus, it is more valid than SNR for estimating POF. Referring to
Figure 7c, the following subsection provides a detailed description of the robust optimal design procedure.
3.1. Robust Optimal Design Using the Hybrid Response Surface Method and FEM
In the previous section, we used MEC and its analytical equation of the OCAF for studying the trends of the OCAF according to the design variables. For the robust optimal design, we use FEM modeled by the slotted stator core to consider slots and saturation effects. Let us carry out the design procedure referring to
Figure 7c.
First, the objectives and constraint conditions of the H-RSM are described below:
Here, the distribution of the airgap length satisfies the normal distribution conditions, i.e., ~ N().
Second,
Table 4 shows the control and noise factors on the OCAF used in the H-RSM, in which the controllable design factors are the MT and MPA and the airgap length is chosen as a noise factor, since it is the interesting and significant manufacturing tolerances on the OCAF.
Third, the H-RSM in this paper uses the orthogonal array in
Table 5 and each combination performs Equation (11) trials same as the number of variations of the airgap length. The effects of the additional airgaps are assumed to be included in that of the airgap as was known in Equations (6) and (9).
Table 5 shows a resultant orthogonal array structure for the H-RSM using data in
Table 4.
Fourth, the regression equations of the statistic values of the OCAF are derived from the analysis of the response surface method as below:
In the above equations, there are no quadratic terms because we used two levels of the MT and MPA as can be seen in
Table 5; we should use three levels of a factor to include the quadratic terms of the factor. However, we think that the quadratic terms of MT and MPA have ignorable effect on the OCAF as can be seen in
Figure 6. In addition, the three levels of a factor increase the number of cases to analyze than the two levels exponentially. Thus, we did not consider the quadratic terms in this paper. Next, the analyses using the regression equations are performed as follows.
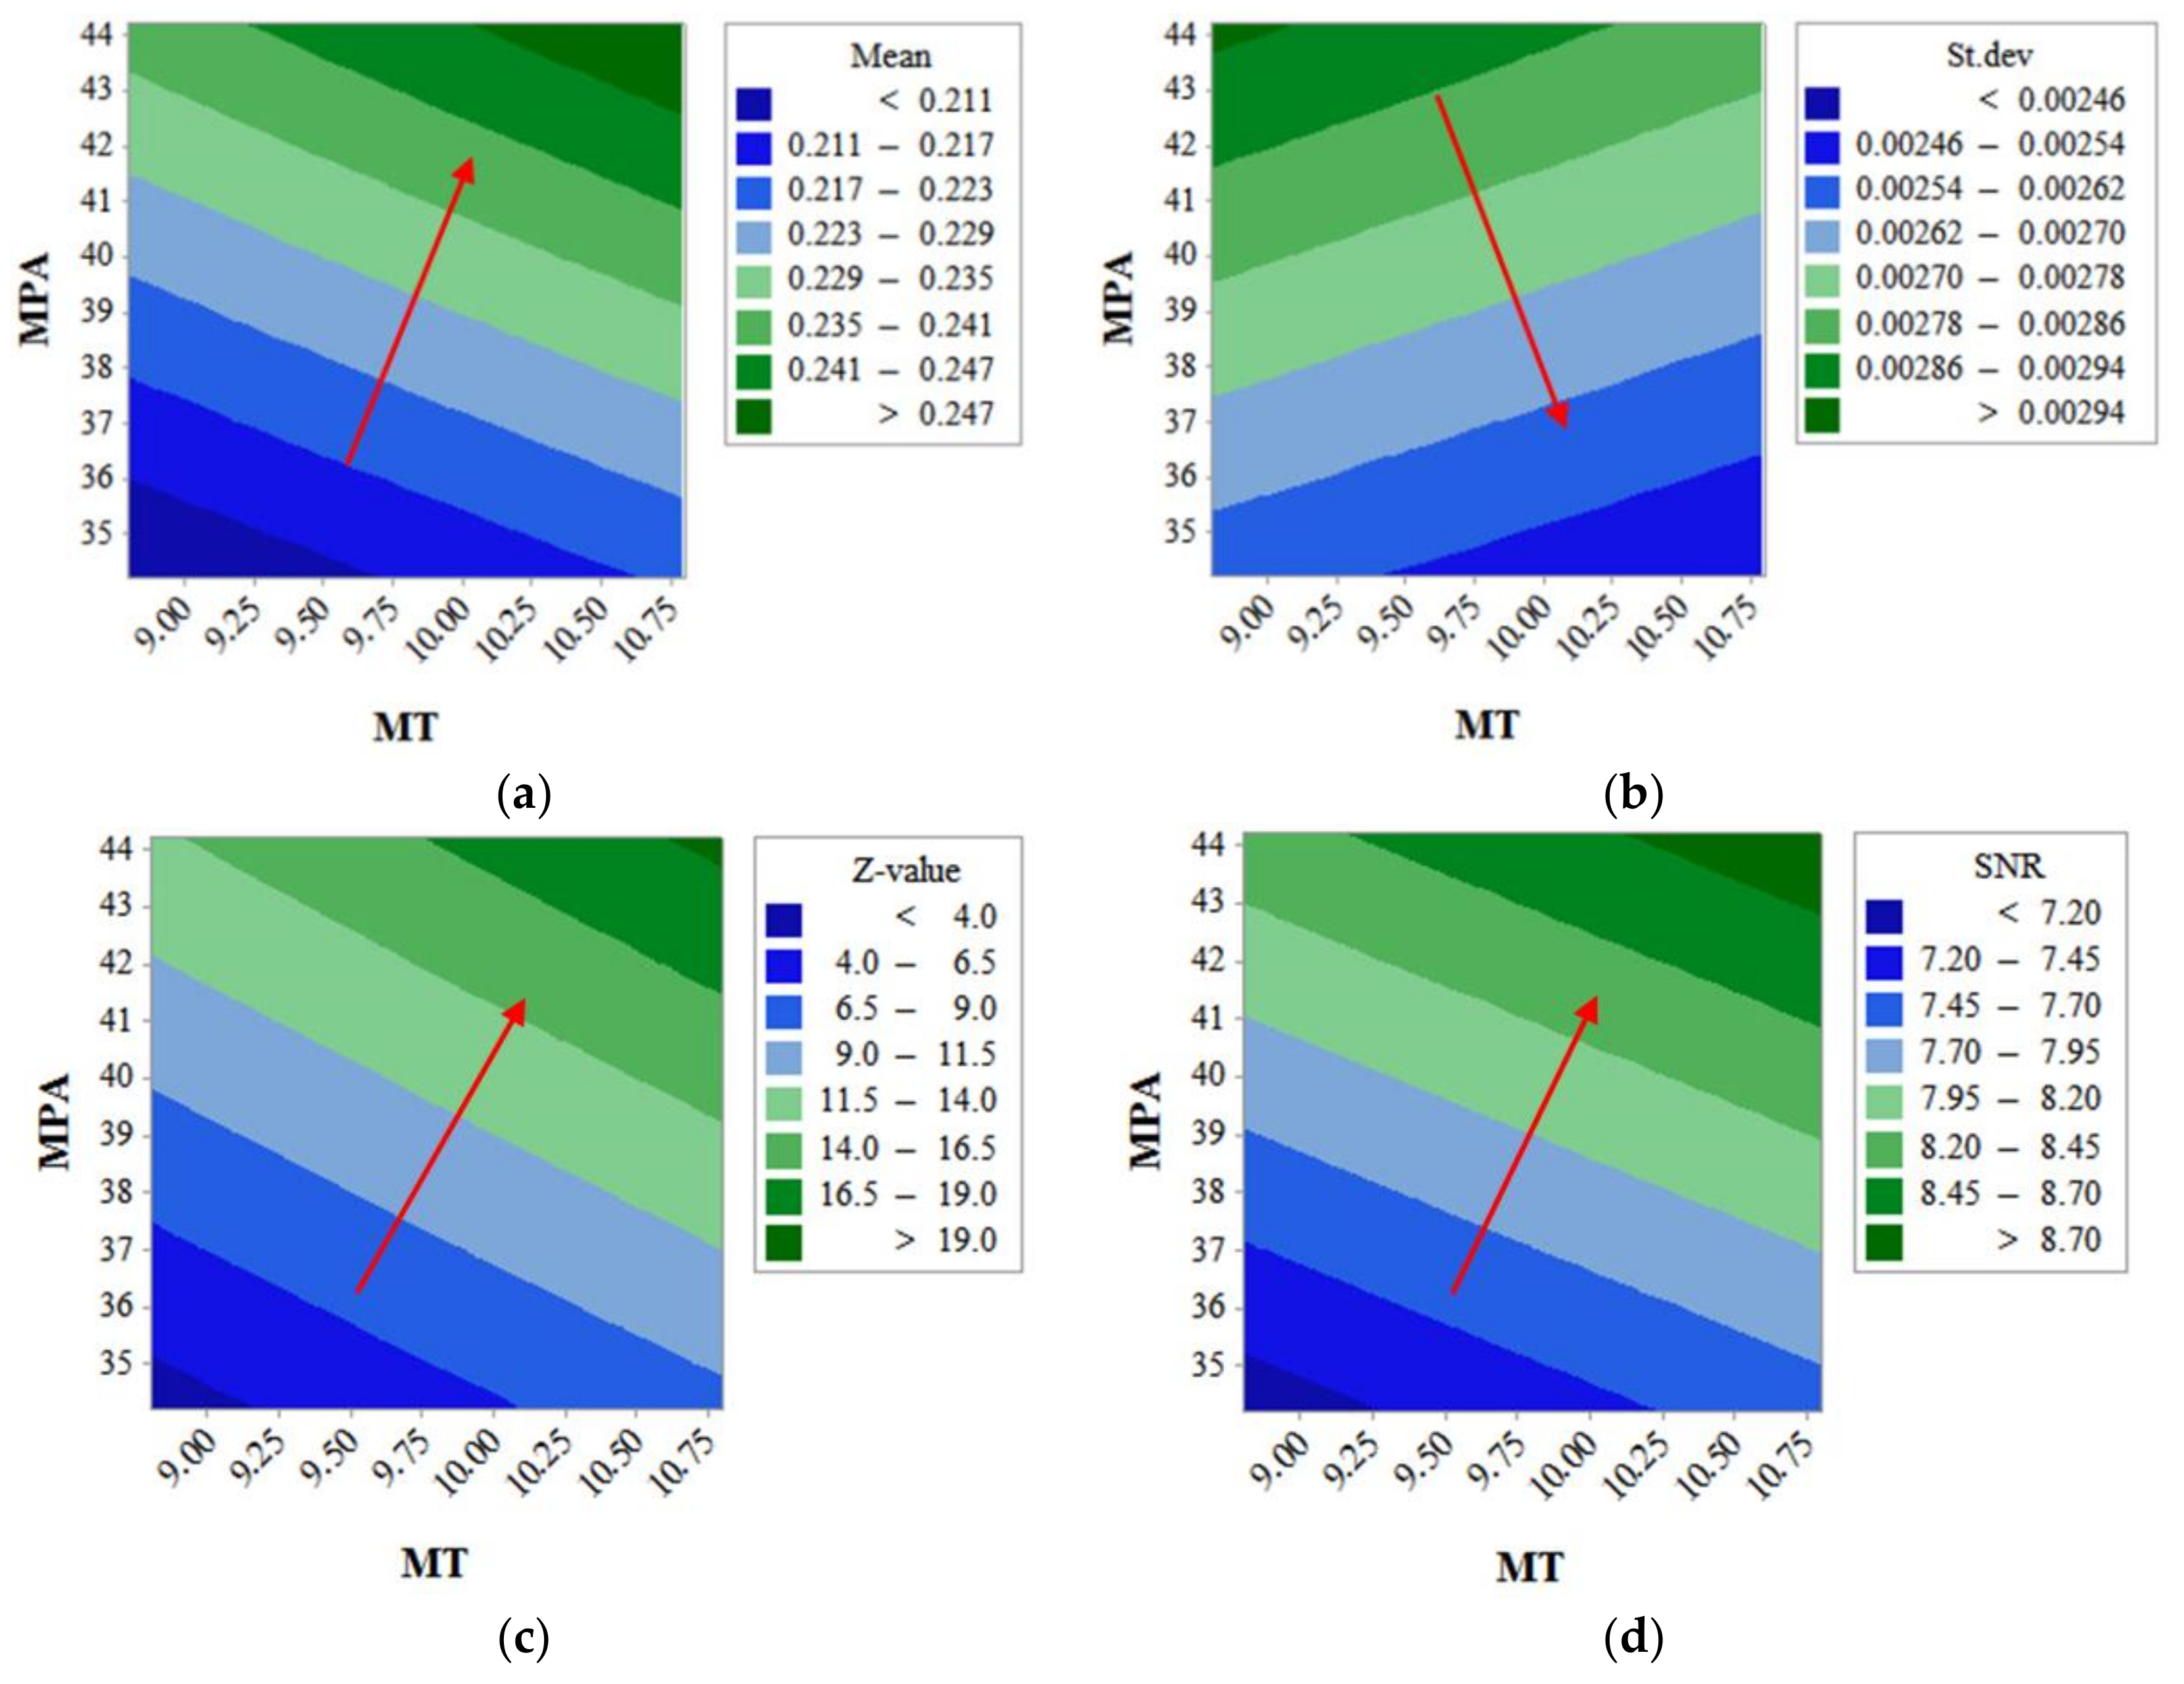
Figure 8 shows the contour plots of the OCAF analyzed by using the data in
Table 4. It is confirmed that the patterns of the mean and the sensitivity (which is proportional to the standard deviation) are similar to those obtained from the tolerance sensitivity analysis in
Section 3.1; increased MT results in a smaller sensitivity as well as a higher mean of the OCAF, so the robustness against variations of the airgap length can be improved.
The Z-value in
Figure 8c and the SNR in
Figure 8d are proportional to both the MT and MPA; investigating the convertibility between the Z-value and the SNR for estimating POF, it seems to be overall similar, but, not exactly the same. Thus, we should carefully use the SNR for reducing POF and it can be more valid and easy to use the Z-value rather than the SNR directly.
Lastly, the optimization is carried out using the regression equations to satisfy all objectives and constraints described in Equation (11).
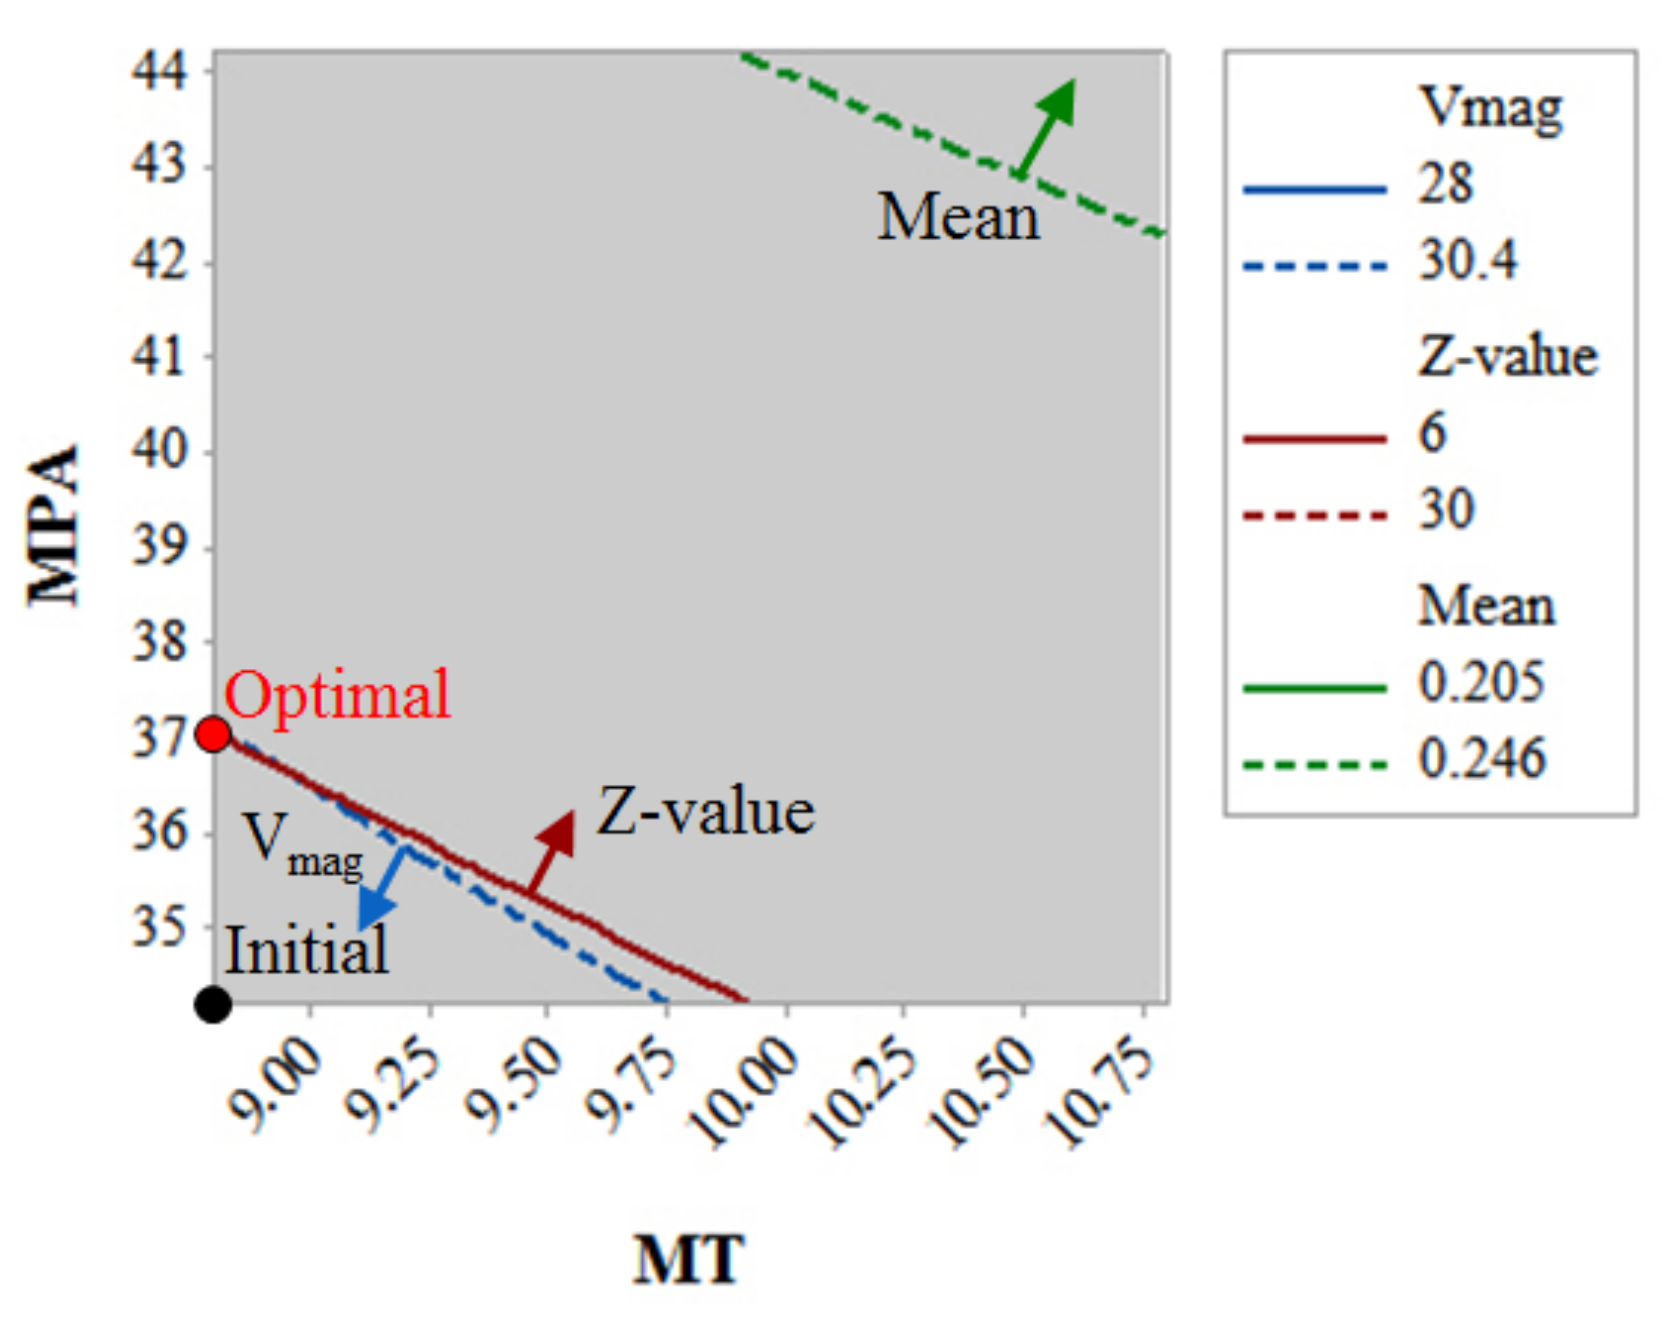
Figure 9 shows the optimization result using the overlaid contour plot to find the optimal point satisfying Equation (11), in which the initial point moved to the optimal point from MPA = 34.2° to 37° with the same MT,
= 9.0 mm including
= 0.2 mm although increasing MT and MPA show an increase and decrease in the variation of the OCAF, respectively. This is due to the fact that increasing MPA is easier and cost-effective than increasing MT for a higher Z-value.
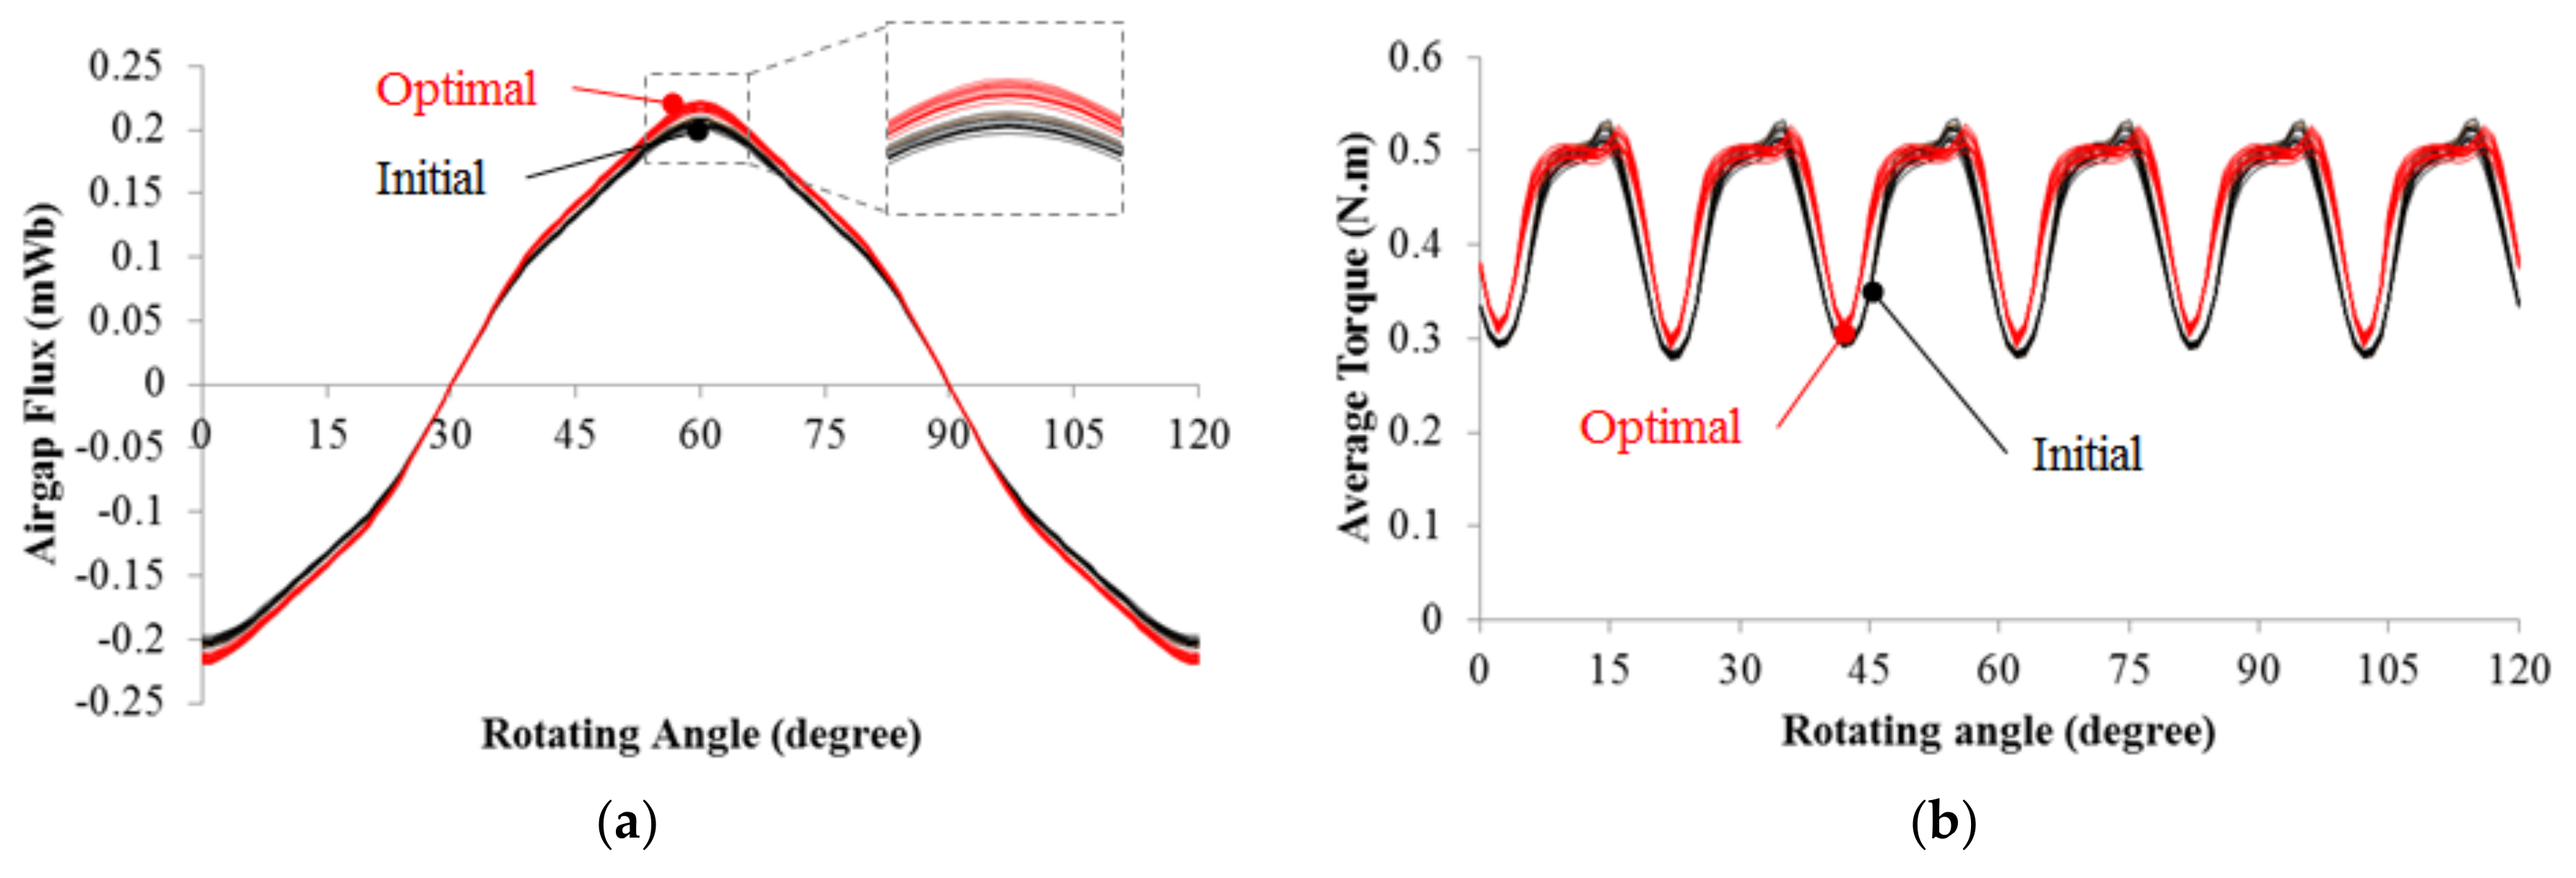
Figure 10a shows the waveforms of the airgap fluxes of the initial model and the optimal one and
Figure 10b shows the waveforms of torques of the two models. It can be observed that the change is large as the absolute value increases.
3.2. Verification of the Results Using the Monte-Carlo Simulation and FEM
In this section, the results of the tolerance sensitivity analysis obtained from the MEC in the previous section are verified by using the Monte-Carlo Simulation [
1] and FEM.
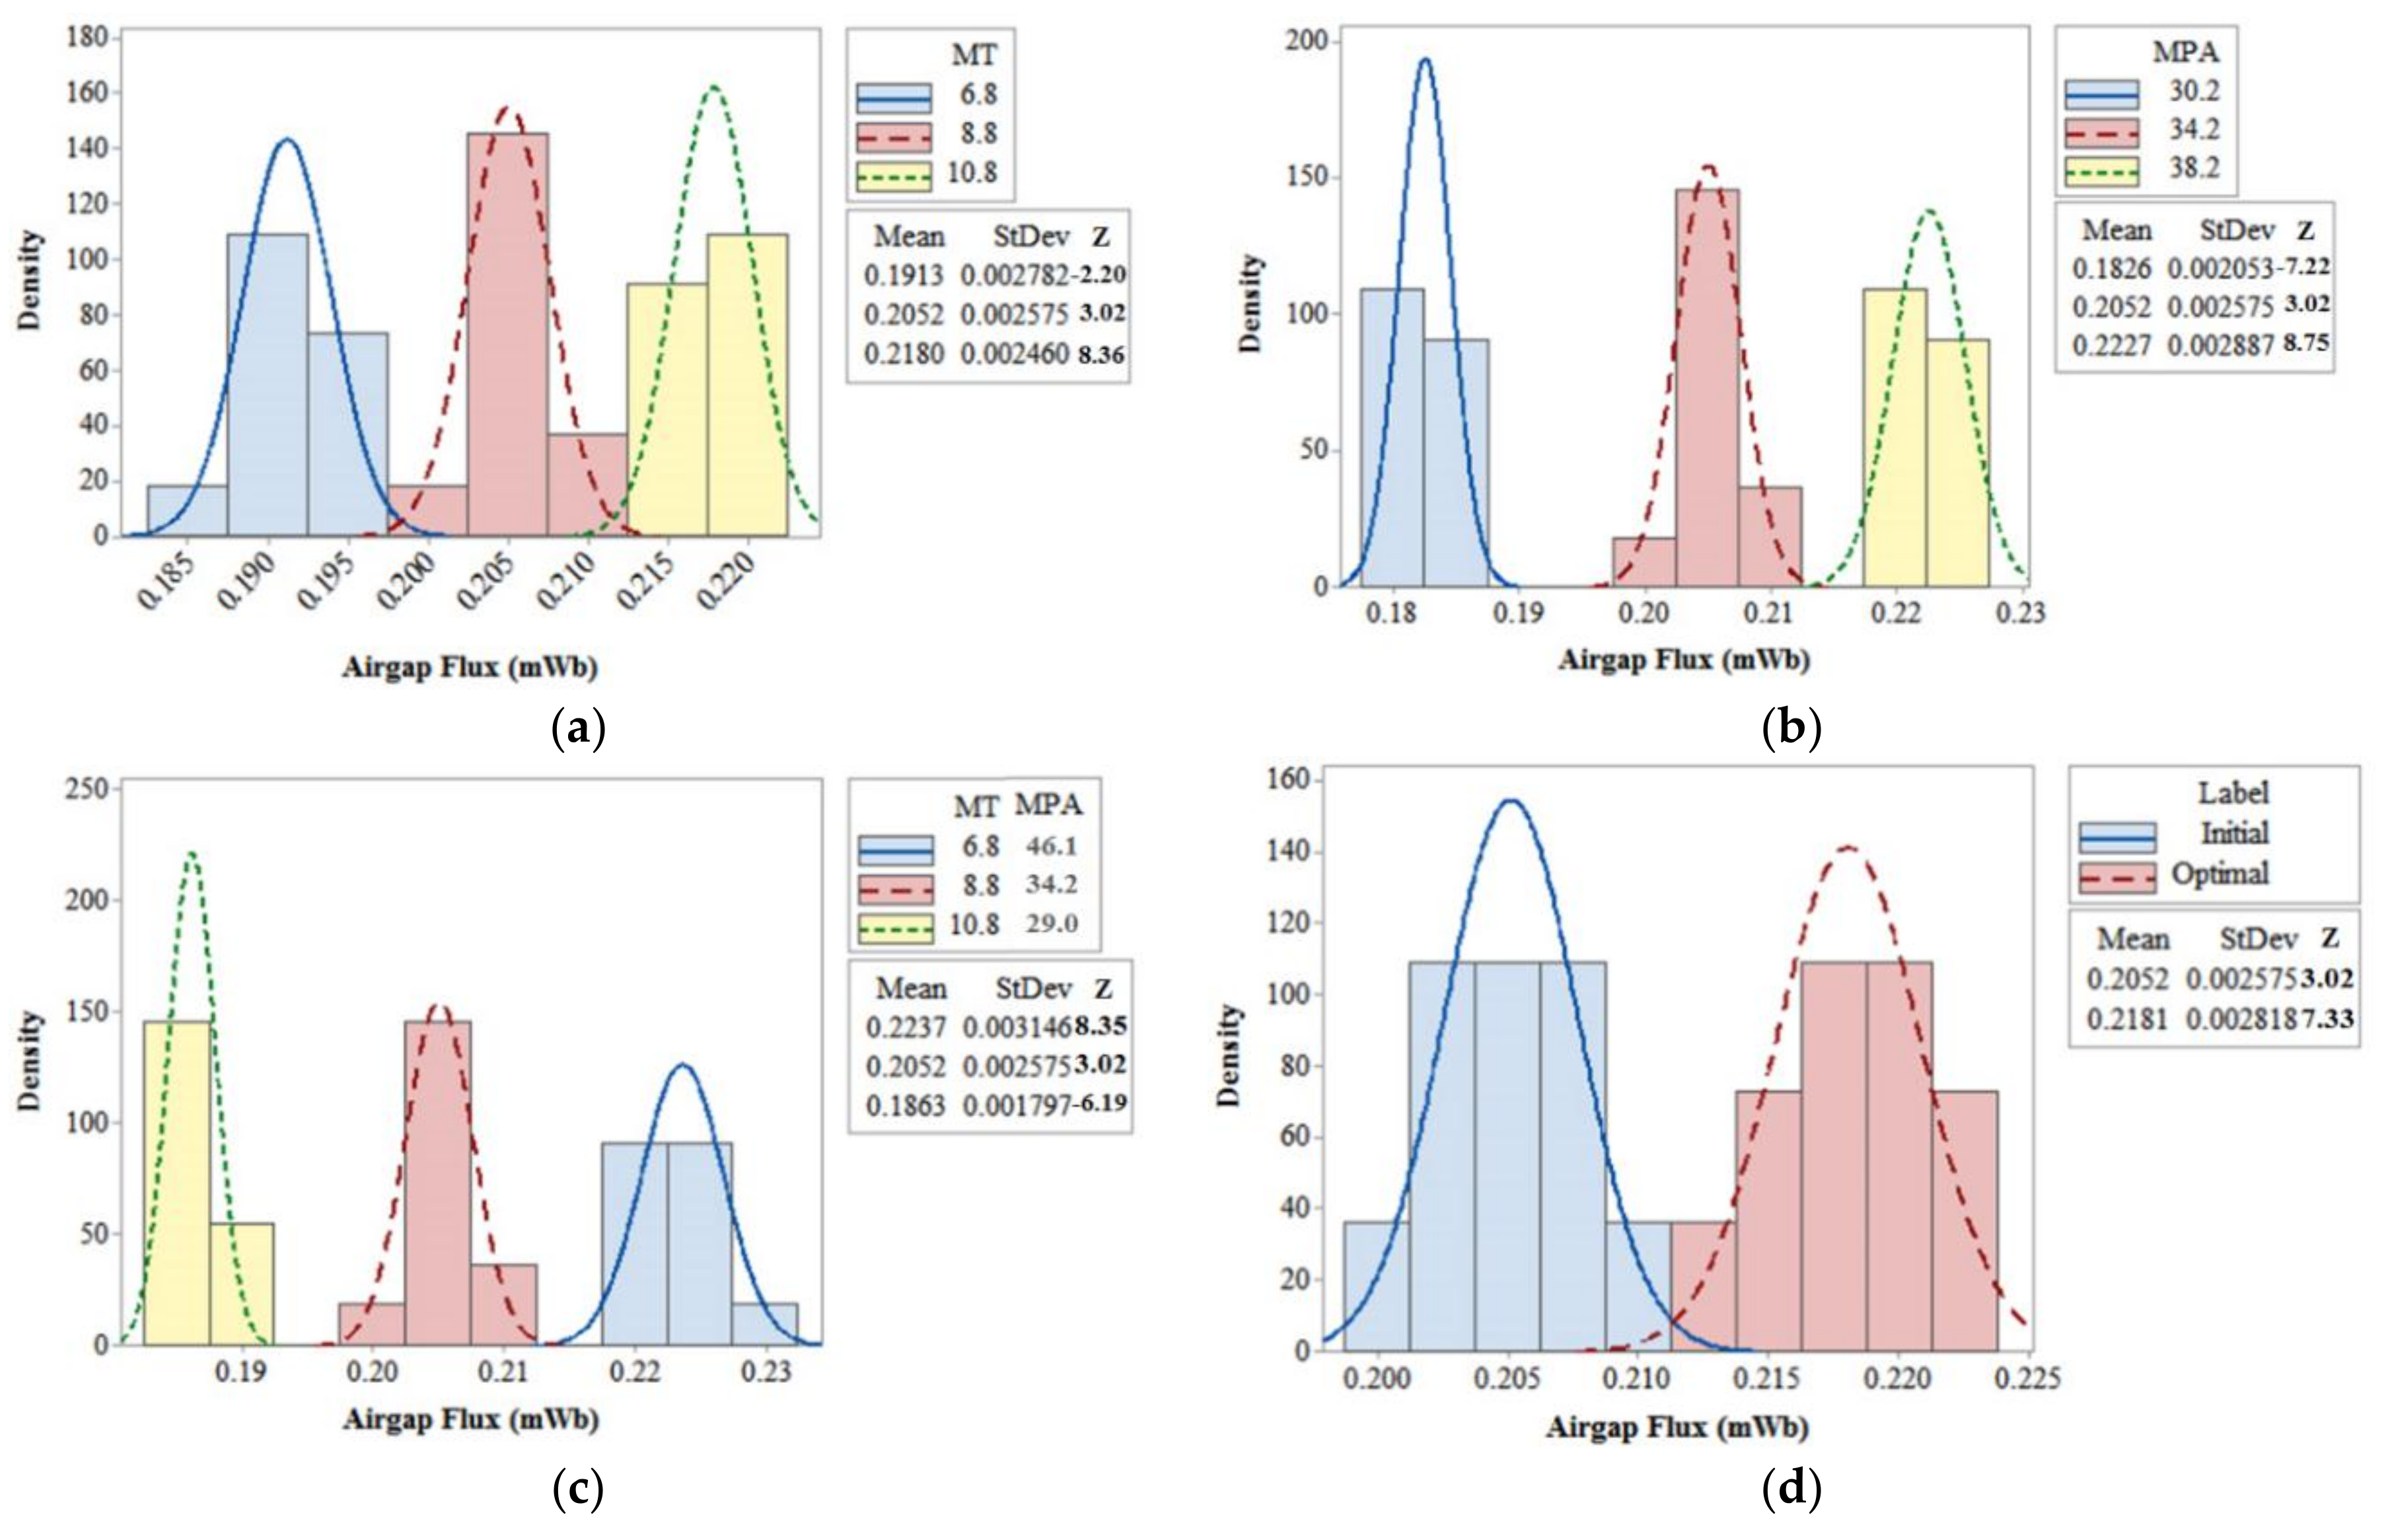
Figure 11a shows the distributions of airgap fluxes according to the MT:
= 6.8, 8.8 and 10.8 mm at
= 34.2°. It can be seen that the pattern of the airgap fluxes with respect to the magnet thicknesses coincides with that of
Figure 6b, i.e., increased MT results in a higher
and a lower
.
Figure 11b shows distributions of the airgap fluxes according to the MPA:
= 32.2°, 34.2° and 38.2° at the same other conditions. The pattern of the airgap fluxes with the MPA is also similar to that of
Figure 6c; an increase in the MPA results in a higher
and
.
Figure 11c shows distributions of airgap fluxes according to the combination of magnet thicknesses and MPAs with the same PM volume and other conditions. It can be seen that the pattern of airgap fluxes with the same magnet volume coincides with that of
Figure 6d; increasing MT and decreasing MPA result in both a lower
and
.
Figure 11d shows the distributions of airgap fluxes of the initial and optimal model. All of the results coincide with those of the tolerance sensitivity analysis and H-RSM.
Table 6 shows the comparison of the optimal model to the initial model shown in
Figure 8a. As can be seen, it can be observed that the Z value of the optimal model increased more than twice as much as the initial model.
4. Conclusions
Herein, the OCAF and its variation caused by the variations in the airgap length were investigated as a function of the main design variables such as airgap length, MT, and MPA. This was done by using the MEC and its induced equations, taking into consideration the additional airgap between the magnet and rotor back yoke.
The tolerance sensitivity analysis was carried out by the partial derivative method, from which we investigated the functional relationships between the design variables and the OCAF. The H-RSM, which is the hybrid of the RSM and Taguchi robust design and uses the Z-value instead of SNR as the robustness index, was suggested for the robust optimal design. It was shown that the Z-value is more valid index than SNR for estimating POF because SNR is not always proportional to POF, i.e., not always in inverse proportional to the Z-value.
Finally, the results of the tolerance sensitivity analysis performed by the MEC and robust optimal design performed by H-RSM were verified by the FEM, and the results showed good agreement.
From the analysis results, it was confirmed that increasing the MT results in reducing variations of the OCAF due to those of the airgap length as well as increasing the mean of the OCAF. On the other hand, increasing the MPA results in increasing variations of the OCAF due to those of the airgap length as well as increasing the mean of the OCAF.
Therefore, motor designers should determine the dimensions of the MT and MPA considering the variance as well as the mean value of the OCAF to achieve the target probability of failure.
In their next study, the authors will study the improved robust design method for various motor types using MEC considering more practical issues or noise factors, e.g., the magnetic saturation effect, armature reaction effect, and so on.


