Article

Influencing Factors and Decoupling Elasticity of China’s Transportation Carbon Emissions

1
School of Statistics, Dongbei University of Finance and Economics, Dalian 116025, China
2
Postdoctoral Research Station, Dongbei University of Finance and Economics, Dalian 116025, China
3
School of Economics, Qingdao University, Qingdao 266071, China
*
Author to whom correspondence should be addressed.
Energies 2018, 11(5), 1157; https://doi.org/10.3390/en11051157
Submission received: 8 April 2018 / Revised: 30 April 2018 / Accepted: 2 May 2018 / Published: 5 May 2018
(This article belongs to the Special Issue Modeling and Simulation of Carbon Emission Related Issues)

Abstract

:
Transportation is an important source of carbon emissions in China. Reduction in carbon emissions in the transportation sector plays a key role in the success of China’s energy conservation and emissions reduction. This paper, for the first time, analyzes the drivers of carbon emissions in China’s transportation sector from 2000 to 2015 using the Generalized Divisia Index Method (GDIM). Based on this analysis, we use the improved Tapio model to estimate the decoupling elasticity between the development of China’s transportation industry and carbon emissions. The results show that: (1) the added value of transportation, energy consumption and per capita carbon emissions in transportation have always been major contributors to China’s carbon emissions from transportation. Energy carbon emission intensity is a key factor in reducing carbon emissions in transportation. The carbon intensity of the added value and the energy intensity have a continuous effect on carbon emissions in transportation; (2) compared with the increasing factors, the decreasing factors have a limited effect on inhibiting the increase in carbon emissions in China’s transportation industry; (3) compared with the total carbon emissions decoupling state, the per capita decoupling state can more accurately reflect the relationship between transportation and carbon emissions in China. The state of decoupling between the development of the transportation industry and carbon emissions in China is relatively poor, with a worsening trend after a short period of improvement; (4) the decoupling of transportation and carbon emissions has made energy-saving elasticity more important than the per capita emissions reduction elasticity effect. Based on the conclusions of this study, this paper puts forward some policy suggestions for reducing carbon emissions in the transportation industry.

1. Introduction

Since the beginning of this century, the concentration of greenhouse gases in the atmosphere, represented by carbon dioxide, has been steadily increasing, leading to global warming and more frequent natural disasters. Climate change has become one of the greatest challenges to mankind in the 21st century. Currently, all countries in the world are constantly seeking solutions and striving to achieve the goal of lower carbon emissions: the United Nations (UN) has held many international negotiations on climate change and formulated the “United Nations Framework Convention on Climate Change” [1] and the “Kyoto Protocol” [2]; in 2016, leaders from more than 170 countries jointly signed the Paris Agreement [3] focusing on climate change issues at the UN Headquarters. As the world’s largest developing country, with its rapid economic development, China’s carbon emissions remain high. China’s carbon emissions account for about one-third of the world’s total carbon emissions and rank first in the world in carbon emissions [4]. The research data of the Global Carbon Project [5], an international carbon emission research institution, shows that in 2015, China’s carbon emissions accounted for 28.65% of the world’s total carbon emissions, far exceeding the second highest in the United States (14.93%) and the third largest in the European Union (9.68%). To this end, the Chinese government has actively shouldered its responsibility and obligation to reduce emissions, and successively formulated numerous energy-saving and emission reduction policies [6,7,8,9].
The transportation industry is an indispensable key link in daily life and social production and a basic industry for economic development in China. Along with the increasing demand for transportation in China, the transportation industry, while promoting economic growth and facilitating human life, has also caused a great deal of energy consumption and carbon emissions. The energy consumption of China’s transportation industry increased from 114,470,000 tons of coal equivalent in 2000 to 383,180,000 tons of coal equivalent in 2015. At the same time, China’s transportation sector accounts for approximately one-quarter of the carbon emissions, second only to the third largest carbon sector in the energy and industrial sectors [10]. Moreover, with the continuous progress of urbanization in China and the increasing number of motor vehicles, carbon emissions in the transportation industry are still on the rise. At present, China’s transportation industry is at a critical period of rapid development and transition. By accurately analyzing the drivers of changes in carbon emissions in the transportation sector, the relationship between transportation development and carbon emissions can be explored. This is of great and far-reaching practical significance for the early realization of low-carbon transportation.
Factor decomposition and decoupling are important parts of research on carbon emission. There are deficiencies in the methods used to decompose and decouple the carbon emission in the transportation industry, and indicators in the decoupling—causal chain need to be improved. The deficiencies of the existing research are described in detail in Section 2.3. Therefore, this paper innovates the research methods of carbon emission factor decomposing and the selection of decoupling—causal chain indicators in transportation industry, and provides a new research perspective for accurately analyzing the relationship between the development of transportation industry and carbon emissions. Specific innovations and improvements in this article are detailed in Section 2.3.
The remainder of this article is arranged as follows: Section 2 presents a literature review; Section 3 introduces the measurement of carbon emissions; Section 4 builds the index decomposition model of the historical evolution of transportation carbon emissions and the decoupling model of carbon emissions from transportation development; Section 5 analyzes the driving factors and the decoupling situation; Section 6 presents the discussion and analysis and finally Section 7 presents the conclusions and suggestions.

2. Literature Review

This paper studies the influencing factors and decoupling elasticity of China’s transportation carbon emissions. The factor decomposition is used to analyze the specific driving effect of factors that have impacts on carbon emissions. The decoupling is used to explore the correlation between the development of the transportation industry and carbon emissions. Therefore, based on the purpose of this paper, the literature review contains two aspects, one is the influencing factors of carbon emissions, and the other is the decoupling of carbon emissions and economic development.

2.1. Literature Review of the Influencing Factors of Carbon Emissions

An analysis of influencing factors is an important part of the research on carbon emissions in the transportation industry. Wang et al. [11] investigated the influence mechanism of people’s activity travel scheduling on transportation energy consumption and emissions on holidays in China. Hao et al. [12] comprehensively measured energy efficiency in China’s transportation sector and identifies the opportunities for further energy efficiency improvements. Wei et al. [13] discussed carbon dioxide abatement for 29 provinces in China, and concluded that industry composition, energy mix, openness degree affected carbon dioxide abatement potential. Lugauer et al. [14] estimated the impact of age distribution on carbon emissions by exploiting demographic variation in a panel of 46 countries. Yang et al. [15] analyzed the allocation of carbon intensity reduction target by 2020 among industrial sectors in China. The factor decomposition method is gradually being used in research on carbon emissions addressing an impact mechanism that was originally applied primarily to examine energy consumption [16]. Factor decomposition of changes in carbon emissions includes structural decomposition and index decomposition. The structural decomposition method requires an input-output model as its basis so it’s not convenient to analyze in practice. Compared with the structural decomposition method, the index decomposition method is widely used in environmental economics because it is suitable for decomposing time series data and models with fewer factors [16].
In general, the index decomposition methods mainly include the Laspeyres decomposition method, Arithmetic Mean Divisia Index (AMDI) method and Logarithmic Mean Divisia (LMDI) method. Sun [17] proposed a complete decomposition model, also known as the improved Laspeyres decomposition method, and used it to analyze the factor for the change of energy intensity and energy consumption in the world. Rüstemoğlu et al. [18] applied the refined Laspeyres index model to analyze the impact of four main factors, such as economic activity, employment, energy intensity, and carbon intensity in carbon emissions changes in Brazil and Russia. Hatzigeorgiou et al. [19] dealt with the decomposition analysis of energy-related carbon emissions in Greece using the AMDI technique, and concluded that the income effect was the most important factor contributing to the increase of carbon emissions. Although the Laspeyres decomposition method has been improved to solve the original residual problem well, the calculation process becomes very complicated when the influencing factor of the decomposition is more than 3 [20]. AMDI has residual problems and does not apply to cases in which there is a value of 0 in the data. Compared with the above two exponential decomposition methods, LMDI solves their existing problems well, and the model is simple. Therefore, it has been widely used in academia to study the influencing factors of carbon emissions in transportation and other fields. Gambhir et al. [21] used the LMDI decomposition method to determine the main factors of China’s road transportation sector carbon emissions and set different scenarios to estimate changes in costs and carbon emissions. M’raihi et al. [22] investigated the effects of the main driving factors of carbon emissions changes from road freight transportation in Tunisia using decomposition analysis, mainly the LMDI, and the results showed that economic growth and average petroleum emissions were the main driving factors.
Shi et al. [23] took four Chinese megacities (Beijing, Tianjin, Shanghai, and Chongqing) as case studies, and decomposed per capita urban carbon emissions into manufacturing, transportation and construction sectors using LMDI method. Du et al. [24] used LMDI model to analyze the change of carbon emissions in China’s metallurgy industry, and the empirical results showed that main factors were labor productivity, energy intensity and industry size. Ma et al. [25] built an LMDI method with a higher technical resolution and applied it to decompose the growth of energy-related carbon emissions in China. Wang et al. [26] used LMDI method based on the extended Kaya identity to explore the main driving factors for energy-related carbon emissions in Guangdong province annually. De Freitas et al. [27] conducted LMDI decomposition of carbon emissions change from energy consumption in Brazil. The results demonstrated that economic activity and demographic pressure were the leading forces explaining emission increase. On the other hand, carbon intensity reductions and diversification of energy mix towards cleaner sources were the main factors contributing to emission mitigation. Kharbach et al. [28] used LMDI to analyze the drivers for carbon emissions’ increase in Moroccan road transportation sector, and found that population growth and increase in vehicles ownership were the main causes. Zhu et al. [29] applied LMDI decomposition method combined with Tapio decoupling model to study the driving factors and decoupling effects of the transportation sector’s carbon emissions in the Beijing-Tianjin-Hebei area, China. Zhang et al. [30] conducted an empirical analysis of urban traffic energy consumption in Beijing, Shanghai and Guangzhou using the LMDI method. The main factors affecting the energy consumption of Beijing’s passenger traffic are the number of daily trips per capita followed by the proportion of motorized trips. The main factor in Shanghai is the urban population, followed by the average single trip distance. The main factor affecting Guangzhou is the urban population, followed by the number of daily trips per capita. Shen et al. [10] used the LMDI method to study the drivers of carbon emissions in China’s transportation sector and found that the main positive drivers were urbanization, the tertiary industry’s share of the total secondary and tertiary industries, and the total population. The main negative drivers are the traffic volume per unit of GDP, the energy consumption per unit of traffic volume, the total secondary and tertiary industries per urban resident population, and the contribution of tertiary industry to GDP. Zhou et al. [31] carried out LMDI decomposition of transportation carbon emissions and considered that economic growth is the most influential factor. Traffic energy conservation is the second most important factor contributing to the reduction of transportation carbon emissions, but the driving effect is not stable enough. However, the effect of traffic emissions reduction is the most limited.
With the growing academic research on index decomposition, the defects of LMDI have also gradually appeared. Vaninsky [32] noted problems that exist in index decomposition methods such as LMDI: the model cannot contain multiple relative and absolute factors simultaneously, and the result of decomposition depends on the interdependence of factors and may lead to results that conflict with economic common sense. To solve these shortcomings, Vaninsky [32] proposed a new index decomposition model, that is, Generalized Divisia Index Decomposition (GDIM). The GDIM model can simultaneously contain the impact of multiple absolute and relative variables on carbon emissions, solve the problems of other index decomposition methods, and more accurately and objectively analyze the contribution of each driving force to changes in carbon emissions. Currently, Shao Shuai et al. have used GDIM to disaggregate the historical evolution of China’s manufacturing [33] and mining [34] carbon emissions and, respectively, have reached the following conclusions: (1) the main driver of the increase in manufacturing carbon emissions is the investment scale, and the key factors in the reduction of manufacturing emissions are the output carbon intensity and the carbon intensity of investment; (2) the primary factor of the promotion of the increase in the mining carbon emissions is the scale of output with the conclusion that the carbon intensity of the output contributes the most to the mining carbon emissions reduction.

2.2. Literature Review of Carbon Emissions Decoupling

Factor decomposition of the evolution of the trend of carbon emissions can determine the impacts of various factors on carbon emission changes. The decoupling analysis is helpful to explore the relationship between economic growth and carbon emissions to provide a practical solution for the realization of low-carbon development. According to the Environmental Kuznets Curve (EKC) hypothesis, economic growth generally leads to increased environmental pressures and resource consumption. However, when effective policies and new technologies are adopted, the result may be lower environmental pressures and resource consumption in return for the same or even faster economic growth; this process is called decoupling. The decoupling of carbon emissions in the transportation industry is the idealized process of continuously weakening or even causing the disappearance of the relationship between transportation development and carbon emissions, that is, realizing the growth of the transportation industry while gradually reducing energy consumption. To date, scholars have conducted a great deal of research on the decoupling of carbon emissions from the economy.
Li et al. [35] conducted a decoupling analysis of the added value of Shanxi’s industrial sector and energy consumption and carbon emissions. They concluded that the province’s industrial GDP, energy consumption and carbon emissions showed an expansive coupling status. Yang et al. [36] used the decoupling theory to analyze the characteristics of carbon emissions and economic growth in the western region and concluded that the major factor contributing to the increase in carbon emissions is the rapid growth of the economy, while the impacts of industrial structure, energy intensity and energy structure on carbon emissions are not the same. Wu et al. [37] discussed decoupling trends in world economic growth and carbon emissions based on decoupling theories. Lin et al. [38] calculated the decoupling trend of carbon emissions from China’s heavy industry by presenting a theoretical framework for decoupling. Diakoulaki et al. [39] analyzed the decoupling relationship between industrial economic growth and carbon emissions in 14 EU countries and the efforts and achievements made by various countries. Li et al. [40] analyzed the decoupling state between the carbon emissions of the construction industry in Jiangsu Province and the province’s economic growth based on the Tapio decoupling model. Román et al. [41] used the decoupling elasticity approach to analyze the importance of energy consumption changes in relation to the GDP changes in Colombia. The results showed that current decoupling-oriented measures were steps in the right direction but efforts made to achieve decoupling energy consumption from economic growth were not at all effective. Freitas et al. [42] examined the occurrence of a decoupling between economic activity and carbon emissions from energy consumption in Brazil. Grand [43] introduced different types of decoupling models in detail and used them to analyze the decoupling of economic activities and carbon emissions in Argentina. Roinioti et al. [44] analyzed the decoupling relationship between carbon emissions and economic growth in Greece with the use of the decoupling index. The results indicated that the decoupling progress achieved was intercepted during the years of intense recession. Wang et al. [45] studied China’s industrial carbon emissions based on decoupling elasticity and the Tapio decoupling model. Hu et al. [46] used the non-competitive I-O model and the Tapio decoupling model to comprehensively analyze the decoupling relationship between the output of the product sector in China and its embodied carbon emissions under trade openness. Wan et al. [47] studied the decoupling relationship between carbon emissions and economic growth of the equipment manufacturing industry in China. As energy and the environment are facing increasingly serious forms, some domestic and foreign scholars have shifted their attention from decoupling the relationship between the total carbon emissions and economic growth to the transportation industry, a high-energy-consuming and high-emission industry, and they have researched decoupling economic growth from carbon emissions in transportation.
Tapio [48] studied the relationships among transportation volume, greenhouse gases and transportation economic growth in Europe from 1970 to 2001 by constructing a decoupling model. Gray et al. [49] studied the decoupling of traffic, carbon emissions and economic growth in Scotland. Loo et al. [50] explored the potential and the reality of decoupling transportation from economic growth in 15 major countries such as China, Russia and Canada. Zhao et al. [51] analyzed the relationship between transportation growth and carbon emissions associating the decomposition technique with the decoupling elasticity in Guangdong province, China. Using the Tapio elasticity analysis method, Liu et al. [52] explored the decoupling between transportation development and economic growth. The results show that there is a clear interaction between the economy and traffic volume, and they are mutually dependent. Zhou et al. [31] constructed causal chains by introducing intermediate variables and analyzed the decoupling relationship between economic growth and carbon emissions based on Tapio’s decoupling model from the perspectives of the decoupling elasticity of traffic emissions reduction, decoupling elasticity of traffic energy-savings and decoupling elasticity of traffic development. Table 1 summarizes representative studies on the influencing factors of carbon emissions and the decoupling from economic development.

2.3. The Deficiencies of the Existing Studies and the Innovations of this Article

Currently, scholars have laid a solid foundation for future exploration with their studies of the factor decomposition of carbon emissions in transportation and economic development and the decoupling elasticity. However, taken together, the existing research has the following deficiencies:
(1)
Decomposition methods of influencing factors of transportation carbon emissions are flawed. Most of the studies focused on index decomposition of the influencing factors of carbon emissions in the transportation sector use the Logarithmic Mean Divisia Index (LMDI) method. The method itself has some defects that cause inaccuracies in the decomposition result. Vaninsky [32] noted that there are two problems with the existing index decomposition methods, including LMDI. First, the methods decompose the carbon emissions into the product of various factors according to the Kaya identity. For example, carbon emissions are usually decomposed into the product of energy carbon emission intensity, energy intensity, GDP per capita and population, while at most one absolute factor (such as population) can be considered in the decomposition. When other absolute factors change, such as when energy consumption increases, while other factors remain unchanged, the model does not show an increase in carbon emissions; it simply reduces the energy carbon intensity and increases the energy intensity. This is contradictory. Second, due to the interdependence of various factors, when different factor decomposition models are used, the methods may lead to different decomposition results.
(2)
The choice of influencing factors of transportation carbon emissions is not comprehensive enough. In analyzing the changes that affect the carbon emissions in the transportation sector, the limitations inherent in the selected decomposition method make the factors of the study less comprehensive. Some studies have expanded the basic decomposition model in order to analyze more selected factors. Although this can increase the research factors, the selection of factors is still subject to the Kaya identity; this cannot arbitrarily select the relative factor and the absolute factor, and at most, it can only study the impact of an absolute factor [32]. This leads to typical factors, such as the energy consumption and the value added of the sector, not being taken into account, leaving the final conclusion insufficiently comprehensive.
(3)
The causal chain model of decoupling in transportation is insufficient. Existing research mainly analyzes the decoupling situation of carbon emissions from economic growth in the transportation industry by constructing a causal chain. The Tapio model divides the decoupling into eight types according to the magnitude of the decoupling elasticity. This fine division means that the calculation results of the decoupling elasticity will be classified into different categories with little accuracy. In addition, although the existing research can analyze the reasons for the decoupling of carbon emissions from the energy-saving elasticity and emissions-reducing elasticity of transportation, the total amount of carbon emissions in the model is too macroscopic and does not take into account the differences among individuals. It also makes the calculation results of the decoupling elasticity not accurate enough and cannot respond sensitively to changes in the decoupling state, which may lead to deviation in the final analysis.
Based on the status of existing research, this paper first uses GDIM to factor the changes in carbon emissions in China’s transportation industry, then analyzes the situation of decoupling transportation development from carbon emissions. The improvements and innovations in this article are as follows:
(1)
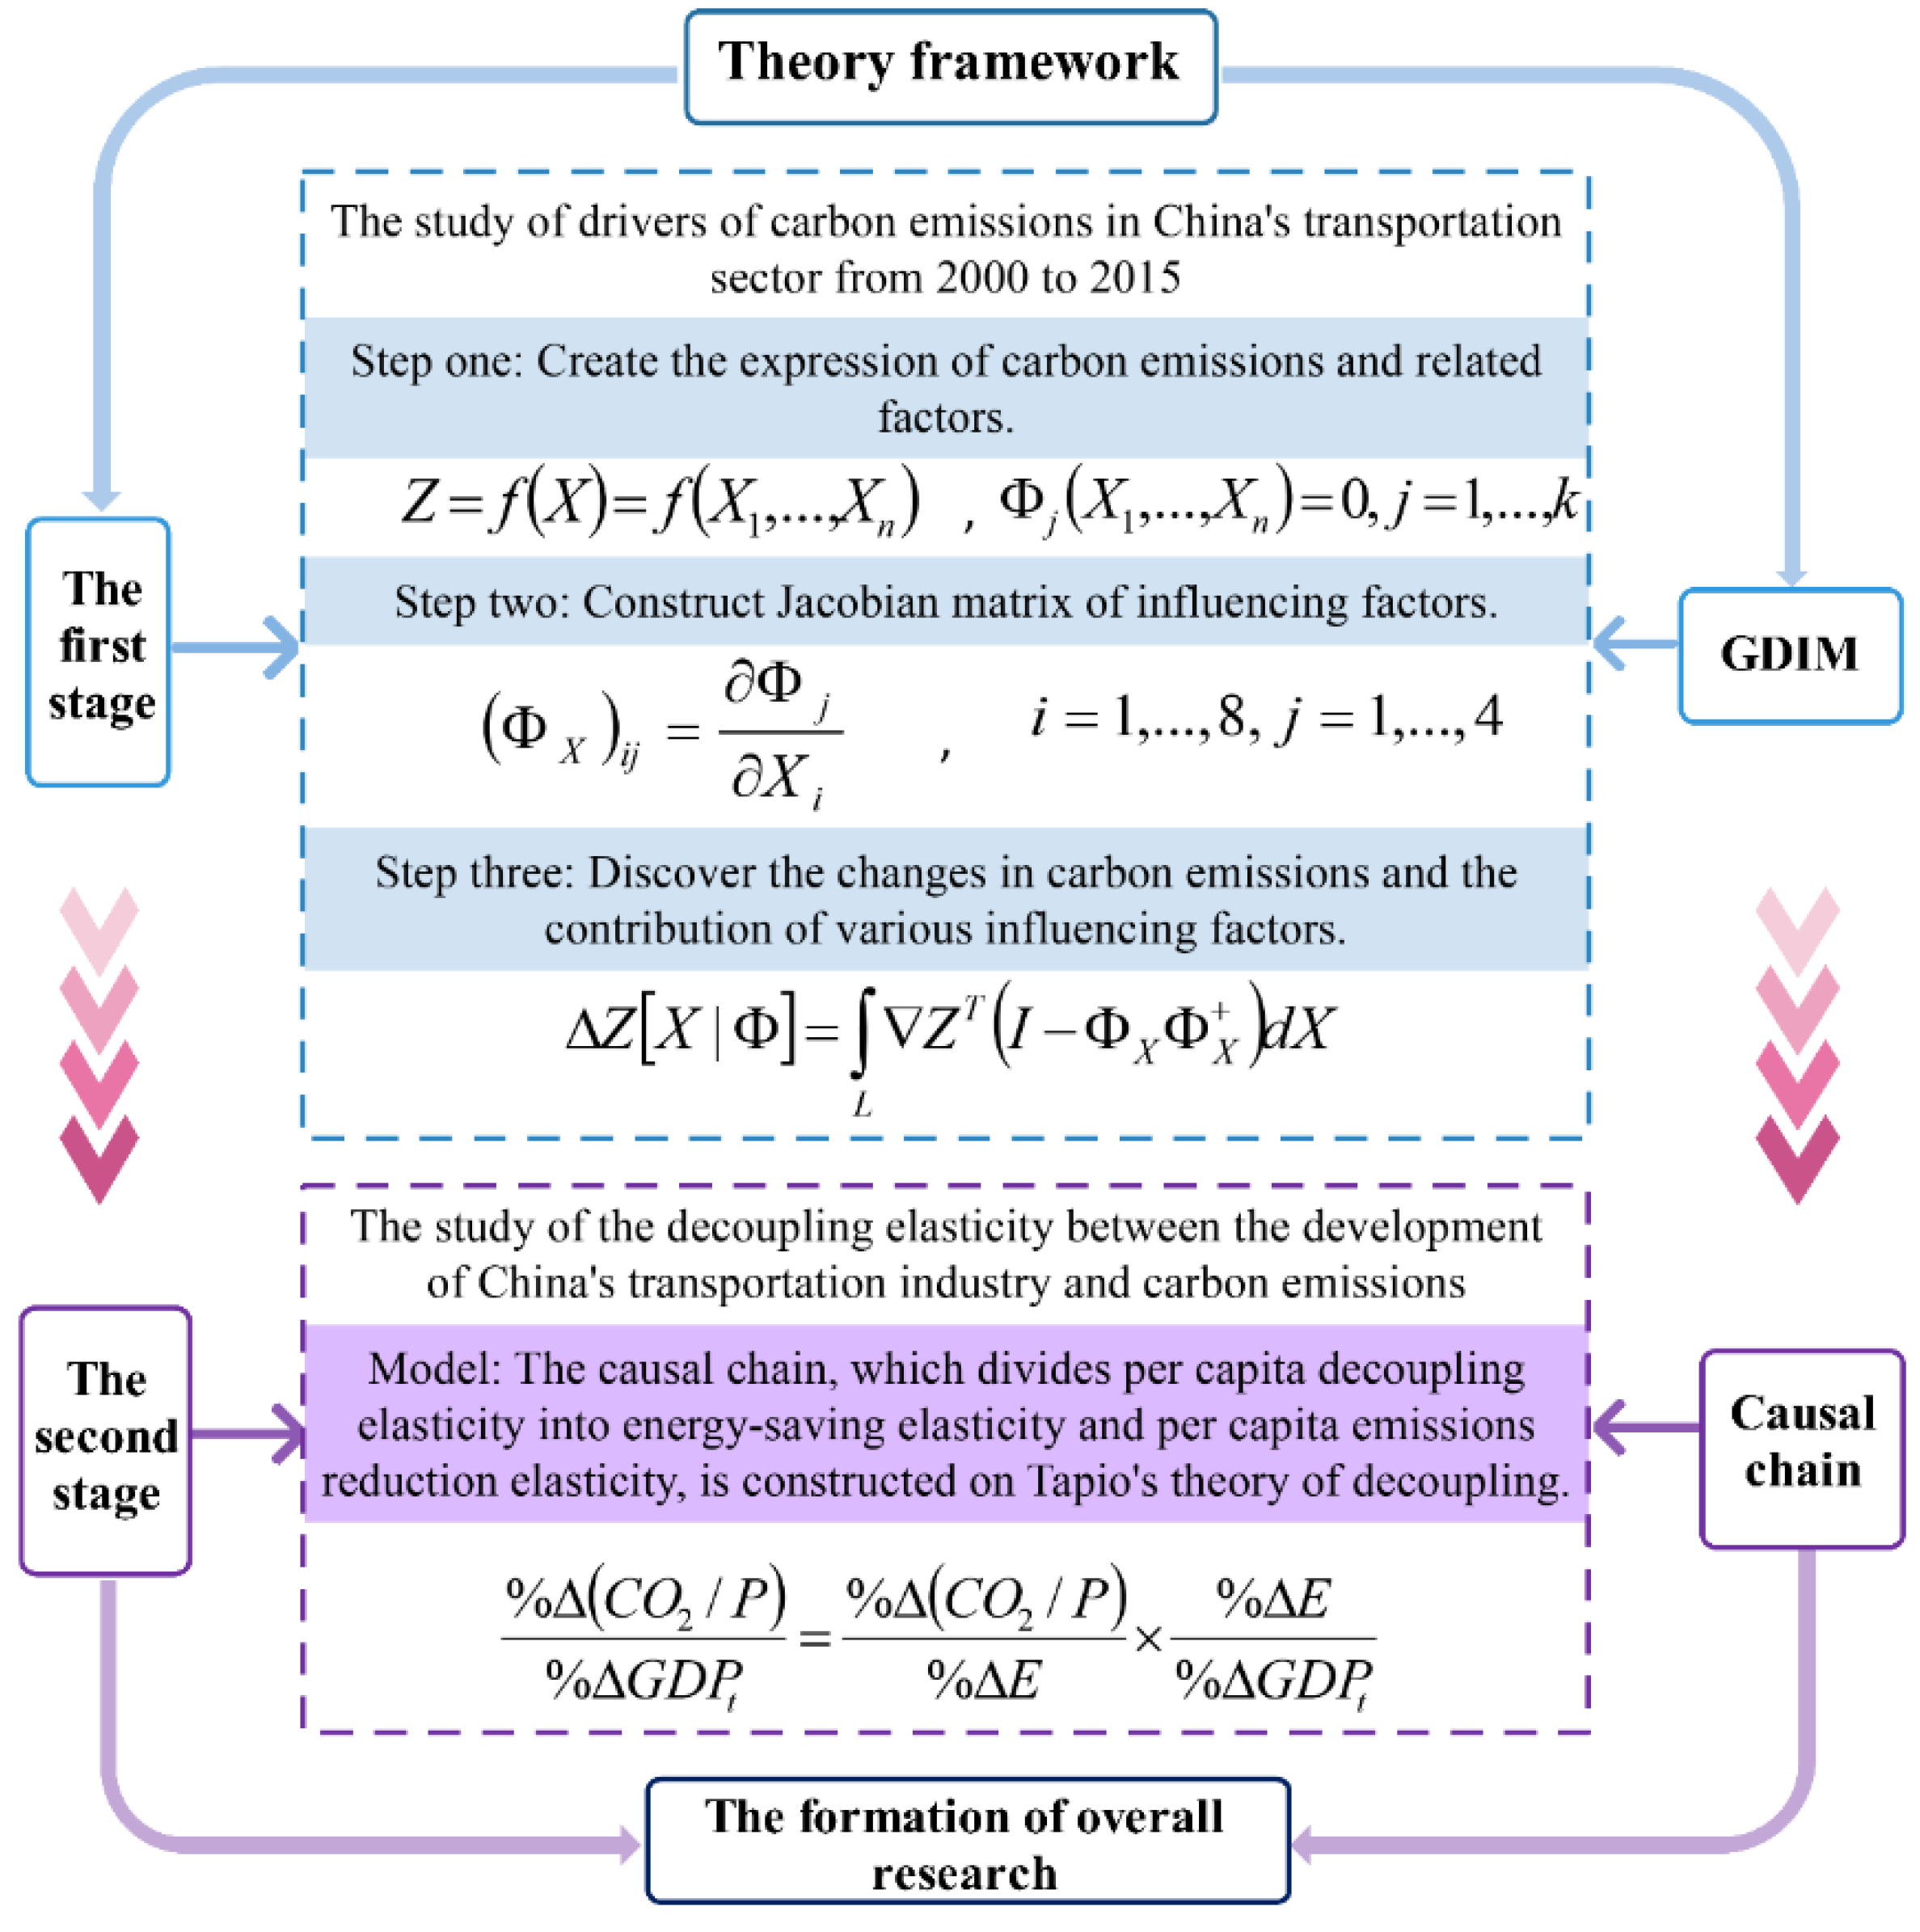
In terms of research methods, this paper is the first to analyze the driving factors of changes in carbon emissions in China’s transportation industry using the Generalized Divisia Index Method (GDIM) proposed by Vaninsky [32]. Based on the Kaya identity, GDIM constructs a decomposition model that contains multiple absolute and relative variables by deforming Kaya identities. There are three advantages to analyzing the driving factors of carbon emissions changes in the transportation industry based on GDIM: ① GDIM avoids the inherent flaws of other index decomposition methods and breaks through limitations when selecting factors. Furthermore, GDIM expands the analysis scope of Kaya’s identity, breaks the formal interdependence of various influencing factors, can reveal the impact of more than one absolute factor of change on carbon emissions in particular, and fully considers the factors that have an impact on carbon emissions that are implicit in the decomposition process; ② GDIM overcomes the contradictions in the existing index decomposition methods, doesn’t produce results that are inconsistent with economic common sense and breaks the current situation of interdependence when selecting factors. Moreover, GDIM avoids the factor decomposition results depending on the selection of influencing factors, and makes it impossible to produce paradoxical conclusions when using different factor decomposition forms; ③ Using GDIM can examine the implicit environmental impact factors, and its decomposition result can distinguish the correlation of all the factors without any double counting problem. Therefore, this paper examines a full range of eight key factors such as carbon intensity of added value, energy intensity and per capita carbon emissions in the transportation industry. In particular, it examines three absolute factors that the current literature fails to pay attention to at the same time, but cannot be ignored: population size, energy consumption, and added value of transportation industry. This paper uses GDIM to accurately and comprehensively quantify the actual contribution of the different factors in transportation carbon emissions, and draws more reasonable decomposition results.
In order to more intuitively demonstrate the reasons for selecting the GDIM model in this paper and the advantages of the GDIM model, the GDIM model is compared with other typical factor decomposition methods, as shown in Table 2.
(2)
In the selection of indicators, this paper adopts per capita carbon emissions in the transportation industry in the causal chain of decoupling elasticity for the first time. This paper doesn’t use the indicator of total carbon emissions in the decoupling causal chain model of the transportation industry, but instead innovatively decomposes per capita decoupling elasticity into per capita emissions reduction elasticity and energy-saving elasticity. This can further explore the key reasons for the decoupling of the development of the transportation industry from carbon emissions, fully take into account the differences among individuals, and reflect the individual’s role and value. In addition, it can more truly reflect the actual situation of carbon emissions in China’s transportation industry and the evolution trend of decoupling state over time than the previous decoupling causal chain model, avoid the misjudgment of the decoupling situation caused by the mistake of the calculation result, and make up for the deficiency of the existing decoupling model.

3. Estimation of Carbon Emissions in China’s Transportation Industry

Currently, China’s official statistical agencies have not released data on carbon emissions in the transportation sector and need to calculate them. According to China’s current statistical standards and the “Industrial classification for national economic activities of 2017” [58] published by the National Bureau of Statistics, the transportation industry in this paper includes transportation, storage and postal services. Among them, transportation includes railway transportation, road transportation, water transportation, air transportation, pipeline transportation, multimodal transportation and transportation agency industry. It should be pointed out that some people still have misunderstandings about the scope of the transportation industry and believe that the production of transportation goods, such as vehicles, fuels and infrastructure, also belong to the transportation industry. However, in the “Industrial classification for national economic activities of 2017”, production of transportation goods belongs to the manufacturing industry, and the use of vehicles belongs to the transportation industry. This article uses the official classification, and the definition of the transportation industry in this paper is also widely used in other studies, such as Zhao et al. [51], Wang et al. [59], and Hao et al. [12].
The carbon emissions from human activities mainly come from the consumption of fossil fuels, while most of the carbon emissions data are calculated indirectly through energy consumption. The fossil fuel energy consumed by the transportation industry mainly includes raw coal, coke, gasoline, diesel oil, and natural gas. Based on fossil energy consumption data, this paper used the calculation method of carbon emissions from energy consumption described in the IPCC GHG Inventories Guide, and combined various coefficients published by the Chinese government to measure carbon emissions from the transportation industry. The carbon emission calculation method used in this paper is currently widely used by academics, such as Wei et al. [13], Freitas et al. [42], Zhou et al. [31]. The specific formula is (1):
C O 2 = i E i × C V i × C C F i × ( 1 C S i ) × O i × ( 44 / 12 )
In Equation (1): i = 1 , 2 , , 8 indicates the type of energy. To ensure the accuracy of the estimation results, this paper fully considers eight kinds of fossil fuels, including raw coal, coke, crude oil, fuel oil, gasoline, kerosene, diesel oil and natural gas; CO2 is the total carbon emissions from transportation energy consumption in units of 104 tons; Ei is the consumption of fossil fuels in units of 104 tons or one hundred million cubic meters; CVi is the average low calorific value in units of kJ/kg or kJ/m3; CCFi is the unit of carbon content of calorific value in tons/TJ; CSi is the carbon fixation rate; Oi is the rate of carbon oxidation; 44 is the molecular weight of CO2; and 12 is the atomic weight of C.
The carbon emissions of China’s transportation industry are calculated according to Equation (1). The values of the coefficients are derived from the literature [31] and reference “China Energy Statistical Yearbook” [60] (2000–2015), “A Study on City Greenhouse Gas Emissions Inventory” [61] and “2006 IPCC Guidelines for National Greenhouse Gas Inventories” [62]. The sequence length of each fossil energy consumption in transportation is 2000–2015, and the data are from “China Energy Statistical Yearbook”. Considering that the electricity does not directly produce CO2, in order to avoid double counting, the electricity consumed by the transportation industry has not been included in our calculation.

4. Methods

4.1. Decomposition Model of Influencing Factors of Carbon Emissions in the Transportation Industry—GDIM

We have considered the defects of the decomposition methods such as LMDI. Thus, in order to comprehensively investigate the driving factors of changes in carbon emissions, this paper uses the GDIM proposed by Vaninsky [32].
(1) Creating an expression of carbon emissions and related factors. The index Z is a function of the influencing factors X1,X2,…,Xn, and Xi varies with time t: Xi = Xi(t); they are related to each other by Equation (2):
Z = f ( X ) = f ( X 1 , , X n ) , Φ j ( X 1 , , X n ) = 0 , j = 1 , , k
In this paper, let Z = CO2, X1 = GDPt, X2 = (CO2/GDPt), X3 = E, X4 = (CO2/E), X5 = P, X6 = (CO2/P), X7 = (GDPt/P), and X8 = (E/GDPt), where CO2 is the transportation carbon emissions (104 tons), GDPt is the transportation added value (100 million yuan), CO2/GDPt is the carbon intensity of added value (tons/104 yuan), E is the energy consumption (104 tons of coal equivalent), CO2/E is the energy carbon emission intensity (ton/ton of coal equivalent), P is the population size (104 persons), CO2/P is the per capita carbon emissions in the transportation industry (ton/person), GDPt/P is the per capita added value of transportation (104 yuan/person), and E/GDPt is the energy intensity (tons of coal equivalent/104 yuan). The transportation carbon emissions and related factors are expressed by Equations (3)–(5):
Z = X 1 X 2 = X 3 X 4 = X 5 X 6
X 7 = X 6 / X 2
X 8 = X 2 / X 4
Further, Equations (3)–(5) are transformed into the form of the system of Equations (2); these are Equations (6)–(10):
Z = X 1 X 2
X 1 X 2 X 3 X 4 = 0
X 1 X 2 X 5 X 6 = 0
X 1 X 5 X 7 = 0
X 3 X 1 X 8 = 0
(2) Constructing the Jacobian matrix of influential factors. For factor X, let Z(X) denote its contribution to the change in carbon emissions. Constructing a Jacobian matrix ΦX composed of various influencing factors from Equations (6)–(10), where ( Φ X ) i j = Φ j X i , i = 1,2,…,8; j = 1,2,…,4:
Φ X = ( X 2 X 1 X 4 X 3 0 0 0 0 X 2 X 1 0 0 X 6 X 5 0 0 1 0 0 0 X 7 0 X 5 0 X 8 0 1 0 0 0 0 X 1 ) T
(3) Discovering the changes in carbon emissions and the contribution of various influencing factors. According to the principle of GDIM, the variation in carbon emissions ΔZ is decomposed into the following sum of contributions of each factor of Equation (12):
Δ Z [ X | Φ ] = L Z T ( I Φ X Φ X + ) d X
In Equation (12), L refers to the time span; Z = ( f 1 , , f n ) T , f i = Z X i , i.e., Z = ( X 2 , X 1 , 0 , 0 , 0 , 0 , 0 , 0 ) ; I is the unit matrix; d X = d i a g ( X 1 , X 2 , , X n ) d t ; “+” refers to the generalized inverse matrix; Φ X + = ( Φ X T Φ X ) 1 Φ X T if the columns in the Jacobian matrix Φ X are linearly independent, and the coordinates of the row vector Δ Z [ X | Φ ] are the decomposition Δ Z X i of each factor.
From Equation (12), the variation Δ Z of carbon emissions is divided into the sum of eight effects: Δ Z X 1 , Δ Z X 2 , Δ Z X 3 , Δ Z X 4 , Δ Z X 5 , Δ Z X 6 , Δ Z X 7 , and Δ Z X 8 . Among them, the three absolute factors Δ Z X 1 , Δ Z X 3 and Δ Z X 5 represent the impact of changes in the added value of transportation, changes in energy consumption and changes in the population size on carbon emissions in the transportation sector, respectively. In terms of relative factors, Δ Z X 2 represents the impact of low-carbon changes in transportation development on changes in carbon emissions; Δ Z X 4 represents the impact of energy structure adjustment on changes in carbon emissions; and Δ Z X 6 reflects changes in carbon emissions caused by low-carbon changes in people’s travel; Δ Z X 7 reflects the impact of changes in per capita added value of transportation on changes in carbon emissions; and Δ Z X 8 shows the impact of changes in energy efficiency on changes in carbon emissions.
The paper uses the data of China’s transportation industry from 2000 to 2015. The added value of transportation and population size come from the “China Statistical Yearbook” [63] (2000–2015), and the energy consumption comes from the “China Energy Statistical Yearbook” [60] (2000–2015). To maintain the comparability of data, the added value of the transportation sector is adjusted at constant 2000 prices to eliminate the impact of price fluctuations.

4.2. The Decoupling Model of Carbon Emissions from Transportation Development—Tapio

“Decoupling” is the phenomenon of a breakdown in the coupling between economic development and environmental pressure [64]. If economic development did not lead to increased environmental pressure and even less environmental pressure, then “decoupling” could be found. Based on the Organization for Economic Co-operation and Development (OECD) decoupling model, Tapio introduced the concept of “decoupling elasticity” to construct the decoupling index, which solves the difficulty of the OECD decoupling model in the selection of the base period. It comprehensively and carefully divides the decoupling state and is the most widely used decoupling relationship research method.
According to Tapio’s theory of decoupling, this paper constructs a decoupling model between the economic growth of transportation and carbon emissions, and in order to further explore the reasons for the decoupling between the two, a causal chain is constructed for the decoupling model:
% Δ C O 2 % Δ G D P t = % Δ C O 2 % Δ E × % Δ E % Δ G D P t
In Equation (13), %ΔCO2, %ΔGDPt and %ΔE represent the percentages of changes in carbon emissions, value added and energy consumption in transportation, respectively; % Δ C O 2 % Δ G D P t represents the decoupling elasticity between economic growth and carbon emissions in transportation; % Δ C O 2 % Δ E represents the elasticity of emission reduction between transportation energy consumption and carbon emissions; and % E % Δ G D P t represents the energy-saving elasticity between transportation economic growth and energy consumption.
Most of the studies on the decoupling of transportation industry refer to Equation (13). To overcome the shortcomings of the model, the total carbon emissions in Equation (13) are replaced by per capita carbon emissions in the transportation industry:
% Δ ( C O 2 / P ) % Δ G D P t = % Δ ( C O 2 / P ) % Δ E × % Δ E % Δ G D P t
In Equation (14), % Δ ( C O 2 / P ) represents the percentage change in carbon emissions per capita in the transportation industry; % Δ ( C O 2 / P ) % Δ G D P t represents per capita decoupling elasticity between transportation economic growth and carbon emissions; and % Δ ( C O 2 / P ) % Δ E represents per capita emissions reduction elasticity between transportation energy consumption and carbon emissions.
According to the Tapio decoupling elastic value of the division, the decoupling situation of development of transportation from carbon emissions is subdivided into eight kinds of states [48]. This division standard is also widely used in other studies at present, such as Román et al. [41], Zhao et al. [51] and Jiang et al. [65]. The specific divisions and their meanings are shown in Table 3.

4.3. Model Summary

The research methods and models of the influencing factors and the decoupling of carbon emissions from transportation development are summarized in Figure 1.

5. Analysis of Results

5.1. Analysis of the Factors Affecting Carbon Emissions in the Transportation Industry

5.1.1. Concrete Analysis of the Factors Affecting Carbon Emissions in the Transportation Industry

The time range of this study is from 2000 to 2015. To facilitate the analysis of the results, it is divided into three sub-stages: 2000–2005, 2005–2010 and 2010–2015. Using the R software (R i386 3.4.1) [32] to decompose the driving force of carbon emissions in transportation by the generalized Divisia index method, the result of factorization can be calculated according to Equations (8) and (12) as shown in Figure 2.
As seen in Figure 2, among the eight factors affecting transportation carbon emissions, the added value of transportation, energy consumption, population size and per capita carbon emissions in the transportation industry have all shown an increasing effect on carbon emissions. However, the energy carbon emission intensity and per capita added value in the transportation industry show a declining effect on carbon emissions. The increasing and decreasing effects of carbon intensity on the added value and energy intensity have emerged:
(1) The driving factors for the growth of carbon emissions in the transportation industry are strong. Among the various factors that promote growth in carbon emissions, the growth-enhancing effect of the added value of transportation industry is constantly increasing. In 2000–2005, 2005–2010 and 2010–2015, the added value of transportation contributed to 45,883,200 tons, 61,226,800 tons and 66,330,900 tons of carbon emissions, respectively. This is mainly due to the rapid growth of China’s economy, which has led to the ever-increasing length of its transportation routes. The average annual growth rate of regular-service airline routes in the transportation routes has even reached 8.79%. At the same time, the transportation equipment is also growing, resulting in a corresponding increase in carbon emissions.
The effect of energy consumption on increased transportation carbon emissions also shows an increasing trend, reflecting the continuous growth of China’s high-energy transportation modes and the high share of all transportation modes. For instance, the proportion of passenger traffic of civil aviation increased from 0.45% in 2000 to 2.24% in 2015, and the proportion of passenger traffic on railways increased from 7.11% in 2000 to 13.04% in 2015. Although the proportion of passenger traffic on the road has decreased, it has still retained approximately 80% of the share in recent years. At the same time, with the improvement in people’s living standards and quality of life, people’s demand for transportation is increasing. The number of motor vehicles such as private cars is rapidly increasing, and the courier and take-out industries are developing rapidly, which greatly increases the consumption of transportation energy so that the corresponding amount of carbon emissions continues to increase.
The evolutionary trend of the effect of population size on the promotion of carbon emissions in the transportation industry is identical to the above two factors, from 2.4918 million tons in 2000–2005 to 4.3635 million tons in 2010–2015. The reason for this is that the absolute number of the Chinese population is constantly increasing and is accompanied by an increase in the rate of urbanization. This has increased the rigid demand for transportation and has led to a continuous increase in carbon emissions in transportation. Quantitatively speaking, the effect of population size on the increase in carbon emissions is relatively small. This is due to China’s implementation of the family planning policy, which limits the natural increase in the population.
The per capita carbon emissions in the transportation industry show greater volatility in promoting the growth of transportation carbon emissions, decreasing from 50.9032 million tons in 2000–2005 to 47.4734 million tons in 2005–2010 and then increasing to 63.7025 million tons in 2010–2015. This is because under the impact of the 2008 international financial crisis, the economic downturn caused a decrease in people’s willingness to spend, leading to a drop in consumption-based travel, such as tourism, in approximately 2008 and resulting in a decrease in the increasing effect of per capita carbon emissions.
(2) The effect of each reduction factor on the suppression of carbon emissions growth is weaker. Among all the factors contributing to the decrease, the declining effect of energy carbon emission intensity has been steadily increasing from 80,200 tons in 2000–2005 to 2,611,700 tons in 2005–2010, then increasing to 3,760,800 tons in 2010–2015. This shows that the optimization of the energy structure in China’s transportation industry shows obvious results. Among them, the energy structure showed a significant low-carbon adjustment in 2005–2010 thanks to China’s goal of optimizing energy structure proposed during The Eleventh Five-Year Plan period. The proportions of coal and petroleum dropped by 3.0 and 0.5 percentage points, respectively; natural gas and other renewable energy sources increased by 2.5 and 0.3 percentage points, respectively. In recent years, China’s high-speed rail construction has developed rapidly, and the electrification rate has thus been upgraded. As a result, this objectively optimizes the energy structure of the transportation industry and promotes a decrease in carbon emissions.
The per capita added value of transportation has a more stable effect on reducing carbon emissions. In 2000–2005, 2005–2010 and 2010–2015, the per capita added value of the transportation industry led to decreases of 10,886,100 tons, 12,160,400 tons and 10,700,800 tons of carbon emissions, respectively. It seems counterintuitive that the per capita added value of the transportation industry has a negative effect on carbon emissions, and the absolute value is small relative to other factors. Vaninsky [32] stated that per capita added value in the transportation sector is a relative quantity factor and includes two indicators that have an impact on carbon emissions: the added value of transportation and population size. Changes in these indicators affect their carbonization, and they are also energy-related. As the per capita added value of the transportation industry is correlated with some indicators, its change affects all through Equations (6)–(10). In this way, changes in per capita added value in the transportation industry are allocated to all of these indicators. Only part of its own change is due to changes in per capita added value and is calculated by Equation (12) in the impact on changes in carbon emissions. The remaining part is included in the impact of other indicators and accordingly adjusts the response level of the resulting indicator, Z. Therefore, even if the per capita added value of the transportation industry increases the carbon emissions, if the value is not large enough, it may show a negative value. On the other hand, with the rapid economic growth in China, the state gradually extends the welfare of the people from the most basic medical care to transportation and other fields. For instance, the government subsidizes transportation to impoverished laborers working across provinces. The negative impact of per capita added value of transportation on carbon emissions shows that the motivation of people’s welfare lags behind the development of the national transportation economy [32].
The carbon intensity of added value contributed to the increases of 4,879,900 tons and 460,000 tons of carbon emissions in 2000–2005 and 2010–2015, respectively, while the effect of declining in 2005–2010 is very obvious, with 8,956,500 tons. This is because for the first time in China’s “The Eleventh Five-Year Plan”, energy conservation and emissions reduction were binding targets, and an energy-savings and emissions reduction indicator system, a testing system, an assessment system and a target responsibility system were established to make the transportation industry’s energy conservation and emissions reduction efforts continue to strengthen and effectively enhance the carbon productivity of the transportation industry and raise the low-carbon level of its development. In the period of 2010–2015, due to a lack of overall planning and promotion of standards and policies related to transportation, the carbon intensity of added value shows a weak increasing effect.
In the period of 2000–2005, the effect of the decrease in energy intensity was 467,400 tons. In 2005–2010, it increased the carbon emissions by 186,900 tons. Finally, carbon emissions were restrained by 229,600 tons in 2010–2015. This shows that the energy efficiency of China’s transportation industry has improved in recent years. This can be attributed to the fact that China attached great importance to energy development during The Twelfth Five-Year Plan period and set a target of 16% reduction in energy intensity per unit of GDP by 2015 to guide the transportation industry to continuously improve energy efficiency, avoid the unnecessary waste of energy, and extend the duration of energy use under a given supply.

5.1.2. Cumulative Contribution Analysis of Factors Affecting Carbon Emissions in the Transportation Industry

To more clearly and comprehensively reflect the dynamic impacts of the above eight factors on the changes in carbon emissions from 2000 to 2015, the contribution of each factor to carbon emissions was accumulated year by year. Based on 2000, the cumulative effect of each factor was calculated, as shown in Figure 3.
(1) The cumulative growth of transportation carbon emissions is larger. Figure 3 shows that during the period of 2000–2015, the cumulative carbon emissions from transportation increased by 464,478,100 tons, and the cumulative growth after 2000 was both positive and increasing. This is because after China acceded to the World Trade Organization in 2001, the transportation industry enjoyed many opportunities for development, resulting in the expansion of the transportation market. The industry, including warehousing, concentrated transportation and other industries related to transportation, was open to the outside world, and international trade was frequent. At the same time, the process of urbanization in China entered a phase of an all-round promotion since 2002. The population and area of cities constantly expanded, and the demand for transportation rapidly increased. Together, these factors contributed to the rapid development of the transportation sector and consumed a large amount of energy, resulting in a substantial increase in the accumulated carbon emissions of the transportation industry.
(2) The cumulative contribution of each factor to carbon emissions is different in size and trend. Figure 3 shows that the added value of transportation and energy consumption are the primary factors driving the increase in carbon emissions. Carbon emissions from transportation added value increased from 6,137,100 tons in 2001 to 161,496,400 tons in 2015, an average annual growth rate of 26.31%. Total energy consumption increased by 162,401,800 tons of carbon emissions in 2000–2015. Per capita carbon emissions in the transportation sector are also an important factor in promoting the growth of carbon emissions. However, the growth-boosting effect of per capita carbon emissions was surpassed by the added value of the transportation industry in 2007 and maintained its rapid growth at an average annual rate of 39.78%. The effect of population size on carbon emissions growth was relatively weak. By 2015, its cumulative result was 10,892,500 tons of carbon emissions. Per capita added value of transportation and energy carbon emission intensity are the main factors of carbon emissions reduction. Among them, the effect of energy carbon emission intensity gradually emerged after 2008, and the effect of its reduction increased rapidly from 2008 to 2015 at an average annual rate of 34.81%. The carbon intensity of added value has generally reduced carbon emissions in 2000–2015, reducing a total of 3.5895 million tons of carbon emissions, but its volatility was greater. Energy intensity had a small effect on reducing carbon emissions, and its growth rate was relatively slow; it reduced 934,300 tons of carbon emissions cumulatively by 2015. From the above results, we can see that the added value of transportation and energy consumption still play a significant role in the growth of carbon emissions. The adjustment of energy structure and the improvement in energy efficiency in the transportation sector, which are highly valued by China, have achieved initial success in their contribution to carbon emissions reduction but are still far from the expected targets and still have much room for improvement. Since economic development is the driving force of national rejuvenation and the guarantee of people’s livelihood, the countermeasures to reduce carbon emissions by sacrificing the economic growth rate are not in keeping with the fact that China is still in a ‘developing country’s’ situation; however, this is not conducive to achieving energy conservation, emissions reduction and sustainable development in the transportation industry. Therefore, based on the above results, in the future, China’s transportation industry should focus on improving energy efficiency, increase the proportion of clean energy in the energy mix and actively implement a carbon reduction policy that focuses on low-carbon and energy-saving development.
Summary: The eight factors studied have different effects on carbon emissions, and the driving effect of the increasing factors are more obvious. The decreasing factors still have a lot of room for improvement in curbing carbon emissions in China’s transportation industry.

5.2. Analysis of the Decoupling Elasticity between Transportation Development and Carbon Emissions

By decomposing the evolving trend of carbon emissions in the transportation sector, the present study investigated the actual contribution of each factor to the change in carbon emissions in the transportation industry. Decoupling can help to explore the interaction between carbon emissions and economic development. In the following section, we further analyze the decoupling situation between transportation development and carbon emissions based on factor decomposition.
Based on Equation (14), we calculated the per capita decoupling elasticity, per capita emissions reduction elasticity and energy-saving elasticity of transportation development and carbon emissions from 2001 to 2015. To more clearly reflect the size of each decoupling indicator and the relationships among them, we created a trend graph, as shown in Figure 4.
As can be seen in Figure 4, the decoupling of the development of China’s transportation industry and carbon emissions has fluctuated greatly. This is similar to the existing studies, such as the study by Zhao et al. [51] and Zhou et al. [31] on the decoupling of the development of transportation industry and carbon emissions in Guangdong Province and the whole country. In Figure 4, we can see that during the period of 2001–2015, there are three types of decoupling between the development of transportation industry and carbon emissions: “weak decoupling”, “expansive coupling” and “expansive negative decoupling”. Among them, more than half of the years experience “expansive coupling” and “expansive negative decoupling”, indicating that the decoupling of carbon emissions from transportation development is poor, and the economic growth of the transportation industry is accompanied by an increase in carbon emissions.
Overall, during the period of 2001–2015, the decoupling of carbon emissions from transportation development shows a tendency to deteriorate first, then to improve, and then to slightly deteriorate again. The years 2001–2004 were a period of deterioration in decoupling; 2005–2009 was a period of improvement, and 2010–2015 was a period of slight deterioration in decoupling. ① From 2001 to 2004, the period was dominated by expansive negative decoupling, namely, the increase in carbon emissions was greater than the economic growth of the transportation sector. This is mainly due to the improvement in the global economic situation and the expansion of the economic scale of China’s transportation industry. For the purpose of boosting domestic demand and increasing investment, China implemented a proactive macro-economic policy and launched a large number of high-energy-consuming and repetitive infrastructure projects [31]. In addition, online sales, such as Taobao, developed rapidly during this period. However, these basic projects and online sales led to a sharp increase in demand and the consumption of energy while promoting the development of the transportation industry [31], but the state lacked effective emissions reduction measures to control this. ② During 2005–2009, in 2006 only, the decoupling state was expansive coupling. During the rest of the years, there was weak decoupling, meaning that the growth rate of the transportation carbon emissions was less than the rate of economic growth. This is mainly because during the period when China developed its transportation industry, China increased its emphasis on carbon emissions, set a hard target for energy conservation and emissions reduction, and promulgated a number of laws and regulations such as the “Renewable Energy Law”. At the same time, China’s overall improvement in the level of opening up provided ample opportunities for high and new technology industries to speed up the development of high and new technology industries, which have the characteristics of high added value and low transportation density [66], thus optimizing the decoupling of transportation development from carbon emissions and transforming the economic growth mode from extensive to intensive. ③ During the period of 2010–2015, the transportation carbon emissions showed obvious signs of increases compared with the previous period. The decoupling state was mainly dominated by expansive coupling and even showed expansive negative decoupling in 2012. This shows that the transportation industry’s energy-saving emissions reduction efforts were insufficient at this stage and did not reach the desired state. Under the background of the problem that traffic congestion is difficult to solve and there has been a rapid increase in the number of motor vehicles, the road toward energy conservation and emissions reduction in China’s transportation industry is still full of bumps.
After replacing total carbon emissions with per capita carbon emissions in the transportation sector, the decoupling status in 2002 and 2008 is different from the previous calculation. In 2002, the decoupling state of total carbon emissions was expansive negative decoupling, while the per capita decoupling state was expansive coupling. In 2008, the decoupling state of total carbon emissions was expansive coupling, while the per capita decoupling state was weak decoupling. China formally joined the World Trade Organization in late 2001, causing an increase in the traffic demand in 2002 and an increase in carbon emissions. At the same time, the state analyzed in depth the opportunities and challenges brought by the accession to the World Trade Organization for energy development in The Tenth Five-year Plan for Energy Development and formulated energy development strategies that focused on optimizing the energy structure and making efforts to improve energy efficiency. It guided the transportation industry to gradually pursue energy-saving emissions reduction and to some extent slowed the increase in carbon emissions. Therefore, the per capita decoupling state was changed from weak decoupling in 2001 to expansive coupling in 2002. With the continuous opening up of China, the transportation industry faced increasingly fierce price competition, especially in the impact of road transportation. Therefore, compared with the growth rate of the transportation economy, the increase in its carbon emissions was larger, leading to a worsening per capita decoupling status in the next two years, from expansive coupling in 2002 to expansive negative decoupling. In 2008, the global economic crisis caused a great impact on China’s transportation industry. Coupled with the continuous progress of energy conservation and emissions reduction, the per capita decoupling status showed weak decoupling. It can be seen from this that the per capita decoupling state can more accurately and subtly reflect the relationship between the development of the transportation industry and carbon emissions compared with the decoupling state calculated through the transportation of total carbon emissions, so we can conduct a better and more comprehensive analysis and provide a reference for the formulation of energy conservation and emissions reduction policies by the state.
There is a relatively large gap between the trend of the energy-saving elasticity and per capita emissions reduction elasticity. As seen in Figure 4, the volatility of energy-saving elasticity is relatively large, especially in the sharp increase in energy-saving elasticity in 2001–2002. After a period of fluctuation, the energy-saving elasticity has also picked up in recent years, indicating that the transportation industry is more dependent on energy consumption and that energy efficiency needs to be improved. Per capita emissions reduction elasticity fluctuated relatively more in 2008–2010 and almost overlapped with per capita decoupling elasticity, which shows that per capita emissions reduction elasticity, which is the energy consumption structure, has a more important impact on decoupling the development of transportation from carbon emissions during this period. However, per capita emissions reduction elasticity changed little in general, tended to be stable, and had little effect on the decoupling status. Within the entire period of 2001–2015, the trends of energy-saving elasticity and per capita decoupling elasticity were almost the same, both rising and falling, indicating that compared with per capita emissions reduction elasticity, energy-saving elasticity played a more crucial role in decoupling the development of transportation from carbon emissions. This is consistent with the analysis of energy intensity in the factor decomposition above. Energy intensity showed a declining effect on carbon emissions in 2001, 2005, 2007, 2009 and 2014. Although energy intensity showed a stimulus-increasing effect in 2008, its value was relatively small, only 2770 tons. However, the decoupling of transportation development from carbon emissions has shown weak decoupling in the past few years.
Summary: The causal chain model of the per capita decoupling elasticity accurately reflects that the decoupling state of carbon emissions from the development of China’s transportation industry is relatively poor. And energy-saving elasticity plays a more important role in decoupling than the per capita emissions reduction elasticity.

6. Discussion and Analysis

6.1. Discussion on the Comparison between the Results of This Paper and the Existing Research Results

This study explores the factors influencing carbon emissions in China’s transportation industry and the decoupling relationship between carbon emissions and the development of the transportation industry. Many scholars have done similar research on these two aspects. The following two representative articles were selected to compare with the results of this study.
(1) Comparing driving factors of the evolution of China’s transportation carbon emissions. Zhou et al. [31] conducted an LMDI decomposition of China’s transportation carbon emissions from 1995 to 2012, extending the Kaya identity and discussing the impact of five factors on carbon emissions. Three of them are the same as the research factors in this paper, namely, energy carbon emission intensity, energy intensity and population size. The comparison of the results is shown in Table 4.
As seen in Table 4, ① the direction of the effect of energy carbon emission intensity on the carbon emissions in the transportation sector is almost the same in the two studies, with the opposite direction in 2007 only. The comparative study shows the promotion effect, and this paper shows the inhibitory effect. Considering that the two studies are basically consistent with the overall change trend of energy carbon emission intensity in terms of transportation carbon emissions and that the gap before and after is one year only in the turning year in which the energy carbon emission intensity plays a role, this is acceptable. ② In both papers, there is a big gap between the magnitude of the effect of energy intensity on transportation carbon emissions. In recent years, China has focused on energy development and has guided the transportation industry to improve the efficiency of energy utilization so that energy intensity has a negative effect on carbon emissions in most years. However, although the adjustment of energy intensity is effective, it does not reach the expected level, making the effect of reducing energy intensity weaker and in some years even showing a slight increase in the effect. Therefore, the maximum declining effect of the energy intensity in this paper is only 451,000 tons in Table 4, and the increasing effect does not exceed 10,000 tons. ③ The population size in both papers contributed to carbon emissions. This is due to the huge population base in China at present, but the sizes of the two studies are quite different. China’s family planning policy, which has been implemented for several decades, has greatly limited the increase in the natural population growth rate and causes the population scale to promote carbon emissions, but its value is not great.
From the above comparative analysis, it can be seen that compared with the paper using the LMDI decomposition method used in previous studies to study the influencing factors, using GDIM to explore the drivers of transportation carbon emissions can not only allow more key factors to be chosen but also shows more reasonable decomposition results and helps to develop practical policy measures.
At present, there are studies on the factors of carbon emissions in the transportation industry, such as Tunisia and Morocco. M’raihi et al. [22] used LMDI to decompose Tunisia’s carbon emissions from road freight from 1990 to 2006 into average oil emissions, oil consumption share of road freight, oil consumption intensity of road fright, road freight intensity, and GDP. The results show that economic growth is a major factor in the increase of carbon emissions in the transportation industry, which is the same as the study in this paper. In addition, the paper also analyzes the cumulative contributions of various influencing factors and can more clearly reflect the dynamic impact of economic growth on carbon emissions changes. Kharbach et al. [28] used LMDI to decompose the carbon emissions from the road transportation industry in Morocco into the average fleet emission factor, energy use, motor vehicle ownership, and population. The study found that population growth and the increase in motor vehicle ownership have a catalytic effect on carbon emissions, which is the same as this paper. In addition, the paper also studied the carbon emissions per capita and found that per capita carbon emissions contributed significantly to the growth of carbon emissions.
(2) Comparing the decoupling between the development of China’s transportation industry and carbon emissions. Based on the Tapio decoupling model, Zhou Yinxiang [57] studied the decoupling relationship between the development of the transportation industry and carbon emissions in 1990–2013 and their evolution and constructed the causal chain to explore the influencing factors of decoupling. In the same manner as in this present paper, Zhou Yinxiang concluded that whether the development of the transportation industry can be decoupled from carbon emissions depends more on energy-saving elasticity, but the decoupling status in individual years is different. The comparison of the results is shown in Table 5.
As seen in Table 5, the decoupling status is the same for most years, but the change in the decoupling status in this study is slightly greater than that in the reference study, mainly due to the per-capita carbon emission indicator that allocates the transportation carbon emissions to each individual, specifically considers the changes in individual carbon emissions, and truly reflects the actual situation of China’s carbon emissions. Thus, per capita decoupling elasticity can more accurately reflect the relationship between transportation development and carbon emissions and capture changes in the decoupling status more sensitively and subtly.
At present, there are few studies on the decoupling of transportation development and carbon emissions in other countries. Loo et al. [50] studied the decoupling of transportation and economic growth in 15 countries, including Russia and Canada. The results showed that decarbonisation of the transportation sector were more difficult to achieve than the reduction in the levels of transportation-related fatalities. Alises et al. [67] compared the decoupling of road freight transportation between the United Kingdom and Spain. Studies have shown that Spain’s decoupling rate is much lower than that of the United Kingdom driven by economic structure changes. It can thus be seen that the decoupling of the transportation industry is not particularly optimistic in China and other countries.

6.2. The Reference Meaning of This Study

(1) The research in this present paper can provide some reference to other countries. All the selected indices in this paper are widely applicable indices, such as the added value of transportation and total energy consumption. All of these factors play a vital role in the transportation carbon emissions both in developed and developing countries. An accurate understanding of the situation can help to develop a realistic carbon reduction policy for one or more of these factors. In today’s world, all countries are actively developing the transportation industry. With the increasing number of motor vehicles and the ever-increasing number of trips and distances traveled by residents, the rapid growth of carbon emissions in the transportation industry has become an important issue that cannot be ignored. If we can grasp the decoupling relationship between the development of transportation and carbon emissions and block the coupling between the two, this will significantly improve the status of the continued increase in global carbon emissions.
(2) The research of this paper can provide a reference to other industries. The industrial sector, represented by electricity and machinery, has far more carbon emissions than transportation and is an important area for China’s carbon emissions. Its development is accompanied by an increase in carbon emissions. Using the research methods of this paper, we can determine the factors that have a significant impact on carbon emissions, understand the decoupling state between carbon emissions and industrial development, and take effective measures to save energy and reduce emissions.

6.3. The Deficiency of This Research and Directions of Improvement

Due to the lack of data on various energy consumption in the transportation sector before 2000, this paper only studies the situation of carbon emissions in the transportation industry from 2000 to 2015 and fails to expand the study period, which is not conducive to a more accurate and comprehensive grasp of the law of changes of China’s transportation carbon emissions. In the study of the drivers of carbon emissions in the transportation industry, the selected indicators are the most common key factors, such as the added value of the industry. In the future, we can try to make innovations in terms of the factors studied.

7. Conclusions and Suggestions

7.1. Main Conclusions

The transportation industry is a large source of energy consumption and carbon emissions in China. The transportation industry must shoulder the heavy responsibility of reducing carbon emissions and strive to find practical ways to save energy and reduce emissions. This is, to a large extent, related to whether China’s carbon emission reduction targets and low-carbon sustainable development vision can be successfully achieved as soon as possible. In this paper, GDIM is first used to decompose the evolution of China’s carbon emissions from 2000 to 2015 in the transportation industry, and then, the decoupling of carbon emissions from transportation development is analyzed based on the Tapio decoupling theory. Then, the interaction between carbon emissions and economic development is further explored. The main conclusions of this study are as follows:
(1)
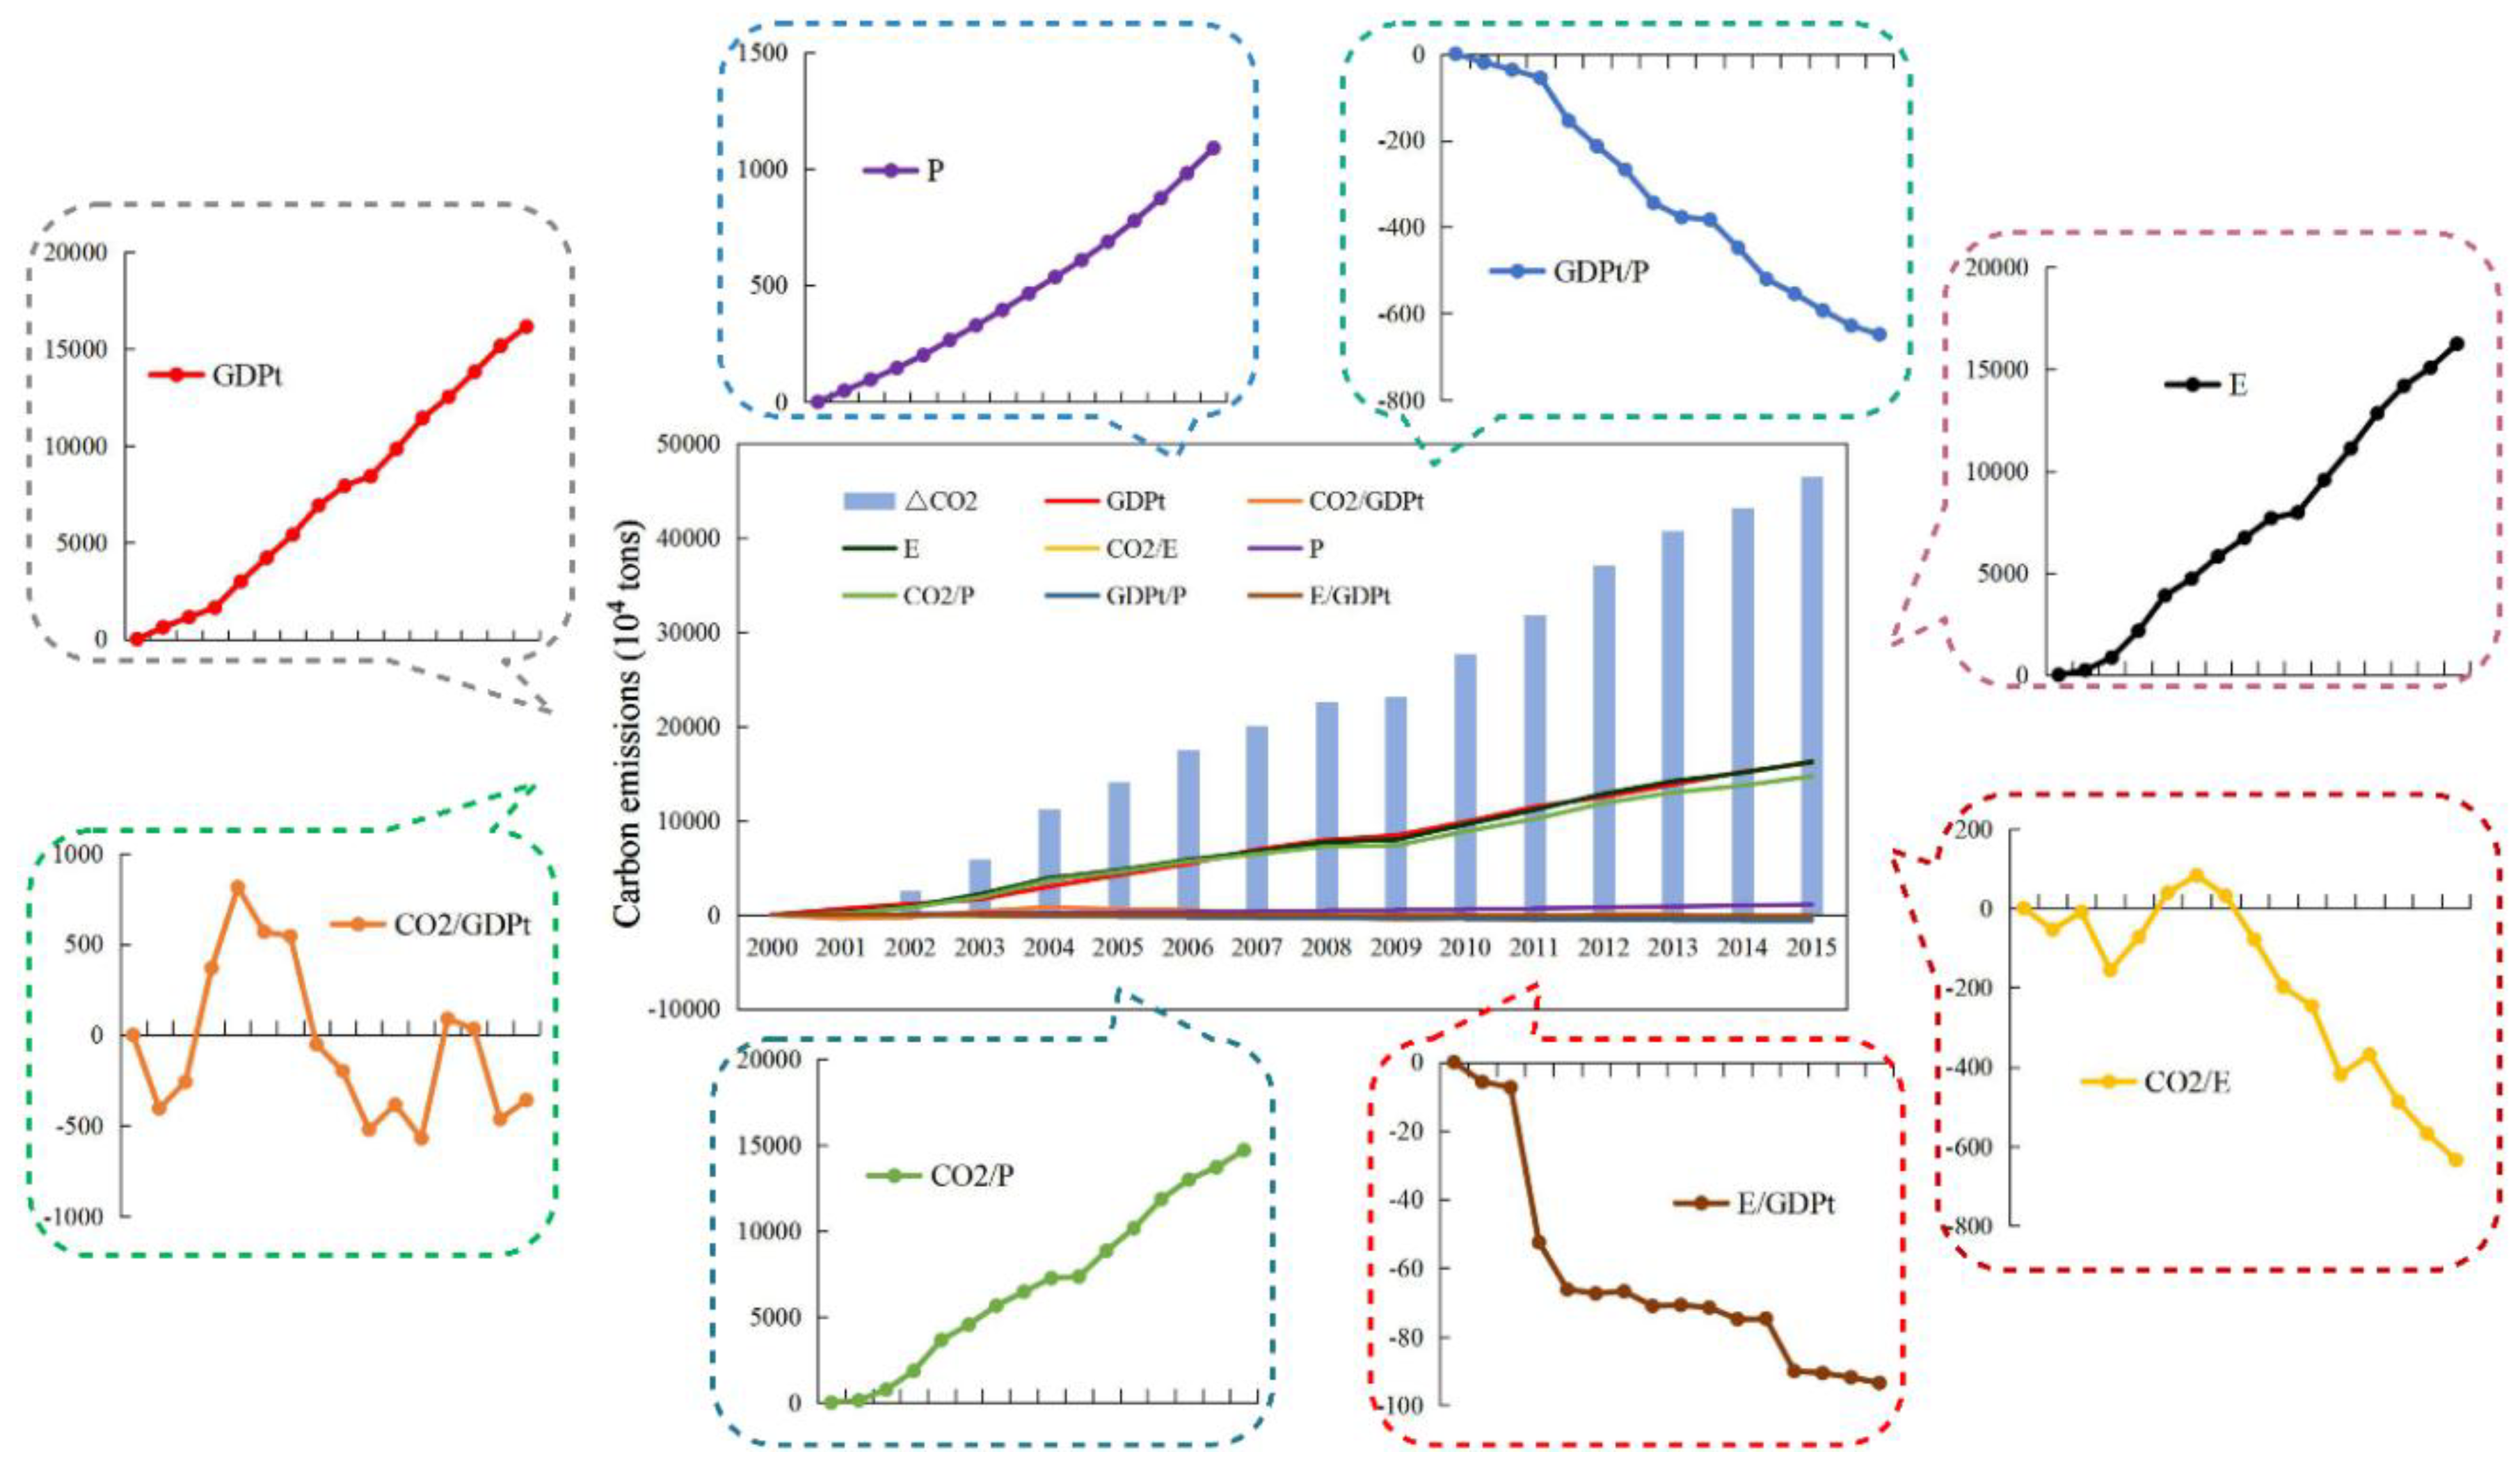
The added value of transportation, energy consumption and per capita carbon emissions in the transportation industry are the major factors leading to the increase in carbon emissions. The energy carbon emission intensity is the key factor leading to a reduction in carbon emissions. Among other factors, population size has a positive effect on carbon emissions, while per capita added value of transportation, energy intensity and carbon intensity of added value have a decreasing effect on carbon emissions.
(2)
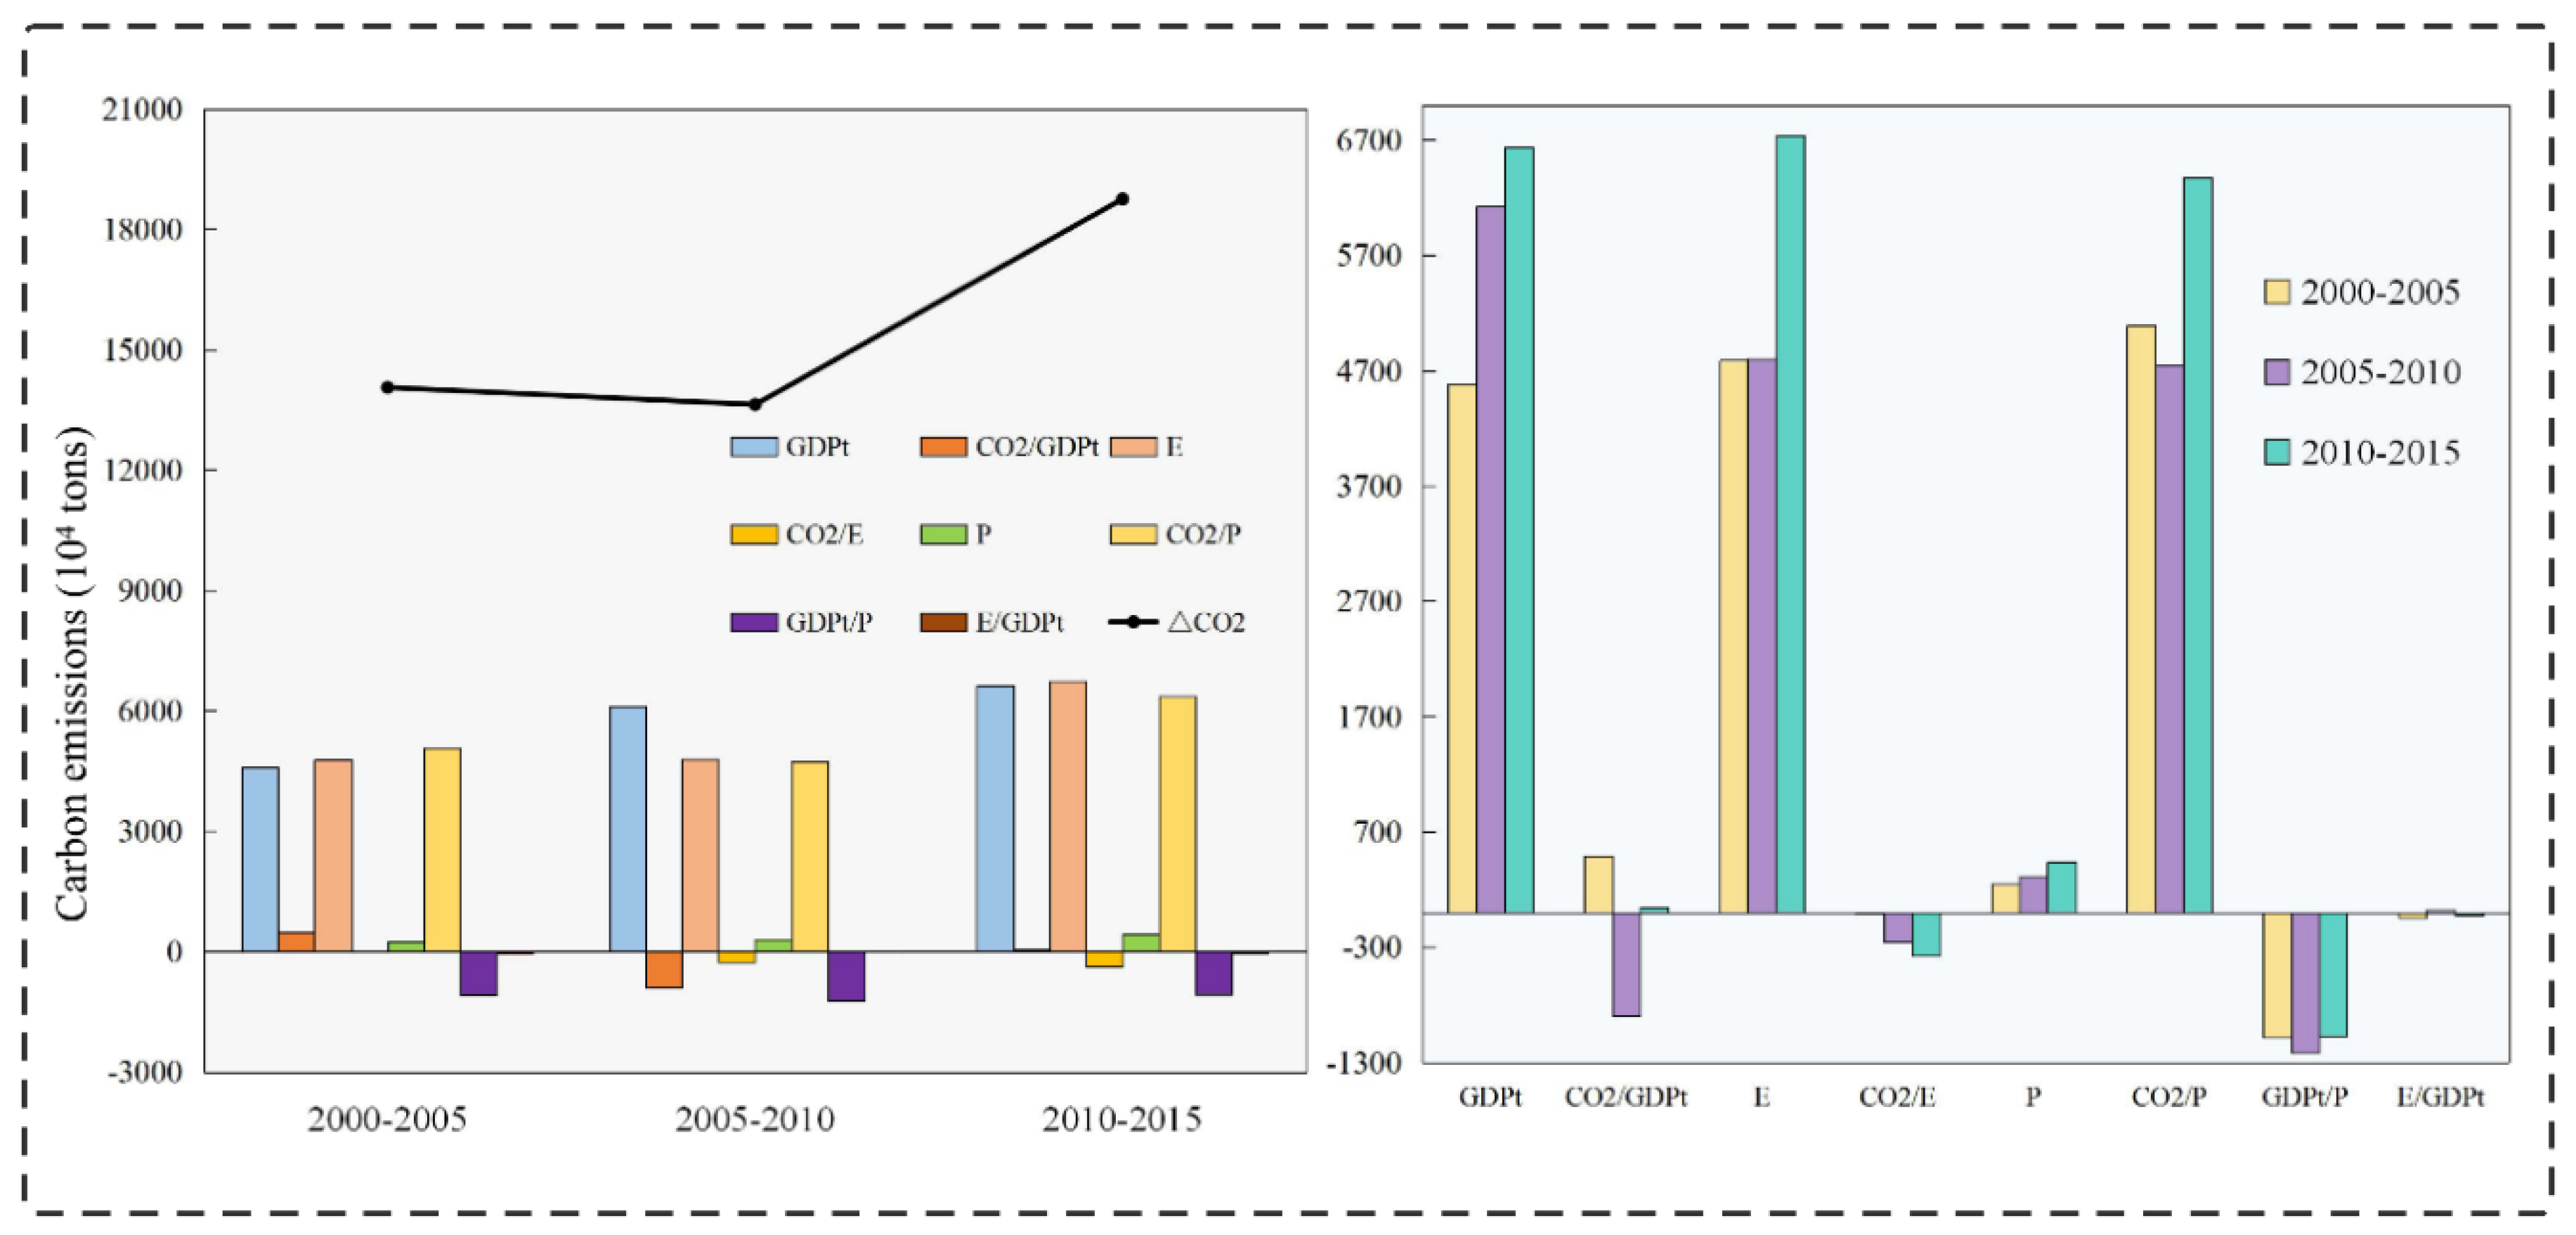
The decreasing factors have a limited effect on the suppression of carbon emissions in the transportation industry, and this effect is far less than the contribution of the increasing factors to the increase in carbon emissions.
(3)
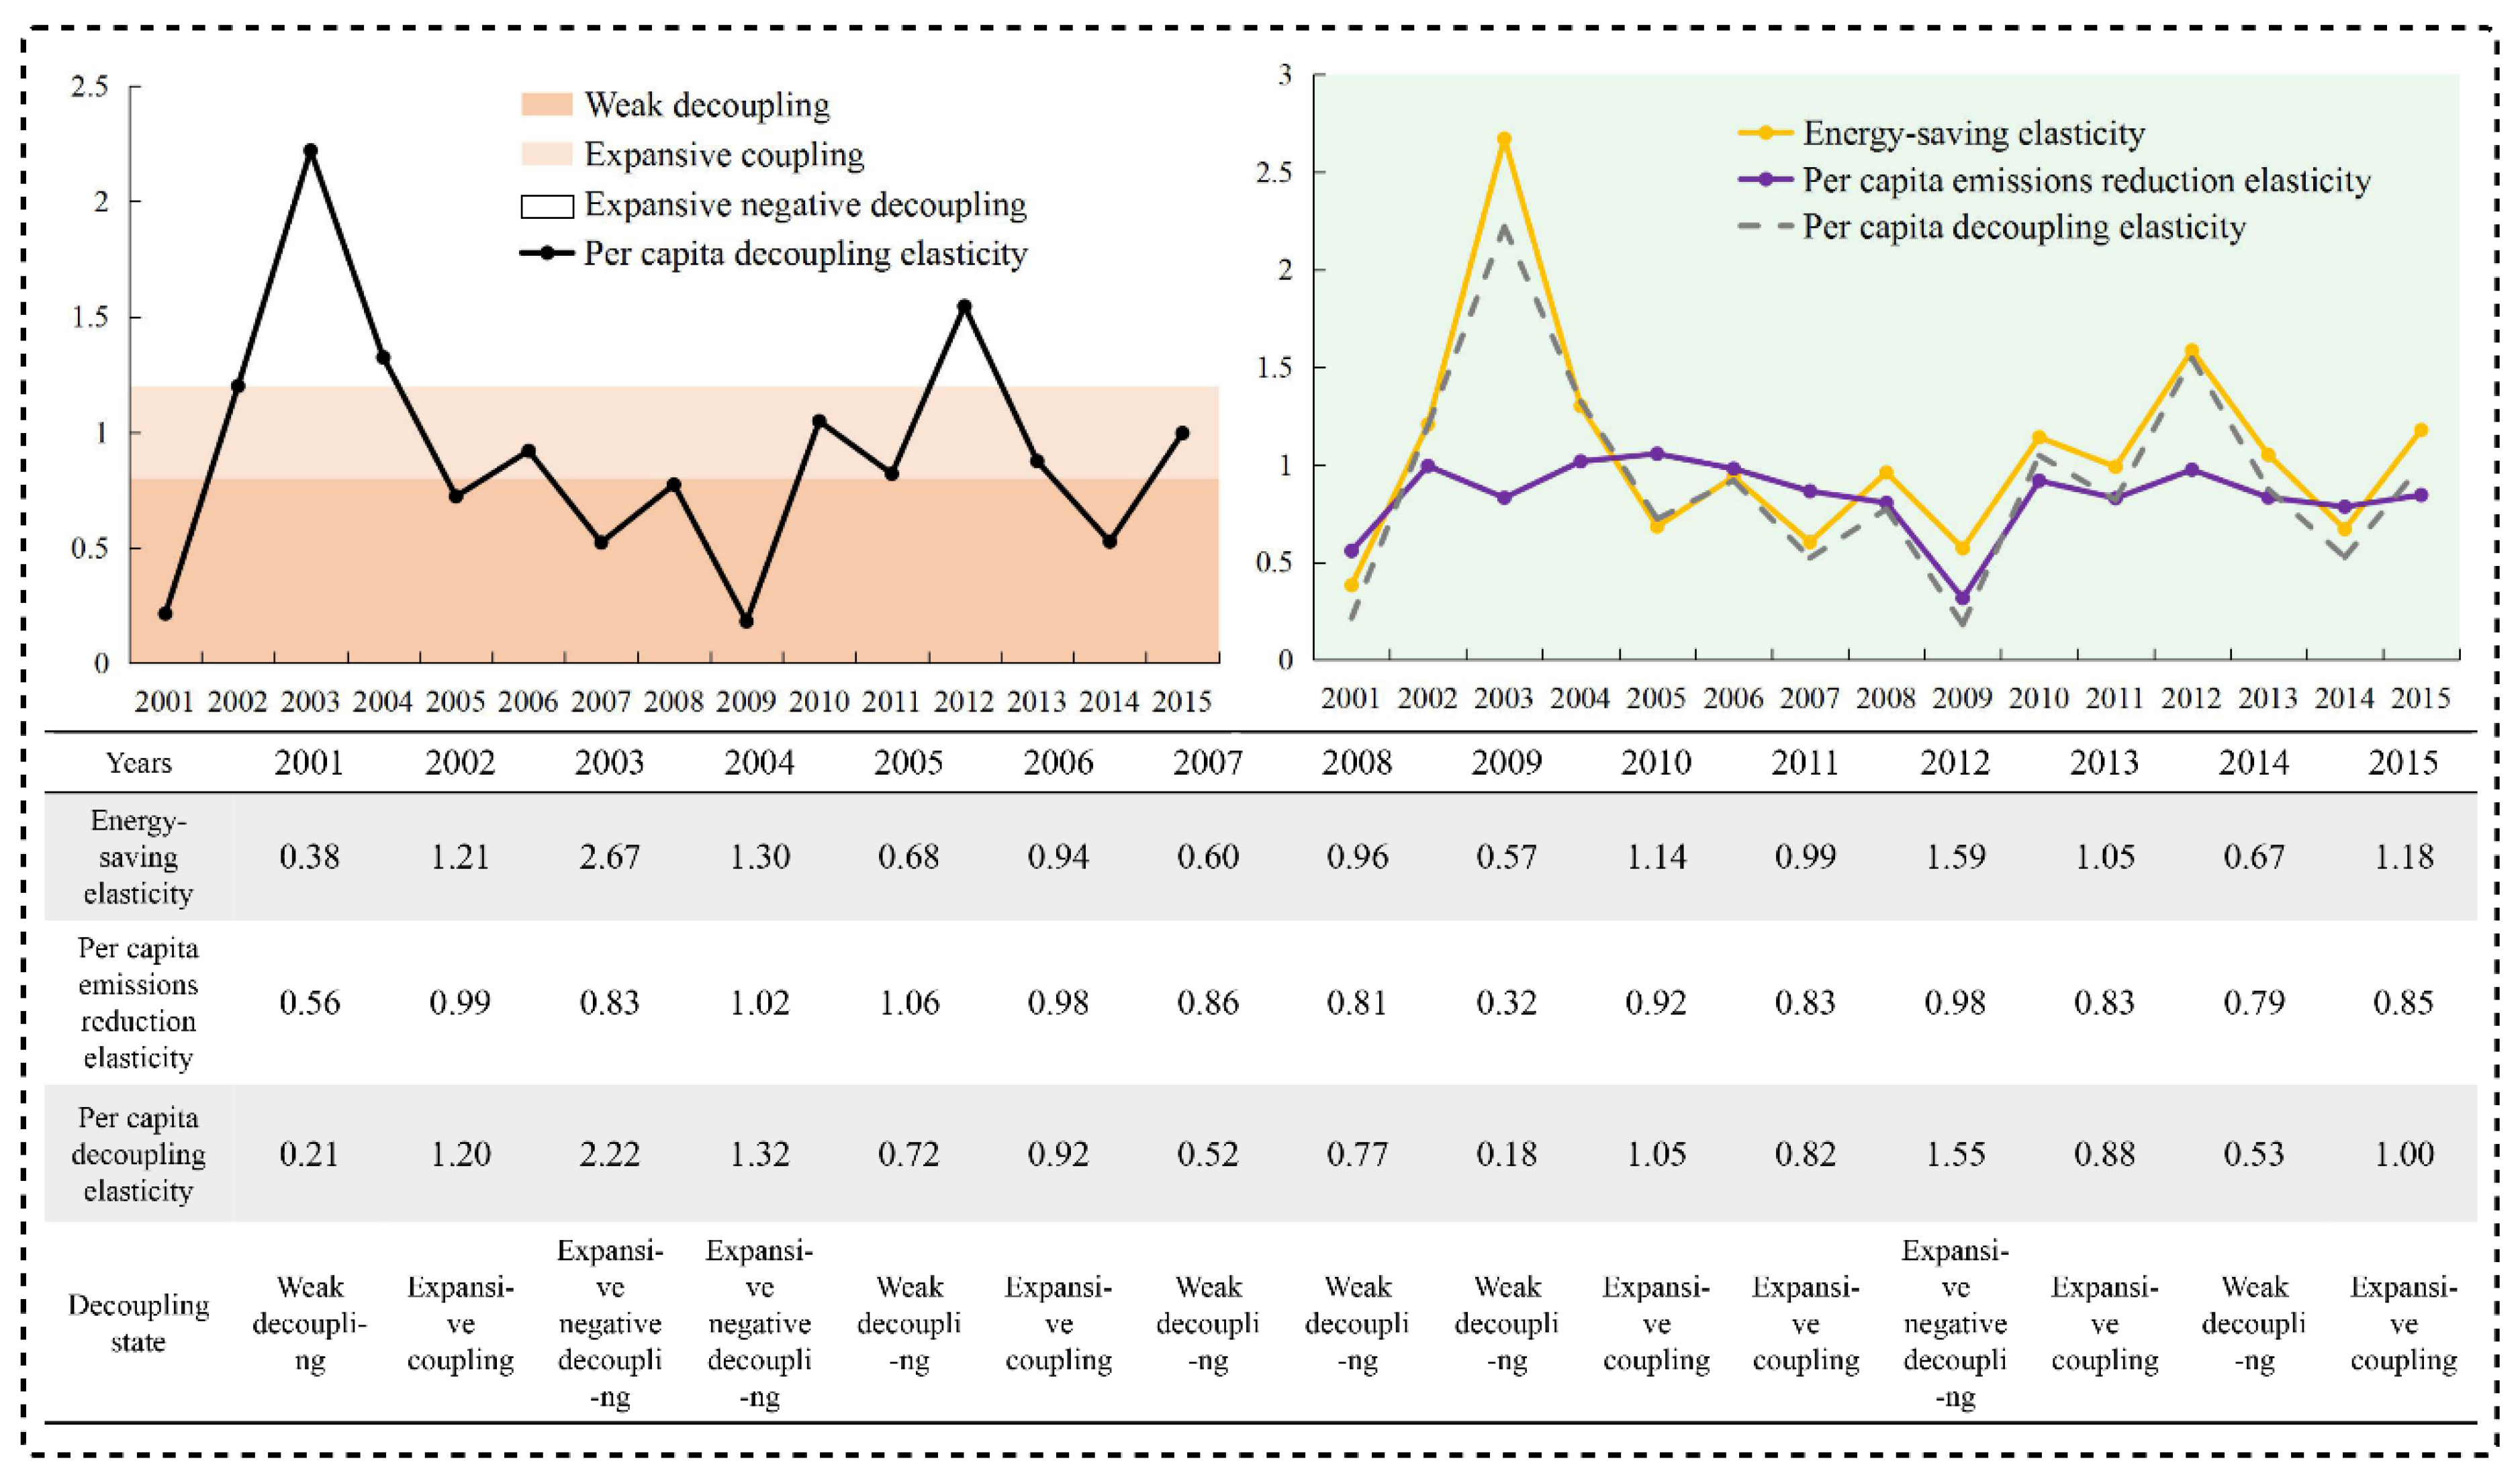
The decoupling state between the development of China’s transportation industry and the carbon emission is poor, and it gradually shows a deteriorating trend after a short period of improvement.
(4)
Per capita decoupling elasticity can reflect the decoupling status between transportation development and carbon emissions more accurately and subtly than the decoupling elasticity of total carbon emissions.
(5)
Compared with the effect of per capita emissions reduction elasticity, energy-saving elasticity plays a more crucial role in decoupling the development of transportation from carbon emissions.

7.2. Policy Suggestions

Based on the above research results, we propose the following policy suggestions:
(1)
Optimize the traffic structure. From the analysis of Figure 2, Figure 3 and Figure 4, the added value of transportation industry is the main factor that promotes increases in carbon emissions, and the expansion of the economic scale also leads to deterioration of the decoupling state. The continuous economic growth has become the bottleneck of low-carbon development in China’s transportation industry, but at the same time it is also the goal of sustainable development of our country and the guarantee of people’s material well-being. Transportation carbon emissions reduction at the expense of economic development is not desirable, but the state can adjust the structure of the transportation industry, optimize the combination of various modes of transportation and the proportion of investment, gradually develop high-tech industries, and rationally plan the construction of low-carbon transportation infrastructure.
(2)
Optimize the energy structure of the transportation industry. From the analysis of Figure 2 and Figure 3, the energy carbon emission intensity is a key factor in reducing carbon emissions. Therefore, the government should focus on the following: optimizing the energy structure of the transportation industry in the future; reducing the consumption of traditional energy, such as petrol and diesel, by adjusting prices and taxes; phasing out the high-energy-consumption and high-emissions transportation vehicles; increasing the investment in the use of clean energy, such as solar energy; and encouraging and promoting the development of new energy sources for transportation.
(3)
Improve the energy efficiency of the transportation industry. Through the analysis of Figure 2, Figure 3 and Figure 4, it can be seen that energy intensity has a decreasing effect on carbon emissions, and energy-saving elasticity plays an important role in decoupling the development of transportation from carbon emissions. Therefore, energy efficiency must be taken seriously. At present, the enhancement of energy efficiency in the transportation industry has a very limited effect on curbing carbon emissions and has not reached a satisfactory level. In the future, there will still be much room for improvement. Increasing energy efficiency plays an important role in decoupling the carbon emissions from the development of transportation and can achieve the effect of reducing carbon emissions in a relatively short period of time rather than optimizing the energy structure. In the future, the government should increase investment in and development of energy-saving technologies, actively develop and promote low-carbon transportation technologies, optimize the transportation system, and enhance the intelligence of transportation to reduce energy consumption.
(4)
Increase public transportation system construction. Through the analysis of Figure 2, Figure 3 and Figure 4, it can be seen that energy consumption is the main factor that promotes carbon emissions, and the large increase in energy consumption also hinders the decoupling process of China’s transportation industry. With the advancing urbanization in China, the problems of the increase in the number of private cars, traffic congestion, slow driving and so on are becoming increasingly prominent. As a result, the demand and consumption of energy continues to increase, leading to more serious carbon emissions in the transportation sector. However, promoting public transportation construction is a fast and effective way to solve this problem. Therefore, the government should give priority to the development of public transportation, accelerate the construction of urban rail transit such as subways and skyrails, and rationally plan bus lanes and bus routes to facilitate citizens’ travel and transfer.
(5)
Enhance citizens’ low-carbon traffic awareness. From Figure 2 and Figure 3, it can be seen that the population size has a positive effect on carbon emissions and the per capita carbon emissions is the main factor that lead to an increase in carbon emissions. Therefore, the population cannot be ignored in the carbon emissions reduction in transportation industry. Although China implements the family planning policy and controls the natural population growth rate, the huge population base still causes the population size to promote an increase in carbon emissions, making citizens’ choices of modes of transportation especially important for reducing carbon emissions. Therefore, the government should step up the publicity of low-carbon traffic, conduct lectures on the theme of low-carbon transportation, hold related art performances, carry out bicycle riding and other activities in schools, work units and communities, broadcast more of these public service advertisements and formulate corresponding incentive measures for citizens’ environmental protection behaviors in different degrees to raise citizens’ awareness of environmental protection and promote citizens’ green travel.
The main conclusions of this paper on the influencing factors and decoupling elasticity of China’s transportation carbon emissions are shown in Table 6.

Author Contributions

Yingchun Zhang was mainly responsible for the writing of the full text; Yong Wang and Yu Zhou conceived and designed the study; Lin Zhu and Fei Zhang built the models of the paper.

Acknowledgments

This paper is supported by Liaoning Economic and Social Development Research Project (2018lslktzd-010), National Natural Science Foundation of China (71573034), Liaoning Social Science Fund (L17CTJ001, L17BJY042), China Postdoctoral Science Foundation special fund (2017T100180), China Postdoctoral Science Foundation(2016M601318) and Research Project of Dongbei University of Finance and Economics (DUFE2017Q16).

Conflicts of Interest

The authors declare no conflict of interest.

References

  1. United Nations Framework Convention on Climate Change. Available online: https://wenku.baidu.com/view/a8aa555271fe910ef02df896.html (accessed on 16 April 2018).
  2. Full Text of the Kyoto Protocol. Available online: https://wenku.baidu.com/view/98fdd2fb941ea76e58fa0402.html?from=search (accessed on 16 April 2018).
  3. The Chinese Version of the Paris Agreement. Available online: https://wenku.baidu.com/view/f9492ef783c4bb4cf6ecd1a9.html (accessed on 15 April 2018).
  4. Wu, Y.; Tan, W.; Shi, Y. China Ranked First in the World in Terms of Carbon Emissions in 2013 or Accelerated the Adjustment of Energy Structure. 2014. Available online: http://www.thepaper.cn/newsDetail_forward_1268328 (accessed on 2 December 2017).
  5. Global Carbon Project. Available online: http://www.globalcarbonatlas.org/en/CO2-emissions (accessed on 10 May 2017).
  6. Notice of the State Council Issuing “Work Plan on Controlling Greenhouse Gas Emission in the Twelfth Five-Year Plan”. Available online: http://www.gov.cn/zwgk/2012-01/13/content_2043645.htm (accessed on 12 November 2017).
  7. State Council Issues “Work Plan on Controlling Greenhouse Gas Emission in the Thirteenth Five-year Plan”. People’s Daily, 5 November 2016.
  8. Notice of the State Council Issuing “Integrated Work Plan on Energy Saving and Emission Reduction in the Thirteenth Five-Year Plan. Available online: http://www.gov.cn/gongbao/content/2017/content_51634 48.htm (accessed on 15 November 2017).
  9. Notice of the State Council Issuing “Integrated Work Plan on Energy Saving and Emission Reduction in the Twelfth Five-Year Plan”. Available online: http://www.gov.cn/zwgk/2011-09/07/content_1941731.htm (accessed on 15 November 2017).
  10. Shen, M.; Chi, X. Analysis on the Driving Factors of the Growth of Carbon Emissions in China’s Transportation Sector. Jianghuai Trib. 2012, 31–38. [Google Scholar] [CrossRef]
  11. Wang, B.; Shao, C.; Ji, X. Influencing Mechanism Analysis of Holiday Activity–travel Patterns on Transportation Energy Consumption and Emissions in China. Energies 2017, 10, 897. [Google Scholar] [CrossRef]
  12. Hao, H.; Liu, F.; Liu, Z.; Zhao, F. Measuring Energy Efficiency in China’s Transport Sector. Energies 2017, 10, 660. [Google Scholar] [CrossRef]
  13. Wei, C.; Ni, J.; Du, L. Regional Allocation of Carbon Dioxide Abatement in China. China Econ. Rev. 2012, 23, 552–565. [Google Scholar] [CrossRef]
  14. Lugauer, S.; Jensen, R.; Sadler, C. An Estimate of the Age Distribution’s Effect on Carbon Dioxide Emissions. Econ. Inq. 2014, 52, 914–929. [Google Scholar] [CrossRef]
  15. Yang, B.; Liu, C.; Su, Y.; Jing, X. The Allocation of Carbon Intensity Reduction Target by 2020 among Industrial Sectors in China. Sustainability 2017, 9, 148. [Google Scholar] [CrossRef]
  16. Zhou, Y. Responsive Relationship between Transportation Carbon Emissions and Traffic Economic Growth—A Practical Study Based on Decoupling & Recoupling Theory and LMDI Decomposition. Collect. Essays Financ. Econ. 2014, 11, 764–765. [Google Scholar]
  17. Sun, J.W. Changes in Energy Consumption and Energy Intensity: A Complete Decomposition Model. Energy Econ. 2004, 20, 85–100. [Google Scholar] [CrossRef]
  18. Rüstemoğlu, H.; Andrés, A.R. Determinants of CO2 Emissions in Brazil and Russia between 1992 and 2011: A Decomposition Analysis. Environ. Sci. Policy 2016, 58, 95–106. [Google Scholar] [CrossRef]
  19. Hatzigeorgiou, E.; Polatidis, H.; Haralambopoulos, D. CO2 Emissions in Greece for 1990–2002: A Decomposition Analysis and Comparison of Results Using the Arithmetic Mean Divisia Index and Logarithmic Mean Divisia Index Techniques. Energy 2008, 33, 492–499. [Google Scholar] [CrossRef]
  20. Ang, B.; Zhang, F. A Survey of Index Decomposition Analysis in Energy and Environmental Studies. Energy 2000, 25, 1149–1176. [Google Scholar] [CrossRef]
  21. Gambhir, A.; Tse, L.K.C.; Tong, D.; Martinez-Botas, R. Reducing China’s Road Transport Sector CO2 Emissions to 2050: Technologies, Costs and Decomposition Analysis. Appl. Energy 2015, 157, 905–917. [Google Scholar] [CrossRef]
  22. M'raihi, R.; Mraihi, T.; Harizi, R.; Bouzidi, M.T. Carbon Emissions Growth and Road Freight: Analysis of the Influencing Factors in Tunisia. Transp. Policy 2015, 42, 121–129. [Google Scholar] [CrossRef]
  23. Shi, L.; Sun, J.; Lin, J.; Zhao, Y. Factor Decomposition of Carbon Emissions in Chinese Megacities. J. Environ. Sci. 2018. [Google Scholar] [CrossRef]
  24. Du, Z.; Lin, B. Analysis of Carbon Emissions Reduction of China’s Metallurgical Industry. J. Clean. Prod. 2017, 176, 1177–1184. [Google Scholar] [CrossRef]
  25. Ma, L.; Chong, C.; Zhang, X.; Liu, P.; Li, W.; Li, Z.; Ni, W. LMDI Decomposition of Energy-related CO2 Emissions Based on Energy and CO2 Allocation Sankey Diagrams: The Method and an Application to China. Sustainability 2018, 10, 344. [Google Scholar] [CrossRef]
  26. Wang, F.; Wang, C.; Su, Y.; Jin, L.; Wang, Y.; Zhang, X. Decomposition Analysis of Carbon Emission Factors from Energy Consumption in Guangdong Province from 1990 to 2014. Sustainability 2017, 9, 274. [Google Scholar] [CrossRef]
  27. De freitas, L.C.; Kaneko, S. Decomposition of CO2 Emissions Change from Energy Consumption in Brazil: Challenges and Policy Implications. Energy Policy 2011, 39, 1495–1504. [Google Scholar] [CrossRef]
  28. Kharbach, M.; Chfadi, T. CO2 Emissions in Moroccan Road Transport Sector: Divisia, Cointegration, and EKC Analyses. Sustain. Cities Soc. 2017, 35, 396–401. [Google Scholar] [CrossRef]
  29. Zhu, X.; Li, R. An Analysis of Decoupling and Influencing Factors of Carbon Emissions from the Transportation Sector in the Beijing-Tianjin-Hebei Area, China. Sustainability 2017, 9, 722. [Google Scholar] [CrossRef]
  30. Zhang, M.; Mu, H. Research on the Change of Motorized Passenger Transport Energy Consumption in Selected Chinese Cities Based on LMDI Method. Acta Sci. Nat. Univ. Pekin. 2010, 46, 483–486. [Google Scholar]
  31. Zhou, Y.; Liu, W. Decoupling Elasticity and Driving Factors Analysis between the Relationship of Transportation Carbon Emissions and Economic Growth. J. Guangxi Univ. Financ. Econ. 2015, 28, 28–35. [Google Scholar]
  32. Vaninsky, A. Factorial Decomposition of CO2 Emissions: A Generalized Divisia Index Approach. Energy Econ. 2014, 45, 389–400. [Google Scholar] [CrossRef]
  33. Shao, S.; Zhang, X.; Zhao, X. Empirical Decomposition and Peaking Pathway of Carbon Dioxide Emissions of China’s Manufacturing Sector—Generalized Divisia Index Method and Dynamic Scenario Analysis. Chin. Ind. Econ. 2017, 34, 44–63. [Google Scholar]
  34. Shao, S.; Liu, J.; Geng, Y.; Yang, Y. Uncovering Driving Factors of Carbon Emissions from China’s Mining Sector. Appl. Energy 2016, 166, 220–238. [Google Scholar] [CrossRef]
  35. Li, Z.; Qing, D. An Empirical Study of Decoupling Economic Growth from Carbon Dioxide—A Case Study of Shanxi Province. Fujian Trib. 2010, 30, 67–72. [Google Scholar]
  36. Yang, R.; Chang, X. Decoupling and Driving Factors Analysis between the Relationship of Carbon Emissions and Economic Growth in Western Region. Econ. Geogr. 2012, 32, 34–39. [Google Scholar]
  37. Wu, Y.; Zhu, Q.; Zhu, B. Decoupling Analysis of World Economic Growth and CO2 Emissions: A Study Comparing Developed and Developing Countries. J. Clean. Prod. 2018, 190, 94–103. [Google Scholar] [CrossRef]
  38. Lin, B.; Liu, K. Using LMDI to Analyze the Decoupling of Carbon Dioxide Emissions from China’s Heavy Industry. Sustainability 2017, 9, 1198. [Google Scholar]
  39. Diakoulaki, D.; Mandaraka, M. Decomposition Analysis for Assessing the Progress in Decoupling Industrial Growth from CO2 Emissions in the Eu Manufacturing Sector. Energy Econ. 2007, 29, 636–664. [Google Scholar] [CrossRef]
  40. Li, R.; Jiang, R. Moving Low-carbon Construction Industry in Jiangsu Province: Evidence from Decomposition and Decoupling Models. Sustainability 2017, 9, 1013. [Google Scholar]
  41. Román, R.; Cansino, J.M.; Botia, C. How Far Is Colombia from Decoupling? Two-level Decomposition Analysis of Energy Consumption Changes. Energy 2018, 148, 687–700. [Google Scholar] [CrossRef]
  42. Freitas, L.C.D.; Kaneko, S. Decomposing the Decoupling of CO2 Emissions and Economic Growth in Brazil. Ecol. Econ. 2011, 70, 1459–1469. [Google Scholar] [CrossRef]
  43. Grand, M.C. Carbon Emission Targets and Decoupling Indicators. Ecol. Indic. 2016, 67, 649–656. [Google Scholar] [CrossRef]
  44. Roinioti, A.; Koroneos, C. The Decomposition of CO2 Emissions from Energy Use in Greece Before and During the Economic Crisis and Their Decoupling from Economic Growth. Renew. Sustain. Energy Rev. 2017, 76, 448–459. [Google Scholar] [CrossRef]
  45. Wang, Q.; Li, R.; Jiang, R. Decoupling and Decomposition Analysis of Carbon Emissions from Industry: A Case Study from China. Sustainability 2016, 8, 1059. [Google Scholar] [CrossRef]
  46. Hu, J.; Gui, S.; Zhang, W. Decoupling Analysis of China’s Product Sector Output and Its Embodied Carbon Emissions—An Empirical Study Based on Non-competitive I-O and Tapio Decoupling Model. Sustainability 2017, 9, 815. [Google Scholar] [CrossRef]
  47. Wan, L.; Wang, Z.L.; Ng, J. Measurement Research on the Decoupling Effect of Industries’ Carbon Emissions—Based on the Equipment Manufacturing Industry in China. Energies 2016, 9, 921. [Google Scholar] [CrossRef]
  48. Tapio, P. Towards a Theory of Decoupling: Degrees of Decoupling in the Eu and the Case of Road Traffic in Finland between 1970 and 2001. Transp. Policy 2005, 12, 137–151. [Google Scholar] [CrossRef]
  49. Gray, D.; Anable, J.; Illingworth, L.; Graham, W. Decoupling the Link between Economic Growth, Transport Growth and Carbon Emissions in Scotland. Available online: http://www.gov.scot/Resource/Doc/935/0042647.pdf (accessed on 7 October 2017).
  50. Loo, B.P.Y.; Banister, D. Decoupling Transport from Economic Growth: Extending the Debate to Include Environmental and Social Externalities. J. Transp. Geogr. 2016, 57, 134–144. [Google Scholar] [CrossRef]
  51. Zhao, Y.; Kuang, Y.; Huang, N. Decomposition Analysis in Decoupling Transport Output from Carbon Emissions in Guangdong Province, China. Energies 2016, 9, 295. [Google Scholar] [CrossRef]
  52. Liu, X.; Sun, L.; Sun, Q. Decoupling Between China and Provincial Economic Growth and Carbon Emissions from Transport. J. Shandong Univ. Sci. Technol. 2016, 18, 47–54. [Google Scholar]
  53. Timilsina, G.R.; Shrestha, A. Factors Affecting Transport Sector CO2 Emissions Growth in Latin American and Caribbean Countries: A LMDI Decomposition Analysis. Int. J. Energy Res. 2009, 33, 396–414. [Google Scholar] [CrossRef]
  54. Wu, L.; Kaneko, S.; Matsuoka, S. Driving Forces behind the Stagnancy of China’s Energy-related CO2 Emissions from 1996 to 1999: The Relative Importance of Structural Change, Intensity Change and Scale Change. Energy Policy 2005, 33, 319–335. [Google Scholar] [CrossRef]
  55. Guo, S. Study on Decoupling and Emission Peak of China Industry. Ind. Econ. Rev. 2017, 4, 1–13. [Google Scholar]
  56. Tang, Z.; Shang, J.; Shi, C.; Liu, Z.; Bi, K. Decoupling Indicators of CO2 Emissions from the Tourism Industry in China: 1990–2012. Ecol. Indic. 2014, 46, 390–397. [Google Scholar] [CrossRef]
  57. Zhou, Y. Study on the Decoupling and Coupling Relationship between Transportation Carbon Emissions and Industrial Economic Growth: Based on Tapio Decoupling Model and Cointegration Theory. Inquiry Econ. Issues 2016, 37, 41–48. [Google Scholar]
  58. Industrial Classification for National Economic Activities of 2017. Available online: http://www.stats.gov.cn/tjsj/tjbz/hyflbz/201710/t20171012_1541679.html (accessed on 9 October 2017).
  59. Wang, Y.F.; Li, K.P.; Xu, X.M.; Zhang, Y.R. Transport Energy Consumption and Saving in China. Renew. Sustain. Energy Rev. 2014, 29, 641–655. [Google Scholar] [CrossRef]
  60. Department of Energy Statitics, National Bureau of Statitics, People’s Republic of China. China Energy Statistical Yearbook. 2000–2015. Available online: http://www.doc88.com/p-0911392153730.html (accessed on 13 November 2017).
  61. Cai, B. A Study on City Greenhouse Gas Emissions Inventory. Adv. Clim. Chang. Res. 2011, 7, 23–28. [Google Scholar]
  62. Intergovernmental Panel on Climate Change (IPCC). 2006 IPCC Guidelines for National Greenhouse Gas Inventories; Institute for Global Environmental Strategy: Kanagawa, Japan, 2006.
  63. National Bureau of Statistics of People’s Republic of China. China Statistical Yearbook. 2000–2015. Available online: http://www.stats.gov.cn/tjsj/ndsj/2016/indexch.htm (accessed on 13 November 2017).
  64. Li, H.; Wang, L.; Zhang, F. Core Conception of the Modern Circular Economy in China: The Notion of Decoupling and Its Measurement. Chin. Soft Sci. 2007, 43–48. [Google Scholar] [CrossRef]
  65. Jiang, R.; Zhou, Y.; Li, R. Moving to a Low-carbon Economy in China: Decoupling and Decomposition Analysis of Emission and Economy from a Sector Perspective. Sustainability 2018, 10, 978. [Google Scholar] [CrossRef]
  66. Wu, W.; Cao, Y.; Liang, S.; Xiao, C. Study on Dynamics of Freight Volume in the Yangtze River Delta since the Mid-1980s. Resour. Environ. Yangtze Basin 2011, 20, 843–847. [Google Scholar]
  67. Alises, A.; Vassallo, J.M.; Guzmán, A.F. Road Freight Transport Decoupling: A Comparative Analysis between the United Kingdom and Spain. Transp. Policy 2014, 32, 186–193. [Google Scholar] [CrossRef]
Figure 1. The summary of research methods and models.
Energies 11 01157 g001
Figure 2. Staged factor decomposition results of the evolution of transportation carbon emissions.
Energies 11 01157 g002
Figure 3. Cumulative contribution of drivers of changes in carbon emissions in transportation.
Energies 11 01157 g003
Figure 4. The decoupling of carbon emissions from transportation development and the trend of decoupling elasticity.
Energies 11 01157 g004
Table 1. Representative studies on the influencing factors of carbon emissions and the decoupling from economic development.
Research TopicsStudy AuthorsResearch ContentResearch MethodsResearch ProcessInsufficient Research
Carbon emission factor analysisTimilsina et al. [53]Factors affecting carbon emissions in the transportation sector in some countriesLMDI decomposition methodStudying the main influencing factors of carbon emissions in Latin America and the Caribbean countries, such as population growth, energy intensity, and energy structure and so on.Taking some developing countries as their research subjects cannot completely explain the impact of urbanization and other factors on the transportation industry and has little reference to other countries.
Wu et al. [54]Evolution of carbon emissions in China and its driving factorsThree complete decomposition methodsA study is conducted on China’s energy-related changes in carbon emissions from 1996–1999 and their influencing factors. The results show that energy intensity, the number of motor vehicles and the average distance traveled are the driving forces behind the growth of carbon emissions in transportation.Consideration of the impact factors of transportation carbon emissions is relatively shallow, does not explain the impact of population growth and economic growth, and cannot truly reflect the drivers of transportation carbon emissions.
M’raihi et al.The driving factors of carbon emissions changes from road freight transportation in TunisiaLMDI decomposition methodThis paper decomposes the carbon emissions changes from road freight transportation in Tunisia into five kinds of factors from 1990 to 2006. The results show that economic growth and average petroleum emissions are the main driving factors.Due to the inherent flaw in the LMDI decomposition method used, it is limited in the selection of factors and only includes the absolute GDP, which leads to some important factors not being considered.
The decoupling relationship between carbon emissions and economic developmentGuo Shiyi [55]The decoupling of carbon emissions from industrial economic growthIGT decoupling index modelBased on the IGT decoupling index, the paper studies the relationship between industrial economic growth and carbon emissions in China from 2000 to 2014. The results show that China’s industry is in a period of transition from “relative decoupling” to “absolute decoupling”.Although the unique advantage of the IGT model is the ability to quantitatively analyze the relationship between economic growth and environmental loading, the Tapio decoupling model provides a more detailed breakdown of decoupling types and is more appropriate for the current context of decoupling carbon emissions from industrial economies.
Tang et al. [56]Decoupling indicators of carbon emissions from the tourism industry in ChinaTapio decoupling modelThis paper explores the decoupling effects between tourism-related carbon emissions and the tourism economy from 1990 to 2012. The results show that the decoupling state is very complicated and alternates between negative decoupling and weak decoupling.The decoupling elasticity is not further decomposed, leading to a shallow analysis of the decoupling situation, and the study fails to analyze in more detail the specific reasons for the decoupling of tourism carbon emissions.
Zhou Yinxiang [57]The decoupling and coupling relationship between traffic carbon emissions and industrial economic growthTapio decoupling modelThis paper measures the decoupling relationship between China’s transportation carbon emissions and industrial economic growth from 1990 to 2013 and the trends of their evolution, and it constructs the causal chain to further analyze the influencing factors and mechanism of action. The results show that the decoupling status is not ideal and that the decoupling depends mainly on the traffic energy-saving elasticity.In the decoupling model, the total amount of carbon emissions in the transportation industry is taken into account without taking into account the differences among individuals, making the analysis not meticulous.
Table 2. Comparison of typical factor decomposition methods.
MethodsFeatures
Structural decomposition methodIt is based on an input-output model, which has higher requirements on data, and the decomposition result can only be an additive form. So it’s not convenient to analyze in practice [20].
Laspeyres decomposition methodWhen the number of influencing factors exceeds 3, the calculation process becomes complicated.
AMDI methodThe model contains residuals; it cannot be used when there are zero values in the data.
LMDI methodThe result of decomposition depends on the interdependence of factors and the choice of factors is limited.
GDIMIt breaks the formal interdependence of various influencing factors and makes the results more comprehensive and accurate.
Table 3. Division of the decoupling of transportation development from carbon emissions.
Decoupling State % Δ ( C O 2 / P ) % Δ G D P t Per Capita Decoupling ElasticityMeaning
Strong decoupling-+(−∞,0)Economic growth, decreasing carbon emissions
Weak decoupling++[0,0.8)Economic growth, increased carbon emissions, carbon emissions increased less than the rate of economic growth
Recessive decoupling--(1.2, +∞)Economic recession, carbon emissions decreasing, but the decrease in carbon emissions is greater than the economic recession
Strong negative decoupling+-(−∞,0)Economic recession, carbon emissions increase
Weak negative decoupling--[0,0.8)Economic recession, carbon emissions decrease, but the decrease in carbon emissions is less than the magnitude of economic recession
Expansive negative decoupling++(1.2, +∞)Economic growth, increased carbon emissions, carbon emissions increased more than economic growth
Expansive coupling++[0.8,1.2]Economic growth, increased carbon emissions, the increase in carbon emissions is greater than or equal to the economic growth rate
Recessive coupling--[0.8,1.2]Economic recession, carbon emissions decrease, carbon emissions are less than or equal to the magnitude of economic recession
Table 4. Comparison of the results of driving factors. Unit: 104 tons
YearsEnergy Carbon Emission Intensity EffectEnergy Intensity EffectPopulation Size Effect
Comparative LiteratureThis ArticleComparative LiteratureThis ArticleComparative LiteratureThis Article
2001−163.28−54.03−1124.04−5.76150.5748.38
2002157.6744.81−233.32−1.60146.2447.57
2003−505.51−146.471916.89−45.10149.2049.37
2004131.5183.39843.15−13.73168.3055.50
2005449.20111.62−206.91−1.18194.3764.37
20063.1643.59108.760.63193.5763.09
200717.09−51.12−1291.05−4.26207.0966.69
2008−412.6−110.16−1186.170.28215.3770.43
2009−213.71−119.30−335.39−0.75212.7770.68
2010−112.07−48.33101.38−3.37222.6572.27
2011−387.76−172.46−187.740.17243.0879.12
2012258.2750.141793.08−15.28275.9789.92
Table 5. Comparison of research results of the decoupling state.
YearsDecoupling State
Comparative LiteratureThis Article
2001Weak decouplingWeak decoupling
2002Expansive couplingExpansive coupling
2003Expansive negative decouplingExpansive negative decoupling
2004Expansive negative decouplingExpansive negative decoupling
2005Expansive couplingWeak decoupling
2006Expansive couplingExpansive coupling
2007Weak decouplingWeak decoupling
2008Weak decouplingWeak decoupling
2009Weak decouplingWeak decoupling
2010Expansive couplingExpansive coupling
2011Weak decouplingExpansive coupling
2012Expansive negative decouplingExpansive negative decoupling
2013Expansive negative decouplingExpansive coupling
Table 6. Main conclusions of this paper.
Research TopicsFactorsContribution to Carbon Emissions (104 tons)Cumulative Contribution to Carbon Emissions (104 tons)Character
2000–20052005–20102010–2015
Decomposition of influencing factors—GDIMAdded value of transportation industry4588.326122.686633.09Increasing from 6,137,100 tons in 2001 to 161,496,400 tons in 2015The primary increasing factor
Carbon intensity of added value487.99−895.6546.00Reducing a total of 3.5895 million tons of carbon emissions in 2000-2015The more volatile decreasing factor
Energy consumption4786.974803.626738.01Increasing from 2,336,700 tons in 2001 to 162,401,800 tons in 2015The primary increasing factor
Energy carbon emission intensity−8.02−261.17−376.08The decreasing effect growing rapidly from 783,600 tons in 2008 to 6.3401 million tons in 2015The main decreasing factors
Population size249.18312.57436.35Cumulative resulting in 10,892,500 tons of carbon emissions by 2015The relatively weak increasing factor
Per capita carbon emissions in the transportation industry5090.324747.346370.25Maintaining its rapid growth at an average annual rate of 39.78%The important increasing factor
Per capita added value of transportation−1088.61−1216.04−1070.08The decreasing effect increasing from 200,100 tons in 2001 to 6.4745 million tons in 2015The main decreasing factors
Energy intensity−46.7418.69−22.96Reducing 934,300 tons of carbon emissions cumulatively by 2015The small decreasing factor
Decoupling elasticity—Improved Tapio causal Chain Situation
Decoupling stateThe years 2001-2004 were a period of deterioration; 2005-2009 was a period of improvement, and 2010-2015 was a period of slight deterioration.
Per capita decoupling elasticityIt increased sharply from 0.21 in 2001 to 2.22 in 2003. After a period of fluctuation, it reached 1.00 in 2015.
Per capita emissions reduction elasticityIt fluctuated relatively more in 2008-2010, but it tended to be stable in general.
Energy-saving elasticityIts volatility is relatively large, the trends of it and per capita decoupling elasticity are almost the same, and it plays a more crucial role in decoupling the development of transportation from carbon emissions.

