Article

Peukert-Equation-Based State-of-Charge Estimation for LiFePO4 Batteries Considering the Battery Thermal Evolution Effect

1
School of Astronautics, Harbin Institute of Technology, Harbin 150001, China
2
Department of Mechanical Engineering, Harbin Institute of Technology at Weihai, Weihai 264209, China
*
Author to whom correspondence should be addressed.
Energies 2018, 11(5), 1112; https://doi.org/10.3390/en11051112
Submission received: 16 April 2018 / Revised: 26 April 2018 / Accepted: 27 April 2018 / Published: 1 May 2018

Abstract

:
To achieve accurate state-of-charge (SoC) estimation for LiFePO4 (lithium iron phosphate) batteries under harsh conditions, this paper resorts to the Peukert’s law to accommodate different temperatures and load excitations. By analyzing battery heat generation and dissipation, a thermal evolution model (TEM) is elaborated and exploited for on-line parameter identification of the equivalent circuit model (ECM). Then, a SoC estimation framework is proposed based on the Adaptive Extended Kalman Filter (AEKF) algorithm. Experimental results on a LiFePO4 pack subject to the Federal Urban Driving Schedule (FUDS) profile under different temperatures and initial states suggest that the proposed SoC estimator provides good robustness and accuracy against changing temperature and highly dynamic loads.

Graphical Abstract

1. Introduction

Since lithium-ion batteries are extensively utilized in electric vehicles (EVs) [1], battery state-of-charge (SoC) is indispensable as the indicator of residual mileage. Importantly, accurate SoC can prevent these batteries from over-charge and over-discharge, which may lead to irreversible damage to battery internal structures [2].
Generally, the SoC can be inferred by the real-time open-circuit voltage (OCV) from off-line calibrated OCV–SoC correlations. However, the flatness of the OCV plateau and the hysteresis gap, especially pronounced for LiFePO4 batteries (LFPBs) [3], makes OCV-based methods unsuitable for the pursuit of SoC [4]. Though battery internal resistance manifests some relevance with the SoC, their irregular relationship is unreliable for SoC estimation [5]. Suffering from the incapability of initial SoC determination and increasingly accumulated error, the coulomb counting method cannot give accurate results without auxiliary correction techniques [5]. Based on machine learning techniques, such as artificial neural networks [6], fuzzy logic [7], and support vector machines [8], battery nonlinear characteristics can be reconstructed. However, these methods are heavily reliant on abundant high-quality training data and the performance is sensitive to external disturbances. Accounting for a large proportion of documented methods, equivalent battery models (ECMs) with explicit physical meanings have been validated for SoC estimation [9]. ECMs emulate the battery through an assembly of electrical components [10]. The relationships between battery internal states and external quantities can be conveniently translated to mathematical expressions and combined with algorithms, such as Kalman filters [11,12,13,14].
In EV applications, the battery usually experiences wide ranges of temperature and is driven by dynamic load currents. Since temperature and discharge rate characterize remarkable impacts on battery available capacity, they are non-negligible considerations for accurate SoC estimation.
To capture the rate-dependence of capacity, the Peukert’s law is introduced to formulate the discharge capacity as a function of current density
C p = I p c t
where C p is the Peukert capacity (constant for a given battery and temperature), I is the constant discharge current, t is the available discharge time, and p c is the Peukert coefficient [15,16,17]. Through only two discharge tests, the coefficients of C p and p c can be identified. Note that, since C p and p c exhibit significant differences at different temperatures, the correlations of C p T (temperature) and p c T need to be calibrated by a series of tests before being employed for practical applications.
From Equation (1), the actual capacity at a specified rate can be transformed as:
C n = C p · I 1 p c ,
where C n = I t . Accordingly, the SoC variation can be governed by
SoC k + 1 = SoC k η i L Δ t C n ,
where Δ t is the sampling interval, k is the step index, i L is the instantaneous current during Δ t (>0 for discharge and <0 for charge), and C n is the real-time capacity from Equation (2). Through the above transformation, both the factors of temperature and current rate have been taken into account.
This paper is arranged as follows. Section 2 introduces the testing equipment, investigated battery, and characteristic tests. In Section 3, we present the employed ECM, fit the OCV SoC T correlation, and elucidate the formulation of the thermal evolution model (TEM). Section 4 designs an online ECM parameterization approach using the simulated battery terminal voltage and battery temperature. Subsequently, the Adaptive Extended Kalman Filter (AEKF)-based SoC estimation scheme is constructed. In contrast to the coulomb counting method, experimental verifications of the proposed estimator under complex conditions are demonstrated in Section 5. Finally, Section 6 summarizes this paper.

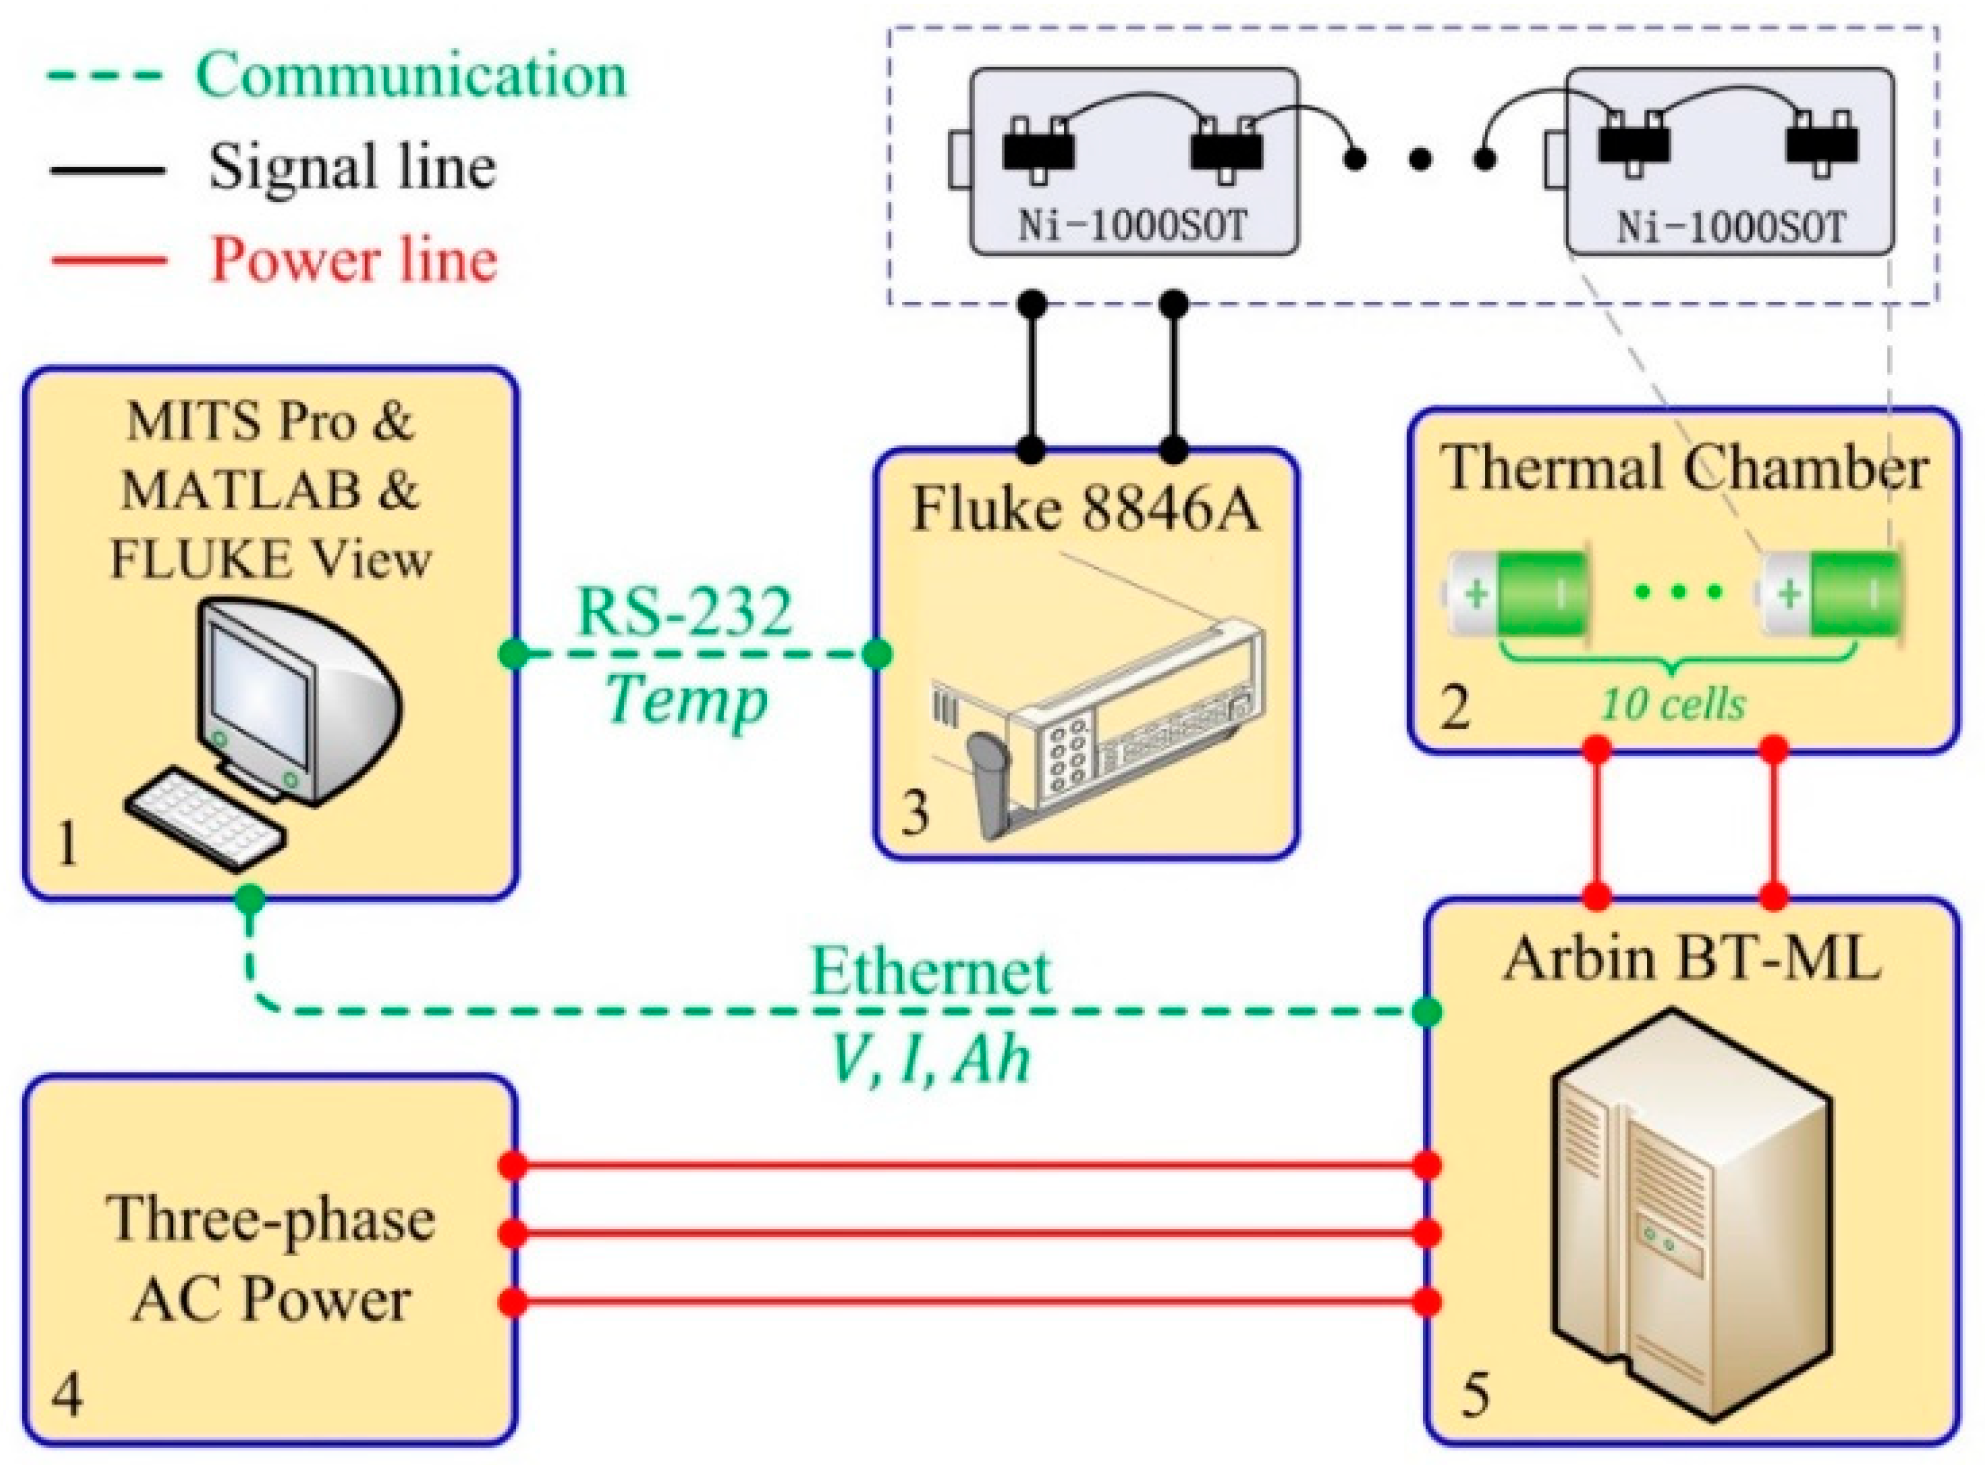
2. Equipment and Tests

As Figure 1 shows, the test bench consists of a battery cycler BT-ML (Arbin, College Station, TA, USA, 40V/20A, 0.02% FS), a thermal chamber, a multimeter 8846A (Fluke, Everett, Washington, DC, USA, 6.5-digit resolution), and an estimation algorithm run on a personal computer (PC). The ECM-based estimation algorithm can be easily realized in the Matlab environment using the Simulink function blocks. The accompanying software MITS Pro 4.0 and FLUKE View v4.5.2 are also installed on the PC. Table 1 lists the specifications of the investigated cell. Ten cells are connected in series as a pack, which is studied as a whole and referred to as the ‘battery’ below.
A temperature-sensing device was elaborated using 20 series-connected Nickel-film resistors (Ni-1000SOTs, Measurement Specialties, Schaffhausen, Switzerland), which have a sensitive Temperature Coefficient of Resistance (nominal 6178 ppm/K). The plastic coats of the cells were stripped, and every cell has two Ni-1000SOTs adhered on the surface. The total resistance was measured by the multimeter and decoded as temperature with a resolution of 0.01 °C.
Prior to every test, the battery was soaked in the thermal chamber at the specified temperature for 2 h to reach the stable thermal state. During the tests, battery temperature was held within the range of ±2 °C deviated from the specified one, and once the deviation exceeded 2 °C, the procedure was suspended for 20 min before proceeding with further testing. The test procedure was terminated when prescribed operational limitations were exceeded; for example, the voltage and temperature limits listed in Table 1. The sampling interval is Δ t = 1   s . Aging is outside the scope of this paper, and all tests were conducted at a specific aging level.

2.1. OCV–SoC Correlation Test

A sequence of consecutive (dis)charge pulses were performed to draw the respective OCV–SoC curves in monotonic charge and discharge processes [18]. To explore the dependence of OCV–SoC on temperature, the calibration tests were carried out at six temperatures of 0, 10, 20, 30, 40, and 50 °C, respectively. As a result, six pairs of OCV–SoC curves were attained. Then, the actual OCV–SoC correlation is approximated as the average between the charge curve and discharge curve [13] as Equation (4) defines.
U o c ( z , T ) = ( U o c c h ( z , T ) + U o c d c ( z , T ) ) / 2 ,
where z is shorthand for SoC, T is the battery temperature, and U o c c h ( S o C , T ) and U o c d c ( S o C , T ) are the OCV–SoC curves in charge and discharge processes, respectively. The resultant correlations can be found in Figure 2.

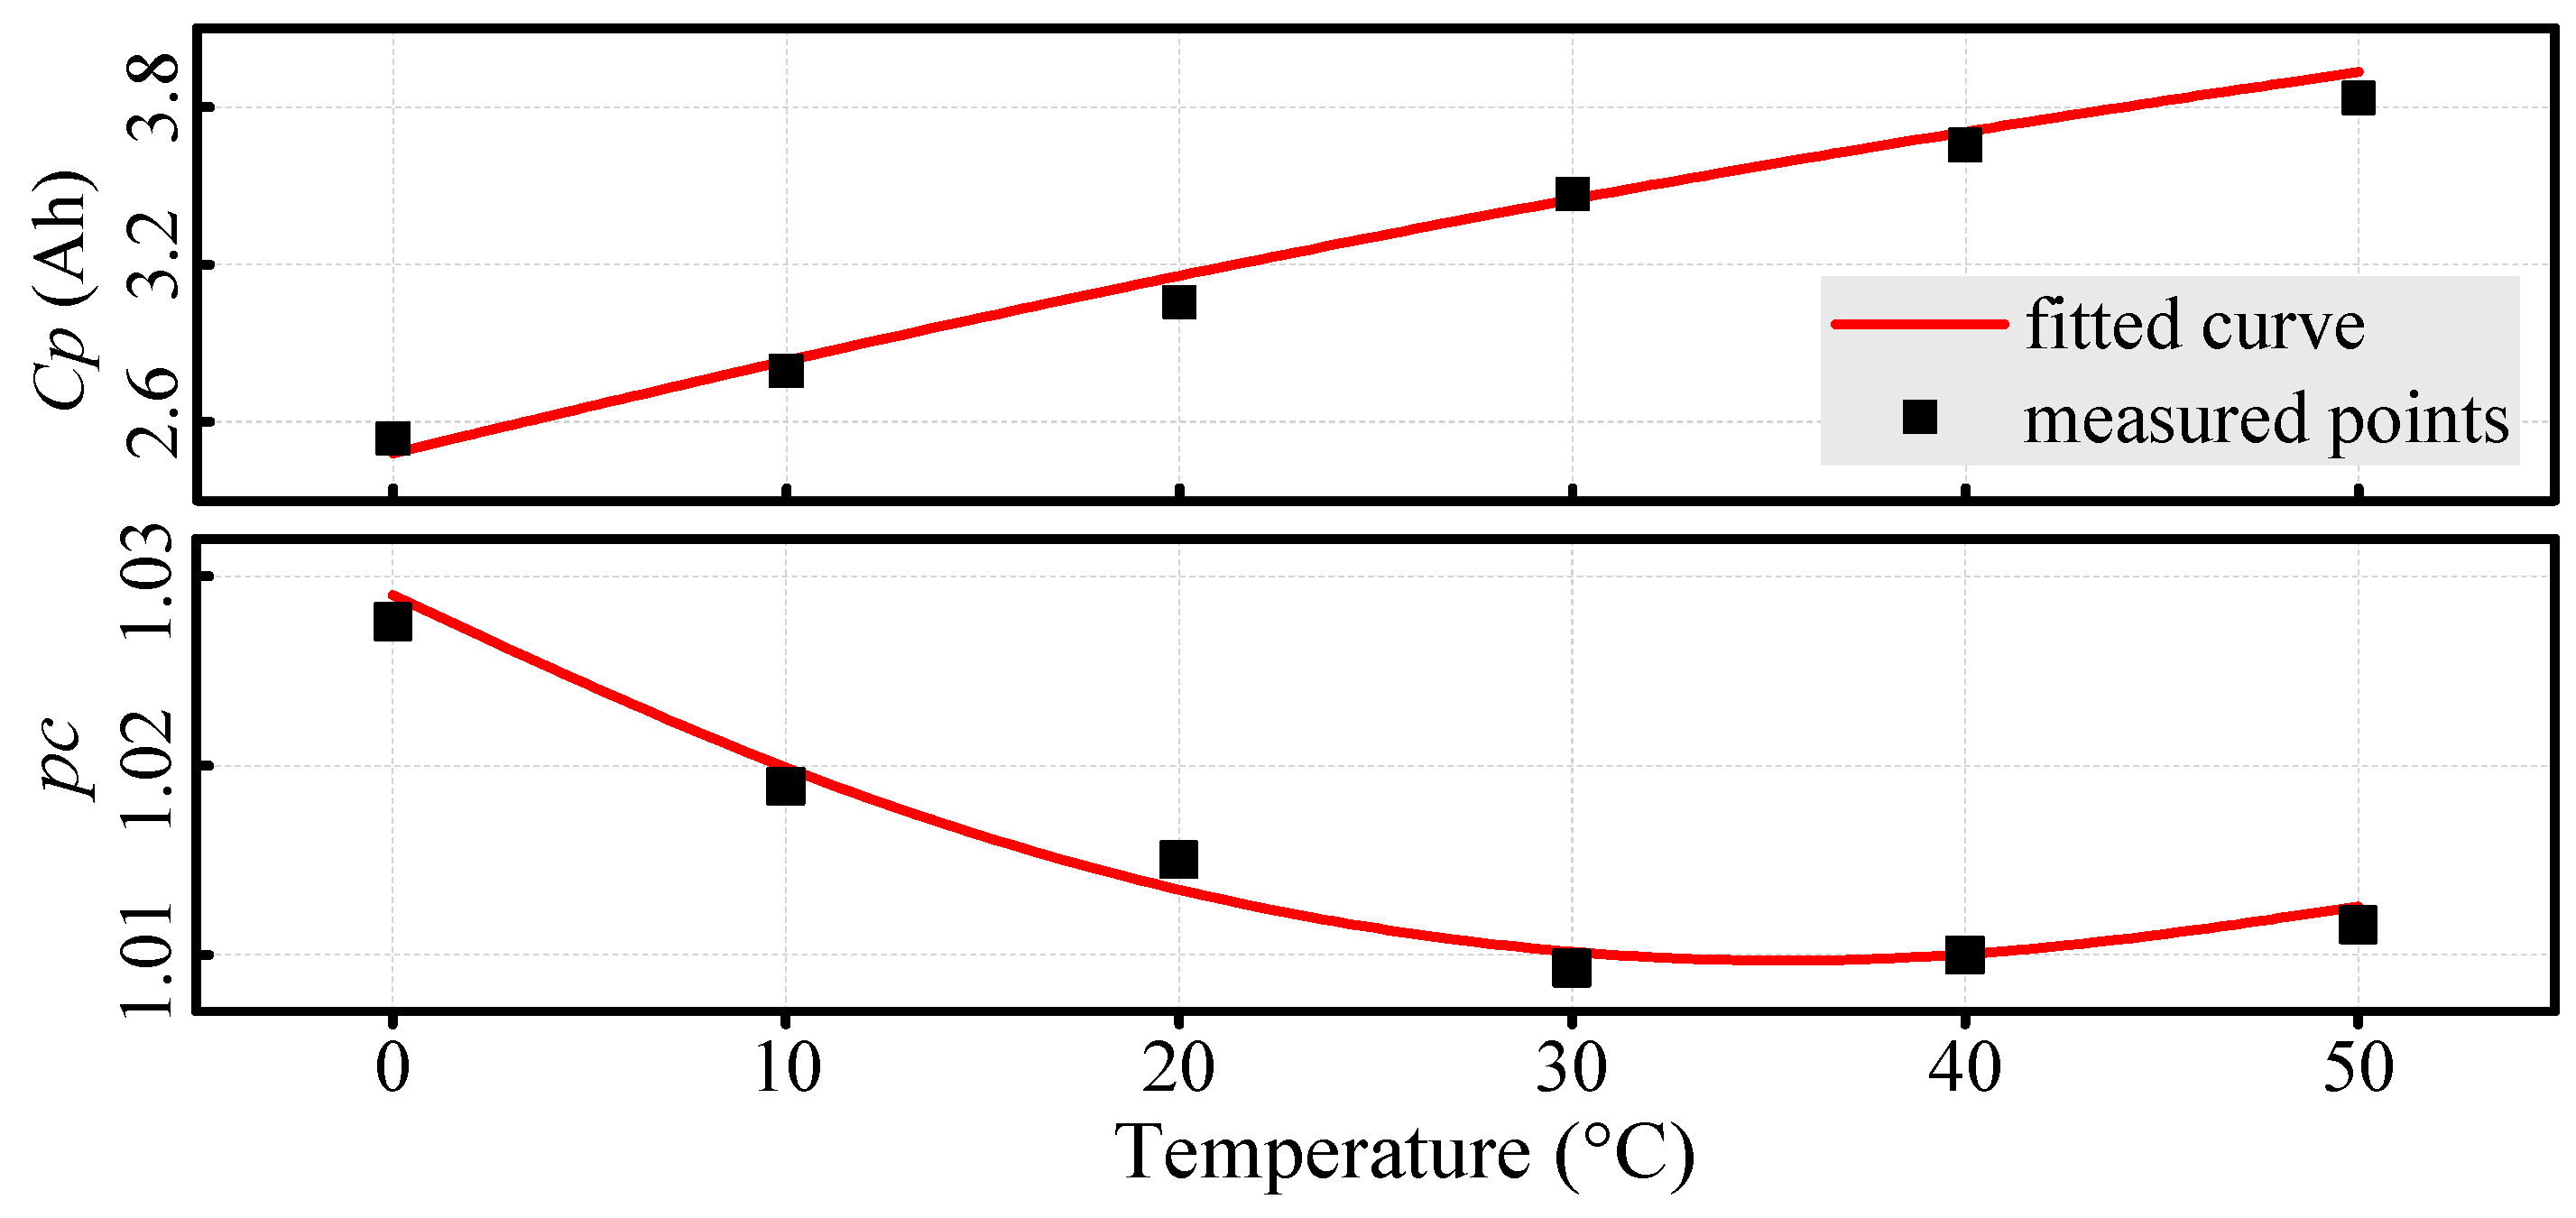
2.2. Peukert Coefficient Identification Test

After being fully charged then soaked in the thermal chamber at 0 °C for 2 h, the battery is discharged at a 1C rate and a C/3 rate until it is exhausted. Then, the C p and p c can be solved from
{ C p = I C p c t C C p = I C / 3 p c t C / 3 ,
where t C and t C / 3 are the corresponding discharge times at the 1C and C/3 rates, respectively. Repeating the above operation at the other five temperatures of 10, 20, 30, 40, and 50 °C, we acquire six pairs of ( C p , p c ) . Then, the correlations of C p T and p c T can be approximated by polynomials as
{ C p ( T ) = i = 0 2 α i · T i p c ( T ) = i = 0 2 β i · T i ,
where α 0 , α 1 , and α 2 are fitted as 2.482, 0.0373, and −1.65 × 10⁻⁴, and β 0 , β 1 , and β 2 are fitted as 1.027, −0.001122, and 1.586 × 10⁻⁵, respectively, for the investigated battery as outlined in Figure 3.

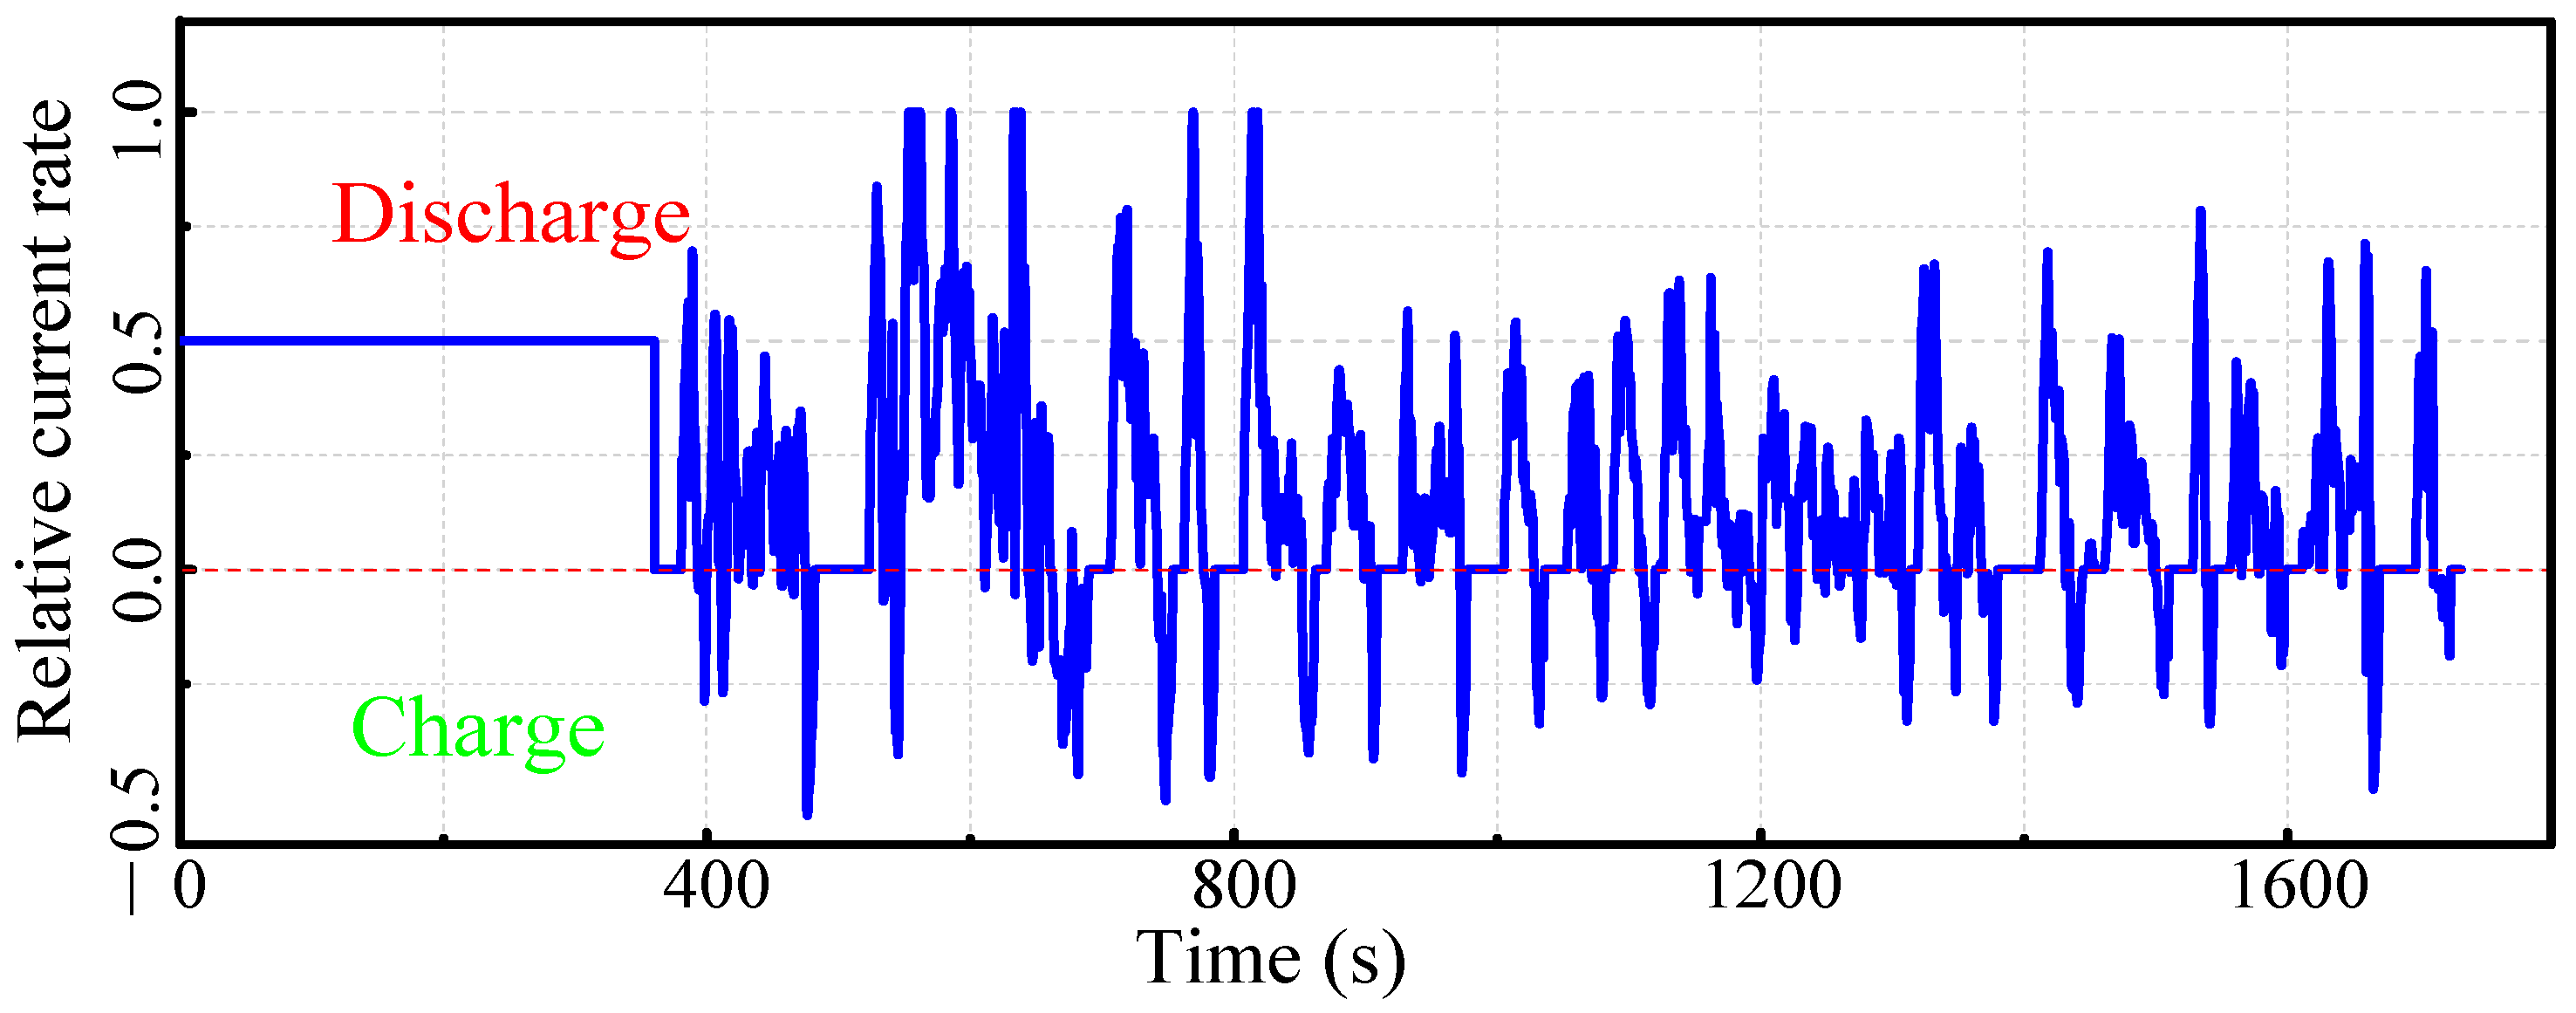
2.3. Method Validation Test

The Federal Urban Driving Schedule (FUDS) includes various current rates, durations, and alternations, and therefore is generally used to emulate the dynamic demands of Hybrid EVs. In this work, a starting segment of a 360 s, 0.5 A discharge pulse is expanded on the FUDS, as Figure 4 shows, to traverse a wide SoC range faster. Multiple cycles of scaled FUDS were performed to evaluate the adaptability and effectiveness of the proposed SoC estimation method.

3. Battery Modeling

3.1. ECM

As Figure 5 depicts, a second-order ECM is utilized in this work to capture battery electrical characteristics. The ECM comprises the voltage source ( U o c ), the hysteresis potential ( U h ), the internal resistor ( R Ω ), the activation polarization RC (resistor-capacitor) pair ( R p c / / C p c ), and the concentration polarization RC pair ( R p d / / C p d ) [19]. Then, the electrical relationships can be written as Equation (7) [11,13]:
{ U p c , k + 1 = E p c U p c , k + ( 1 E p c ) i L , k R p c U p d , k + 1 = E p d U p d , k + ( 1 E p d ) i L , k R p d U t , k + 1 = U o c , k + 1 + U h , k + 1 U p c , k + 1 U p d , k + 1 i L , k + 1 R Ω ,
where E p c = exp ( Δ t / ( R p c C p c ) ) , E p d = exp ( Δ t / ( R p d C p d ) ) , and the U h is governed by the one-state hysteresis model [14] as
U h , k + 1 = E h U h , k sign ( i L , k ) ( 1 E h ) H k ,
where E h = exp ( | i L , k Δ t / κ h | ) , κ h is a decaying factor, and H k is half of the hysteresis between charging and discharging. In this work, κ h and H k are identified as 822.4 and 0.167, respectively, for the investigated battery referring to the method specified in [4].

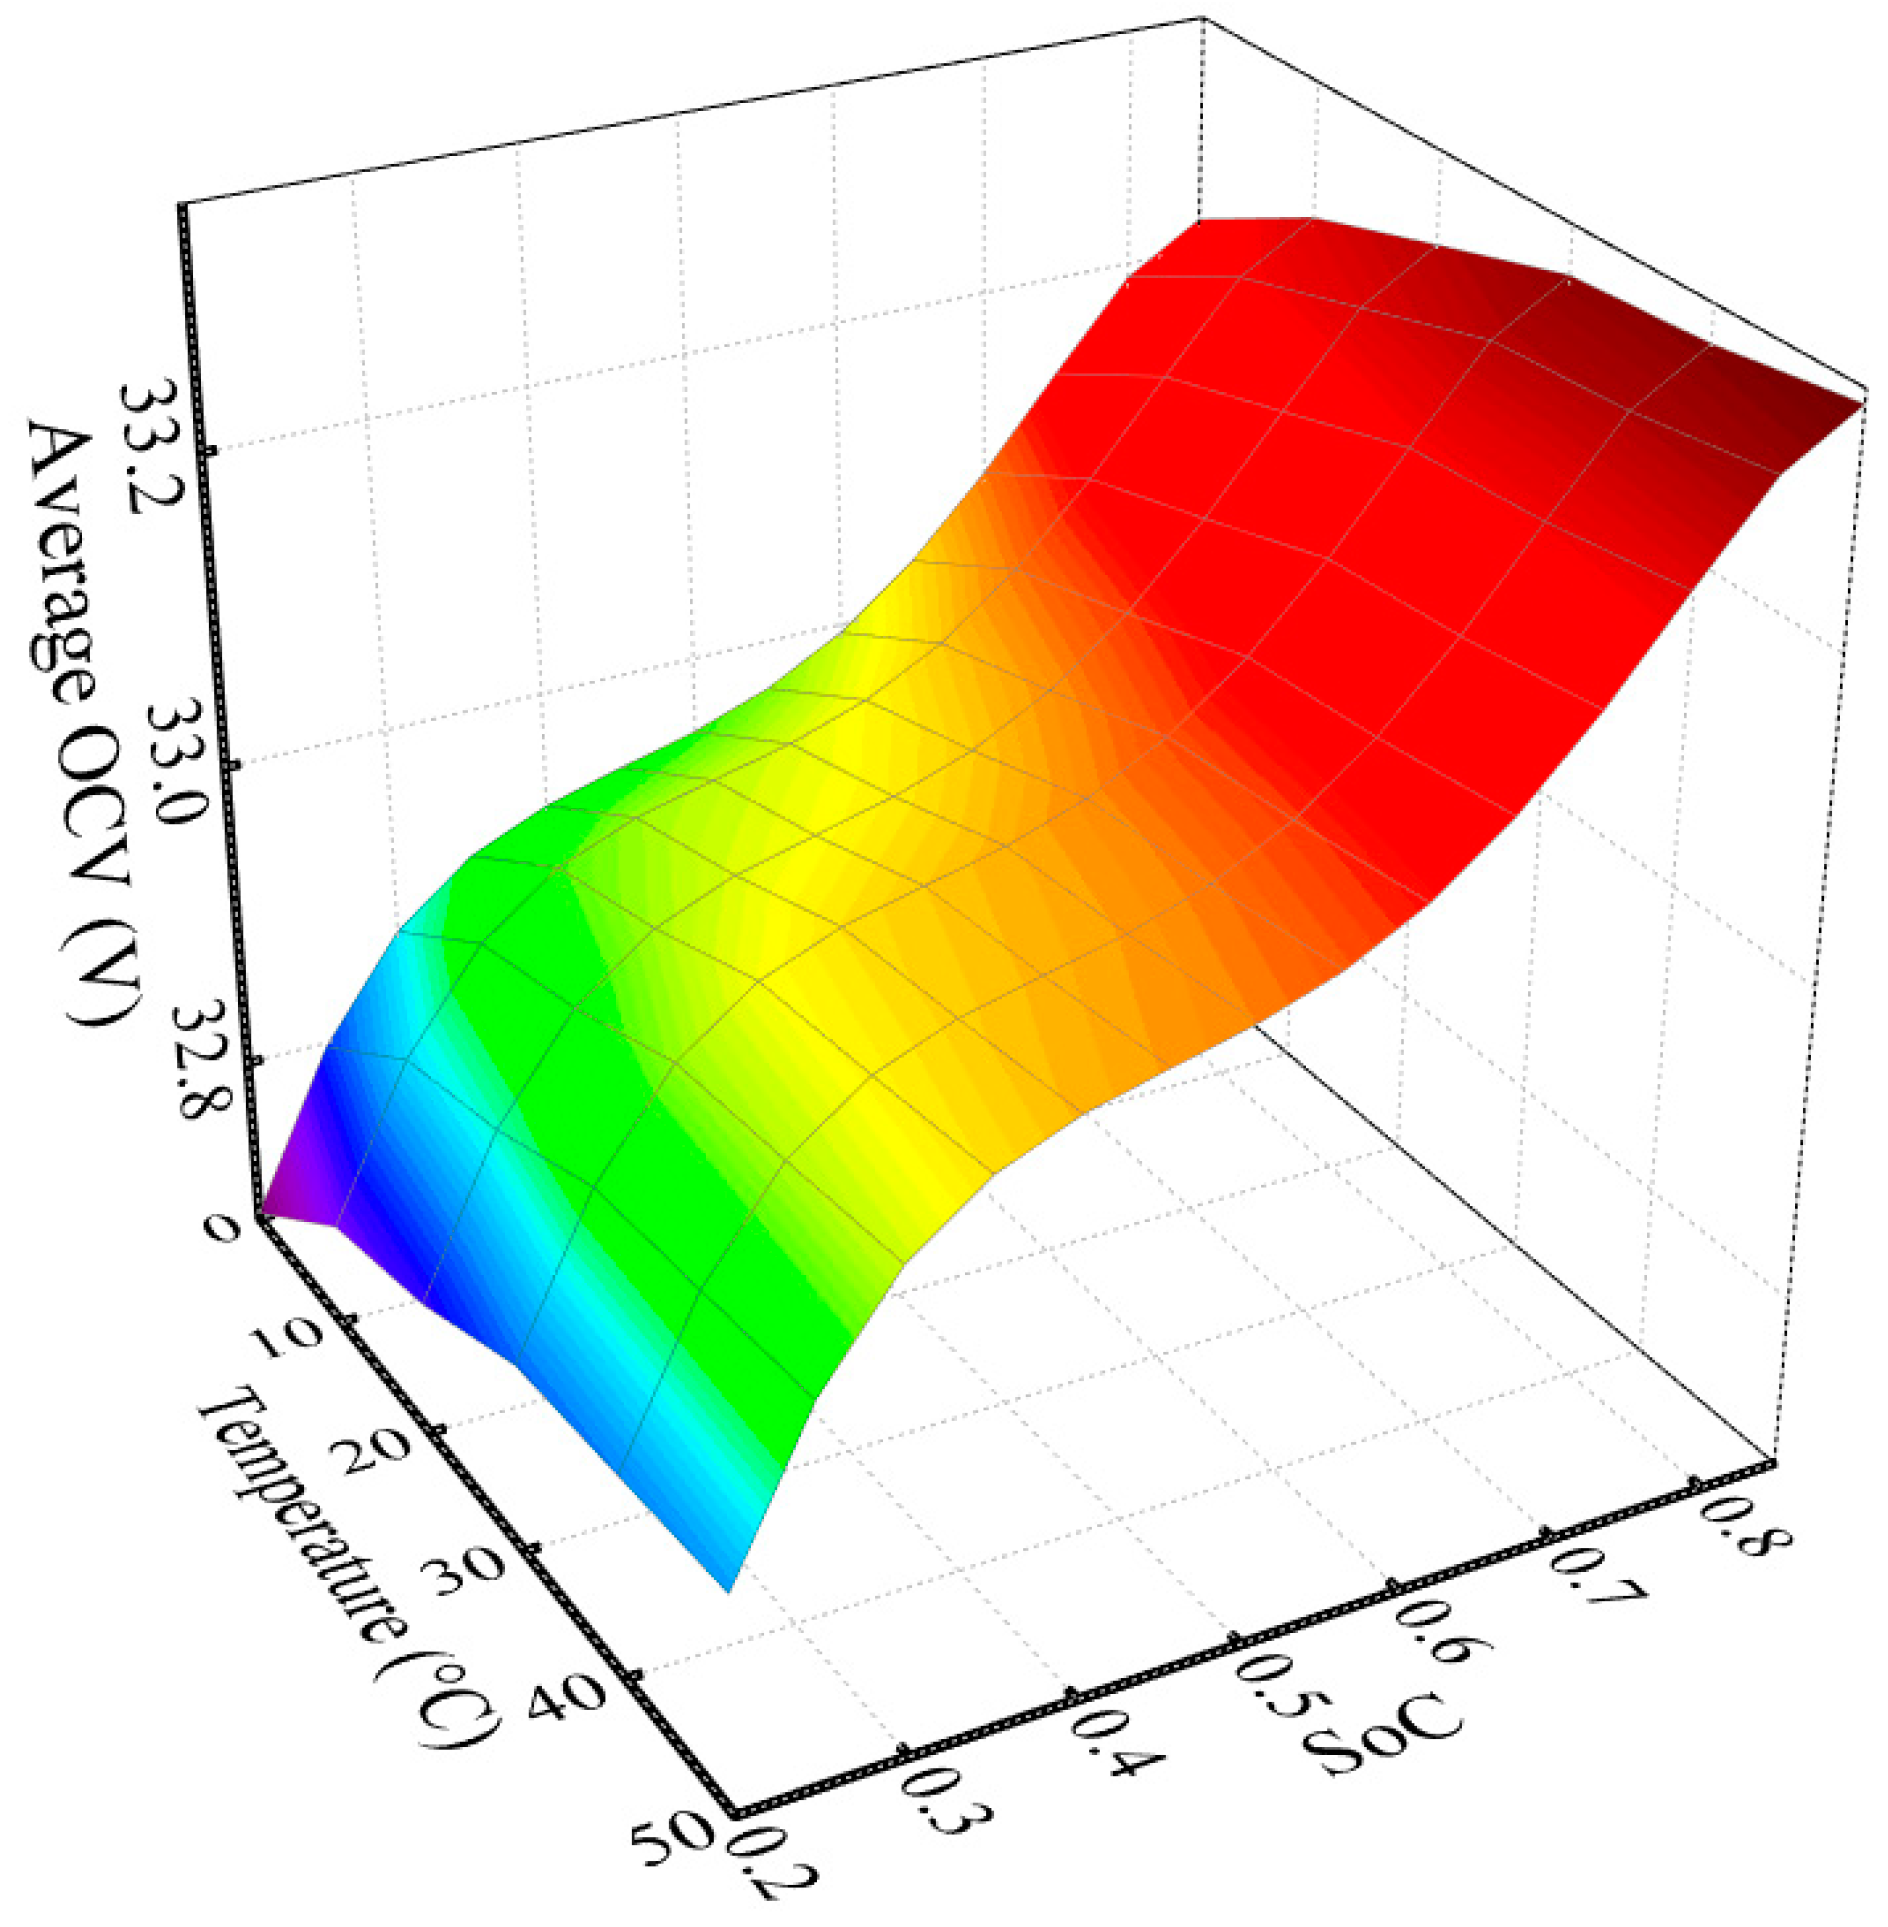
3.2. OCV–SoC–T Correlation

From the OCV–SoC correlations acquired at different temperatures in Figure 2, we find that these curves have similar shapes except for upward shifts of the voltage plateau when the temperature increases from 0 °C. Then, adapted from the U o c ( z ) form in [13], the OCV can be fitted as a function of SoC and temperature as
U o c ( z , T ) = K 0 + K 1 z + K 2 / z + K 3 ln z + K 4 ln ( 1 z ) + K 5 exp ( z ) + K 6 T + K 7 T 2 ,
where K 6 and K 7 are used to model the temperature effect, and the coefficients K ξ ( ξ = 0 , ,   7 ) are listed in Table 2.

3.3. Thermal Effect Modeling

During the test, a portion of the generated heat dissipates to the environment convectively and the remaining portion is absorbed by the battery itself, based on which a thermal evolution equation can be formulated. Assuming that the temperature gradient across the battery is uniform, the thermal balance [20] can be expressed as
m c p d T s d t B a t t e r y   h e a t   v a r i a t i o n = i L 2 R Ω + U p c 2 R p c + U p d 2 R p d H e a t   g e n e r a t i o n h c A ( T s T a ) H e a t   d i s s i p a t i o n ,
where T s is the battery surface temperature, T a is the ambient temperature, and the other involved symbols are listed in Table 3. Since C p c / / R p c governs short-time behavior and U p c characterizes a rapid convergence to the steady state of i L R p c after power bursts, an approximation of U p c i L R p c can be used. Then, Equation (10) can be rewritten as
m c p d T s d t = i L 2 R Ω p c + ( U o c     U t     i L R Ω p c ) 2 R p d h c A ( T s T a ) ,
where R Ω p c = R Ω + R p c . For brevity, Equation (11) is expressed as
κ 1 T s ˙ = i L 2 R Ω p c + ( U o c     U t     i L R Ω p c ) 2 R p d κ 2 T s + κ 2 T a ,
where κ 1 =   m c p , κ 2 = h c A . After a further transformation on Equation (12), we obtain
T s ˙ = κ 2 κ 1 T s + κ 2 κ 1 ( i L 2 R Ω p c κ 2 + ( U o c     U t     i L ( t ) R Ω p c ) 2 R p d κ 2 + T a ) .
Then, a more concise expression of Equation (13) is
T s ˙ = κ 2 κ 1 T s + κ 2 κ 1 M ,
where M = i L 2 R Ω p c / κ 2 + ( U o c     σ E ) 2 / ( R p d κ 2 ) + T a and σ E = U t + i L R Ω p c .
Converting the first-order differential Equation (14) to a discrete-time form, the battery temperature evolves as
T s , k + 1 = E T T s , k + ( 1 E T ) M ,
where E T = exp ( κ 2 Δ t / κ 1 ) .

4. Parameter Identification and SoC Estimation

Time-invariant ECMs cannot reproduce battery behaviors with high fidelity due to the uncertainties from various loads, temperatures, and SoCs. This section first illustrates an on-line approach to updating the ECM parameters. Then, based on the regulated ECM, the AEKF algorithm is implemented for SoC estimation.

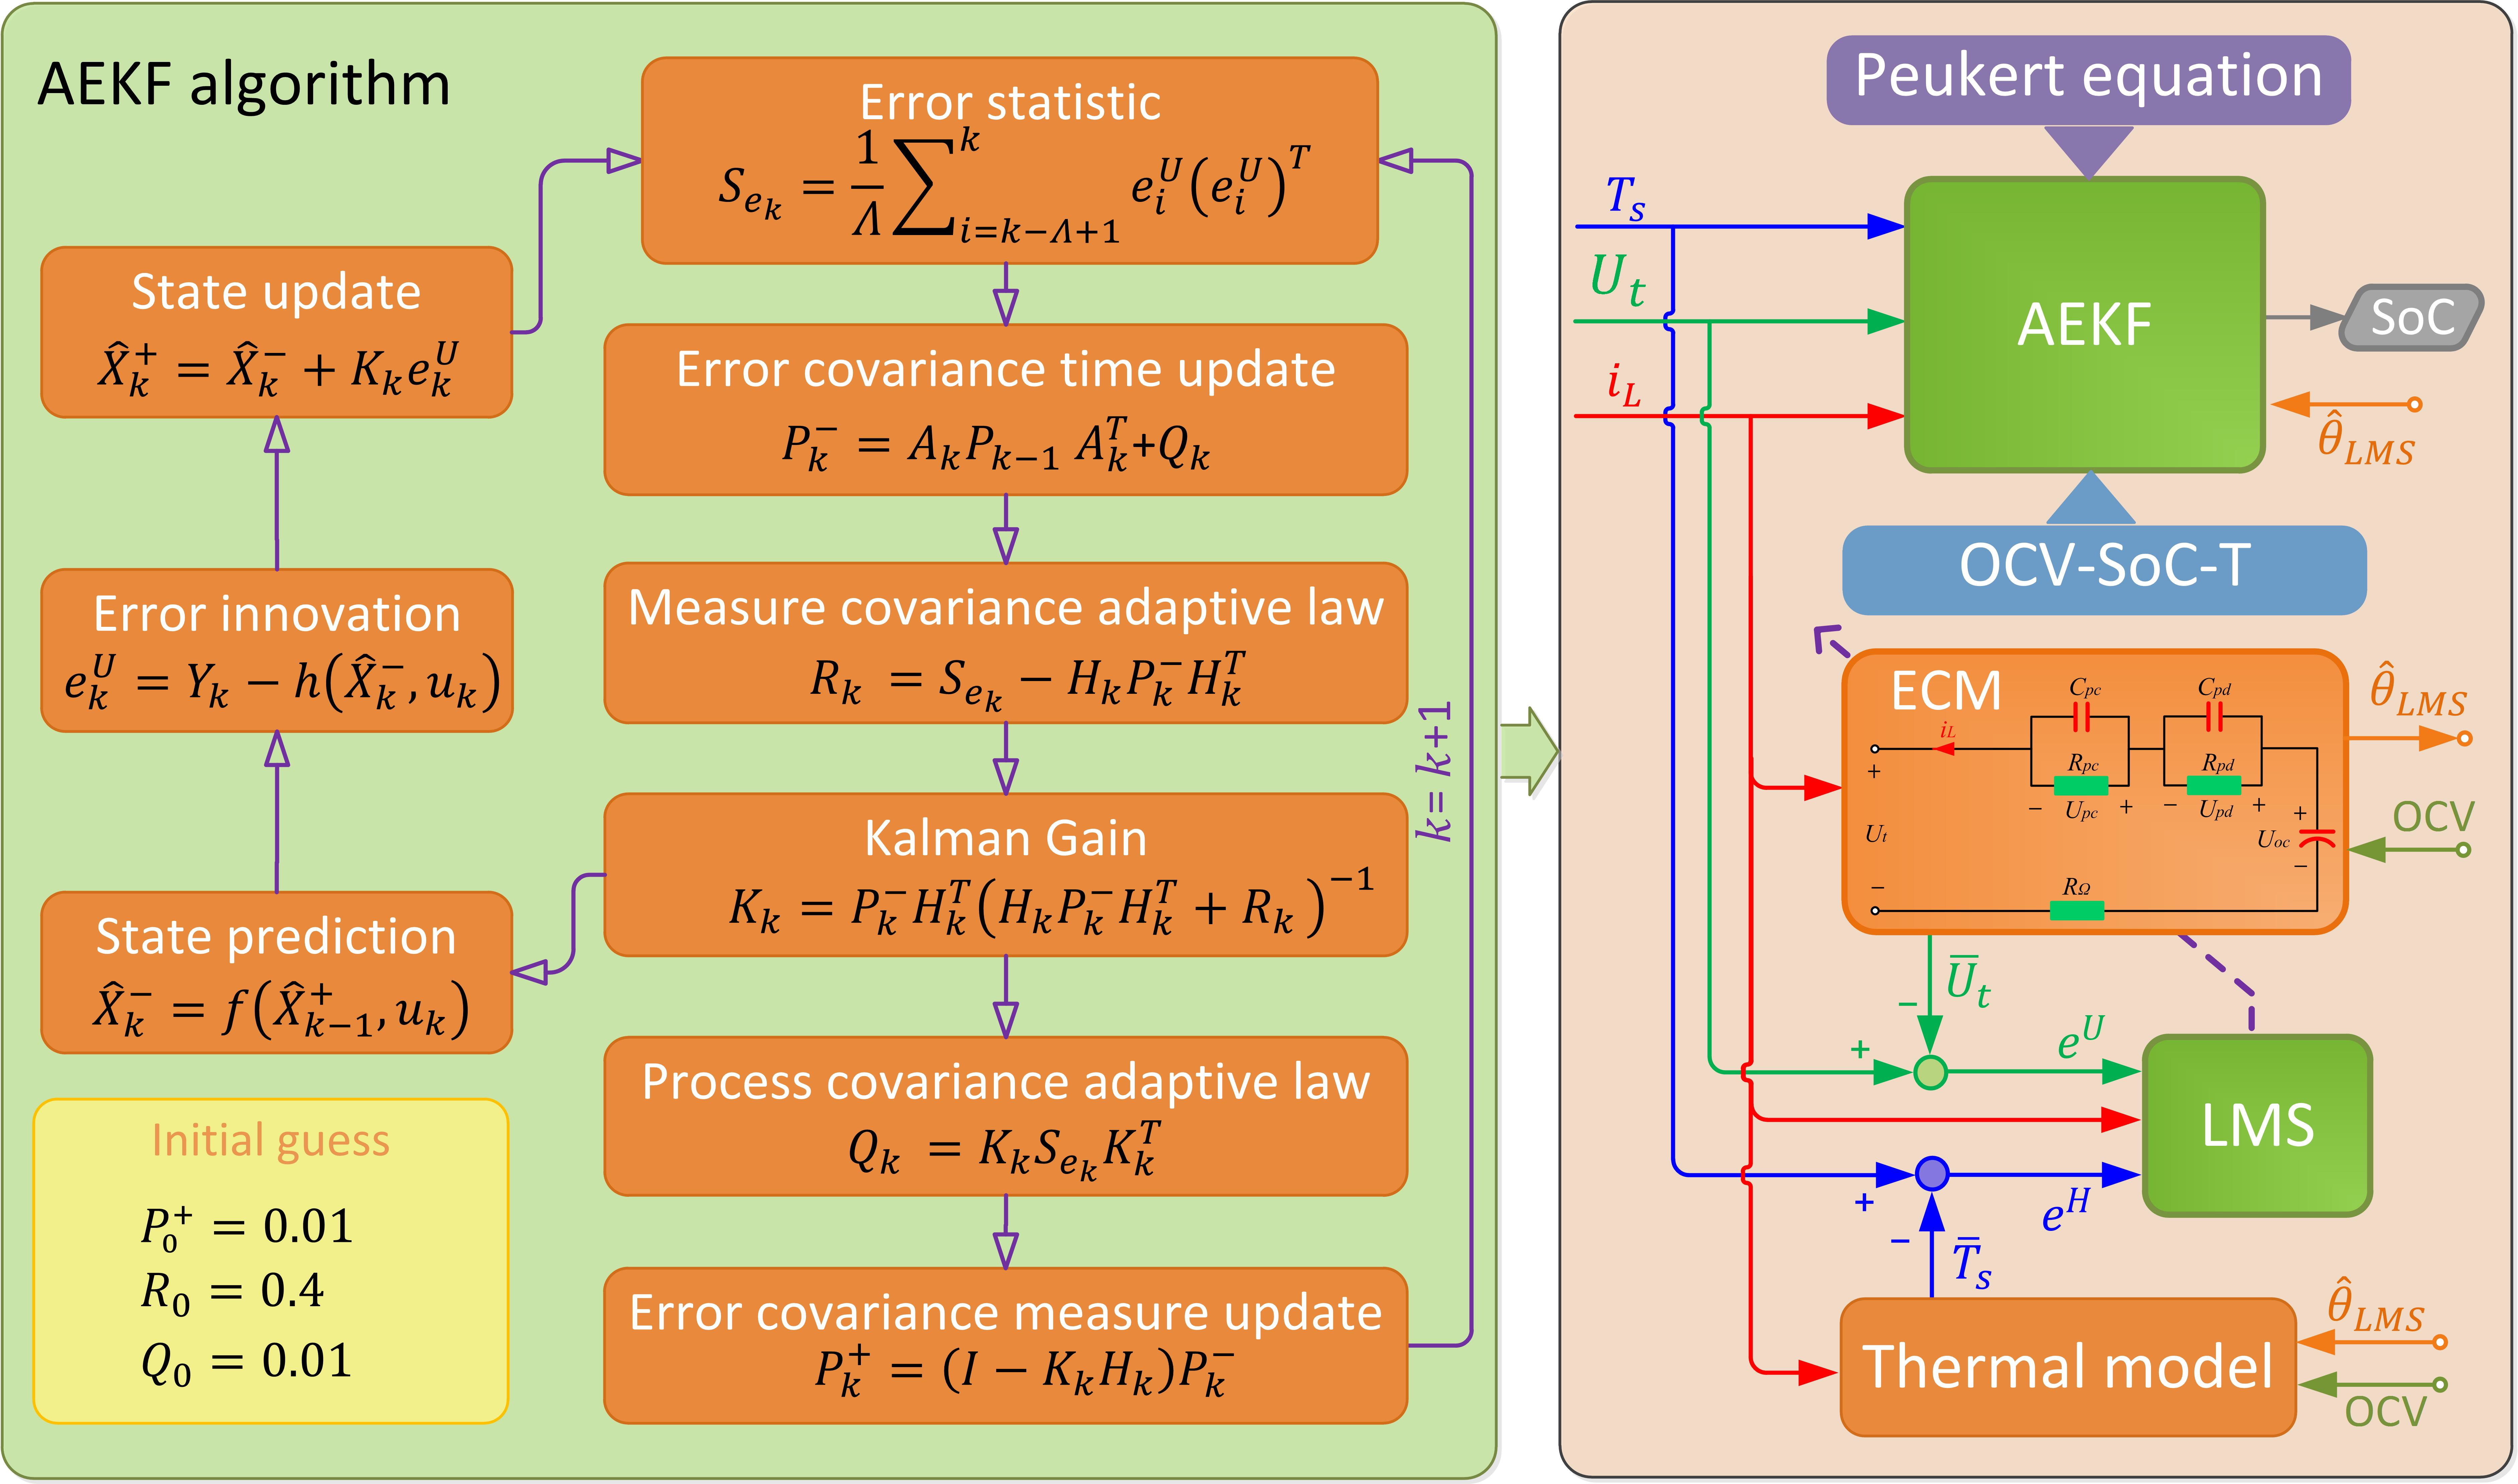
4.1. On-Line Parameter Identification

Many on-line approaches have been reported to identify ECM parameters [21,22,23,24]. However, these approaches either require considerable computational overhead or incur significant cross interference between the states and parameters [21]. This section designs a lightweight parameter identifier which can effectively address these deficiencies. Compared with C p d and C p c , which are mainly dependent on battery state-of-health [25,26], R Ω , R p c , and R p d have closer relevance to the excitation, SoC, and temperature. Here, the parameters to be identified are determined as θ L M S   =   [ R Ω R p c R p d ] T with C p d and C p c held fixed. Referring to [27], a Least-Mean-Square (LMS) filter is employed to track θ L M S with the objective function of
min θ L M S [ e k U ( e k U ) T ]   ,
where e k U = U t , k U ¯ t , k ( θ L M S , k ) , U t , k and U ¯ t , k are the measured and simulated terminal voltage, respectively. The impedance gain vector γ = [ γ Ω γ p c γ p d ] T is used to update θ L M S by
{ R Ω , k + 1 = γ Ω , k R Ω , k R p c , k + 1 = γ p c , k R p c , k R p d , k + 1 = γ p d , k R p d , k .
In an attempt to reduce e U , γ is real-time regulated by
{ γ Ω , k + 1 = γ Ω , k + μ Ω U i L , k e k U γ p c , k + 1 = γ p c , k + μ p c U i L , k e k U γ p d , k + 1 = γ p d , k + μ p d U i L , k e k U ,
where μ Ω U , μ p c U , and μ p d U are small step gains to guarantee the robustness of the filter. Then, a pseudo state-space expression can be extracted from Equations (17) and (18) as
{ γ k + 1 = A γ γ k + B γ u γ , k θ L M S , k + 1 = C γ θ L M S , k ,
where A γ = I ( 3 ) , B γ = [ μ Ω U μ p c U μ p d U ] T , C γ = d i a g ( γ ) , and u γ = [ i L e U ] .
Integrating the established TEM, another correction term can be added to reform Equation (18) as
{ γ Ω , k + 1 = γ Ω , k + μ Ω U i L , k e k U + μ Ω H e k H γ p c , k + 1 = γ p c , k + μ p c U i L , k e k U + μ p c H e k H γ p d , k + 1 = γ p d , k + μ p d U i L , k e k U + μ p d H e k H ,
where e k H = T s , k T ¯ s , k ( θ L M S , k ) , T s , k , and T ¯ s , k are the measured and predicted battery surface temperature, respectively. Accordingly, B γ = [ μ Ω U μ p c U μ p d U ; μ Ω H μ p c H μ p d H ] T , u γ = [ i L e U e H ] T , and the new objective function is
min θ L M S [ e k U ( e k U ) T + e k H ( e k H ) T ] .
Compared with tracking the absolute values [28,29], this approach updates the parameters using relative changes, whereby drastic oscillations can be avoided.

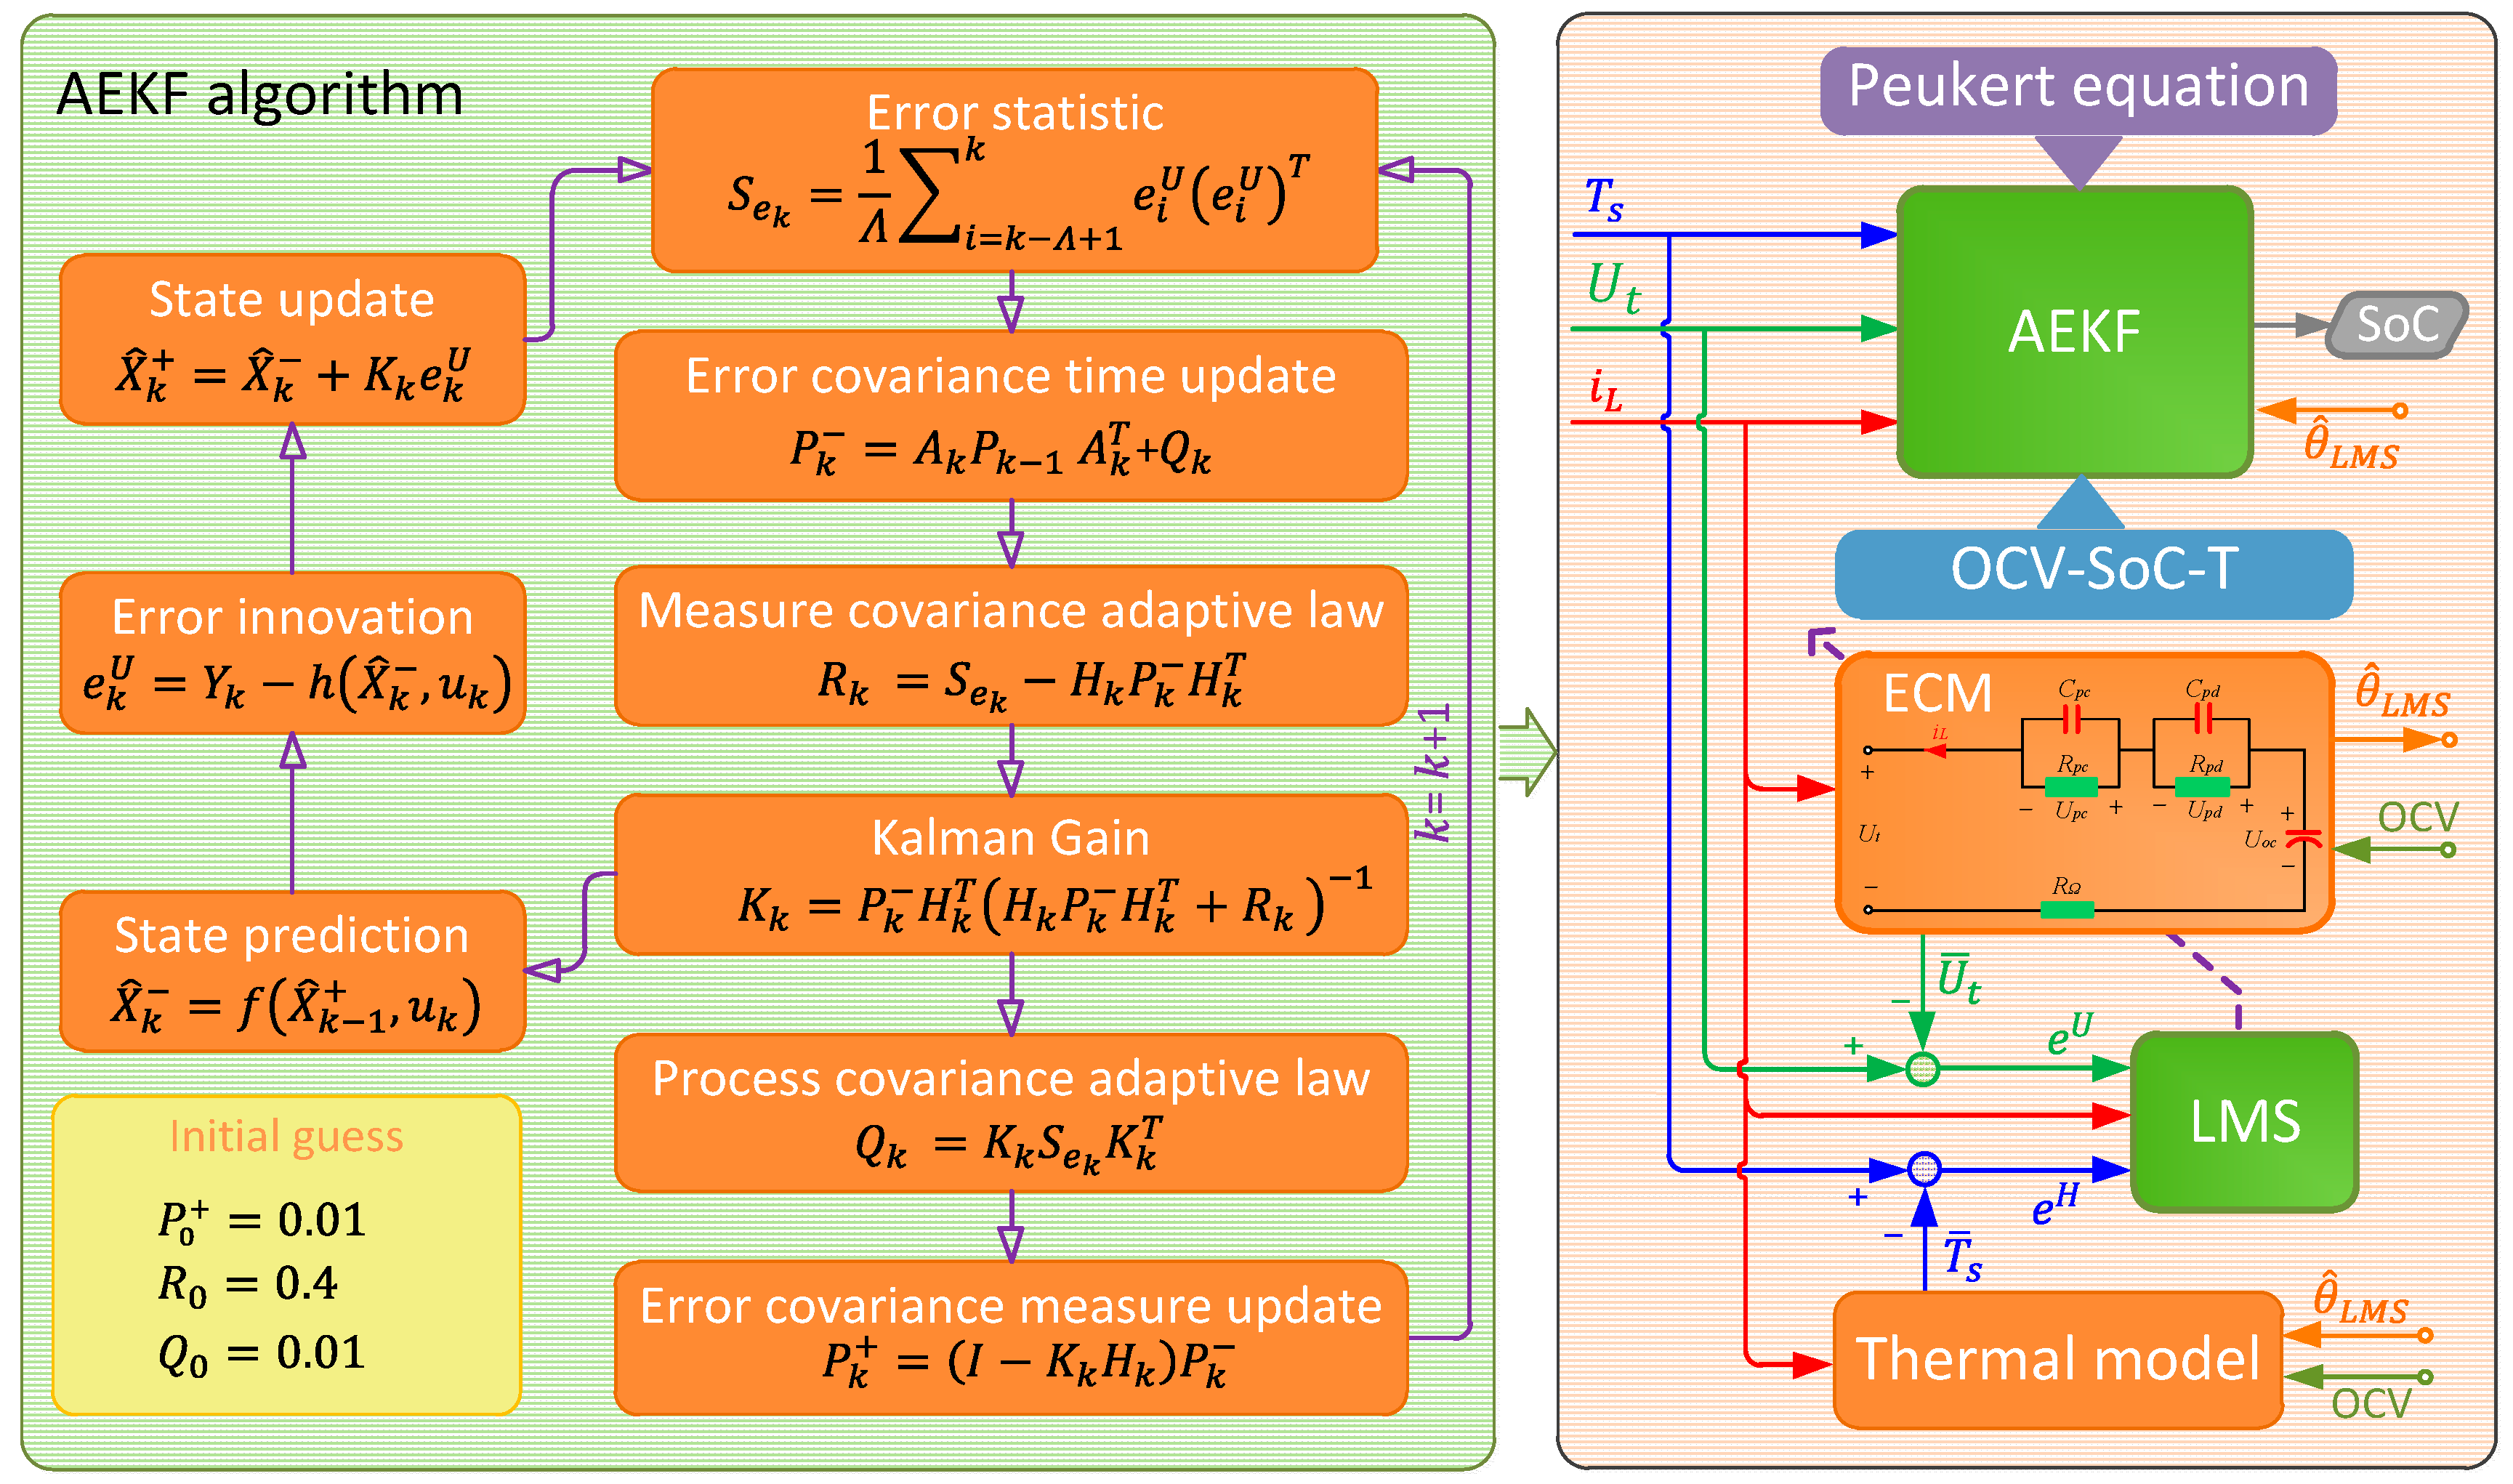
4.2. SoC Estimation Based on AEKF

Extended Kalman Filter (EKF) is the most frequently utilized algorithm to deal with battery nonlinear characteristics. However, EKF holds the initially guessed system and measurement noise covariances unchanged, which may lead to large errors and even divergence. In [30], Mehra introduces four adaptive EKFs, among which the covariance-matching variation is utilized in this work. Combining Equations (3), (6) and (7), we can obtain the state-space expression as
{ X k + 1 = A k X k + B k u k + ω k Y k = h ( X k , u k ) + ν k ,
where
{ X k = [ z k U p c , k U p d , k U h , k ] T   u k = [ i L , k s i g n ( i L , k ) H k ] T , Y k = U t , k A k = d i a g ( [ 1 E p c E p d E h ] T ) , B k = [ η Δ t / C n 0 R p c ( 1 E p c ) 0 R p d ( 1 E p c ) 0 0 ( 1 E h ) ] ,
and ω k and υ k are independent zero-mean Gaussian noises of the covariance matrices Q k and R k , respectively. Then, the AEKF, as detailed in Figure 6, can be operated to estimate X k .
Figure 6 outlines the entire estimation framework. The ECM parameters ( θ L M S ) are tuned on-line with voltage and temperature prediction errors referring to Section 4.1. Enhanced by the Peukert equation and the U o c ( z , T ) correlation, an AEKF-based SoC estimator is built up to accommodate different temperatures, discharge rates, and other model uncertainties.

5. Results and Discussion

To verify the constructed SoC estimation scheme, experiments with erroneous initial states under different temperatures were arranged. The FUDS profile scaled by 6 was applied to the battery. The reference SoC was obtained by post-processing the recorded current from the end moment backwards to the start moment.

5.1. TEM Impact on On-Line Parameter Update

The LMS-based on-line update of ECM parameters described in Section 4.1 takes advantage of both the electrical behavior and the thermal behavior of the battery. Nevertheless, the identifier can still work with just one of these two behaviors, i.e., either the voltage prediction error ( e U ) or the temperature prediction error ( e H ) is available.
In this section, the parameterization results at 35 °C subject to consecutive FUDS cycles are outlined to analyze the parameter identifier. The impact of e H is examined by decomposing the identifier, i.e., switching off and switching on the e H signal. In Figure 7, we can see that the parameter trajectories extracted from e U deliver obvious oscillations because the battery terminal voltage involves more transient dynamics which are not completely modeled. Then, through the inclusion of e H , the change trajectories of the resistors are apparently affected such that the oscillations are suppressed and the overall evolution trends are changed as well. This phenomenon proves that the introduction of thermal behavior imposes a considerable impact on the performance of the parameter identifier. Since most of the electrochemical reactions inside batteries are sluggish ion migrations, a gradual variation of the parameters is more reasonable. Therefore, the experimental results on parameter identification justify the effectiveness of the TEM.

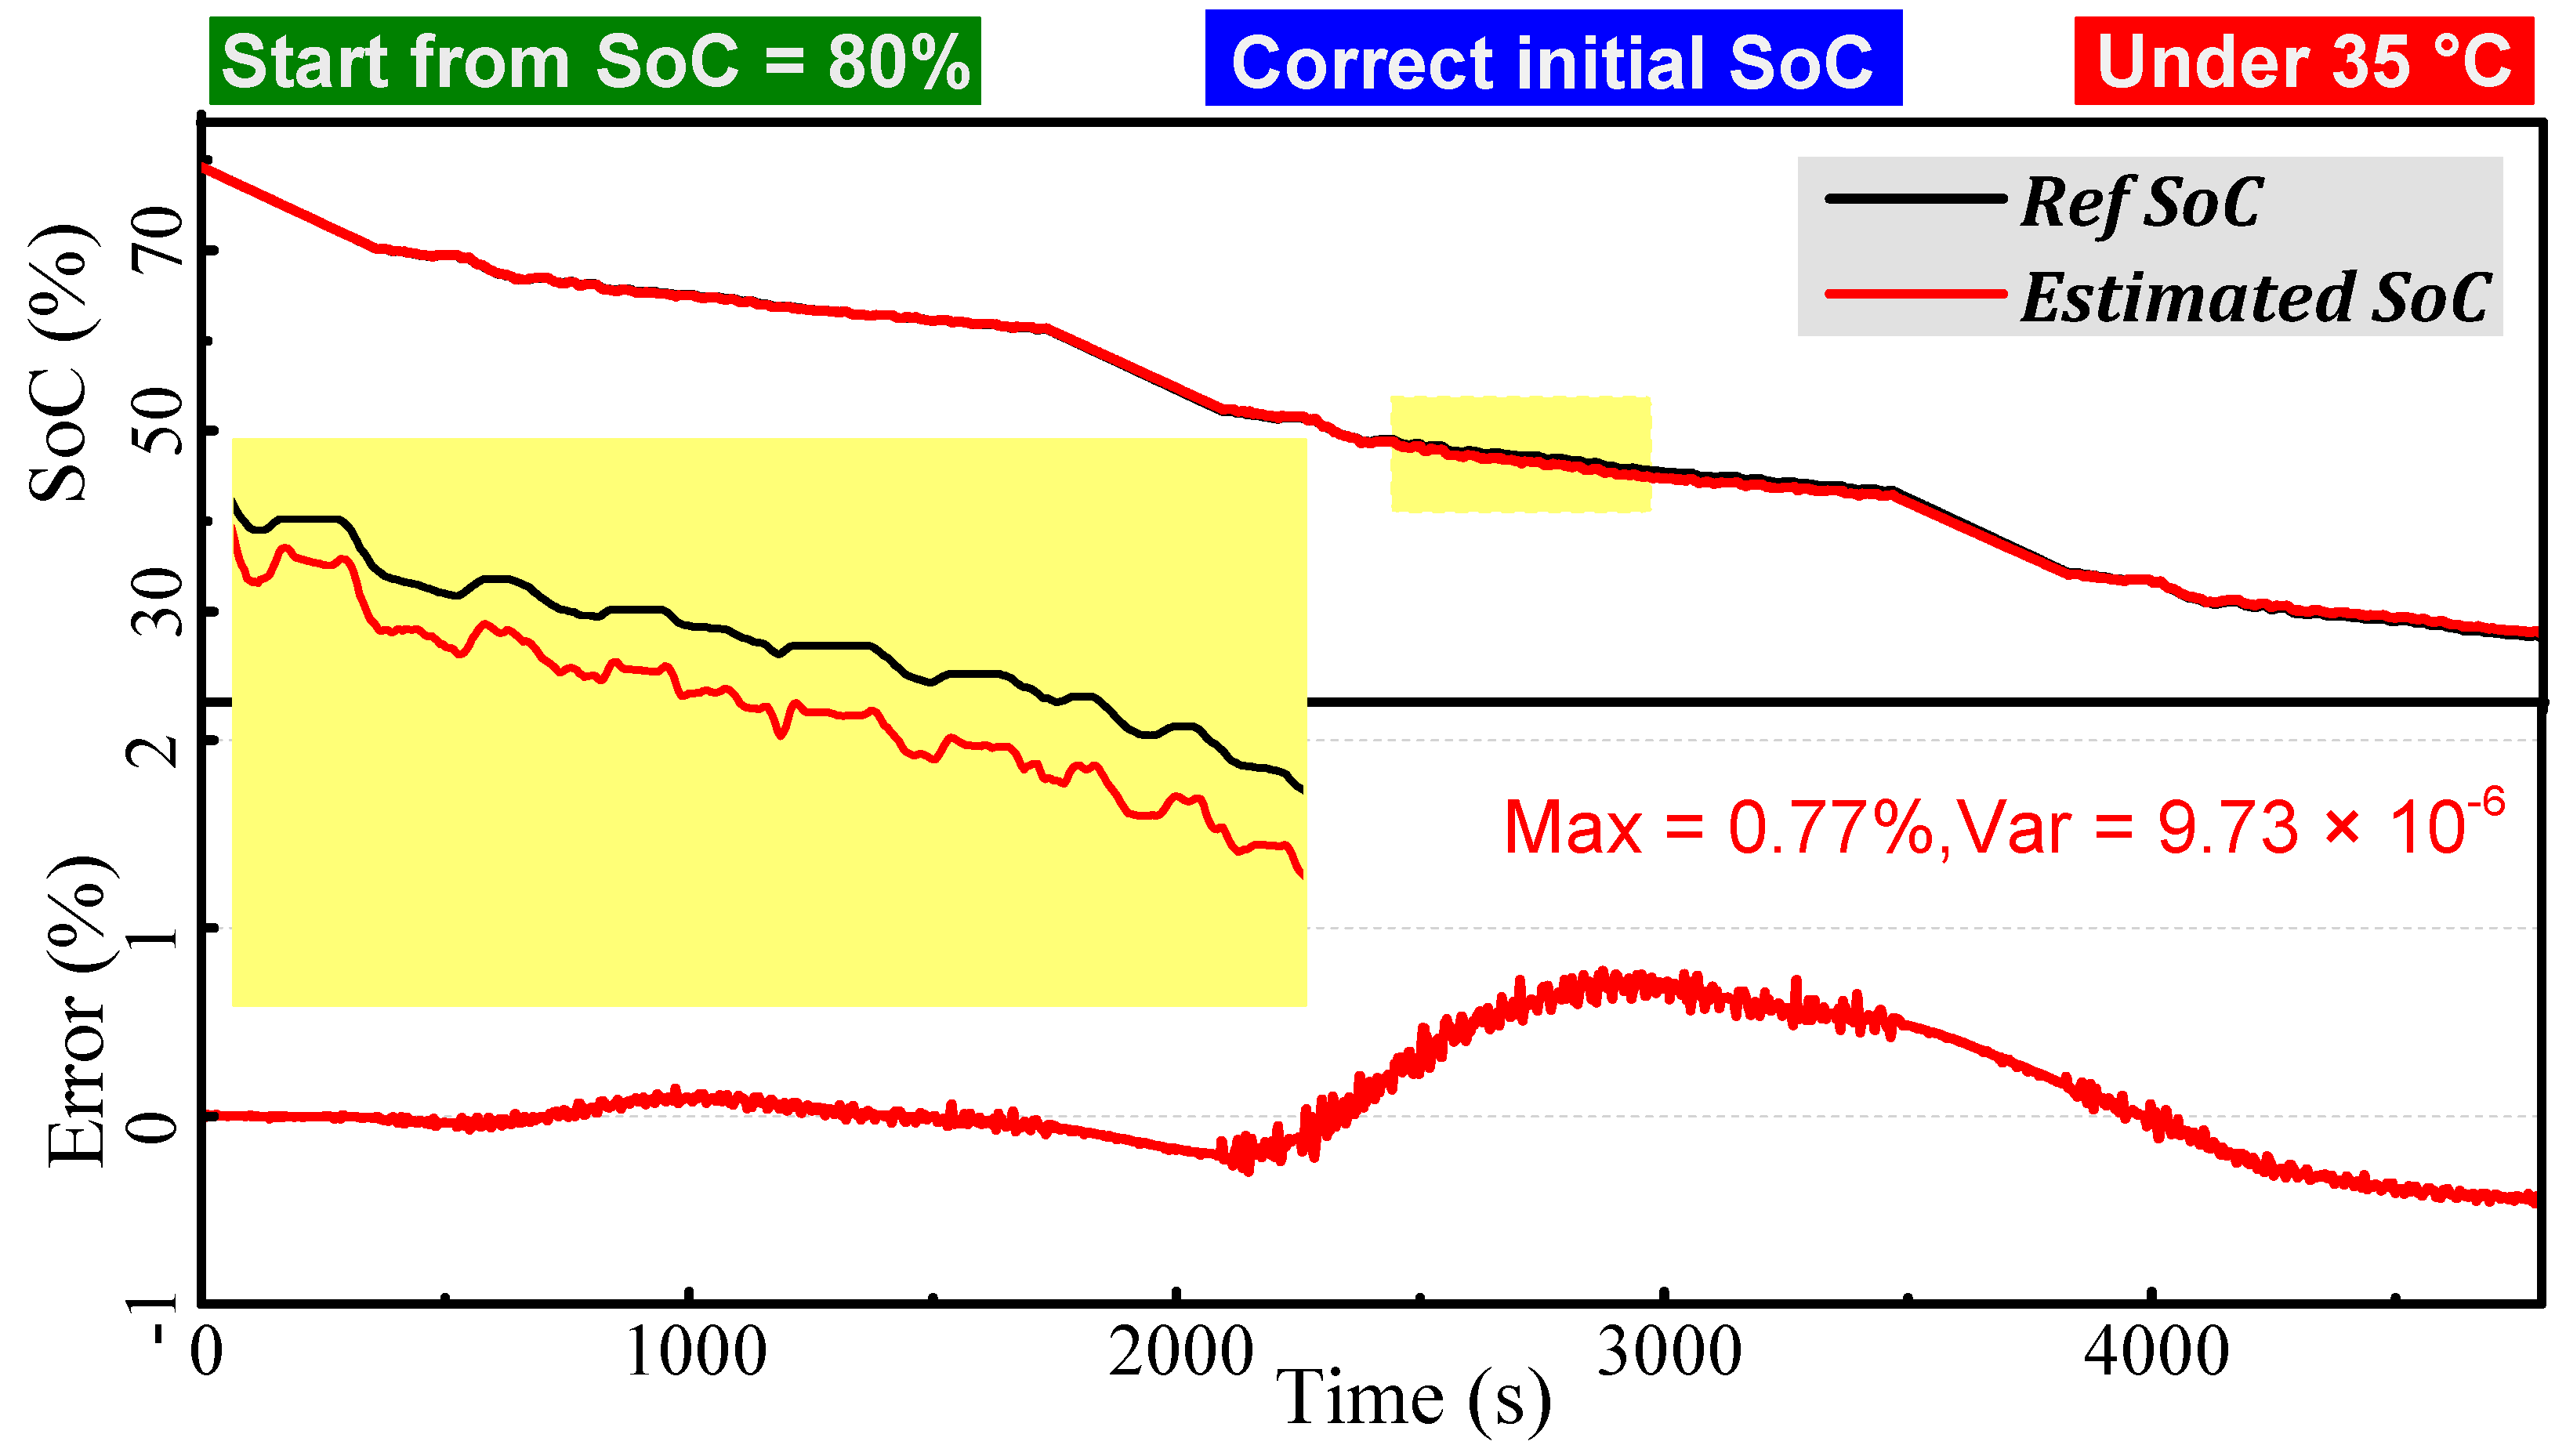
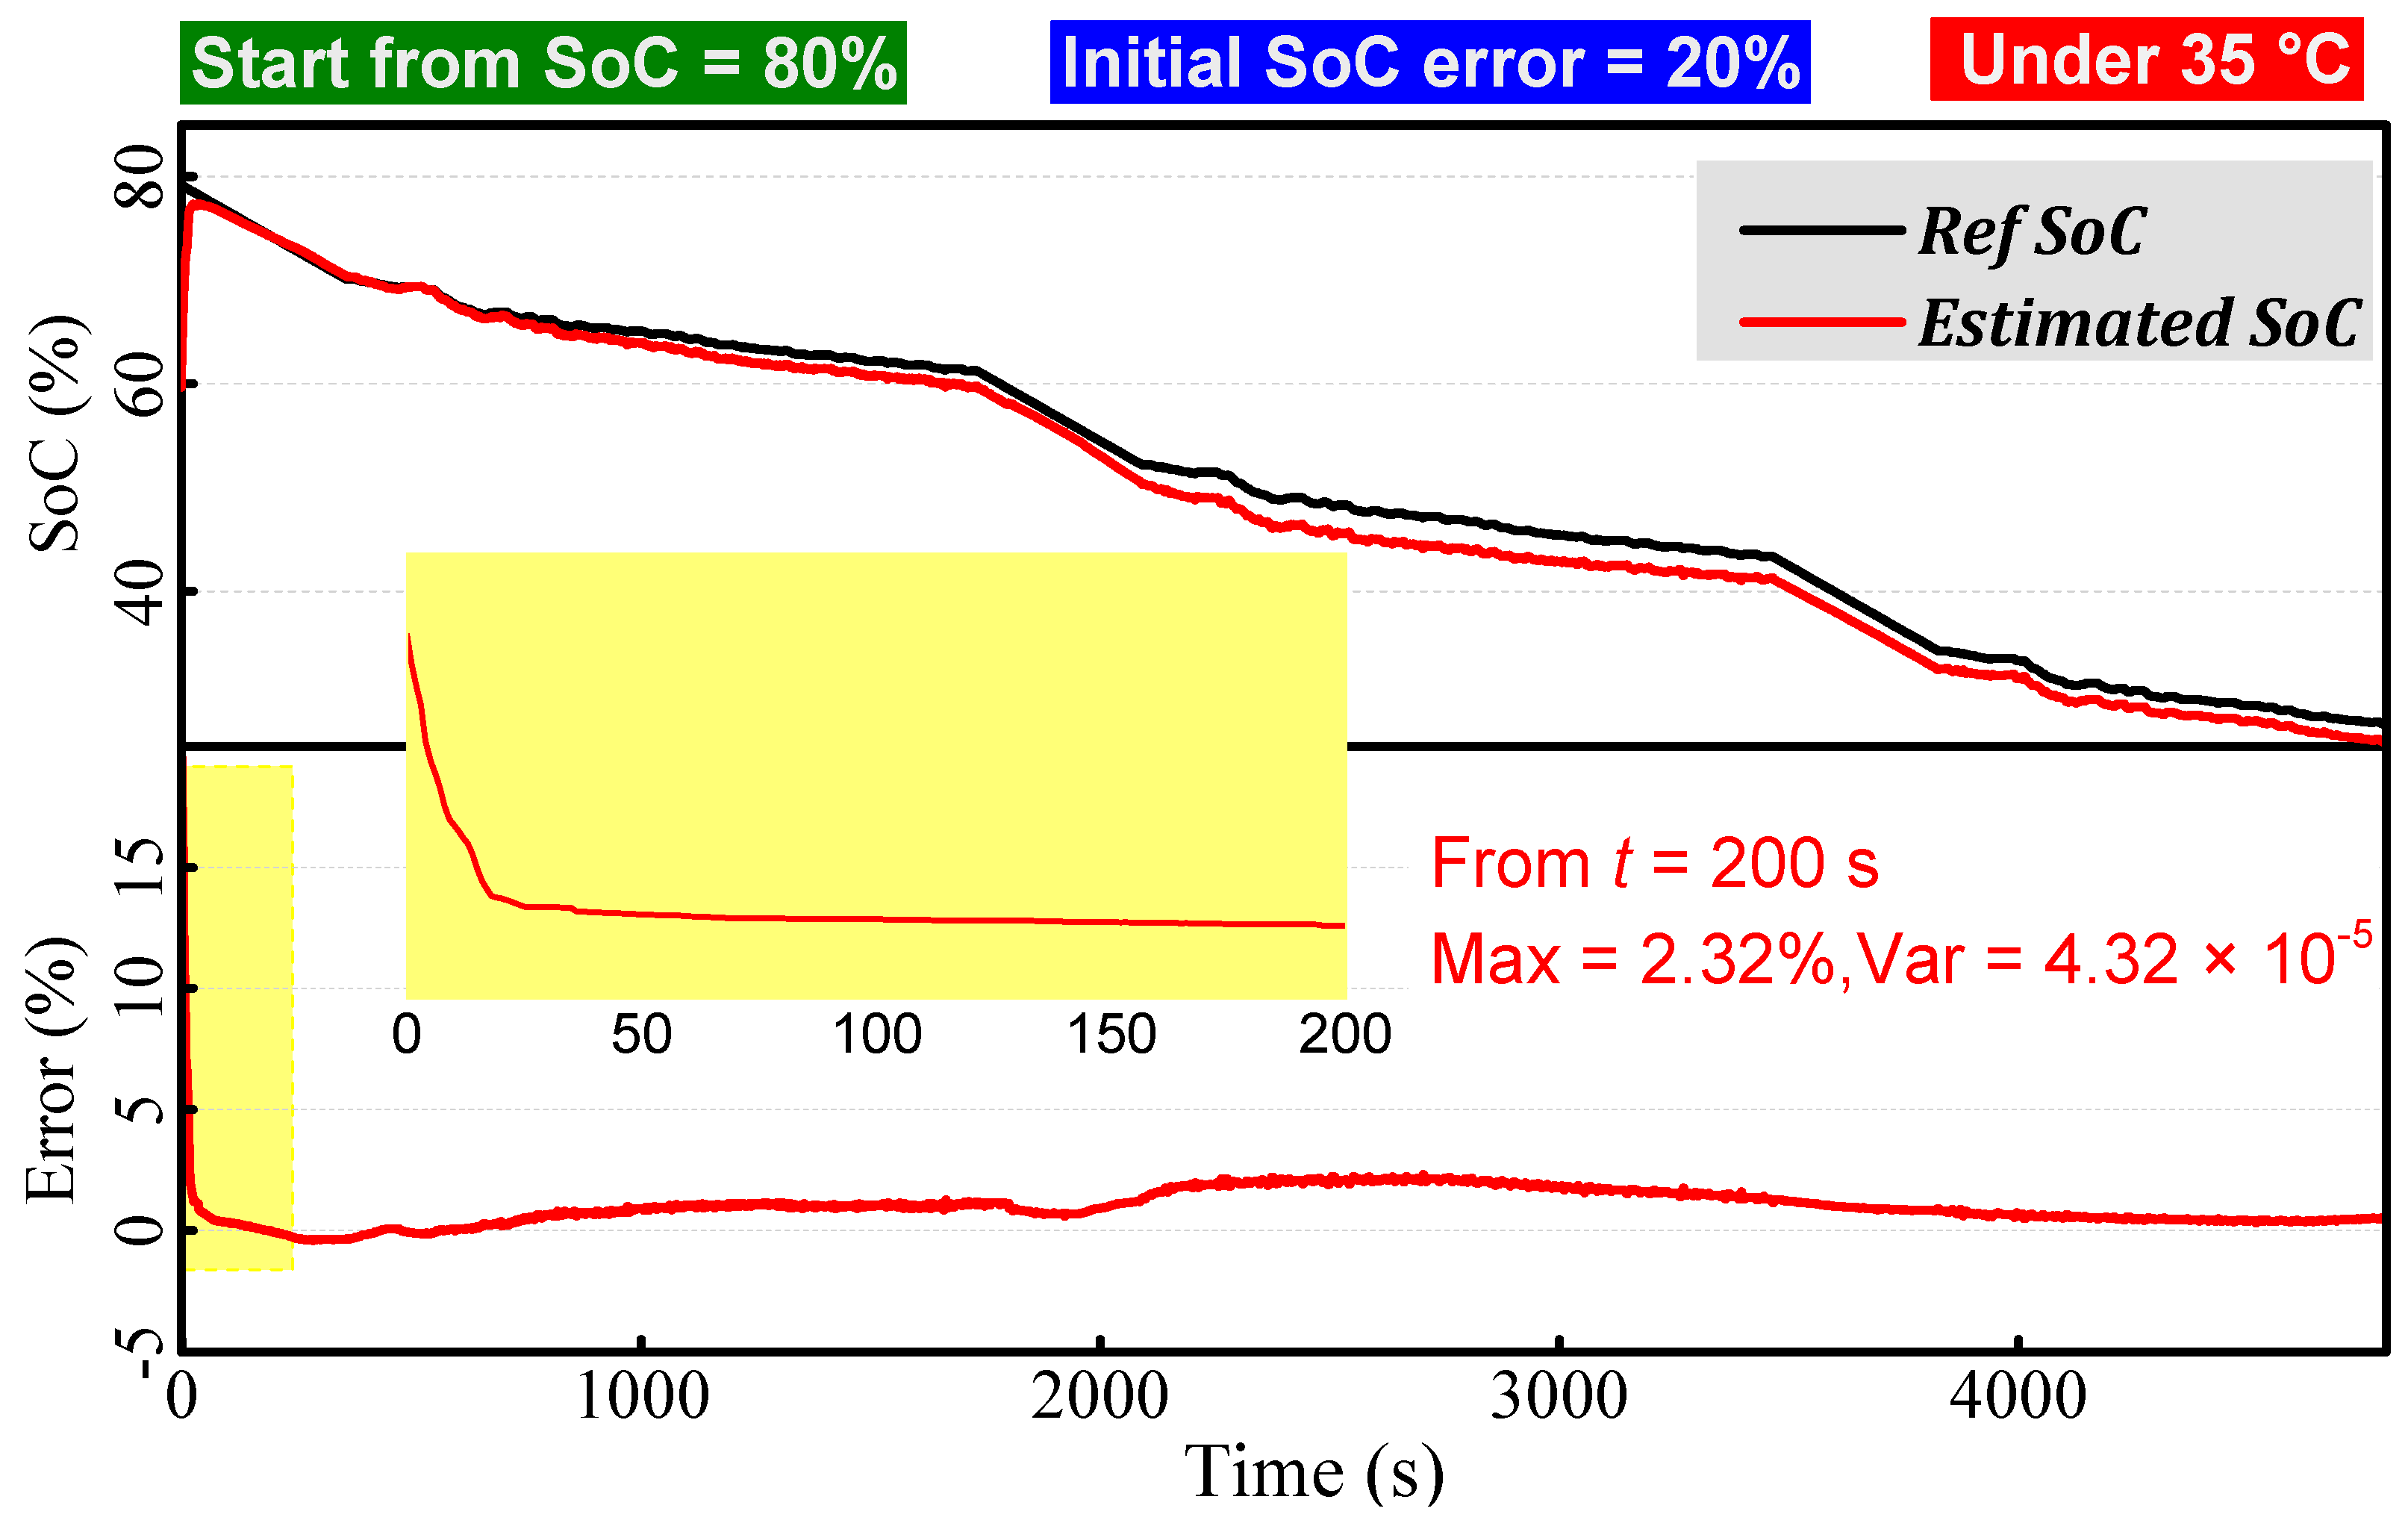
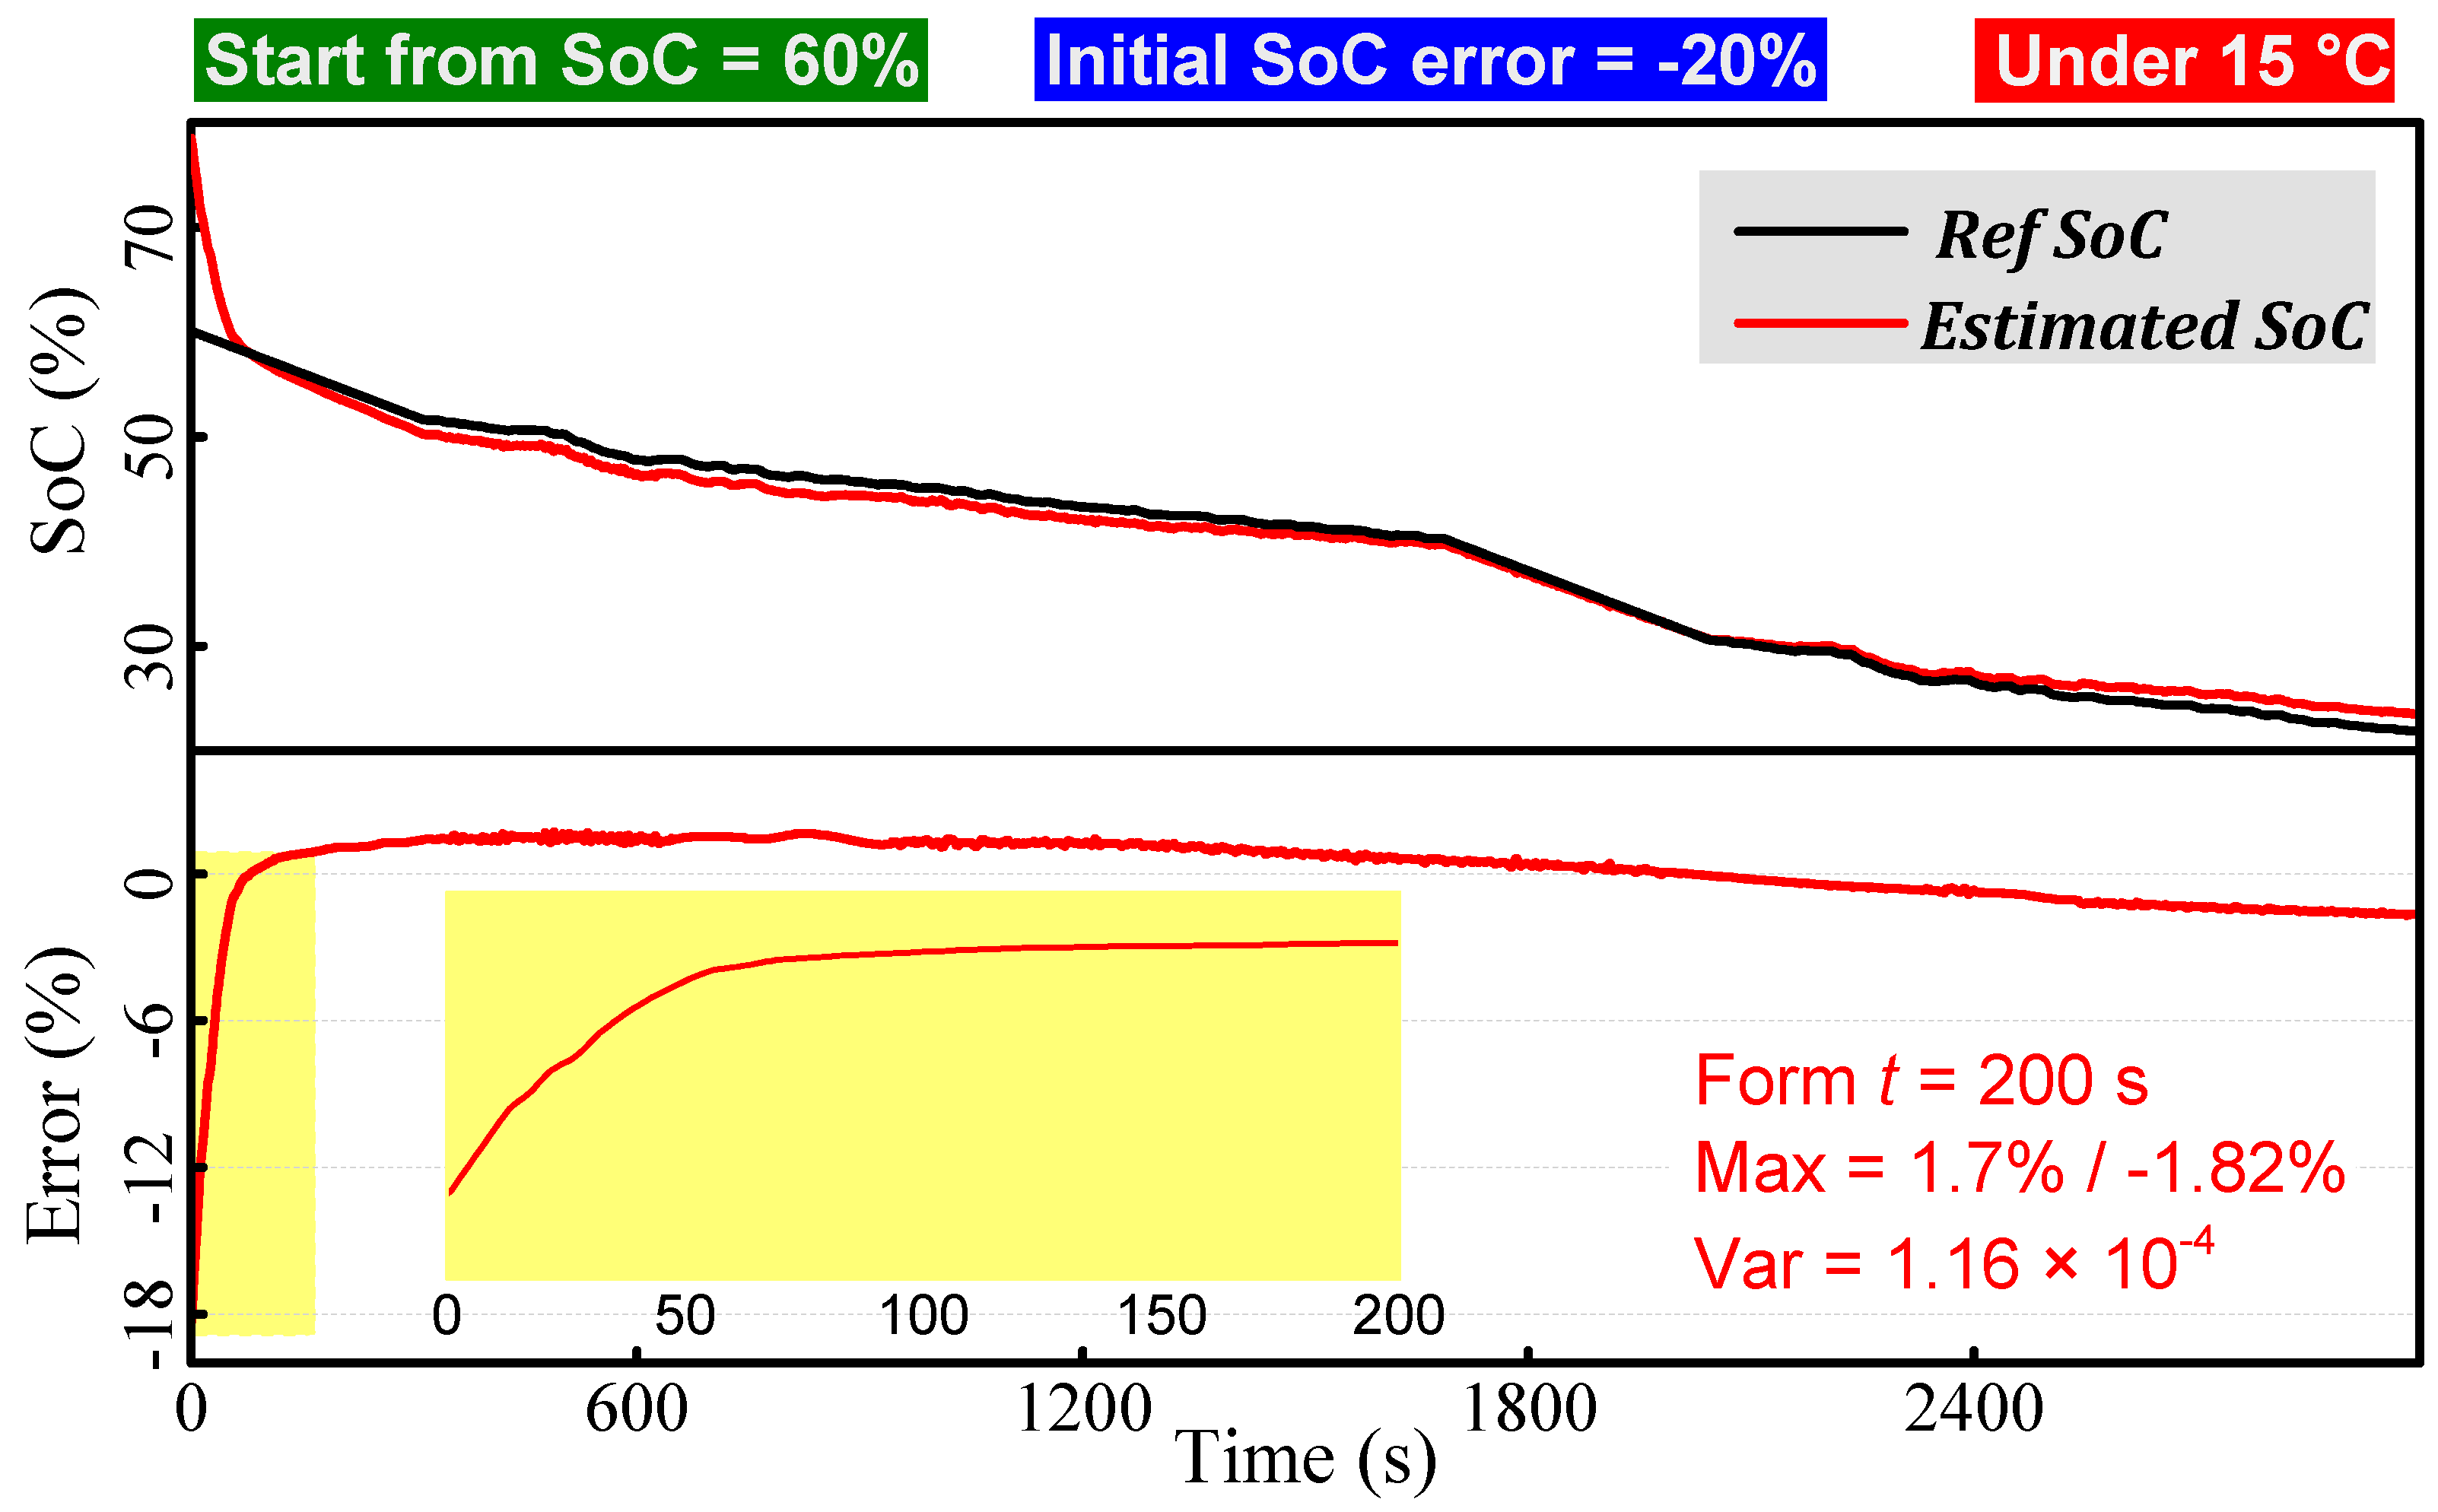
5.2. SoC Estimation Under Constant Temperatures

To perform a primary verification on the SoC estimator, an experiment was first carried out under 35 °C with a correct initial SoC. As Figure 8 presents, the estimated SoC characterizes a close track along with the reference until t = 2200 s, after which a gradient climb occurs and the oscillations become obviously drastic. This is mainly ascribed to that the construction of U o c ( z , T ) inevitably involves some distortions during the plateau range, and when it comes to the flat stage, a slight derivation of OCV will incur a significant SoC error. As the discharge proceeds, the maximum error is reached at around t = 3000 s, and then the error progresses downhill. The overall trend of the error is shaped like a roller coaster. Approaching the terminal phase, the error goes across the zero-axis and terminates with a slight negative value. From a global view, the proposed estimator gives accurate results with a maximum error smaller than 1% under highly dynamic excitations. This implies that the utilization of Peukert equation can effectively tackle the rate-dependence of battery capacity.
Then, to achieve a deeper insight into the correction mechanism of the estimator against erroneous initials, another two experiments were launched with an error magnitude of 20% under constant temperatures of 35 °C and 15 °C, respectively. As Figure 9 and Figure 10 present, the estimator emphasizes a rapid convergence (steep error rise/drop) and achieves a primarily stable track in 50–100 s, which is ascribed to the progressive essence of AEKF. Although Figure 9 shows a positive error, it fluctuates along with a horizontal baseline without an obvious increase. The overall trend of Figure 10 manifests a wider error fluctuation from positive to negative. The statistical properties of the SoC errors indicate that the proposed estimator can accommodate different temperatures and initial errors with high reliability and robustness.

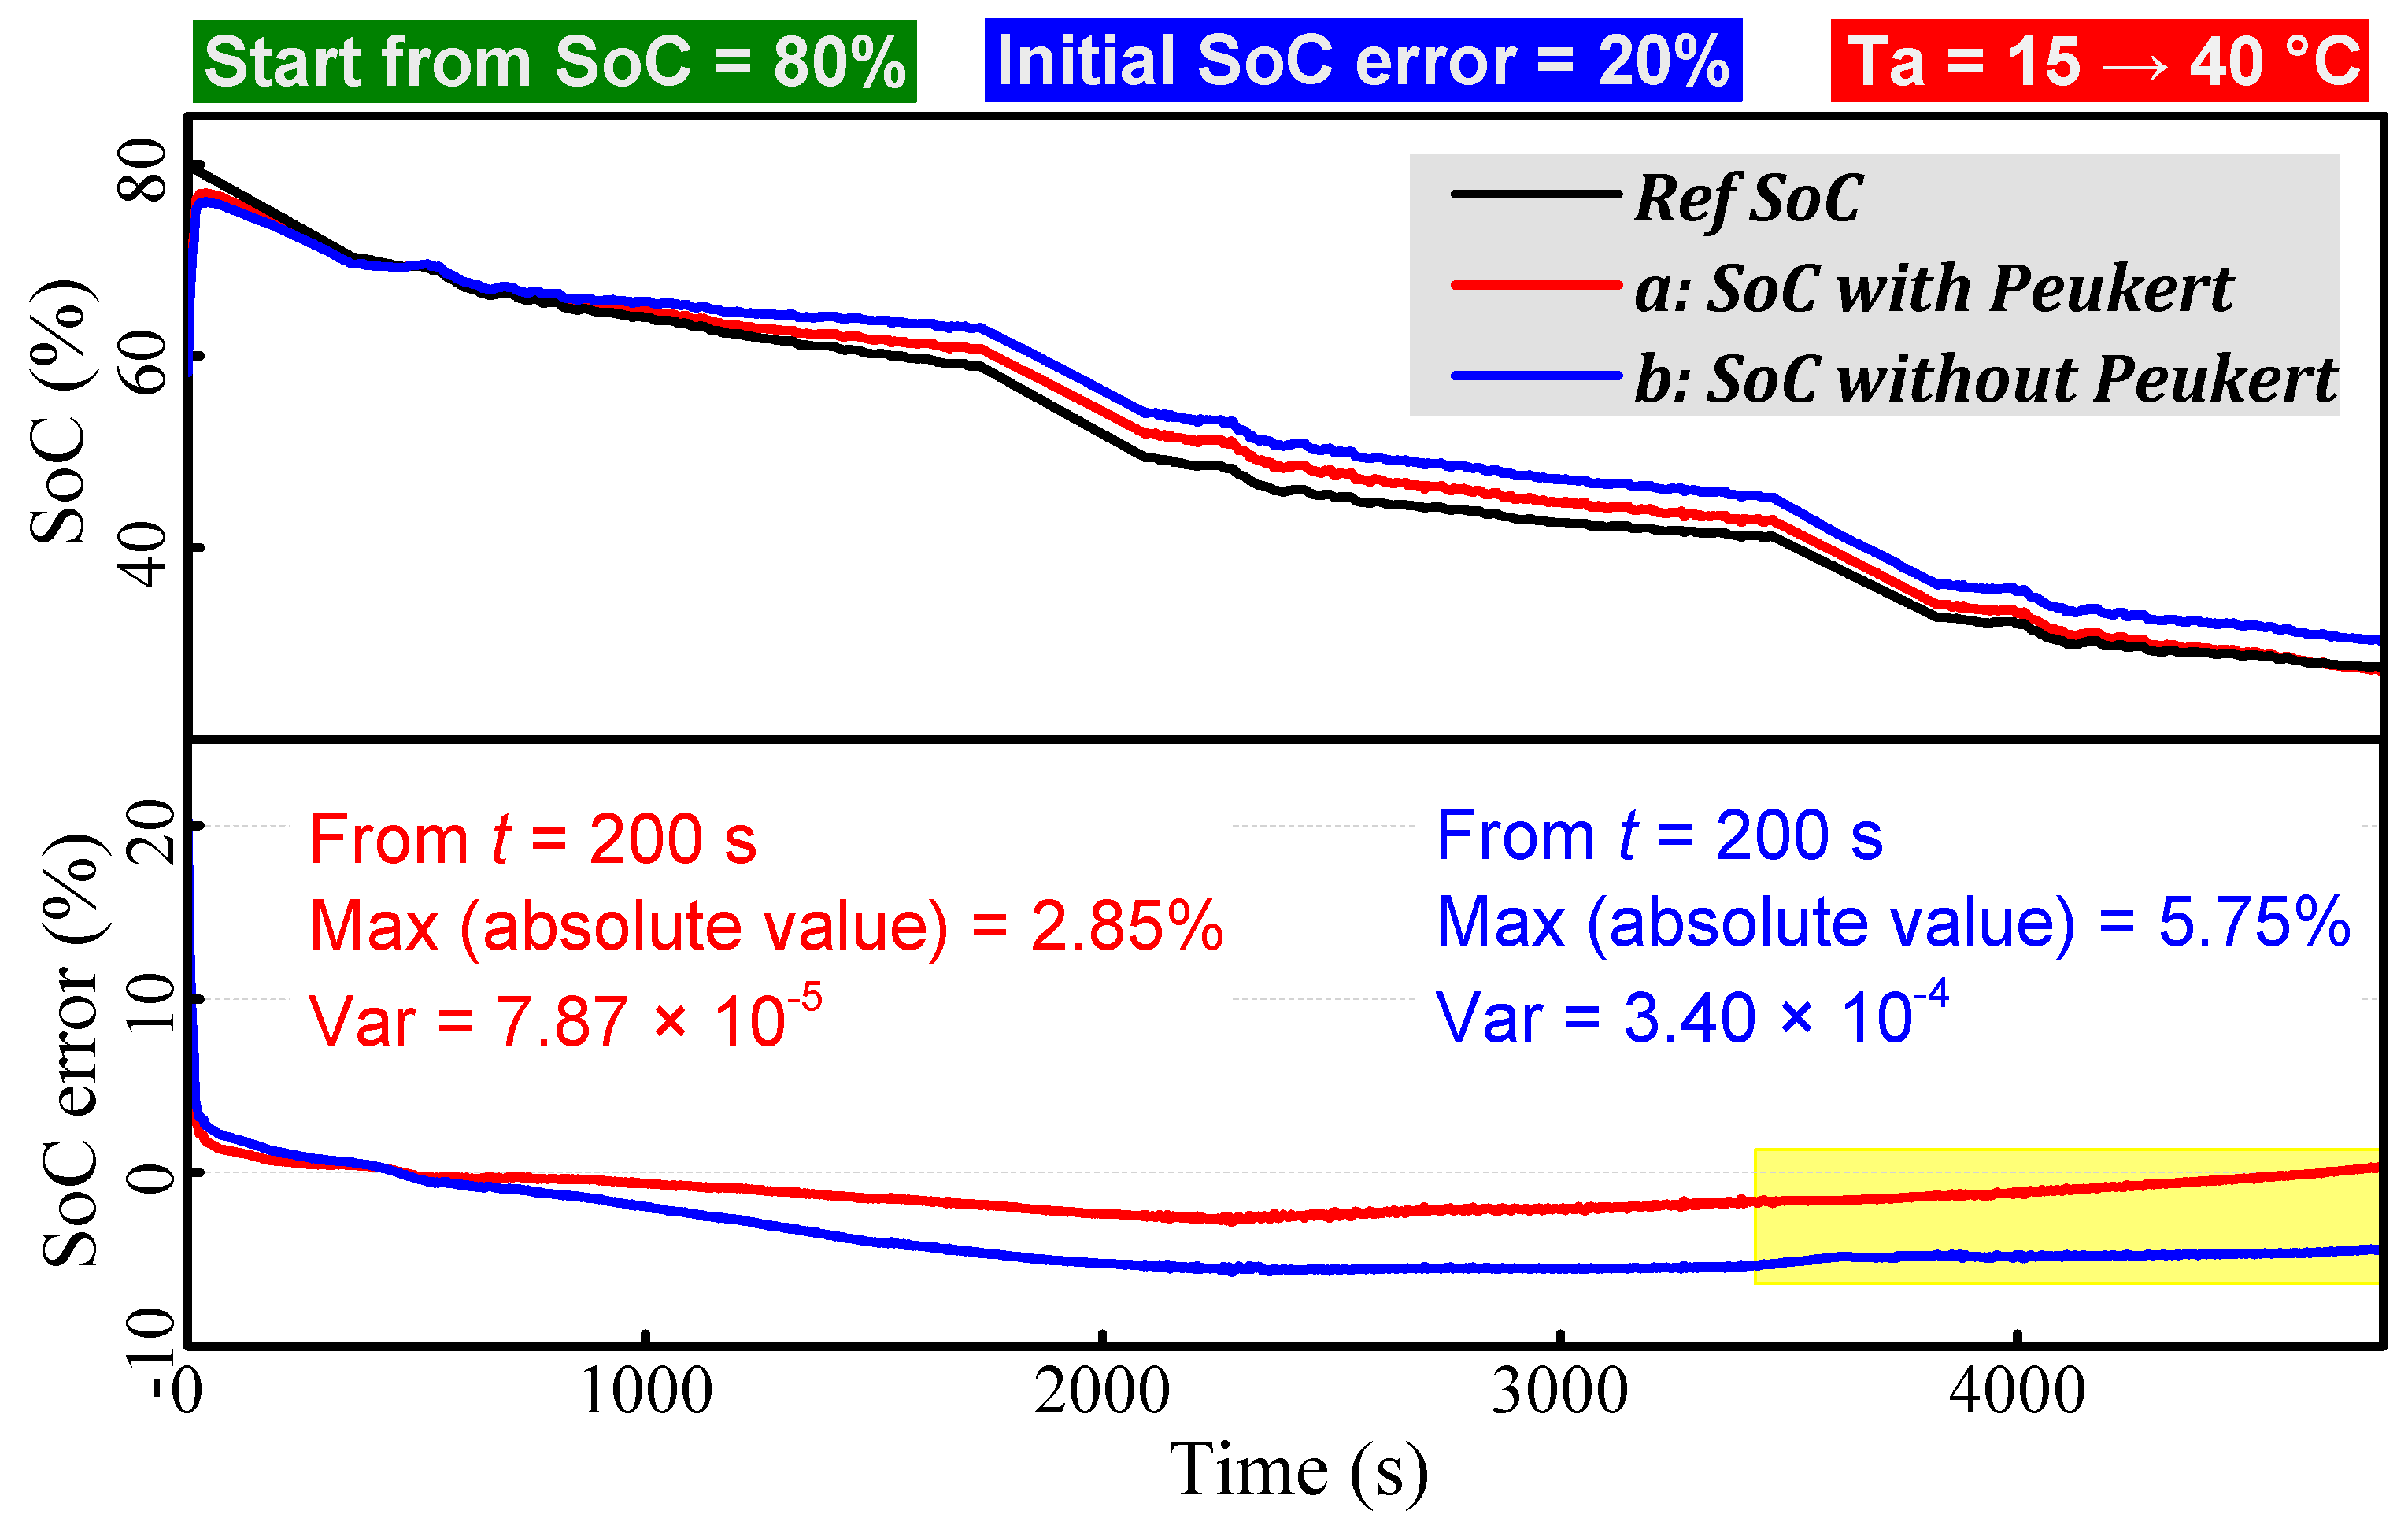
5.3. SoC Estimation under Varying Temperatures

Finally, tests under a varying temperature from 15 to 40 °C were conducted. Both the estimators (a) with Peukert adaption and (b) without Peukert adaption were operated. Note that estimator (b)uses the rated capacity ( C N ) for the SoC calculation. As Figure 11 delineates, the errors of (a) and (b) characterize immediate drops during the initial period promoted by the steep OCV–SoC appearance. Thereafter, the errors progress downhill and touch the bottom (min error) at about t = 2300 s. After this, (a) climbs back to the zero-axis gradually, whereas (b) is stuck around the level of −5.5% because (b) has no coping mechanism against the capacity variation from the varying temperature. The constant C N in (b) leads to a conservative SoC variation at low temperature and an overestimated SoC variation at high temperature. Consequently, (b) exhibits a considerable deviation from (a).
As for (a), there are two reasons contributing to the error evolution trend. First, as discussed above, the medium range of the OCV–SoC curve is sensitive and the actual OCV–SoC correlation under dynamic loads may suffer some bias compared with the curve acquired by static tests. Second, the varying temperature may lead to distortions to the employed capacity in the SoC governing equation (Equation (3)). Although the temperature effect has been modeled based on the Peukert equation, there still exist some inevitable inaccuracies. Nevertheless, the SoC error is acceptable with a maximum of 2.85% (absolute) under such a harsh condition.
In summary, the AEKF-based SoC estimator adapted by Peukert’s law can give consistent SoC tracking performance with robustness, accuracy, and reliability against various uncertainties under complex conditions.

6. Conclusions

To reproduce the behaviors of LiFePO4 batteries, this paper constructs a comprehensive battery ECM factoring in the effects of hysteresis potential, current rate, and temperature. The acting load current and capacity are adapted from an experimentally identified Peukert equation to consider the rate-dependence and temperature-dependence of battery capacity. Besides this, by analyzing the balance of heat generation and dissipation, we establish a battery TEM, which is exploited to identify ECM parameters. To cope with the uncertainties from model inaccuracies and complex conditions, a LMS-based on-line parameterization approach is designed, wherein both battery electrical behavior and thermal behavior are involved. Thereby, ECM parameters can be accurately tracked, and additionally, the parameter oscillations can be alleviated. Integrating the above achievements, an AEKF-based SoC estimator is constructed. Experiments under different conditions suggest that the proposed estimator can provide favorable SoC tracking performance. By covariance matching and on-line tuned ECM parameters, the AEKF estimator delivers the merits of rapid convergence and stable tracking under different conditions. The elaborate battery model not only contributes to the accuracy of SoC estimation, but also promotes the improvement of estimator reliability against harsh conditions.

Author Contributions

This research article has three authors. Jiale Xie proposed the idea and wrote the paper. Jiachen Ma and Jun Chen provided the experimental platform. Jun Chen, the corresponding author, corrected the paper and is responsible for the paper.

Funding

This work was supported by the National Natural Science Foundation of China (Grant No. 51475115).

Acknowledgments

We would like to thank Yuanli Liu for helping to correct the language problems.

Conflicts of Interest

The authors declare no conflict of interest.

References

  1. Rauh, N.; Franke, T.; Krems, J.F. Understanding the impact of electric vehicle driving experience on range anxiety. Hum. Factors 2015, 57, 177–187. [Google Scholar] [CrossRef] [PubMed]
  2. Sheikh, M.; Elmarakbi, A.; Rehman, S. Thermal and Electrical Failure Analysis of Lithium-Ion Battery after Crash. 2nd IEEC 2017. Available online: http://sure.sunderland.ac.uk/8061/ (accessed on 7 February 2018).
  3. Li, Y.; Wang, C.; Gong, J. A wavelet transform-adaptive unscented Kalman filter approach for state of charge estimation of LiFePo4 battery. Int. J. Energy Res. 2017, 42, 587–600. [Google Scholar] [CrossRef]
  4. Zhang, C.; Li, K.; Pei, L. An integrated approach for real-time model-based state-of-charge estimation of lithium-ion batteries. J. Power Sources 2015, 283, 24–36. [Google Scholar] [CrossRef] [Green Version]
  5. Waag, W.; Fleischer, C.; Sauer, D.U. Critical review of the methods for monitoring of lithium-ion batteries in electric and hybrid vehicles. J. Power Sources 2014, 258, 321–339. [Google Scholar] [CrossRef]
  6. Kang, L.W.; Zhao, X.; Ma, J. A new neural network model for the state-of-charge estimation in the battery degradation process. Appl. Energy 2014, 121, 20–27. [Google Scholar] [CrossRef]
  7. Hametner, C.; Jakubek, S. State of charge estimation for Lithium Ion cells: Design of experiments, nonlinear identification and fuzzy observer design. J. Power Sources 2013, 238, 413–421. [Google Scholar] [CrossRef]
  8. Hu, J.N.; Hu, J.J.; Lin, H.B. State-of-charge estimation for battery management system using optimized support vector machine for regression. J. Power Sources 2014, 269, 682–693. [Google Scholar] [CrossRef]
  9. Seaman, A.; Dao, T.S.; McPhee, J. A survey of mathematics-based equivalent-circuit and electrochemical battery models for hybrid and electric vehicle simulation. J. Power Sources 2014, 256, 410–423. [Google Scholar] [CrossRef]
  10. Lai, X.; Zheng, Y.; Sun, T. A comparative study of different equivalent circuit models for estimating state-of-charge of lithium-ion batteries. Electrochim. Acta 2018, 259, 566–577. [Google Scholar] [CrossRef]
  11. Guo, X.; Kang, L.; Yao, Y.; Huang, Z.; Li, W. Joint estimation of the electric vehicle power battery state of charge based on the least squares method and the Kalman filter algorithm. Energies 2016, 9, 100. [Google Scholar] [CrossRef]
  12. Wei, J.; Dong, G.; Chen, Z. On-board adaptive model for state of charge estimation of lithium-ion batteries based on Kalman filter with proportional integral-based error adjustment. J. Power Sources 2017, 365, 308–319. [Google Scholar] [CrossRef]
  13. Yu, Z.; Huai, R.; Xiao, L. State-of-charge estimation for lithium-ion batteries using a kalman filter based on local linearization. Energies 2015, 8, 7854–7873. [Google Scholar] [CrossRef]
  14. Plett, G.L. Extended Kalman filtering for battery management systems of LiPB-based HEV battery packs: Part 3. State and parameter estimation. J. Power Sources 2004, 134, 277–292. [Google Scholar] [CrossRef]
  15. Peukert, W. Über die Abhängigkeit der Kapacität von der Entladestromstärke bei. Bleiakkumulatoren. Elektrotechnische Z. 1897, 20, 20–21. [Google Scholar]
  16. Omar, N.; Bossche, P.V.D.; Coosemans, T.; Mierlo, J.V. Peukert revisited—Critical appraisal and need for modification for lithium-ion batteries. Energies 2013, 6, 5625–5641. [Google Scholar] [CrossRef]
  17. Doerffel, D.; Sharkh, S.A. A critical review of using the Peukert equation for determining the remaining capacity of lead-acid and lithium-ion batteries. J. Power Sources 2006, 155, 395–400. [Google Scholar] [CrossRef]
  18. Abu-Sharkh, S.; Doerffel, D. Rapid test and non-linear model characterisation of solid-state lithium-ion batteries. J. Power Sources 2004, 130, 266–274. [Google Scholar] [CrossRef]
  19. Pei, L.; Wang, T.; Lu, R. Development of a voltage relaxation model for rapid open-circuit voltage prediction in lithium-ion batteries. J. Power Sources 2014, 253, 412–418. [Google Scholar] [CrossRef]
  20. Bernardi, D.; Pawlikowski, E.; Newman, J. A general energy balance for battery systems. J. Electrochem. Soc. 1985, 132, 5–12. [Google Scholar] [CrossRef]
  21. Wei, Z.; Lim, T.M.; Skyllas-Kazacos, M.; Wai, N.; Tseng, K.J. Online state of charge and model parameter co-estimation based on a novel multi-timescale estimator for vanadium redox flow battery. Appl. Energy 2016, 172, 169–179. [Google Scholar] [CrossRef]
  22. Zhang, C.; Allafi, W.; Dinh, Q. Online estimation of battery equivalent circuit model parameters and state of charge using decoupled least squares technique. Energy 2018, 142, 678–688. [Google Scholar] [CrossRef]
  23. Dong, G.; Wei, J.; Zhang, C.; Chen, Z. Online state of charge estimation and open circuit voltage hysteresis modeling of LiFePO4 battery using invariant imbedding method. Appl. Energy 2016, 162, 163–171. [Google Scholar] [CrossRef]
  24. Wei, Z.; Zhao, J.; Ji, D.; Tseng, K.J. A multi-timescale estimator for battery state of charge and capacity dual estimation based on an online identified model. Appl. Energy 2017, 204, 1264–1274. [Google Scholar] [CrossRef]
  25. Chen, Z.; Mi, C.C.; Fu, Y. Online battery state of health estimation based on genetic algorithm for electric and hybrid vehicle applications. J. Power Sources 2013, 240, 184–192. [Google Scholar] [CrossRef]
  26. Li, X.; Shu, X.; Shen, J.; Xiao, R.; Yan, W.; Chen, Z. An On-Board Remaining Useful Life Estimation Algorithm for Lithium-Ion Batteries of Electric Vehicles. Energies 2017, 10, 691. [Google Scholar] [CrossRef]
  27. Li, J.; Barillas, J.K.; Guenther, C. Sequential Monte Carlo filter for state estimation of LiFePO4 batteries based on an online updated model. J. Power Sources 2014, 247, 156–162. [Google Scholar] [CrossRef]
  28. Xiong, R.; Sun, F.; He, H.; Nguyen, T.D. A data-driven adaptive state of charge and power capability joint estimator of lithium-ion polymer battery used in electric vehicles. Energy 2013, 63, 295–308. [Google Scholar] [CrossRef]
  29. Wei, Z.; Zou, C.; Leng, F.; Soong, B.H.; Tseng, K.J. Online model identification and state-of-charge estimate for lithium-ion battery with a recursive total least squares-based observer. IEEE Trans. Ind. Electron. 2018, 65, 1336–1346. [Google Scholar] [CrossRef]
  30. Mehra, R. Approaches to adaptive filtering. IEEE Trans. Autom. Control 1972, 17, 693–698. [Google Scholar] [CrossRef]
Figure 1. Experimental setup.
Energies 11 01112 g001
Figure 2. The average open-circuit voltage–state of charge (OCV–SoC) correlations acquired at different temperatures.
Energies 11 01112 g002
Figure 3. Fitting the C p and p c with polynomials.
Energies 11 01112 g003
Figure 4. Expanded Federal Urban Driving Schedule (FUDS).
Energies 11 01112 g004
Figure 5. Second-order equivalent circuit model.
Energies 11 01112 g005
Figure 6. Details of the adaptive extended Kalman filter (AEKF) algorithm and the AEKF-based SoC estimation scheme, where Λ is the width of the moving average window, K is the Kalman gain, and P is the error covariance matrix. ECM = equivalent battery model; LMS = Least-Mean-Square.
Energies 11 01112 g006
Figure 7. Changing trajectories of the ECM resistors.
Energies 11 01112 g007
Figure 8. SoC estimation result with a correct initial value under 35 °C.
Energies 11 01112 g008
Figure 9. SoC estimation result with −20% initial error under 35 °C.
Energies 11 01112 g009
Figure 10. SoC estimation result with −20% initial error under 15 °C.
Energies 11 01112 g010
Figure 11. SoC estimation results with and without Peukert adaption, with 20% initial error under a varying temperature from 15 °C to 40 °C.
Energies 11 01112 g011
Table 1. Specifications of the investigated 26650 LiFePO4 cell.
ParametersValue
ChemistryLiFePO4/graphite
Rated capacity ( C N )3.3 Ah@1C 27 °C
Nominal voltage3.2 V
Upper cut-off voltage3.65 V
Lower cut-off voltage2.0 V
Operation temperature−10–55 °C
Table 2. The fitted coefficients of Equation (9).
K 0 K 1 K 2 K 3 K 4 K 5 K 6 K 7
29.10−23.970.3474.4481.16611.554.656 × 10−3−4.392 × 10⁻⁵
Table 3. The meanings and values of the symbols in Equation (10).
SymbolMeaningValue
c p Heat capacity1015 J·Kg−1·K−1
h c Convective heat transfer coefficient6.32 W·m−2·K−1
A Effective surface area (10 cells)5.61 × 10⁻² m 2
m Mass (10 cells)0.89 Kg
A is measured avoiding the area covered by the Ni1000SOTs.

