Research on Stator Main Insulation Temperature Field of Air-Cooled Turbo-Generator after Main Insulation Shelling


Abstract
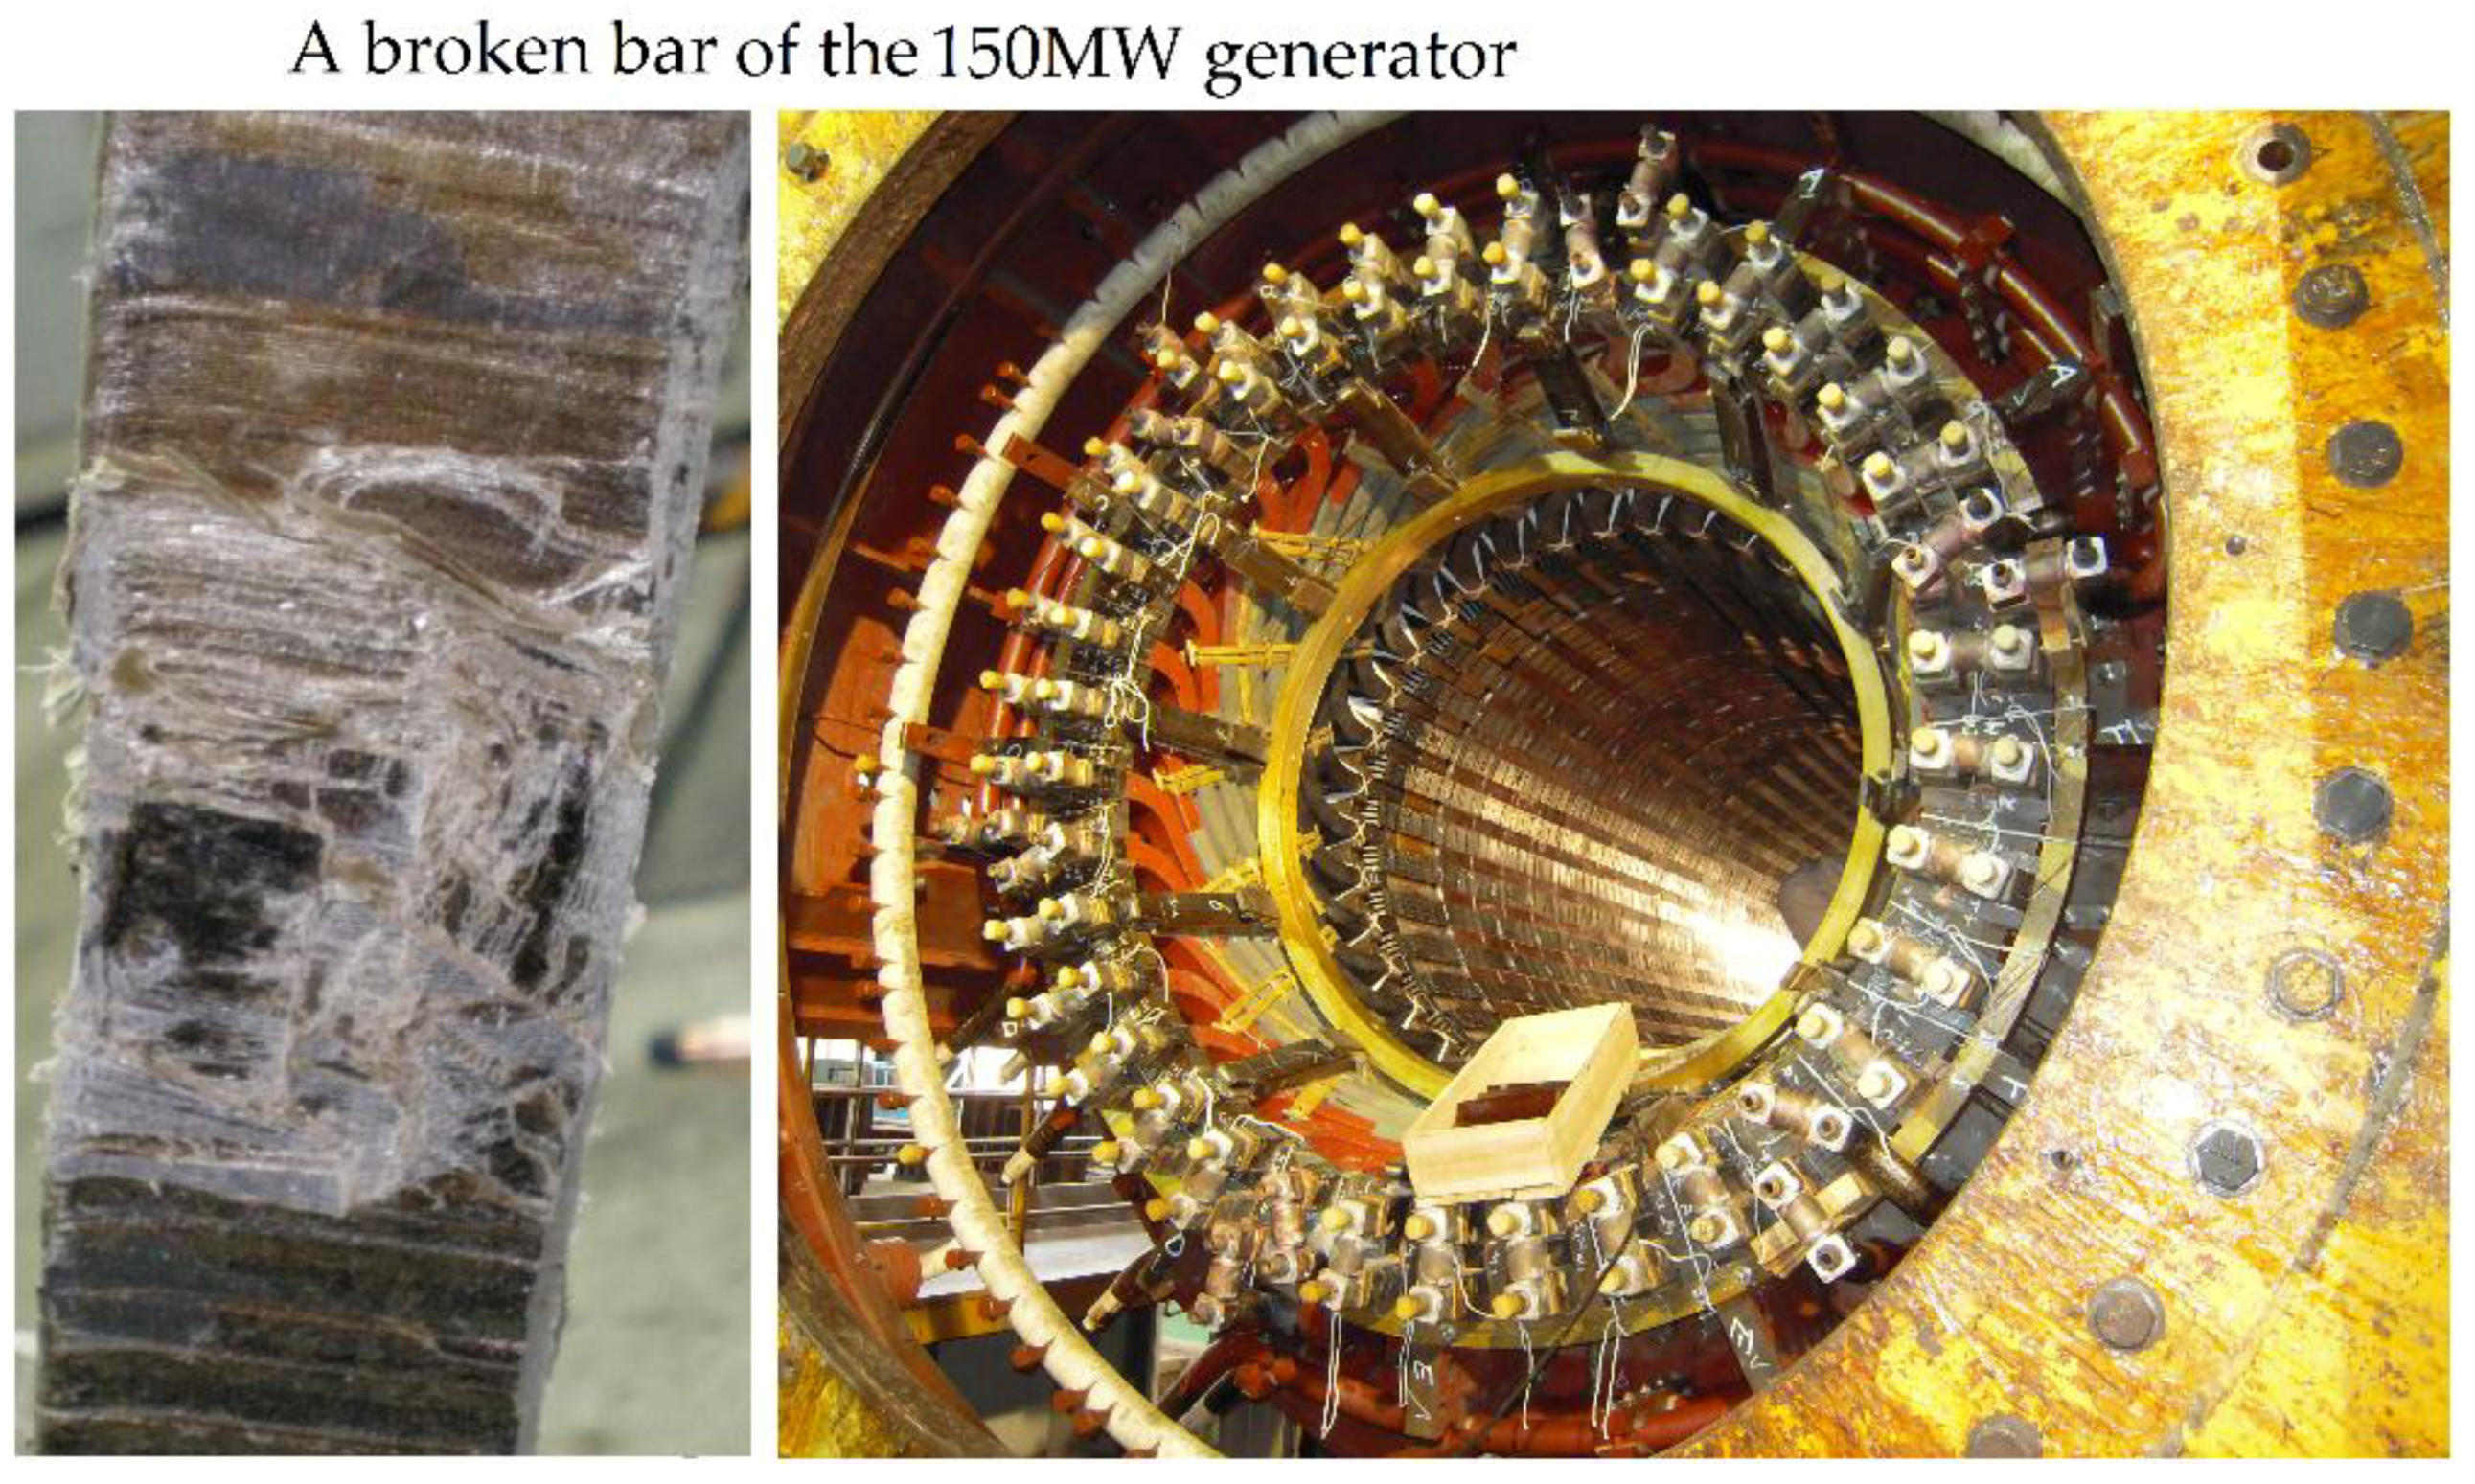
:1. Introduction
2. Stator Calculation Model of Turbo-Generator
2.1. Basic Parameters and Physical Model of Air-Cooled Turbine Generator
2.2. 3D Mathematical Model of Temperature Field of Turbo-Generator Stator
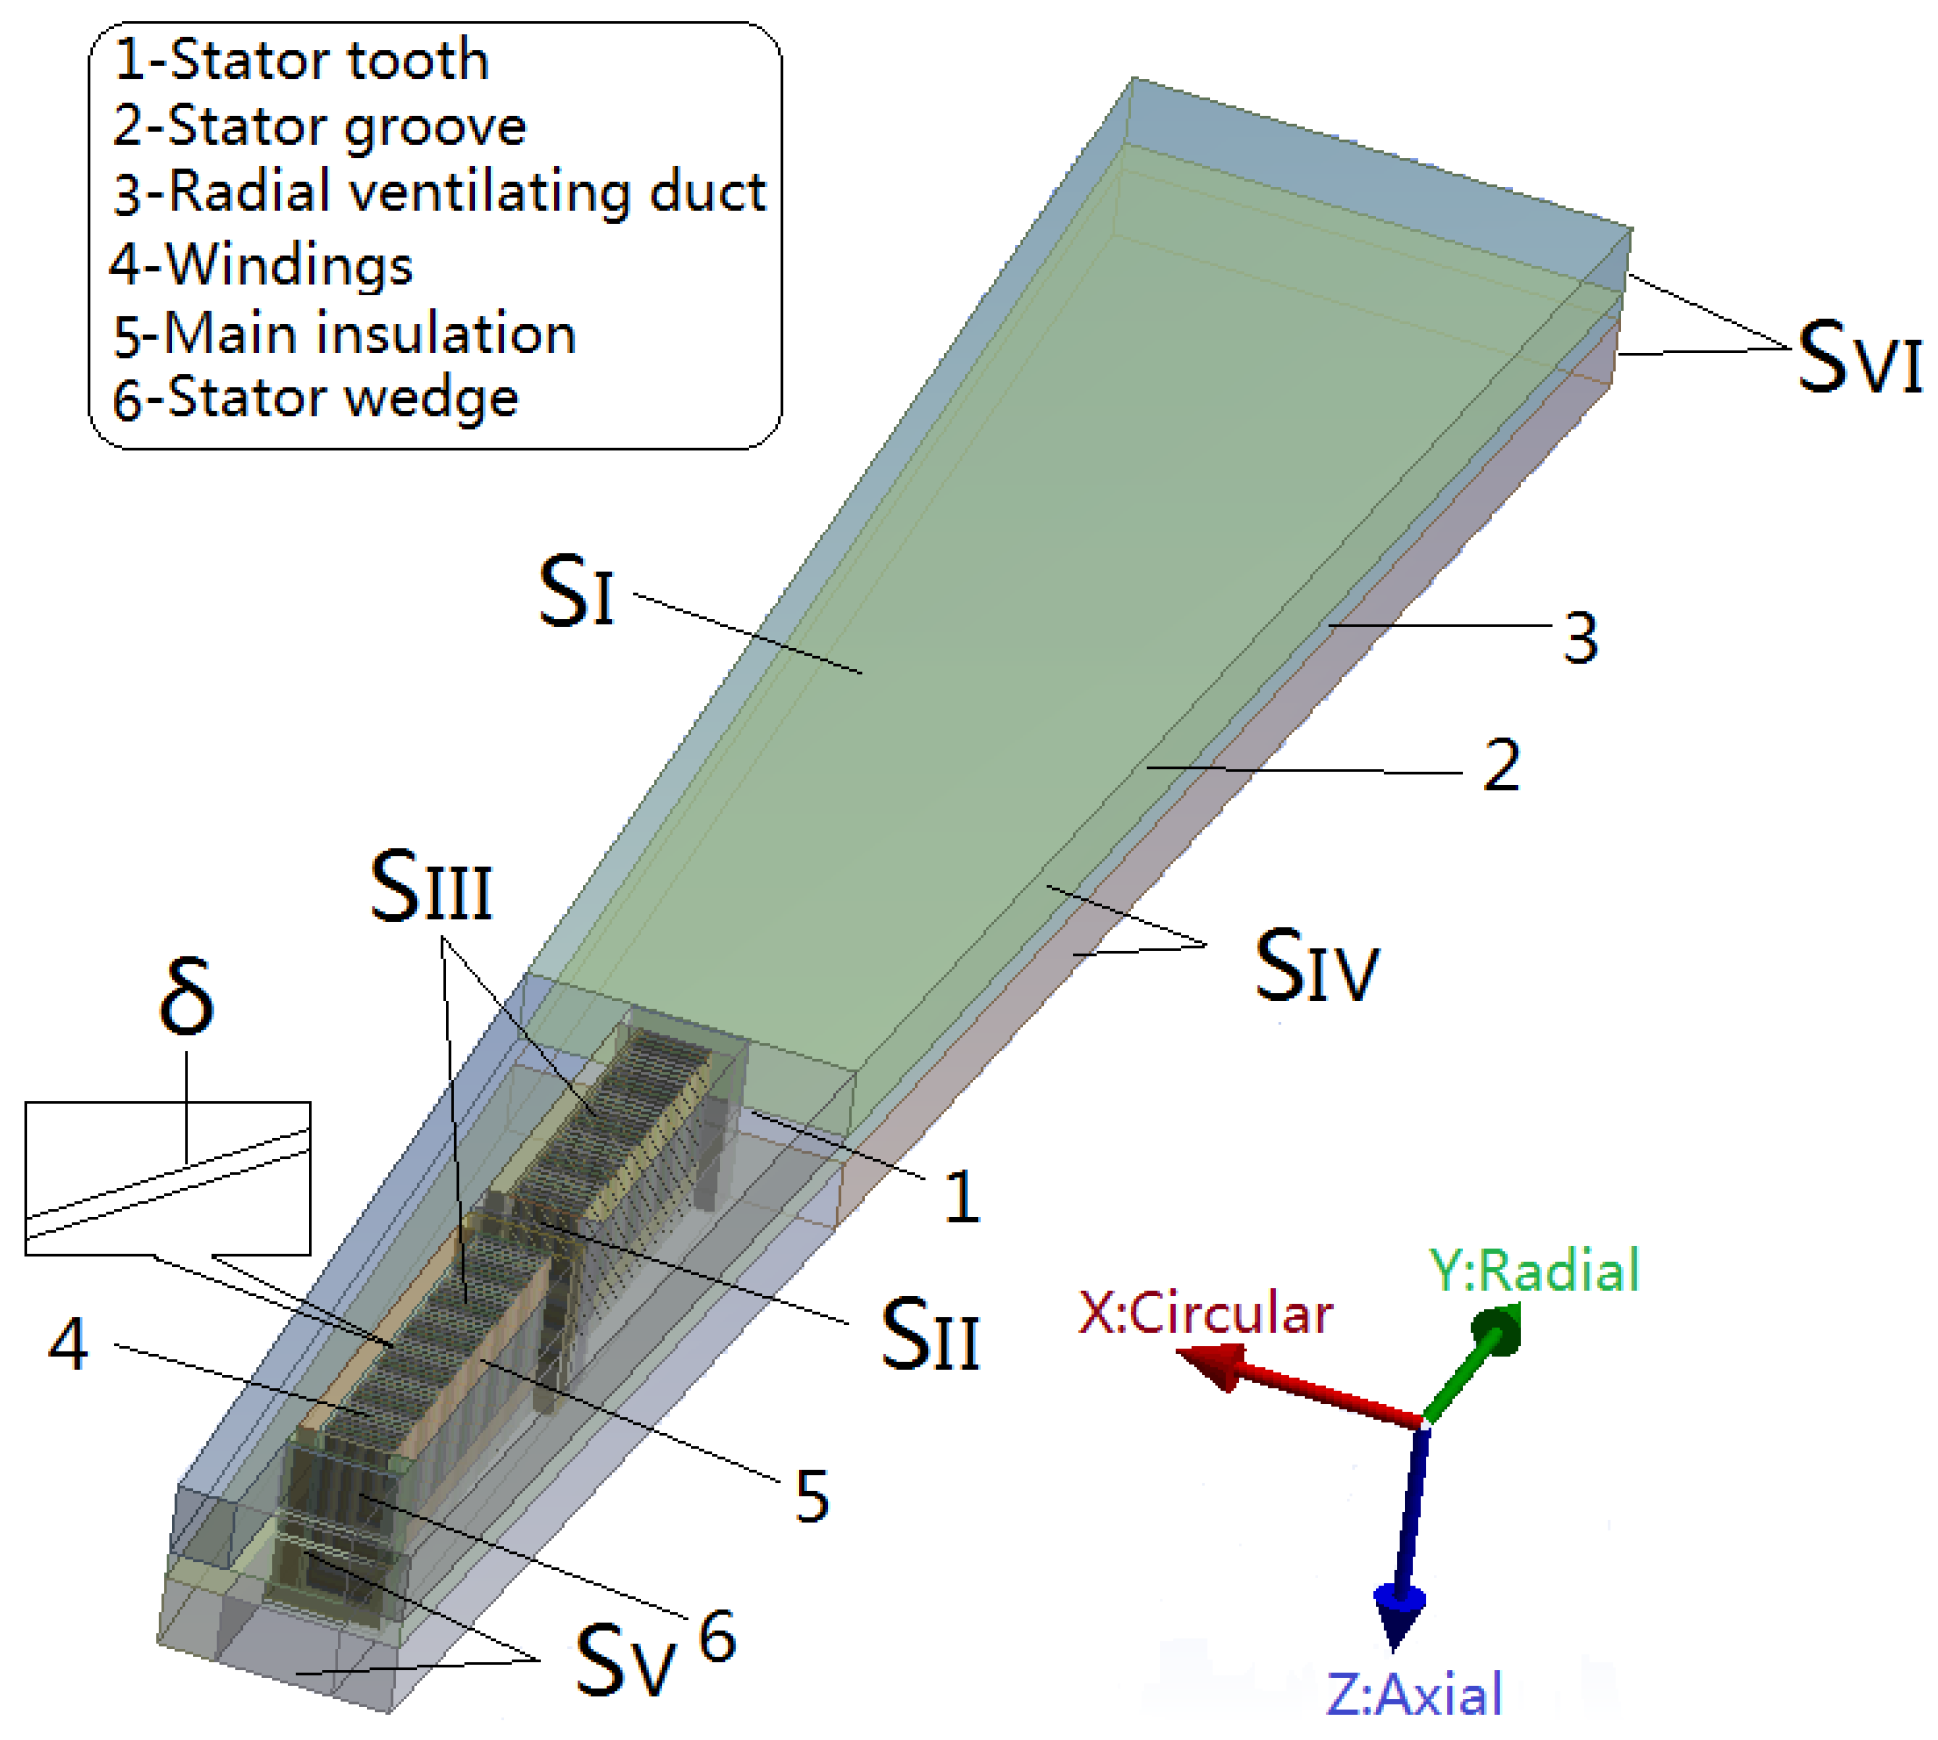
2.3. Calculation Model of 3D Temperature Field of Turbo-Generator Stator
- (1)
- SI, SII, SIII and SIV are adiabatic surfaces, which satisfy:
- (2)
- Tooth top SV and Yoke back SVI are heat transfer surfaces, which satisfy:where n is normal vector of surface, λ is heat transfer coefficient, Tf is ambient temperature.
- (3)
- The outlet port of stator radial ventilating duct is set a standard atmospheric pressure condition. The inlet air velocity of stator ventilating duct is 15.8, which is calculated by air volume of rotor outlet port and air gap, while the inlet air temperature of the stator ventilating duct is 68 °C which is defined by outlet air temperature of rotor ventilating duct.
3. Main Insulation Temperature Field Calculation Results and Analysis of Air-Cooled Turbo-Generator Stator
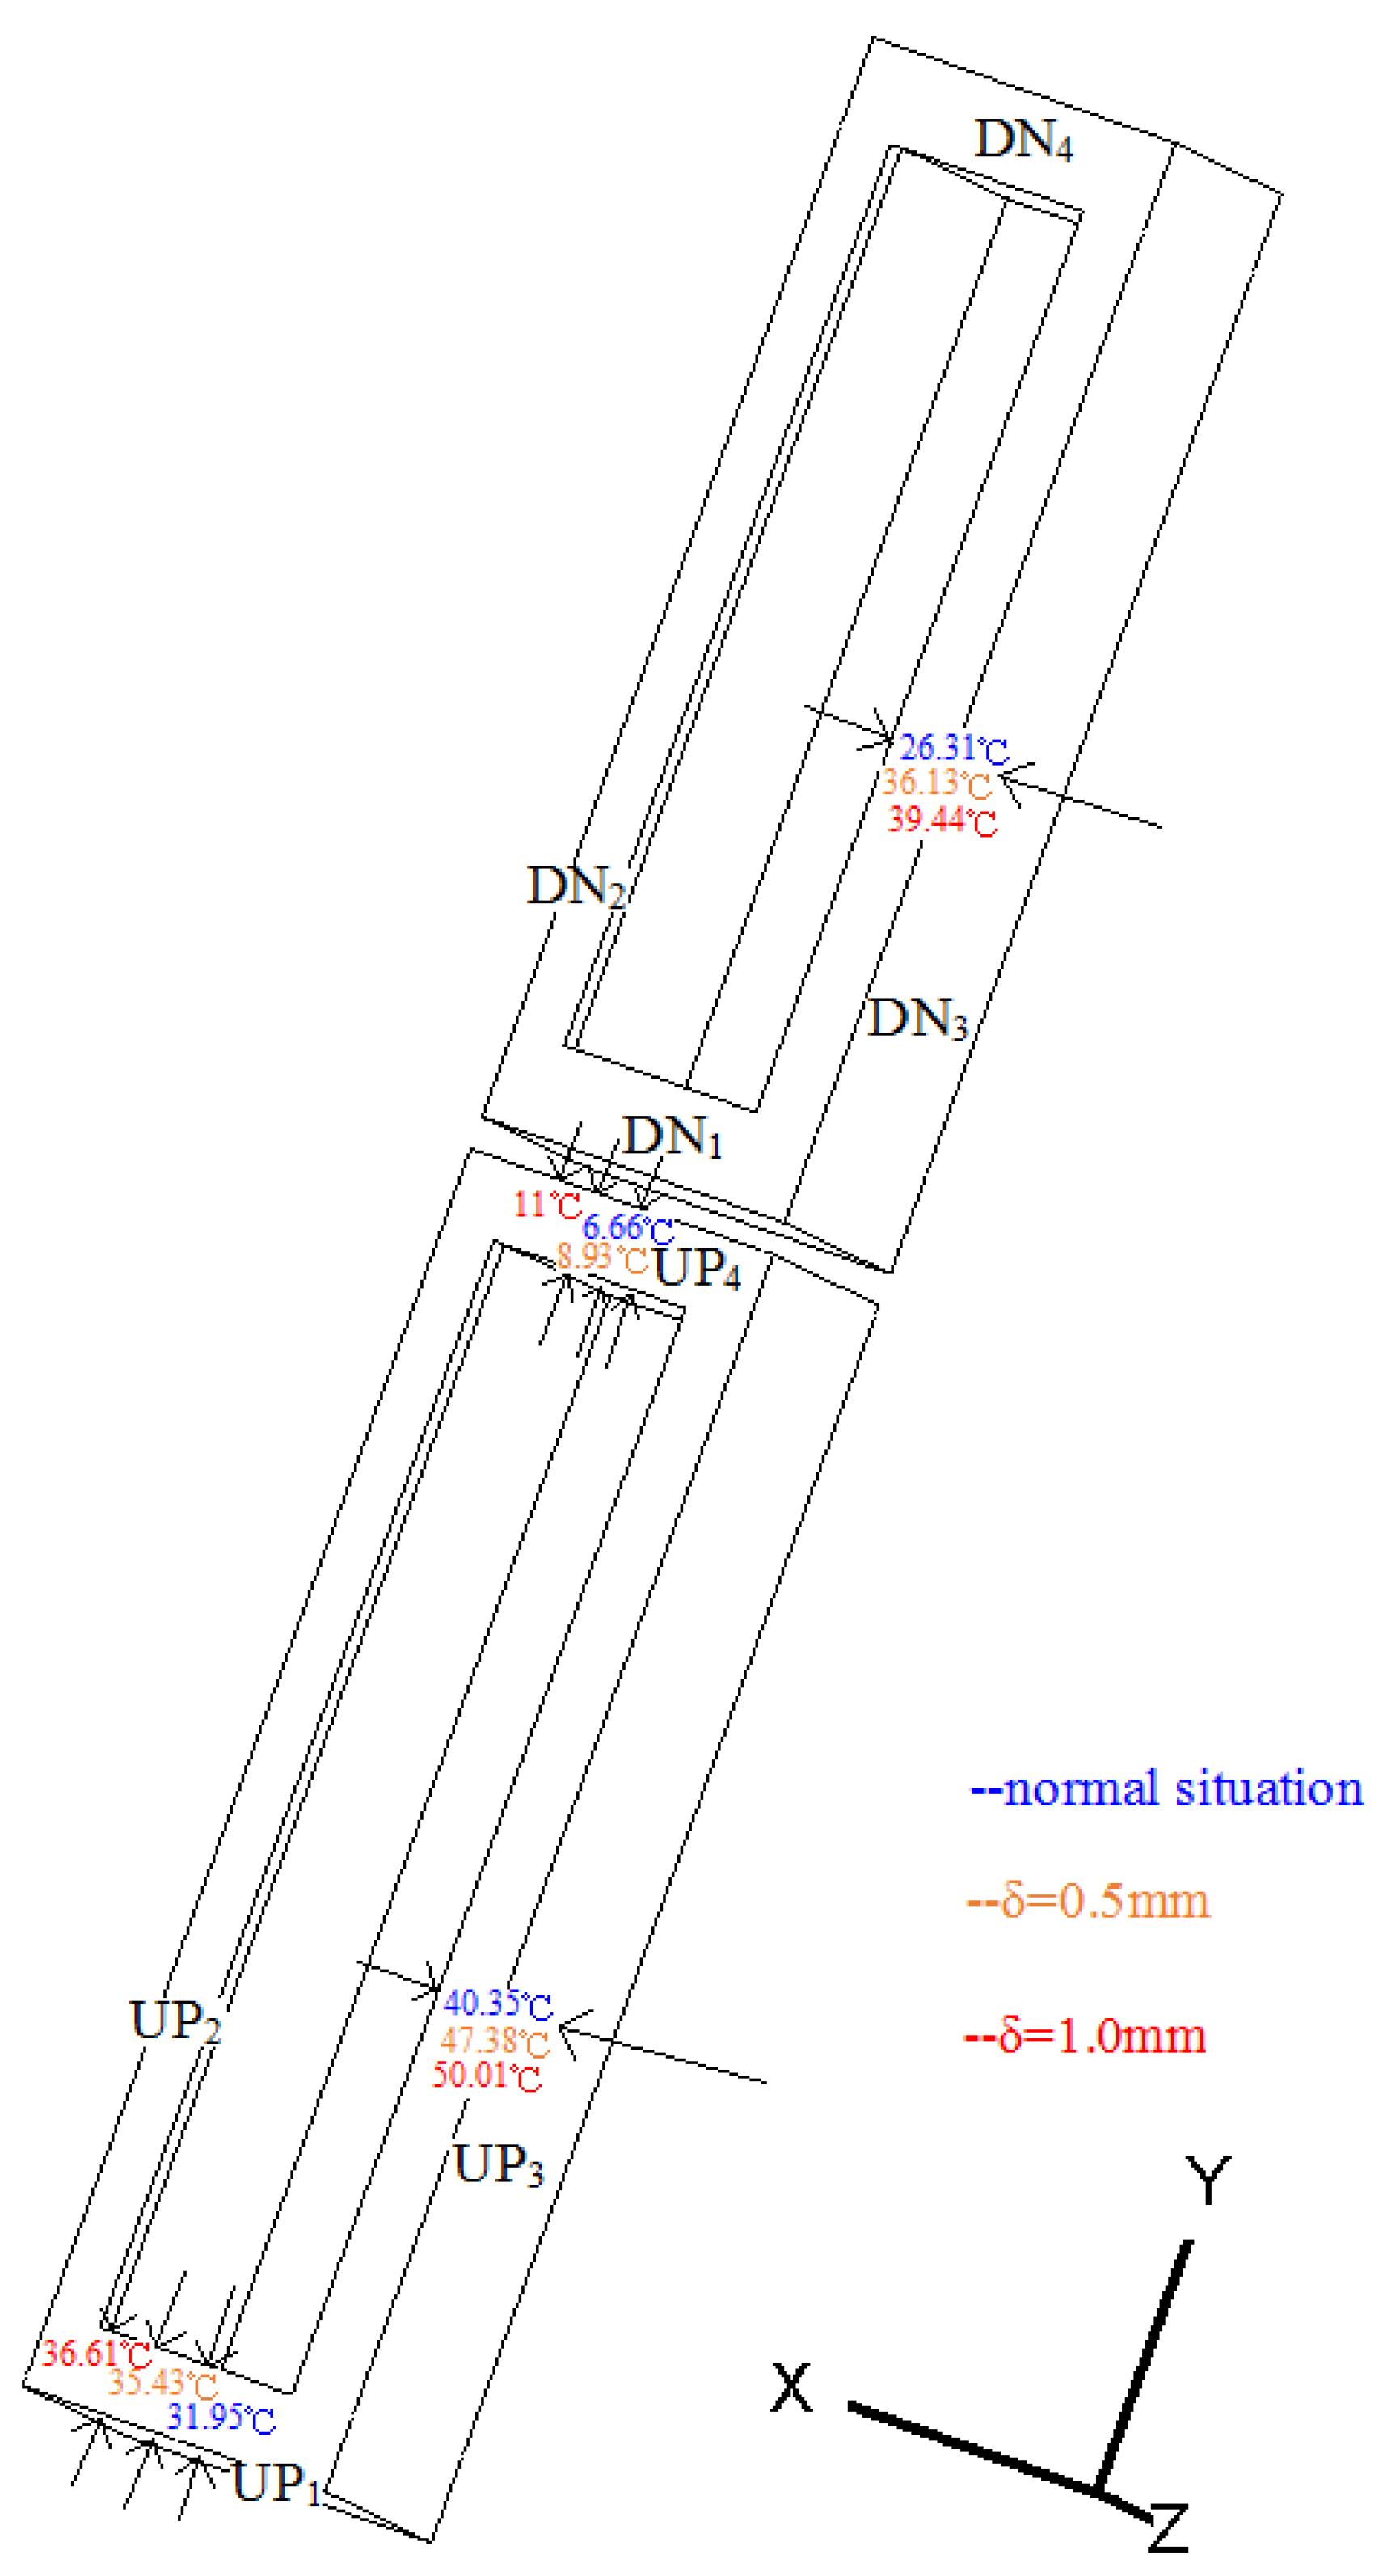
3.1. Research on the Influence of Stator Main Insulation Shelling on Main Insulation Temperature Drop
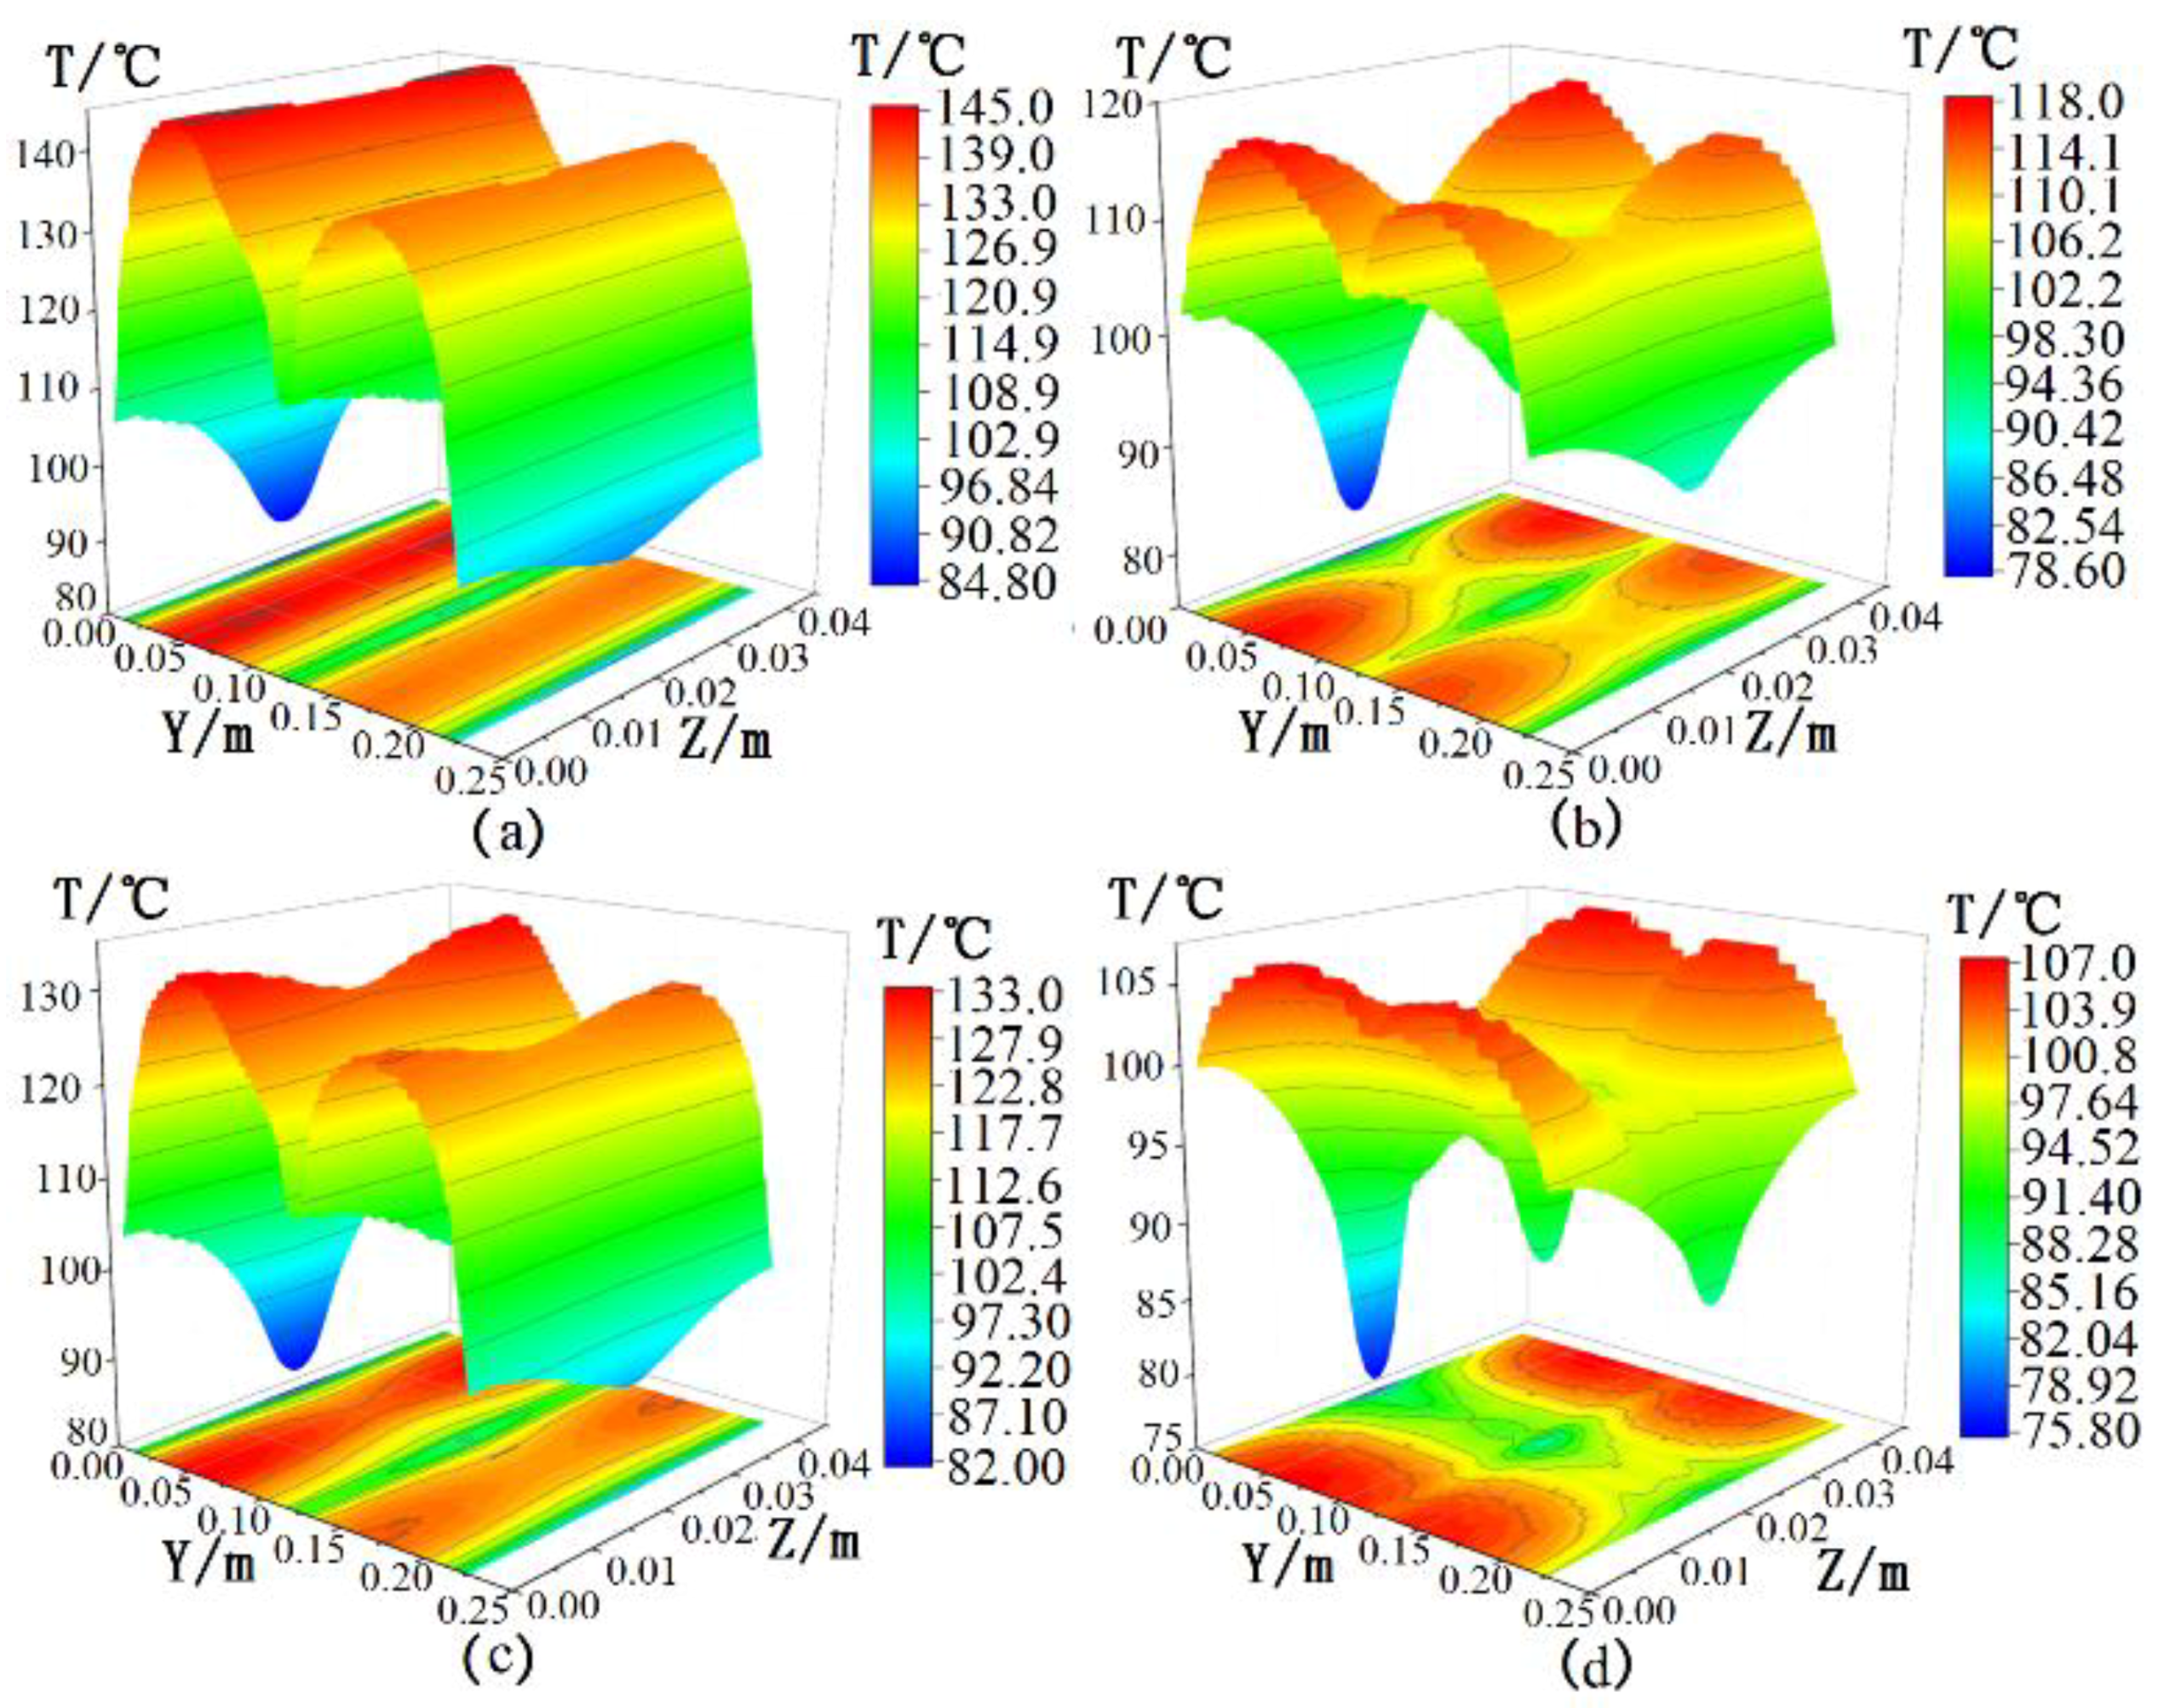
3.2. Research on the Main Insulation Temperature Distribution in the Axis–Radial Section under Main Insulation Normal Operation and Fault Operation
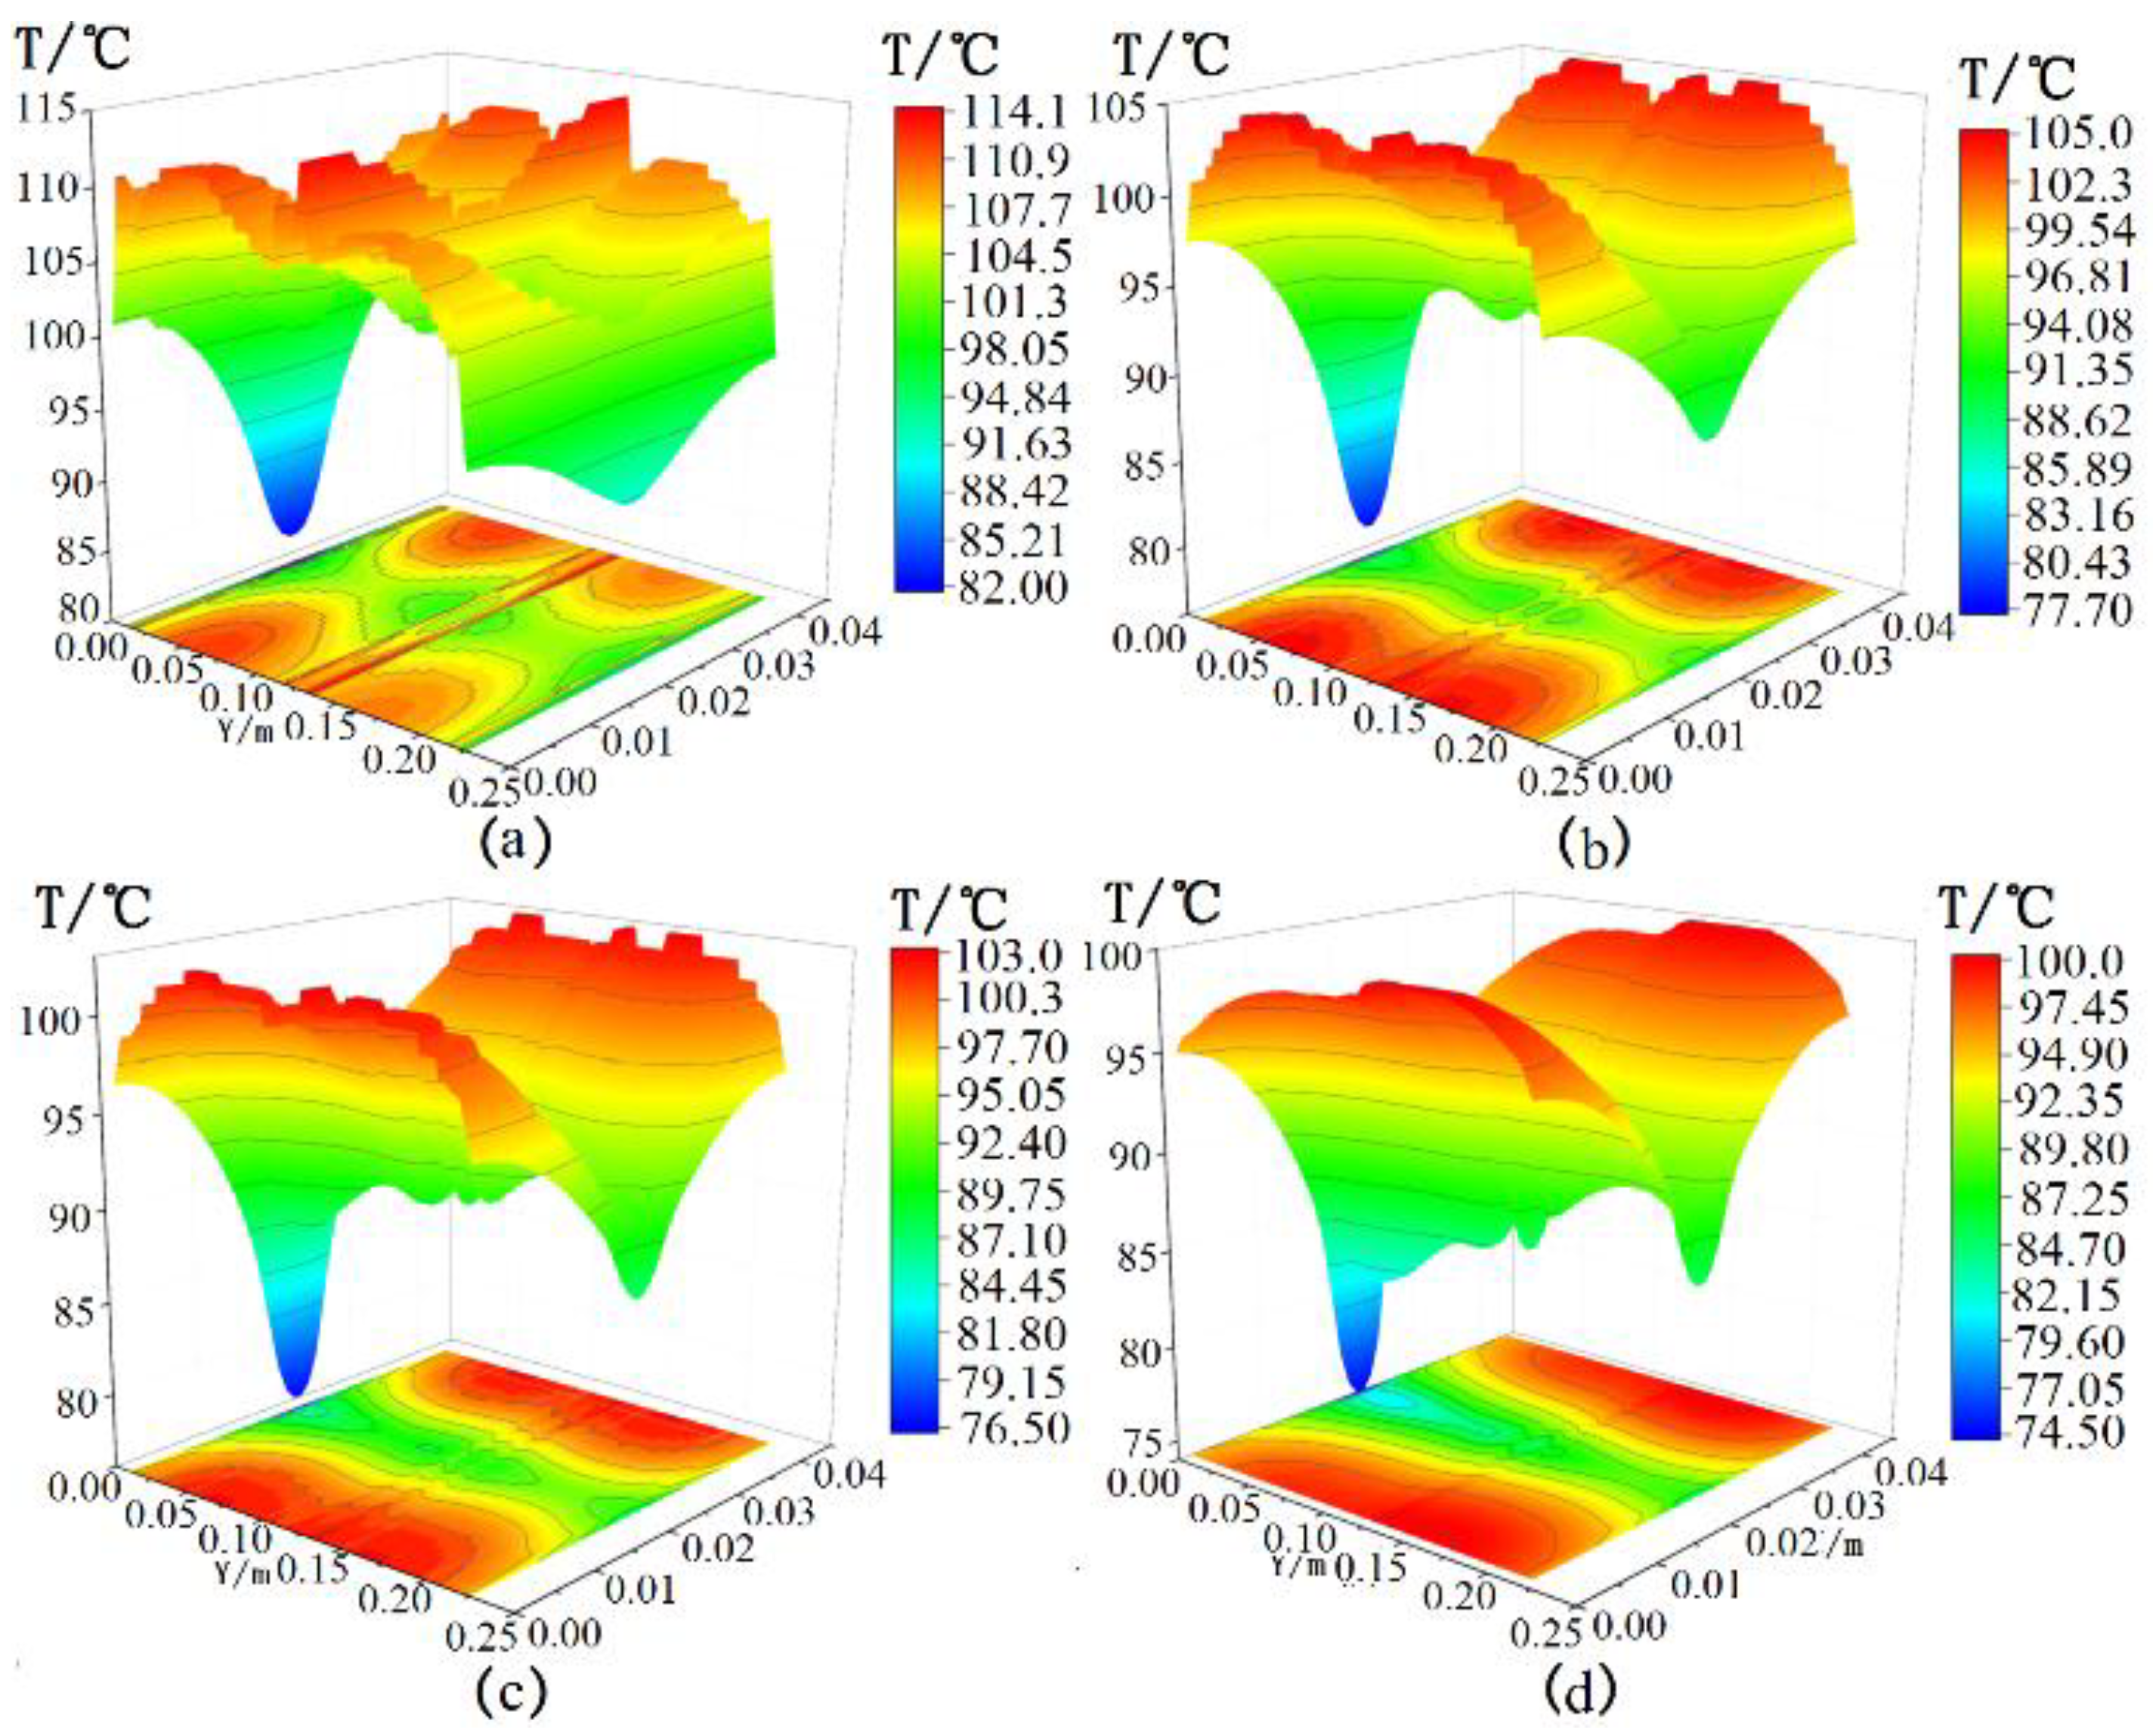
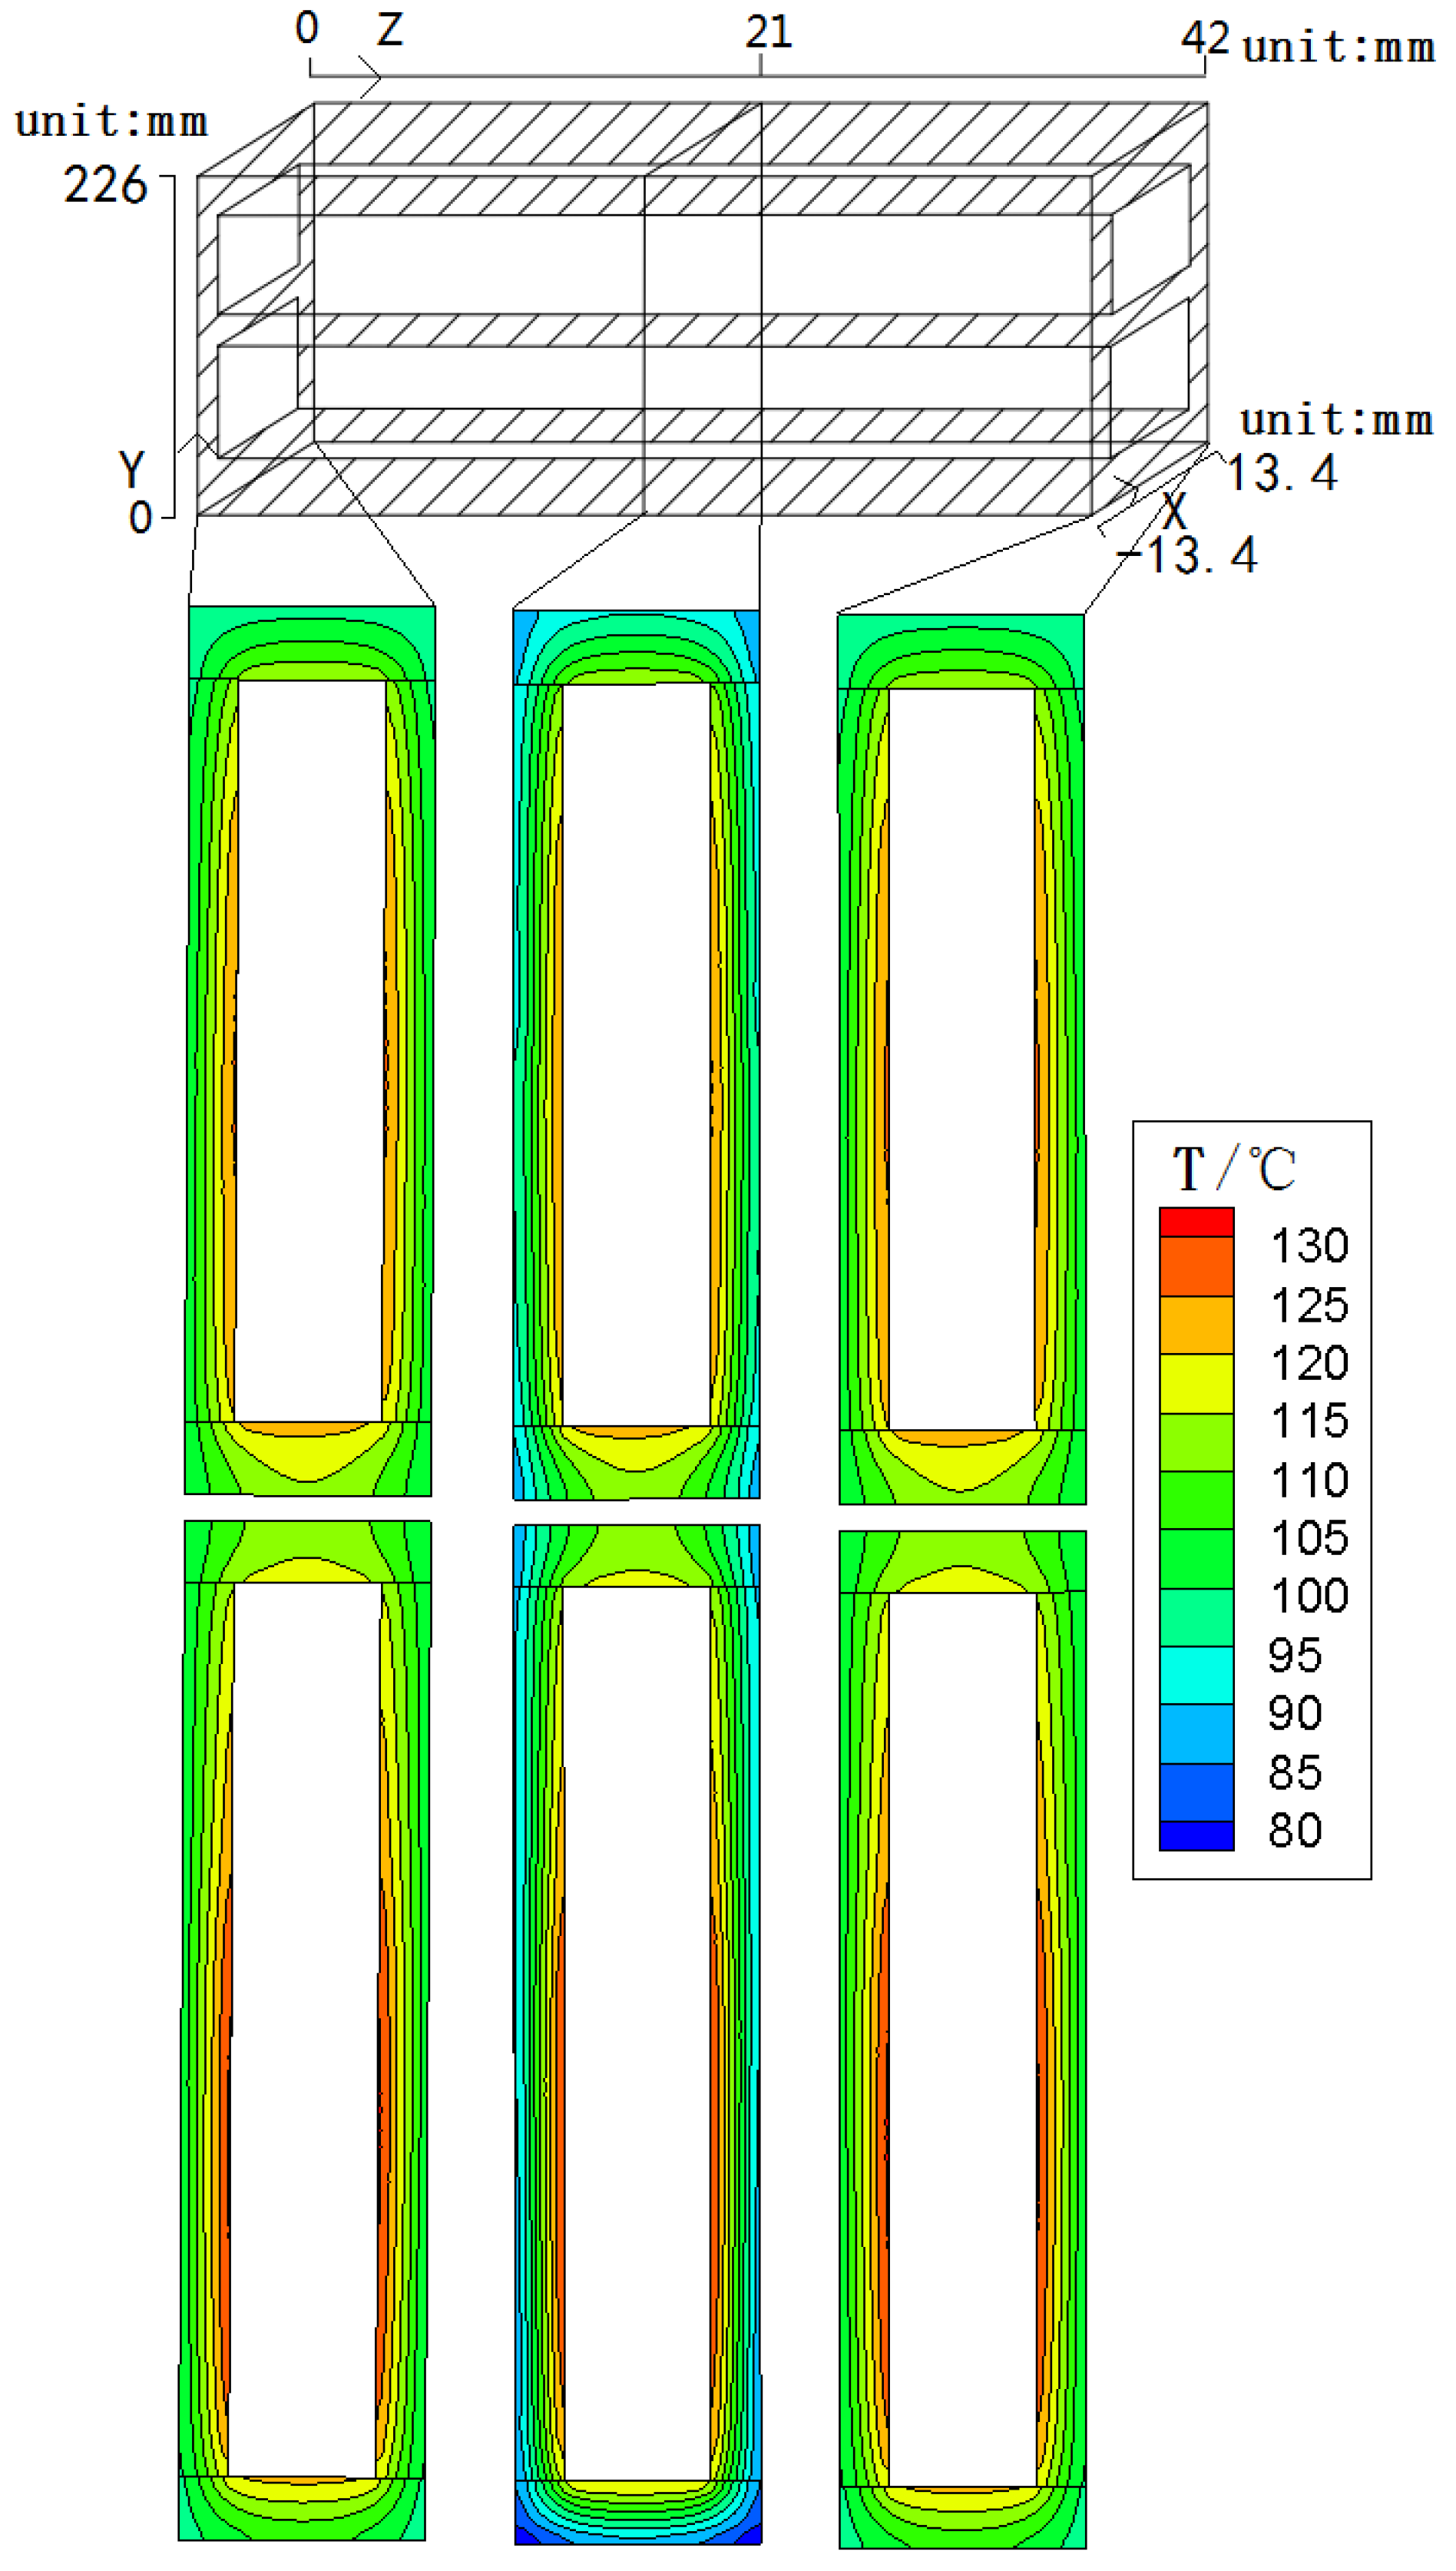
3.3. Research on the Temperature Distribution of Circumferential–Radial Section under the Main Insulation of Stator Windings Normal Operation and Fault Operation
3.3.1. The Main Insulation Temperature Distribution Along the Circumferential–Radial Direction under Normal Operation
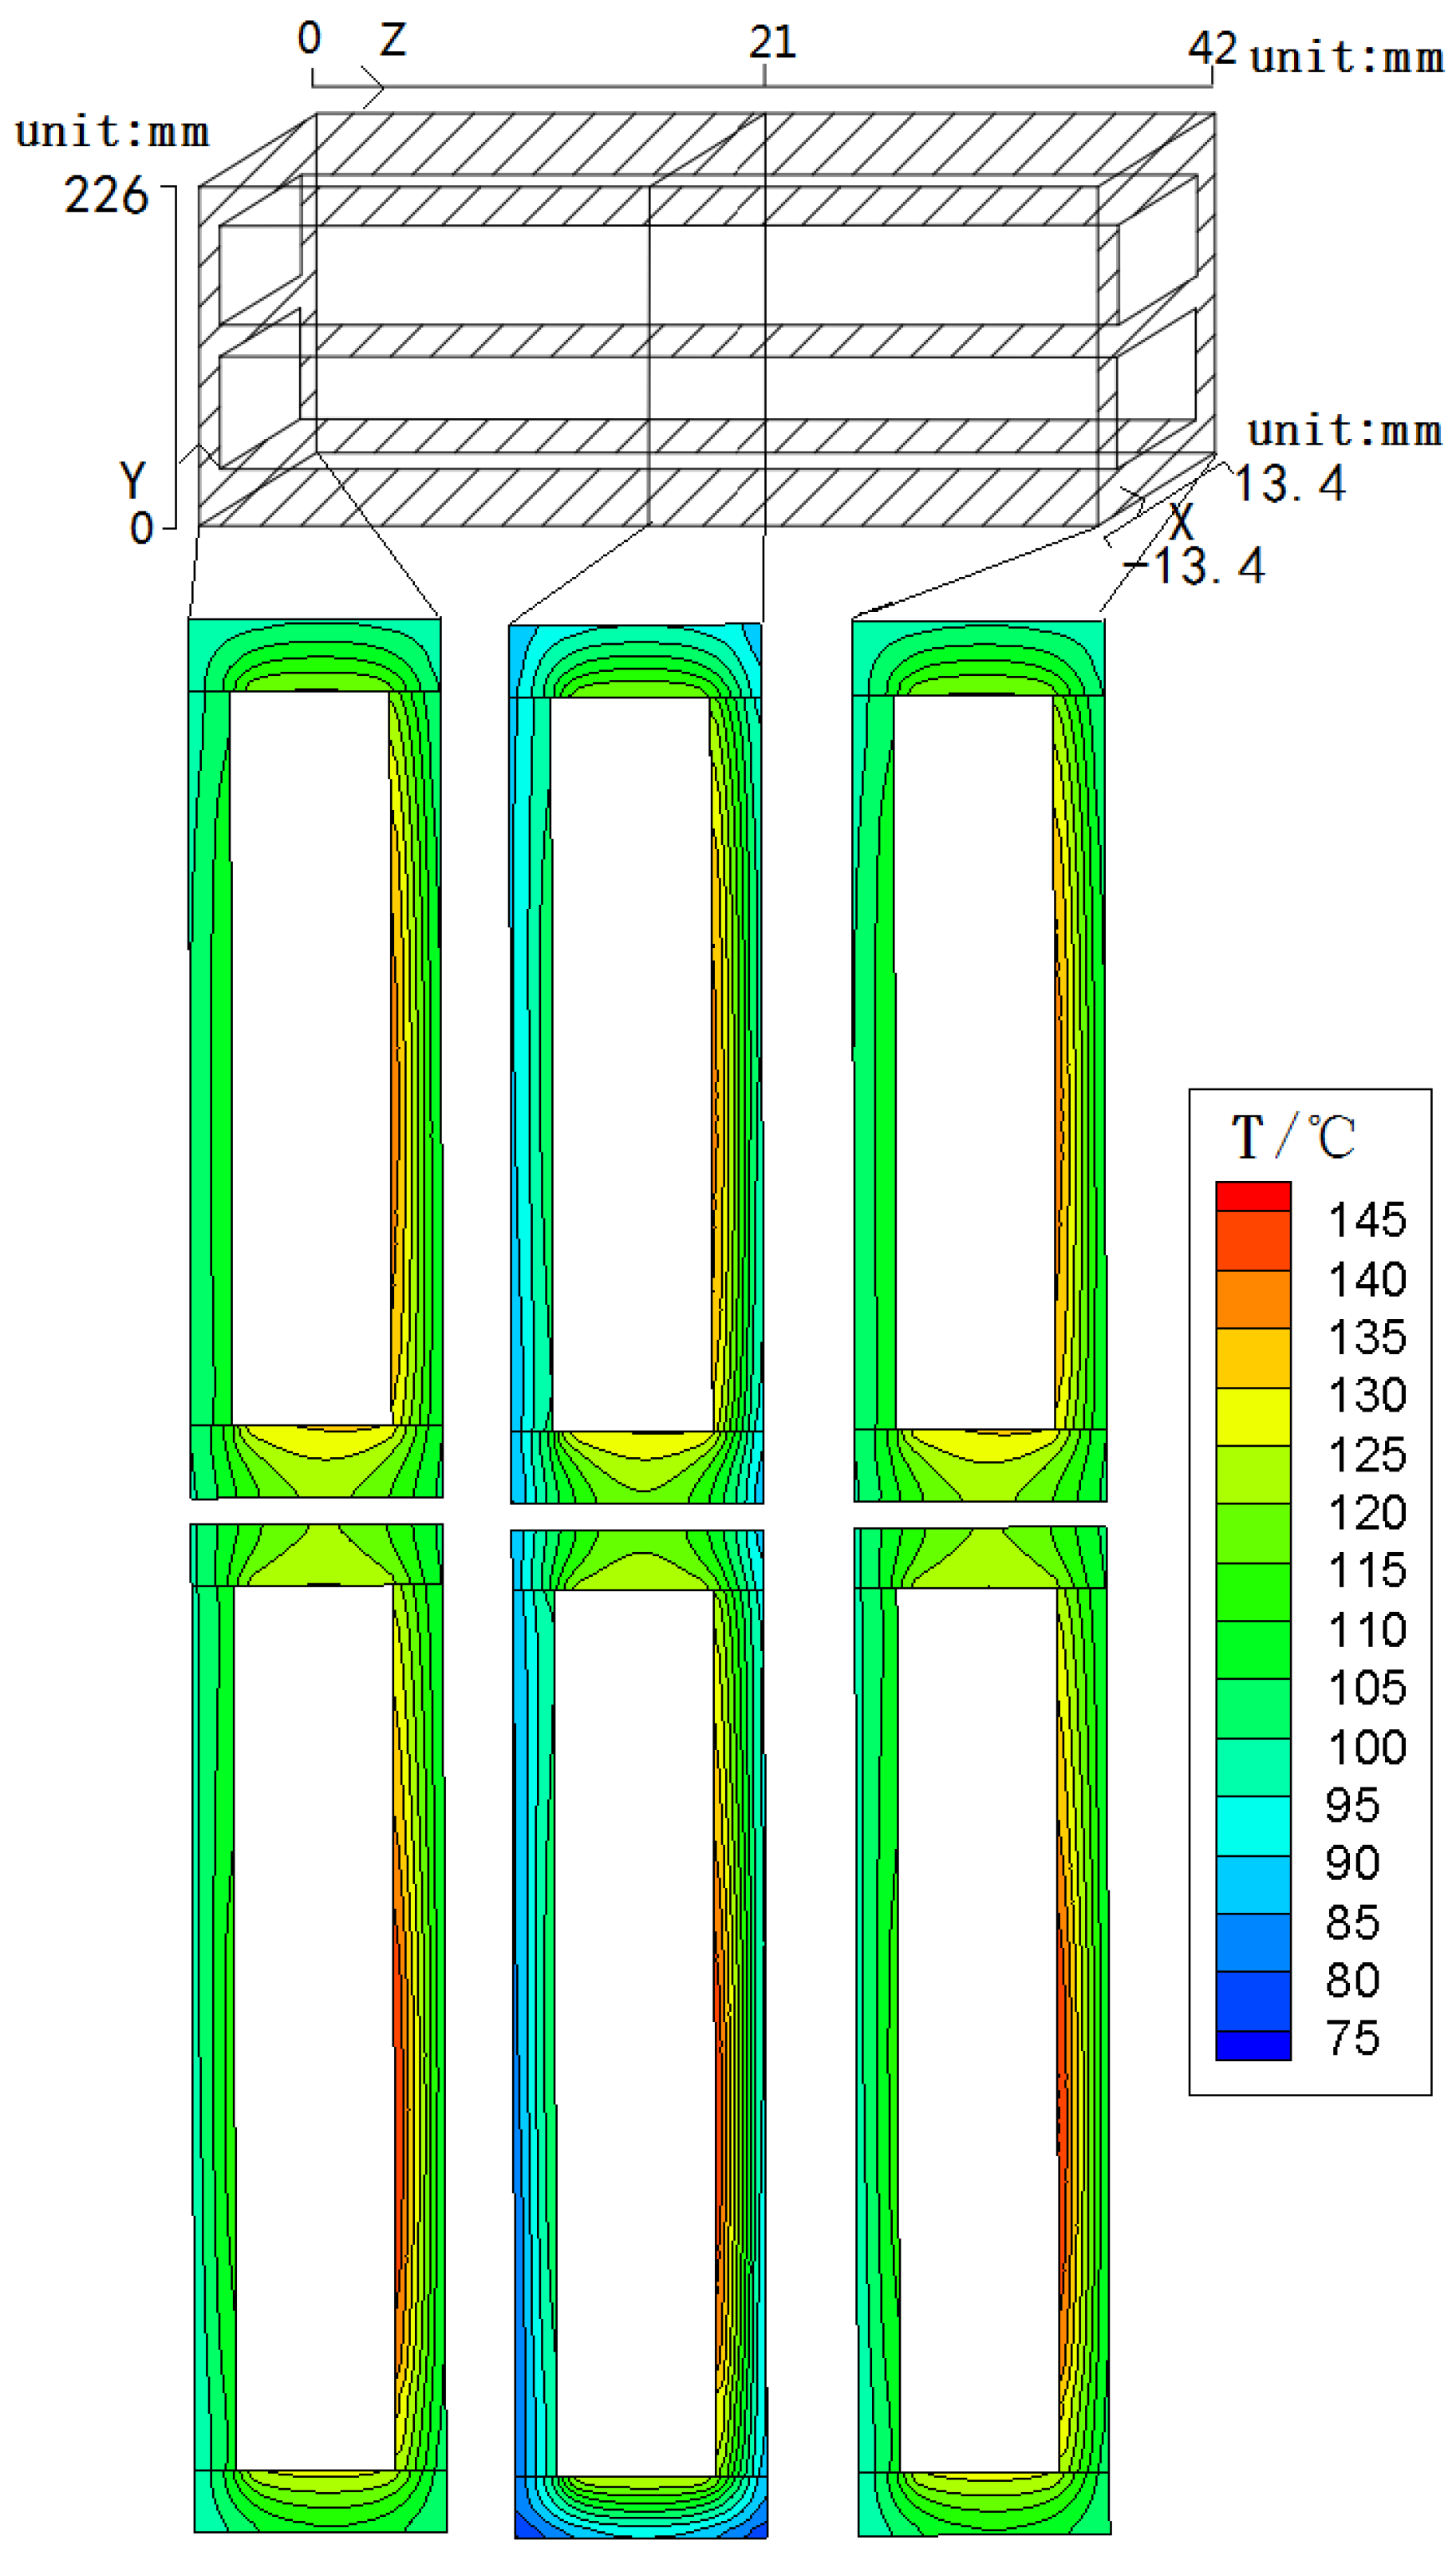
3.3.2. The Main Insulation Temperature Distribution along the Circumferential–Radial in the Case of the Stator Main Insulation Unilateral Shelling δ = 0.5 mm
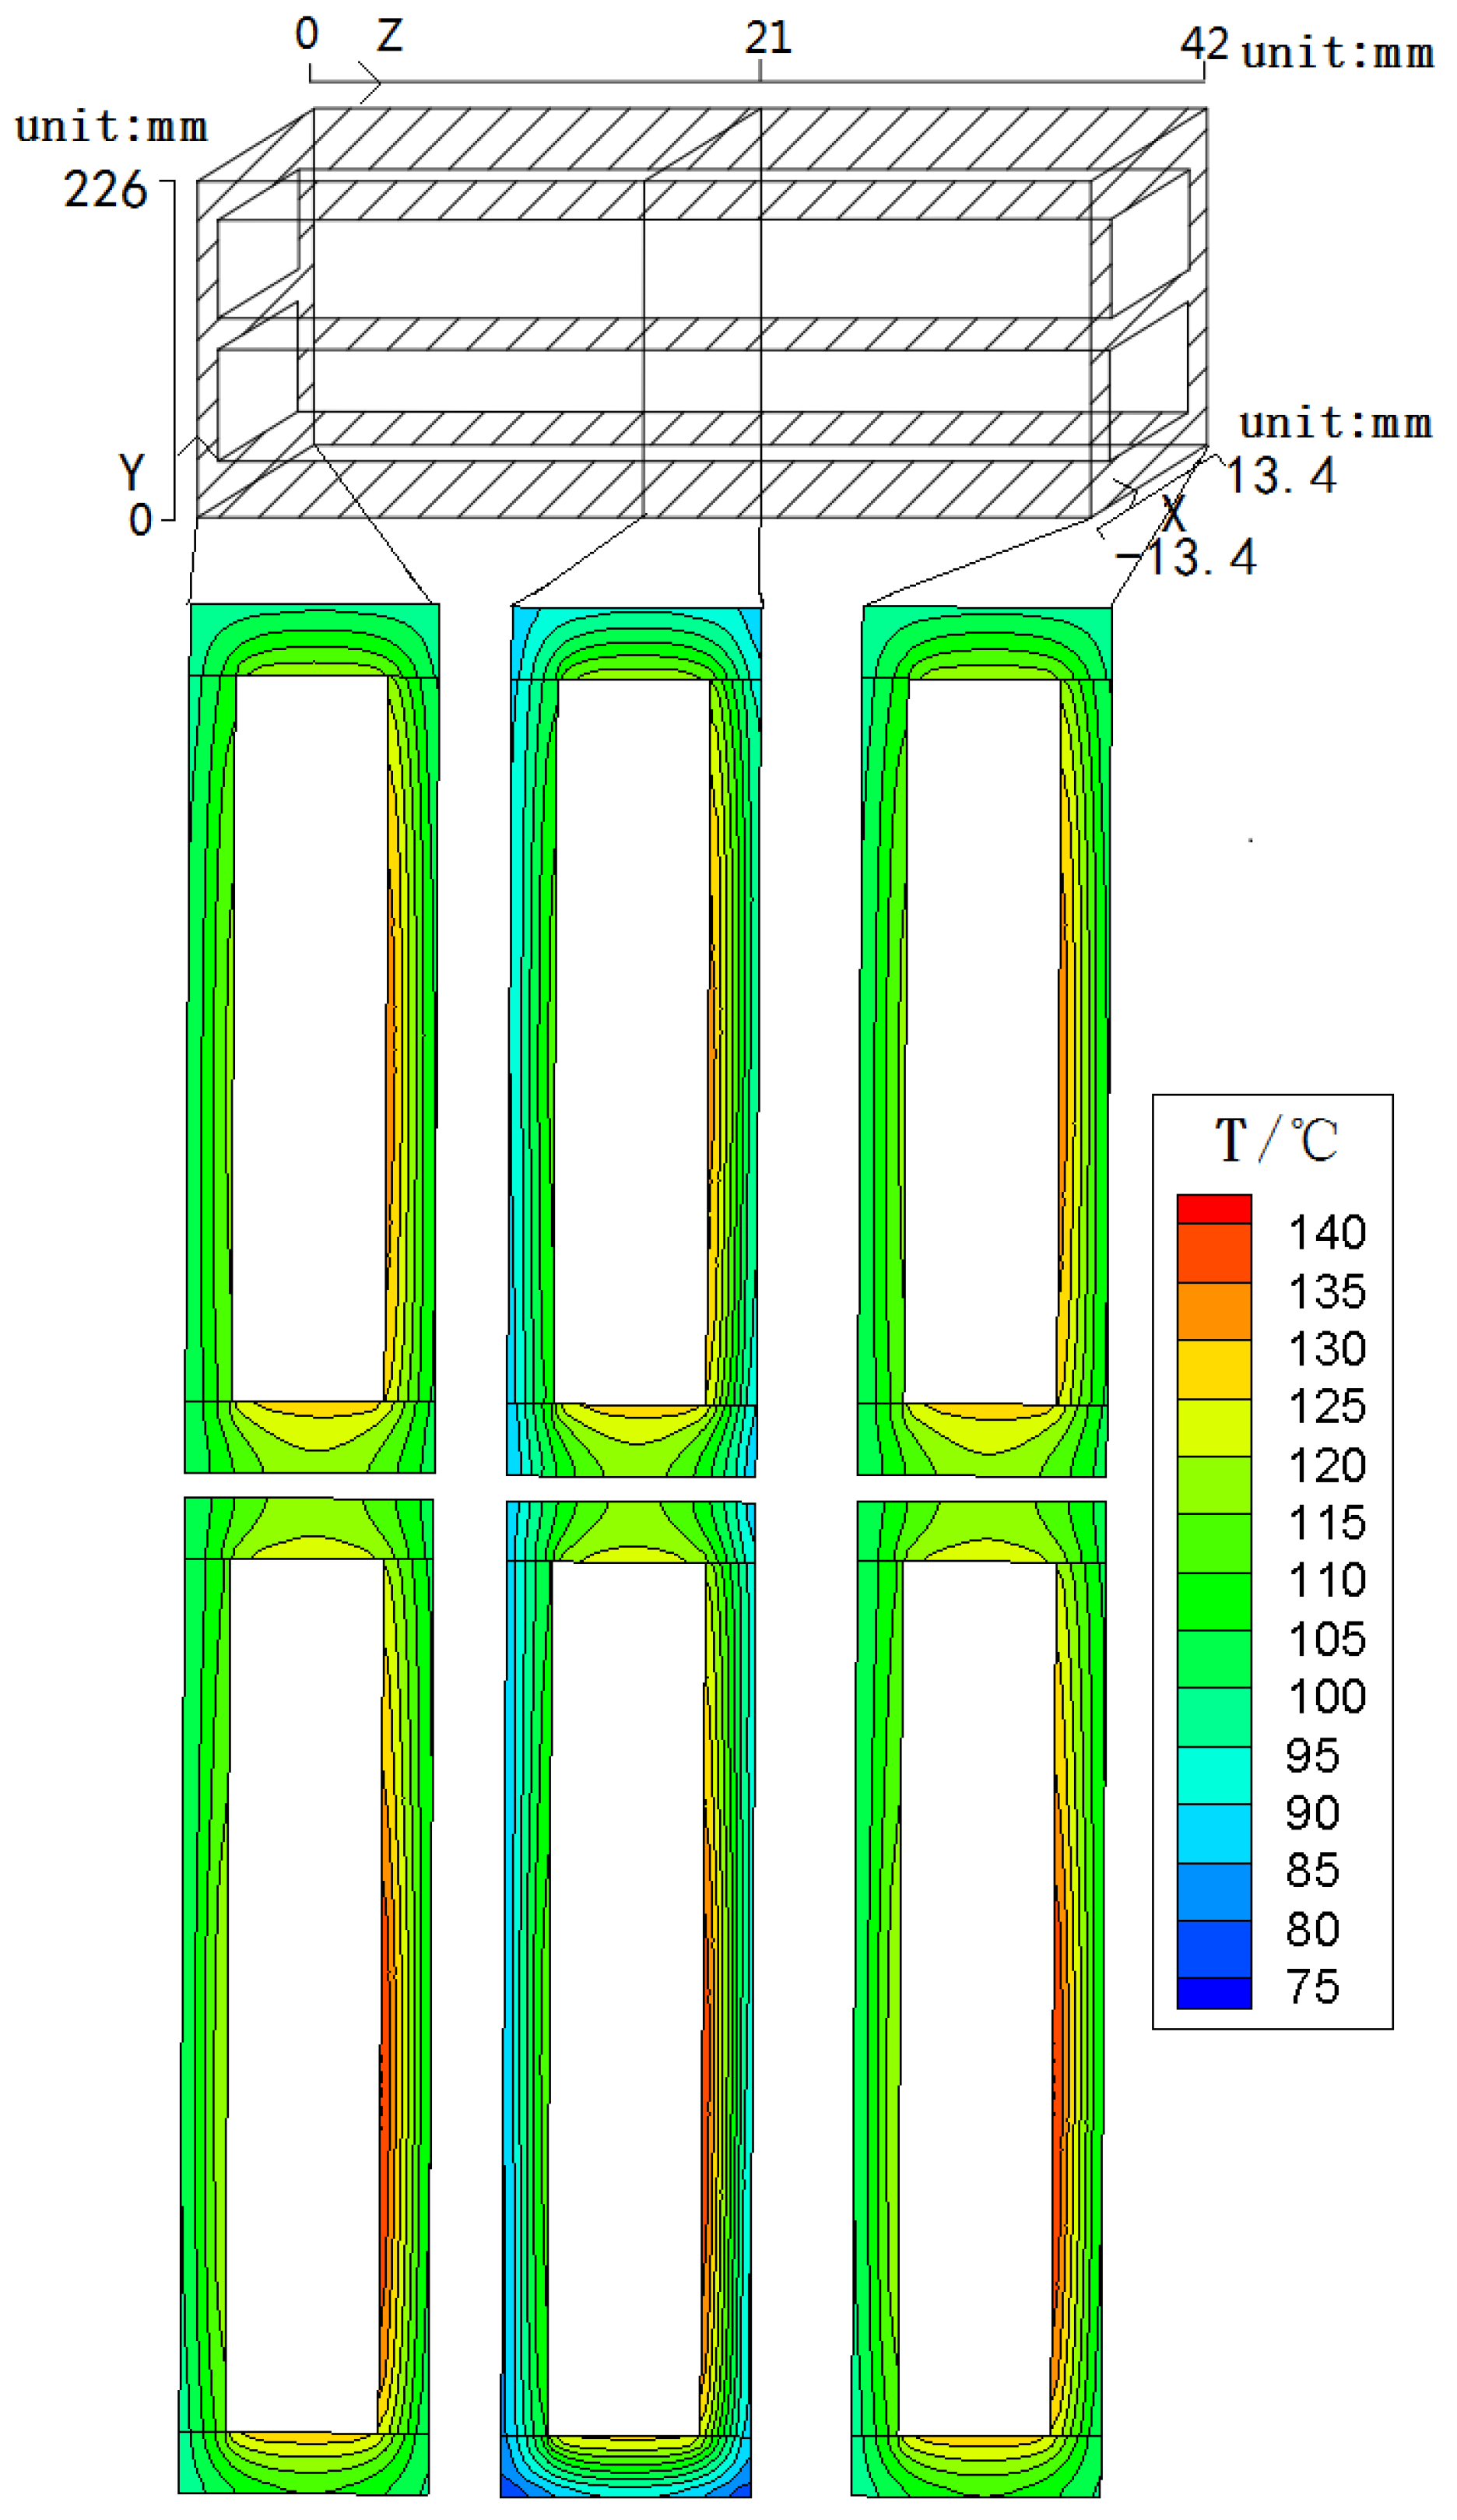
3.3.3. The Main Insulation Temperature Distribution along the Circumferential–Radial in the Case of Stator Main Insulation Unilateral Shelling δ = 1.0 mm
4. Conclusions
- (1)
- In the cases of the main insulation unilateral shelling of the stator, the temperature drop of the main insulation of the shelling side is obviously smaller than that of un-shelling side. With the increase of the shelling gap, the main insulation temperature drop of the shelling side becomes smaller, and the temperature drop of the un-shelling becomes larger, which can lead to bilateral shelling of main insulation considering the thermal aging. The maximum temperature drop of the main insulation is on un-shelling side of the upper winding after the unilateral shelling occurs.
- (2)
- The temperature difference of the main insulation between the upper bar and lower bar close to the stator windings is obvious, but the temperature difference is basically the same in the side of the tooth under main insulation normal operation and fault operation. As the main insulation unilateral shelling gap becomes larger, the maximum temperature value of the main insulation increases, and the maximum, minimum and difference of the temperature in the main insulation shelling side are reduced. The main insulation has a lowest temperature close to the ventilation duct, which is 20 °C lower than that of the lowest temperature in the center of the stator teeth
- (3)
- In the case of main insulation unilateral shelling of the stator, the minimum temperature close to the core teeth in the shelling side and un-shelling side is different, about a difference of 5 °C. Therefore, it can be effectively monitored and determined the situation of the main insulation overheating and shelling by installing temperature measurement components in the both sides of stator core close to the main insulation.
Author Contributions
Acknowledgments
Conflicts of Interest
References
- Romary, R.; Demian, C.; Schlupp, P.; Roger, J.Y. Offline and Online Methods for Stator Core Fault Detection in Large Generators. IEEE Trans. Ind. Electron. 2013, 60, 4084–4092. [Google Scholar] [CrossRef]
- Nadarajan, S.; Panda, S.K.; Bhangu, B.; Gupta, A.K. Hybrid Model for Wound-Rotor Synchronous Generator to Detect and Diagnose Turn-to-Turn Short-Circuit Fault in Stator Windings. IEEE Trans. Ind. Electron. 2015, 62, 1888–1900. [Google Scholar] [CrossRef]
- Yamin, L.D.B.; Shaoyu, W. The Influence of Insulation Aging on Stator Temperature Rise. Large Electr. Mach. Hydr. Turbine 1988, 6, 25–38. [Google Scholar]
- Istad, M.; Runde, M.; Nysveen, A. A Review of Results from Thermal Cycling Tests of Hydro-Generator Stator Windings. IEEE Trans. Energy Convers. 2011, 26, 890–903. [Google Scholar] [CrossRef]
- Sumereder, C.; Weiers, T. Significance of Defects Inside In-Service Aged Winding Insulations. IEEE Trans. Energy Convers. 2008, 23, 9–14. [Google Scholar] [CrossRef]
- Kumar, P.G.S.; Reddy, K.M. Condition Evaluation of Stator Winding Insulation of Vintage High Voltage Turbine Generator. In Proceedings of the 2015 IEEE International Conference on Electrical, Computer and Communication Technologies, Coimbatore, India, 5–7 March 2015; pp. 1–6. [Google Scholar]
- Provencher, H.; Hudon, C.; David, E. Thermal and Thermo-Mechanical Aging of Epoxy-Mica Insulated Stator Bars. In Proceedings of the 2013 IEEE Electrical Insulation Conference, Ottawa, ON, Canada, 2–5 June 2013; pp. 248–252. [Google Scholar]
- Stone, G.C.; Lyles, J.F.; Braun, J.M.; Kaul, C.L. A Thermal Cycling Type Test for Generator Stator Winding Insulation. IEEE Trans. Energy Convers. 1991, 6, 707–713. [Google Scholar] [CrossRef]
- Tanaka, K.; Kojima, H.; Onoda, M.; Suzuki, K. Prediction of Residual Breakdown Electrical Field Strength of Epoxy-Mica Paper Insulation Systems for the Stator Winding of Large Generators. IEEE Trans. Dielectr. Electr. Insul. 2015, 22, 123. [Google Scholar] [CrossRef]
- Brütsch, R.; Tari, M.; Froehlich, K.; Weiers, T.; Vogelsang, R. Insulation Failure Mechanisms of Power Generators. IEEE Electr. Insul. Mag. 2008, 24, 17–25. [Google Scholar] [CrossRef]
- Zhu, H.; Morton, C.; Cherukupalli, S. Quality Evaluation of Stator Coils and Bars under Thermal Cycling Stress. In Proceedings of the Conference Record of IEEE International Symposium on Electrical Insulation, Totonto, ON, Canada, 11–14 June 2006; pp. 384–387. [Google Scholar]
- Zhu, H.; Kung, D.; Cowell, M.; Cherukupalli, S. Acoustic Monitoring of Stator Winding Delaminations during Thermal Cycling Testing. IEEE Trans. Dielectr. Electr. Insul. 2010, 17, 1405–1410. [Google Scholar] [CrossRef]
- Stone, G.C.; Stranges, M.K.; Dunn, D.G. Common Questions on Partial Discharge Testing: A Review of Recent Developments in IEEE and IEC Standards for Offline and Online Testing of Motor and Generator Stator Windings. IEEE Ind. Appl. Mag. 2016, 22, 14–19. [Google Scholar] [CrossRef]
- Stone, G.C.; Boulter, E.A.; Culbert, I.; Dhirani, H. Electrical Insulation for Rotating Machines: Design, Evaluation, Aging, and Repair, 2nd ed.; Wiley Press: New York, NY, USA, 2004; pp. 180–192. ISBN 978-1118057063. [Google Scholar]
- Stone, G.C.; Warren, V. Effect of Manufacturer, Winding Age and Insulation Type on Stator Winding Partial Discharge Levels. IEEE Electr. Insul. Mag. 2004, 20, 13–17. [Google Scholar] [CrossRef]
- Griffith, G.; Tucker, S.; Milsom, J.; Stone, G. Problems with Modern Air-Cooled Generator Stator Winding Insulation. IEEE Electr. Insul. Mag. 2000, 16, 6–10. [Google Scholar] [CrossRef]
- Stone, G.C.; Chan, C.; Sedding, H.G. On-Line Partial Discharge Measurement in Hydrogen-Cooled Generators. In Proceedings of the 2016 IEEE Electrical Insulation Conference, Montreal, QC, Canada, 19–22 June 2016; pp. 194–197. [Google Scholar]
- Jin, H.Y.; Li, W.L.; Ma, X.H.; Ding, S.Y. Calculation and Analysis of Fluid velocity and Fluid Temperature in Large Air-cooled turbo-generator stator. Proc. CSEE 2006, 26, 168–173. [Google Scholar] [CrossRef]
- Li, W.; Ding, S.; Zhou, F. Diagnostic Numerical Simulation of Large Hydro-Generator with Insulation Aging. Heat Transf. Eng. 2008, 29, 902–909. [Google Scholar] [CrossRef]
- Li, W.; Hou, Y. Heating Analysis of Stator Strands of Large Hydro-generator Based on Numerical Method. Proc. CSEE 2001, 21, 115–1186. [Google Scholar] [CrossRef]


| Main Data | Power (W) | Voltage (V) | Current (A) | Rotating Speed (r/min) | Frequency (Hz) | Power Factor |
|---|---|---|---|---|---|---|
| Rated data | 150 | 15,750 | 6469 | 3000 | 50 | 0.85 |
| Position | UP1 | UP2 | UP3 | UP4 | DN1 | DN2 | DN3 | DN4 | |
|---|---|---|---|---|---|---|---|---|---|
| TEMP. (°C) | |||||||||
| Normal operation | 31.95 | 40.35 | 40.35 | 6.66 | 13.79 | 26.31 | 26.31 | 17.83 | |
| Shelling 0.5 mm | 35.43 | 25.13 | 47.38 | 8.93 | 10.77 | 21.72 | 36.13 | 18.7 | |
| Shelling 1.0 mm | 36.61 | 19.79 | 50.01 | 11 | 13.74 | 13.88 | 39.44 | 24.64 | |
| Upper Main Insulation | Lower Main Insulation | |||
|---|---|---|---|---|
| Maximum Temperature (°C) | Minimum Temperature (°C) | Maximum Temperature (°C) | Minimum Temperature (°C) | |
| P1 | 131 | 108 | 126 | 111 |
| P2 | 122 | 105 | 119 | 104 |
| P3 | 111 | 94.2 | 109 | 95.9 |
| P4 | 103 | 85.3 | 103 | 89.7 |
| Upper Main Insulation | Lower Main Insulation | |||
|---|---|---|---|---|
| Maximum Temperature (°C) | Minimum Temperature (°C) | Maximum Temperature (°C) | Minimum Temperature (°C) | |
| P5 | 119 | 83.2 | 117 | 91.6 |
| P6 | 114 | 80.5 | 112 | 90.2 |
| P7 | 106 | 77.4 | 105 | 87.8 |
| P8 | 101 | 74.9 | 101 | 85 |
© 2018 by the authors. Licensee MDPI, Basel, Switzerland. This article is an open access article distributed under the terms and conditions of the Creative Commons Attribution (CC BY) license (http://creativecommons.org/licenses/by/4.0/).
Share and Cite
Li, W.; Li, Y.; Su, Y.; Wang, P.; Liu, W. Research on Stator Main Insulation Temperature Field of Air-Cooled Turbo-Generator after Main Insulation Shelling. Energies 2018, 11, 1101. https://doi.org/10.3390/en11051101
Li W, Li Y, Su Y, Wang P, Liu W. Research on Stator Main Insulation Temperature Field of Air-Cooled Turbo-Generator after Main Insulation Shelling. Energies. 2018; 11(5):1101. https://doi.org/10.3390/en11051101
Chicago/Turabian StyleLi, Weili, Yong Li, Ying Su, Purui Wang, and Wenmao Liu. 2018. "Research on Stator Main Insulation Temperature Field of Air-Cooled Turbo-Generator after Main Insulation Shelling" Energies 11, no. 5: 1101. https://doi.org/10.3390/en11051101
APA StyleLi, W., Li, Y., Su, Y., Wang, P., & Liu, W. (2018). Research on Stator Main Insulation Temperature Field of Air-Cooled Turbo-Generator after Main Insulation Shelling. Energies, 11(5), 1101. https://doi.org/10.3390/en11051101