Repetitive Control to Improve Users’ Thermal Comfort and Energy Efficiency in Buildings


Abstract
1. Introduction
1.1. Past Studies
1.2. Novelty of This Work
1.3. Structure of the Work
2. Methodology
2.1. Thermal Comfort and the PMV Index
- M: metabolic rate .
- : basic clothing insulation .
- : indoor air temperature .
- : relative humidity .
- : mean radiant temperature .
- : relative air velocity .
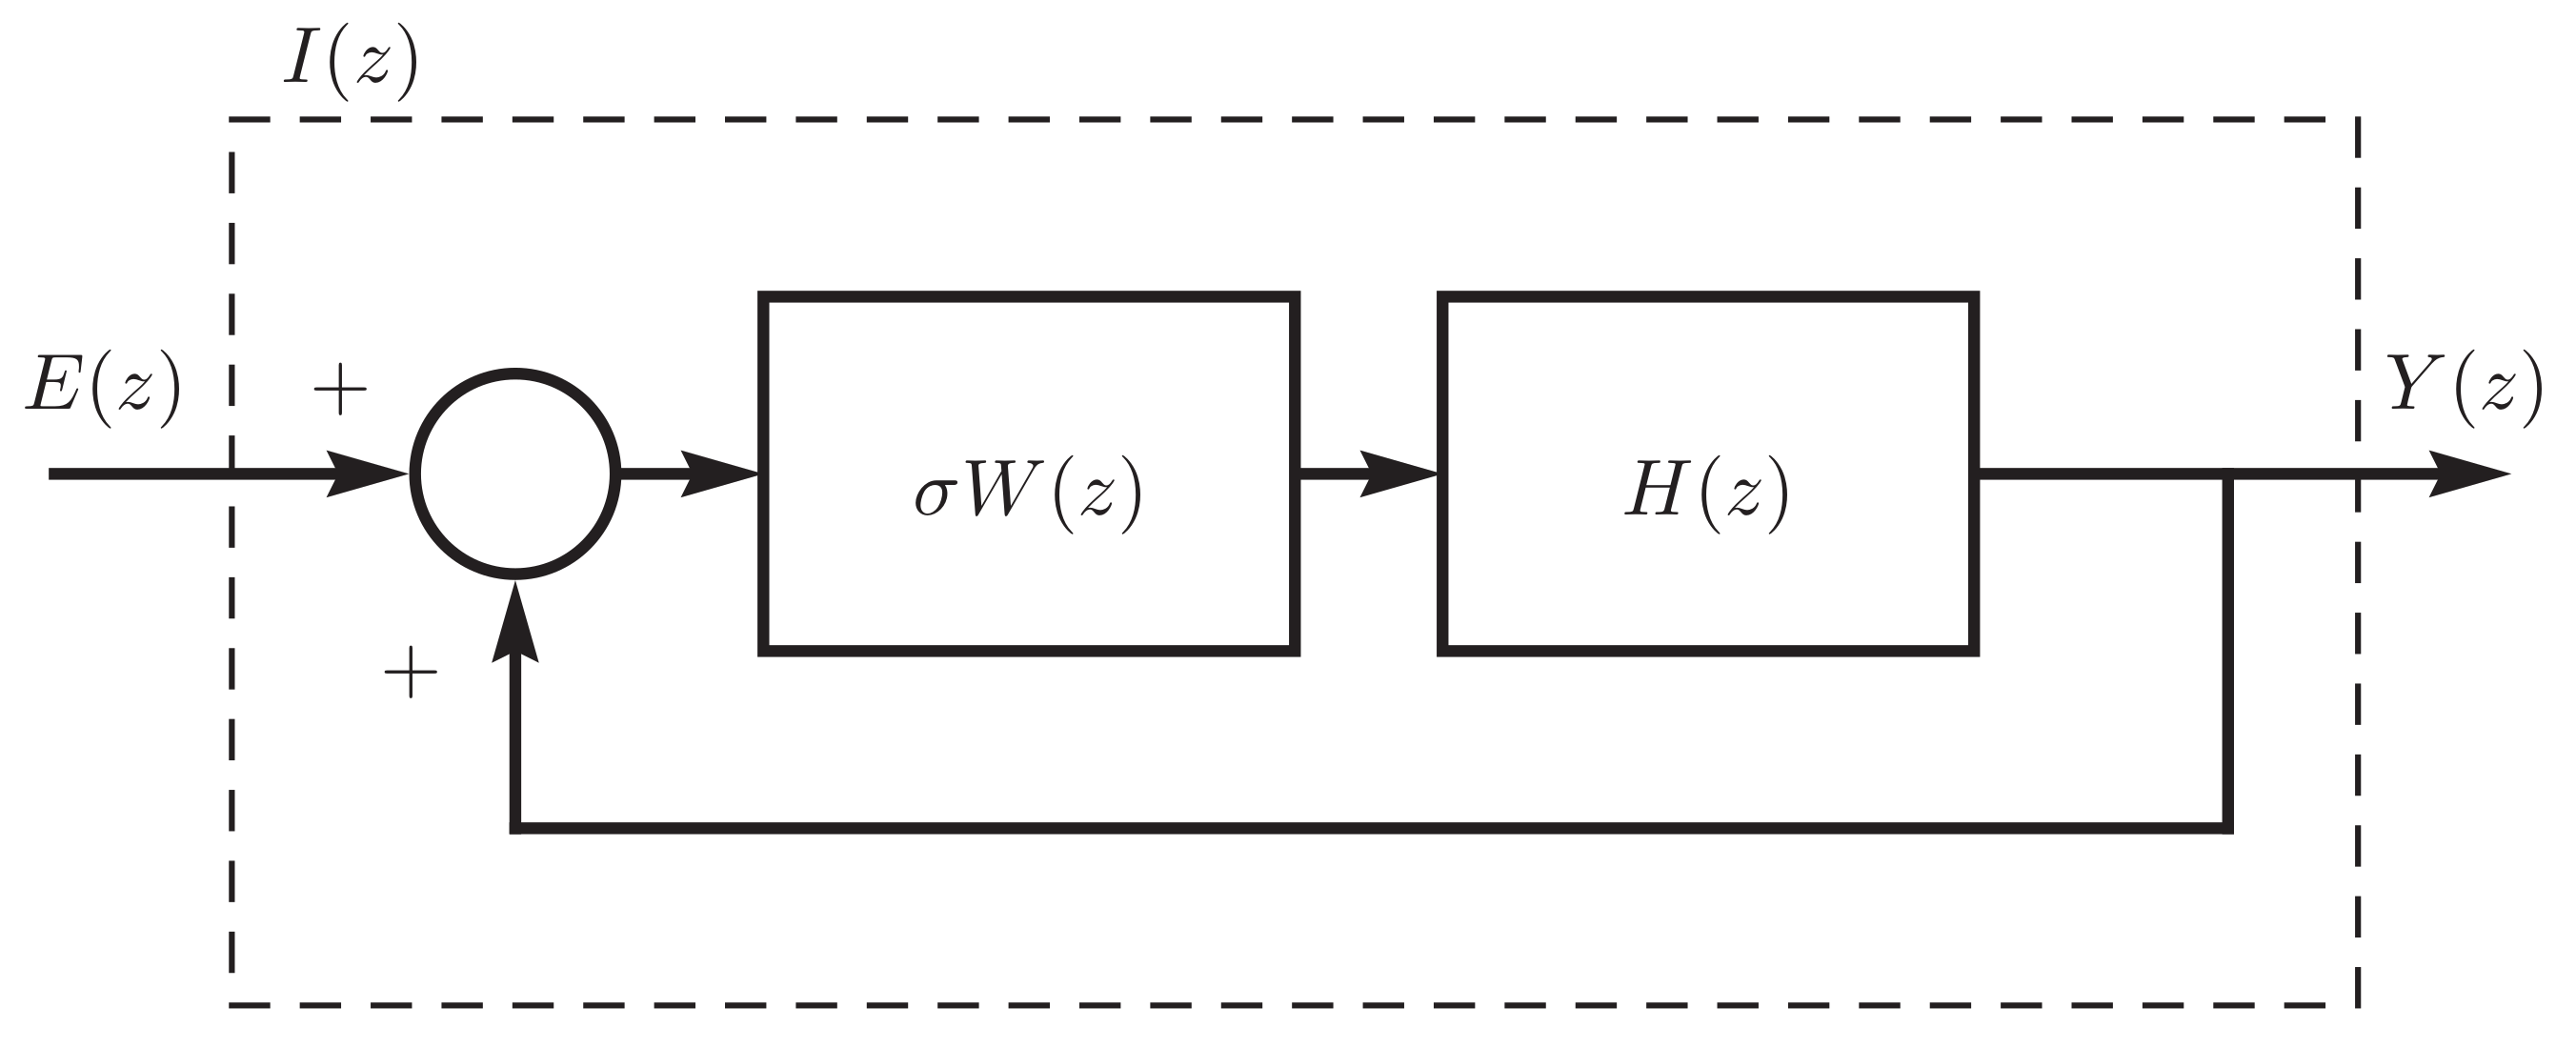
2.2. The Control System
2.3. Test Bed Model
2.3.1. CIESOL Building
2.3.2. Room Simulator
2.4. Linear Model and Person Profile
3. Results and Discussion
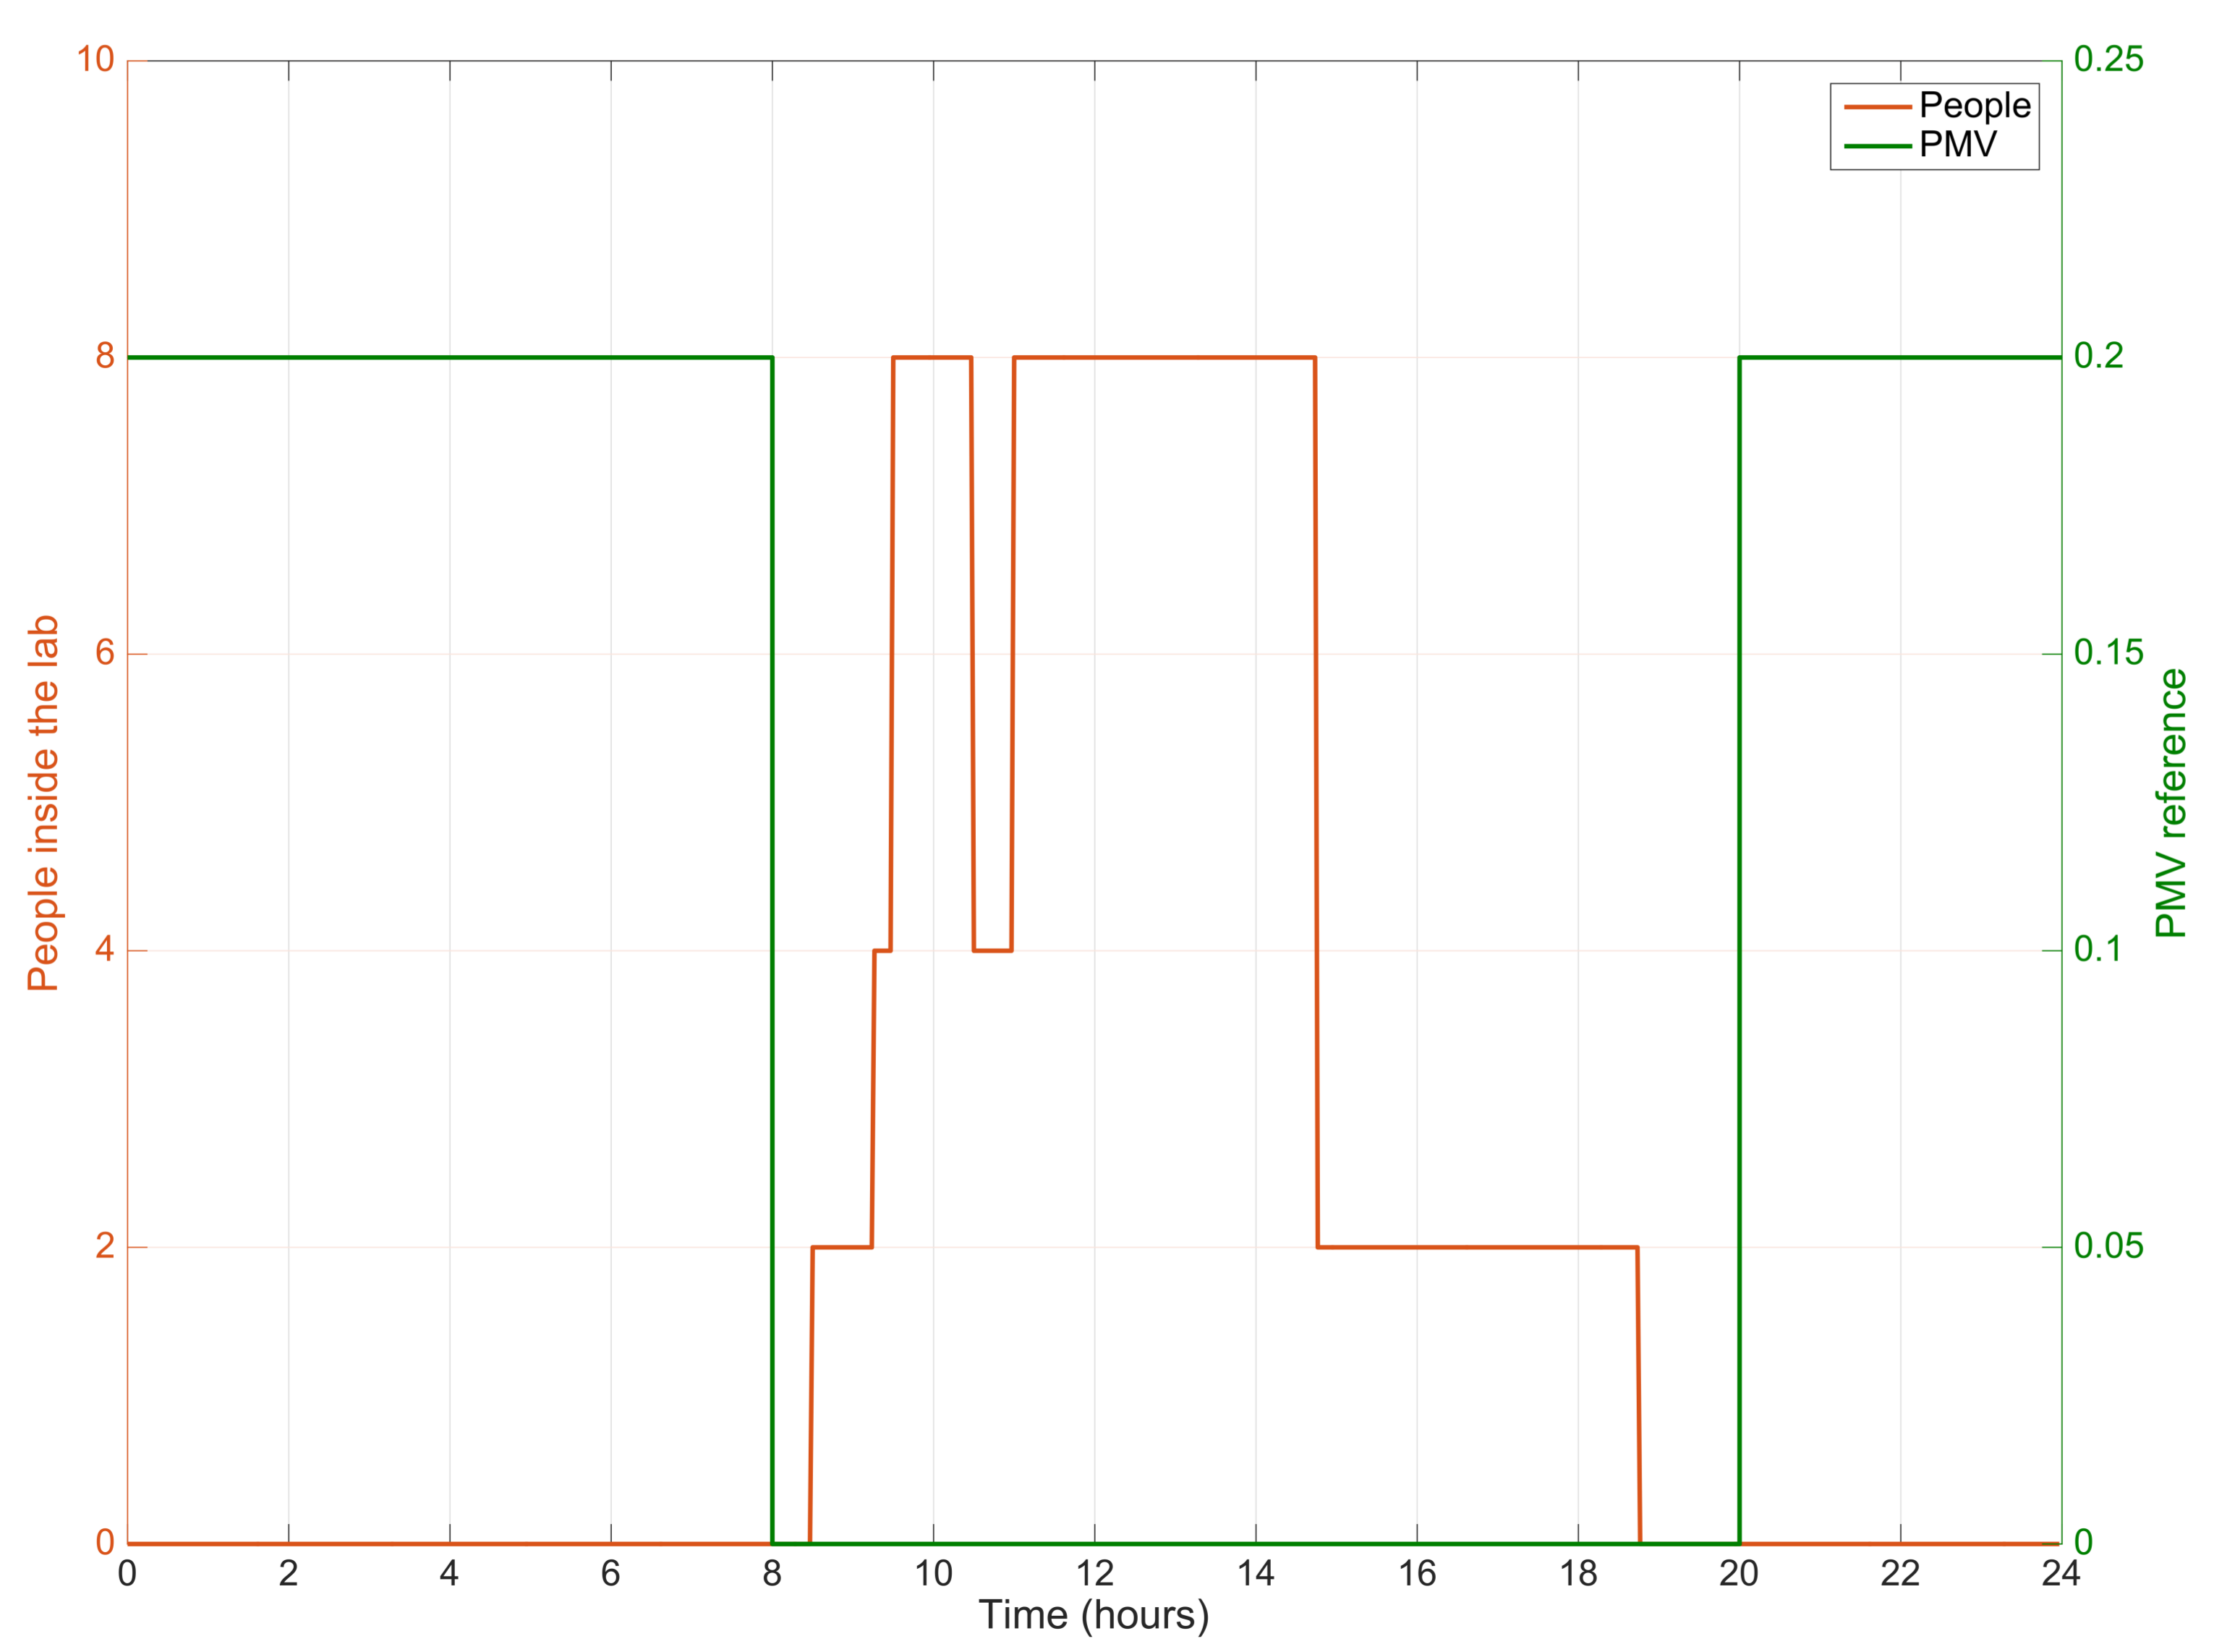
3.1. First Simulation Scenario: The Same Person Profile Every Day
3.2. Second Simulation Scenario: Using Real Data from CIESOL Building
4. Conclusions
4.1. Summary of the Results
4.2. Future Works
Acknowledgments
Author Contributions
Conflicts of Interest
Abbreviations
| E(z) | Error signal |
| Gc(z) | Inner controller |
| Gp(z) | Plant |
| Gx(z) | Stabilizing controller |
| H(z) | Null-phase low-pass filter |
| I | Basic clothing insulation |
| I | Diffuse solar irradiance |
| I | Direct solar irradiance |
| I | Reflected solar irradiance |
| k | Static gain PMV/(m/s) |
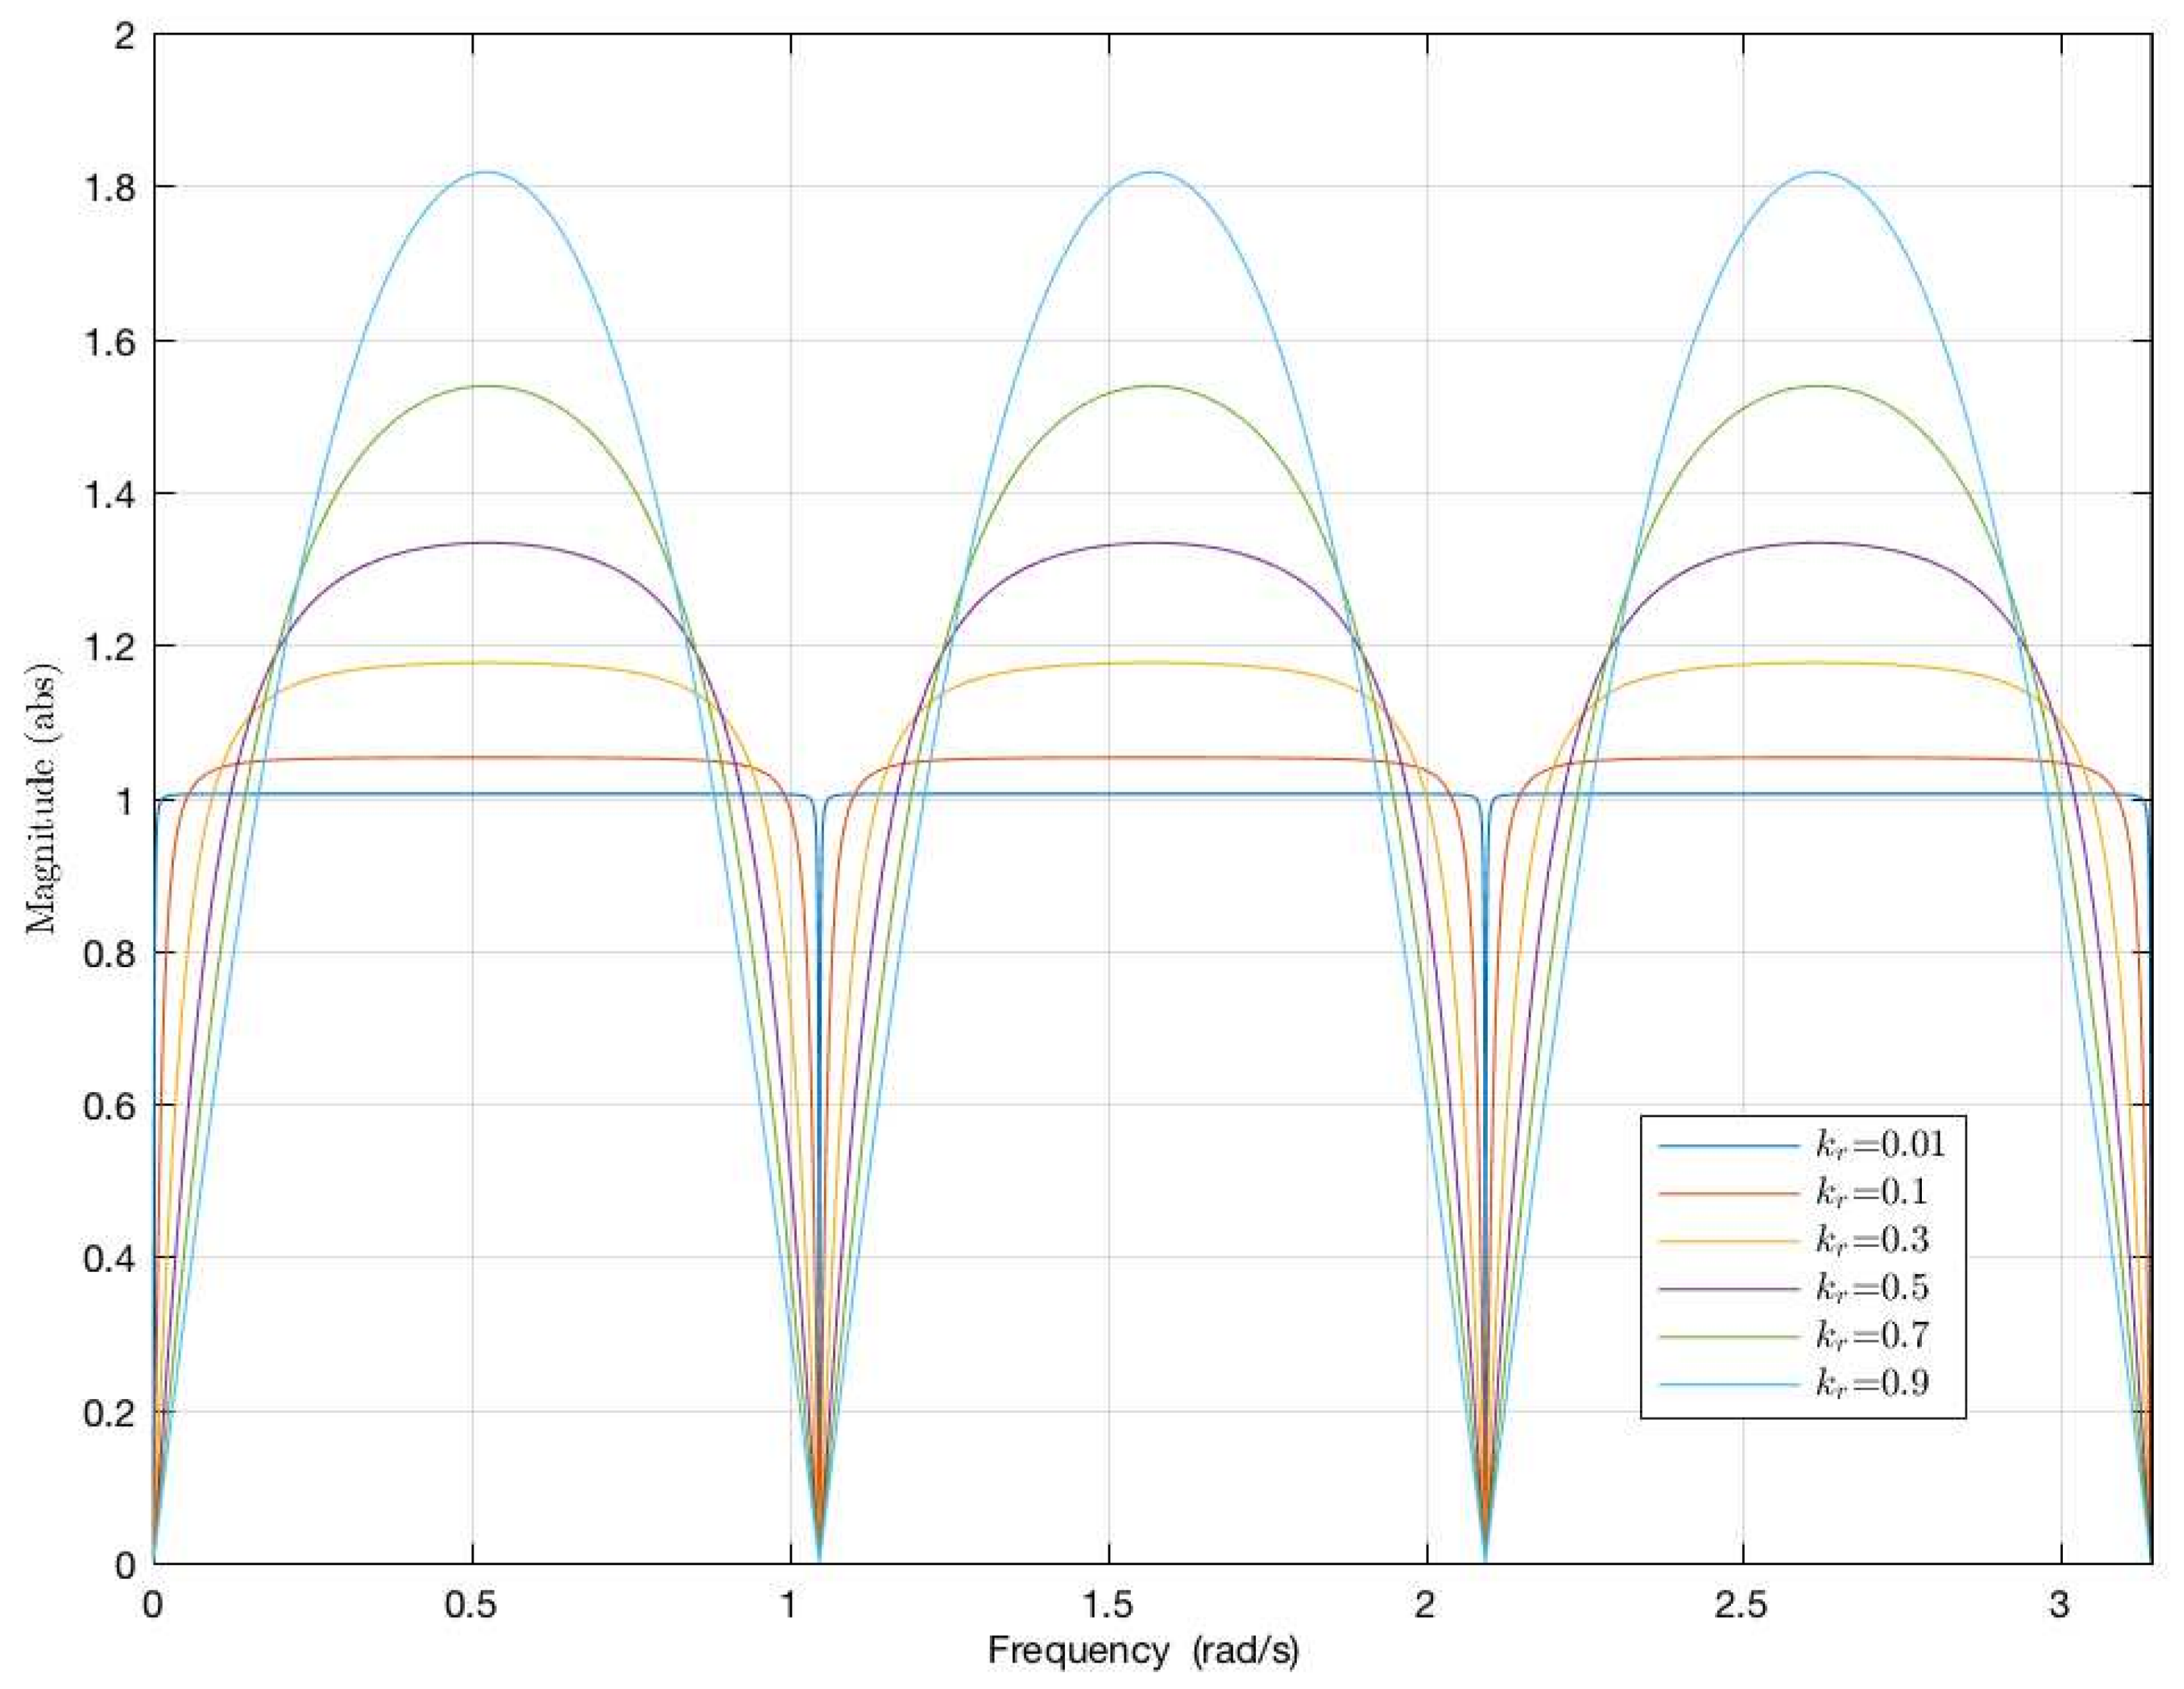
| k | Tuning parameter to define the settling time |
| M | Metabolic rate of a person |
| N | Number of people in the room |
| R(z) | Reference signal |
| RH | Relative humidity |
| t | Indoor air temperature |
| t | Mean radiant temperature |
| T | Outdoor air temperature |
| V | Fan-coil speed (m/s) |
| v | Relative air velocity (m/s) |
| W(z) | Delay function |
| Time constant (s) | |
| HVAC | Heating, Ventilation, and Air Conditioning |
| LTD | Linear Time-Dependent |
| LTI | Linear Time-Invariant |
| MPC | Model-based Predictive Control |
| NZEB | Nearly Zero-Energy Building |
| PI | Proportional–Integral |
| PMV | Predicted Mean Vote |
| PPD | Predicted Percentage Dissatisfied |
| RC | Repetitive control |
| SCADA | Supervisory Control and Data Acquisition |
References
- Berardi, U. Building energy consumption in US, EU, and BRIC countries. Procedia Eng. 2015, 118, 128–136. [Google Scholar] [CrossRef]
- European Comission. Energy Consumption in Buildings. Available online: https://ec.europa.eu/energy/en/topics/energy-efficiency/buildings (accessed on 28 February 2018).
- U.S. Energy Information Administration. Frequently Asked Questions. Available online: http://www.eia.gov/tools/faqs/faq.cfm?id=86&t=1. (accessed on 28 February 2018).
- Al horr, Y.; Arif, M.; Katafygiotou, M.; Mazroei, A.; Kaushik, A.; Elsarrag, E. Impact of indoor environmental quality on occupant well-being and comfort: A review of the literature. Int. J. Sustain. Built Environ. 2016, 5, 1–11. [Google Scholar] [CrossRef]
- 2002/91/CE. Directive 2002/91/CE of the European Parliament and of the Council of 16 December 2002 on the Energy Performance of Buildings. Available online: http://eur-lex.europa.eu/LexUriServ/LexUriServ.do?uri=OJ:L:2003:001:0065:0065:ES:PDF (accessed on 28 February 2018).
- 2009/28/UE. Directive 2009/28/EC of the European Parliament and of the Council of 23 April 2009 on the Promotion of the Use of Energy from Renewable Sources and Amending and Subsequently Repealing Directives 2001/77/EC and 2003/30/EC. Available online: https://eur-lex.europa.eu/legal-content/EN/TXT/PDF/?uri=CELEX:32009L0028&from=EN (accessed on 28 February 2018).
- 2010/31/UE. Directive 2010/31/UE of the European Parliament and of the Council of 19 May 2010 on the Energy Performance of Buildings. Available online: http://eur-lex.europa.eu/LexUriServ/LexUriServ.do?uri=OJ:L:2010:153:0013:0035:EN:PDF. (accessed on 28 February 2018).
- EN 15251. In Indoor Environmental Input Parameters for Design and Assessment of Energy Performance of Buildings Addressing Indoor Air Quality, Thermal Environment, Lighting and Acoustics; European Committee for Standardisation: London, UK, 2007.
- Feige, A.; Wallbaum, H.; Janser, M.; Windlinger, L. Impact of sustainable office buildings on occupant’s comfort and productivity. J. Corp. Real Estate 2013, 15, 7–34. [Google Scholar] [CrossRef]
- Fisk, W.J. Health and productivity gains from better indoor environments and their relationship with building energy efficiency. Annu. Rev. Energy Environ. 2000, 25, 537–566. [Google Scholar] [CrossRef]
- Kosonen, R.; Tan, F. Assessment of productivity loss in air-conditioned buildings using PMV index. Energy Build. 2004, 36, 987–993. [Google Scholar] [CrossRef]
- Roelofsen, P. The design of the workplace as a strategy for productivity enhancement. In Proceedings of the Proceedings of Clima 2000 Conference, Naples, Italy, 15–18 September 2001. [Google Scholar]
- Andersson, J.; Boerstra, A.; Clements-Croome, D.; Fitzner, K.; Hanssen, S. Indoor Climate and Productivity in Offices; REHVA Guidebook; REHVA: Brussels, Belgium, 2008; Volume 6, ISBN 2-9600468-5-4. [Google Scholar]
- Léger, J.; Rousse, D.R.; Le Borgne, K.; Lassue, S. Comparing electric heating systems at equal thermal comfort: An experimental investigation. Build. Environ. 2018, 128, 161–169. [Google Scholar] [CrossRef]
- Oldewurtel, F.; Parisio, A.; Jones, C.N.; Gyalistras, D.; Gwerder, M.; Stauch, V.; Lehmann, B.; Morari, M. Use of model predictive control and weather forecasts for energy efficient building climate control. Energy Build. 2012, 45, 15–27. [Google Scholar] [CrossRef]
- Zampetti, L.; Arnesano, M.; Revel, G. Experimental testing of a system for the energy-efficient sub-zonal heating management in indoor environments based on PMV. Energy Build. 2018, 166, 229–238. [Google Scholar] [CrossRef]
- Castilla, M.; Álvarez, J.D.; Rodríguez, F.; Berenguel, M. Comfort Control in Buildings; Advances Series in Industrial Control; Springer: Berlin/Heidelberg, Germany, 2014; p. 237. [Google Scholar]
- Pčolka, M.; Žáčeková, E.; Robinett, R.; Čelikovskỳ, S.; Šebek, M. Bridging the gap between the linear and nonlinear predictive control: Adaptations for efficient building climate control. Control Eng. Pract. 2016, 53, 124–138. [Google Scholar] [CrossRef]
- Ascione, F.; Bianco, N.; De Stasio, C.; Mauro, G.M.; Vanoli, G.P. Simulation-based model predictive control by the multi-objective optimization of building energy performance and thermal comfort. Energy Build. 2016, 111, 131–144. [Google Scholar] [CrossRef]
- Ma, J.; Qin, S.J.; Salsbury, T. Application of economic MPC to the energy and demand minimization of a commercial building. J. Process Control 2014, 24, 1282–1291. [Google Scholar] [CrossRef]
- Liang, J.; Ruxu, D. Thermal comfort control based on neural network for HVAC application. In Proceedings of the 2005 IEEE Conference on Control Applications, Toronto, ON, Canada, 28–31 August 2005; pp. 819–824. [Google Scholar]
- Liang, J.; Du, R. Design of intelligent comfort control system with human learning and minimum power control strategies. Energy Convers. Manag. 2008, 49, 517–528. [Google Scholar] [CrossRef]
- Marvuglia, A.; Messineo, A.; Nicolosi, G. Coupling a neural network temperature predictor and a fuzzy logic controller to perform thermal comfort regulation in an office building. Build. Environ. 2014, 72, 287–299. [Google Scholar] [CrossRef]
- Congradac, V.; Kulic, F. HVAC system optimization with CO2 concentration control using genetic algorithms. Energy Build. 2009, 41, 571–577. [Google Scholar] [CrossRef]
- Nassif, N.; Kajl, S.; Sabouring, R. Two-objective online optimization of supervisory control strategy. In Proceedings of the 8th Building Simulation Conference, Eindhoven, The Netherlands, 11–14 August 2003; pp. 927–943. [Google Scholar]
- Guo, W.; Zhou, M. Technologies toward thermal comfort-based and energy-efficient HVAC systems: A review. In Proceedings of the IEEE Conference on Systems, Man, and Cybernetics, San Antonio, TX, USA, 11–14 October 2009; pp. 3883–3888. [Google Scholar]
- Jazizadeh, F.; Ghahramani, A.; Becerik-Gerber, B.; Kichkaylo, T.; Orosz, M. User-led decentralized thermal comfort driven HVAC operations for improved efficiency in office buildings. Energy Build. 2014, 70, 398–410. [Google Scholar] [CrossRef]
- Longman, R.W. Iterative learning control and repetitive control for engineering practice. Int. J. Control 2000, 73, 930–954. [Google Scholar] [CrossRef]
- Tomizuka, M. Dealing with periodic disturbances in controls of mechanical systems. Annu. Rev. Control 2008, 32, 193–199. [Google Scholar] [CrossRef]
- Francis, B.; Wonham, W. Internal Model Principle in Control Theory. Automatica 1976, 12, 457–465. [Google Scholar] [CrossRef]
- Álvarez, J.D.; Costa-Castelló, R.; Castilla, M.; Camacho, E.F. Repetitive control to counteract the effect of people on thermal comfort control. In Proceedings of the 2013 European Control Conference (ECC), Zurich, Switzerland, 17–19 July 2013; pp. 1187–1191. [Google Scholar]
- Vinther, K.; Chandan, V.; Alleyne, A.G. Learning/repetitive control for building systems with nearly periodic disturbances. In Proceedings of the 2013 European Control Conference (ECC), Zurich, Switzerland, 17–19 July 2013; pp. 1198–1203. [Google Scholar]
- Minakais, M.; Okaeme, C.C.; Mishra, S.; Wen, J.T. Iterative Learning Control for coupled temperature and humidity in buildings. In Proceedings of the 20th IFAC World Congress, Toulouse, France, 9–14 July 2017. [Google Scholar]
- Peng, C.; Sun, L.; Tomizuka, M. Constrained Iterative Learning Control with PSO-Youla feedback tuning for building temperature control. IFAC-PapersOnLine 2017, 50, 3135–3141. [Google Scholar] [CrossRef]
- Castilla, M.; Bonilla, J.; Álvarez, J.D.; Rodríguez, F. A room simulation tool for thermal comfort control in a bioclimatic building: A real example of use with an optimal controller. Optim. Control Appl. Methods 2016, 37, 479–495. [Google Scholar] [CrossRef]
- ASHRAE. ASHRAE Handbook—Fundamentals; The American Society of Heating, Refrigerating and Air-Conditioning Engineers: Atlanta, GA, USA, 2017. [Google Scholar]
- ASHRAE55. Thermal Environment Conditions for Human Occupancy; The American Society of Heating, Refrigerating and Air-Conditioning Engineers: Atlanta, GA, USA, 2017. [Google Scholar]
- ISO7730. Ergonomics of the Thermal Environment: Analytical Determination and Interpretation of Thermal Comfort Using Calculation of the PMV and PPD Indices and Local Thermal Comfort; International Standardization Organization: Geneva, Switzerland, 2005. [Google Scholar]
- Fanger, P.O. Assessment of man’s thermal comfort in practice. Br. J. Ind. Med. 1973, 30, 313–324. [Google Scholar] [CrossRef] [PubMed]
- D’Ambrosio Alfano, F.R.; Olesen, B.W.; Palella, B.I. Povl Ole Fanger’s Impact Ten Years Later. Energy Build. 2017, 152, 243–249. [Google Scholar] [CrossRef]
- D’Ambrosio Alfano, F.R.; Olesen, B.W.; Palella, B.I.; Riccio, G. Thermal Comfort: Design and Assessment for Energy Saving. Energy Build. 2014, 81, 326–336. [Google Scholar] [CrossRef]
- D’Ambrosio Alfano, F.R.; Palella, B.I.; Riccio, G. Notes on the Calculation of the PMV index by means of Apps. Energy Procedia 2016, 101, 249–256. [Google Scholar] [CrossRef]
- Oliveira, A.V.M.; Gaspar, A.R.; Raimundo, A.M.; Quintela, D.A. On the measurement of globe temperatures: Analysis of the influence of different parameters. Extrem. Physiol. Med. 2015, 4, A14. [Google Scholar] [CrossRef][Green Version]
- Quintela, D.A.; Gaspar, A.R.; Raimundo, A.M.; Oliveira, A.V.M.; Cardoso, D. Assessment of the performance of globe thermometers under different environmental conditions. In Occupational Safety and Hygiene II. Selected Extended and Revises Contributions from the International Symposium Occupational Safety and Hygiene; Taylor & Francis: London, UK, 2014; Volume 1, pp. 523–528. [Google Scholar]
- ISO 7726. Ergonomics of the Thermal Environment—Instruments for Measuring Physical Quantities; International Standardization Organization: Geneva, Switzerland, 1998. [Google Scholar]
- Costa-Castello, R.; Nebot, J.; Griñó, R. Demonstration of the Internal Model Principle by Digital Repetitive Control of an Educational Laboratory Plant. IEEE Trans. Educ. 2005, 48, 73–80. [Google Scholar] [CrossRef]
- Ramos, G.A.; Costa-Castelló, R. Power factor correction and harmonic compensation using second-order odd-harmonic repetitive control. IET Control Theory Appl. 2012, 6, 1–12. [Google Scholar] [CrossRef]
- Inoue, T.; Nakano, M.; Kubo, T.; Matsumoto, S.; Baba, H. High Accuracy Control of a Proton Synchroton Magnet Power Supply. In Proceedings of the 8th IFAC World Congress, Kyoto, Japan, 24–28 August 1981; pp. 216–220. [Google Scholar]
- Camacho, E.F.; Alba, C.B. Model Predictive Control; Springer: Berlin/Heidelberg, Germany, 2013. [Google Scholar]


© 2018 by the authors. Licensee MDPI, Basel, Switzerland. This article is an open access article distributed under the terms and conditions of the Creative Commons Attribution (CC BY) license (http://creativecommons.org/licenses/by/4.0/).
Share and Cite
Álvarez, J.D.; Costa-Castelló, R.; Castilla, M.D.M. Repetitive Control to Improve Users’ Thermal Comfort and Energy Efficiency in Buildings. Energies 2018, 11, 976. https://doi.org/10.3390/en11040976
Álvarez JD, Costa-Castelló R, Castilla MDM. Repetitive Control to Improve Users’ Thermal Comfort and Energy Efficiency in Buildings. Energies. 2018; 11(4):976. https://doi.org/10.3390/en11040976
Chicago/Turabian StyleÁlvarez, José Domingo, Ramon Costa-Castelló, and María Del Mar Castilla. 2018. "Repetitive Control to Improve Users’ Thermal Comfort and Energy Efficiency in Buildings" Energies 11, no. 4: 976. https://doi.org/10.3390/en11040976
APA StyleÁlvarez, J. D., Costa-Castelló, R., & Castilla, M. D. M. (2018). Repetitive Control to Improve Users’ Thermal Comfort and Energy Efficiency in Buildings. Energies, 11(4), 976. https://doi.org/10.3390/en11040976