Test of Different Sensitizing Dyes in Dye-Sensitized Solar Cells Based on Nb2O5 Photoanodes


Abstract
:1. Introduction
- low cost of production;
- easy fabrication;
- wide range of applicable materials [1].
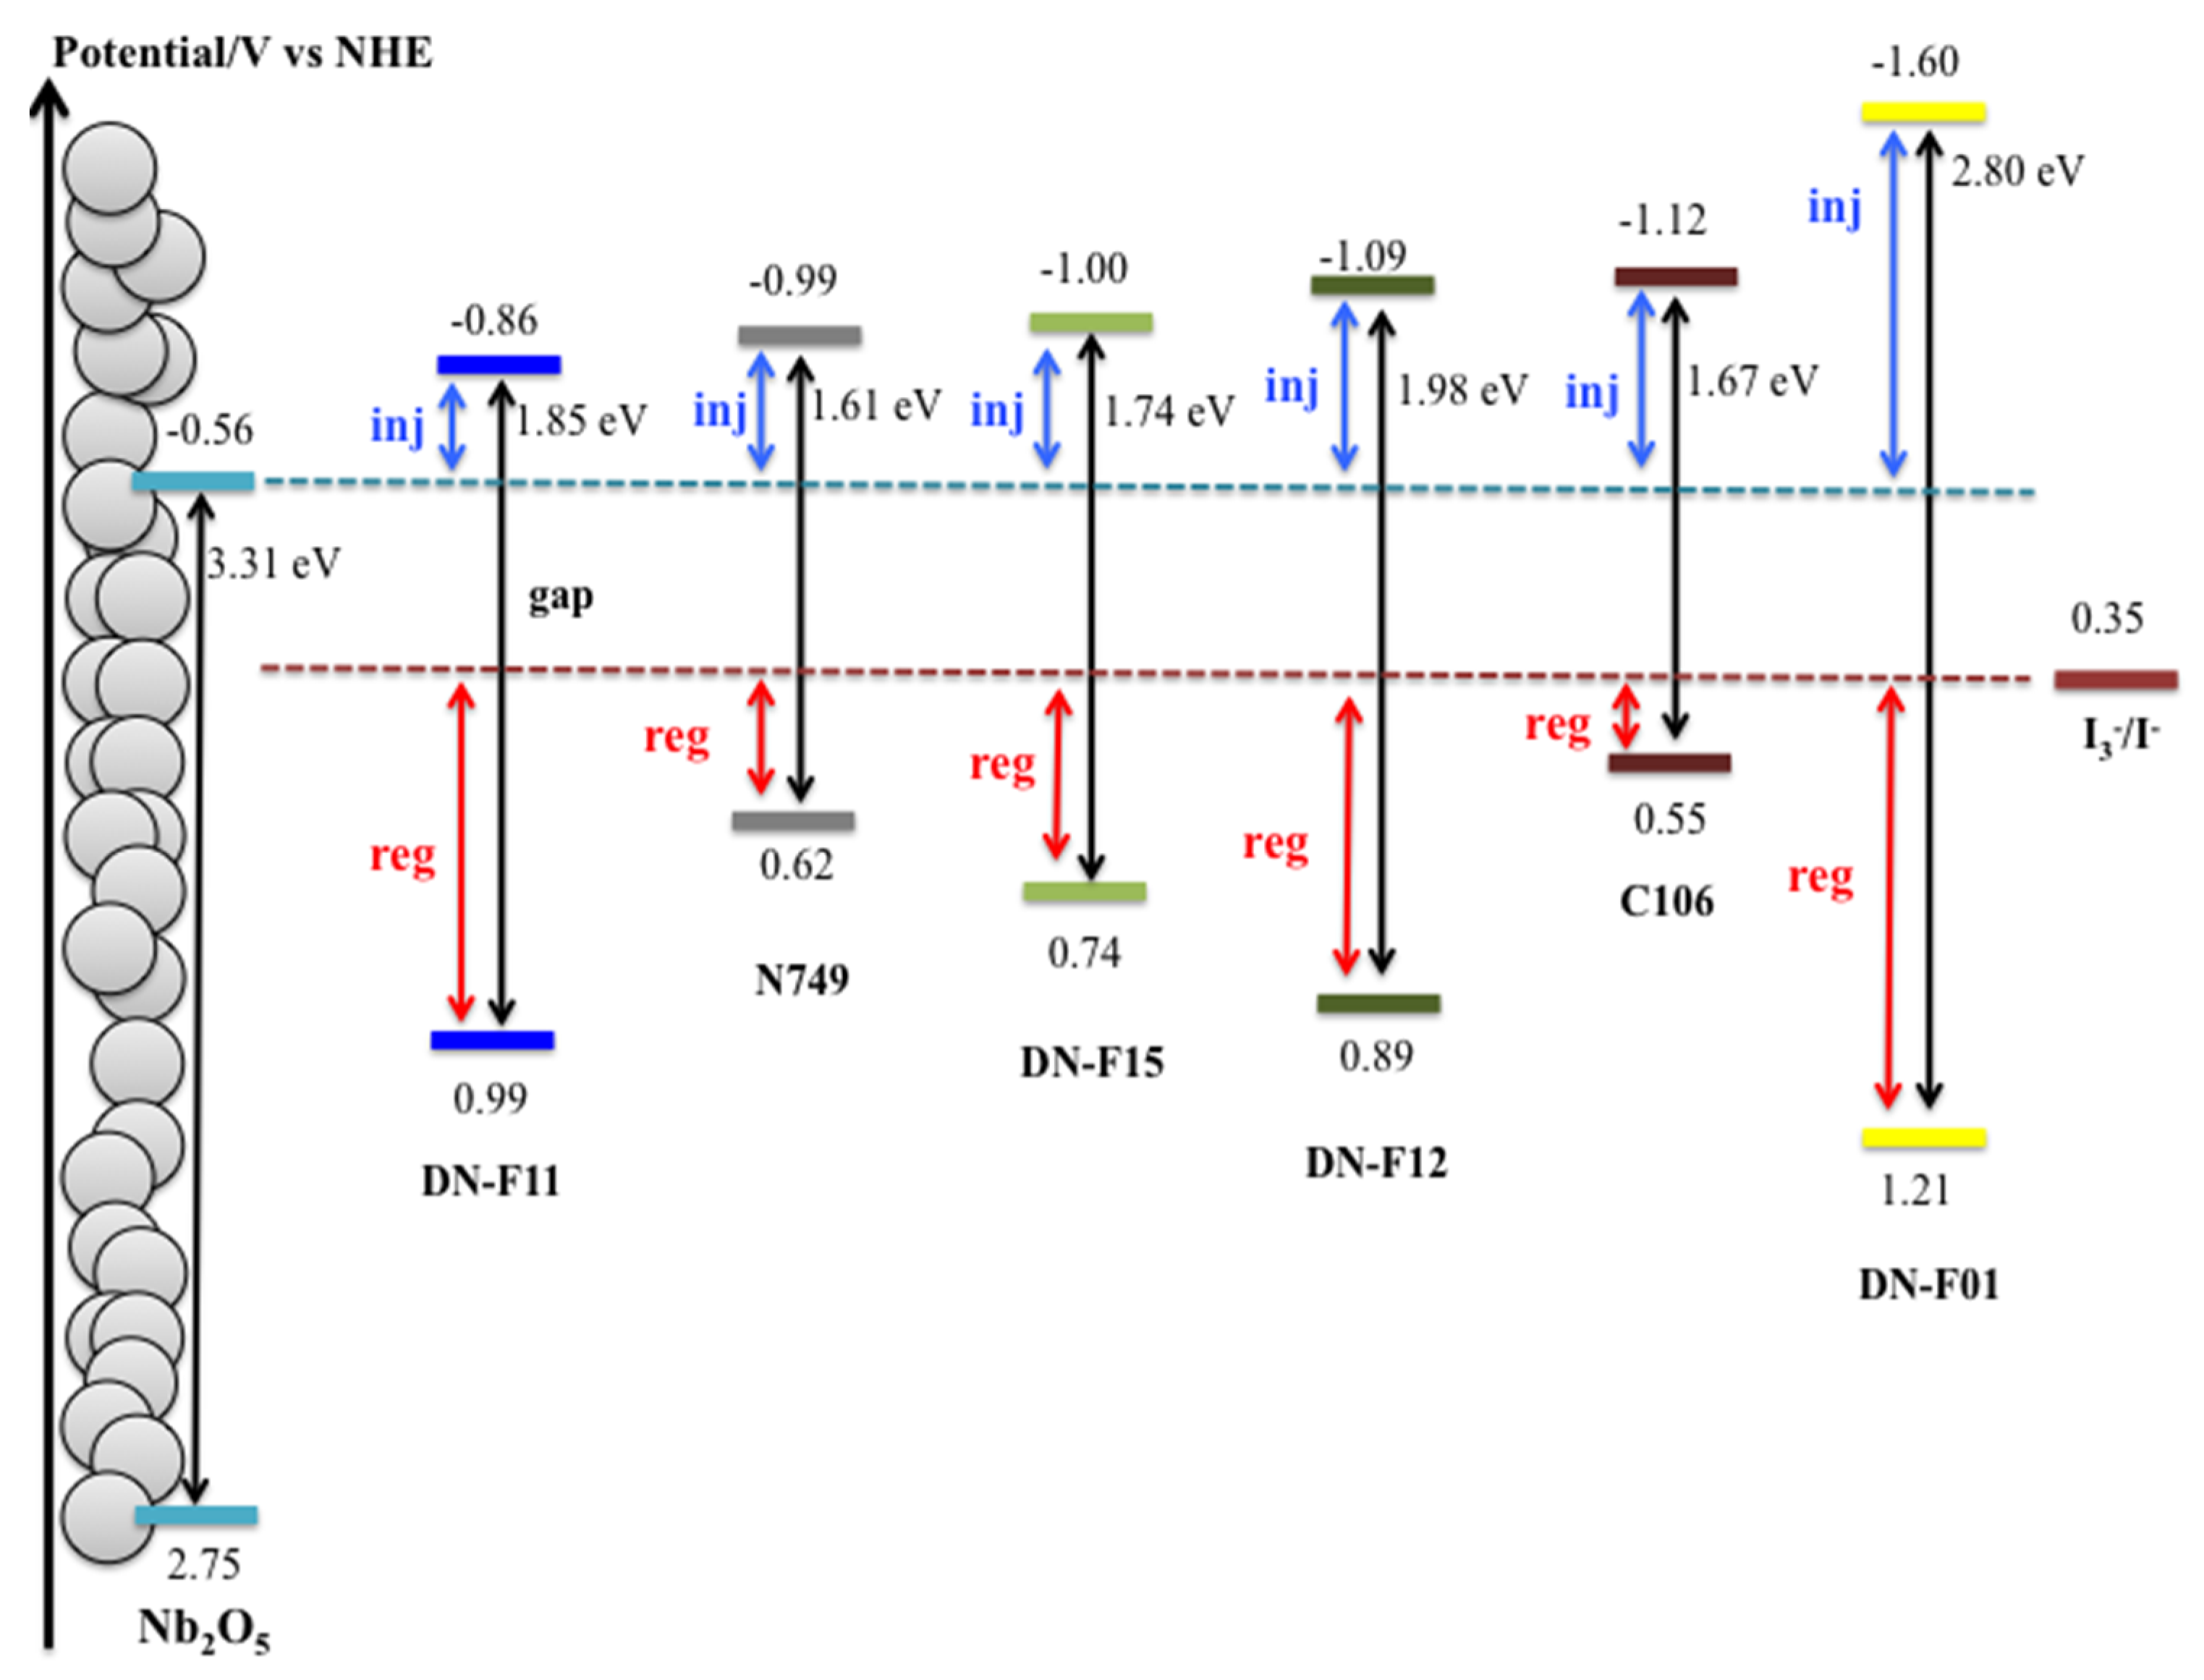
- width of the sensitizing dye HOMO–LUMO gap (EO-O);
- number of dye–semiconductor bonds;
- presence or absence of dye-molecule aggregates on the surface of the semiconductor;
- excited state oxidation potential of the dye (EOX*). The thermodynamic driving force for the electron-injection process () depends on this parameter;
- oxidation potential of dye in ground state (EOX). This parameter is closely linked to the driving force of the dye regeneration ();
- the ability of the dye to shield the surface of the semiconductor from the redox mediator in the electrolyte solution [14].
2. Results and Discussion
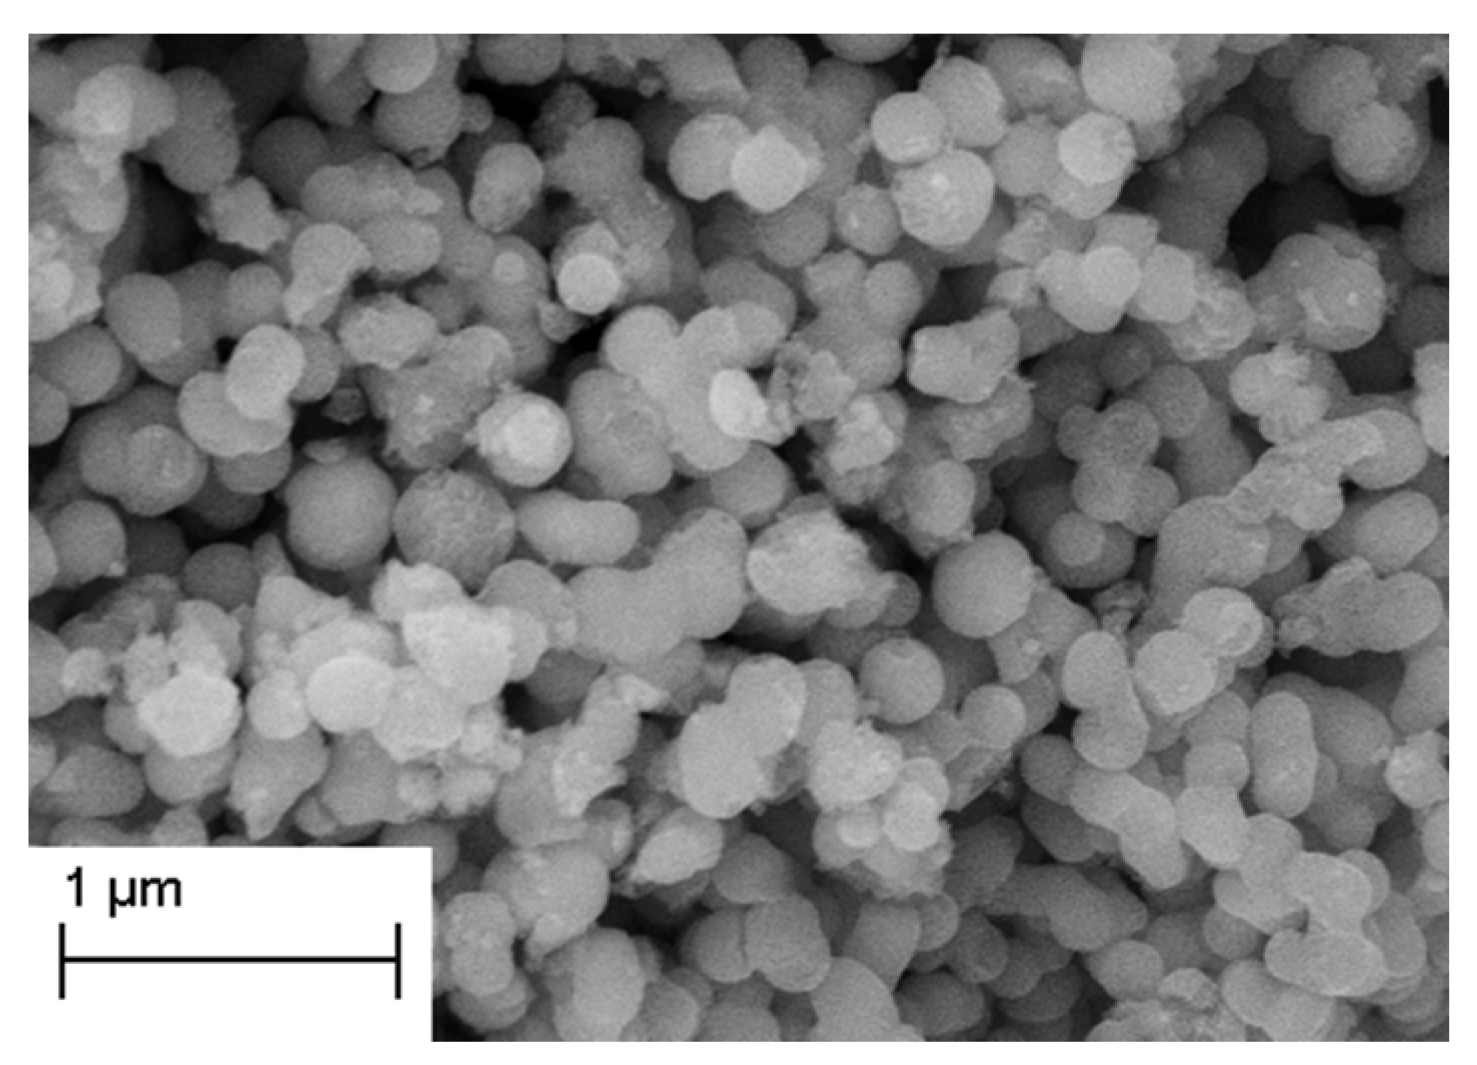
2.1. FESEM
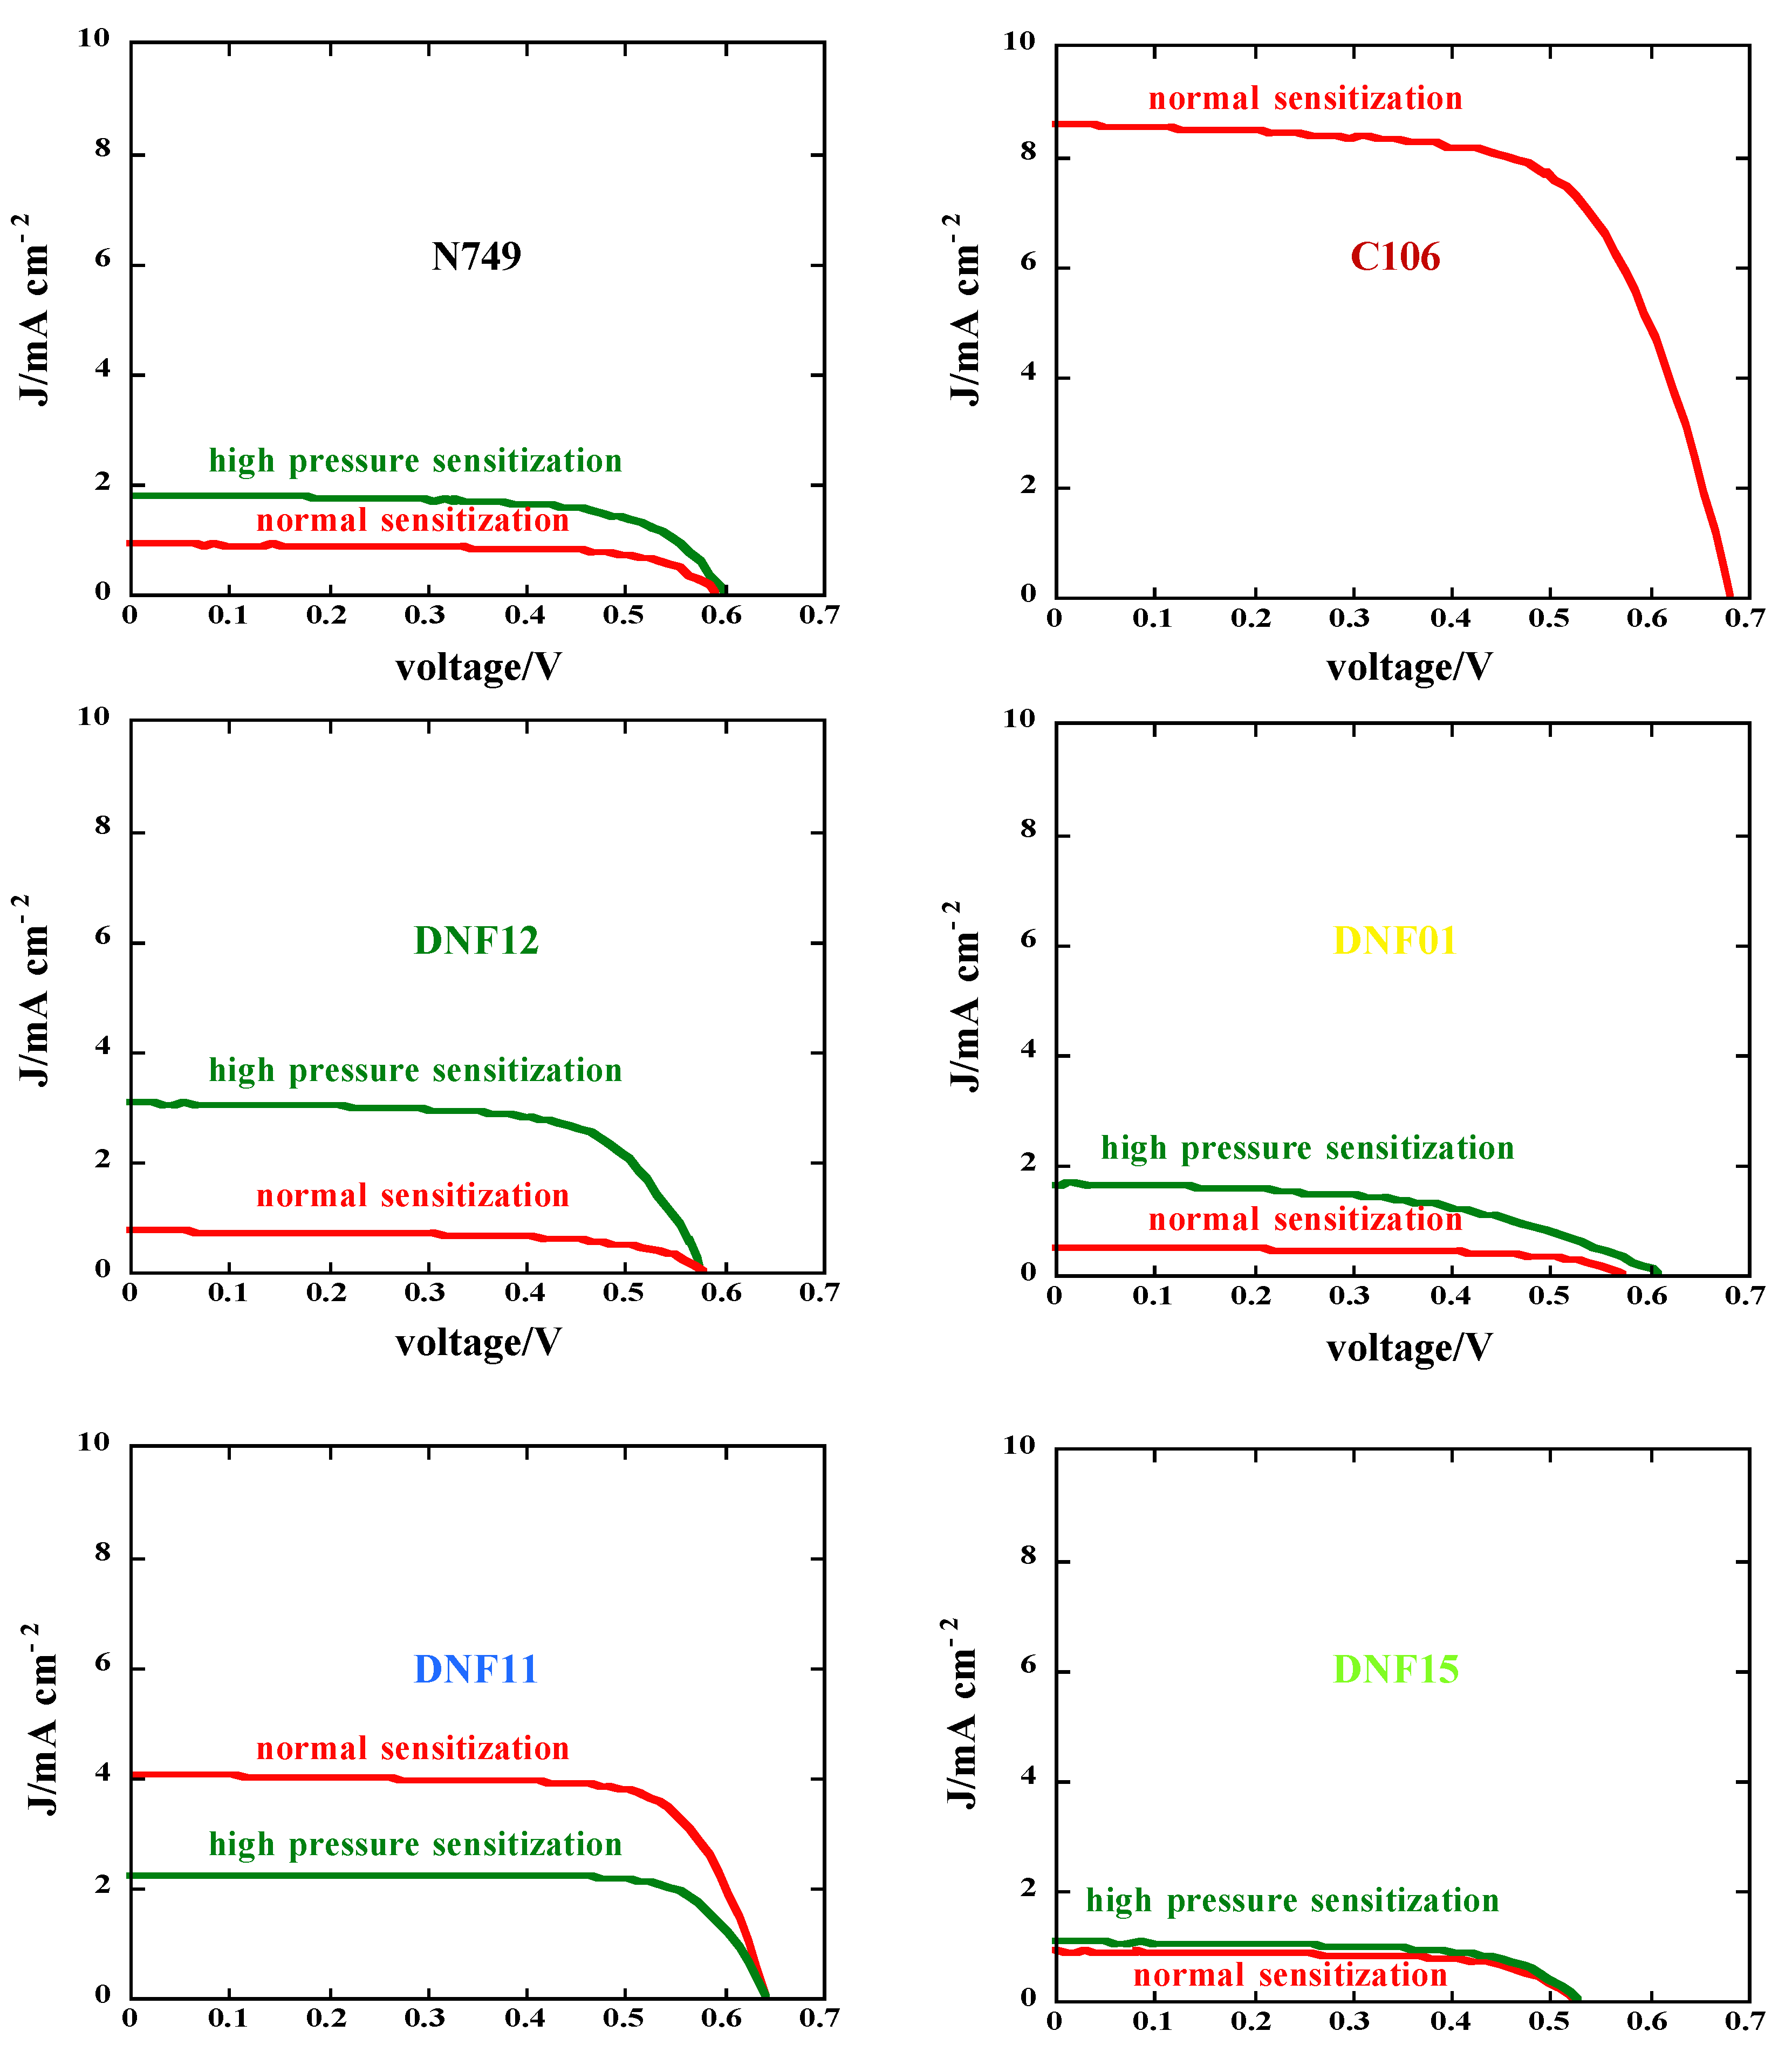
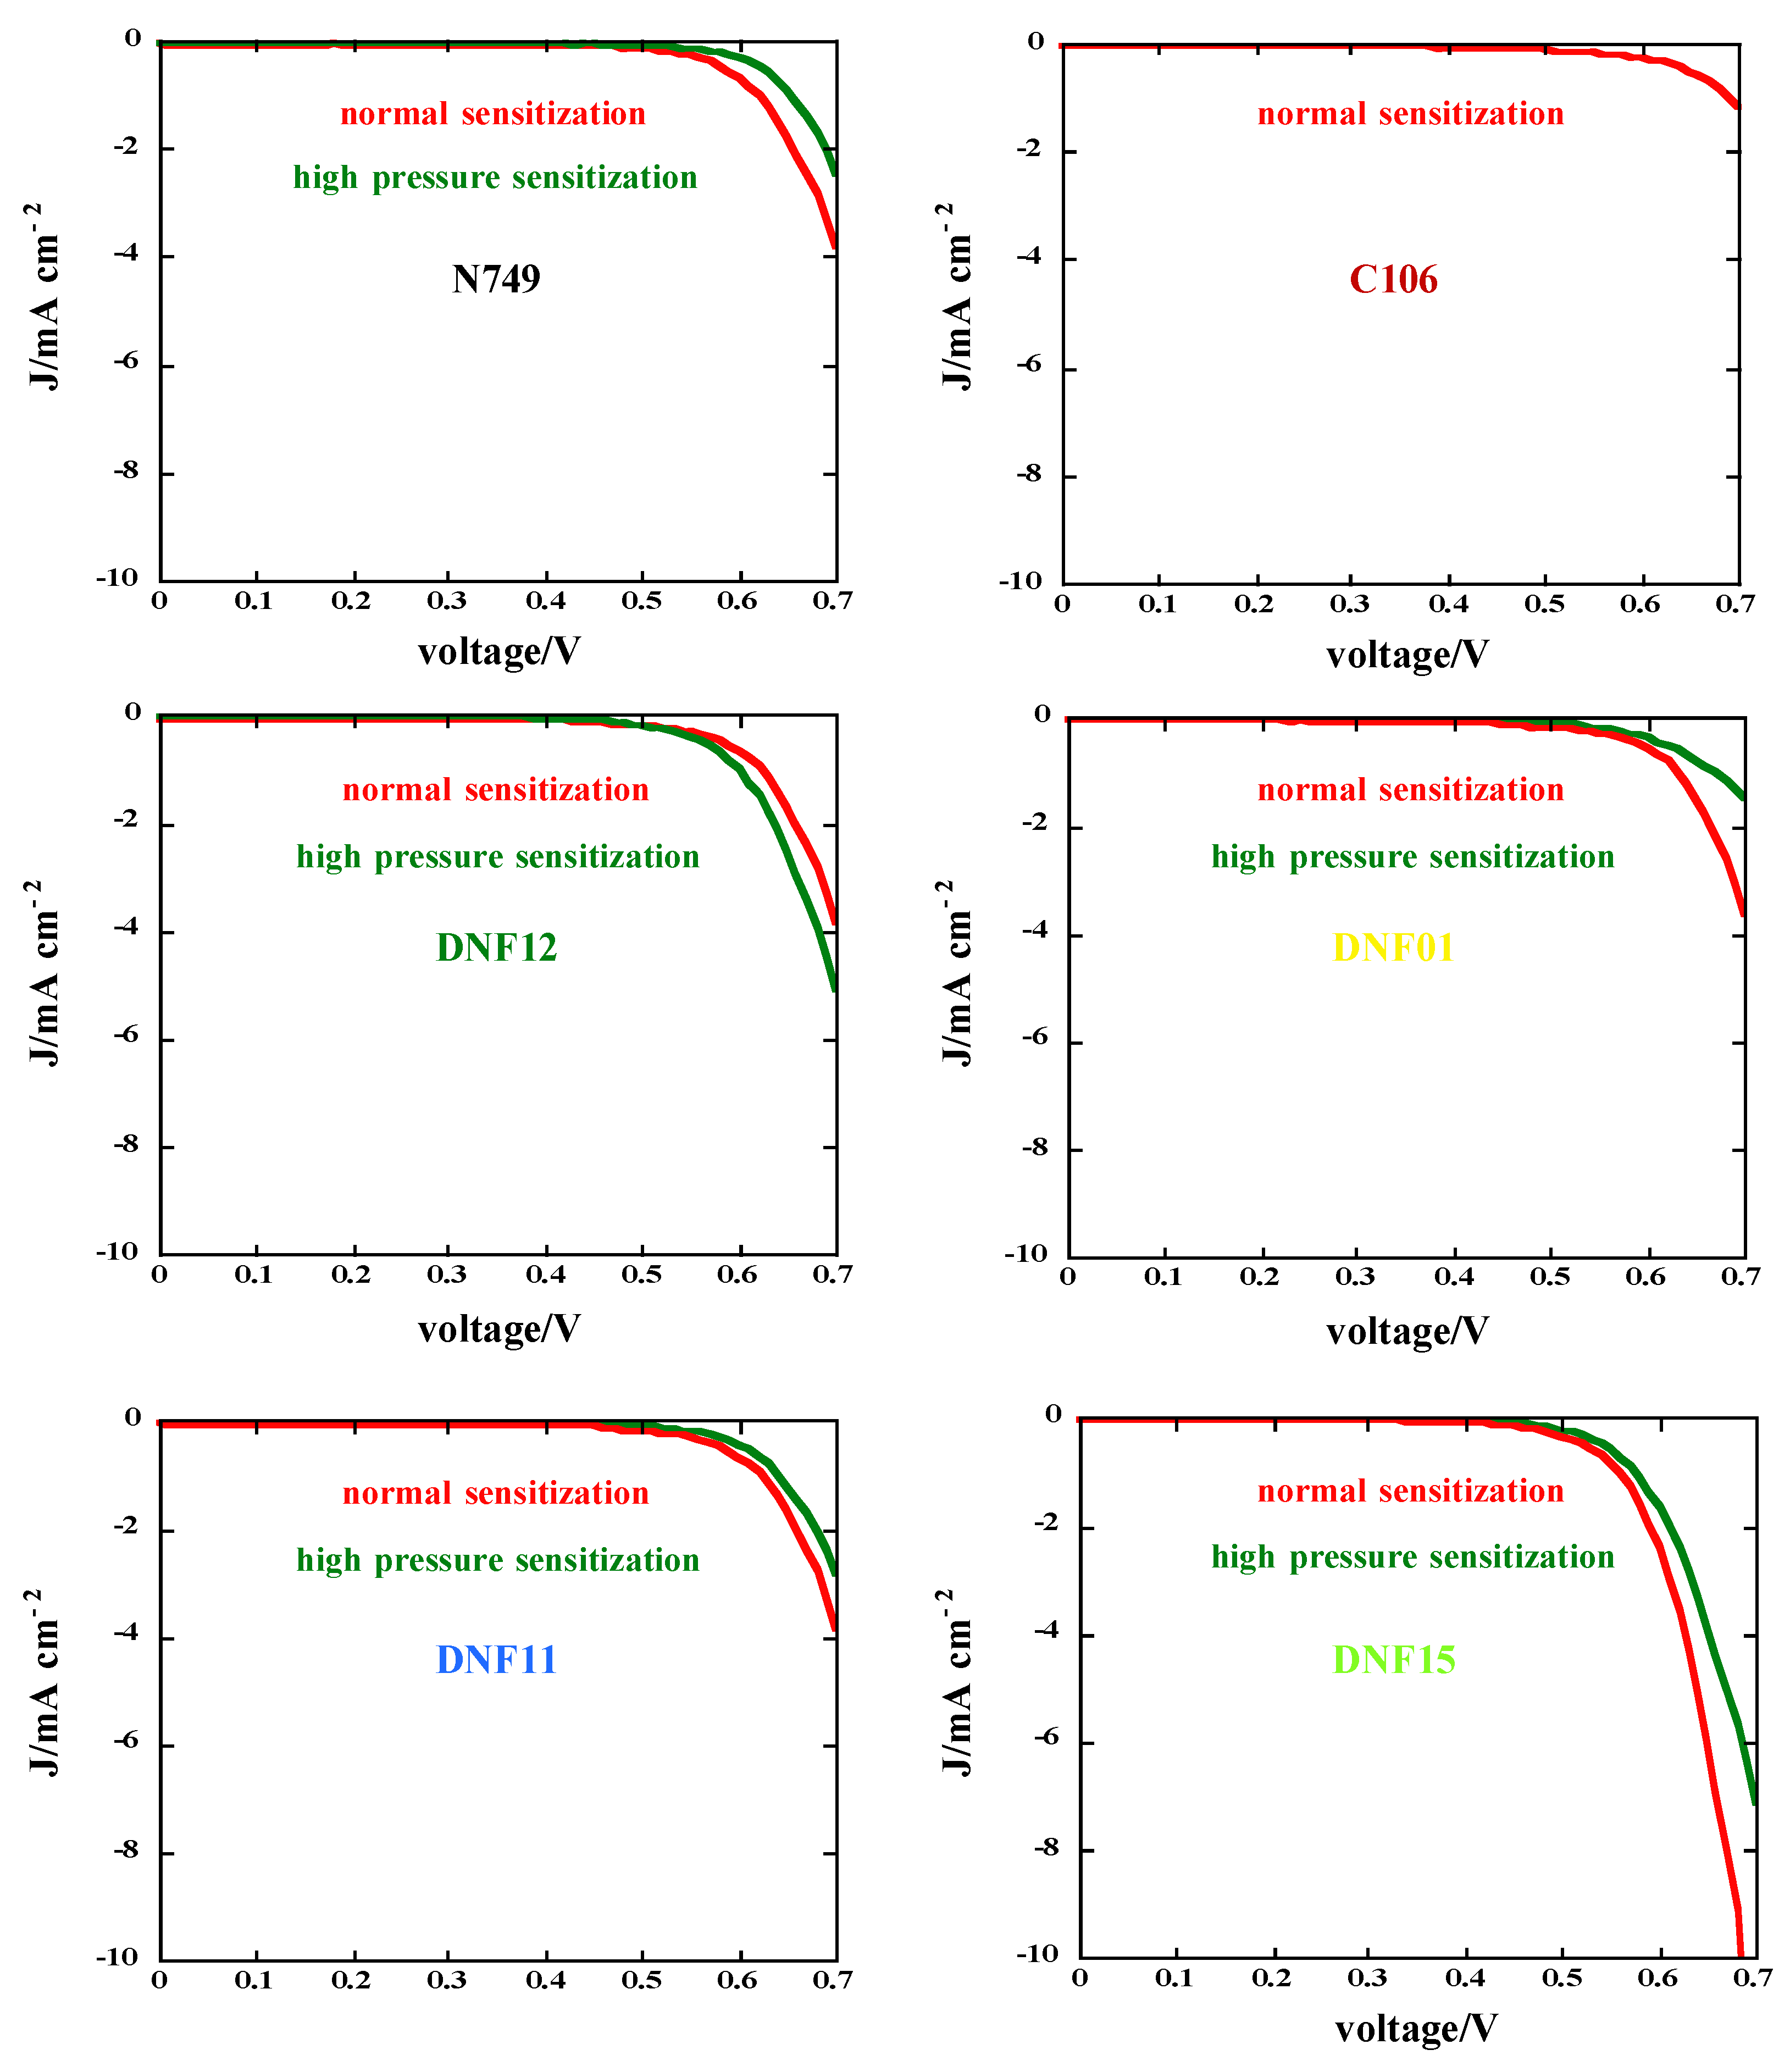
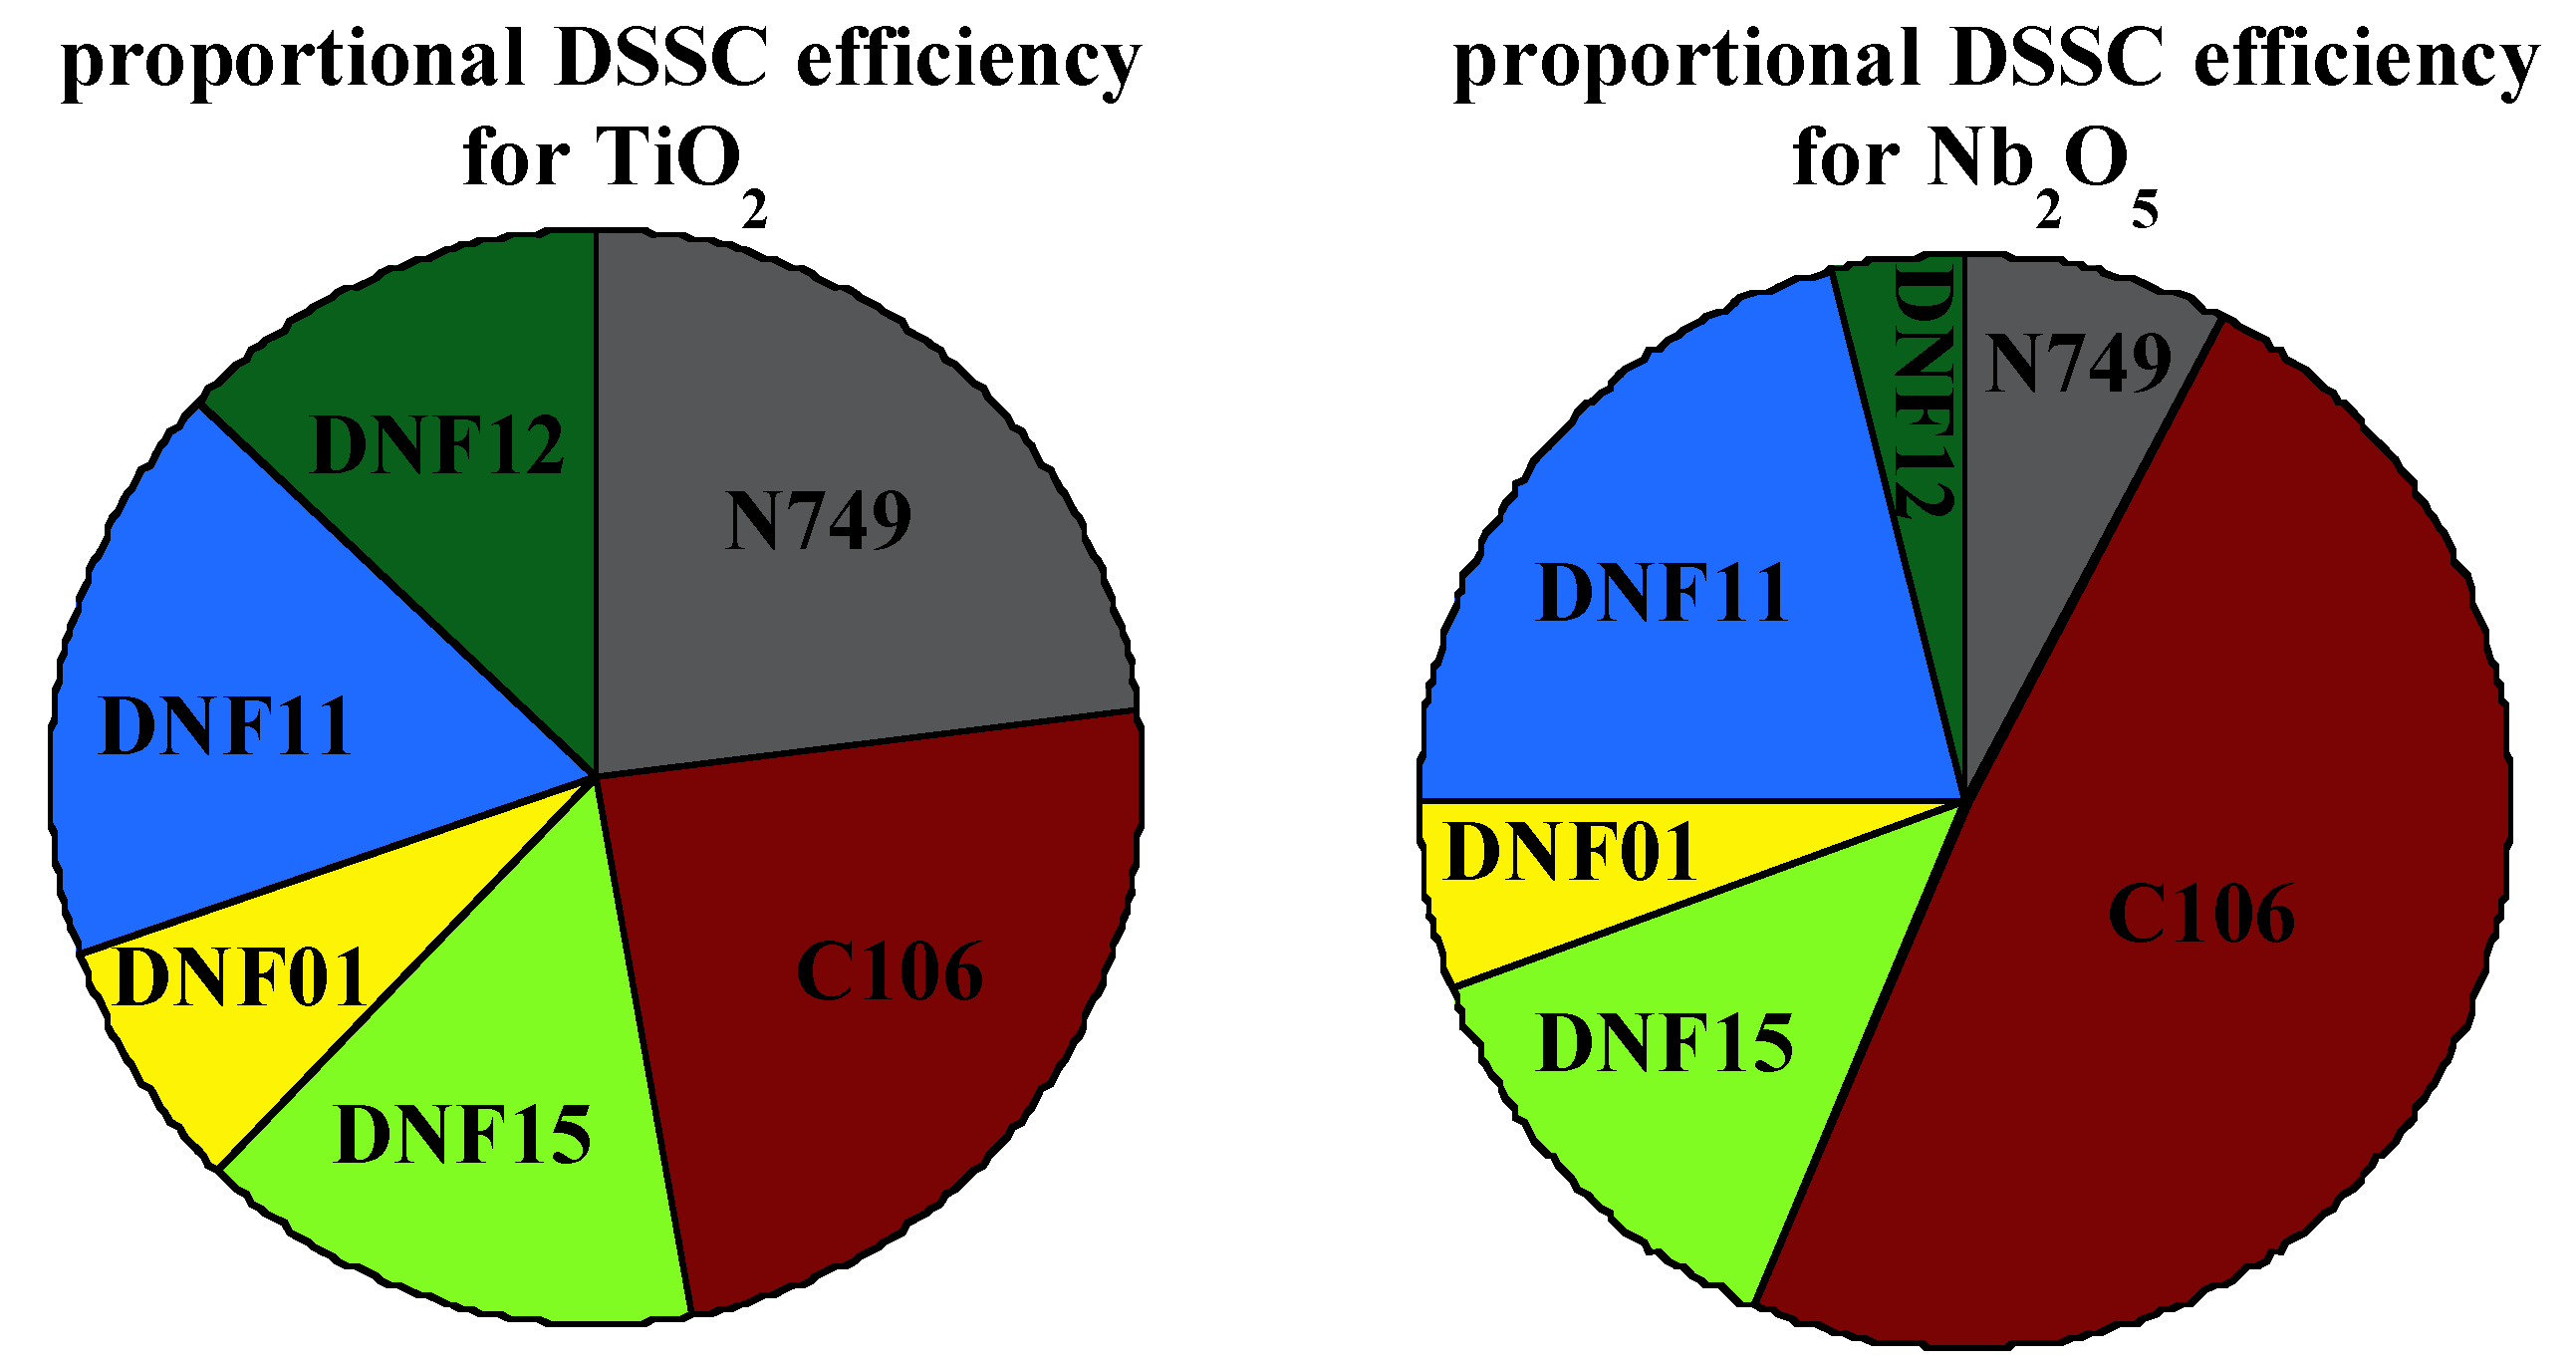
2.2. J–V Curves under 1 Sun AM 1.5 G Illumination and in the Dark
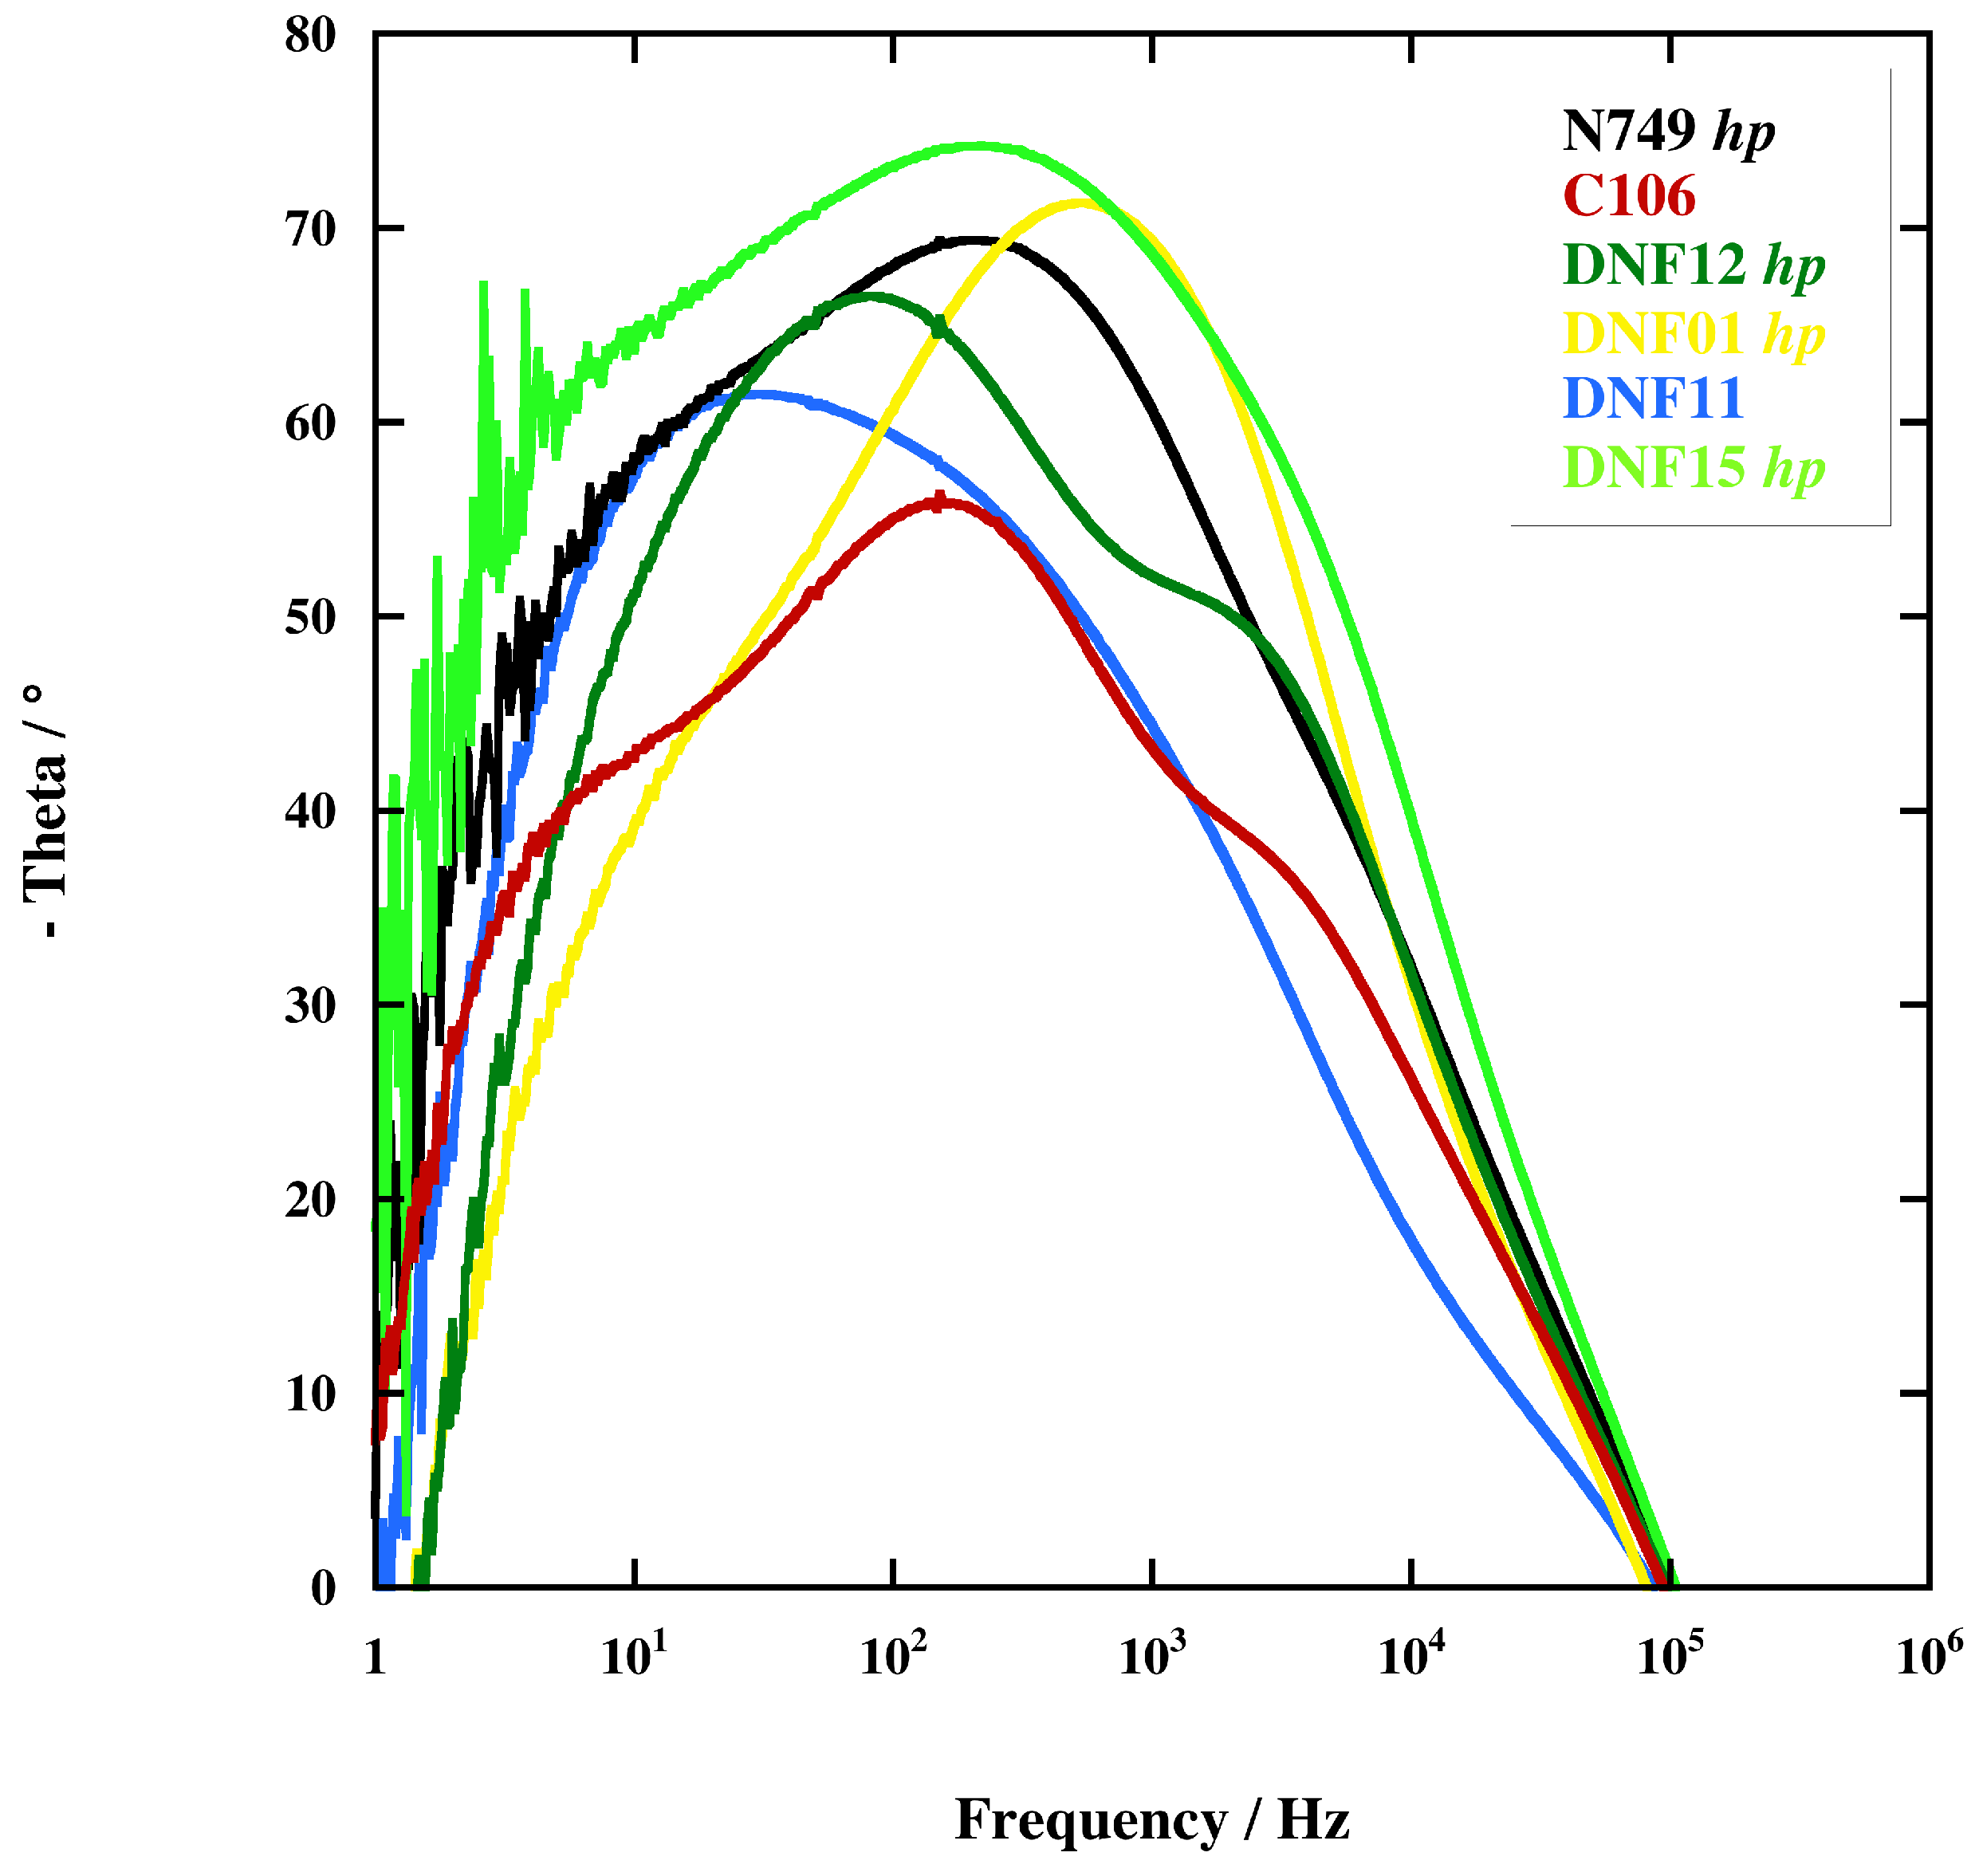
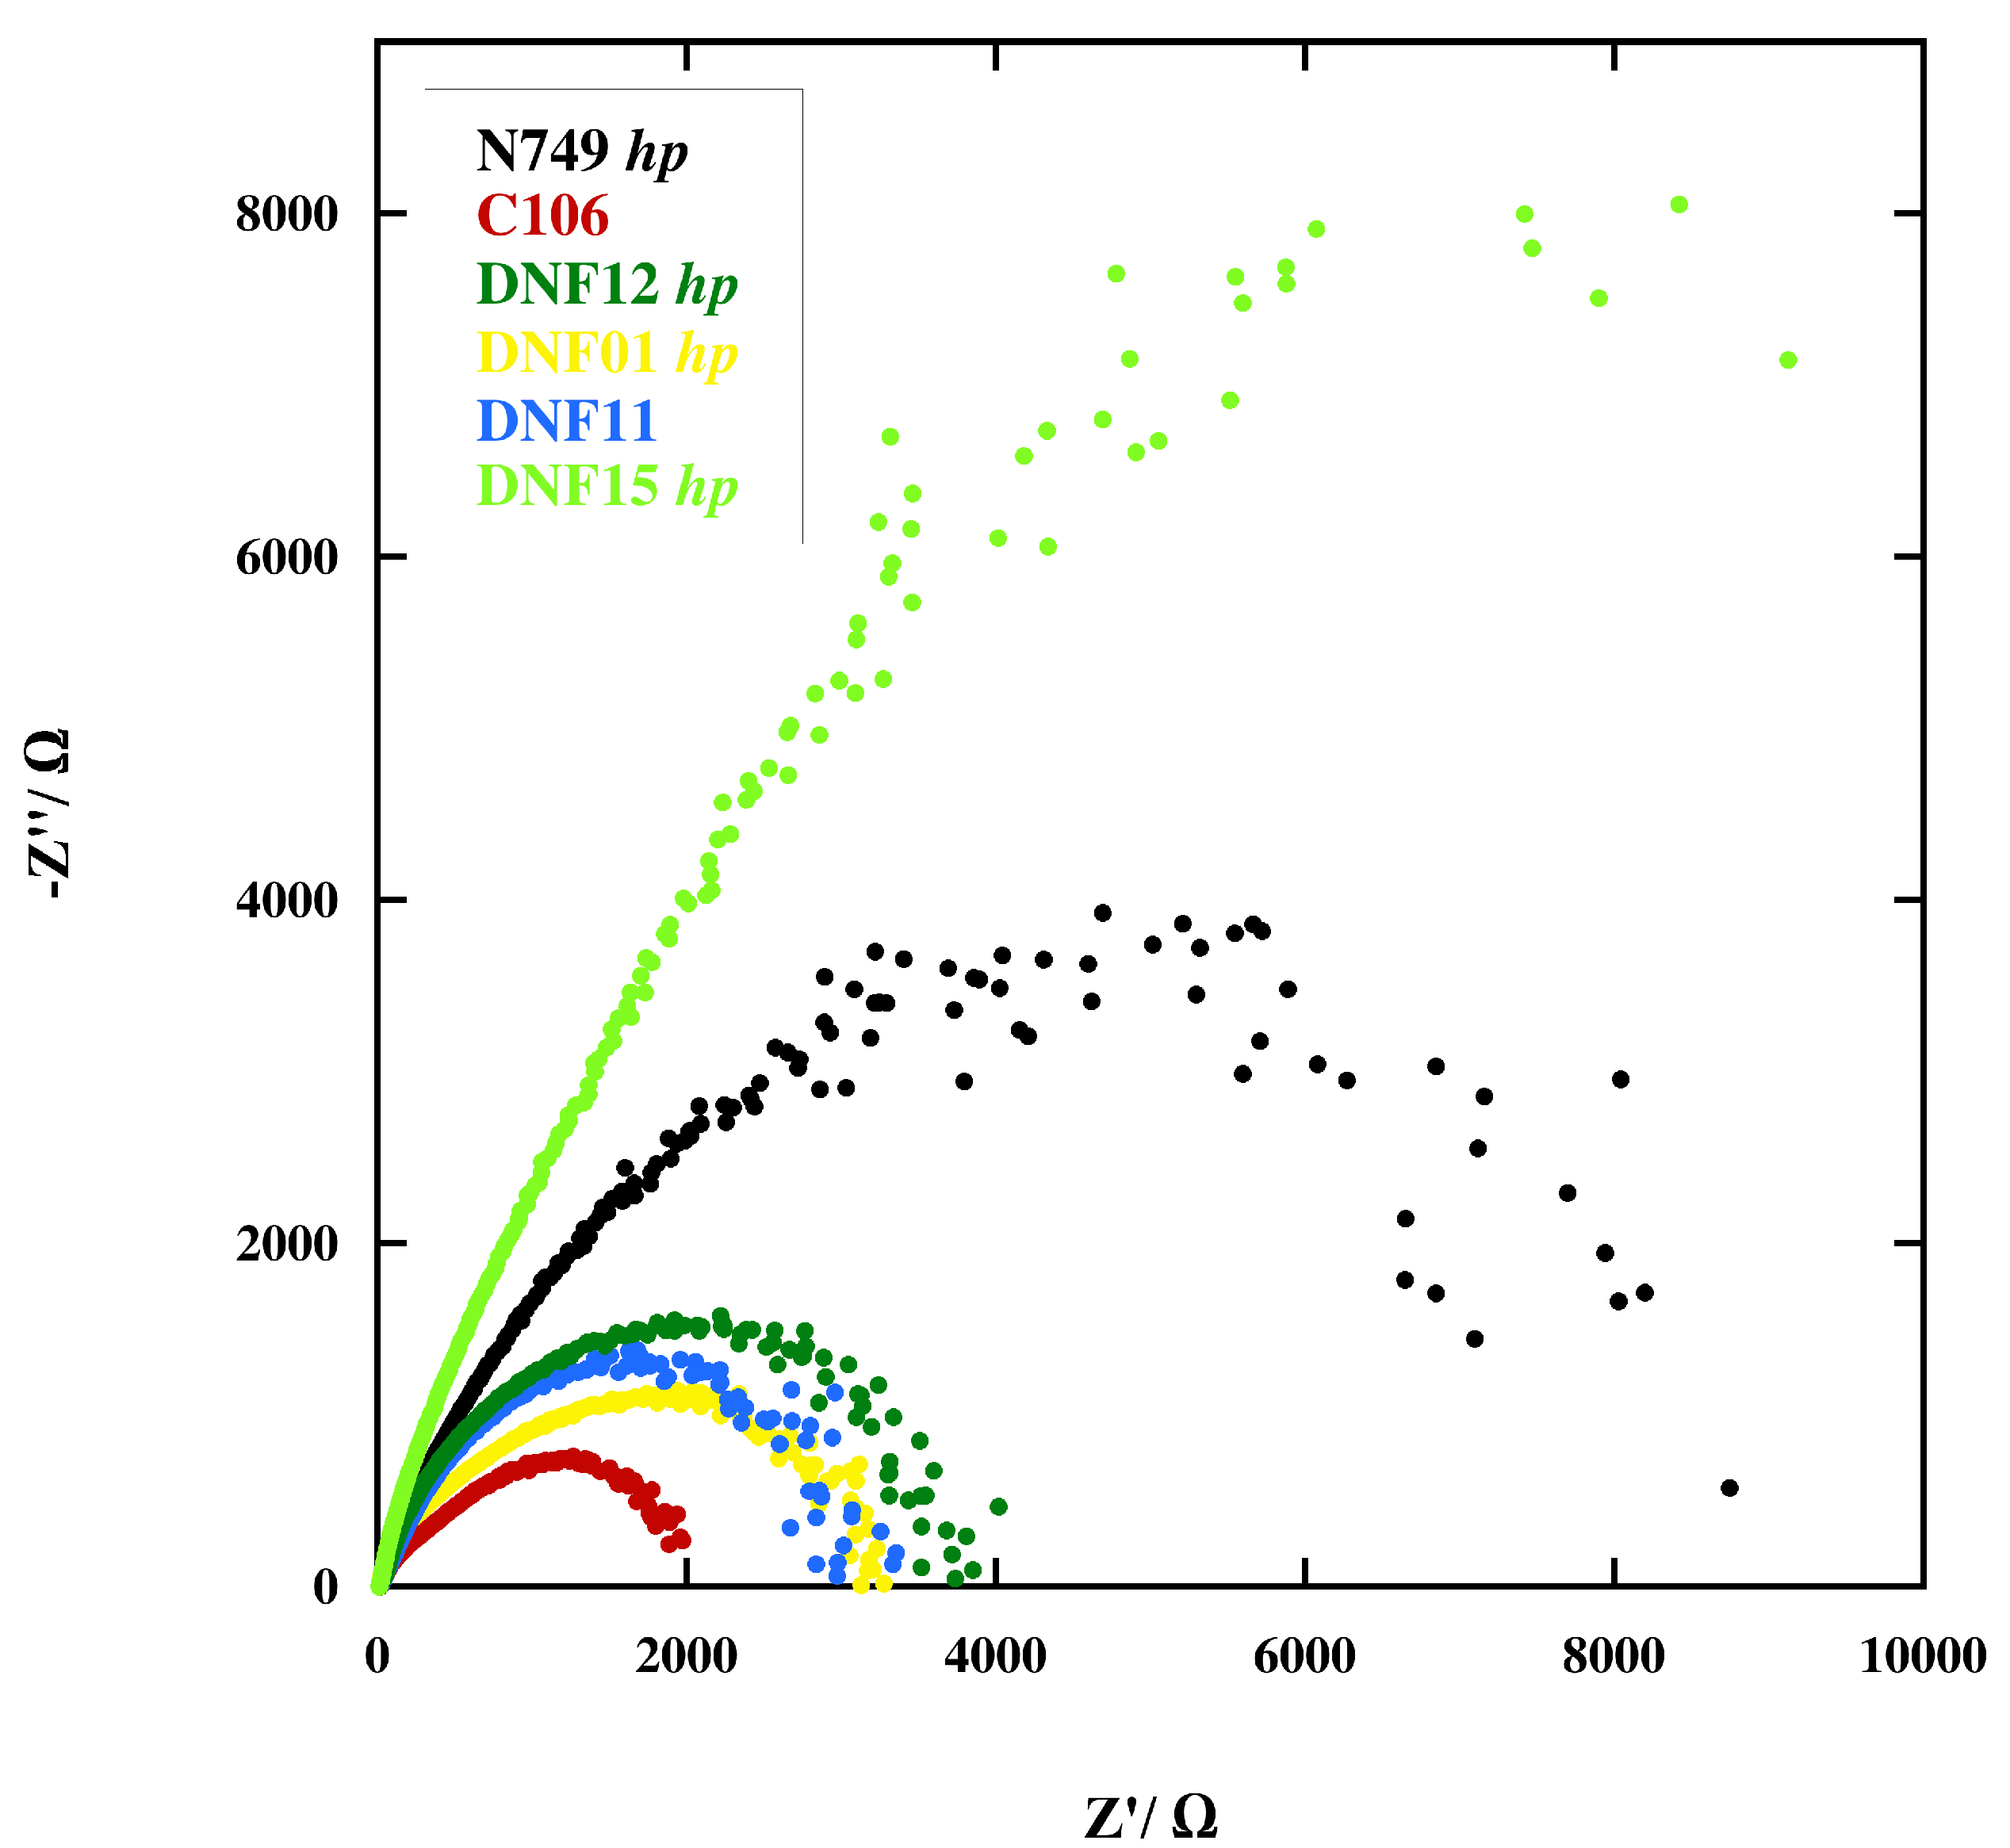
2.3. Electrochemical Impedance Spectroscopy (EIS)
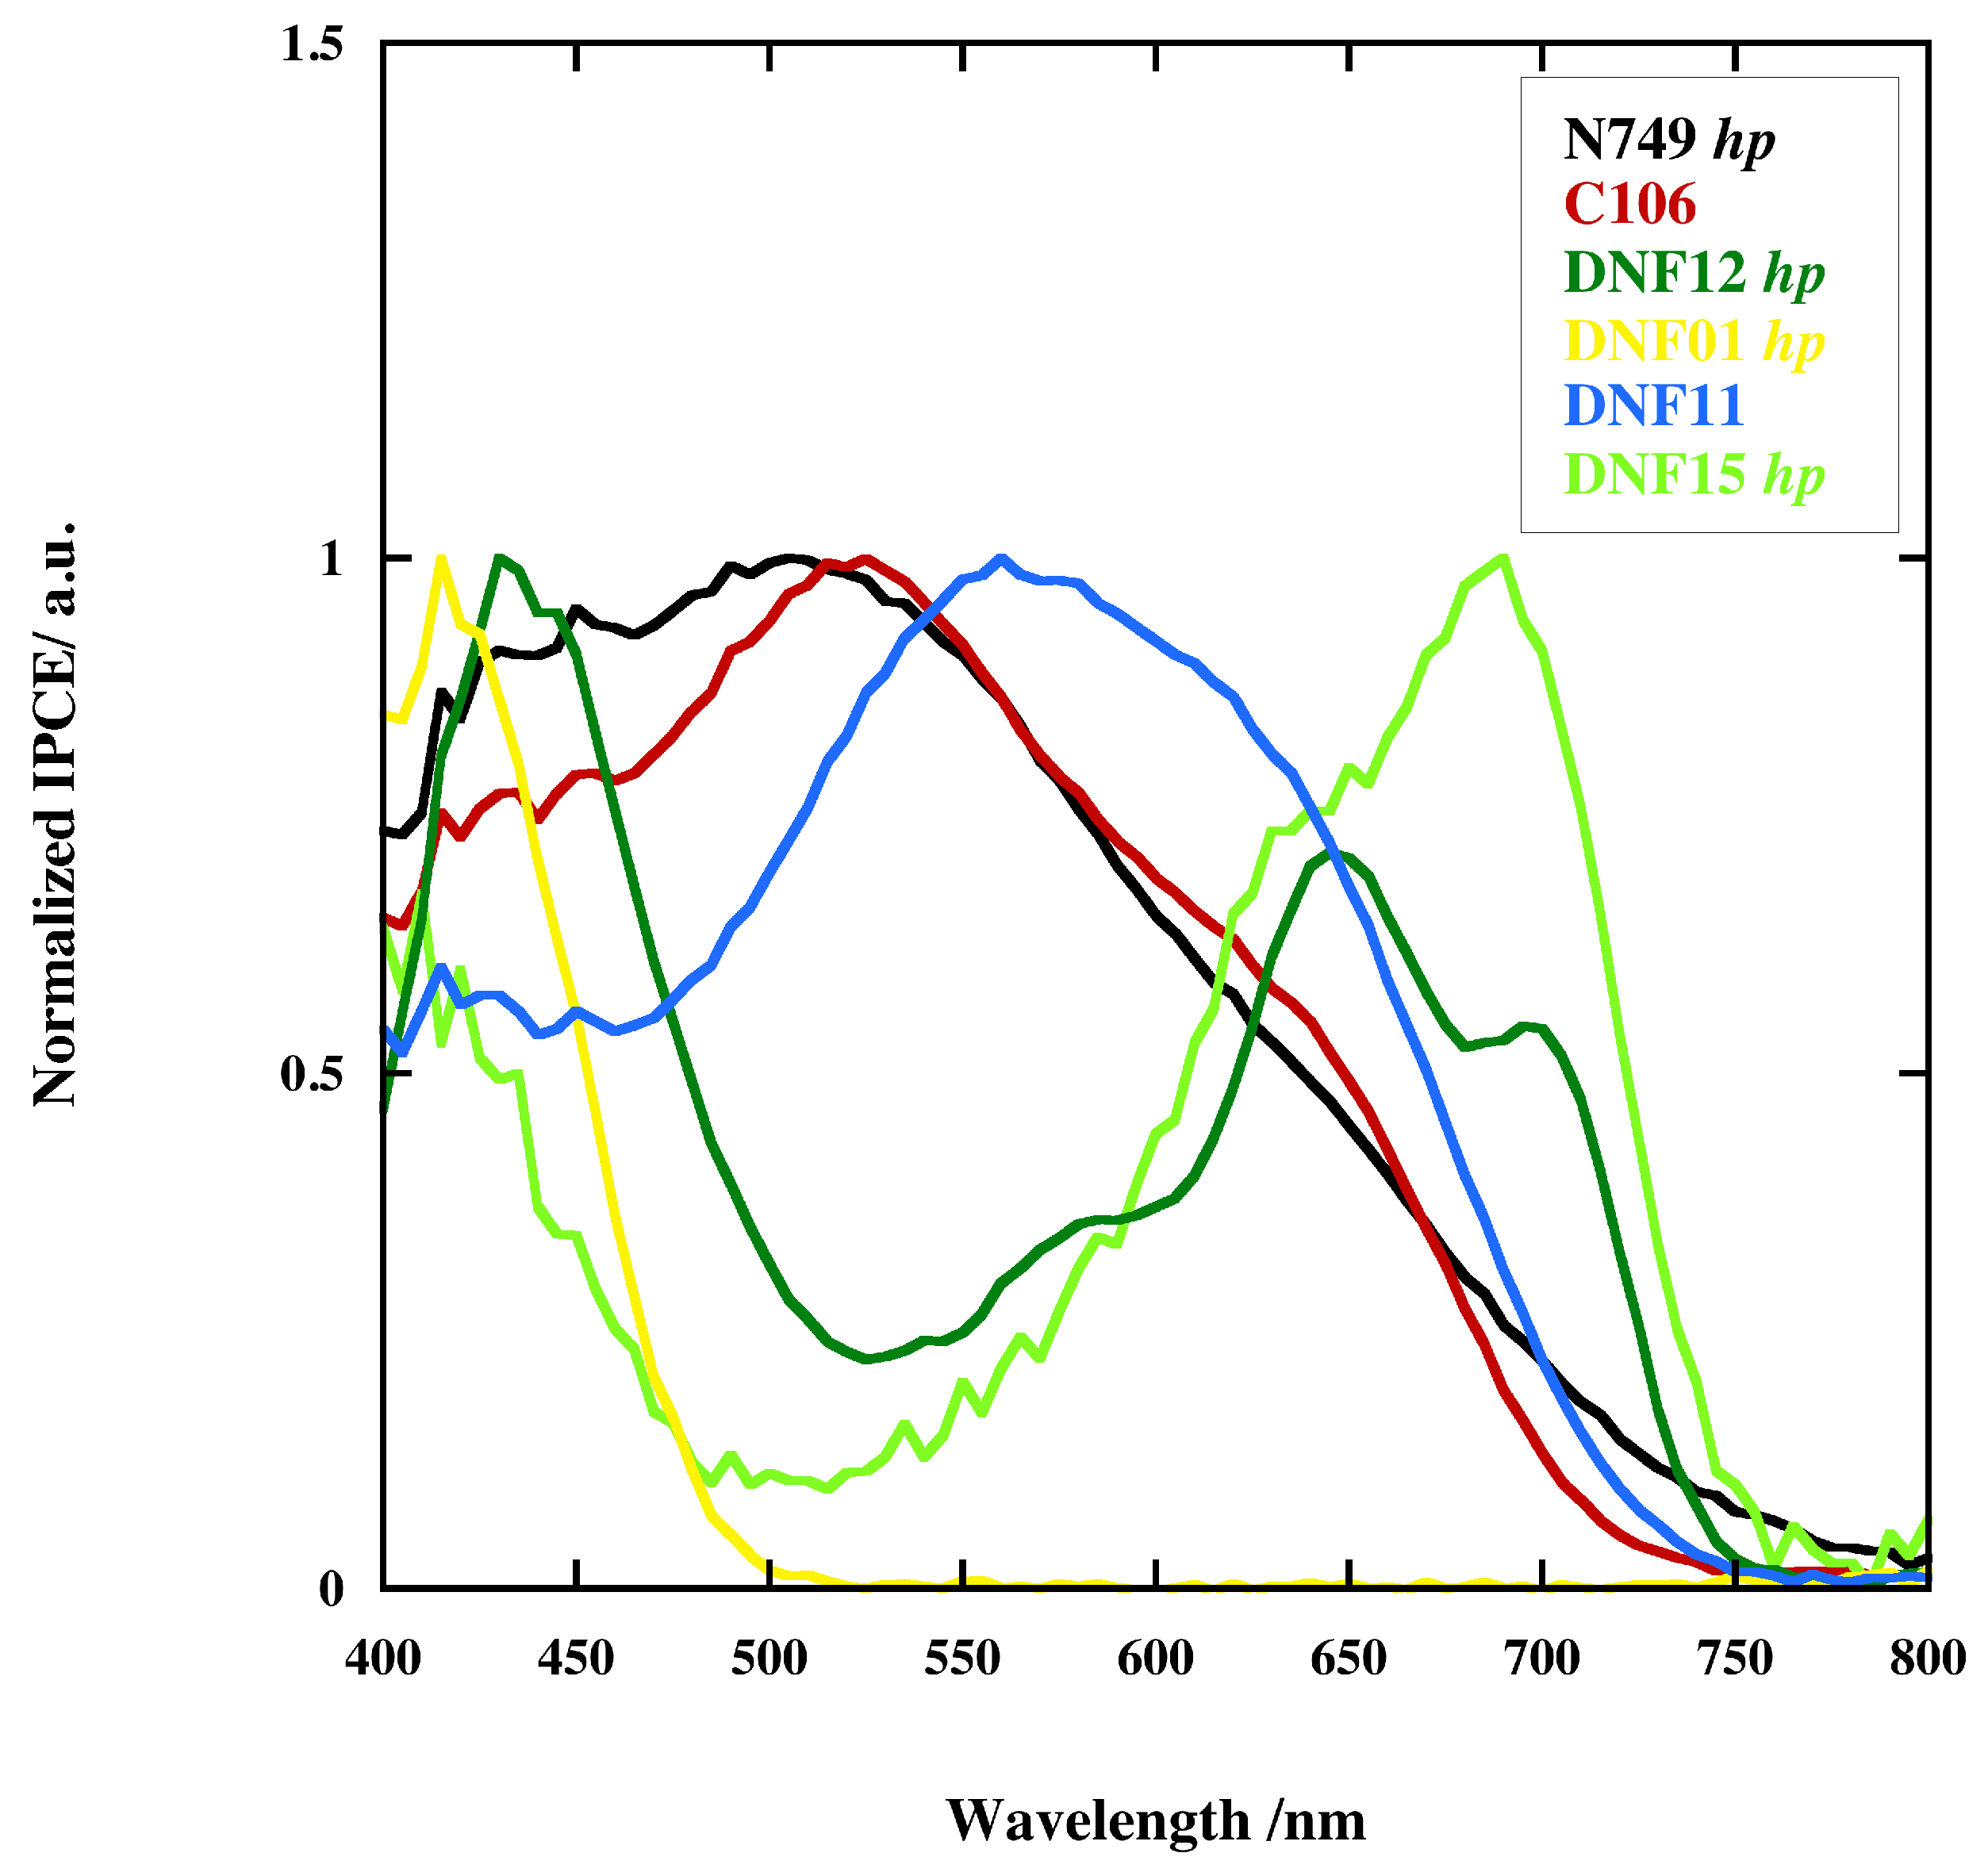
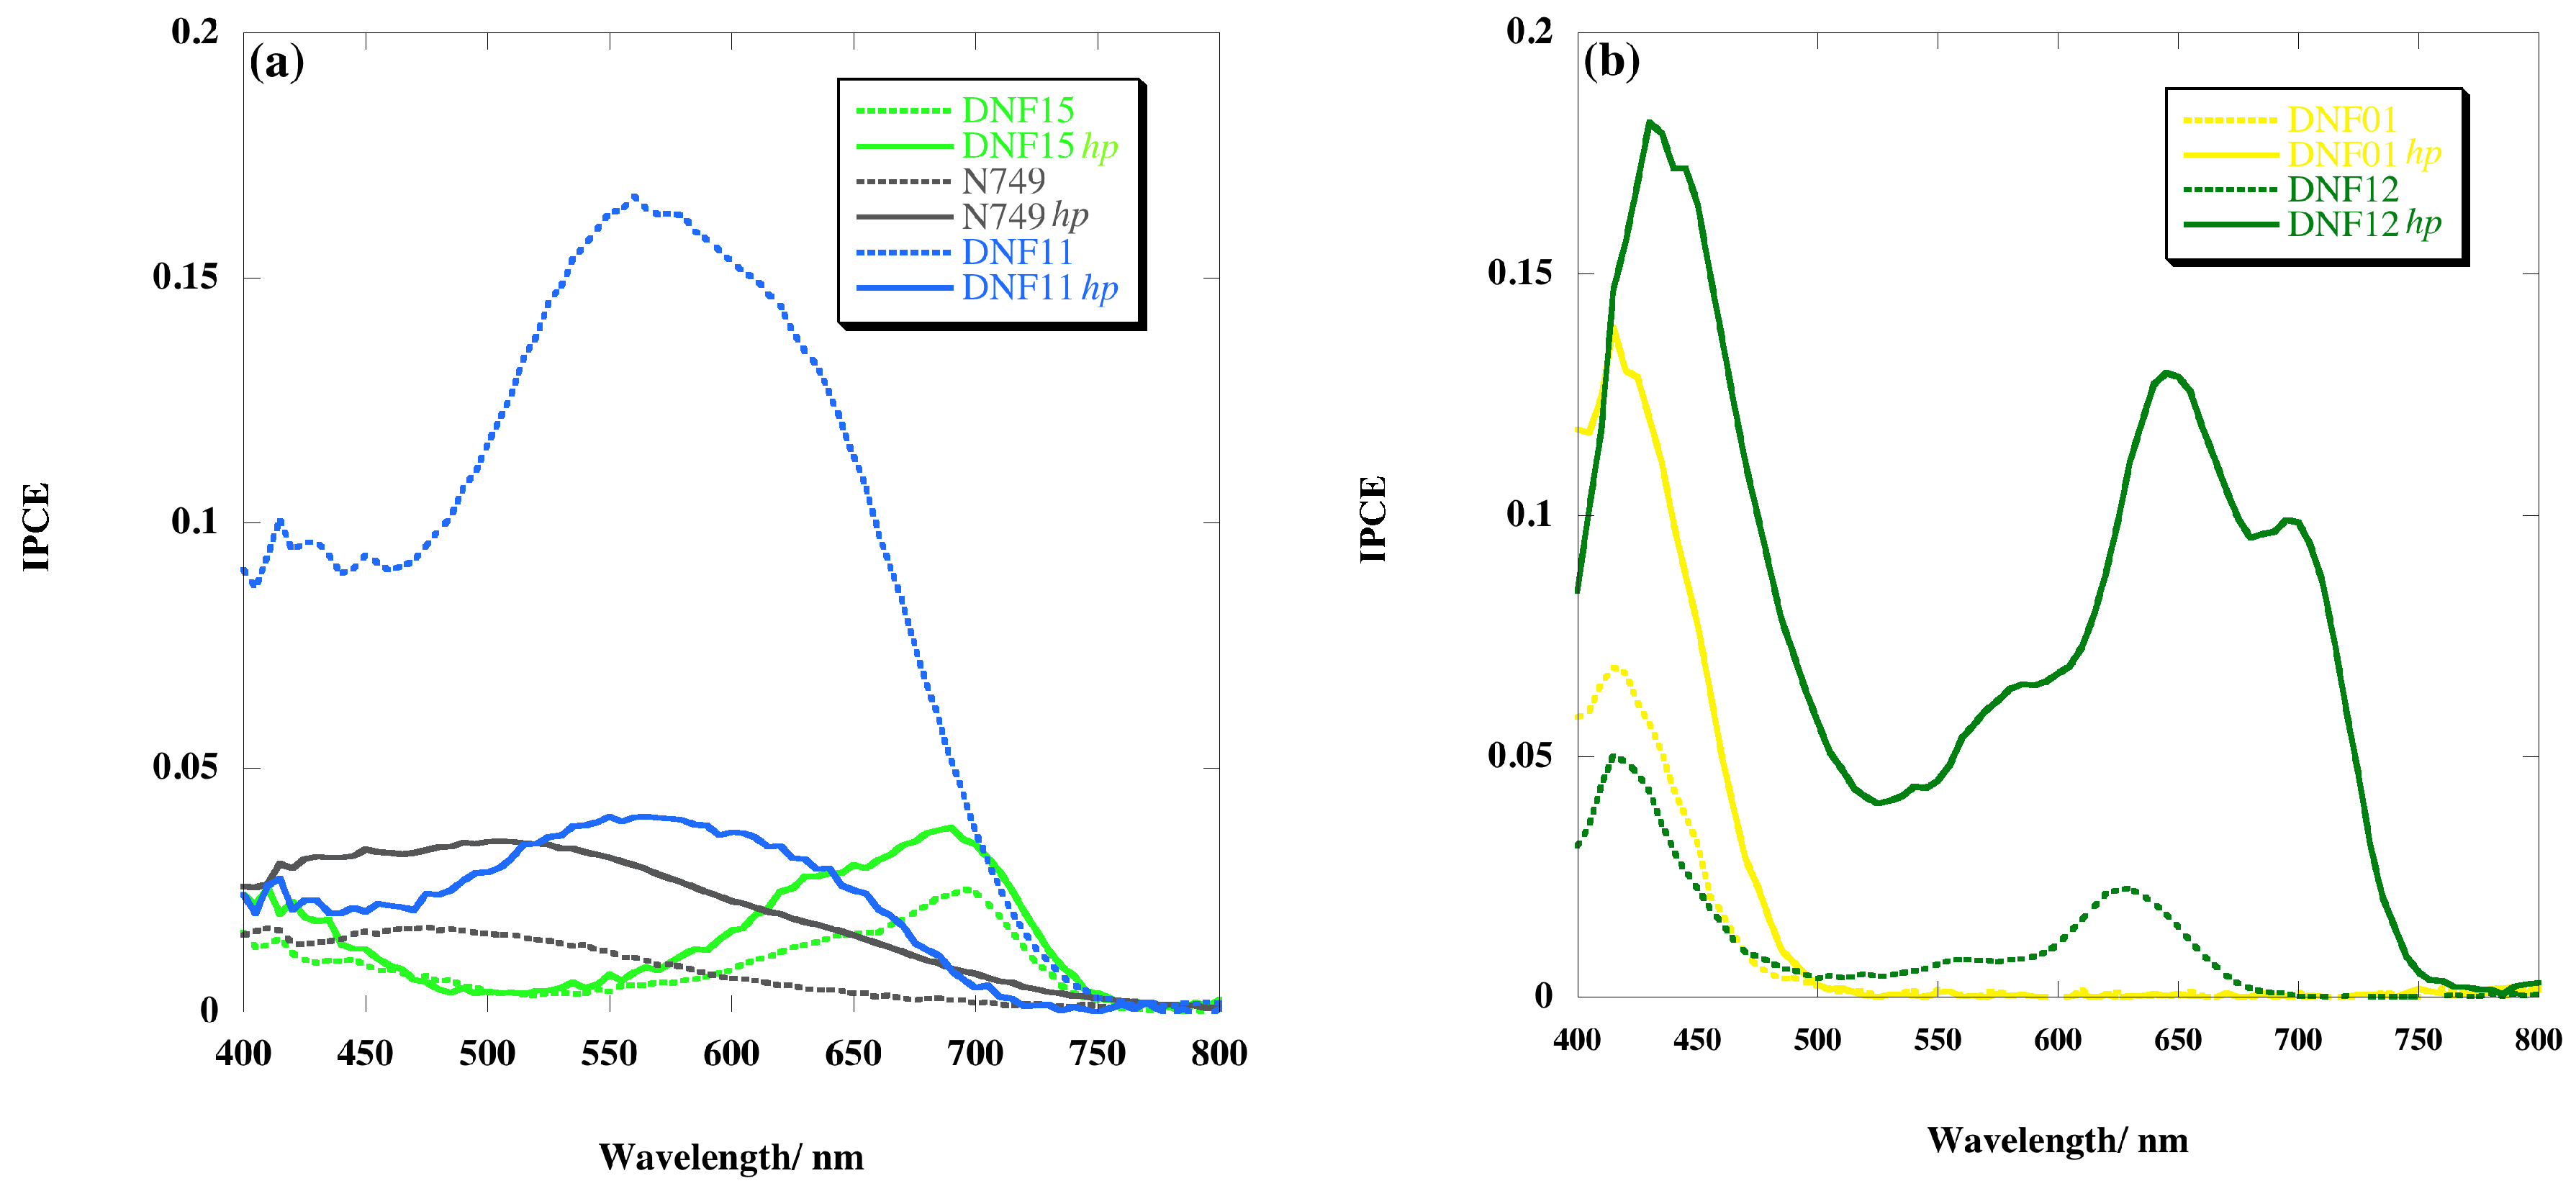
2.4. Incident Photon-to-Current Efficiency (IPCE)
3. Materials and Methods
3.1. Preparation of Nb2O5 Nanoparticles
3.2. DSSC Preparation and Assembly
- N749: mixture of acetonitrile and tert-butyl alcohol (volume ratio: 1/1), 500 µM dye concentration and 20 mM chenodeoxycholic acid concentration;
- C106: mixture of acetonitrile and tert-butyl alcohol (volume ratio: 1/1), 300 µM dye concentration and 2 mM of chenodeoxycholic acid concentration;
- DNF01: acetonitrile solution, 500 µM dye concentration and 40 mM chenodeoxycholic acid concentration;
- DNF11: mixture of acetonitrile and tert-butyl alcohol (volume ratio: 1/1), 125 µM dye concentration;
- DNF12: ethanol solution, 200 µM dye concentration and 400 mM chenodeoxycholic acid concentration;
- DNF15: mixture of acetonitrile and tert-butyl alcohol (volume ratio: 1/1), 200 µM dye concentration.
3.3. FESEM
3.4. DSSC Test
4. Conclusions
Acknowledgments
Author Contributions
Conflicts of Interest
References
- O’Regan, B.; Gräzel, M. A low-cost, high-efficiency solar cell based on dye-sensitized colloidal TiO2 films. Nature 1991, 353, 737–739. [Google Scholar] [CrossRef]
- Cavallo, C.; Di Pascasio, F.; Latini, A.; Bonomo, M.; Dini, D. Nanostructured Semiconductor Materials for Dye-Sensitized Solar Cells. J. Nanomater. 2017, 5323164. [Google Scholar] [CrossRef]
- Chava, R.K.; Kang, M. Improving the photovoltaic conversion efficiency of ZnO based dye sensitized solar cells by indium doping. J. Alloys Compd. 2017, 692, 67–76. [Google Scholar] [CrossRef]
- Chava, R.K.; Lee, W.; Oh, S.; Jeong, K.; Yu, Y. Improvement in light harvesting and device performance of dye sensitized solar cells using electrophoretic deposited hollow TiO2 NPs scattering layer. Sol. Energy Mater. Sol. Cells 2017, 161, 255–262. [Google Scholar] [CrossRef]
- Chava, R.K.; Raj, S.; Yu, Y. Synthesis and electrophoretic deposition of hollow-TiO2 nanoparticles for dye sensitized solar cell applications. J. Alloys Compd. 2016, 672, 212–222. [Google Scholar] [CrossRef]
- Le Viet, A.; Jose, R.; Reddy, M.V.; Chowdari, B.V.R.; Ramakrishna, S. Nb2O5 Photoelectrodes for Dye-Sensitized Solar Cells: Choice of the Polymorph. J. Phys. Chem. C 2010, 114, 21795–21800. [Google Scholar] [CrossRef]
- Sayama, K.; Sugihara, H.; Arakawa, H. Photoelectrochemical Properties of a Porous Nb2O5. Chem. Mater. 1998, 10, 3825–3832. [Google Scholar] [CrossRef]
- Raga, S.R.; Barea, E.M.; Fabregat-Santiago, F. Analysis of the Origin of Open Circuit Voltage in Dye Solar Cells. Phys. Chem. Lett. 2012, 3, 1629–1634. [Google Scholar] [CrossRef] [PubMed]
- Mehmood, U.; Hussein, I.A.; Harrabi, K.; Ahmed, S. Density Functional Theory Study on the Electronic Structures of Oxadiazole Based Dyes as Photosensitizer for Dye Sensitized Solar Cells. Adv. Mater. Sci. Eng. 2015, 286730. [Google Scholar] [CrossRef]
- Alibabaei, L.; Luo, H.; House, R.L.; Hoertz, P.G.; Lopez, R.; Meyer, T.J. Applications of metal oxide materials in dye sensitized photoelectrosynthesis cells for making solar fuels: Let the molecules do the work. J. Mater. Chem. A 2013, 1, 4133–4145. [Google Scholar] [CrossRef]
- Jin, X.; Liu, C.; Xu, J.; Wang, Q.; Chen, D. Size-controlled synthesis of mesoporous Nb2O5 microspheres for dye sensitized solar cells. RSC Adv. 2014, 4, 35546–35553. [Google Scholar] [CrossRef]
- Ou, J.Z.; Rani, R.A.; Ham, M.; Field, M.R.; Zhang, Y.; Zheng, H.; Reece, P.; Zhuiykov, S.; Sriram, S.; Bhaskaran, M.; et al. Elevated Temperature Anodized Nb2O5: A Photoanode Material with Exceptionally Large Photoconversion Efficiencies. ACS Nano 2012, 6, 4045–4053. [Google Scholar] [CrossRef] [PubMed]
- Zhang, H.; Wang, Y.; Yang, D.; Li, Y.; Liu, H.; Liu, P.; Wood, B.J.; Zhao, H. Directly Hydrothermal Growth of Single Crystal Nb3O7(OH) Nanorod Film for High Performance Dye-Sensitized Solar Cells. Adv. Mater. 2012, 24, 1598–1603. [Google Scholar] [CrossRef] [PubMed]
- Hagfeldt, A.; Boschloo, G.; Sun, L.; Kloo, L.; Pettersson, H. Dye-Sensitized Solar Cells. Chem. Rev. 2010, 110, 6595–6663. [Google Scholar] [CrossRef] [PubMed]
- Panetta, R.; Pettiti, I.; Latini, A.; Cavallo, C. Synthesis and Characterization of Nb2O5 Mesostructures with Tunable Morphology and Their Application in Dye-Sensitized Solar Cells. Mater. Chem. Phys. 2017, 202, 289–301. [Google Scholar] [CrossRef]
- Boschloo, G.; Hagfeldt, A. Characteristics of the Iodide/Triiodide Redox Mediator in Dye-Sensitized Solar Cells. Acc. Chem. Res. 2009, 11, 1819–1826. [Google Scholar] [CrossRef] [PubMed]
- Wang, Z.S.; Yamaguchi, T.; Sugihara, H.; Arakawa, H. Significant Efficiency Improvement of the Black Dye-Sensitized Solar Cell through Protonation of TiO2 Films. Langmuir 2005, 21, 4272–4276. [Google Scholar] [CrossRef] [PubMed]
- Cao, Y.; Bai, Y.; Yu, Q.; Cheng, Y.; Liu, S.; Shi, D.; Gao, F.; Wang, P. Dye-Sensitized Solar Cells with a High Absorptivity Ruthenium Sensitizer Featuring a 2-(Hexylthio)thiophene Conjugated Bipyridine. J. Phys. Chem. C 2009, 113, 6290–6297. [Google Scholar] [CrossRef]
- Kitamura, T.; Ikeda, M.; Shigaki, K.; Inoue, T.; Anderson, N.A.; Ai, X.; Lian, T.; Yanagida, S. Phenyl-Conjugated Oligoene Sensitizers for TiO2 Solar Cells. Chem. Mater. 2004, 16, 1806–1812. [Google Scholar] [CrossRef]
- Yum, J.; Holcombe, T.W.; Kim, Y.; Rakstys, K.; Moehl, T.; Teuscher, J.; Delcamp, J.H.; Nazeeruddin, M.K.; Grätzel, M. Blue-Coloured Highly Efficient Dye-Sensitized Solar Cells by Implementing the Diketopyrrolopyrrole Chromophore. Sci. Rep. 2013, 3, 2446. [Google Scholar] [CrossRef] [PubMed]
- Hsieh, C.; Lu, H.; Chiu, C.; Lee, C.; Chuang, S.; Mai, C.; Yen, W.; Hsu, S.; Diau, E.W.; Yeh, C. Synthesis and characterization of porphyrin sensitizers with various electron-donating substituents for highly efficient dye-sensitized solar cells. J. Mater. Chem. 2010, 20, 1127–1134. [Google Scholar] [CrossRef]
- Qin, C.; Numata, Y.; Zhang, S.; Yang, X.; Islam, A.; Zhang, K.; Chen, H.; Han, L. Novel Near-Infrared Squaraine Sensitizers for Stable and Efficient Dye-Sensitized Solar Cells. Adv. Funct. Mater. 2014, 24, 3059–3066. [Google Scholar] [CrossRef]
- Ito, S.; Murakami, T.N.; Comte, P.; Liska, P.; Grätzel, C.; Nazeeruddin, M.K.; Grätzel, M. Fabrication of thin film dye sensitized solar cells with solar to electric power conversion efficiency over 10%. Thin Solid Films 2008, 516, 4613–4619. [Google Scholar] [CrossRef]
- Nazeeruddin, M.K.; Splivallo, R.; Liska, P.; Comte, P.; Grätzel, M. A swift dye uptake procedure for dye sensitized solar cells. Chem. Commun. 2003, 1456–1457. [Google Scholar] [CrossRef]
- Chen, D.; Cao, L.; Huang, F.; Imperia, P.; Cheng, Y.; Caruso, R.A. Synthesis of Monodisperse Mesoporous Titania Beads with Controllable Diameter, High Surface Areas, and Variable Pore Diameters (14–23 nm). J. Am. Chem. Soc. 2010, 132, 4438–4444. [Google Scholar] [CrossRef] [PubMed]
- Hsu, C.; Lee, K.; Huang, J.T.; Lin, C.; Lee, C.; Wang, L.; Tsai, S.; Ho, K. EIS analysis on low temperature fabrication of TiO2 porous films for dye-sensitized solar cells. Electrochim. Acta 2008, 53, 7514–7522. [Google Scholar] [CrossRef]
- Barea, E.M.; Ortiz, J.; Payà, F.J.; Lazaro, F.F.; Santiago, F.F.; Santos, S.A.; Bisquert, J. Energetic factors governing injection, regeneration and recombination in dye solar cells with phthalocyanine sensitizers. Energy Environ. Sci. 2010, 3, 1985–1994. [Google Scholar] [CrossRef]
- Latini, A.; Cavallo, C.; Aldibaja, F.K.; Gozzi, D. Efficiency Improvement of DSSC Photoanode by Scandium Doping of Mesoporous Titania Beads. J. Phys. Chem. C 2013, 117, 25276–25289. [Google Scholar] [CrossRef]
- Latini, A.; Panetta, R.; Cavallo, C.; Gozzi, D.; Quaranta, S. A Comparison of the Performances of Different Mesoporous Titanias in Dye-Sensitized Solar Cells. J. Nanomater. 2015, 450405. [Google Scholar] [CrossRef]
- Cavallo, C.; Salleo, A.; Gozzi, D.; Di Pascasio, F.; Quaranta, S.; Panetta, R.; Latini, A. Solid Solutions of Rare Earth Cations in Mesoporous Anatase Beads and Their Performances in Dye-Sensitized Solar Cells. Sci. Rep. 2015, 5, 16785. [Google Scholar] [CrossRef] [PubMed]
- Latini, A.; Aldibaja, F.K.; Cavallo, C.; Gozzi, D. Benzonitrile based electrolytes for best operation of dye sensitized solar cells. J. Power Sources 2014, 269, 308–316. [Google Scholar] [CrossRef]
- Santiago, F.F.; Belmonte, G.G.; Serò, I.M.; Bisquert, J. Characterization of nanostructured hybrid and organic solar cells by impedance spectroscopy. Phys. Chem. Chem. Phys. 2011, 13, 9083–9118. [Google Scholar] [CrossRef] [PubMed]


| Dye | EO-O/V | EOX/V | EOX*/V | ∆Ginj*/kJ mol−1 | ∆Greg*/kJ mol−1 | η(TiO2) % | Ref. |
|---|---|---|---|---|---|---|---|
| N749 | 1.61 | 0.62 | −0.99 | 41.5 | 40.5 | 10.2 | [17] |
| C106 | 1.67 | 0.55 | −1.12 | 54.0 | 33.8 | 10.6 | [18] |
| DNF12 | 1.98 | 0.89 | −1.09 | 51.1 | 66.6 | 6.6 | [19] |
| DNF01 | 2.80 | 1.21 | −1.60 | 100 | 97.5 | 3.3 | [20] |
| DNF11 | 1.85 | 0.99 | −0.86 | 28.9 | 76.2 | 7.6 | [21] |
| DNF15 | 1.74 | 0.74 | −1.00 | 42.4 | 52.1 | 5.7 | [22] |
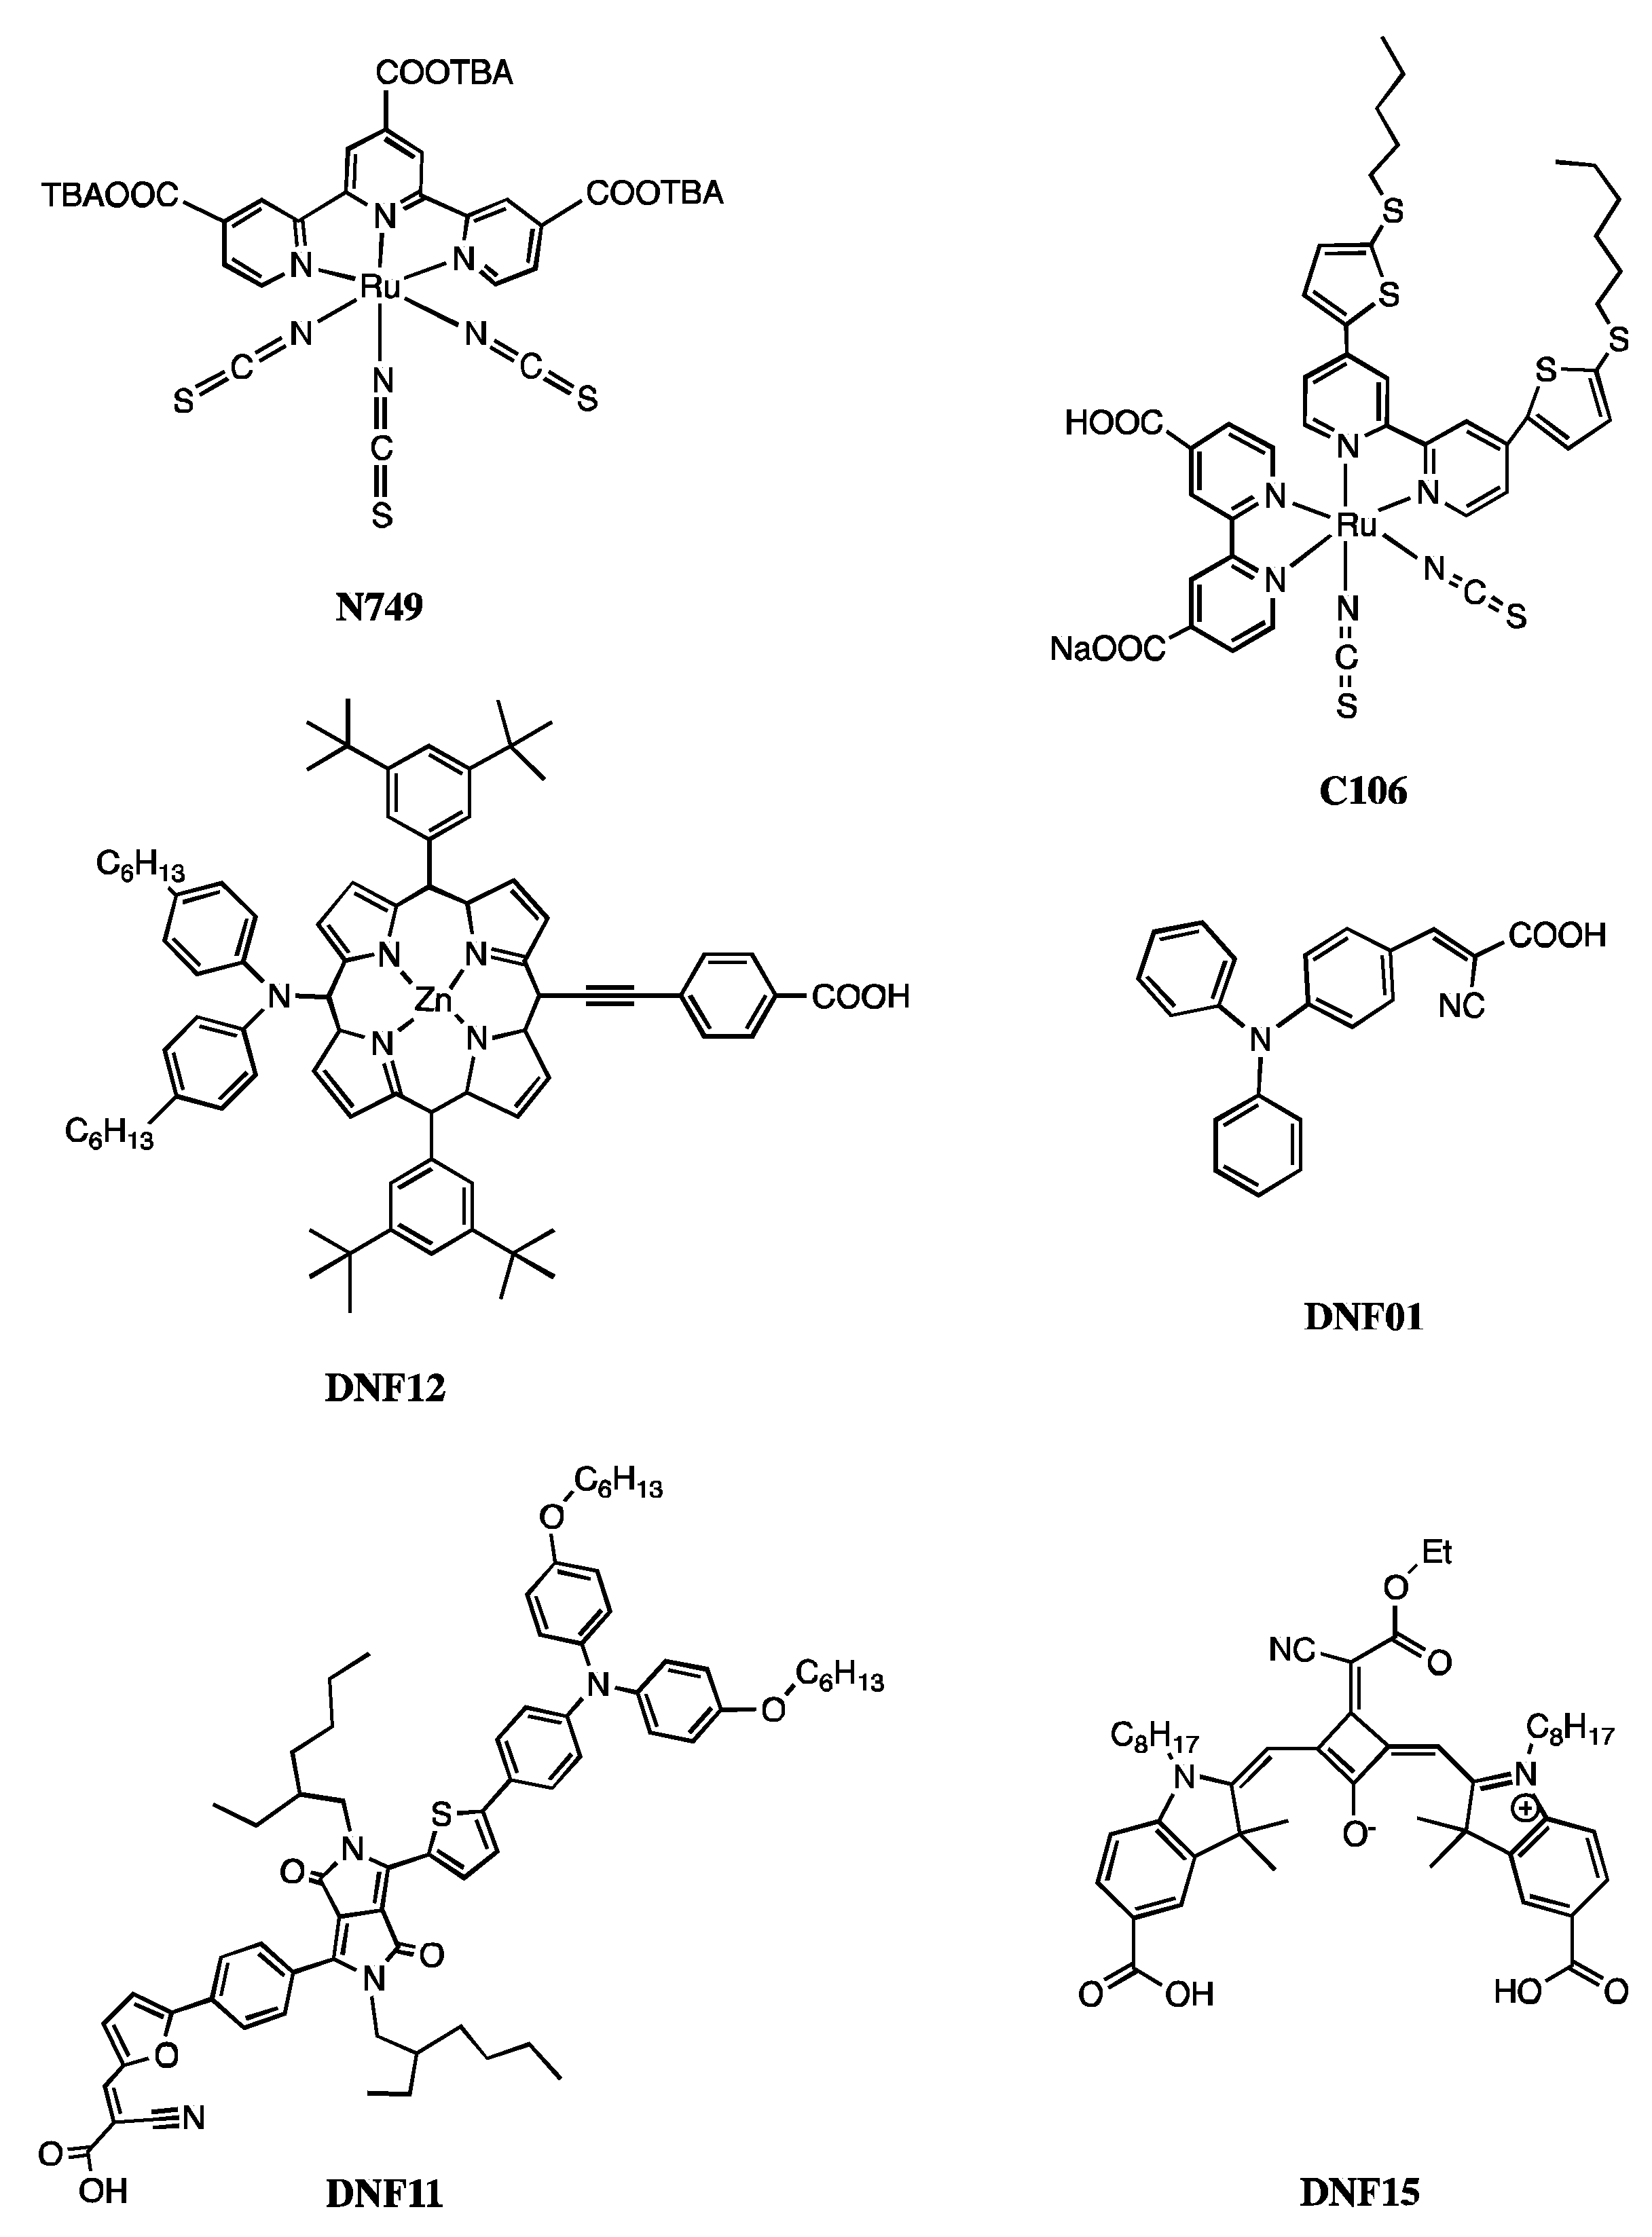
| Dye | IUPAC Name |
|---|---|
| N749 | Tris(N,N,N-tributyl-1-butanaminium)[[2,2″6′,2″-terpyridine]-4,4′,4″-tricarboxylato(3-)-N1,N1′,N1″]tris(thiocyanato-N)hydrogen ruthenate(4-) |
| C106 | Ruthenate(2-), [[2,2′-bipyridine]-4,4′-dicarboxylato(2-)-N1,N1′][4,4′-bis[5-(hexylthio)-2-thienyl]-2,2′-bipyridine-N1,N1′]bis(thiocyanato-N)-, cis-Bis(isothiocyanato)(2,2′-bipyridyl-4,4′-dicarboxylato)(4,4′-bis(5-(hexylthio)thiophen-2-yl)-2,2′-bipyridyl)ruthenium(II) |
| DNF12 | Zinc(II) 5,15-Bis(3,5-di-tert-butylphenyl)-10-(bis(4-hexylphenyl)amino)-20-(4-carboxyphenylethynyl)porphyrin |
| DNF01 | 4-(diphenylamino)phenylcyanoacrylic acid |
| DNF11 | (E)-3-(5-(4-(4-(5-(4-(bis(4-(hexyloxy)phenyl)amino)phenyl)thiophen-2-yl)-2,5-bis(2-ethylhexyl)-3,6-dioxo-2,3,5,6-tetrahydropyrrolo[3,4-c]pyrrol-1-yl)phenyl)furan-2-yl)-2-cyanoacrylic acid |
| DNF15 | (3Z,4Z)-4-((5-carboxy-3,3-dimethyl-1-octyl-3H-indol-1-ium-2-yl)methylene)-2-(((E)-5-carboxy-3,3-dimethyl-1-octylindolin-2-ylidene)methyl)-3-(1-cyano-2-ethoxy-2-oxoethylidene)cyclobut-1-en-1-olate |
| Dye | VOC/V | JS/mA cm−2 | η/% | FF | Rs/Ω | J0/nA cm-2 | m |
|---|---|---|---|---|---|---|---|
| N749 | 0.5911 ± 0.0001 | 0.9 ± 0.1 | 0.36 ± 0.03 | 0.7 ± 0.1 | 660 ± 100 | 8 ± 1 | 2.06 ±0.01 |
| N749 hp | 0.6008 ± 0.0001 | 1.8 ± 0.2 | 0.7 ± 0.1 | 0.7 ± 0.1 | 370 ± 100 | 1 ± 0.2 | 1.85 ± 0.01 |
| C106 | 0.6844 ± 0.0001 | 9.4 ± 0.7 | 4.4 ± 0.3 | 0.7 ± 0.1 | 110 ± 40 | 11 ± 2 | 2.15 ± 0.01 |
| DNF12 | 0.5792 ± 0.0001 | 0.8 ± 0.1 | 0.26 ± 0.02 | 0.6 ± 0.1 | 730 ± 110 | 14 ± 1 | 2.16 ± 0.01 |
| DNF12 hp | 0.5796 ± 0.0001 | 3.1 ± 0.2 | 1.2 ± 0.1 | 0.7 ± 0.1 | 240 ± 60 | 7 ± 1 | 1.97 ± 0.01 |
| DNF01 | 0.5717 ± 0.0001 | 0.5 ± 0.1 | 0.18 ± 0.02 | 0.6 ± 0.1 | 1160 ± 100 | 41 ± 12 | 2.48 ± 0.01 |
| DNF01 hp | 0.6106 ± 0.0001 | 1.6 ± 0.1 | 0.50 ± 0.04 | 0.5 ± 0.1 | 940 ± 120 | 20 ± 2 | 2.388 ± 0.003 |
| DNF11 | 0.6444 ± 0.0001 | 4.1 ± 0.4 | 1.9 ± 0.2 | 0.7 ± 0.1 | 190 ± 50 | 30 ± 6 | 2.36 ± 0.01 |
| DNF11 hp | 0.6444 ± 0.0001 | 2.3 ± 0.2 | 1.1 ± 0.1 | 0.8 ± 0.1 | 370 ± 100 | 1.7 ± 0.2 | 1.88 ± 0.01 |
| DNF15 | 0.5250 ± 0.0001 | 0.9 ± 0.1 | 0.31 ± 0.02 | 0.6 ± 0.1 | 630 ± 110 | 17 ± 3 | 2.00 ± 0.01 |
| DNF15 hp | 0.5289 ± 0.0001 | 1.1 ± 0.1 | 0.36 ± 0.06 | 0.6 ± 0.1 | 520 ± 130 | 3.1 ± 0.3 | 1.77 ± 0.01 |
| Dye | |
|---|---|
| N749 | −44 ± 22 |
| DNF12 | −67 ± 20 |
| DNF01 | −19 ± 14 |
| DNF11 | 95 ± 45 |
| DNF15 | −17 ± 11 |
| Dye | Rtr /Ω | Rrec/kΩ | Cµ/F | Le/µm | Charge Collection Efficiency |
|---|---|---|---|---|---|
| N749 | 270 ± 30 | 4.6 ± 0.4 | (1 ± 1) × 10−7 | 40 ± 10 | 0.9 ± 0.1 |
| N749 hp | 210 ± 10 | 6.3 ± 0.6 | (9 ± 1) × 10−6 | 55 ± 10 | 1.0 ± 0.1 |
| C106 | 440 ± 50 | 1.3 ± 0.1 | (4.5 ± 0.4) × 10−5 | 17 ±1 | 0.8 ± 0.1 |
| DNF12 | 200 ± 20 | 4.8 ± 0.5 | (1.0 ± 0.1) × 10−5 | 50 ± 20 | 1.0 ± 0.1 |
| DNF12 hp | 190 ± 20 | 2.9 ± 0.3 | (1.1 ± 0.1) × 10−5 | 40 ± 10 | 0.9 ± 0.1 |
| DNF01 | 130 ± 20 | 6.0 ± 0.6 | (1.3 ± 0.1) × 10−5 | 70 ± 10 | 1.0 ± 0.1 |
| DNF01 hp | 110 ± 10 | 2.0 ± 0.2 | (1.2 ± 0.1) × 10−5 | 40 ± 20 | 1.0 ± 0.1 |
| DNF11 | 180 ± 20 | 2.5 ± 0.3 | (1.9 ± 0.2) × 10−5 | 40 ± 10 | 0.9 ± 0.1 |
| DNF11 hp | 310 ± 30 | 5.0 ± 0.5 | (1.5 ± 0.2) × 10−5 | 40 ± 10 | 0.9 ± 0.1 |
| DNF15 | 140 ± 20 | 5.2 ± 0.5 | (1.4 ± 0.1) × 10−5 | 60 ± 10 | 1.0 ± 0.1 |
| DNF15 hp | 230 ± 30 | 17 ± 2 | (5 ± 1) × 10−6 | 90 ± 30 | 1.0 ± 0.1 |
| Dye | Dye-Coverage Variation (%) |
|---|---|
| N749 | 107 |
| DNF12 | 621 |
| DNF01 | 115 |
| DNF11 | −77 |
| DNF15 | 60 |
© 2018 by the authors. Licensee MDPI, Basel, Switzerland. This article is an open access article distributed under the terms and conditions of the Creative Commons Attribution (CC BY) license (http://creativecommons.org/licenses/by/4.0/).
Share and Cite
Latini, A.; Panetta, R. Test of Different Sensitizing Dyes in Dye-Sensitized Solar Cells Based on Nb2O5 Photoanodes. Energies 2018, 11, 975. https://doi.org/10.3390/en11040975
Latini A, Panetta R. Test of Different Sensitizing Dyes in Dye-Sensitized Solar Cells Based on Nb2O5 Photoanodes. Energies. 2018; 11(4):975. https://doi.org/10.3390/en11040975
Chicago/Turabian StyleLatini, Alessandro, and Riccardo Panetta. 2018. "Test of Different Sensitizing Dyes in Dye-Sensitized Solar Cells Based on Nb2O5 Photoanodes" Energies 11, no. 4: 975. https://doi.org/10.3390/en11040975
APA StyleLatini, A., & Panetta, R. (2018). Test of Different Sensitizing Dyes in Dye-Sensitized Solar Cells Based on Nb2O5 Photoanodes. Energies, 11(4), 975. https://doi.org/10.3390/en11040975