1. Introduction
1.1. Urgency
Climate change, depletion of fossil fuels, and scarcity of resources demand a sustainable transition of the world as we know it. Cities are increasingly dependent on energy supplies from politically volatile delta areas. Their heat-accumulating mass and high density are inherently vulnerable to excessive heat. The call for resilience is clearly evident on many fronts and is now without any need for further justification. The European Union underlines this, as can be seen from its sustainability programmes and targets [
1,
2].
1.2. City-zen EU
City-zen is an FP7 project of the EU [
3], in which 34 public, private and academic partners collaborate to develop a method, tools and solutions for urban energy transition, to initiate and monitor demonstrator projects and to disseminate results throughout Europe. In one of the nine City-zen work packages, academic partners collaborate to develop an urban energy transition methodology, apply to the two partner cities, Amsterdam and Grenoble, and help them to develop a Roadmap towards the year 2050. In another work package, Roadshows are organised.
1.3. City-zen Roadshows
As part of the dissemination work package of City-zen, so-called Roadshows are organised. The aims of the City-zen Roadshow are to engage city stakeholders with innovative technologies and their applications, and to facilitate the development of a sustainable city agenda. These aims are met through multidisciplinary working groups and co-creative interactive sessions. The City-zen Roadshows take place in cities that do not form part of the project but that have expressed their desire to become carbon neutral in due time. For the City-zen project they also function to introduce, test and enhance the urban energy transition methodology presented.
The Roadshow is novel, in that its aim is not that of a typical urban design project usually undertaken by city governance bodies and their agencies. The Roadshow is intended as a challenge, one that inspires cities to meet environmental issues head on. It achieves this by using a design methodology to future-cast a possible solution for a neighbourhood that is not only achievable in terms of a time-based intervention and process but is also carbon accounted in a way that is didactic and accessible for a range of stakeholders.
1.4. Effectiveness of the Roadshow
Market failures usually prevent environmental policies or measures from being effective. Planning considerations are therefore critical in correctly implementing policies, as discussed by Deal et al. [
4], Deal & Pan [
5] and even earlier by Klosterman in 1985 [
6]. In order to make plans or policies viable, understanding how planning information should be used is essential.
Obviously, spending one week in a neighbourhood, with a small team of academic designers and carbon-accountants, cannot be seen as a sustained intervention, nor can it be judged as community engagement in the normal sense, but the Roadshow is not intended to replace these sustained interventions. More focused and long-term engagement is necessary to make real change (see [
4]). However, it does offer a new way of seeing the challenges of urban sustainability as issues of the stakeholders’ imagination, rather than just a matter of technical know-how. Inspiring stakeholders’ imagination as to what is possible and introducing a simple process-based methodology could unlock stasis in a socially-orientated context such as a West-European city.
2. Methodology
2.1. The Urban Energy Transition Roadmap
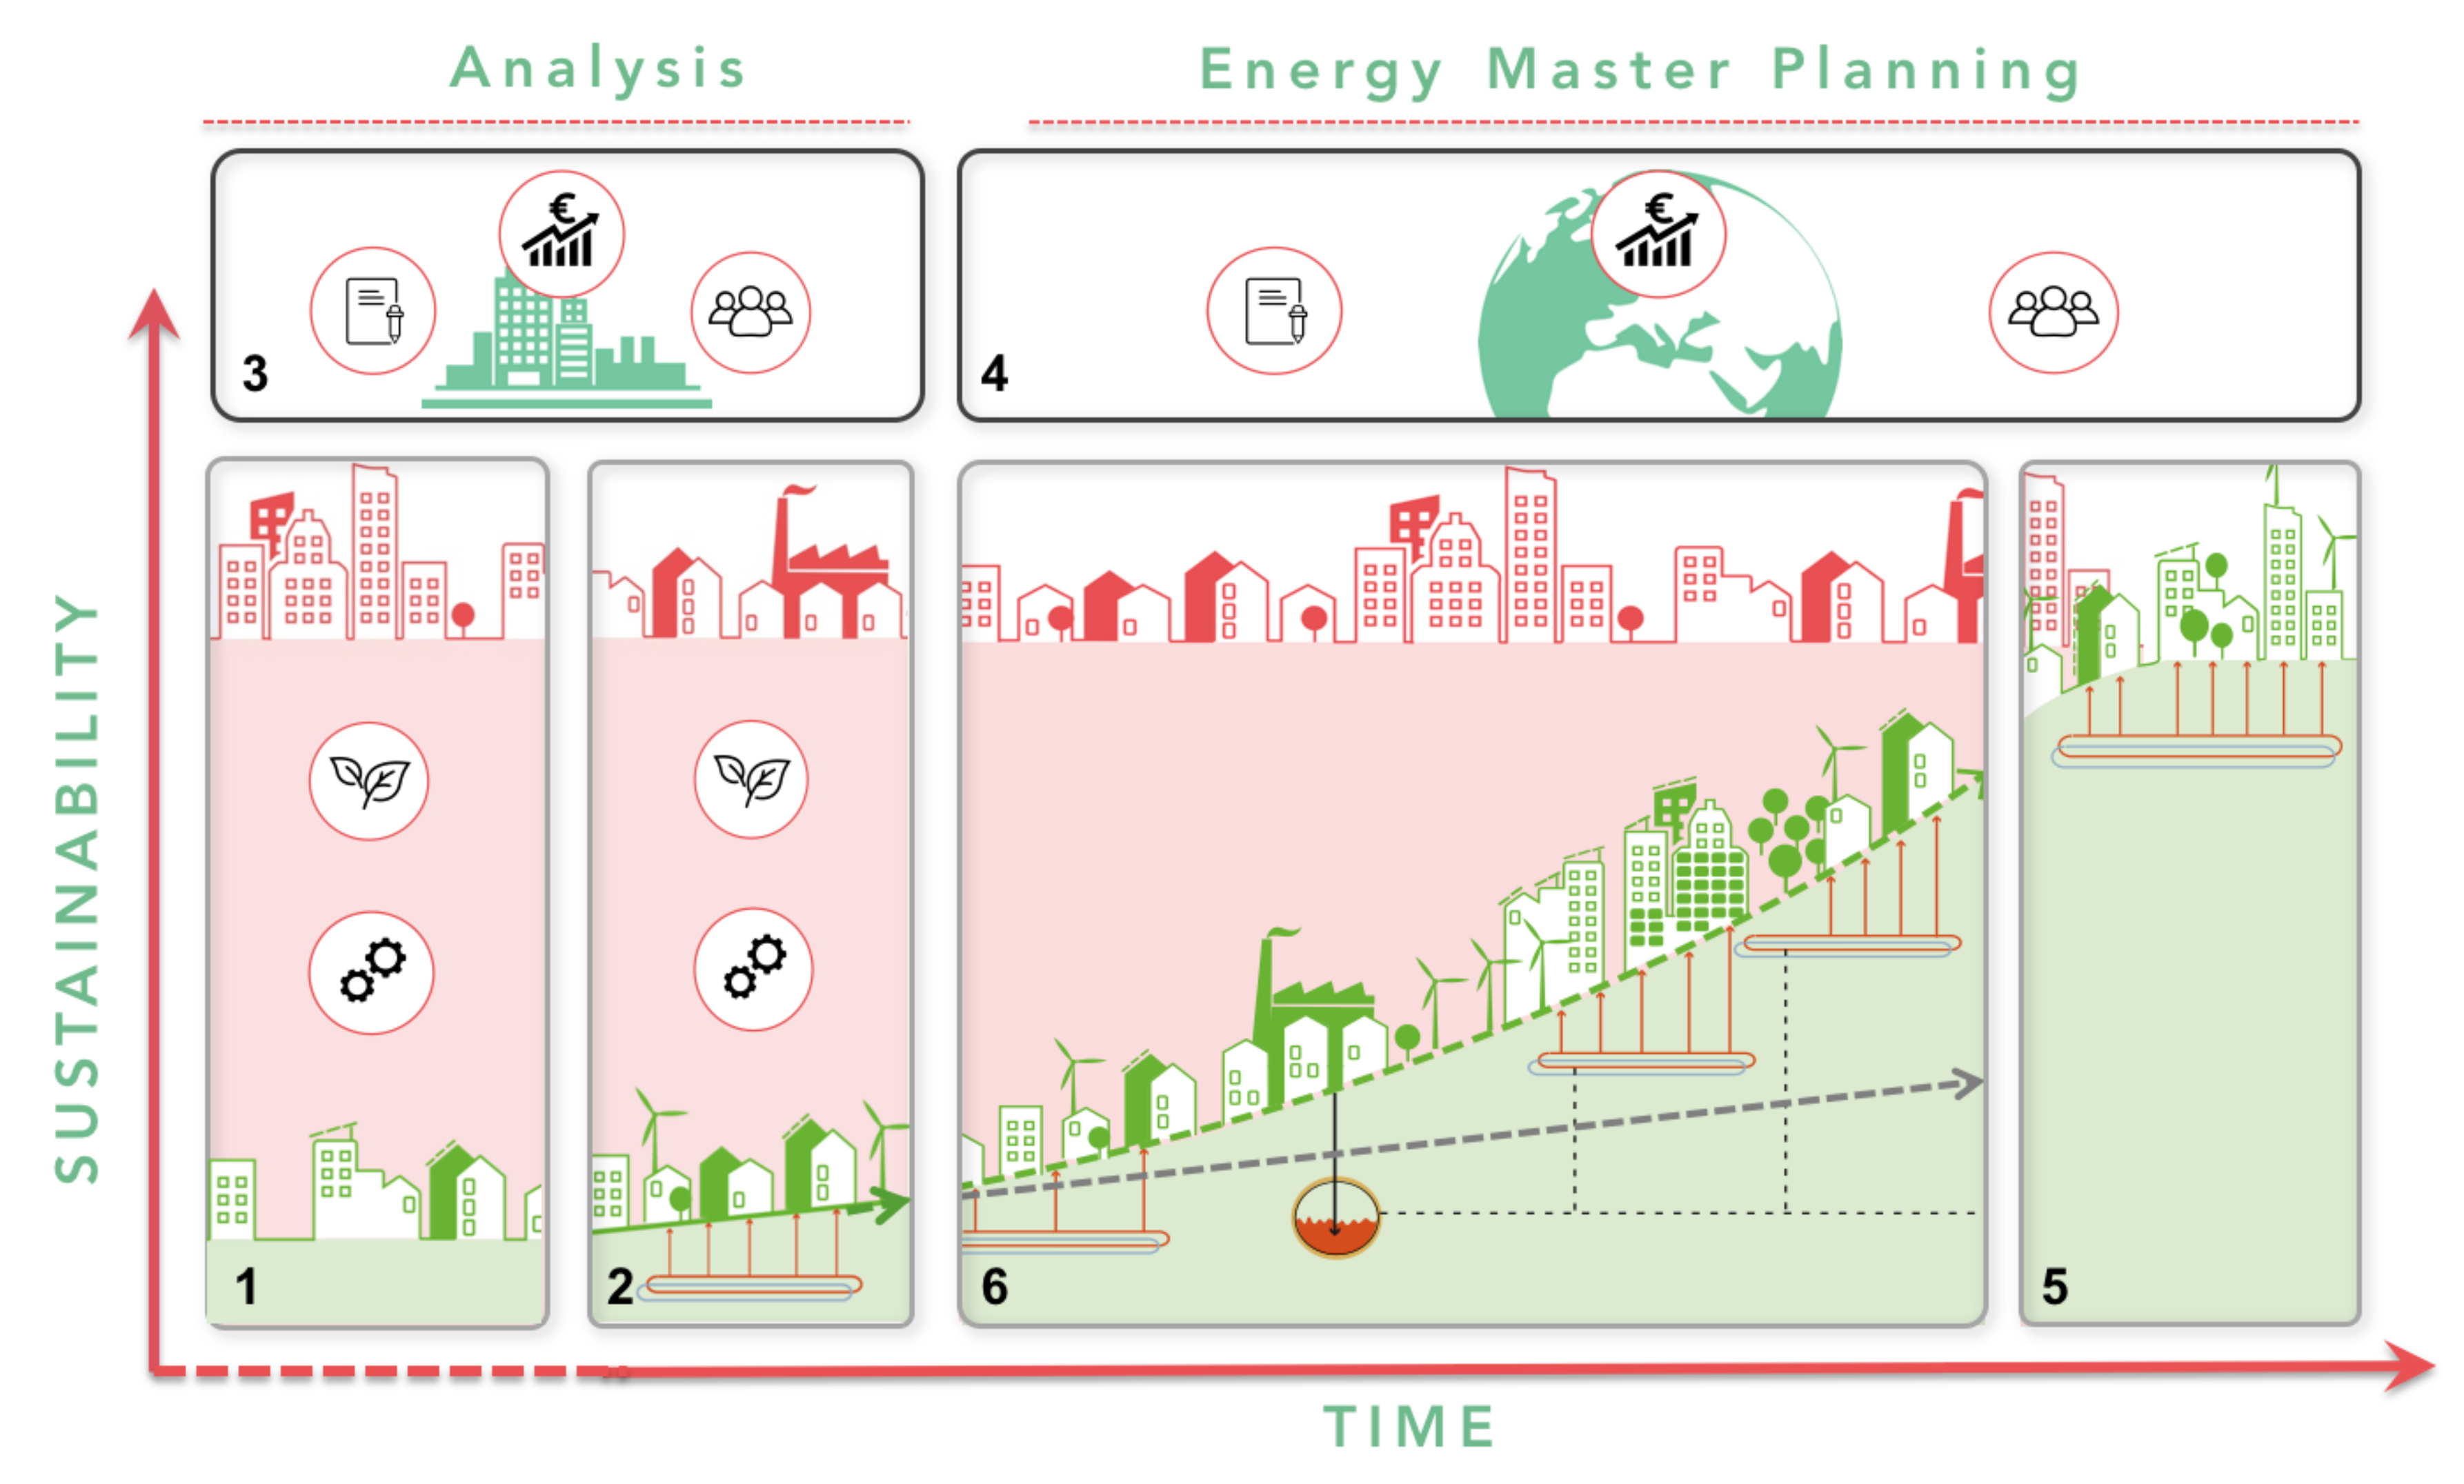
Put in a time-frame and within specific non-technical boundary conditions,
Figure 1 illustrates the process for moving towards the desired future sustainable state of a city, as applied in the City-zen project. Starting from the analysis of the (non-sustainable) situation at present, the urban development already planned (2) and the stakeholders involved (3), the desires of these stakeholders together with scenarios for the future (4) define a future (sustainable) vision of the city, which is then translated back into interventions on the way towards this desired future state (6), the urban energy transition roadmap. This methodology in fact, is a more elaborate process of backcasting, as presented by Robinson [
7] and Dreborg [
8], and as proposed by Zhivov et al. [
9] for communities and campuses.
For the green curved route in
Figure 2, acceleration is needed along a transitional S-curve; otherwise, business-as-usual will ensure that very little progress is made, that is, the energy transition and future carbon emissions will remain on the grey line.
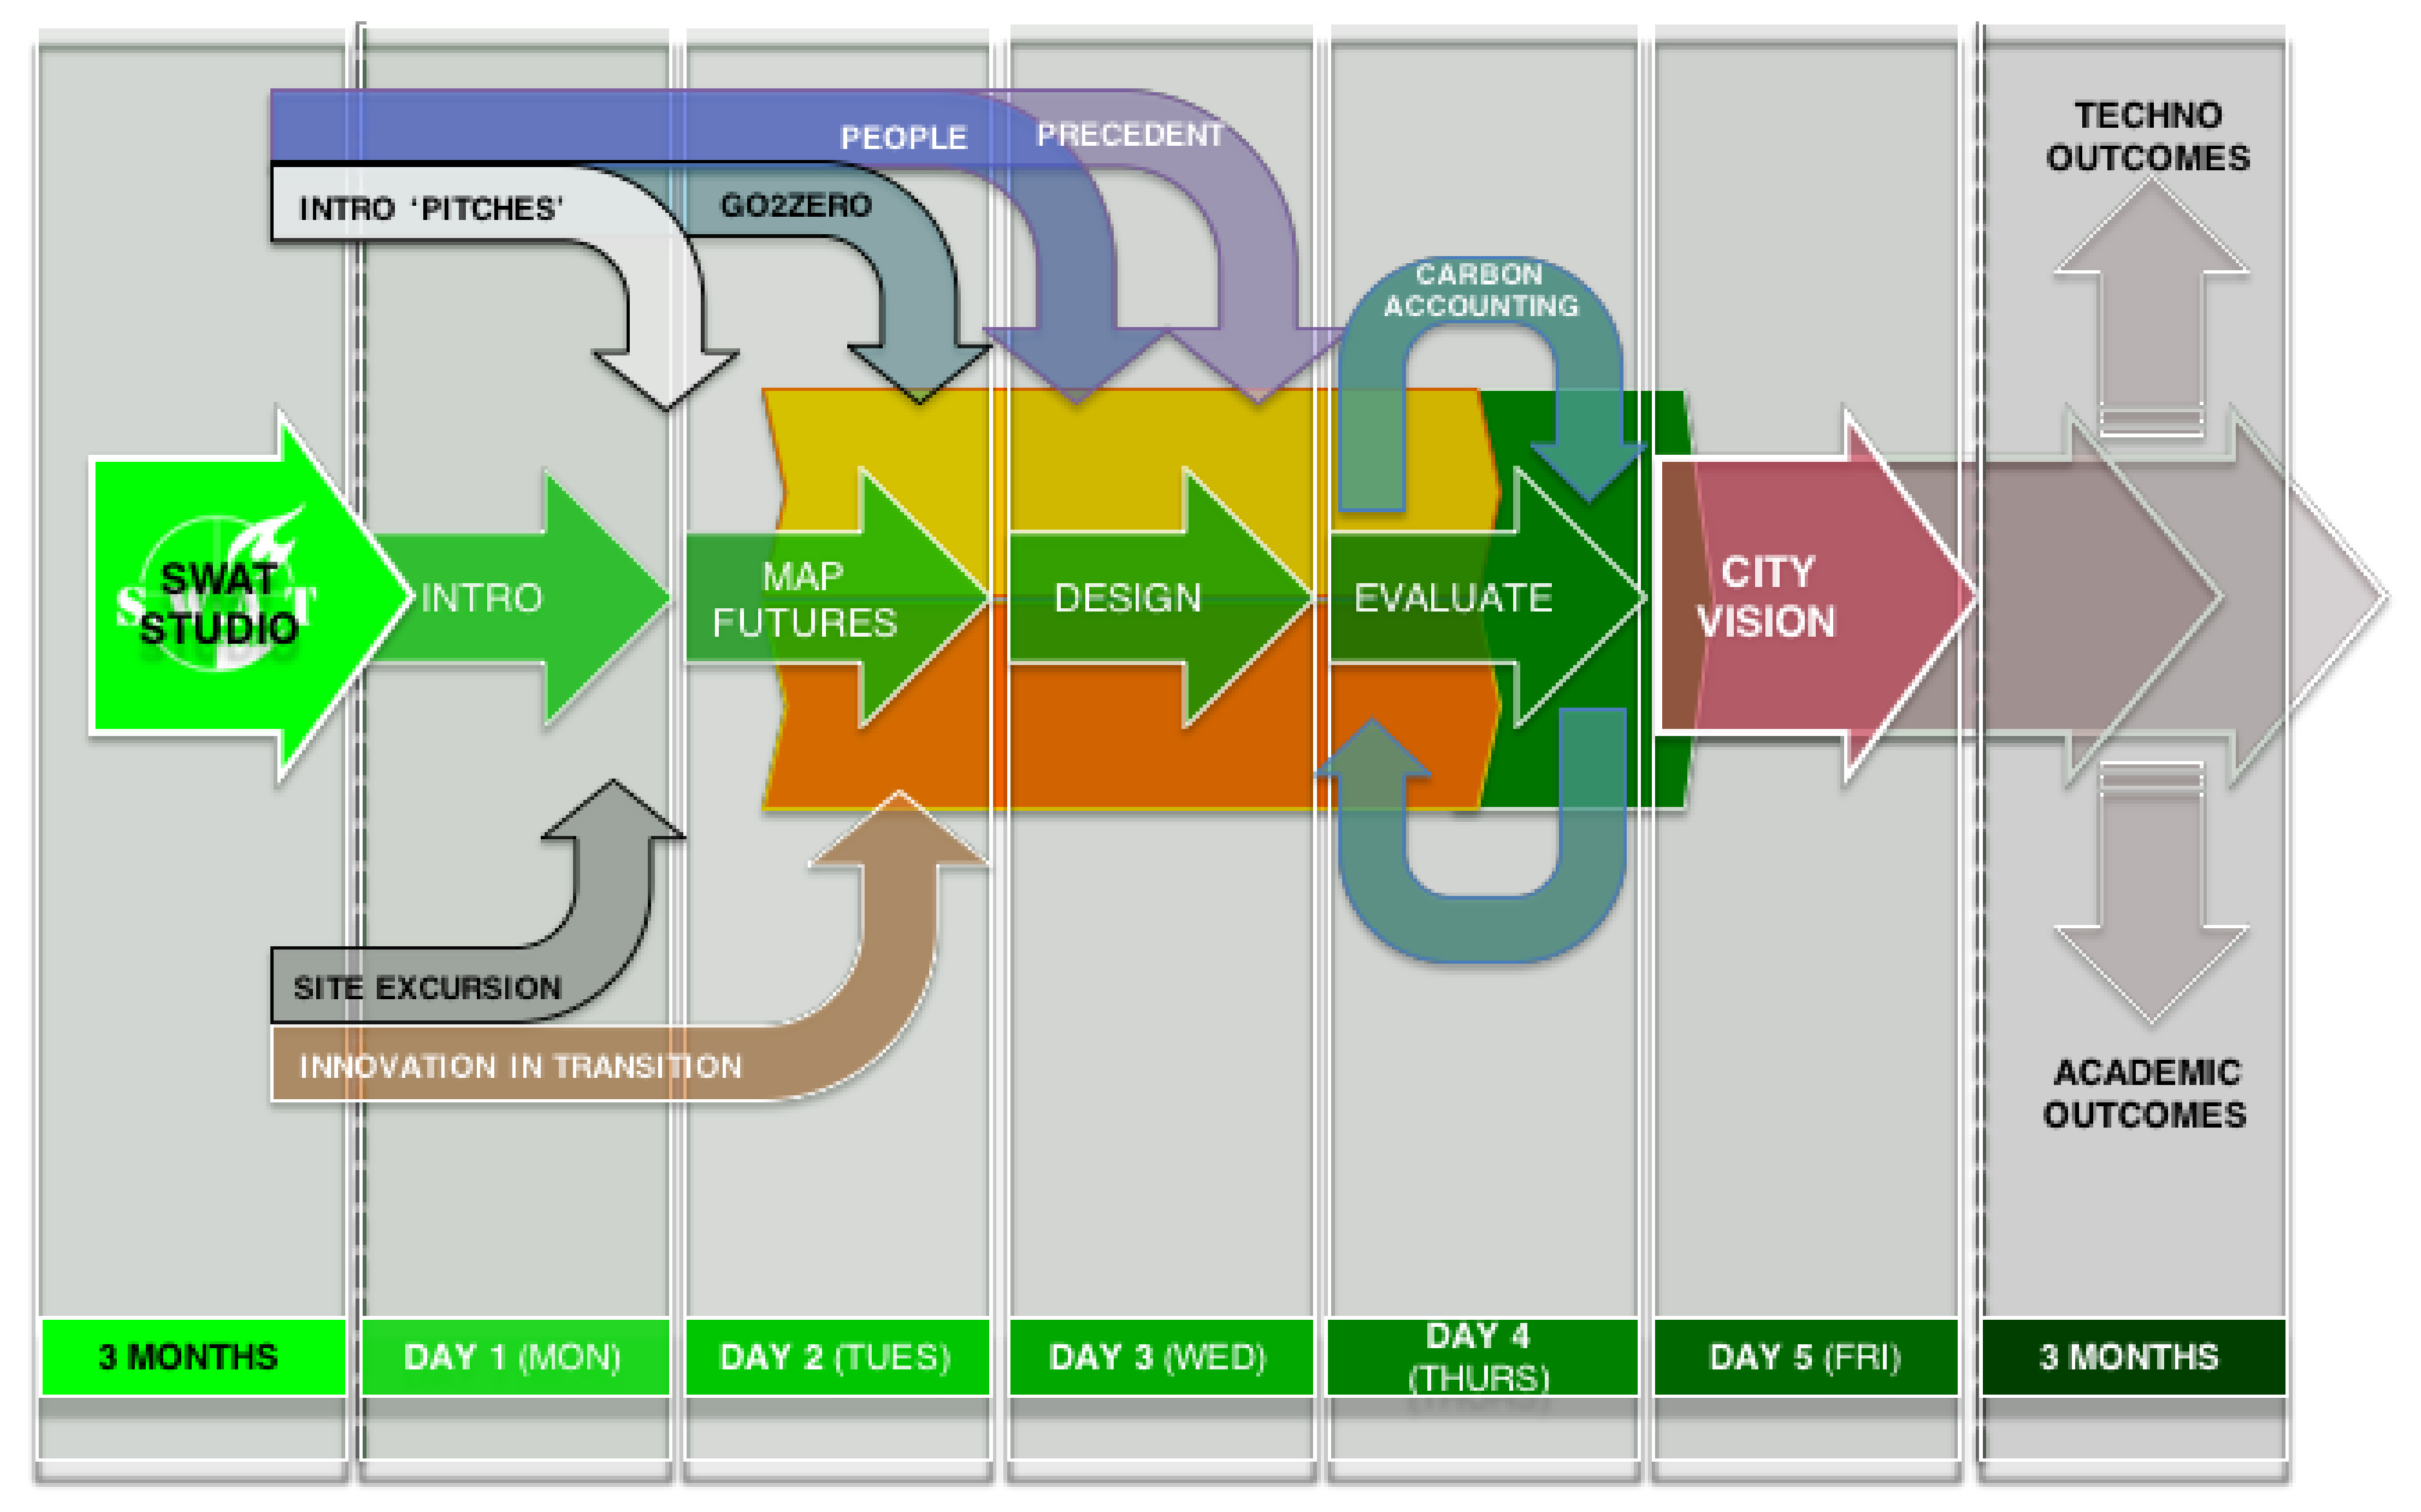
2.2. The City-zen Roadshow Methodology
The City-zen Roadshow methodology is a thoroughly structured timeline of events designed to create meaningful partnerships, knowledge sharing and rigorously prepared Sustainable City Vision (
Figure 2).
The City-zen Roadshow is preceded by the SWAT Studio, an explorative two-week collaborative workshop with students from TU Delft, which typically occurs two months in advance of the specialist five-day Roadshow workshop. The outputs of the SWAT Studio consist of group proposals for sustainable interventions in the city, which the professionals of City-zen develop further during the Roadshow itself.
The Roadshow itself is an intensive and impactful co-creative 5-day model that has evolved over a -year period of live onsite implementation (see
Figure 3). It strategically places Pecha Kucha pitches, and organizes interactive field visits, stakeholder interviews, Energy Potential Mapping [
10], design workshops, serious gaming, mini-masterclasses (social and technical), seminars and interactive Carbon Accounting. The five days culminate with a Sustainable City Vision that shows how the city can achieve carbon neutrality through the implementation of variously scaled strategic and design interventions and measure.
2.3. Roadshow Week Activities
The largest part of the work of the Roadshow is done in interactive sessions between the researchers and stakeholders, creative work informed by hard data from the city and validated by energy and carbon calculations. The Roadshow team analyses the use of energy and emission of carbon dioxide, in total numbers and per household. In one specific workshop, the explanation of carbon usage and its measurement is described through the individual daily experiences of each of the attending stakeholders. This is an exciting component that has evolved incrementally with each Roadshow. The approach builds confidence in the math by supporting it with a visual carbon narrative and graphics. Once an understanding of individual carbon usage is gained it is up-scaled to include the street, neighbourhood, district, city and depending on location, an entire island. Carbon data is coupled to the forest area that needs to be planted to compensate for the emissions, but the eventual goal is to avoid this principle of compensation. The designs, calculations and proposed implementation eventually leads to a city vision on different scales—at city, neighbourhood and building levels—which is presented to the decision makers of the city on the final morning of the Roadshow.
2.4. The Dubrovnik Roadshow
Under the initiative of the City of Dubrovnik Development Agency (DURA) and by a mandate from the Mayor, the City was host to both the SWAT Studio and the specialist City-zen ‘Dubrovnik’ Roadshow, in fall 2016.
This paper presents the process and outcomes of that Roadshow, which are made specific by the carbon emission assessment of proposed interventions. The authors do not intend to discuss urban planning theory or to put the City-zen Roadshow in perspective using different urban planning methods. Although extensive work was done on sustainable urban planning in the overarching project, the focus of this paper is on strategies and measures of carbon emission reductions within the urban context of Dubrovnik.
3. Introducing Dubrovnik and Gruž
Before and during the Roadshow, the characteristics of Dubrovnik, the district of Gruž in particular, were systematically analysed, leading to in-depth understanding of the current problems and potentials of the city.
3.1. Dubrovnik
The city of Dubrovnik is best known for its historical UNESCO protected old town centre overlooking the Adriatic Sea—home-base for the imaginary city called King’s Landing in the popular TV series Game of Thrones. However, the reason Dubrovnik was selected to host a Roadshow was Gruž, the port town of Dubrovnik, which lies to the north-west of the city.
DURA (the city’s development agency), EE Info (Energy Efficiency office) and the University of Zagreb, as well as other local stakeholders collaborated closely with the Roadshow leader to prepare both the SWAT Studio and the City-zen Gruž Roadshow. The DURA offices on 15 Branitelja Dubrovnika was the studio base of the Roadshow during its co-creative efforts to develop a Sustainable City Vision for Dubrovnik.
3.2. Problems
A comprehensive analysis was undertaken to document the environmental challenges of Gruž. According to the Dubrovnik Tourist Board, in 2016 more than 1 million tourists arrived in the city with approximately 3.7 million overnight stays [
11]. This means that on average ten thousand visitors descend into the city daily, creating a considerable impact on the daily routines of local life. During the height of the tourist summertime season this number is manifold. The majority of tourists arrive by cruise ship, which are moored in the Gruž harbour, and then transported by a continuous fleet of coaches to the gate of the old town.
Considering this cruise ship activity and the projected flow of tourists, a 2012 traffic study of Dubrovnik revealed the following problems: a lack of adequate parking space, bicycle transportation is difficult, the public transportation system is in need of improvement, and there is a pedestrian traffic problem in the city centre during the tourist season. As Peručić and Puh [
12] found, the citizens of Dubrovnik experience many problems related to cruise ship tourism. This particularly holds true for Gruž, the district adjacent to Dubrovnik’s port.
3.3. Cruise Ships
The environmental impact of cruise ships, essentially floating cities of 2000–2500 inhabitants, is enormous. The scope of the Roadshow and this paper cannot present a full study of the impact of cruise ship tourism, but we want to mention a few figures. Per week, 600–1000 m3 of sewage is discharged into the sea. This is an environmental problem at sea, but the way ports accept mooring ships plays an important role in the sustainable transition of cruise ships, as will be discussed later. The annual carbon emission of one ship is comparable to the CO2 absorbed by 11,900 hectares of forestland, approximately ten times larger than a town the same size. On a daily basis, a cruise ship expels the same amount of sulphur dioxide fumes as 13.1 million cars, which is generated from the most polluting and harmful form of diesel. Part of this emission is released in harbours such as Gruž.
3.4. Gruž
Gruž suffers severely from the fumes and soot emitted by the cruise ships. Gruž is a relatively poor community with minimal public transport and mobility partly due to the topography; buildings are also generally energy-inefficient. All these factors are exacerbated by the fact that the area has a high proportion of elderly people.
The economically beneficial, but equally environmentally adverse relationship between the cruise ships and the district was a major driver during the development of the City Vision for Dubrovnik/Gruž.
4. Analysis of Carbon Emission
4.1. Carbon Emission Accountancy
The carbon accounting developed here estimates the greenhouse gas emission in a city or neighbourhood. The emission is given in t CO
2-eq corresponding to the quantity of the main greenhouse gases released into the atmosphere i.e., CO
2, CH
4 and N
2O, multiplied by their Global Warming Potentials (GWP), see
Table 1. The main references for this procedure are the Global Protocol for Community-Scale Greenhouse Gas (GHG) Emission Inventories [
13], other carbon assessments (such as [
14]), some previous experience and case studies. In particular, the monitoring of GHG emissions and impact mitigation scenarios has been demonstrated to be a powerful tool to address choices and hinder global warming and climate change at the regional [
15] and urban level [
16] or for specific sectors such as urban waste [
17].
4.2. Carbon Emissions in Gruž
A simplified but reliable carbon assessment was carried out for an average Dubrovnik-Gruž household, through the analysis of the domestic energy demand, mobility, waste management and water management. Statistical data (2015) was provided by the Municipality of Dubrovnik during the co-working sessions of the Roadshow. The emission factors used for the assessment refer to the IPCC standards [
18], as reported in
Table 1, except for the site-specific emission factor of electricity, which was estimated and based on the Croatian grid mix (
Table 2).
Table 3 shows results for the single household and neighbourhood (almost 8000 inhabitants). Outcomes show that the average emission per household in Dubrovnik (on average 2.7 people on 100 m
2) is around 5.70 tonne CO
2eq/a mostly depending on the use of electricity for lighting, appliances and cooling, and methane for heating, water heating and cooking (energy demand: 47%). Other sources of emission are the use of private cars (mobility: 20%), the collection and treatment of domestic waste, considering that most of it is landfilled (waste management: 30%) and water withdrawal from the aqueduct (water management: 3%).
4.3. Forestland Sequestration of Carbon
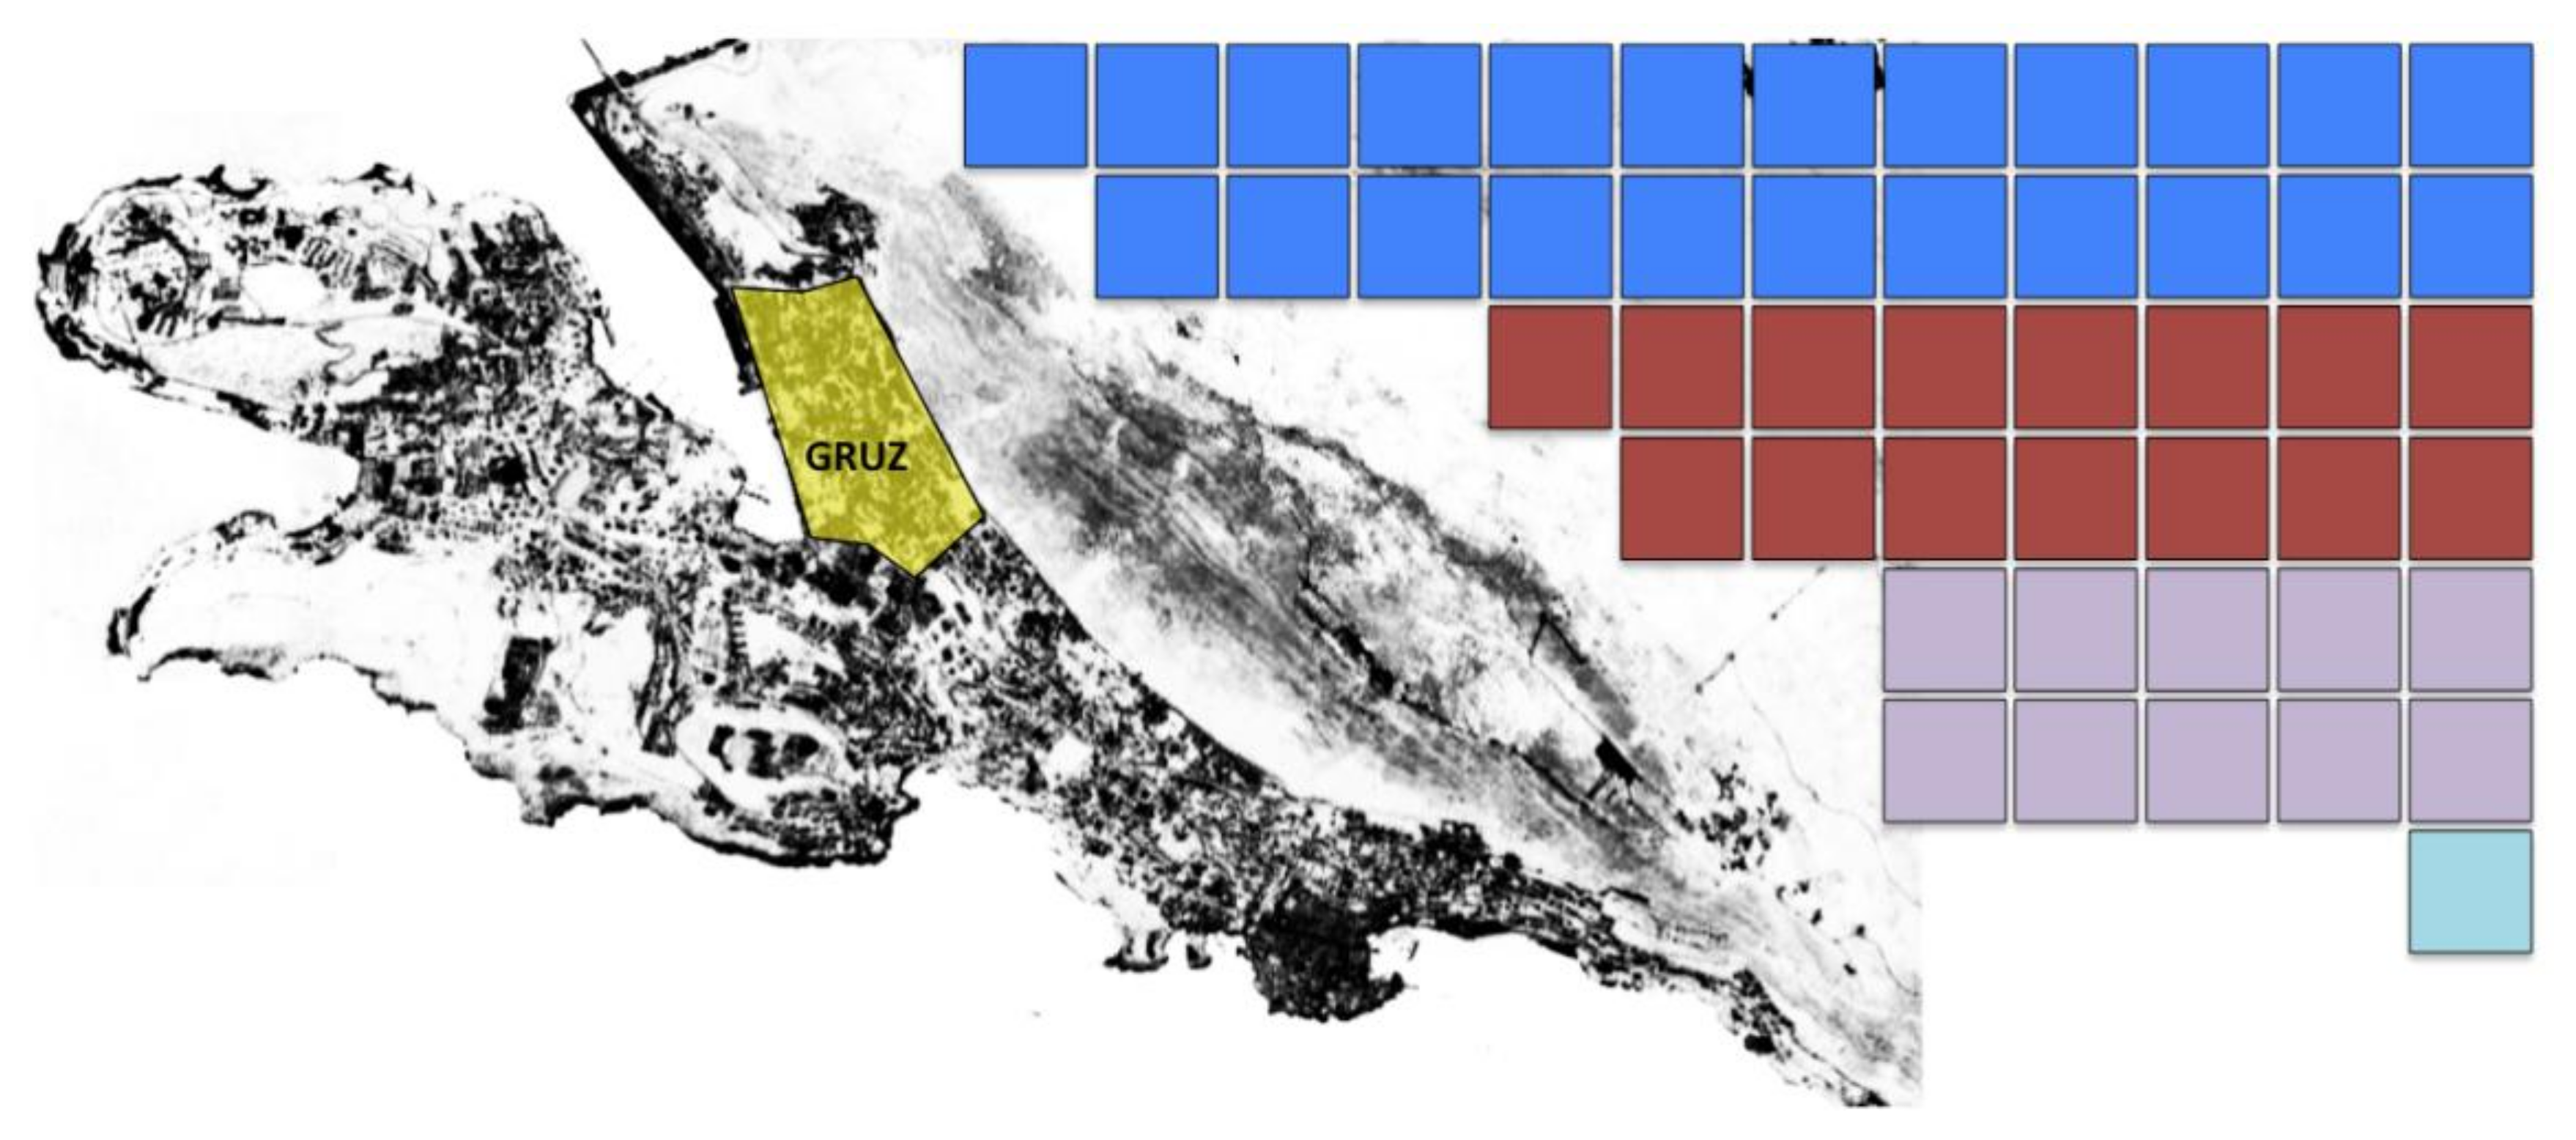
As calculated according to the carbon accounting method described above, from the single household profile (average of 80 m
2) up to the neighbourhood scale (2900 households), the greenhouse gas emission of the neighbourhood corresponds to more than 16,000 tonne CO
2eq. Compensation for this amount of carbon emission would require a hypothetical forestland of about 1200 hectares, as illustrated by
Figure 3, using the same spatial scale of the neighbourhood. This carbon sequestration area has been divided by emission sources i.e., energy demand (blue), mobility (purple), waste (brown) and water management (cyan). The graphical representation is used to communicate and visualise the state of the art to the wider public, which was the initial challenge to be faced in planning new strategies. The primary goal was to propose a coherent and clear plan for a carbon-neutral Gruž, as well as to develop a full energy transition strategy for Dubrovnik.
The carbon footprint per family corresponds to 0.42 hectare of forestland (considering an average carbon uptake of 1.35 kg CO2eq/m2 of forest), which is equivalent to the size of football pitch in area. The area of football pitch is familiar to many and is independent of cultural or demographical background.
5. Analysis of Energy Potential
5.1. The Local Climate of Dubrovnik
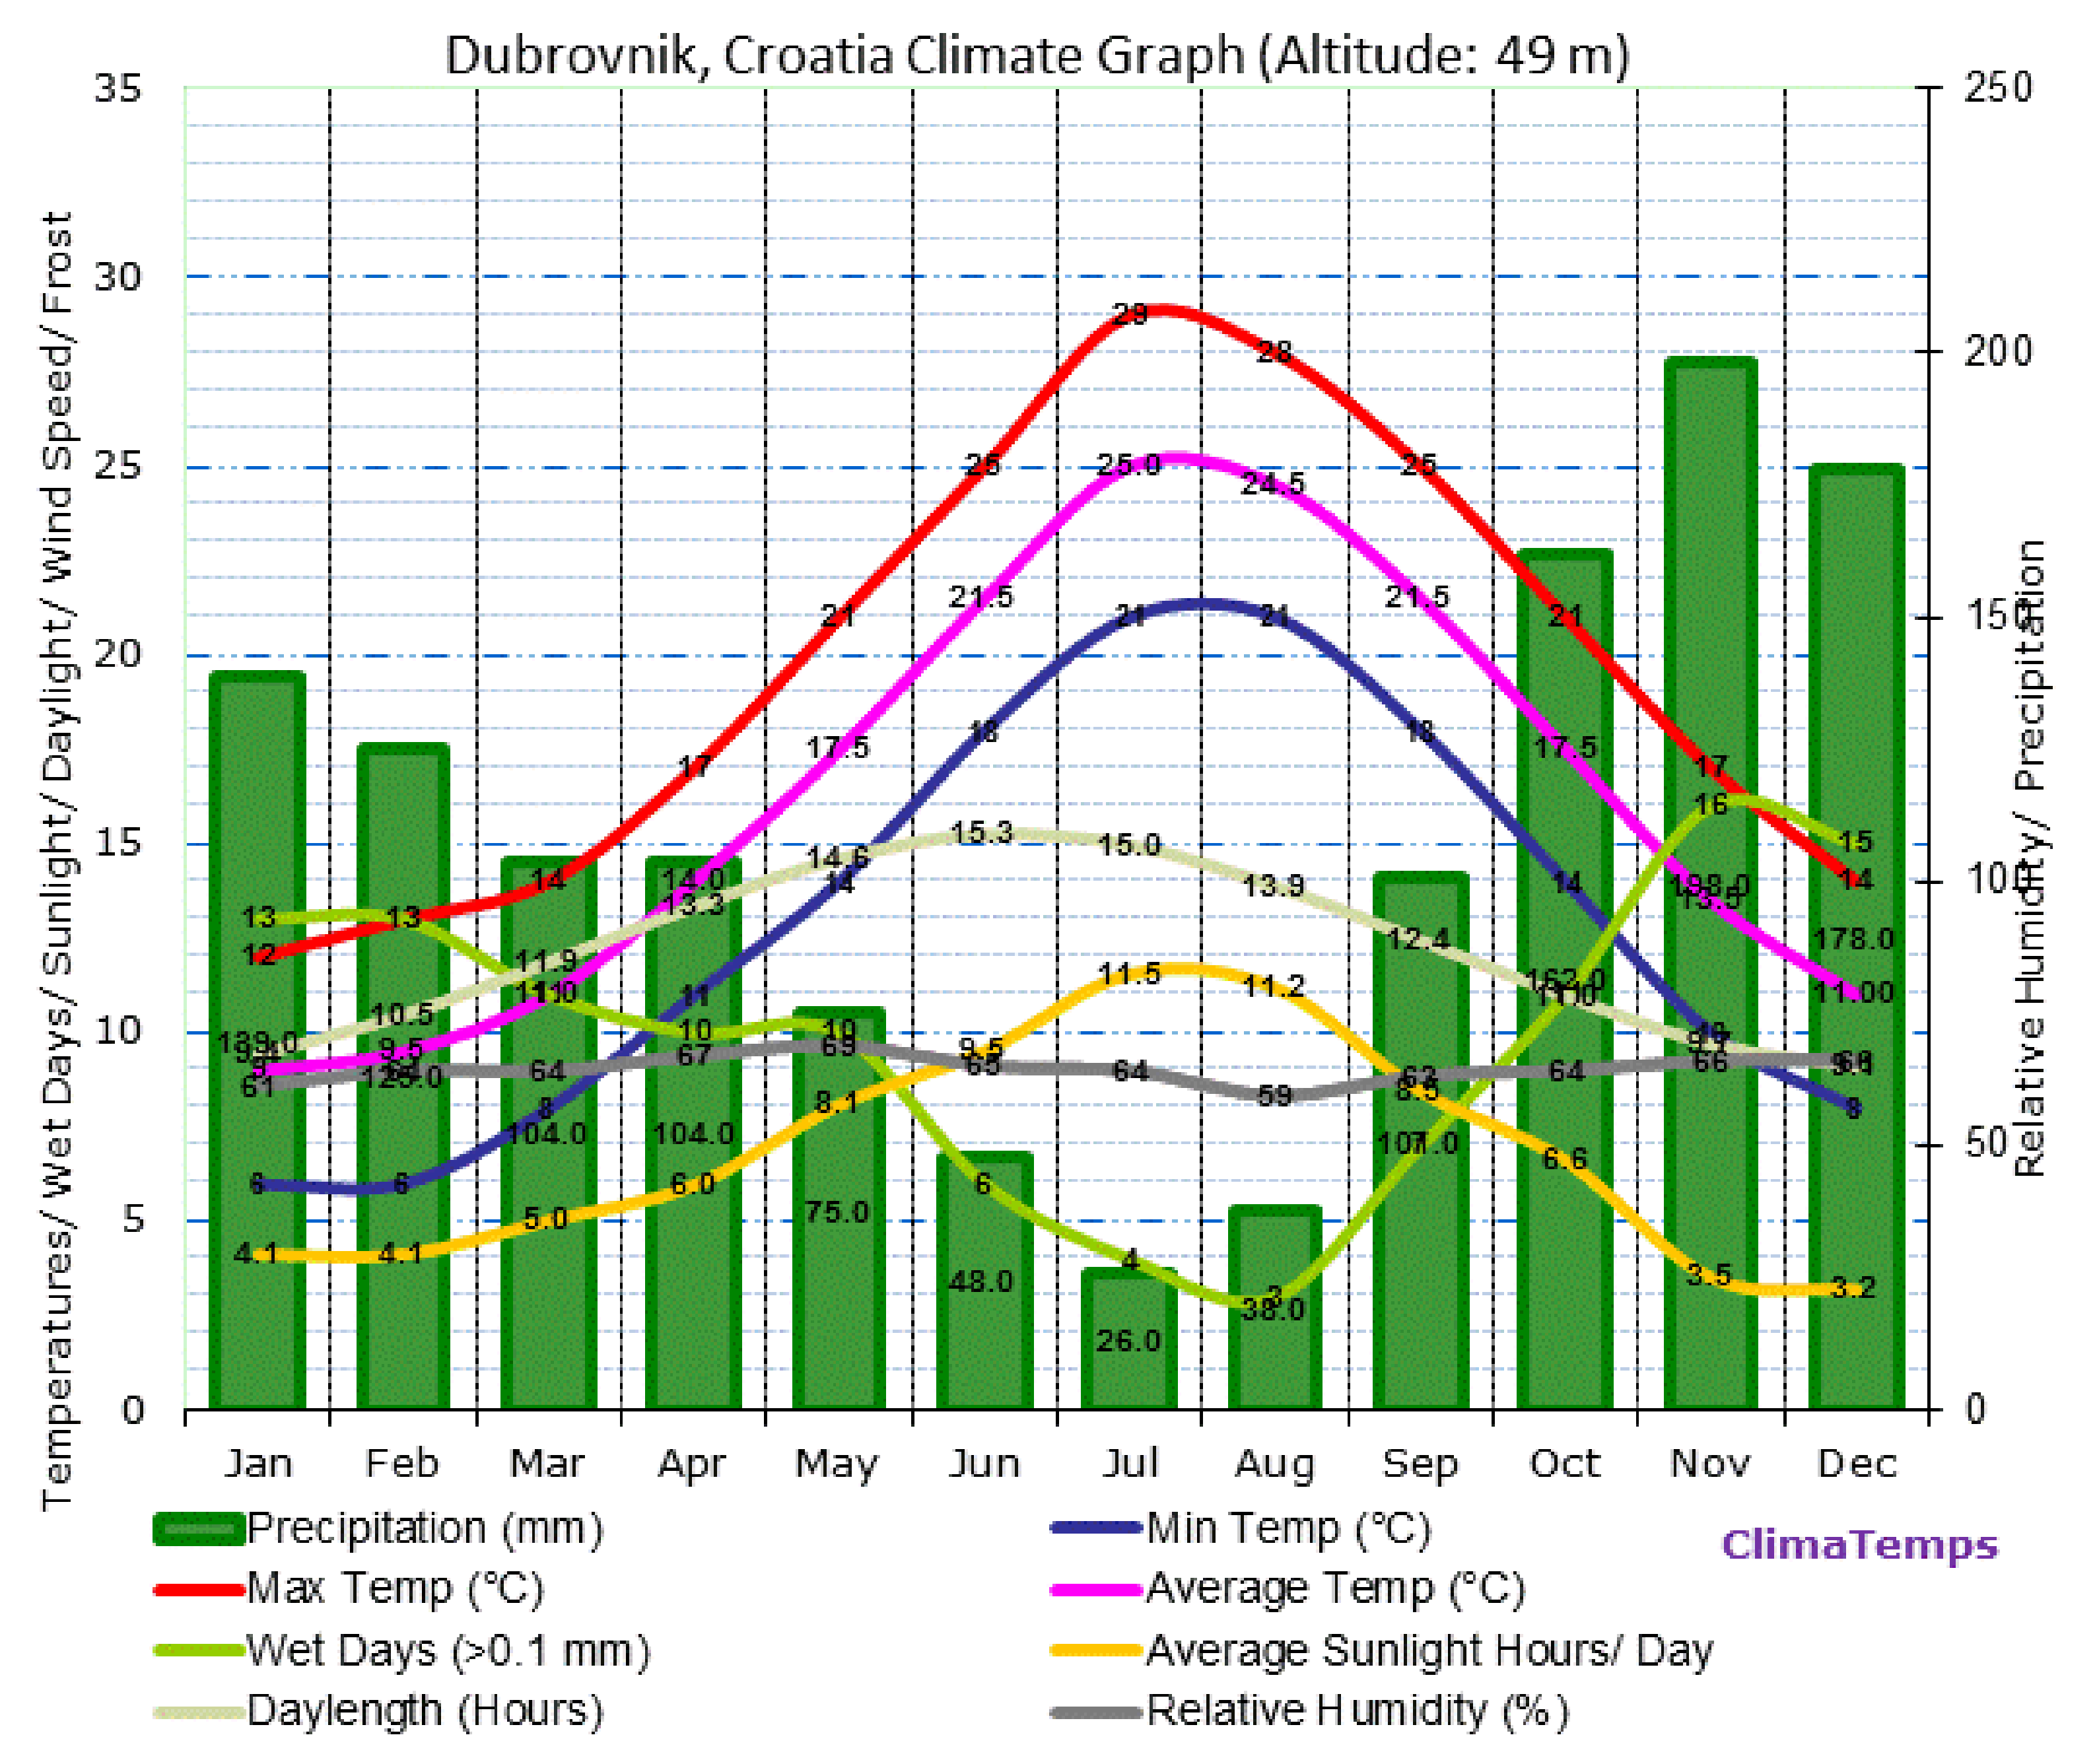
The climate of Dubrovnik seems quite favourable (
Figure 4): the temperature ranges between 5 and 30 °C in winter and summer, with an average of 16 °C, which means that the soil will have a temperature of around 16 °C, ideal for cooling in the summertime and pre-heating in wintertime. At the moment, there are no soil energy systems operating in Dubrovnik.
Annually, Dubrovnik receives more than 1000 mm of precipitation. With this quantity, all the water consumption for toilet flushing, washing and watering of plants could be served with collected and stored rain water. However, such energy-efficient solutions are not commonly practiced in Dubrovnik.
In spite of the high rainfall, Dubrovnik has high average daily sunlight hours, making the city—not least for its good slope orientation towards the south—very suited for active and passive solar technologies. As with water recycling, such solar applications are rarely in use in the area, the exception being the intermittent uptake of solar heat collectors for hot water.
5.2. Energy Potentials
In order to determine the renewable energy potentials of Dubrovnik, the method of Energy Potential Mapping [
10] was used.
Based on the climatic analysis undertaken, it was very apparent that the solar potential of the entire city is significant: Dubrovnik has 2480 h of sunshine per year, and an average solar irradiation of 1810 kWh/m2 (SW orientation). In comparison, the solar irradiation of North-Western Europe is around 1000 kWh/m2.
Further, wind turbines could be potentially effective when located on top of the coastal ridges, where wind from the sea accelerates them. The sea near the city, including the harbour of Gruž, also has the potential to be used as a source of heat and cold, assuming that the wave energy is not too complicated to harness. Finally, biomass could be obtained from bio-organic waste and from forest maintenance around the city’s hinterland.
6. Strategies for Improvement
6.1. Energy Master Planning
In line with other energy master planning methods (e.g., [
9]), the urban energy transition methodology of City-zen is based on incremental approaches such as REAP [
21,
22] and LES [
23]. The basis of these methods lies in the New Stepped Strategy (NSS [
24]): reduce (the demand for energy), reuse (waste energy flows), produce (energy from renewable sources). These steps are then translated to the urban level.
Figure 5 depicts an urban energy metabolism scheme from the Energy Master Plan [
25], which is indebted to the ‘Eco-device’ concept of Wirdum [
26] and Tjallingii [
27,
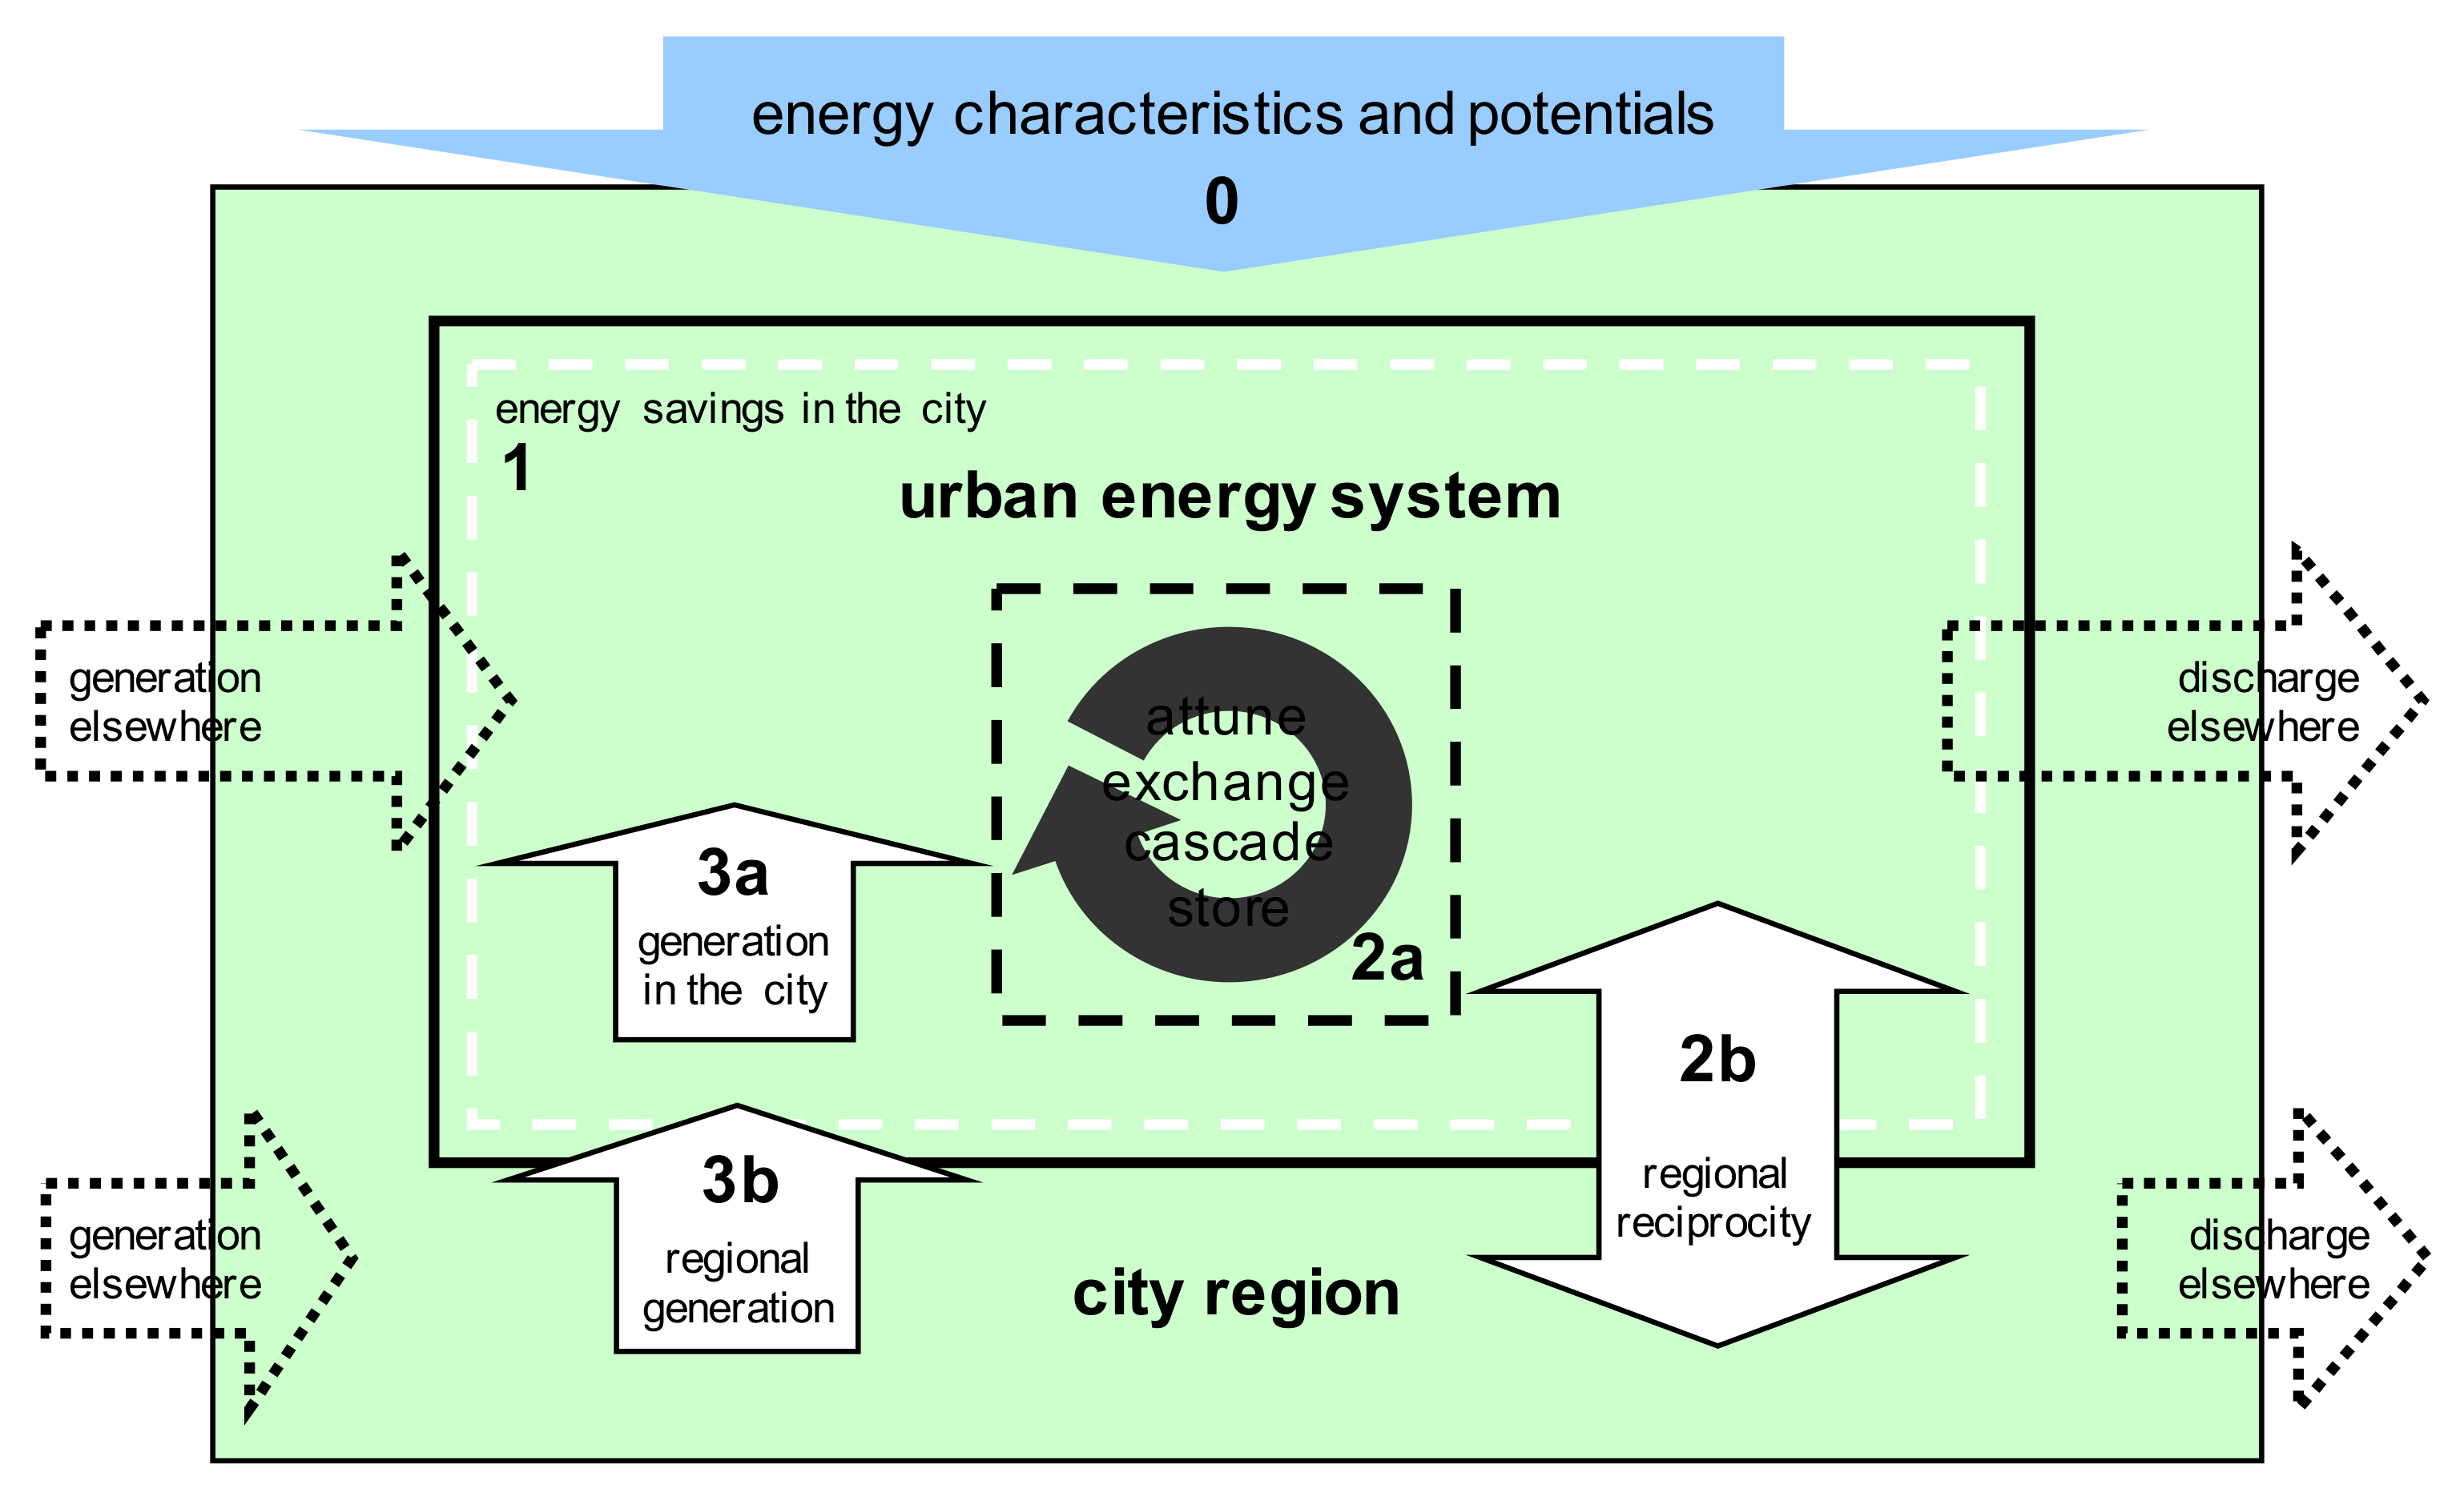
28], and includes a stepped approach based on REAP and the NSS. Basic preparative work includes attaining insight into the energy characteristics of a city and identifying energy sources and sinks (0, the blue arrow above). In the globalised world, provisions for cities and their regions are now commonly established by supply from outside, with discharge of waste flows (waste heat, waste water, waste materials, nutrients) to outside the city (the grey arrows left and right). The first step towards a more sustainable energy system is to reduce the energy demand in the urban environment (1), followed by solving the reuse of waste flows within and outside the city boundaries (2a and 2b), and the production of energy from renewable sources (3a and 3b). These technical-spatial strategies can be used for any urban sustainable transition process.
In close collaboration with local stakeholders, the Roadshow team co-created a proposal for a series of variously scaled interventions to make Gruž, and thus, the entire city of Dubrovnik, net zero energy and zero carbon.
6.2. Reduce: Smart Bioclimatic Design and Energy Renovation
Energy conservation is probably the largest factor in becoming carbon neutral. This includes for instance, saving energy for heating, cooling, ventilating and lighting, in newly constructed buildings and existing building stock. The greatest challenge lies in reducing the cooling demand of existing buildings.
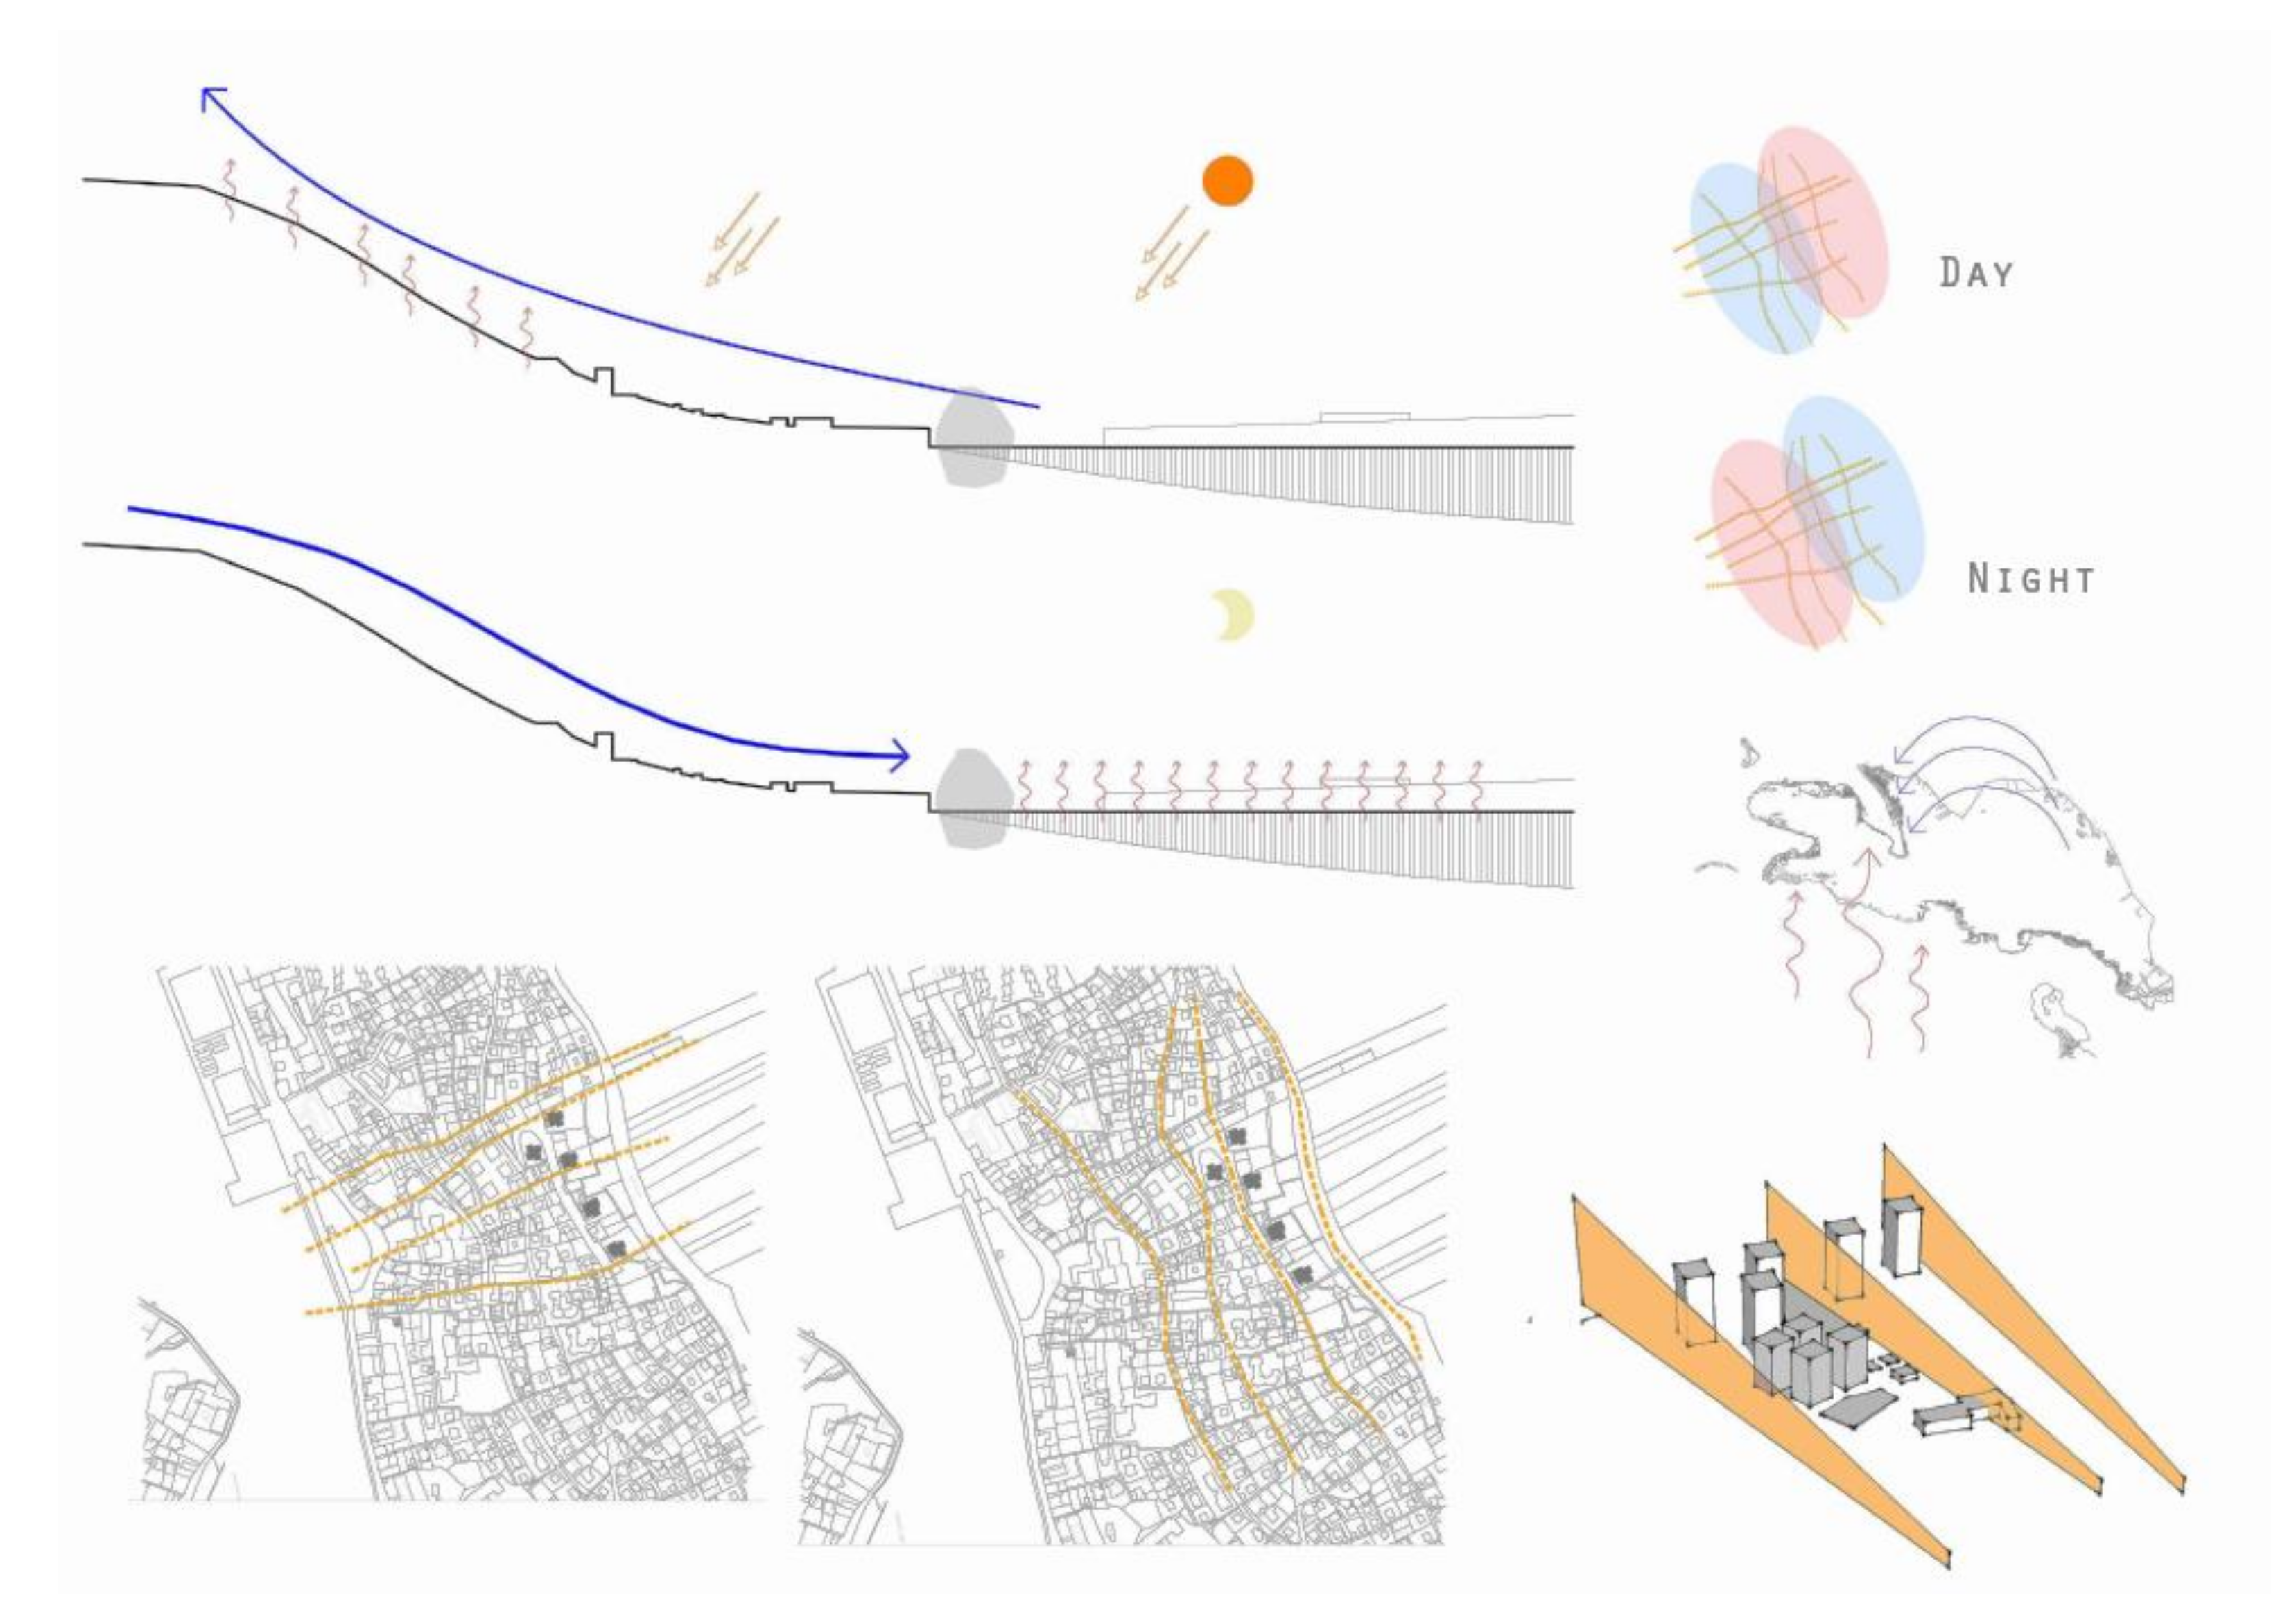
The local analysis made clear that Gruž’ position on a slope next to the harbour makes it suited for cooling breezes passing through the streets and alleys, powered by thermal daytime drafts, and by downward night-time mountain drafts (
Figure 6). This would save mechanical cooling needs and hence save energy. To calculate the exact impact of these cooling breezes, advanced simulations with CFD models would be needed, which was not possible within the time-frame of the Roadshow. Therefore, this particular planning proposal was not included in the calculated carbon savings. Nonetheless, it could be an additional factor.
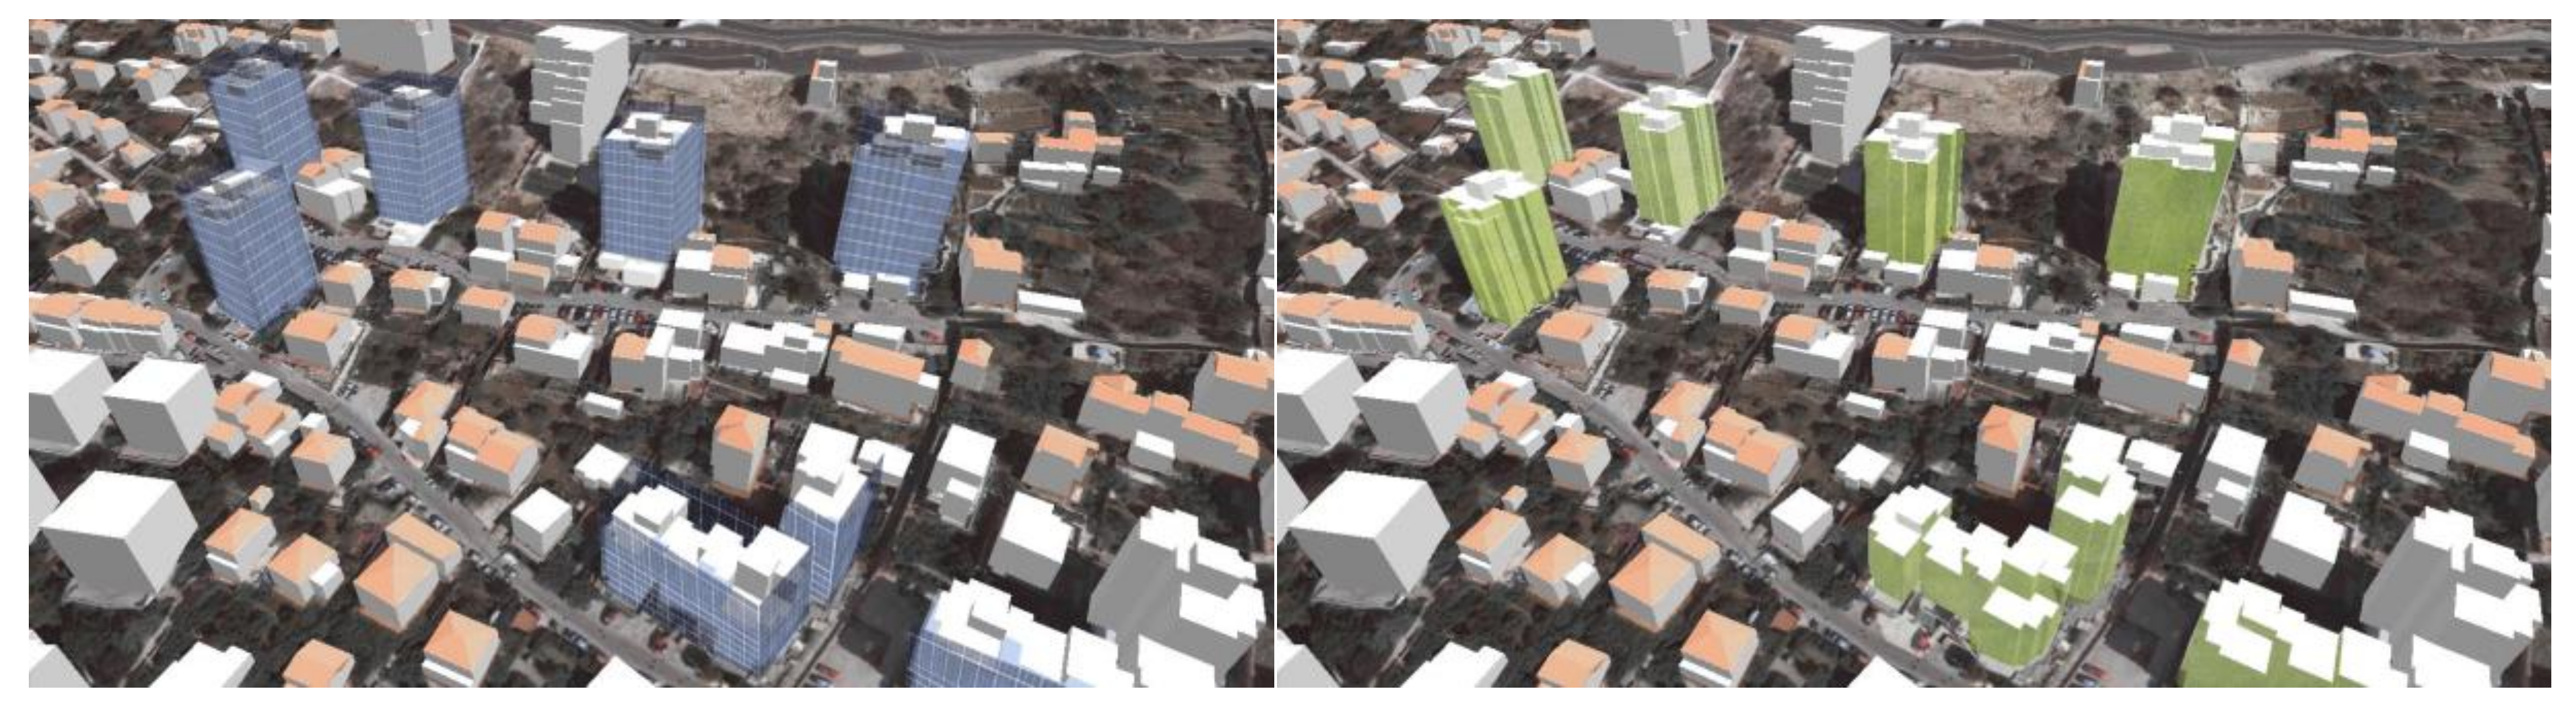
An energy renovation scheme was proposed for Gruž’s building stock, starting with the larger apartment blocks, which could be turned into energy-neutral buildings with post-insulation and photovoltaics (PV), algae or greenhouse facades (
Figure 7).
After studying the situation in situ and using the numbers provided by the Dubrovnik Development Agency and University of Zagreb, the effects of the proposed measures of energy renovation were calculated and later translated to carbon emission reductions. The energy calculations were informed by the expert judgement of the Roadshow team members.
Roof and façade shading—applicable to 50% of all households—could lead to a cooling demand reduction of 10%. Greening buildings could have the same effect and is applicable to 60% of Gruž households; greening the street blocks further helps to reduce demand by 5%. The greatest effect is achieved by post-insulation of roofs and walls and replacing windows with low-emittance alternatives, applicable to 80% of the households and resulting in a 35% reduction in heating demand and 5% in cooling demand. The impact of switching to heat pump systems, was calculated as adding a further saving of 26%.
6.3. Reuse: The Green Port
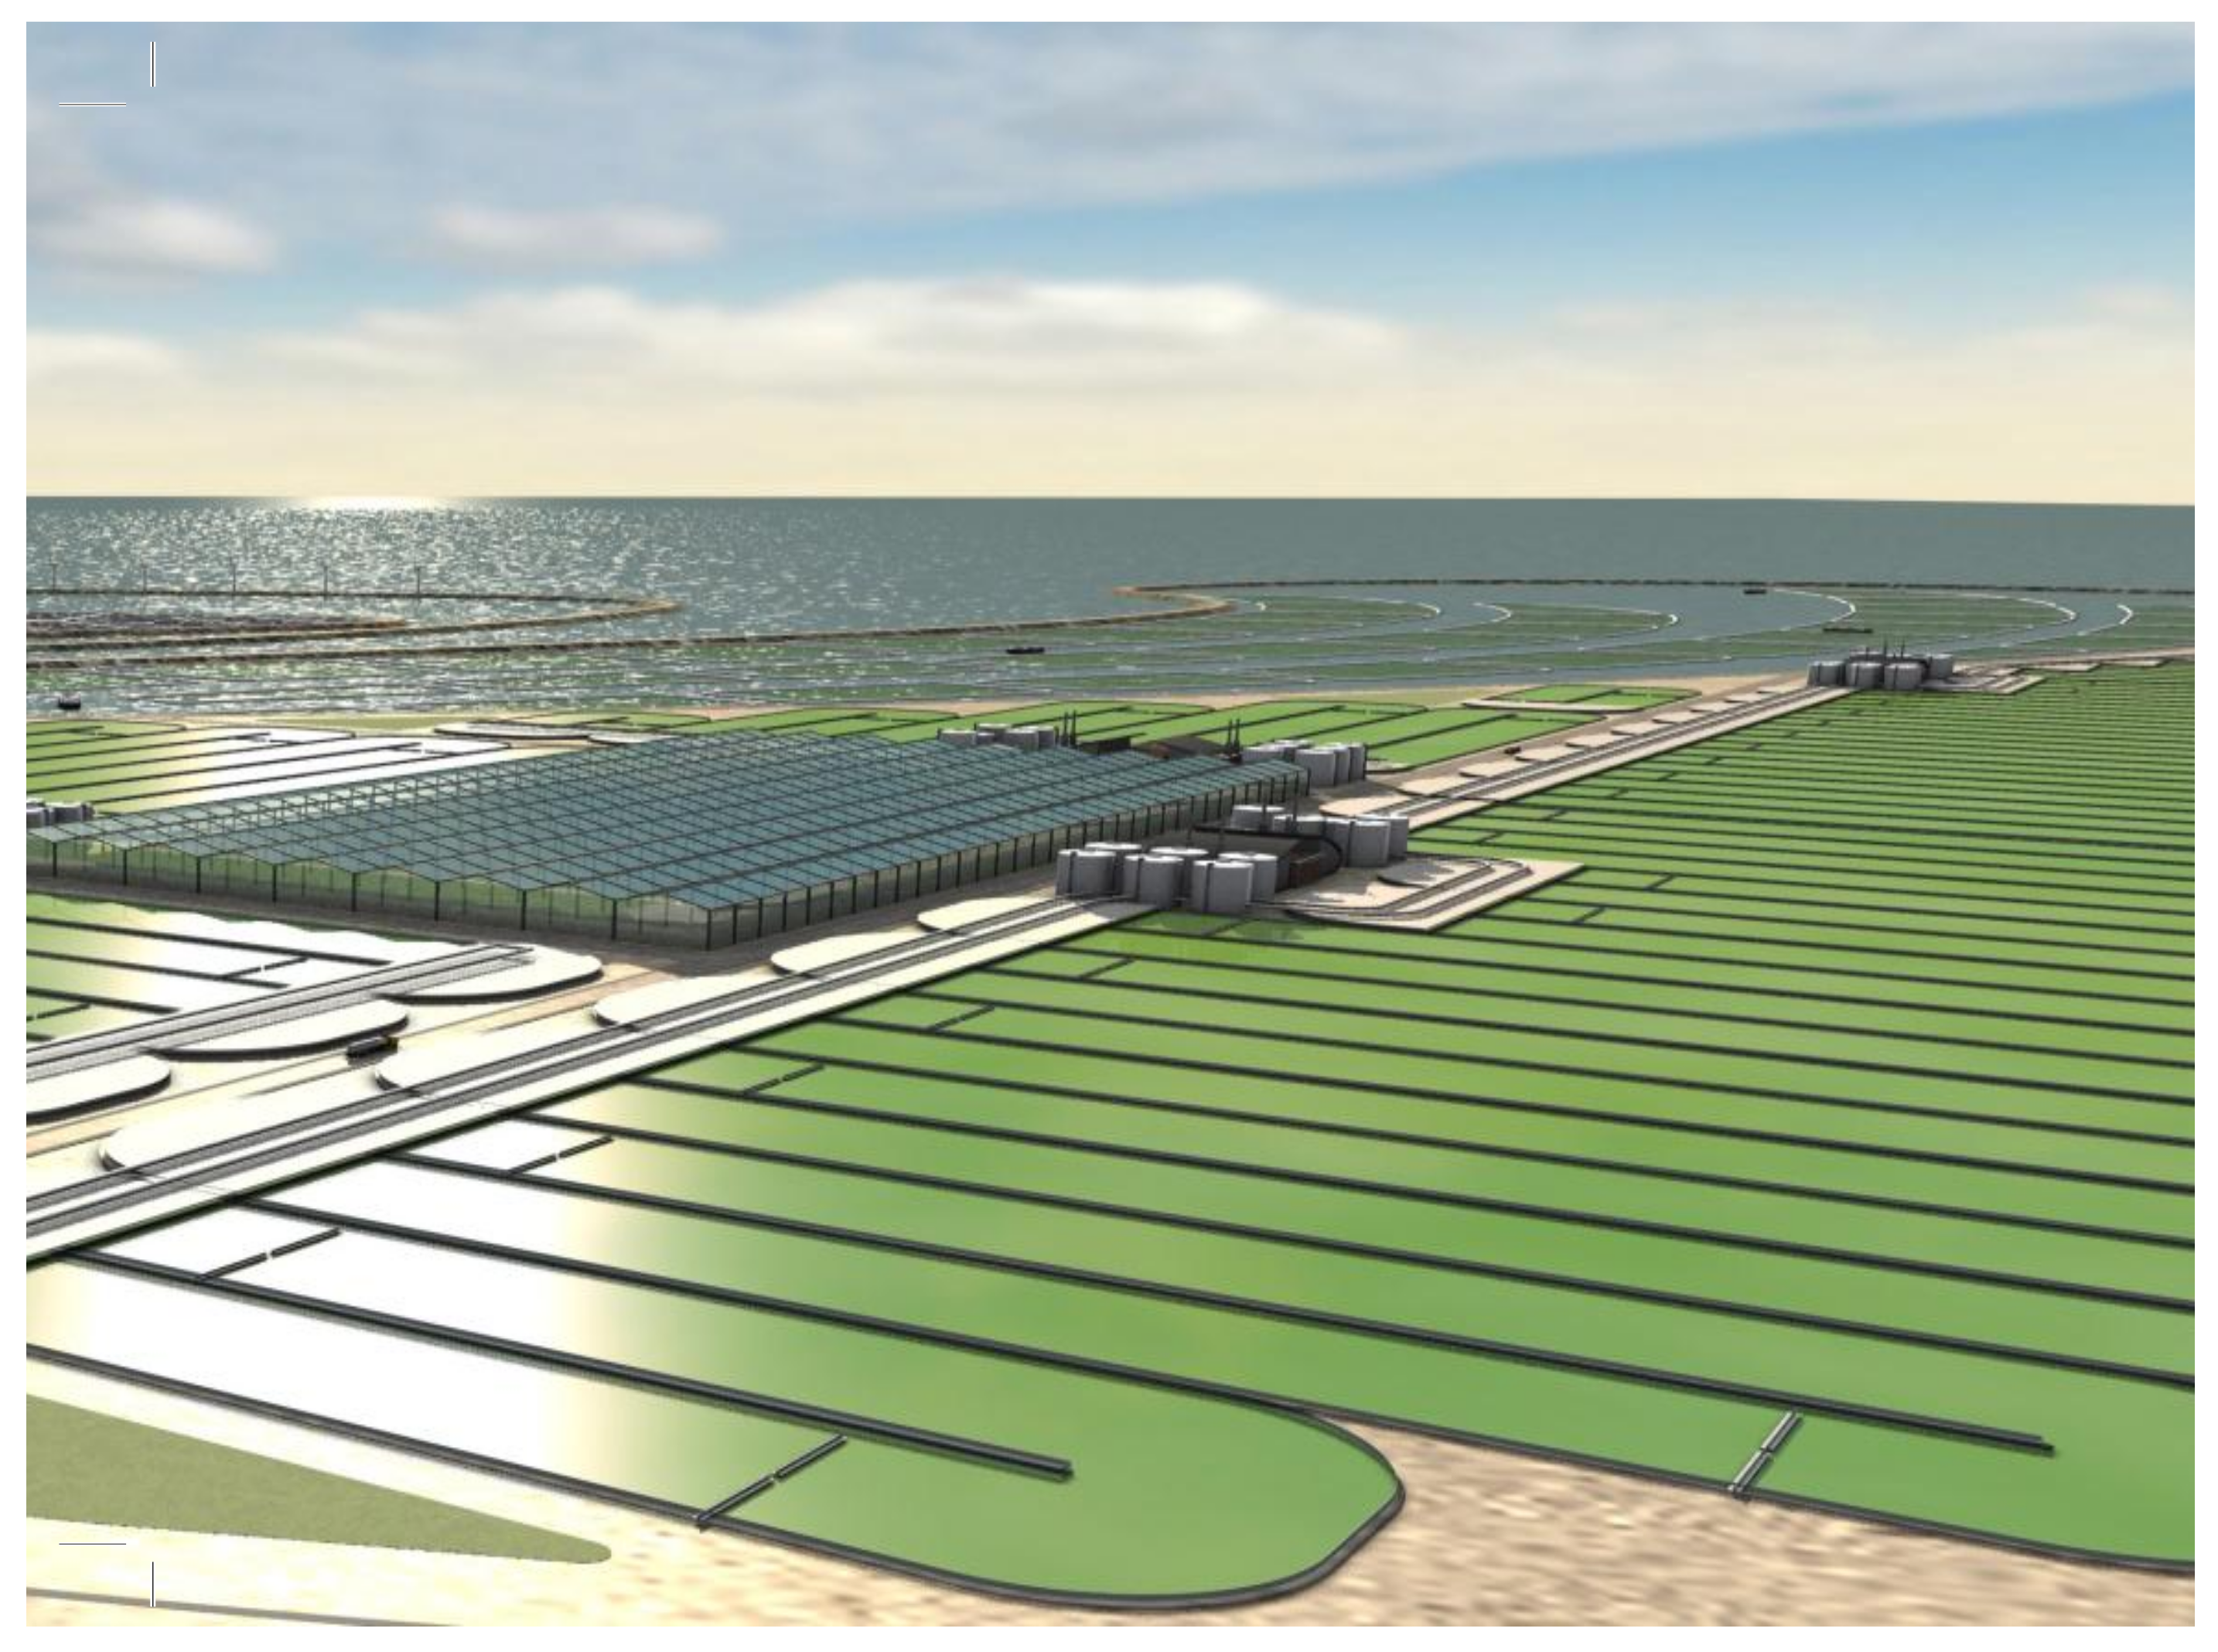
With a clear understanding of the contextual challenges ahead and their hierarchy in terms of importance, need and resolution, the strategy was to seriously address the issues related to cruise ship tourism. Requesting that the cruise ships transport their waste water to Gruž, instead of accepting that they release it directly into the sea, as is the present case, would be a step toward energy efficiency and creating a greener, cleaner economy and environment. The use of waste water treatment by algae enables the production of biodiesel and nutrients that are used to grow food, both of which can be sold back to the cruise ships. This green port solution (
Figure 8) would create a win-win for the local community of Gruž.
6.4. Produce: Golf Course Wind Park
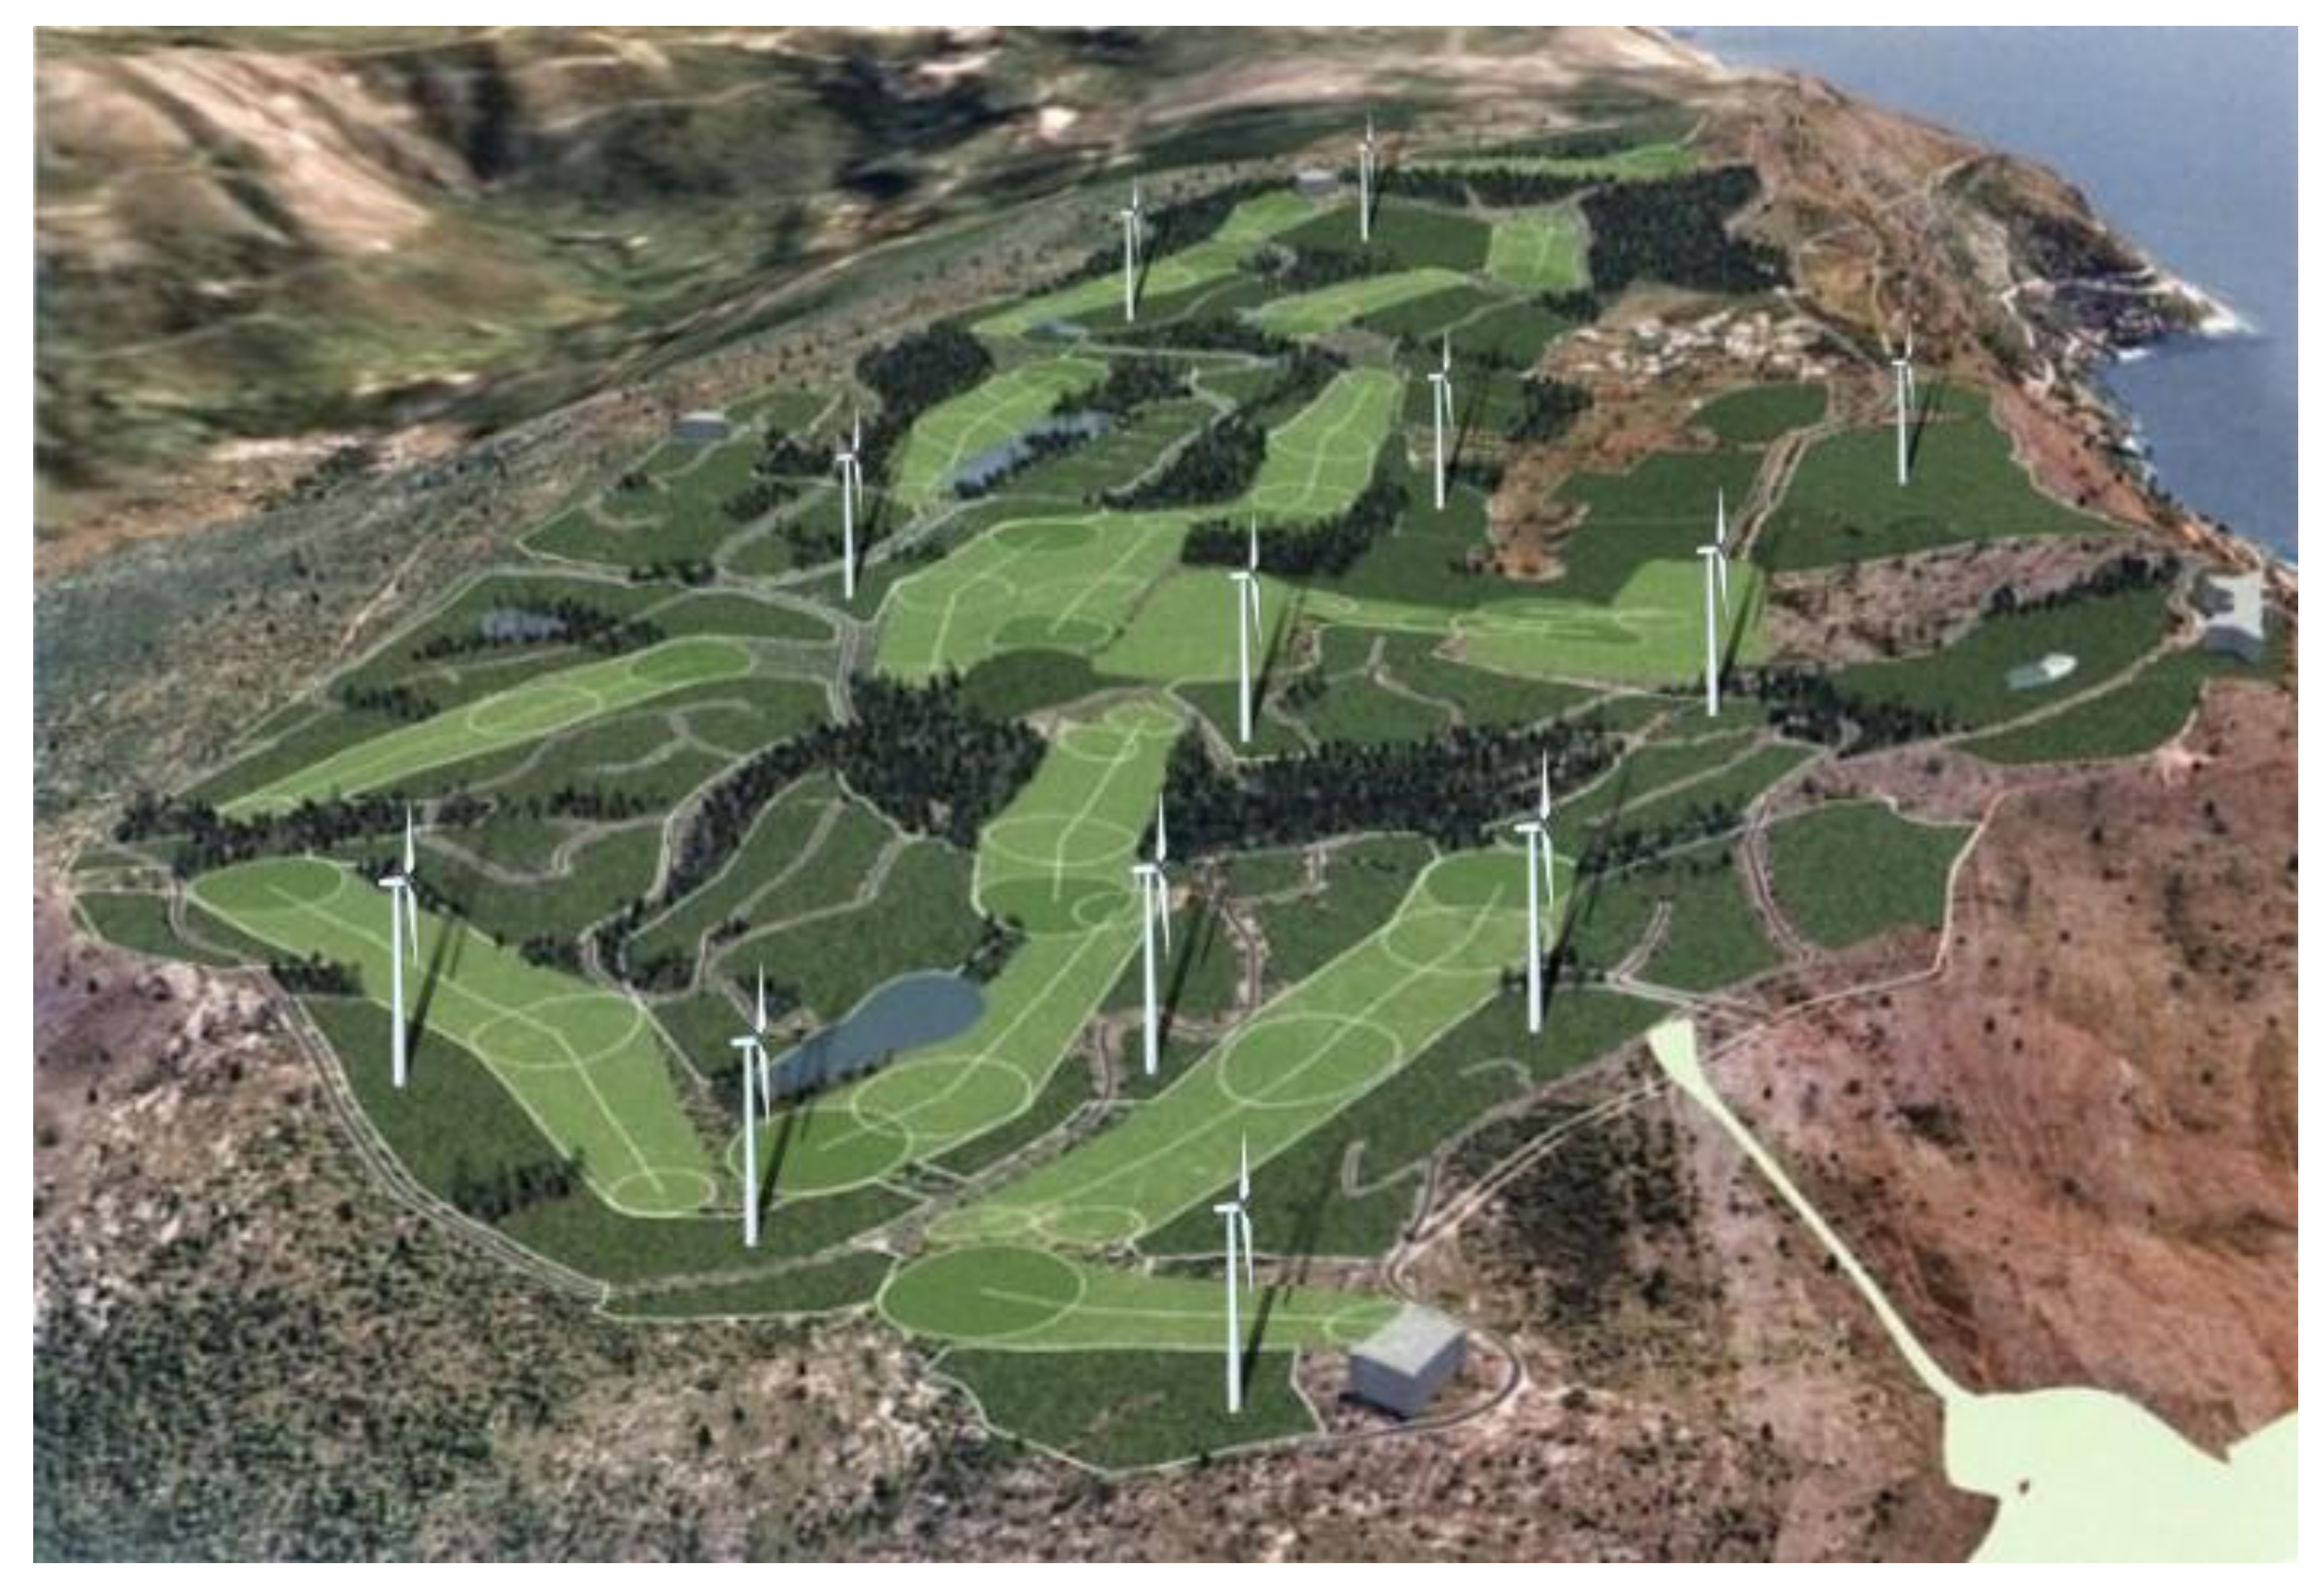
For Gruž, the City-zen Roadshow proposed a set of renewable energy production opportunities within the district, use of photovoltaics in particular, and these were calculated as savings of fossil fuels and carbon emissions. We want to highlight one unusual proposal that was made.
The Roadshow method ensures that not only past and present situations are analysed but also that future plans for the built environment influence the final outcomes. In the case of Gruž, an expansive and locally controversial golf resort has been proposed on the ridge overlooking the city. Considering the loss of biodiversity, use of pesticides, energy required for frequent grass trimming, material use of golf balls lost, etc., golf courses are seldom sustainable (for instance see data accessible through the Golf Course Superintendents Association of America [
30]).
The City-zen Roadshow suggested that the strategic placement of wind turbines between the greens could add to the productive renewable energy capacity of Gruž (
Figure 9). The effect of the wind turbines was included in the calculation as a saving in the use of non-sustainable electricity. A side effect would be that communal wind turbines would improve the acceptability of the controversial golf course.
6.5. Sustainable and Healthy Transportation
“A developed country is not a place where the poor have cars, it is where the rich use public transportation”, said Petro Gustavo, Mayor of Bogotá. Or bicycles, we could add. Dubrovnik transportation has a large share of private cars and other fossil fuel powered vehicles. Cruise ship tourists converge on the city centre in diesel buses, contributing further to fossil energy consumption, carbon emissions and air pollution. Based on carbon figures for various forms of transportation (see below), the modal split of Dubrovnik entails a relatively large emission of CO2 as compared to other European cities. The City-zen Roadshow tried to reduce the carbon emissions of a default modal split of transportation by a shift to more use of public electric transportation, cycling and walking. The impact of this was included in the calculations.
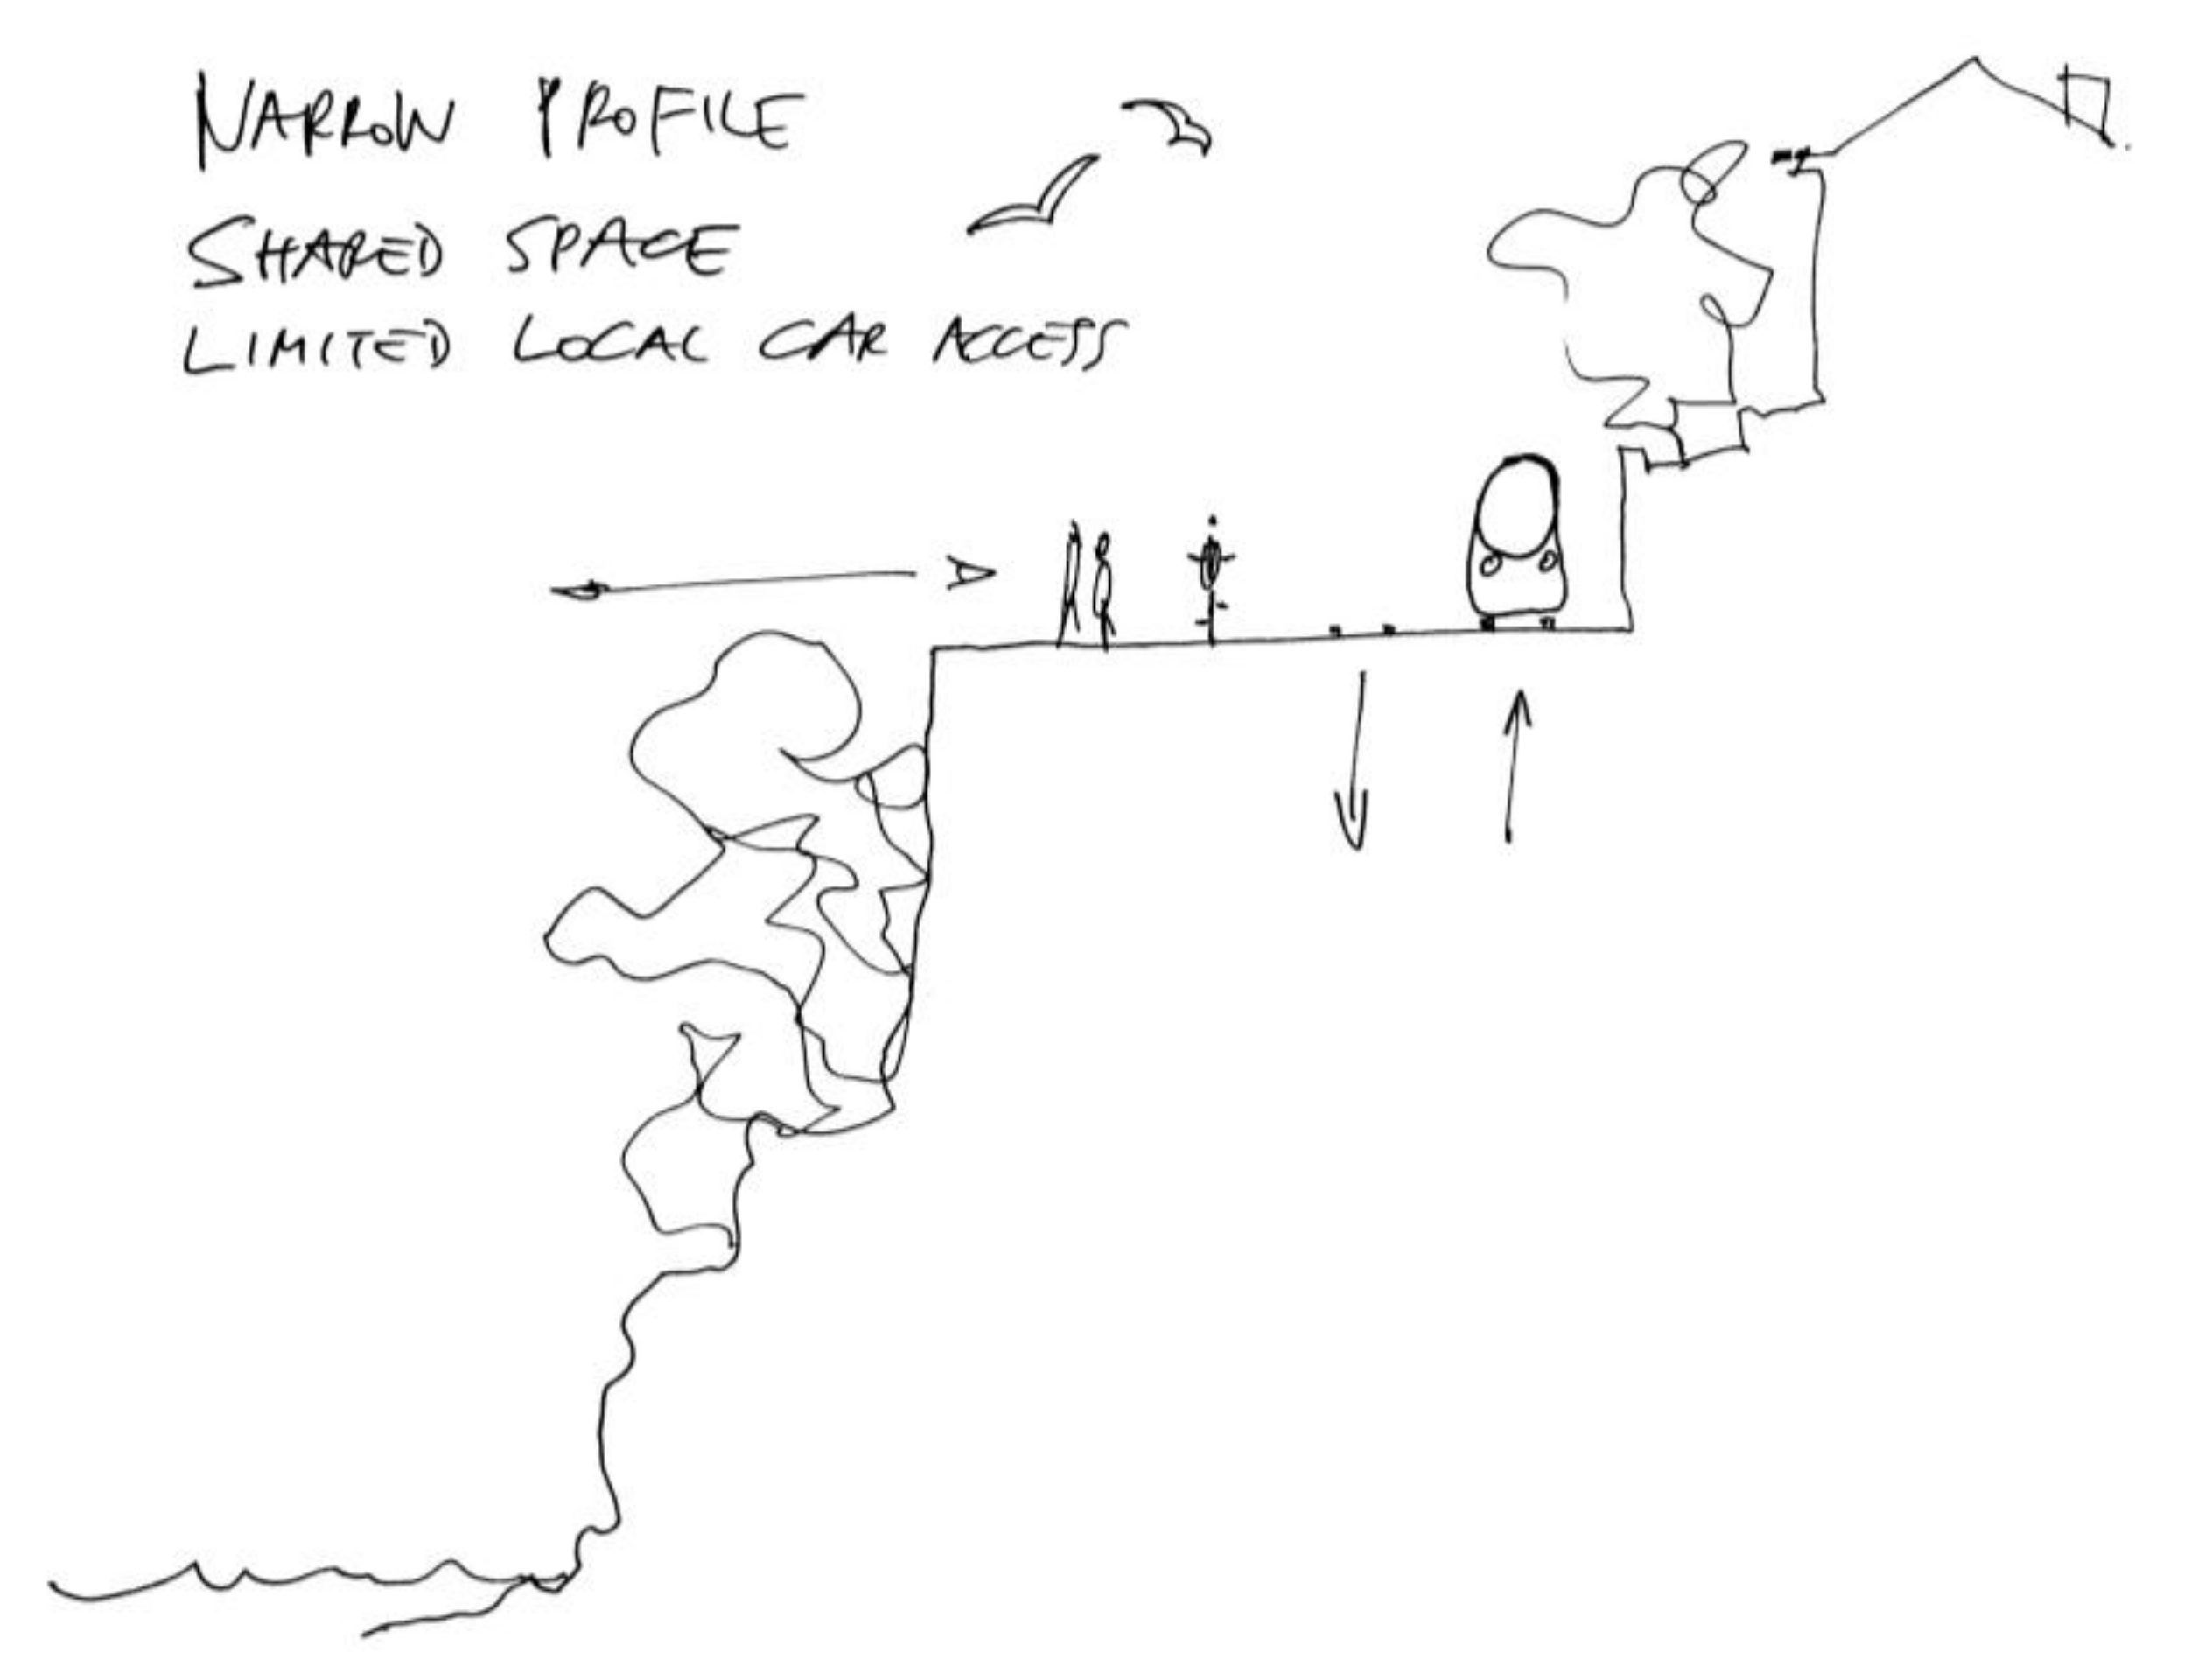
For example, the Roadshow proposed a new tramway linking the Gruž port and the historic centre of Dubrovnik. Bicycle lanes and walkways for more health conscious citizens and tourists would complement the logical green corridor scheme.
Figure 10 illustrates this. It is a good example of the design-driven workshop (a form of research by design [
31]), which includes interactive, co-creative processes, including science (most notably, impact assessments), technology (knowledge of latest technical developments) and design skills (the ability to imagine new solutions and draw them in present-day situations). The traffic solution shown in
Figure 10 was hand-drawn by an architect with input from local stakeholders and assessed for its energy and carbon impact by scientists.
It should be noted that a minority of tourists do attempt the journey by foot today, but the 20-min journey is unattractive, exhaust fumed and precarious. The lack of appropriately safe, wide and level footpaths causes coaches and buses to stop abruptly to prevent their wing mirrors striking unaware, single-filed and city-unfamiliar pedestrians.
7. Impact Assessment
The Sustainable City Vision presented to stakeholders of the city incorporated a path towards an attainable sustainable future, validated by calculations of the carbon emission effects.
Table 4 shows a sequence of possible measures that can be potentially applied to progressively decrease the impacts on the Gruž neighbourhood. In particular, ten measures are selected as follows:
Building greenery and shading. This combines solutions for shading building roofs and facades from direct solar irradiation. It also includes nature-based solutions such as roof gardens, vertical greenery systems or common vegetation and trees in squares and streets to avoid the Urban Heat Island (UHI) effect.
Heat pumps. This concerns the replacement of old electric systems that are diffusely used in houses. Based on a coefficient of performance (COP) of 4, this would provide an energy saving for heating and cooling.
Building envelope insulation. Considering the current state of dwellings, energy retrofitting of buildings in the neighbourhood would be a strategic choice.
Solar PV and solar thermal for domestic hot water was estimated based on real availability of flat roofs and well-oriented walls. Considering 2480 h of sunshine per year, an average solar irradiation of 1810 kWh/m2 and the orientation of buildings (6% South-East; 6% South; 61% South-West out of 750 available roofs per 80 m2 each), the potential of electricity production has been estimated to be around 4300 MWh/a.
Mini wind towers. It is estimated that 50 towers would produce up to 350 MWh/a of generated electricity for the neighbourhood.
Increase in public transport. This measure is highly desirable in Gruž and would potentially involve 60% of households avoiding the use of private cars.
Transition to electric mobility. This is a medium- or long-term scenario hypothesising full electrification of the mobility system with an additional electricity demand estimated as 1.4 GWh.
Wind turbines. This hypothesises the installation of 12 wind turbines of 1 MW each on the planned golf course, which would support the electricity demand of the neighbourhood once the transition to electric mobility has been achieved.
Avoid waste to landfill. Increase the fraction of differentiated waste (most of it is just landfilled) by redirecting it to composting (40% organic waste), incineration (10%) and recycling (up to 30%).
Carbon uptake by urban forestry. The final assessment reveals that urban (re)forestation of 67 hectares would compensate the residual emission mostly due to waste and water management that cannot be avoided anyhow.
Realisation of the proposed measures would ensure that near all of Gruž’s greenhouse gas emissions incurred by energy consumption and other sources would be reduced to zero. Of the 1200 hectares of forestland initially required, only 67 remained, and these relate to the emission from the waste-to-energy plant, landfills and water resource use. This emission cannot be completely avoided but could be potentially compensated by the reforestation of 36 hectares of disused land or brownfields. Integrated measures for energy saving and renewable energy generation in buildings (e.g., greenery and shading systems, envelope insulation, PV panels and micro-wind turbines, etc.) as well as new installations (e.g., a wind farm) would increase the differentiated fraction of domestic waste addressed by an integrated waste management system (including recycling, a waste-to-energy plant, organic waste composting and just a little fraction sent to landfill). Enhanced public transport (to replace at least 60% of private cars in the short term) and the provision of a new mobility system, based on electric public and private vehicles in the medium term, are among the possible solutions to achieve the goal of carbon neutrality.
8. Conclusions, Discussion and Outlook
The City-zen Roadshow Dubrovnik demonstrated that through a meaningful merger of co-creative inputs from global experts and local stakeholders that cities can become carbon neutral and energy neutral. The measures proposed for Gruž are of course theoretical and not presently in operation. The zero-energy challenge must now move to the realisation phase in which the lead is taken by the City to formulate an action plan towards a desired future, for which they can take inspiration from the City Vision as presented at the City-zen Roadshow.
It should be mentioned that during the Roadshow more technical, spatial and management proposals were made than could be discussed and elaborated in this paper. The examples given are the most important carbon measures, a timely illustration of the science- and information-based creativity that the City-zen Roadshow entails, without proposing unrealistic solutions.
Although efforts were made by the Roadshow coordinator to invite a wide representation of Dubrovnik stakeholders and although many of these attended the workshop on one or more occasions, it is unknown to us if this set of stakeholders is sufficient to represent the city or district of Gruž, and if the measures proposed will work effectively. It is possible that participants who showed interest are biased while others with influence, or citizens themselves, may not understand the importance of a sustainable transition and measures of carbon emission reduction and renewable energy production.
The endorsement of the mayor of Dubrovnik and active involvement of the spatial planning department however, gives some confidence that the findings and proposals made for Gruž will be processed beyond the Roadshow week. Moreover, the Roadshow revealed pressing issues regarding threats to the health of citizens and to the environment, which directly affect the local population. Turning these problems into potentials for sustainable development and economic prospects, as proposed by the Roadshow, clearly appealed to the local community. Related or not, shortly after the Roadshow the City of Dubrovnik announced a limit to the number of cruise ships mooring in Gruž. The coming years will indicate whether effective change will occur, but the signs are good.
As stated earlier, the Roadshow is not intended to be a substitute for socially-engaged urban planning, and indeed, many of the participants in the cities have roles, that engage directly in this way. What the Roadshow offers them is the chance to play and imagine solutions with experts, that empower them to be bolder in the offerings they present to stakeholders.
Therefore, in addition to the design outcomes and the calculated energy and carbon performance (though vital to the EU and the rest of the world), perhaps the greatest value of the City-zen Roadshow is the collaboration and co-creation it establishes between people with different expertise and between academics, students, experts and local stakeholders [
32]. The parties involved identified and acknowledged this as something making the dissemination of knowledge and strategies to the cities and their citizens much more effective than earlier methods, such as conferences, lectures, meetings, guidelines and reports.
Before Dubrovnik, the City-zen Roadshow visited Belfast (winter 2016) and Izmir (spring 2016); both Roadshows were successful in that they outlined the scale of the energy challenge, the timeline needed to meet it and the location-specific design interventions that could facilitate it both socially and spatially. Lessons were learned from earlier versions of the Roadshow in Florence and Sarajevo. Since Dubrovnik, Menorca was visited in spring 2017, followed by Seville (fall 2017) and Roeselare (spring 2018). The Roadshow has recently been described by its overseeing European Policy Commissioner as “remarkable” for its method and societal contribution. The Roadshow has now been recognised as an example of an EU ‘Best Practice’. The City-zen Roadshows will continue until the end of 2019.
Acknowledgments
City-zen has received funding from the European Union’s Seventh Programme for research, technological development and demonstration under grant agreement No 608702. The Dubrovnik Roadshow would not have been possible without the commitment and energy of two individuals, Andrea Novaković (Director, City of Dubrovnik Development Agency DURA) and Goran Krajacic (Assistant Professor, University of Zagreb). Both Andrea’s and Goran’s unwavering support during the preparations for the SWAT Studio and later Roadshow were pivotal in their joint success. The authors would also like to thank Andrea’s colleagues at DURA: Marko Cosmai, Ana Marija Pilato and Tomislav Matković, all three major factors in the success of the event. We wish them every success in taking the zero-energy outcomes of the Dubrovnik (Gruž) Roadshow to the next level of realisation. The DURA staff worked tirelessly to ensure that the objectives of the Roadshow were met. A special mention must also go to Viktorija Dobravec (PhD candidate, University of Zagreb) whose daily support during the 2-week intensive SWAT Studio was highly appreciated by both TU Delft staff and students. Finally, a mention for Siir Kilkis (Scientific and Technological Research Council of Turkey) who originally nominated the City of Dubrovnik to be a Roadshow city.
Author Contributions
Andy van den Dobbelsteen, Craig Lee Martin, Greg Keeffe and Han Vandevyvere conceived and designed the strategies and solutions; Riccardo Maria Pulselli analysed the data; all authors wrote the paper.
Conflicts of Interest
The authors declare no conflict of interest.
References
- EU. Horizon 2020 Programme Secure Clean and Efficient Energy. Available online: http://ec.europa.eu/programmes/horizon2020/en/h2020-section/secure-clean-and-efficient-energy (accessed on 4 March 2018).
- EU. Energy Strategy and Energy Union. Available online: http://ec.europa.eu/energy/en/topics/energy-strategy-and-energy-union (accessed on 4 March 2018).
- City-zen, EU FP7 Project. Available online: http://www.cityzen-smartcity.eu (accessed on 4 March 2018).
- Deal, B.; Pan, H.; Pallathucheril, V.; Fulton, G. Urban Resilience and Planning Support Systems: The Need for Sentience. J. Urban Technol. 2017, 24, 29–45. [Google Scholar] [CrossRef]
- Deal, B.; Pan, H. Discerning and Addressing Environmental Failures in Policy Scenarios Using Planning Support System (PSS) Technologies. Sustainability 2017, 9, 13. [Google Scholar] [CrossRef]
- Klosterman, R.E. Arguments for and against planning. Town Plan. Rev. 1985, 56, 5–20. [Google Scholar] [CrossRef]
- Dreborg, K.H. Essence of Backcasting. Futures 1996, 28, 813–828. [Google Scholar] [CrossRef]
- Robinson, J.B. Energy Backcasting: A Proposed Method of Policy Analysis. Energy Policy 1982, 10, 337–345. [Google Scholar] [CrossRef]
- Zhivov, A.M.; Case, M.; Liesen, R.; Kimman, J.; Broers, W. Energy Master Planning Towards Net-Zero Energy Communities/Campuses. ASHRAE Trans. 2014, 120, 114–129. [Google Scholar]
- Broersma, S.; Fremouw, M.; van den Dobbelsteen, A. Energy Potential Mapping—Visualising Energy Characteristics for the Exergetic Optimisation of the Built Environment. Entropy 2013, 2, 490–510. [Google Scholar] [CrossRef]
- Dubrovnik Tourist Board (TZ Dubrovnik), Record-Breaking Tourism Results: Dubrovnik Is a Living and Eventful City with a Quality Tourism Product. Available online: http://www.tzdubrovnik.hr/ (accessed on 5 April 2018).
- Peričić, D.; Puh, B. Attitudes of Citizen of Dubrovnik towards the Impact of Cruise Tourism on Dubrovnik. Tour. Hosp. Manag. 2012, 18, 213–228. [Google Scholar]
- World Resources Institute (WRI). GHG Protocol Summary—Global Protocol for Community-Scale Greenhouse Gas Emissions Inventories, Executive Summary 12. 2014. Available online: https://www.wri.org/sites/default/files/global_protocol_for_community_scale_greenhouse_gas_emissions_inventory_executive_summary.pdf (accessed on 4 April 2018).
- Lin, J.; Liu, Y.; Meng, F.; Cui, S.; Xu, L. Using hybrid method to evaluate carbon footprint of Xiamen City, China. Energy Policy 2013, 58, 220–227. [Google Scholar] [CrossRef]
- Marchi, M.; Pulselli, F.M.; Mangiavacchi, S.; Menghetti, F.; Marchettini, N.; Bastianoni, S. The greenhouse gas inventory as a tool for planning integrated waste management systems: A case study in central Italy. J. Clean. Prod. 2017, 142, 351–359. [Google Scholar] [CrossRef]
- Marchi, M.; Niccolucci, N.; Pulselli, R.M.; Marchettini, N. Environmental policies for GHG emissions reduction and energy transition in the medieval historic centre of Siena (Italy): The role of solar energy. J. Clean. Prod. 2018, 185, 829–840. [Google Scholar] [CrossRef]
- Bastianoni, S.; Marchi, M.; Caro, D.; Casprini, P.; Pulselli, F.M. The connection between 2006 IPCC GHG inventory methodology and ISO 14064-1 certification standard e a reference point for the environmental policies at sub-national scale. Environ. Sci. Policy 2014, 44, 97–107. [Google Scholar] [CrossRef]
- IPCC. IPCC Guideline for National Greenhouse Gas Inventories; Eggleston, H.S., Buendia, L., Miwa, K., Ngara, T., Tanabe, K., Eds.; IGES: Tsukuba, Japan, 2006. [Google Scholar]
- Sovacool, B. Valuating the greenhouse emissions from nuclear power: A critical survey. Energy Policy 2008, 36, 2950–2963. [Google Scholar] [CrossRef]
- Dubrovnik Climate Maps. Available online: www.dubrovnik.climatemps.com (accessed on 4 March 2018).
- Tillie, N.; van den Dobbelsteen, A.; Doepel, D.; de Jager, W.; Joubert, M.; Mayenburg, D. Towards CO2 Neutral Urban Planning—Introducing the Rotterdam Energy Approach and Planning (REAP). J. Green Build. 2009, 4, 103–112. [Google Scholar] [CrossRef]
- Van den Dobbelsteen, A.; Keeffe, G.; Tillie, N. Cities Ready for Energy Crises—Building Urban Energy Resilience. In Proceedings of the SASBE2012, Sao Paulo, Brazil, 27–29 June 2012. [Google Scholar]
- Van den Dobbelsteen, A.; Tillie, N.; Kurschner, J.; Mantel, B.; Hakfoort, L. The Amsterdam Guide to Energetic Urban Planning. In Proceedings of the MISBE2011, Amsterdam, The Netherlands, 19–23 June 2011. [Google Scholar]
- Van den Dobbelsteen, A. Towards closed cycles—New strategy steps inspired by the Cradle to Cradle approach. In Proceedings of the PLEA2008—25th Conference on Passive and Low Energy Architecture, Dublin, Ireland, 22–24 October 2008. [Google Scholar]
- Van den Dobbelsteen, A.; Tillie, N.; Broersma, S.; Fremouw, M. The Energy Master Plan: Transition to self-sufficient city regions by means of an approach to local energy potentials. In Proceedings of the PLEA2014, Ahmedabad, India, 16–18 December 2014. [Google Scholar]
- Van Wirdum, G. Ecoterminologie en Grondwaterregime, Mededeling Werkgemeenschap Landschapsoecologisch Onderzoek 6; WLO: Utrecht, The Netherlands, 1979; pp. 19–24. [Google Scholar]
- Tjallingii, S. Ecologisch Verantwoorde Stedelijke Ontwikkeling; IBN-DLO Rapport nr 706; Universiteit Wageningen: Wageningen, The Netherlands, 1992. [Google Scholar]
- Tjallingii, S. Ecopolis—Strategies for Ecologically Sound Urban Development; Backhuys Publishers: Kerkwerve, The Netherlands, 1995. [Google Scholar]
- Keeffe, G. Synergetic City: Urban algae production as a regenerative tool for a post-industrial city. In Proceedings of the IFHP 09, Berlin, Germany, 7–9 May 2009. [Google Scholar]
- Golf Course Superintendents Association of America (GCSAA). Golf Course Environmental Profile—Growing Awareness about the Environmental Impact of Golf Courses; Phase 2 Energy Use Survey Results Now. 2017. Available online: https://www.gcsaa.org/environment/golf-course-environmental-profile (accessed on 5 April 2018).
- De Jong, T.M.; van der Voordt, D.J.M. (Eds.) Ways to Study and Research—Urban, Architectural and Technological Design; Delft University Press: Delft, The Netherlands, 2002. [Google Scholar]
- Martin, C.L.; van den Dobbelsteen, A.; Keeffe, G. The Societal Impact Methodology—Connecting Citizens, Sustainability Awareness, Technological Interventions & Co-creative City Visions. In Proceedings of the International Conference on Passive and Low Energy, Edinburgh, UK, 3–5 July 2017; Volume II, pp. 2791–2798. [Google Scholar]
Figure 1.
City-zen Road mapping scheme, from the present to the desired future state, taking into account future scenarios and using a catalogue of measures and book of inspiration.
Figure 1.
City-zen Road mapping scheme, from the present to the desired future state, taking into account future scenarios and using a catalogue of measures and book of inspiration.
Figure 2.
Organisational schedule of the City-zen Roadshow, starting with input from the SWAT Studio at left and with the resulting City Vision at right (scheme by Craig Lee Martin, TU Delft).
Figure 2.
Organisational schedule of the City-zen Roadshow, starting with input from the SWAT Studio at left and with the resulting City Vision at right (scheme by Craig Lee Martin, TU Delft).
Figure 3.
Gruž (the area depicted in yellow) and its estimated forestland grabbing (in 25-hectare square blocks) with details on emission sources: electricity (blue); waste (brown); mobility (purple); water (cyan) (image by Riccardo Pulselli, University of Siena).
Figure 3.
Gruž (the area depicted in yellow) and its estimated forestland grabbing (in 25-hectare square blocks) with details on emission sources: electricity (blue); waste (brown); mobility (purple); water (cyan) (image by Riccardo Pulselli, University of Siena).
Figure 4.
Climate chart for Dubrovnik, with precipitation in green bars, and minimum, average and maximum temperatures represented by the blue, pink and red line [
20], respectively.
Figure 4.
Climate chart for Dubrovnik, with precipitation in green bars, and minimum, average and maximum temperatures represented by the blue, pink and red line [
20], respectively.
Figure 5.
Metabolism urban energy scheme, including steps to transition to a more sustainable system, as part of the Energy Master Plan (adaptation of [
25]).
Figure 5.
Metabolism urban energy scheme, including steps to transition to a more sustainable system, as part of the Energy Master Plan (adaptation of [
25]).
Figure 6.
Creating cooling breezes via thermal drafts from the harbour during the day and mountain drafts at night (images by Andy van den Dobbelsteen and QUB students).
Figure 6.
Creating cooling breezes via thermal drafts from the harbour during the day and mountain drafts at night (images by Andy van den Dobbelsteen and QUB students).
Figure 7.
Energy renovation by post-insulation and PV (photovoltaic) facades (left) or algae facades (right) (images by Andy van den Dobbelsteen and QUB students0.
Figure 7.
Energy renovation by post-insulation and PV (photovoltaic) facades (left) or algae facades (right) (images by Andy van den Dobbelsteen and QUB students0.
Figure 8.
An impression of algae arrays for waste water treatment for cruise ships [
29].
Figure 8.
An impression of algae arrays for waste water treatment for cruise ships [
29].
Figure 9.
Wind turbines on the golf course green (image by QUB students).
Figure 9.
Wind turbines on the golf course green (image by QUB students).
Figure 10.
New cross-section of a combined pedestrian-bicycle-tramway track on the cliff stretch between Gruž and Dubrovnik city centre, where at present cars and diesel buses are dominant (drawing by Han Vandevyvere, EnergyVille).
Figure 10.
New cross-section of a combined pedestrian-bicycle-tramway track on the cliff stretch between Gruž and Dubrovnik city centre, where at present cars and diesel buses are dominant (drawing by Han Vandevyvere, EnergyVille).
Table 1.
Emission factors used for the carbon accounting and main references (overview by Riccardo Pulselli, University of Siena).
Table 1.
Emission factors used for the carbon accounting and main references (overview by Riccardo Pulselli, University of Siena).
| Emission Factors | EF | Unit | References |
|---|
| Electricity grid | 0.341 | kg CO2eq/kWhe | This study |
| Car driving (diesel) | 0.169 | kg CO2eq/km | IPCC2006 |
| Waste to energy | 0.652 | kg CO2eq/kg | IPCC Waste model |
| Organic to compost | 0.091 | kg CO2eq/kg | IPCC Waste model |
| Landfill | 1.160 | kg CO2eq/kg | IPCC Waste model |
| Water management | 0.585 | kg CO2eq/m3 | IPCC2006 |
Table 2.
Emission factor of electricity in Croatia, based on the national electricity grid mix (overview by Riccardo Pulselli, University of Siena).
Table 2.
Emission factor of electricity in Croatia, based on the national electricity grid mix (overview by Riccardo Pulselli, University of Siena).
| Croatia | LCA-Based EF | Data | | GHG Emission | Notes |
|---|
| | kg CO2eq/kWh | kWh | % | kt CO2eq/a | References |
| General Data | | | | | |
| Electricity demand | - | 1.75 × 10¹⁰ | 100.0 | - | |
| Electricity production | - | 1.36 × 10¹⁰ | 77.4 | - | |
| Import | 0.712 | 3.95 × 10⁹ | 22.6 | 2.81 × 10⁹ | [19] Table 8. Various generators/turbine types |
| Thermo-electricity | | 3.50 × 10⁹ | 20.0 | 3.03 × 10⁹ | |
| Natural gas | 0.443 | 1.00 × 10⁹ | 5.7 | 4.44 × 10⁸ | [19] Table 8. Various combined cycle turbines |
| Petroleum products | 0.778 | 1.29 × 10⁸ | 0.7 | 1.00 × 10⁸ | [19] Table 8. Various generators/turbine types |
| Coal | 1.050 | 2.37 × 10⁹ | 13.5 | 2.49 × 10⁹ | [19] Table 8. Various generator types |
| Renewables | | 1.01 × 10¹⁰ | 57.4 | 1.23 × 10⁸ | |
| Solar PV | 0.032 | 3.50 × 10⁷ | 0.2 | 1.12 × 10⁶ | [19] Table 8. 80 MW, parabolic trough |
| Wind | 0.010 | 7.30 × 10⁸ | 4.2 | 7.30 × 10⁶ | [19] Table 8. 1.5 MW, onshore, 10 g CO2-eq/kWh |
| Hydro | 0.012 | 9.13 × 10⁹ | 52.1 | 1.10 × 10⁸ | [19] Table 8. 3.1 MW, reservoir, 10 g CO2-eq/kWh; 300 kW, river run-off, 13 g CO2/kWh |
| Biomass | 0.028 | 1.65 × 10⁸ | 0.9 | 4.62 × 10⁶ | [19] Table 8. Short rotation forestry steam turbine |
| Total | 0.341 | 1.75 × 10¹⁰ | 100.0 | 5.97 × 10⁹ | |
Table 3.
Carbon footprint of a typical household and the Gruž neighbourhood (8000 inhabitants; 2900 households) (overview by Riccardo Pulselli, University of Siena).
Table 3.
Carbon footprint of a typical household and the Gruž neighbourhood (8000 inhabitants; 2900 households) (overview by Riccardo Pulselli, University of Siena).
| Carbon Footprint (State of the Art) | Gruž Household | Gruž Neighbourhood |
|---|
| Emission Sources | Unit/a | Raw Data | % | kg CO2eq | % | Raw Data | t CO2eq | % |
| Electricity | kWhe | 7930 | 100 | 2703 | 47.4 | 22,997,000 | 7839 | 47.4 |
| Lighting + appliances | kWhe | 2450 | 31 | 835 | 14.6 | 7,105,000 | 2422 | 14.6 |
| Cooling | kWhe | 1850 | 23 | 631 | 11.1 | 5,365,000 | 1829 | 11.1 |
| Cooking | kWhe | 520 | 7 | 177 | 3.1 | 1,508,000 | 514 | 3.1 |
| Water heating | kWhe | 2210 | 28 | 753 | 13.2 | 6,409,000 | 2185 | 13.2 |
| Heating | kWhe | 900 | 11 | 307 | 5.4 | 2,610,000 | 890 | 5.4 |
| Mobility | km | 6600 | - | 1113 | 19.5 | 19,140,000 | 3227 | 19.5 |
| Private car use | km | 6600 | 100 | 1113 | 19.5 | 19,140,000 | 3227 | 19.5 |
| Waste | kg | 1670.35 | 90 | 1726 | 30.3 | 4,359,614 | 5005 | 30.3 |
| % waste-to-energy | kg | 0.00 | 0 | 0 | 0.0 | 0 | 0 | 0.0 |
| % organic | kg | 16.70 | 1 | 2 | 0.0 | 48,440 | 4 | 0.0 |
| % landfill | kg | 1486.61 | 89 | 1724 | 30.2 | 4,311,173 | 5001 | 30.2 |
| Water | m3 | 280 | - | 164 | .9 | 811,696 | 475 | 2.9 |
| m3 per annum (house) | m3 | 279.90 | 100 | 164 | 2.9 | 811,696 | 475 | 2.9 |
| Carbon uptake | ha | 0.00 | 100 | 0 | 0.0 | 0 | 0 | 0.0 |
| Total | | | | 5706 | 100 | | 16,546 | 100 |
Table 4.
Carbon footprint mitigation measures (long-term scenario) from the state of the art to the carbon-neutral neighbourhood (Riccardo Pulselli, University of Siena).
Table 4.
Carbon footprint mitigation measures (long-term scenario) from the state of the art to the carbon-neutral neighbourhood (Riccardo Pulselli, University of Siena).
| | Measure | Electricity | Cooling | Heating | Mobility | Waste | Carbon Uptake | CF | Notes |
|---|
| | | | | | | | | t CO2eq/a | |
| | Single household | | | | | | | 5.706 | Based on the typical household profiling |
| | | MWh/a | MWh/a | MWh/a | 103 km/a | t/a | ha | t CO2eq/a | |
| | State of the Art Gruž | | | | | | | 16,546 | Referring to 8000 inhabitants and 2900 households |
| 1 | Building greenery + shading | −563 | −563 | | | | | −192 | Estimated households involved: 70%; estimated cooling energy saving: −15% |
| 2 | Heat pumps | −2424 | −858 | −1566 | | | | −826 | Estimated households involved: 80%; cooling energy saving: −20%; heating energy saving: −75% (CoP = 4) |
| 3 | Building envelope insulation | −1588 | −805 | −783 | | | | −541 | Estimated households involved: 50%; cooling energy saving: −30%; heating energy saving: −60% |
| 4 | Solar PV + solar thermal | −4300 | | | | | | −1466 | Based on the real estimate of solar energy potential in Gruž (available surface of roofs and well-oriented walls) |
| 5 | Mini wind turbines | −350 | | | | | | −111 | Based on the real estimate of wind energy potential in the neighbourhood (very small, for 50 mini-wind turbines) |
| 6 | Public transport increase | | | | −11,484 | | | −1936 | Estimated 60% avoided private car use |
| 7 | Transition to electric mobility | 1421 | | | −7656 | | | −806 | Estimated 40% fully electrified private cars or bikes with an increase of electricity demand of 1.4 GWh/a |
| 8 | Wind turbine (up to 7 MWh) | −14,948 | | | | | | −5095 | Estimated 12 towers with 1 MW turbine each |
| 9 | Avoid waste to landfill | | | | | −3880 | | −4499 | Estimated differentiated fractions: waste-to-energy: 20%; organic waste-to-compost: 40%; recycling: 30%; landfill 10% |
| 10 | Carbon uptake by urban forestry | | | | | | 67 | −905 | Estimated area needed to compensate the remaining emission (mainly due to waste and water management) |
© 2018 by the authors. Licensee MDPI, Basel, Switzerland. This article is an open access article distributed under the terms and conditions of the Creative Commons Attribution (CC BY) license (http://creativecommons.org/licenses/by/4.0/).

 ,
, 


