Article

Transformation towards a Renewable Energy System in Brazil and Mexico—Technological and Structural Options for Latin America

German Aerospace Center (DLR), Institute of Engineering Thermodynamics, Department of Systems Analysis and Technology Assessment, Pfaffenwaldring 38–40, 70569 Stuttgart, Germany
*
Author to whom correspondence should be addressed.
Energies 2018, 11(4), 907; https://doi.org/10.3390/en11040907
Submission received: 24 February 2018 / Revised: 4 April 2018 / Accepted: 4 April 2018 / Published: 12 April 2018
(This article belongs to the Special Issue Sustainable and Renewable Energy Systems)

Abstract

:
Newly industrialized countries face major challenges to comply with the Paris Treaty targets as economic growth and prosperity lead to increasing energy demand. Our paper analyses technological and structural options in terms of energy efficiency and renewable energies for a massive reduction of energy-related CO2 emissions in Latin America. Brazil and Mexico share similar growth prospects but differ significantly with respect to renewable energy potentials. We identify, how this leads to different transformation pathways. By applying an energy system balancing model we develop normative energy system transformation scenarios across the heating, power, and mobility sectors, including their potential interactions. The normative scenarios rely on three basic strategies for both countries: (1) strong exploitation of efficiency potentials; (2) tapping the renewable energy potentials; and (3) sector coupling and electrification of heat supply and transport. Despite economic growth, significant CO2 emission reductions could be achieved in Brazil from 440 Gt/a (2.2 t/cap) in 2012 to 0.4 Gt (2 kg/cap) in 2050 and in Mexico from 400 Gt/a (3.3 t/cap) to 80 Gt (0.5 t/cap). Our study shows the gap between existing policy and scenarios and our strategies, which provide an economically feasible way to comply with the Paris treaty targets.

1. Introduction

According to the Intergovernmental Panel on Climate Change (IPCC), only a reduction of total greenhouse gases (GHG) by 70–95% will increase the probability to keep global warming below the target of 1.5 °C by over 50% [1,2]. As the energy sector is responsible for more than 78% of total CO2 emissions between 1970 and 2010 [3], decarbonizing the global energy system is one major challenge. Expansion of renewable energy technologies is one key strategy towards this goal [4,5,6,7]. While climate action needs a global focus, a global decarbonisation requires a joint effort of all major energy consuming countries.
Investment cycles in the energy system require equally long analysis perspectives. Energy scenarios do just that by analyzing long term transformation pathways, e.g., on a global level by the International Energy Agency (IEA) annual World Energy Outlook, e.g., Reference [8] and their Energy Technology perspectives [9]. Both report series highlight that policy efforts need to be intensified to meet the emission reduction targets. Even their most ambitious scenarios are still largely based on fossil fuels; the projected 15–20 Gt of CO2 emissions remaining in 2040–2050 are a reduction of 35–50% compared to 2010. However, several studies indicate, that a predominantly renewable energy supply is feasible, and can curb global CO2 emissions in line with the United Nations emission targets [10,11,12,13,14].
In contrast to this global approach, energy policy is mainly shaped on a national level. Tangible measures and targets need to be broken down to the level of decision makers. Newly industrialized countries will have a specific role in energy transition. While the hunger for energy—with growing population and economy—is a challenge in itself, the necessary expansion of energy supply provides a chance for renewable energy technologies at the beginning of the investment cycles. This paper focuses on Brazil and Mexico, the two largest newly industrialized countries in Latin America. Brazil is Latin America’s largest country: with 208 Mio inhabitants Brazil globally ranks 5th in population and 9th in gross domestic product (GDP) [15,16], with a final energy demand of 9.5 EJ in 2015 [17]. Mexico ranks 11th in global population, with 127 Mio inhabitants and 15th in GDP [15,16] consuming 5.0 EJ of final energy in 2015 [18]. Both countries expect a strong growth in population, GDP and consequently in energy demand; the IEA calculates a 45% increase in final energy demand for Brazil by 2040 under current policy conditions [17]. This is a tremendous challenge for reducing CO2 emissions.
Various studies focus on the short or midterm perspective of the energy system globally [19] or in Latin America [20,21,22] providing insights for immediate energy policy. However, they lack a long term outlook to create a climate effective strategy for a low carbon energy system. So far, country specific analyses for Latin America mainly address the power sector [23]. Interdependencies between technologies and sectors—e.g., power demand of electric vehicles are mostly not included. Furthermore, only few studies have targeted a 100% renewable energy system. Existing studies focus on European countries [7,24,25,26,27,28] or on a global level [14,29]. However a cross-sectoral approach is vital in a predominantly renewable energy system, where electricity is essential for supplying renewable heat and renewable transport, which in turn can stabilize large shares of fluctuating power.
We address these research gaps in our paper, presenting transformation pathways towards a predominantly renewable energy system on country level through the following research questions: How can national energy systems transform into decarbonized, low risk and economically compatible ones? Which technological and structural options in terms of energy efficiency and renewable energies are available in Latin American countries up to 2050? How will the transformation pathways differ between Brazil and Mexico, reflecting local conditions in terms of climate and renewable energy potentials?
We are adding a long-term outlook until 2050 on the complete energy system, including the interdependencies between power, heat and transport sectors. Our scenarios show, what is technologically and economically feasible under differing geographical and socio-economic conditions. Brazil and Mexico are especially suitable for a comparison: First, both countries represent typical Latin American trends, such as strong and growing urbanization [30], high demand for electrification and a strong increase in CO2 emissions per capita [20,31]. Second, Latin America offers a high overall potential of renewable energies [32] (see also Section 2.3.3).
Third, both countries represent a very broad range of geographical conditions (affecting renewable energy potentials): A tropical, humid climate in Brazil with intermediate solar potential contrasts the sunny, dry climate with high irradiation in the north of Mexico. Last, both countries provide very different starting points for an energy system transformation: Mexico features a predominantly fossil based energy system. More than 90% of the demand was supplied by fossil or nuclear fuels. Mexico owns large oil and gas resources—oil is the most important energy source (52%), with gas accounting for another 32% [33]. Renewable energy supply is low, hydro supplying 10% of the country’s electricity and biomass 15% of its heat demand, mainly in traditional applications. Transport is almost entirely fossil fueled. In Brazil hydro supplied 75% of power, while bioenergy served for 44% of heat demand and 15% of fuel demand [8]. All these conditions will influence strategies for a predominantly renewable energy supply.
After introducing the scope of our paper, the next section gives an overview of renewable energy prospects for both countries. We introduce our modeling and scenario approach in Section 2, including the relevant input parameters and data. Section 3 presents our modeling results, describing transformation pathways for both countries on a sector level and discusses efficiency improvements as well as different ranges of the renewable energy development in both countries. We discuss the results in Section 4 and conclude with an outlook on relevant strategies for newly industrialized countries to mitigate CO2 emissions from the energy sector.

1.1. Prospects for Renewable Energy in Mexico and Brazil

Mexico: After the COP21 conference, Mexico proposed to reduce its GHG emissions by 25% and 50% until 2030 and 2050, respectively, both compared to the value in 2000 [34]. The country has recognized the potential and importance of an expansion of renewable energies: A detailed overview of their current status and energy policy such as the Law for the Use of Renewable Energy is provided in [35]. Several studies demonstrate significant potential of photovoltaics (PV) [36] or wind [37,38] and the feasibility and viability of a renewable power supply [6,39,40,41]. In contrast other end use sectors are only rarely analyzed yet, e.g., transport from an air pollution perspective [42].
A cross-sectoral perspective has rarely been targeted up to now, e.g., for biomass [43], which could provide up to 2 EJ by 2030. The World Bank shows, that decarbonisation of electricity supply based on wind, biomass, geothermal and hydro power is cost efficient [41]. Combined with efficiency measures 200 Mt CO2 equivalents (eq) could be avoided by 2030. Research and policy action for renewable energy has significantly increased in the last ten years [35,44,45]. By now, renewable energy plays an important role in the midterm energy strategy increasing the renewable share to 46% by 2035, mainly from wind and PV [44,46,47].
Brazil: As one of the global leaders in renewable energy development, Brazil ranks 2nd in hydropower capacity and biofuel production and 5th in solar heat capacity, with hydro and biomass being the backbone of the energy system. However, during the last years the hydro based power sector faced a crisis, also due to its vulnerability to droughts [48]; here climate change provides additional challenges [49]. This resulted in an expansion of “new” or “non-conventional” renewables and thermal capacity.
Various renewable technologies have good prospects in the Brazilian energy system in the next decade [48] and across a series of scenarios [50]. Biomass is a key resource in the Brazilian energy system, accounting for 30% or primary energy in 2014 [51]. As a biomass pioneer, research has particularly addressed biofuels and the large scale use of sugar cane residues since the 1970s [52,53,54,55]: Bioethanol for transport has been strongly developed and is now competitive. Recent research is focusing on environmental and social impacts of biofuel production and use [4,56,57,58,59,60]. While these broad and deep insights in biofuels identify good prospects for biofuels in Brazil, they lack integration with the overall energy system.
Large potentials of cost efficient wind and photovoltaic (PV) [61,62,63,64,65] exist for the power sector, as well as for Concentrated Solar Power (CSP) [66]. Wind is expected to deliver up to 10% of power supply by 2020 [67,68]. CSP is seen as a dispatchable and climate friendly power source e.g., with large potential particularly in the north east of Brazil [66,69,70,71,72,73]. Besides, recent studies suggest that the current hydro based power system can balance high shares of fluctuating renewables, without increasing demand for fossil back up power plants [48,74,75,76].
A variety of scenario studies explored scenarios across the whole Brazilian energy sector up to 2030 [50,77] or even 2050 [32,78,79]. Often, these studies apply optimization models featuring a forecasting approach and assessing emission mitigation perspectives. Even though several studies explore a 100% renewable power sector, none of the studies completely phases out fossil resources for heat and transport. In most of these explorative studies, the energy system fails to reduce GHG emissions to a level well below 1990’s level. Only scenarios targeting a CO2 limit and including carbon capture and storage (CCS) technologies—a technology whose sustainability is still under debate [80,81]—manage to fully abate CO2 emissions.
Brazil has already developed a broad portfolio of policy measures accelerating the development of “new” renewable energies across the power, heat and transport sectors [82]. Starting in 2004 with the PROFINA program [83,84], Brazil’s government has developed specific midterm energy planning until 2030 [85], including efficiency development but still a doubling of oil and gas consumption as well as an increase in coal and biomass/biofuels. More recently, the Brazilian government updated the energy plans until 2050 [86] which expects a strong increase in demand. Prospects of renewables changed significantly, projecting a transition towards electric and biofuel vehicle fleet and 20% of buildings equipped with solar collectors. The plan includes over 100 GW of PV installations, 5 GW of distributed biomethane and 650 TJ of solid biomass by 2050.
Still, the political agenda lacks a cross-sectoral and midcentury perspective, acknowledging interdependencies between heat, transport and power sectors, and connecting it to the targeted emission reduction. All the above mentioned studies focus on very detailed insights in either sector or technology field and lack in the overarching long-term concepts for the integrated renewable energy system. However, their detailed insights provide an important input into our cross-sectoral strategies targeting a predominantly renewable energy system in 2050.

1.2. Objective

Most of the above mentioned scenario studies call for higher CO2 mitigation and stronger climate policy in order to achieve the globally necessary reduction targets. None of the described studies either for Mexico or Brazil considers extensive transformation towards a predominantly renewable energy system, which could, in contrast to the above mentioned efforts, reduce CO2 emissions of the energy system significantly below the 1990 starting value. Even though some of the above mentioned studies on the power sector already suggest a potential for a 100% renewable power sector in Brazil, all scenarios still rely on a significant share of fossil power production and neglect the advantages of integrating the power, heat and transport sectors. The analysis of previous research clearly shows that an additional approach is necessary to tackle the decarbonisation of the energy system.
Explorative scenarios are driven but also constrained by cost minimizing objective functions. Therefore normative scenarios are required to better understand the transformation potentials of energy system. Assessing targets for the future energy system and developing the transformation backwards (back-casting) helps to identify challenges and needs along the transformation pathway. Normative scenarios as employed here are not a prognosis but visions of what is feasible; a combination of explorative and normative scenario approaches is complementary and addresses different objectives [87]. Our study complements the explorative forecasting scenarios with a normative perspective (see Section 2.2) on what is necessary to achieve the targeted reduction of CO2 emissions, both in Brazil and Mexico.

2. Materials and Methods

Our study relies on an energy system simulation model for developing normative scenarios for the future energy system up to 2050. Both countries’ simulations are based on the same modeling structure, applying country specific data.

2.1. Energy System Simulation Model

Brazil’s and Mexico’s national energy systems are represented within the energy simulation model PlaNet, part of the energy and environmental planning package Mesap [88]. PlaNet provides a bottom up accounting framework for the calculation of energy system balances from demand to primary energy supply. Drivers of energy consumption such as GDP and population are externally defined for the simulation. Demand for energy services such as useful heat for space heat and processes, electricity demand and transport services are determined via intensities (e.g., electricity consumption per person, industrial heat demand per GDP). The model disaggregates final energy demand into sectors (Figure 1): Industry, transport and residential & services etc. Furthermore, the conversion sector is taken into account, including power supply, district heat and fuel production. A set of energy technologies represents each sector, disaggregated by fuel input—e.g., coal, gas, oil, and biomass burners for heat generation in the industry sector. Sectoral integration is addressed via Combined Heat and Power production (CHP), electric heating, power-to-fuels technologies, and electric mobility.
The model calculates annual energy flows for a set of energy carriers. The energy flows are connected via technologies with a set of linear equations. By sequentially solving the equation system, the model is balancing demand and supply on annual basis in five-year steps until 2050. Thus overall primary energy is calculated as the sum of useful energy, disaggregated by market shares of each technology multiplied with the specific efficiency of a technology in each sector and in turn multiplied with the efficiency of the transformation technology of each fuel type as described in the following equations:
T F D ( s , t )   =   s S t T ( s ) U E D ( s ) M S ( s ,   t ) ( t )
T P E ( f )   =   f F F E D ( f ) ( t t )
where
  • TFD = total final energy demand
  • s = a specific energy sector
  • t = a specific technology of a sector,
  • MS = market share of a technology in a sector,
  • UED = total useful energy demand of a sector,
  • η = efficiency of a technology.
  • TPE = total primary energy demand of a country
  • f = fuel type
  • tt = transformation technology
Backbone of the model is a technology database for power, heating and mobility technologies, which are summarized in Figure 1. Technology datasets contain efficiencies, fuel input and corresponding emission factors as well as allocation factors (e.g., heat-to-power ratios for combined heat and power production). A full set of these parameters for each country can be found in the Supplementary Material (S1).
Additionally the database includes full load hours and investment & operation cost for the calculation of capacities and power generation costs, which are described in the data Section 2.3. However costs for additional infrastructure such as storage or grid extension are not considered in the model. The datasets are based on previous long term scenario development on national level [89] as well as on international level [90,91,92]. Technology and cost parameters are adapted to Brazil and Mexican conditions according to Section 2.3.4. Model outputs are final and primary energy demand distinguished by resource, sector and/or field of application, CO2 emissions and levelized cost of electricity (LCOE).
For Brazil, the power sector was separately modeled and validated by coupling the simulation model to the power optimization tool REMix (for details of the methodology see [28,93]). The REMix model for Brazil was adapted from previous studies [72,94]. For our study it was applied in a one year optimization run for the target year 2050. Details on the optimization results are presented in [95]. This validation ensures that all power demand is supplied sufficiently at 8760 h in 2050, considering historic load and weather data. For Mexico no REMix application was available. We therefore applied a capacity factor approach, matching peak load with secured capacity at the same level as today. Capacity factors are based on statistical values from [96]: wind 24%, PV 10%, hydro 37%, nuclear 73%, all others 50%.

2.2. Scenario Approach

We develop normative scenarios for the future energy system of both countries, applying the Mesap model. We combine current trends and developments in Brazil and Mexico with future targets and renewable energy potentials, to identify necessary and plausible investments to achieve emission reduction.
First we define targets for the national future energy system in 2050. We translate the global reduction target of 70–95% GHG emissions [1] to 10 Gt/a by 2050, of which we allocate a maximum of 5 Gt/a of CO2 to the global energy system [2,5,11,97]. This converts to less than 0.6 t/cap of CO2 per year from the energy sector for a global population of 9.55 Bill. cap in 2050 [15]. We set this as the upper limit for the normative scenarios in Mexico and Brazil in 2050.
Next, we identify available projections of future energy demand development under business-as-usual conditions for the scenario period until 2050. These trends serve as a Reference scenario for demand development (REF). We then develop an Energy [R]evolution scenario (E[R]) assuming major changes in the energy system and policy. To achieve the CO2 target, the E[R] envisages the expansion of renewable energy technologies and the exploitation of the large efficiency potential [14]. At the same time nuclear power is phased out due to sustainability concerns.
Starting from the target of 0.6 t/cap of CO2 per year in 2050 we identify by back-casting, how the various energy sectors need to transform towards a predominantly renewable energy system. Efficiency potentials in all sectors are based on currently available best practice technology. Additionally the installation of new renewable technologies respects the limitations of the sustainable potential of each resource, specifically with respect to land use, biomass consumption and large hydro power plants. The Energy [R]evolution scenarios address the feasibility of technological solutions. Thus, the general drivers of energy demand—population and GDP growth—remain unchanged from the REF scenario.
Our heuristic approach integrates detailed information from other national and international studies as well as expert knowledge on restrictions such as the expected technical development, national renewable energy potentials and potentials for the deployment of district heat, efficiency potentials etc. The Energy [R]evolution scenarios represent technically feasible and in itself consistent pathways for the energy system, covering a time range from 2012 (starting year) to 2050 with snapshots for every decade. Our scenarios aim at a modeling exercise according to standards of transparency and replicability as proposed by [98]. Thus we provide transparency for model, assumptions and premises above and in the Supplementary Material. The input data is presented in the next section and the full output is included in the Supplementary Material.

2.3. Input Data and Premises

We develop a detailed input data set for each country, considering efficiency potentials, renewable energy potentials, and technical parameters for power, heat and fuel generation technologies in the energy systems. For each country the model was calibrated against the national energy balance: For the years 2007, 2009, 2010 and 2012, the model parameters were adapted so that final and primary energy demand for each fuel type in each sector match the values in the energy balance by adapting the market shares of primary fuel and energy sources as well as efficiencies in the transformation sector [99,100].

2.3.1. Projection of Final Energy Demand in the REF Scenario Based on Key Drivers

Final energy demand in the REF scenarios is mainly based on the Current Policy Scenario of the World Energy Outlook (WEO) [30], where population growth and economic development are key drivers for energy demand modeling [5,101]. This scenario extrapolates the effect of existing international energy and environmental policies into the future until 2040 on regional level in a business-as-usual approach, but does not take into account any additional policies, incentives or measures to improve energy efficiency or the deployment of renewable energies. For Brazil, the WEO provides a specific national Current Policy Scenario. We adapted the energy demand for our REF energy demand according to a more recent national projection for GDP as presented in [102]. For Mexico, the WEO scenario for the OECD Americas without USA was disaggregated to Mexico, Canada and Chile, using projections of population development data [103], GDP [104] and statistics on national energy demand and supply [105]. We extended the scenarios to 2050 along the trends for GDP and population, similar to [14].
Population is projected according to the medium variant of the World Population Prospects [103] (Table 1), with 227 Mio cap in Brazil and 148 Mio cap in Mexico by 2050. Table 1 also includes projections for economic growth. Since 1999, each 1% increase in global GDP has been accompanied by a 0.6% increase in primary energy consumption until 2012 [30]. GDP on country level for Mexico is based on regional growth rates from the WEO for OECD North America [30] and extensions to 2050 by [14]. For Brazil the GDP development was adapted according to estimations from national experts and national banks [102,106]. For comparison reasons, all data on economic development refers to purchasing power adjusted GDP (PPP) (compare [30]).

2.3.2. Efficiency Potentials in the Energy [R]evolution Scenario

Decoupling GHG emissions from economic growth is a major target for a more sustainable energy pathway. Up to now a slight decoupling has occurred in the Latin America: A decrease in carbon footprint by 11% is reported by [107], while GDP increased by 3% in the last decade. On global level, IEA just recently announced the second year of decoupling of GDP and GHG in a row [108]. One major measure to achieve this decoupling is the implementation of available efficiency potentials. For Brazil a detailed assessment of efficiency potentials by 2030 and 2050 is provided for the Energy [R]evolution scenario by [106], calculating technical efficiency potentials for major industries and the residential sector under the assumption of current state of the art technology.
The Mexican scenario was not accompanied by a specific efficiency assessment study. Thus efficiency assumptions rely on technical efficiency potentials for OECD North America for the global Energy [R]evolution Scenario 2010 [12]. Details about assumptions for energy efficiency improvement in industries and others can be found in [109]. For the Mexican scenario, we implement 80% of these technical efficiency potentials by 2050.
Both approaches result in similar efficiency potentials (Table 2) for the main sectors of the model. For both countries, those efficiency potentials were gradually implemented from 2020 on.
Identification of efficiency potentials in the transport sector requires a different approach: besides the significant potential for technical development of individual propulsion technologies, future energy demand is largely dependent on the modal split and the share of “new” propulsion technologies such as battery electric vehicles (BEV) or H2 fuel cell vehicles. For Brazil, the future development pathway is based on a specific assessment from [110]. This bottom up study projects future demand in transport service, in person km for passengers and ton km for freight and assesses potential shifts towards more efficient transport modes such as busses and trains. Next, efficiency potentials for existing transport technologies are implemented and the potential introduction of new vehicle types, such as electric vehicles and hydrogen buses is estimated. The resulting fuel demand for each transport mode is used in the Energy [R]evolution Scenario.
For Mexico modal shifts and efficiency improvements rely on a similar study on car technologies and fleet scenarios for the complete transport sector of OCED North America, developed within [11]. Both described studies consider a major shift towards electric mobility especially for passenger cars as well as a shift towards more efficient transport modes, without reducing overall transport service. However, strategies and results for transport and energy supply differ considerably as described in the results section.

2.3.3. Renewable Energy Potential

Available potentials limit the expansion of renewable energy within the energy system. We assessed the potential of wind and solar resources for power generation by applying an extensive global renewable potential database [111]. The data base provides full load hours-potential-curves for on- and offshore wind, photovoltaics and concentrating solar power at a high geographical resolution. While these full load hours are securely available today, this data potentially underestimates the future power production from variable renewables. For example capacity factors of ground-mounted PV can be significantly improved by tracking systems, potentially reducing the specific power generation costs. The extension of PV generation to the morning and evening hours could also reduce the need for storage. Still we stick to this comparatively conservative approach to avoid overestimation.
Variability for biomass potential assessments is specifically high, depending on sustainability limits. For comparability, we rely on global studies for national biomass potential which include both countries. While [112] conservatively calculate biomass residue potentials of at least 7200 PJ/a for Brazil and 400 PJ/a for Mexico, [113] calculate 11,690 PJ of biofuel potential for Brazil and 1100 PJ for Mexico in a medium case. Additional assessments for Brazil accounted for 600 Mio t of dry matter of biomass [114] (equal to 9600 PJ primary energy), or calculate potentials for power from bioenergy between 13–27 GW [53,115]. For Mexico, national studies calculated an energy potential of 1200–1400 PJ/a [40,116]. Table 3 gives an overview of the applied limits for renewable energy potentials.
Large hydro applications face serious objections with regard to sustainability, specifically with regard to land use and relocation of population and emissions [6,117,118]. Therefore, the extension of hydro power especially in Brazil is limited to facilities currently under construction, as derived from [95].

2.3.4. Technology and Cost Assumptions

The input data of both fossil and renewable energy technologies is based on the regional data for OECD Americas and Latin America from the latest global Energy [R]evolution scenario 2015 [14]. Efficiency assumptions and full load hours for the current power system are derived from the respective national energy balance (Ref. [51] for Brazil, Ref. [99] for Mexico). National emission factors for fossil technologies are calibrated with data from [119]. Future technology and cost development for fossil and renewable power and CHP plants is based on [14] and adapted for Brazil according to [102]. For comparability the same investment costs were applied for Mexico. Table 4 gives an overview over the applied investment costs. Discount rates were set to 6%.
Fossil fuel prices (Table 5) are also based on the WEO 2014 Current Policy scenario [30], extended to 2050 by own assumptions. As there is no world market for natural gas, prices for US were adopted for Mexico and Brazil. Biomass costs are derived from a cost potential curve from [19], representing cheaper costs for Brazil at high availability and in contrast higher costs for Mexico at lower availability.
These input data on drivers, technologies and costs provide the background for the energy system simulation. Its results are presented in the following section.

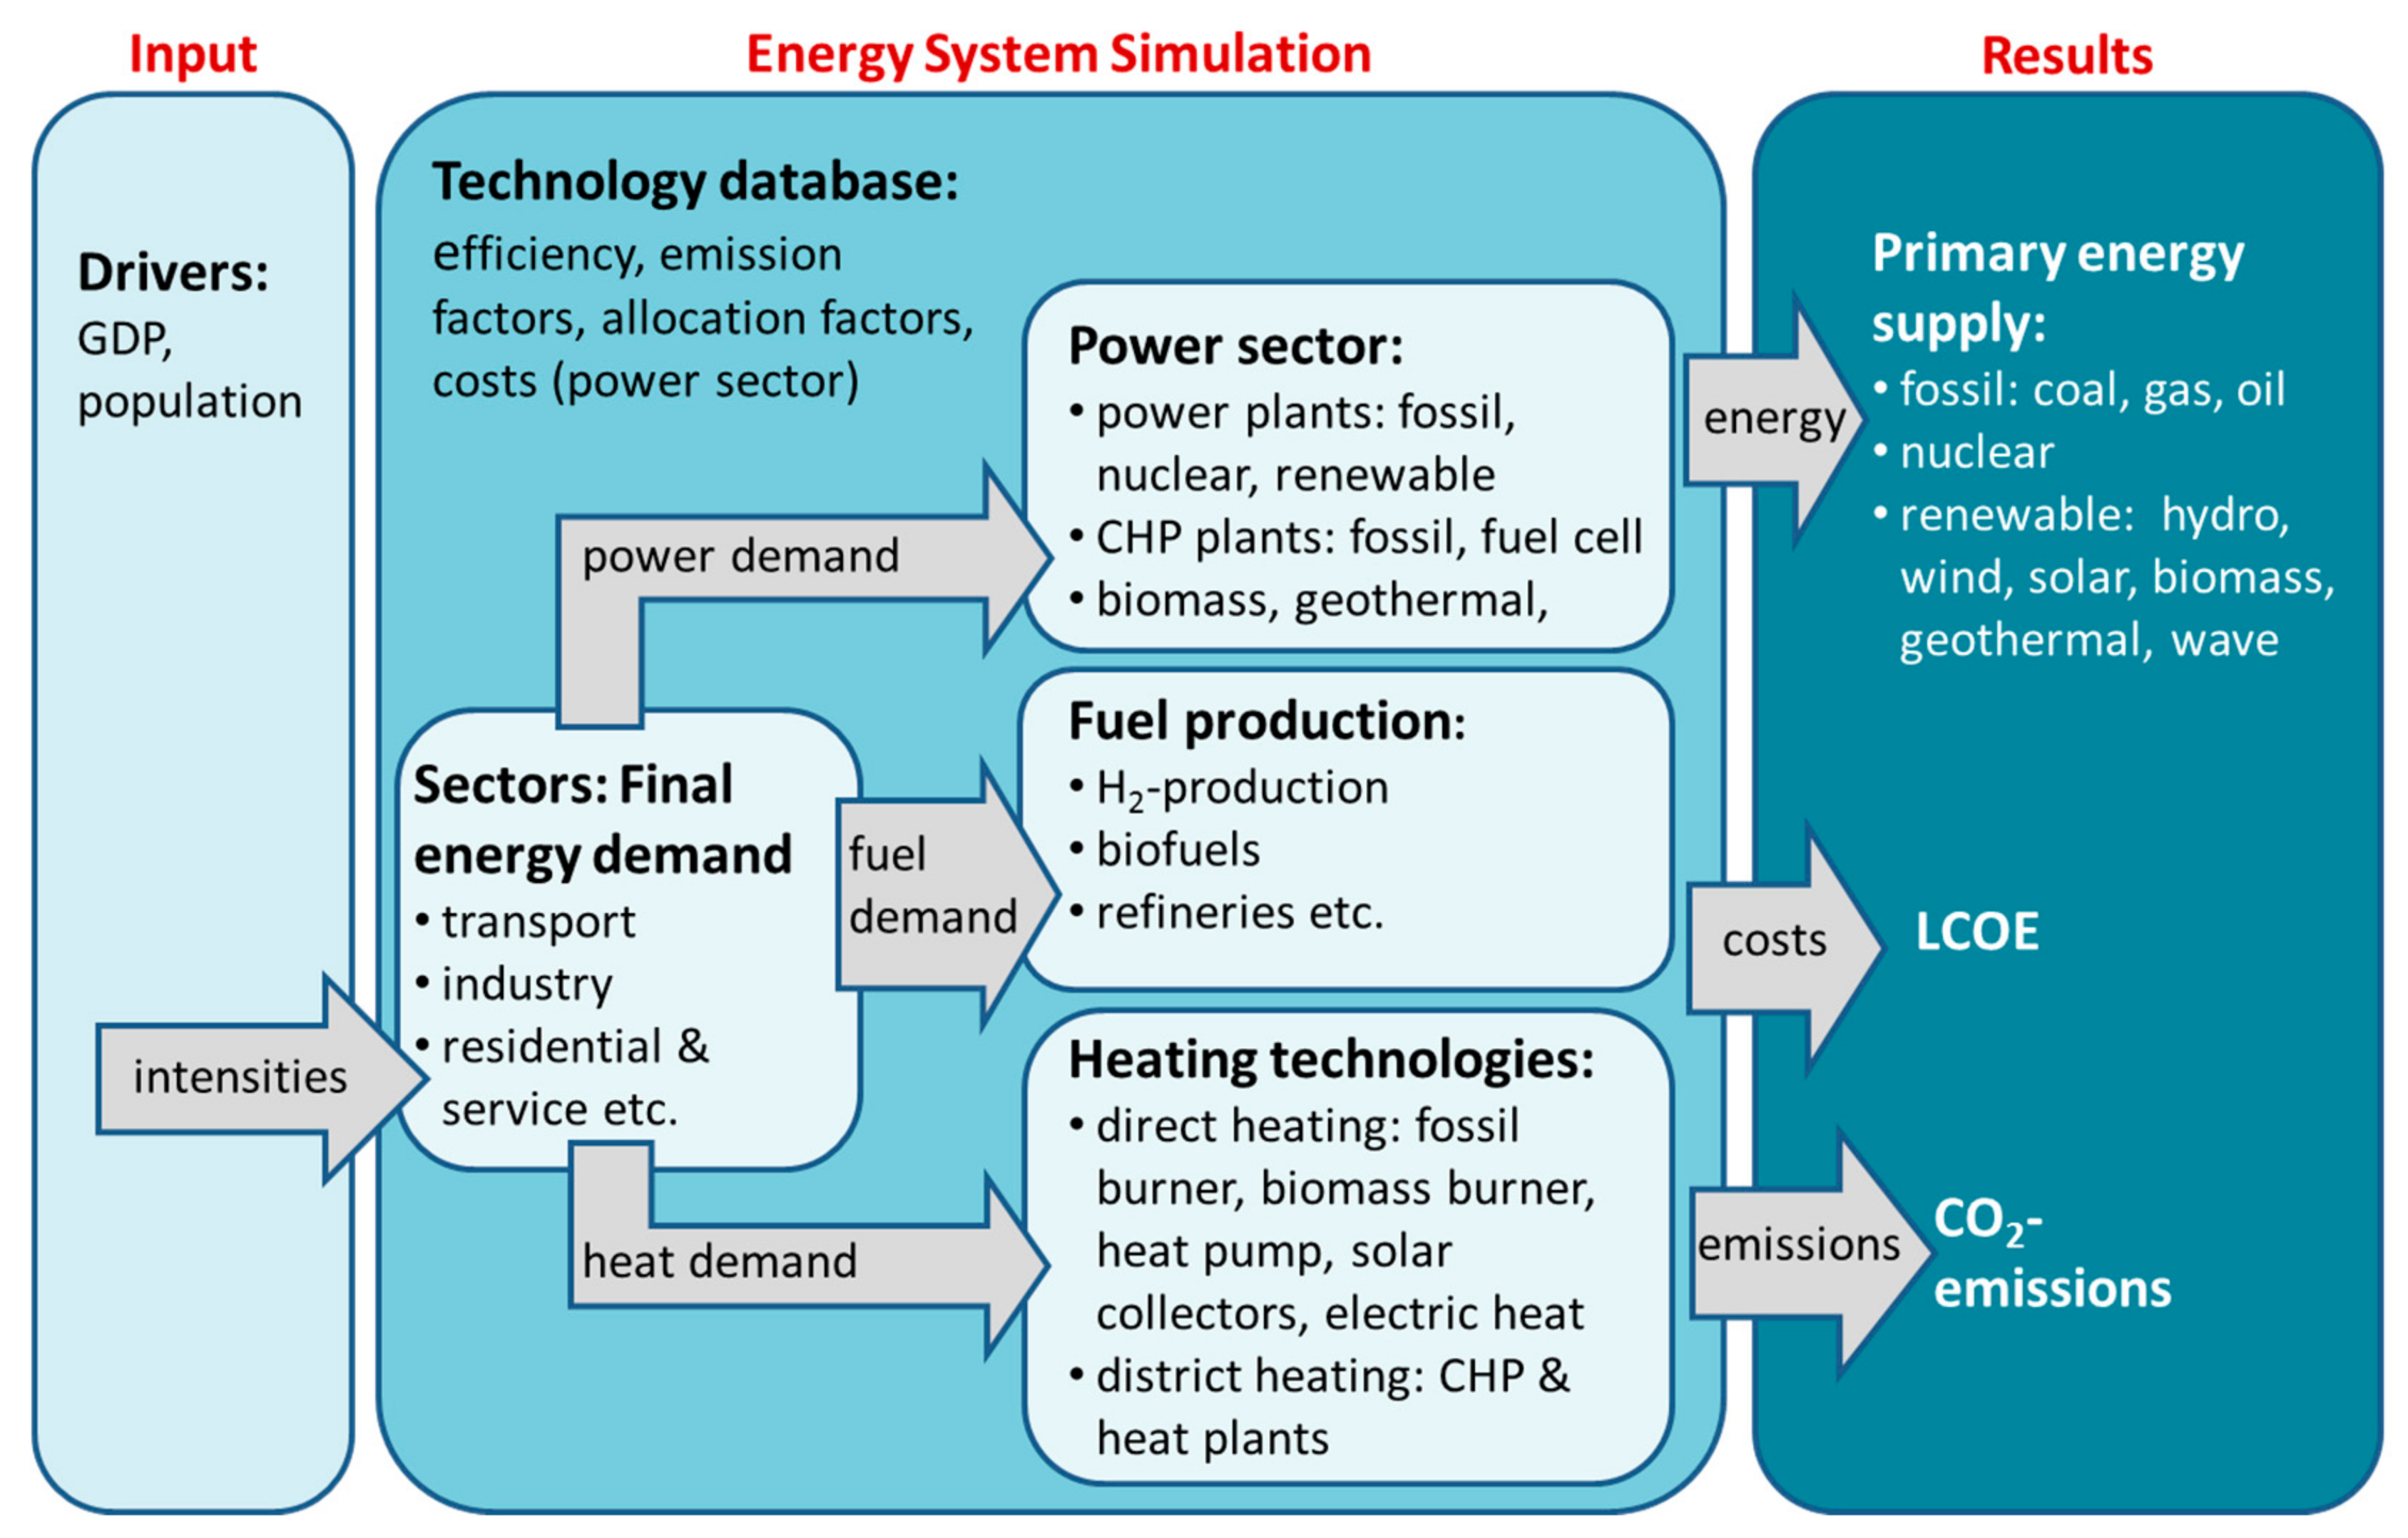
3. Results and Discussion

First, we identify effects of efficiency measures, which serve as a precondition for developing the demand pathway. Next, we provide an overview of the transformation of the supply structure across the heating, transport and power sectors, followed by the assessment of the primary energy supply. Finally, we give an outlook on CO2 emissions and the levelized costs of electricity (LCOE) resulting from such a renewable energy system. A complete overview over the modeling output for all scenario years is presented in the Supplementary Material (S2).

3.1. Energy Efficiency

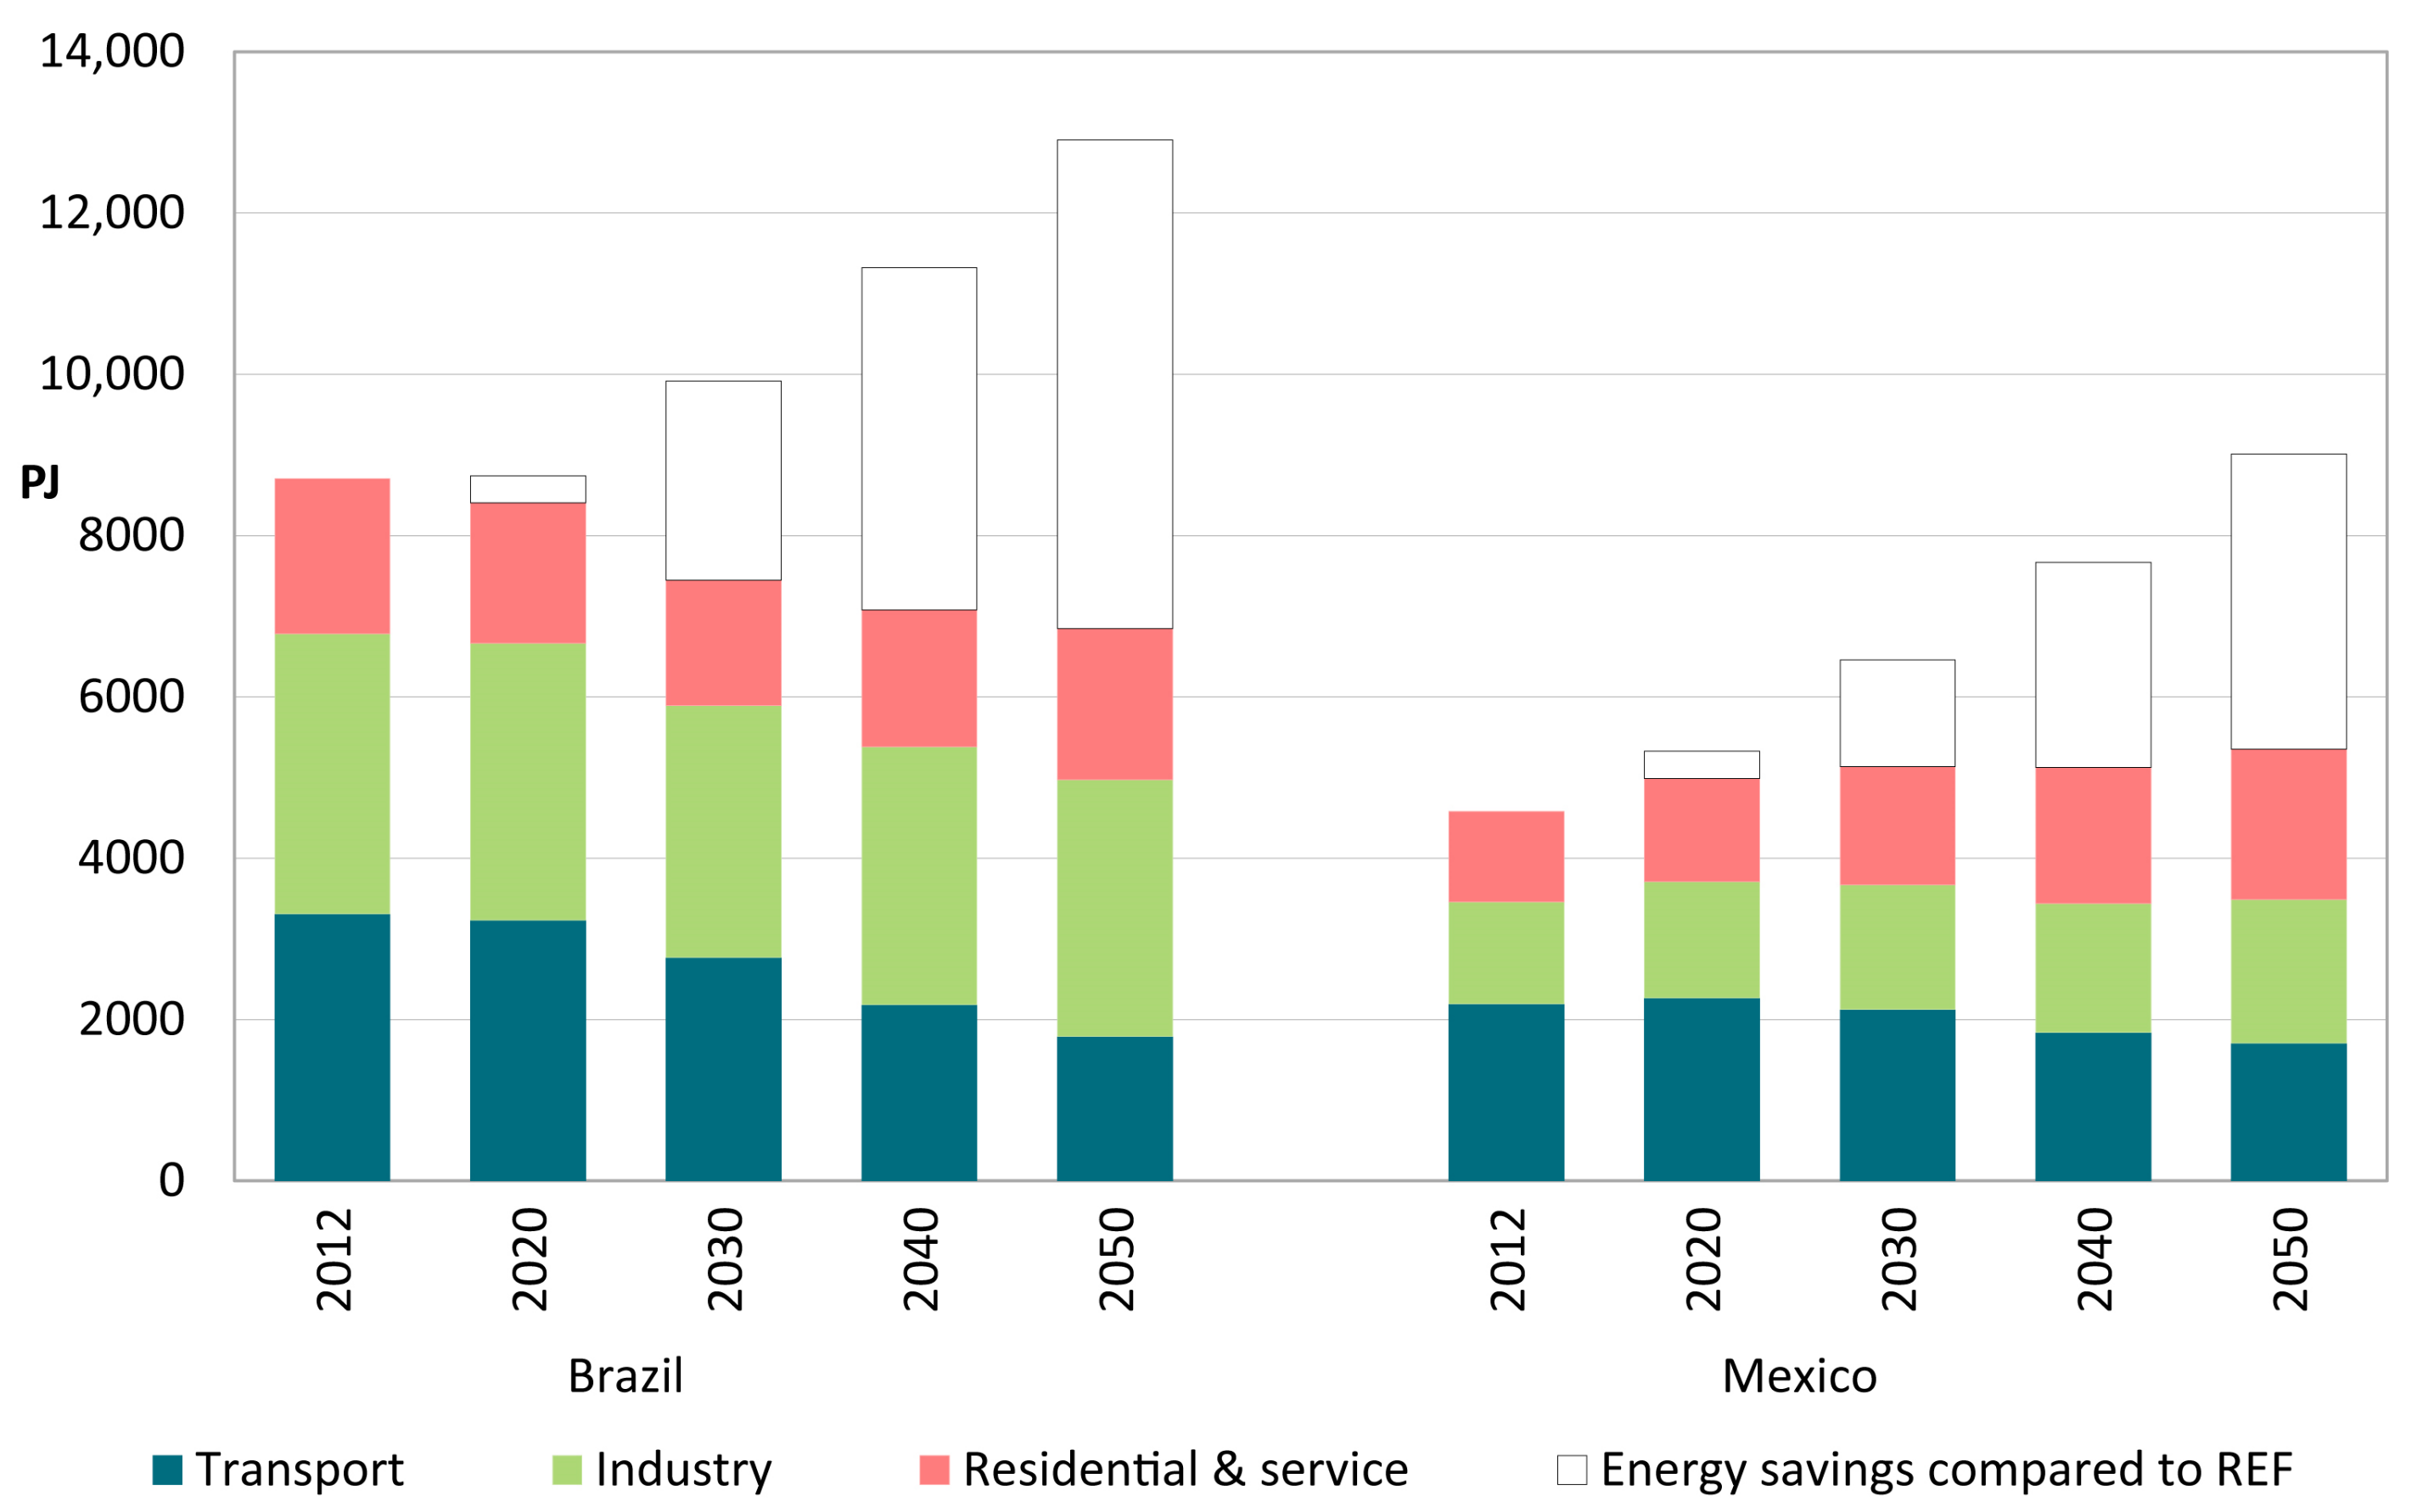
Population and economic development differ considerably between both countries across the scenario period, leading to a slower demand growth in the REF scenario in Brazil compared with Mexico. Additionally, in Brazil, final energy demand remains rather stable until 2020 (Figure 2), reflecting the current economic crisis and a low GDP growth projection. In contrast, final energy consumption in Mexico increases continuously in the REF scenario. The energy efficiency measures in the Energy [R]evolution scenario result in a substantial reduction in energy demand in both countries on a different level. Efficiency potentials from the specific Brazilian study result in a strong demand reduction (−21% compared to 2012). In Mexico, in contrast, the effects of economic growth and an increased population on energy demand outweigh energy savings from efficiency. Final energy consumption in Mexico increases by 17% between 2012 and 2050.
The allocation of demand between the various sectors also reflects the different economic development in both countries (Figure 2). Today, Brazil’s industry sector represents 40% of the final energy demand, followed by transport (38%), while in Mexico transport demand (48%) exceeds industrial demand (28%) by far. Residential and commerce start with the smallest share in final energy consumption in both countries, which increases over the scenario period.
One reason for the currently low share of the residential and commerce sector in total final energy consumption is the warm climate, with limits space heating demand: In tropical Brazil the residential & service sectors consume 5 GJ/cap of fuels in 2012. Mexico’s more varying climate leads to only a slightly higher demand at 6 GJ/cap. In contrast, fuel demand in this sector in the US accounts for 31 GJ/cap (own calculations based on [105]). The gradually increasing demand shares in residential & service reflect the expected increase in living standards, starting from rather low levels in large parts of rural Brazil and Mexico. In particular in developing countries and newly industrialized countries, the increase in prosperity might counteract efficiency gains. This results in in an increasing energy demand despite of technical efficiency improvements.
Even though the input studies on efficiency potentials apply a similar approach, the effects on the resulting final energy consumption differ largely between the countries. While the Mexico Energy [R]evolution scenario shows a similar demand reduction in each sector, Brazil sees specifically high demand reductions in transport. This implies that even though both studies address efficiency in technical potentials, these potentials still are largely dependent on social, economic and political aspects, such as appliance exchange rates. For example effects of GDP growth on appliance life time and turn over or rebound effects are not accounted for, leaving a large range of uncertainty for the efficiency potentials. Implementing these energy efficiency measures is an essential pillar of a sustainable energy supply. Limiting future growth of energy consumption even in newly industrialized countries, without limiting economic development is a precondition for a successful transition towards a mainly renewable energy supply system.
For both countries the transport sector can realize the highest energy savings compared to the start year. However it must be noted that the electrification of power trains—a main factor for reducing energy demand—mainly shifts transformation losses towards the power supply sector and thus from final to primary energy, as long as power supply is dominated by combustion power plants of fuels, as is currently the case in Mexico. Transport electrification therefore needs to be accompanied by increased efficiency in power plants and an increasing renewable power supply to realize energy savings also on the primary energy level.
This is also valid for the heat sector. Today, residential heating in Brazil and Mexico mostly relies on traditional biomass (defined as basic technologies used to cook or heat with solid by IEA [30]). A transition to modern biomass appliances (e.g., biogas and CHP) in the residential sector increases efficiency. At the same time, this measure tackles other sustainability risks such as indoor pollution and health problems as well as deforestation [120]. Additionally renewable electrification provides opportunities for efficiency improvements, e.g., replacing fuel demand for cooking and other process heat by wind and solar power.
Table 6 shows results for the final energy demand for heat and transport, the power demand as well as the effect of the electrification strategy on power demand for heat and transport in the Energy [R]evolution scenario. While there is only a moderate increase in heat supply, power supply sees an over proportional increase in demand. This is the combined effect of increasing demand for energy services, efficiency increases and electrification of heat and transport.
In Brazil power demand doubles over the scenario period, while in Mexico it even triples. Electricity for heat and transport accounts for more than ¼ of total electricity demand in 2050 in each country.

3.2. Energy Supply by Sector in the Energy [R]evolution Scenario
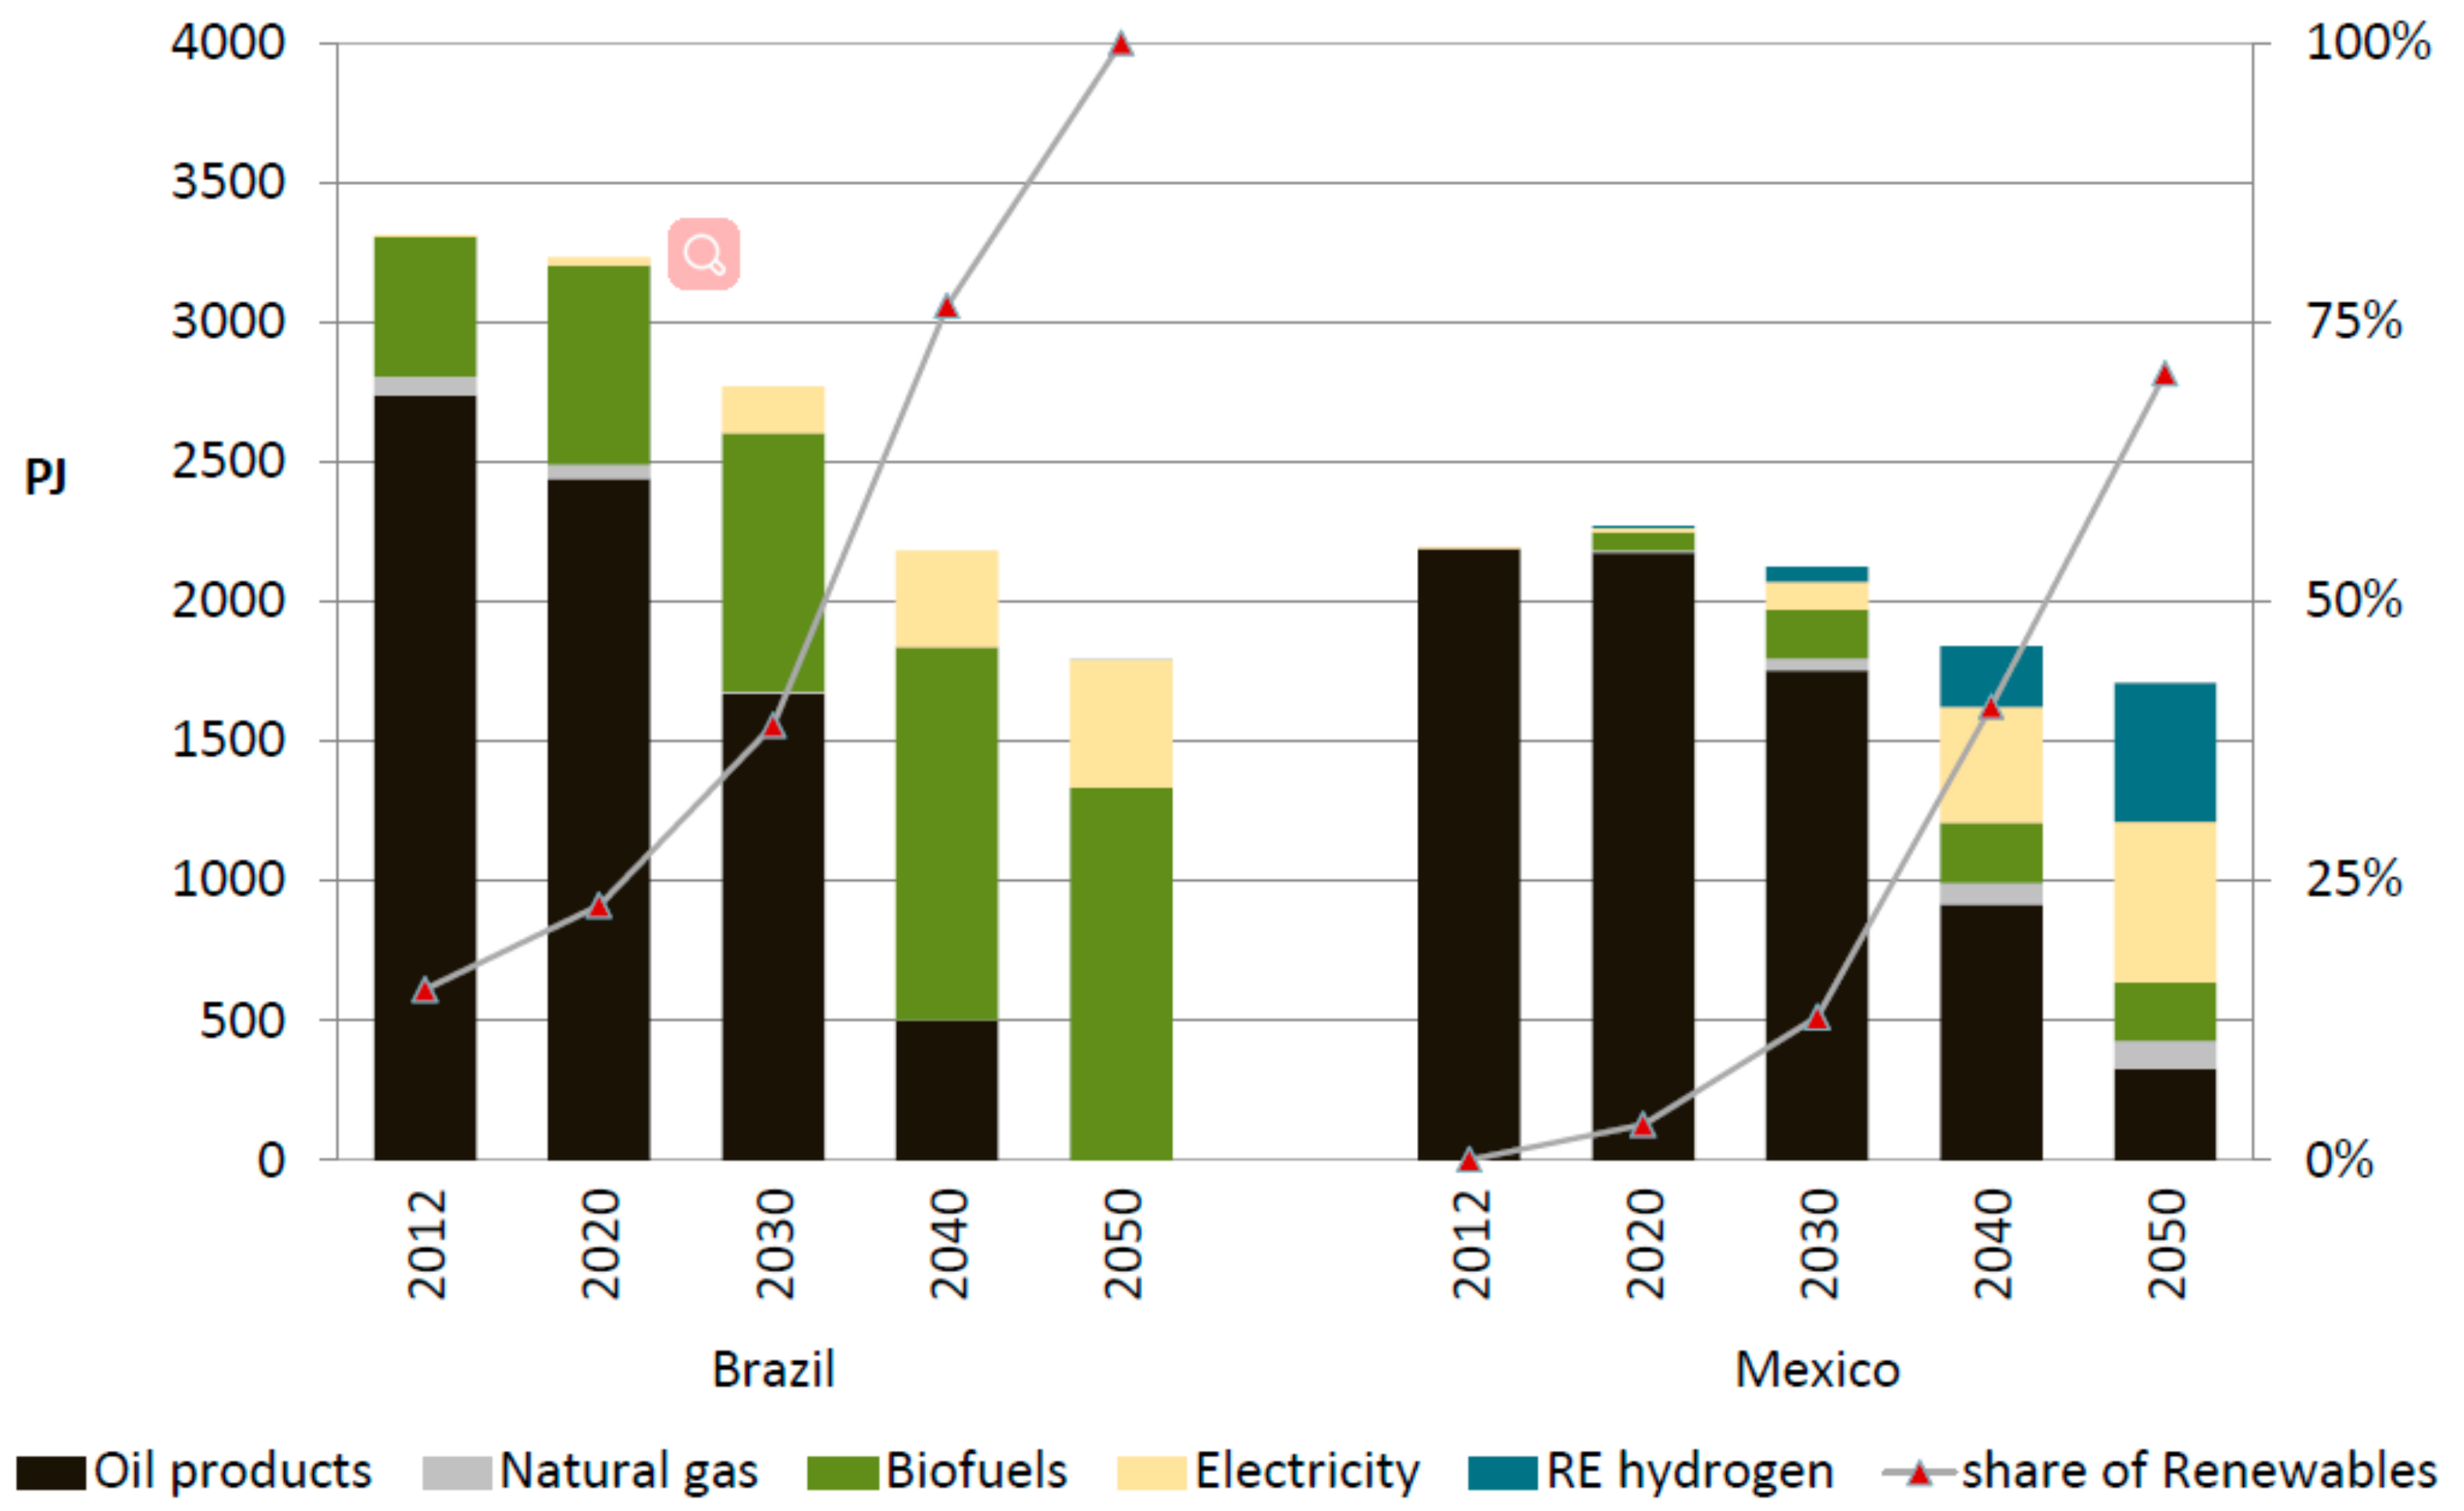
3.2.1. Transport

The modal split and technology shares of energy demand for transport in the Energy [R]evolution scenario vary significantly between Brazil and Mexico. This is mainly due to the different initial conditions and the significantly different supply strategy in each country. As can be seen in Table 7, the Brazilian scenario includes a limited expansion of aviation, shifting transport demand to other long distance travel modes such as trains. As Brazil is world leader in ethanol cars, biofuels are regarded as a main strategy for the decarbonisation of future transport in Brazil.
Brazil has an extraordinarily large biomass potential at competitive prices that supplies 15% of transport fuels already today. In the scenario, it predominantly extends the biofuel share to 75% in 2050 (Figure 3). Due to rather low incomes in Brazil, the potential of electric vehicles is limited, mainly to hybrid drives. Thus, the Energy [R]evolution scenario relies on a massive expansion of biofuel use in this country.
In contrast, Mexico lacks the biomass potentials required to adopt such a strategy. As a consequence, Mexico’s Energy [R]evolution scenario applies a different decarbonisation strategy for the transport sector, based on electrification: In 2050, individual road transport is dominated by battery electric vehicles (BEV) and electric range extender cars. Especially for heavy duty vehicles hydrogen fuel cells play a major role in 2050. This will be supported by the massive investments in the Bus Rapid Transport systems already on the way [107]. With higher incomes in Mexico broader introduction of electro-mobility in private cars also appears to be more feasible.
The electrification of the transport system increasingly couples transport and power sectors. This on the one hand leads to additional burdens for the power sector, which needs to provide additional capacity; however, strategic charging of electric vehicles provides benefits for the integration of variable renewable energies, especially at renewable shares above 85% [121].
This holds also true for hydrogen production. In the long run, direct electricity use needs to be supplemented by hydrogen from renewable sources to achieve a predominantly renewable transport supply because battery capacities limit the deployment of BEV for long-range heavy duty freight transport. Figure 3 shows that biomass alone can only provide a moderate 12% share in the transport sector in Mexico, if biomass consumption is balanced between demand sectors. Mexico therefore needs to apply a broader diversification of transport technologies than Brazil, if transport is supposed to meet the CO2 reduction targets.

3.2.2. Heat Supply

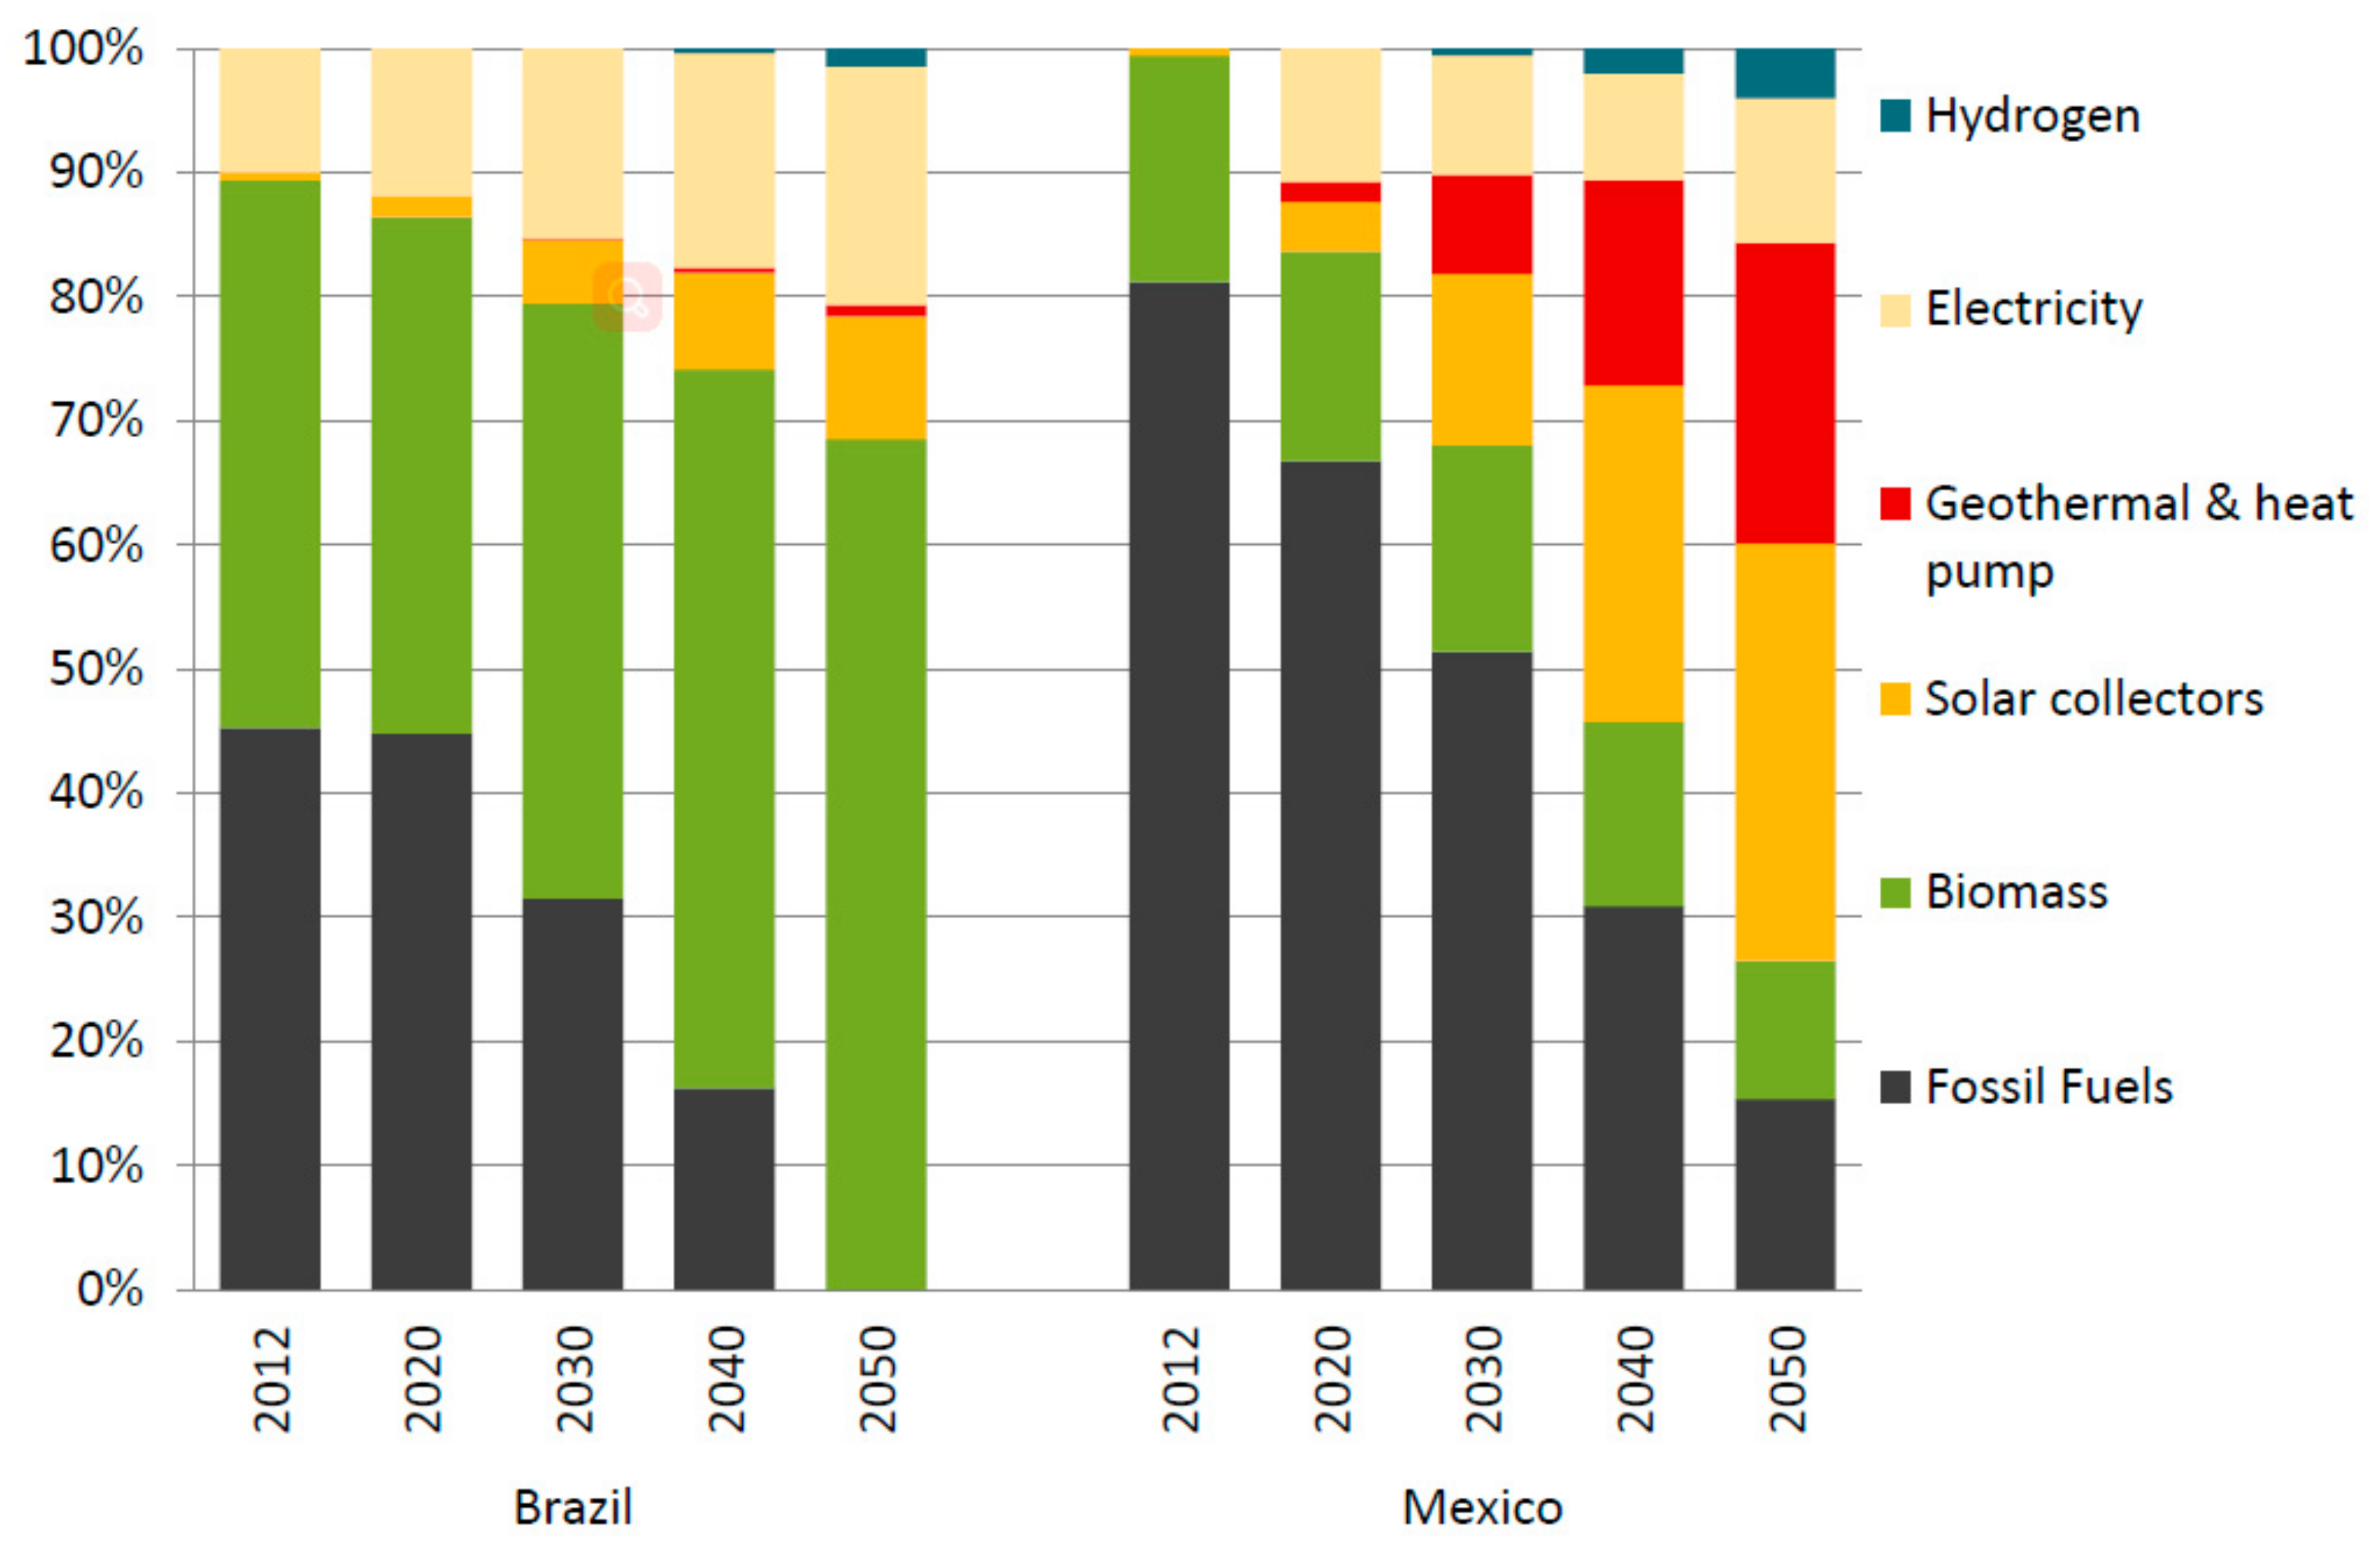
Biomass is the main renewable source in the heat sector today (Figure 4). With a shift from inefficient traditional biomass use towards modern biomass technologies, less biomass could provide more useful energy in the future. It can supply even high temperature process heat, e.g., via anaerobic digestion to biogas or gasification. This is specifically important for industry sectors such as glass and ceramics production, cement and lime production, and iron and steel production where up to 90% of process heat demand requires temperatures above 500 °C [122,123].
Each country scenario features a different biomass and heat strategy. Biomass is already the main heat source in Brazil, covering 44% of the heat supply in 2012. With a shift towards modern heat technologies it will still remain the backbone, complemented by electricity and solar collectors mainly in the residential & service sectors.
Strict limitations of biomass, also due to food competition concerns lead to a rather different strategy in the Mexican heat supply. Large solar potentials at high levels of irradiation may lead to solar as a main heat source in Mexico. Concentrating solar collectors can even supply medium to high temperatures for process heat [124]. Thus, solar collectors provide 35% of total heat in the Energy [R]evolution scenario, followed by geothermal energy and electric heat (including heat pumps), which provide an additional 31%. Overall, this strategy achieves an 85% renewable heat supply by 2050.
Electricity increasingly plays a role in the heat sector, both for low temperature heat e.g., via heat pumps as well as for high temperature heat demand as for process heat. Heat pumps can also be applied for upgrading waste heat, enhancing efficiency. Additionally this intensified coupling with the power sector helps balancing variable renewable power sources, e.g., via heat storage. Additionally even higher electricity shares may be debatable, considering the abundance of renewable power sources in both countries. Perspectives for power to heat (e.g., via heat pumps or direct heating including heat storage) might change with the increasing supply of fluctuating renewable power, as currently is the case in Germany [125].

3.2.3. Power Supply

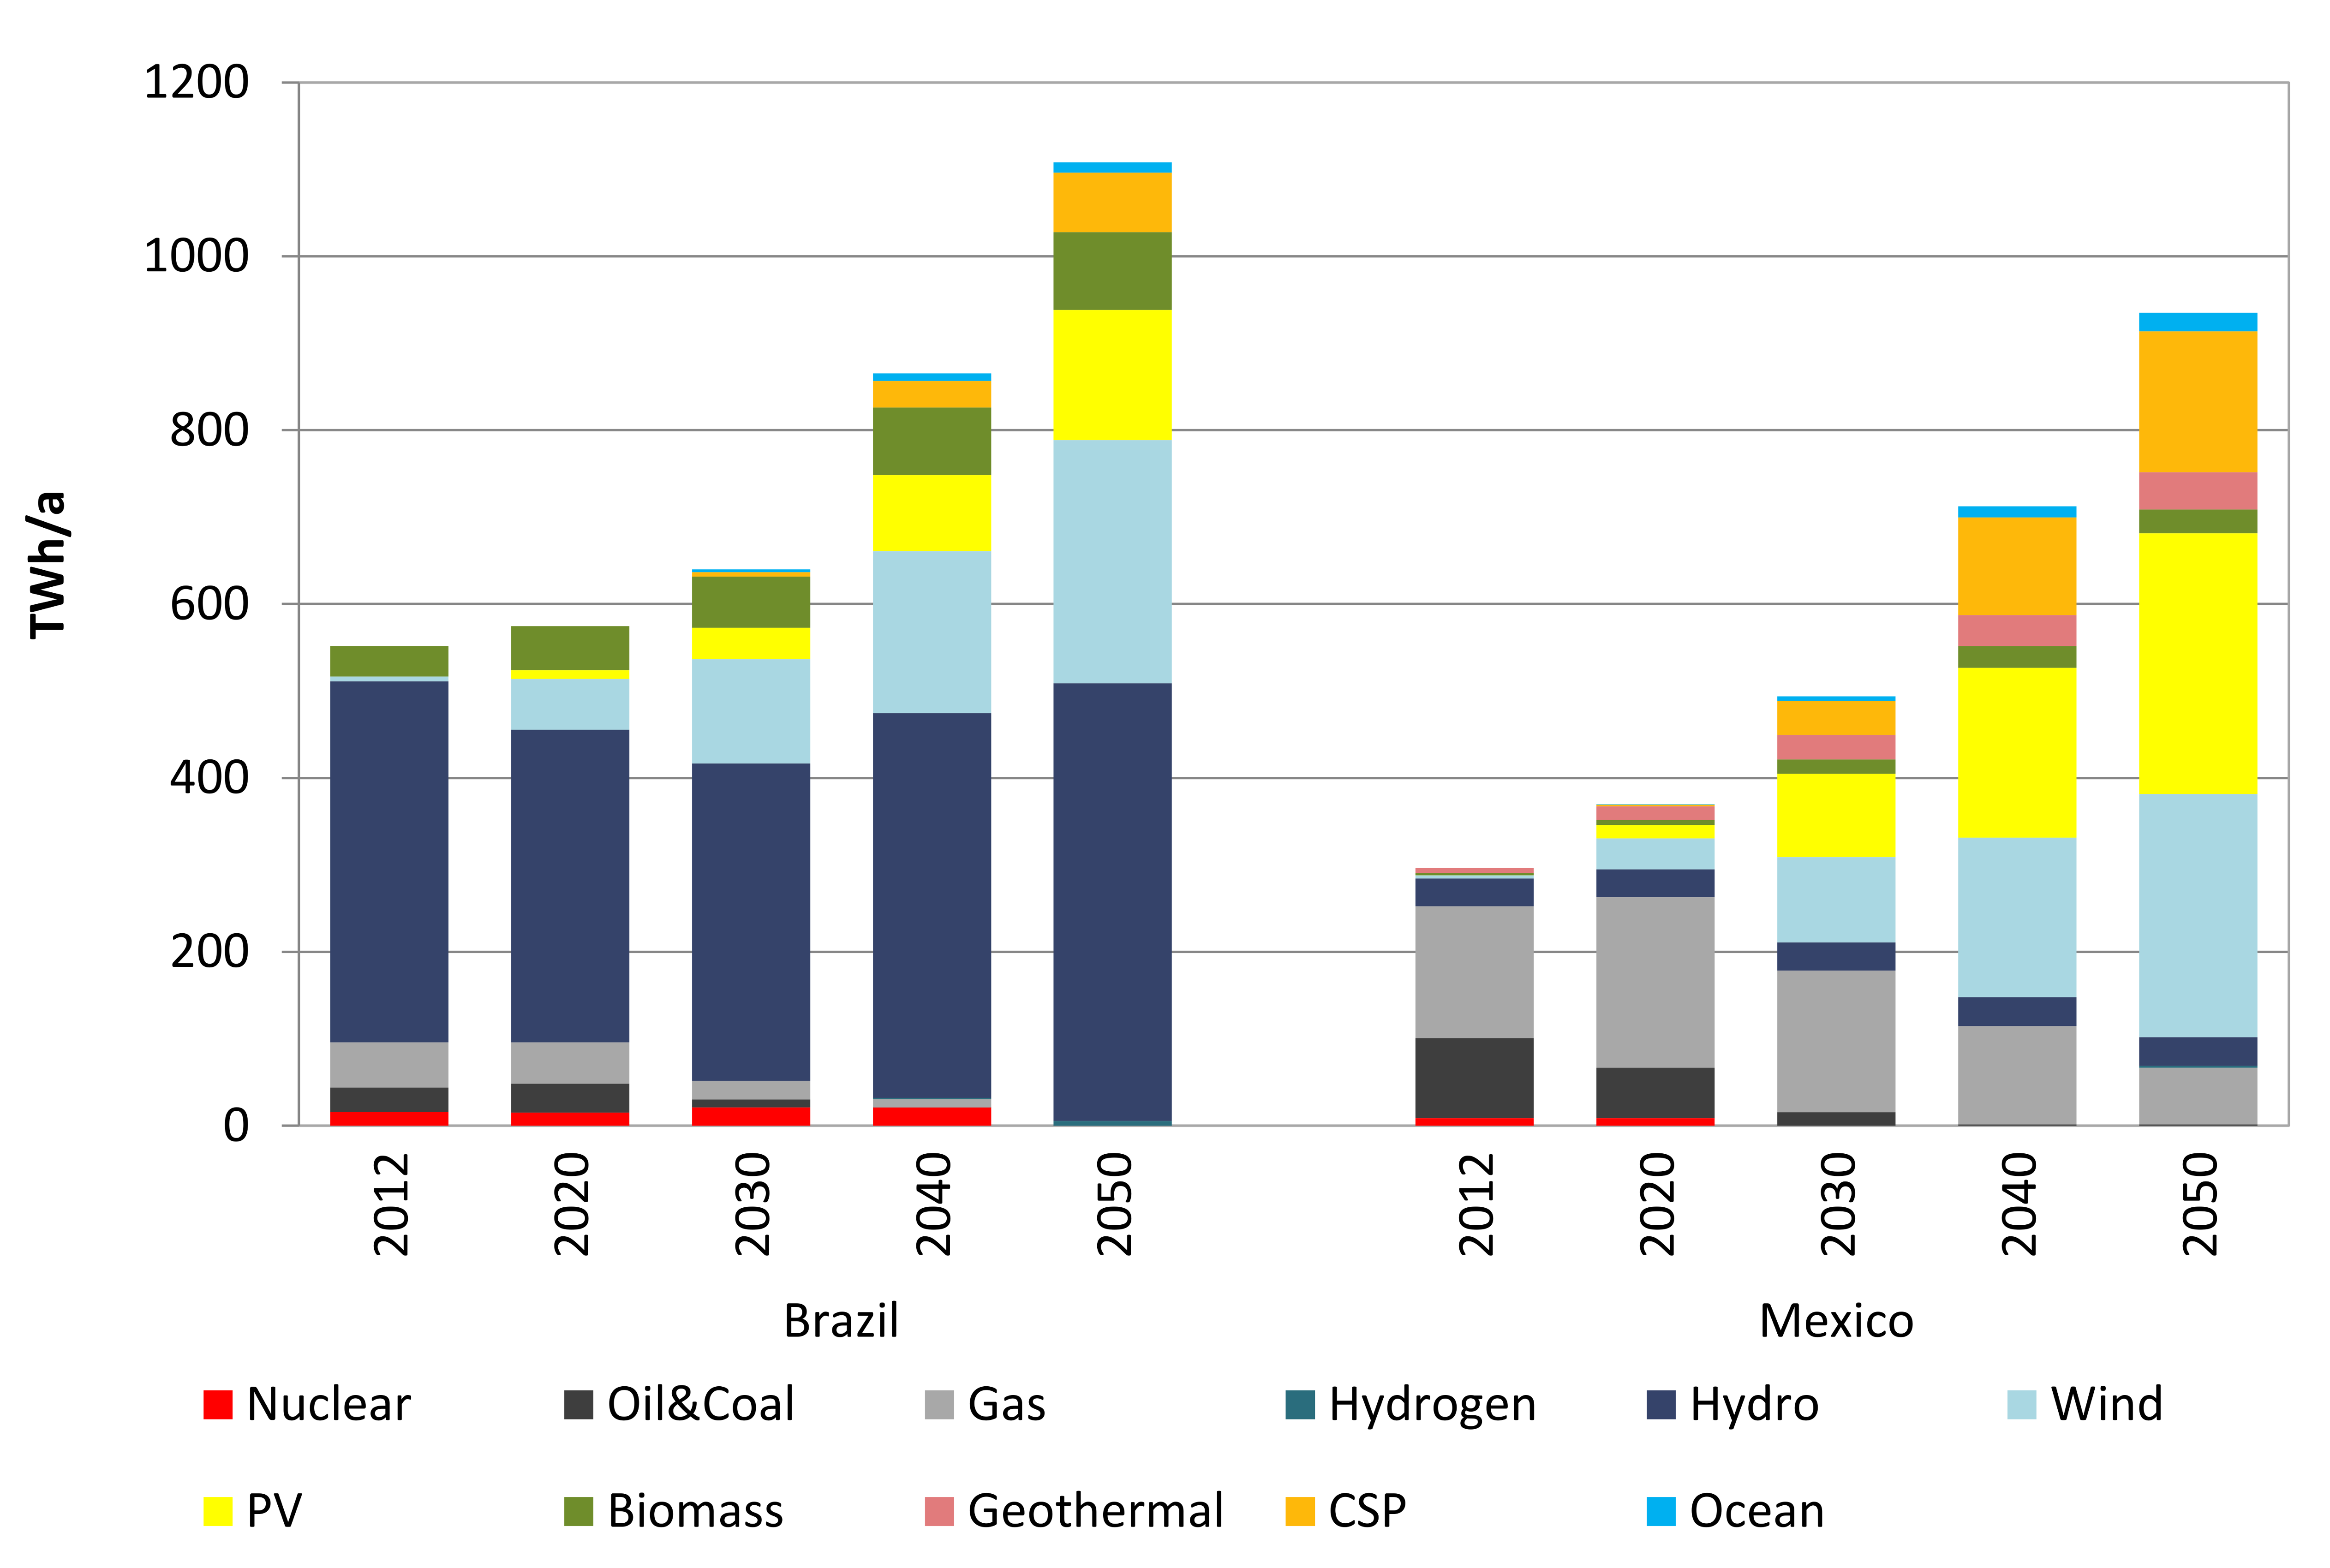
The electricity sector features the largest variety of renewable energy technologies. Figure 5 reflects the strategy, to integrate high shares of fluctuating renewable power, which are available at comparatively cheap costs. PV and wind power have seen considerable cost reduction in the last years [126,127]. At the same time significant capacity of dispatchable power plants is included in order to ensure security of supply.
Today, Brazil relies on an extraordinarily high share of renewable power of 83%, mainly from its abundant hydro resources. With restricted extension of large hydro power plants due to environmental concerns and a doubling in power demand until 2050, it will be a major challenge to maintain this high renewable share, in particular due to expected water shortages which may reduce hydro power production in the coming decades [48]. According to the scenario, by 2050 more than half of the Brazilian power comes from other renewable sources, wind (25%) and PV plants (14%) providing the main shares. Smaller shares are provided by dispatchable biomass (8%) and CSP (6%), backing up the remaining hydro power. The Energy [R]evolution scenario diversifies the electricity system and increases the total share of renewables to 100% (Figure 5).
This transformation requires a different set of power plants and leads to an over-proportional capacity increase (see Table 8). By 2050, the Energy [R]evolution Scenario envisages a substantial installation of renewable capacity in each country. In Brazil this scenario would require 350 GW of installed capacity, 1/3 would be covered by hydro, including the capacity currently under construction. Hydropower remains the backbone of a secure power supply as is shown in Table 8. Especially PV (28%) requires larger capacity, given its low full load hours. Biomass and CSP provide security with comparatively low installed capacities (7% each).
In Mexico in the future RE technologies need to substitute the currently 86% of fossil fuel power supply. This requires a variable and storable power source for grid stability, complementing fluctuating wind and PV power. Thus, CSP plants with integrated thermal storage provide the necessary secured capacity in the Energy [R]evolution Scenario. Considering the high irradiation potential in Mexico, 17% of power comes from CSP by 2050. This is complemented by 30% of wind and 32% of PV power. 7% of power production remains from natural gas.
In Mexico, the power generation capacity needs to increase by nearly a factor of 5 to supply the increasing electricity demand at a high share of renewable energies with lower full load hours than fossil power plants. Wind turbines and PV account for 74% of total capacity. Secured capacity can be provided by dispatchable power plants such as CSP (8% of total capacity), biomass, hydro and geothermal (2% each). Still, the remaining gas power plants represent 10% of the total capacity. They serve as backup systems with very low full load hours, balancing wind and PV power. Additional flexibility demand can be provided by batteries, demand side management (such as controlled loading of battery electric vehicles), and long-range balancing of supply and demand via the (reinforced) electricity grid. However, these flexibility options have not been assessed quantitatively in the Mexico scenario.
With nuclear currently providing less than 3% of power production in both Brazil and Mexico, the phasing out of this technology does not lead to a considerable restructuring of both countries’ power systems. Even though our simulation model does not take into account any seasonal or intra-daily variability of energy demand and supply, the optimization run of the REMix model for Brazil shows, that nuclear is easily compensated by dispatchable renewable technologies. With CSP as a dispatchable power backbone in Mexico, we assume that nuclear can equally be replaced by renewables here. Meanwhile also other scenarios have proven the technical and economic viability of a 100% renewable power supply for Mexico [128] and therefore support these results.
In both countries the additional capacity will not only provide for increased direct power demand, but also for additional demands from electric transport and electric heat applications. Our calculations show the technical feasibility of such a sector coupling even under much higher shares of renewables as projected in the above presented optimization studies [44,72,78] or national strategies [47,86] for Brazil and Mexico.
The two scenarios developed here for Brazil and Mexico describe possible future developments of the energy system in these two countries, which are technically feasible and economically viable (see Section 3.3) under the cost assumptions made here. One of the basic features of these scenarios is a rather broad technology mix in both the heat and power sectors. However, our scenarios describe only one of the feasible solutions to decarbonize the energy system in those countries. While we provide a well-balanced and stable energy system set up, with high resilience towards future insecurities as e.g., resource limits, we do not claim to provide a cost-optimal solution. Given the current dynamic development of the global wind and PV markets as well as the expected market expansion and price reduction of batteries, decarbonization scenarios for many countries are discussed in which power generation is almost entirely based on wind and PV. This is supported by the current market expansion, reaching 80 GW of PV and more than 50 GW of wind installations in 2017 [129,130]. It is proposed that the system flexibility which is necessary to integrate those intermittent renewables in the energy system is provided by batteries and/or (off-grid) pumped hydro storages (see e.g., [131])—in contrast to e.g., CSP or gas power plants in our scenario. It has to be clearly stated that our scenarios describe a different, albeit equally possible future. We have valid reasons to supplement wind, PV and hydro in our scenario with other renewable technologies such as CSP and geothermal, which can balance intermittent power sources also beyond 80% of renewable power. Challenges for the system integration of renewable power sources increase with higher shares of intermittent renewable power production. The current dynamic market development of wind and PV takes place in an energy system which is still characterized by dispatchable conventional power plants providing enough flexibility. System advantages of dispatchable technologies such as CSP and pumped hydro (e.g., electricity storage, demand side management, load balancing via grid expansion etc.) manifest specifically on the long run, at much higher shares of wind and PV than today. CSP provides an additional alternative to pumped hydro storage, which often faces low social acceptance due to rather high interventions in nature and landscape; or to batteries with potentially high environmental and resource demand impacts [132,133]. In Brazil, CSP power plants are expected to provide a stability supplement to the energy system [66,70,71]. For Brazil, different power supply structures have been studies in the related publication [95]. They include variations in the supply shares and/or costs of wind, PV, CSP, and battery storage. We found that predefined capacities of PV and CSP do not significantly increase the overall system costs in 2050. The same applies to the consideration of higher wind and CSP costs, as well as lower battery storage costs, which however influence the contribution of individual technologies on the supply costs. The paper shows a high degree of freedom in the technology choice for Brazil in a 100% renewable power supply, which is certainly favored by the large amount of existing hydro generation and especially hydro reservoir capacity. We consider CSP, hydro, geothermal and biomass as promising and complementing technological options to meet the large challenges when pushing towards 100% renewable power. These technologies should be developed early on and may pave the way for more wind and PV. Thus our scenario adds to a broader discussion of renewable energy scenarios, proposing a wider portfolio of power generation and flexibility technologies than current market developments suggest. In the next step we therefore examine the economic effects of the power sector.

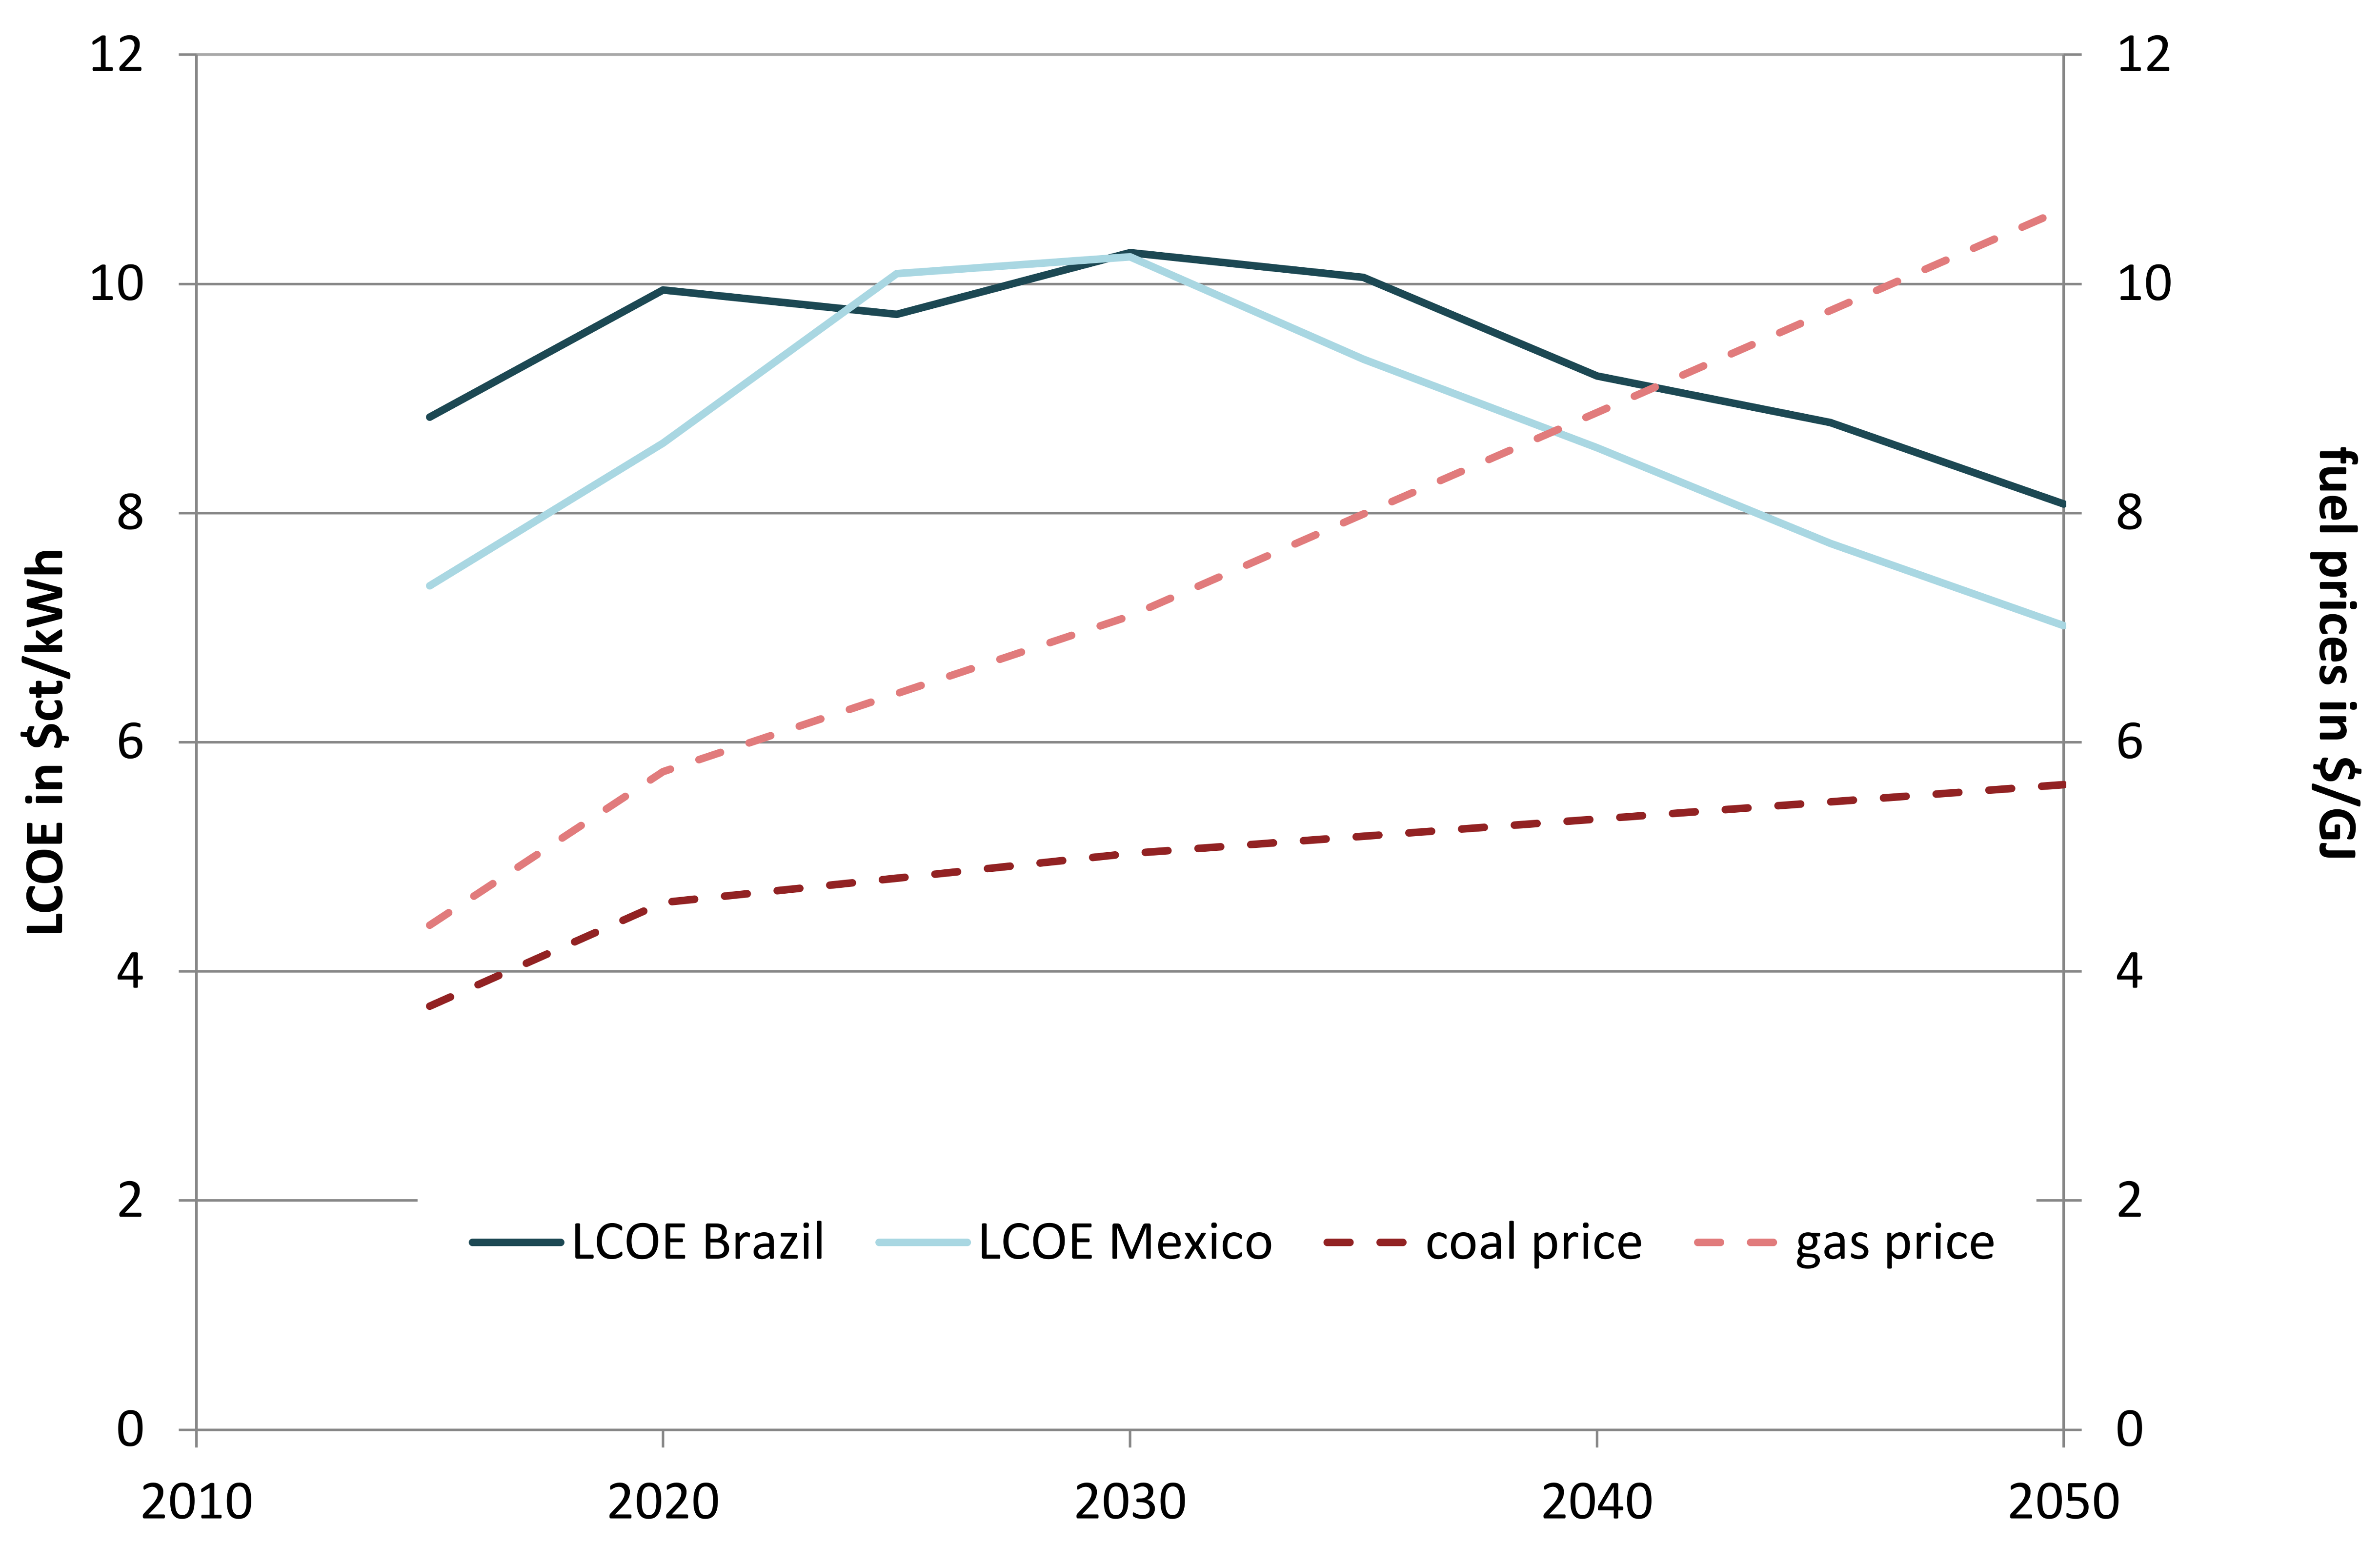
3.3. Power Generation Costs

Ex-post analysis of power production costs in the Energy [R]evolution scenario for Brazil and Mexico shows that a renewable power system pays off in the long run. Increasing LCOE during the next decade is a result of both massive investment in renewable technologies and strongly increasing fuel prices in the remaining fossil power production. Both, fossil and renewable plants are necessary to satisfy the strongly growing demand. From 2030 on renewables in Brazil and Mexico help curbing power costs, in spite of still growing fuel costs for coal and gas as well as oil (Figure 6).
Our simulations indicate, that even higher shares of renewables in power sector would be economically feasible and beneficial, than most above mentioned explorative scenarios suggest: While IRENA and SENER consider 42–46% renewable power feasible for Mexico in 2030 [44,46], the Energy [R]evolution Scenario achieves 67% in the same year. For Brazil all scenarios in [78] apply nuclear and/or CCS in 2050, even under strict GHG mitigation policy, whereas the Energy [R]evolution scenario assumes a 100% renewable power supply.
Cost calculations however strongly depend on the validity of input cost assumptions. Fuel prices have been very variable in the past. Furthermore, the development of investment costs for renewable power generation is uncertain. Therefore the fuel cost projections shown in as well as the absolute values of LCOE are subject to a high uncertainty, as is the case for any long term cost analysis. Within a global context a simultaneous transition of power systems might dampen price increase in fossil fuels, as is expected e.g., in the 450 ppm scenario of the WEO [30]. However we did not calculate scenarios for different price pathways. Still, our heuristic approach for normative scenarios including ex-post cost analysis is less vulnerable to cost uncertainty than optimization scenarios.
In contrast to this large uncertainties our assumptions on investment costs are backed by recent assumptions by the IEA [134], which find similar investment costs for fossil and renewable technologies for 2040. Still, our simulation lacks in quantifying future costs for additional infrastructure such as grid and storage. In a parametric study for Europe, variable renewable energy integration costs of about 4.5–6.5 $/MWh have been identified for systems with PV and wind supply shares in the range of 20–30% of the demand each [135]. These costs include storage, grid, and curtailment. In an alternative study for Australia, integration costs have been estimated to lie between 19 and 23 $/MWh [131]. Adding the integration costs to the power generation LCOE values calculated here (65–80 $/GWh, see Figure 6), overall LCOE between 70 and 100 $/MWh are obtained.

3.4. Primary Energy Demand and CO2 Emissions

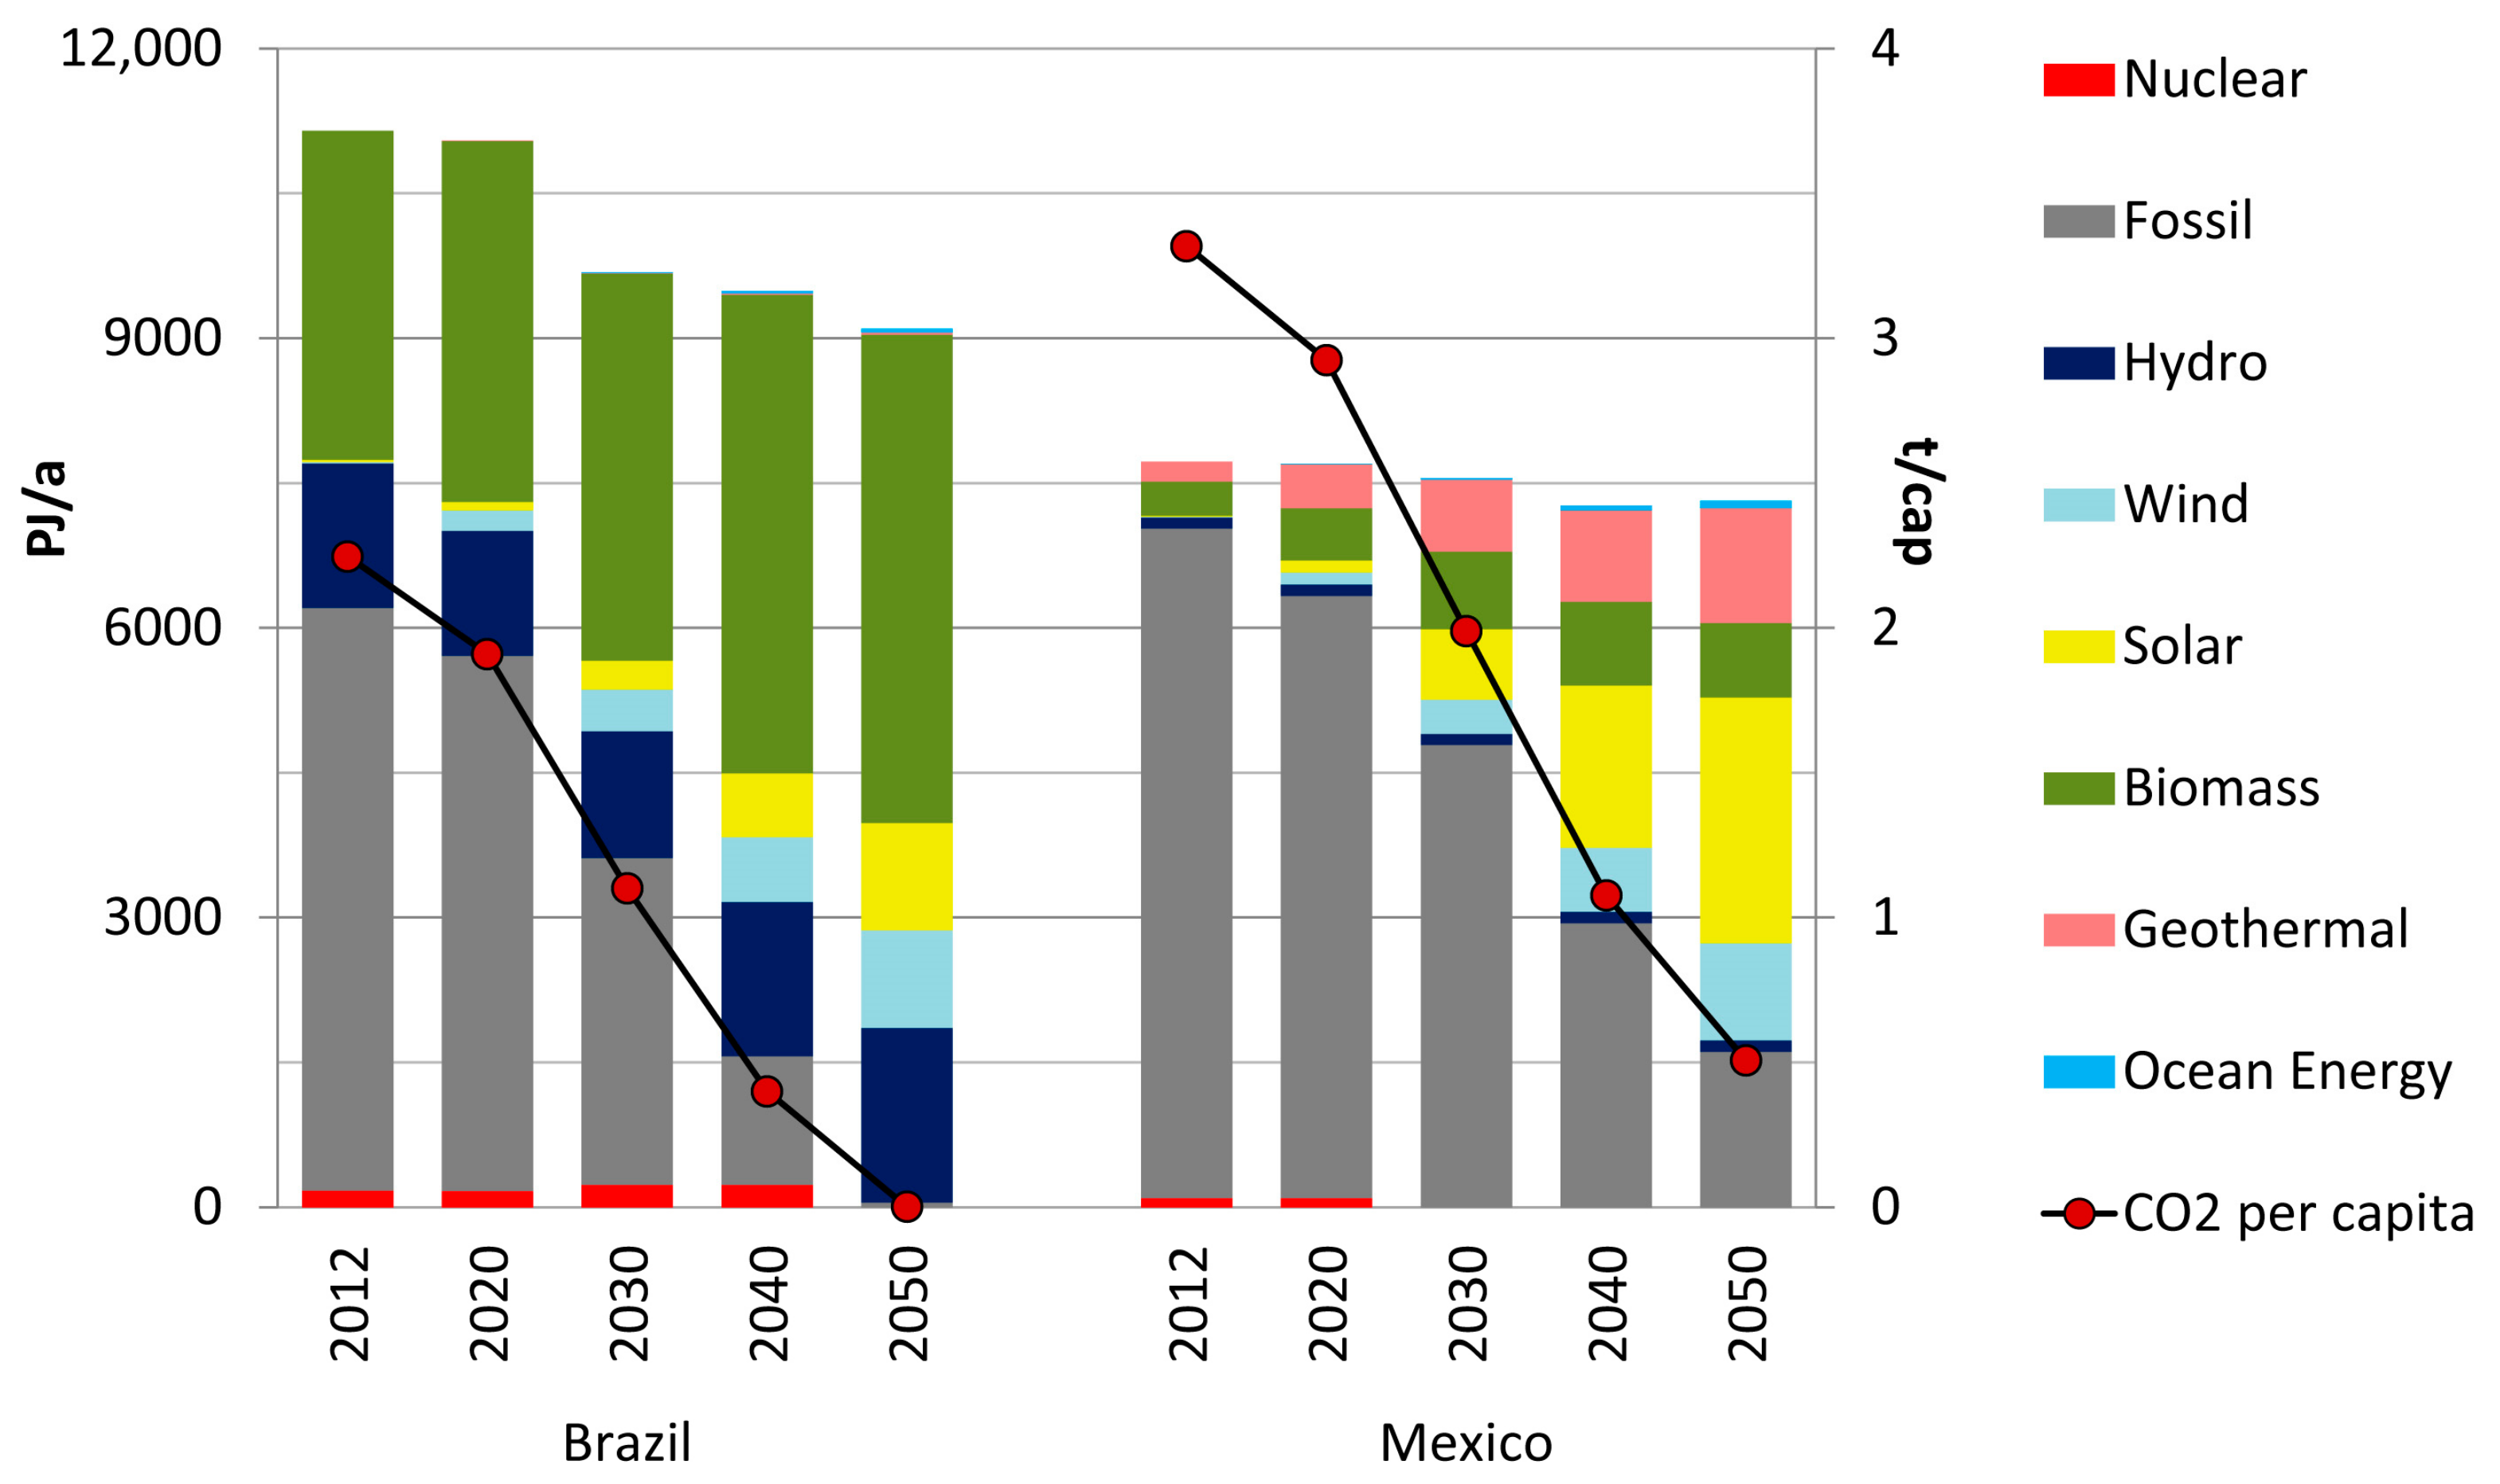
The simulation eventually calculates primary energy demand and CO2 emissions in the overall energy system (Figure 7). Brazil is mainly relying on the already available and implemented hydro power and biomass throughout the Energy [R]evolution scenario. Only after 2030, Brazils renewable portfolio is extended significantly to solar and wind, which today are already marketable [126,136]. Biomass remains the main pillar of the renewable energy supply in this scenario, delivering half of the total primary energy supply in 2050.
This leads to a total abatement of CO2 emissions by midcentury, in spite of a 30 Mio cap population increase to 230 Mio cap and average income growth of 80% until 2050. Per capita emissions decline from 2.2 t/cap in 2012 to almost zero. Total emissions decrease from 446 Mio t (2012) to 0.4 Mio t (2050). In Mexico, per capita emissions exhibit a similar decrease form 3.3 t/cap in 2012 to 0.5 t/cap in 2050. Overall emissions are reduced by nearly 80% from 401 Mio t (2012) to 84 Mio t (2050).
Mexico hosts a broader variety of new renewable technologies in the energy system, resulting in a share of 78% renewables in primary energy. The remaining fossil energy is mainly due to grid stability and high temperature process heat required in the industry sector. Mexico in particular could exploit its large solar potential, providing 35% of primary energy supply and extend the use of geothermal energy, which is already part of the current energy system.
Brazil and Mexico start with different amounts of CO2 emissions, reflecting different energy demand and supply structures in their current energy systems. Nevertheless, both countries can significantly reduce emissions along the identified global per capita targets and therefore significantly contribute to the Paris treaty. However, in 2050, our results indicate zero emissions for Brazil but 0.5 t/cap for Mexico. This level depends mainly on the development in the dominant renewable technologies since the available renewable potential is large in both countries. In 2050, Brazil will rely on already well developed hydro and biomass, while Mexico will depend on significant technology development in “new” renewables. For these a significant cost improvement is projected for the next years according to the IEA [137] and significant market development is expected e.g., in PV markets [126]. For both countries, the predominantly renewable energy systems are technically feasible and economically beneficial in the long run. Nevertheless, the large share of intermittent renewable power resources in Mexico requires that natural gas-fired backup and CSP plants to stabilize national power production.
It is also clear, that this normative scenario will not be achieved based on existing expansion of renewables [138]. Comparing our target oriented scenarios with the existing scenario literature (see Section 1), we identify a large difference to the explorative scenarios with regard to deployment of renewables [32,44,46,78]. There, projections for Brazil and Mexico suggest much lower shares of renewables in the future energy system. These differences clearly demonstrate the complementary nature of both approaches—exploratory and normative. While the explorative scenarios identify the track of current and planned policy, the normative approach provides an additional outlook on what is technologically feasible within given economic boundaries. Given the demonstrated technical feasibility, a comparison of our normative scenarios with the explorative scenarios identifies the gap policy has to bridge to achieve a decarbonized energy system and thus the climate targets. The normative scenarios highlight the need for additional political measures, which result in an expansion of renewables. This can improve the societal and economic environment for emerging technologies, helping to implement efficiency and renewable energy technologies.

4. Conclusions

Given the global goal of decarbonisation, especially newly industrialized countries face the problem that economic growth almost inevitably triggers a higher energy demand and thus higher CO2 emissions. Still, if the Paris agreement is to be implemented, any growing economy has to be reconciled with lower GHG emissions. This study shows via normative scenario modelling for both Brazil and Mexico that this is indeed possible: We provide target-oriented scenarios until 2050, implementing a major reduction of CO2 emissions across the whole energy system—including heat, transport and power.
Brazil and Mexico have very different starting conditions with respect to the current deployment of renewable energies for power, heat and transport, and with respect to potentials of hydropower, solar energy, and biomass. As a consequence, their transformation pathways towards more sustainable energy systems are very different—despite similar targets. Thus, the different transformation strategies in both countries may serve as blueprints for decarbonisation strategies in other newly industrialized countries in Latin America or elsewhere.
One main result of our study is that renewable energy can enable significant CO2 emission reductions if accompanied by efficiency measures and sector coupling. A massive integration of renewable energy technologies across all demand sectors—including heat and transport—is technically feasible. We demonstrate the feasibility of an (almost) 100% renewable energy system in two large newly industrialized countries in Latin America that are characterized by a strong growth in energy demand due to growing economy, prosperity and population. Despite the strong increase in energy demand, the transformation is also economically feasible.
Already today, the share of renewable energy in Brazil’s primary energy demand exceeds 40%. Brazil benefits from large potentials of hydro power as well as biomass, which can be used to replace fossil fuels in the power, heat, and transport sectors. The dispatchability of hydro power and power from biomass facilitates the integration of other, fluctuating power sources such as PV and wind which increasingly contribute to power production in the future. In the transport sector, fossil fuels are replaced by biofuels. An additional infrastructure for hydrogen cars is not required. Also in the heat sector biomass can supply even larger shares than today, specifically replacing fossil high temperature process heat.
Mexico, in contrast, starts with much lower shares of renewable energy today. Hence, an even more challenging transition than in Brazil is necessary to achieve the climate goals, as it is proposed in the Energy [R]evolution Scenario. In accordance with Mexico’s renewable energy potentials, the strategy for a low carbon energy supply in Mexico needs to implement mainly solar, wind and geothermal technologies. This implies strong efforts to invest in the development and deployment of technologies, such as PV, wind, CSP and geothermal power production, not all of which are already market-ready and economic today. Due to limited sustainable biomass potentials, the decarbonisation of the transport sectors requires a comprehensive roll-out of new technologies such as battery electric vehicles and hydrogen fuel cell cars. The heat sector needs specific efforts to promote solar collectors and geothermal heat applications, which need to become the major heat sources.
Both the transformation pathways in Brazil and in Mexico face enormous challenges. First there is the speed of the transformation process itself. Demand growth requires an even faster deployment of renewable energies in newly industrialized countries than in the US or the EU: Right now a fast expansion of wind and PV plants is necessary. This is followed by the expansion of dispatchable power sources and additional system flexibility (electricity grid, storages, dispatchable backup power plants) in the long run. Here, Brazil with its large share of hydro and biomass has a good point of departure. For Mexico, the dispatchable capacity through CSP can play a major role. Here it is essential to avoid lock-in effects which occur in the long run, if new (inflexible) fossil power plants are constructed in the near future to meet increasing power demand. A second challenge is the sector coupling. Markets for electric and hydrogen vehicles, as well as electric heating need to be promoted to exploit synergies between decarbonizing heat and transport on the one hand, and to provide system services for the power sector on the other.
Ambitious goals require political commitment for a massive deployment of renewable energy technologies: Our scenarios are unlikely to come true if current policies are continued. A comparison of our strictly normative scenarios with existing explorative scenarios shows that the current and discussed political measures to reduce CO2 emissions are clearly not enough to make this vision reality. Policy needs to improve the framework conditions for deployment of renewable energy and improve market integration of new technologies also in the heat and transport sector. This will foster renewable energy technologies, further reducing costs and unlocking CO2 reduction potentials on global level to achieve the Paris Treaty targets.

Supplementary Materials

The following are available online at https://www.mdpi.com/1996-1073/11/4/907/s1, Table S1: model input, Table S2: model results.

Acknowledgments

The research for this paper was funded by Greenpeace Brazil for Brazil and Greenpeace International for Mexico. It was complemented by modeling the Brazilian power sector in cooperation with Rafael Soria and Roberto Schaeffer from the Energy Planning Program, Universidade Federal do Rio de Janeiro, Brazil.

Author Contributions

Sonja Simon and Tobias Naegler conceived and designed the simulation model; Sonja Simon carried out the Mesap modeling for Brazil, Tobias Naegler carried out the Mesap modeling for Mexico, Hans Christian Gils carried out the REMix modeling for Brazil; Sonja Simon wrote the paper, Tobias Naegler and Hans Christian Gils provided significant review of the paper.

Conflicts of Interest

The authors declare no conflict of interest.

References

  1. Intergovernmental Panel on Climate Change (IPCC). Climate Change 2014: Synthesis Report. Contribution of Working Groups I, II and III to the Fifth Assessment Report of the Intergovernmental Panel on Climate Change; Core Writing Team, Pachauri, R.K., Meyer, L.A., Eds.; IPCC: Geneva, Switzerland, 2014. [Google Scholar]
  2. United Nations Framework Convention on Climate Change (UNFCCC). Report of the Conference of the Parties on Its Twenty-First Session, Held in Paris from 30 November to 13 December 2015—Part Two: Action Taken by the Conference of the Parties at Its Twenty-First Session; United Nations Framework Convention on Climate Change: New York, NY, USA, 2015. [Google Scholar]
  3. Allen, M.R.; Barros, V.R.; Broome, J.; Cramer, W.; Christ, R.; Church, J.A.; Clarke, L.; Dahe, Q.; Dasgupta, P.; Dubash, N.K. IPCC Fifth Assessment Synthesis Report-Climate Change 2014 Synthesis Report; Intergovernmental Panel on Climate Change: Geneva, Switzerland, 2014. [Google Scholar]
  4. Edenhofer, O.; Pichs-Madruga, R.; Sokona, Y.; Seyboth, K.; Matschoss, P.; Kadner, S.; Zwickel, T.; Eickemeier, P.; Hansen, G.; Schlömer, S. IPCC Special Report on Renewable Energy Sources and Climate Change Mitigation; International Panel on Climate Change: Cambridge, UK, 2011. [Google Scholar]
  5. Krewitt, W.; Simon, S.; Graus, W.; Teske, S.; Zervos, A.; Schäfer, O. The 2 °C scenario—A sustainable world energy perspective. Energy Policy 2007, 35, 4969–4980. [Google Scholar] [CrossRef]
  6. Santoyo-Castelazo, E.; Azapagic, A. Sustainability assessment of energy systems: Integrating environmental, economic and social aspects. J. Clean. Prod. 2014, 80, 119–138. [Google Scholar] [CrossRef]
  7. Lund, H. Renewable energy strategies for sustainable development. Energy 2007, 32, 912–919. [Google Scholar] [CrossRef]
  8. International Energy Agency (IEA). World Energy Outlook 2015; International Energy Agency, Organisation for Economic Co-operation and Development: Paris, France, 2015. [Google Scholar]
  9. International Energy Agency (IEA). Energy Technology Perspectives 2016—Towards Sustainable Urban Energy Systems; OECD Publishing: Paris, France, 2016. [Google Scholar]
  10. Jacobson, M.Z.; Delucchi, M.A.; Bauer, Z.A.F.; Goodman, S.C.; Chapman, W.E.; Cameron, M.A.; Bozonnat, C.; Chobadi, L.; Clonts, H.A.; Enevoldsen, P.; et al. 100% clean and renewable wind, water, and sunlight all-sector energy roadmaps for 139 countries of the world. Joule 2017, 1, 108–121. [Google Scholar] [CrossRef]
  11. Teske, S.; Muth, J.; Sawyer, S.; Pregger, T.; Simon, S.; Naegler, T.; O’Sullivan, M.; Schmid, S.; Graus, W.; Zittel, W.; et al. Energy [R]evolution—A Sustainable World Energy Outlook; Greenpeace International, European Renewable Energy Council (EREC), Global Wind Energy Council (GWEC), Deutsches Zentrum für Luft- und Raumfahrt (DLR): Amsterdam, The Netherlands, 2012. [Google Scholar]
  12. Teske, S.; Zervos, A.; Lins, C.; Muth, J.; Krewitt, W.; Pregger, T.; Simon, S.; Naegler, T.; Schmid, S.; Graus, W.; et al. Energy [R]evolution—A Sustainable World Energy Outlook; Greenpeace International, European Renewable Energy Council (EREC), Deutsches Zentrumfür Luft- und Raumfahrt (DLR), Ecofys: Amsterdam, The Netherlands, 2010. [Google Scholar]
  13. Greenpeace International, European Renewable Energy Council (Greenpeace, EREC). Energy [R]evolution; Greenpeace International, European Renewable Energy Council, Deutsches Zentrumfür Luft- und Raumfahrt, Ecofys: Amsterdam, The Netherlands, 2007. [Google Scholar]
  14. Teske, S.; Sawyer, S.; Schäfer, O.; Pregger, T.; Simon, S.; Naegler, T.; Schmid, S.; Özdemir, E.D.; Pagenkopf, J.; Kleiner, F.; et al. Energy [R]evolution—A Sustainable World Energy Outlook 2015; Greenpeace International: Amsterdam, The Netherlands, 2015. [Google Scholar]
  15. United Nations Development Programme (UNPD). World Population Prospects: The 2015 Revision. Available online: https://esa.un.org/unpd/wpp/publications/files/wpp2015_methodology.pdf (accessed on 3 September 2015).
  16. World Bank. World Bank Open Data; World Bank: Washington, DC, USA, 2016. [Google Scholar]
  17. International Energy Agency (IEA). World Energy Outlook 2017; International Energy Agency, Organisation for Economic Co-operation and Development: Paris, France, 2017. [Google Scholar]
  18. International Energy Agency (IEA). World energy balances 2016. In IEA Energy Statistics (Beyond 20/20); International Energy Agency: Paris, France, 2016. [Google Scholar]
  19. International Renewable Energy Agency (IRENA). Roadmap for a Renewable Energy Future; International Renewable Energy Agency: Abu Dhabi, United Arab Emirates, 2016. [Google Scholar]
  20. Sheinbaum-Pardo, C.; Ruiz, B.J. Energy context in Latin America. Energy 2012, 40, 39–46. [Google Scholar] [CrossRef]
  21. Organización Lantinamericana de Energia (OLADE). Potencial de Recursos Energéticos y Minerales de América del sur: Coincidencias Jurídicas Hacia una Estrategia Regional; Organización Lantinamericana de Energia: Quito, Ecuador, 2013. [Google Scholar]
  22. Secretaría de Energía (SENER). Prospectiva del Energías Renovables 2012–2026; Secretaría de Energía: Mexico City, Mexico, 2012. [Google Scholar]
  23. Gischler, C.; Janson, N. Perspectives for Distributed Generation with Renewable Energy in Latin America and the Caribbean: Analysis of Case Studies for Jamaica, Barbados, Mexico, and Chile; Inter-American Development Bank: Washington, DC, USA, 2011. [Google Scholar]
  24. Waenn, A.; Connolly, D.; Ó Gallachóir, B. Investigating 100% renewable energy supply at regional level using scenario analysis. Int. J. Sustain. Energy Plan. Manag. 2014, 3, 21–32. [Google Scholar]
  25. Martinot, E.; Dienst, C.; Weiliang, L.; Qimin, C. Renewable energy futures: Targets, scenarios, and pathways. Annu. Rev. Environ. Resour. 2007, 32, 205–239. [Google Scholar] [CrossRef]
  26. Connolly, D.; Mathiesen, B.V. A technical and economic analysis of one potential pathway to a 100% renewable energy system. Int. J. Sustain. Energy Plan. Manag. 2014, 1, 7–28. [Google Scholar]
  27. Mathiesen, B.V.; Lund, H.; Karlsson, K. 100% renewable energy systems, climate mitigation and economic growth. Appl. Energy 2011, 88, 488–501. [Google Scholar] [CrossRef]
  28. Gils, H.C.; Simon, S. Carbon neutral archipelago—100% renewable energy supply for the Canary Islands. Appl. Energy 2017, 188, 342–355. [Google Scholar] [CrossRef]
  29. Cochran, J.; Mai, T.; Bazilian, M. Meta-analysis of high penetration renewable energy scenarios. Renew. Sustain. Energy Rev. 2014, 29, 246–253. [Google Scholar] [CrossRef]
  30. International Energy Agency (IEA). World Energy Outlook 2014; International Energy Agency, Organisation for Economic Co-operation and Development: Paris, France, 2014. [Google Scholar]
  31. Dale, A.; Pereira de Lucena, A.; Marriott, J.; Borba, B.; Schaeffer, R.; Bilec, M. Modeling future life-cycle greenhouse gas emissions and environmental impacts of electricity supplies in Brazil. Energies 2013, 6, 3182–3208. [Google Scholar] [CrossRef]
  32. Herreras Martínez, S.; Koberle, A.; Rochedo, P.; Schaeffer, R.; Lucena, A.; Szklo, A.; Ashina, S.; van Vuuren, D.P. Possible energy futures for Brazil and Latin America in conservative and stringent mitigation pathways up to 2050. Technol. Forecast. Soc. Chang. 2015, 98, 186–210. [Google Scholar] [CrossRef]
  33. International Energy Agency (IEA). IEA Energy Atlas; IEA: Paris, France, 2016. [Google Scholar]
  34. Gobierno de la República México. Intended Nationally Determined Contribution; UNFCCC: Bonn, Germany, 2015. [Google Scholar]
  35. Alemán-Nava, G.S.; Casiano-Flores, V.H.; Cárdenas-Chávez, D.L.; Díaz-Chavez, R.; Scarlat, N.; Mahlknecht, J.; Dallemand, J.-F.; Parra, R. Renewable energy research progress in Mexico: A review. Renew. Sustain. Energy Rev. 2014, 32, 140–153. [Google Scholar] [CrossRef]
  36. Mundo-Hernández, J.; de Celis Alonso, B.; Hernández-Álvarez, J.; de Celis-Carrillo, B. An overview of solar photovoltaic energy in Mexico and Germany. Renew. Sustain. Energy Rev. 2014, 31, 639–649. [Google Scholar] [CrossRef]
  37. Hernández-Escobedo, Q.; Manzano-Agugliaro, F.; Zapata-Sierra, A. The wind power of Mexico. Renew. Sustain. Energy Rev. 2010, 14, 2830–2840. [Google Scholar] [CrossRef]
  38. Cancino-Solórzano, Y.; Gutiérrez-Trashorras, A.J.; Xiberta-Bernat, J. Current state of wind energy in Mexico, achievements and perspectives. Renew. Sustain. Energy Rev. 2011, 15, 3552–3557. [Google Scholar] [CrossRef]
  39. Manzini, F.; Islas, J.; Martínez, M. Reduction of greenhouse gases using renewable energies in Mexico 2025. Int. J. Hydrog. Energy 2001, 26, 145–149. [Google Scholar] [CrossRef]
  40. Vidal-Amaro, J.J.; Østergaard, P.A.; Sheinbaum-Pardo, C. Optimal energy mix for transitioning from fossil fuels to renewable energy sources—The case of the Mexican electricity system. Appl. Energy 2015, 150, 80–96. [Google Scholar] [CrossRef]
  41. Johnson, T.M.; Alatorre, C.; Romo, Z.; Liu, F. Low-Carbon Development for Mexico; World Bank Publications: Washington, DC, USA, 2009. [Google Scholar]
  42. García, C.A.; Manzini, F.; Islas, J. Air emissions scenarios from ethanol as a gasoline oxygenate in Mexico City Metropolitan Area. Renew. Sustain. Energy Rev. 2010, 14, 3032–3040. [Google Scholar] [CrossRef]
  43. Islas, J.; Manzini, F.; Masera, O. A prospective study of bioenergy use in Mexico. Energy 2007, 32, 2306–2320. [Google Scholar] [CrossRef]
  44. International Renewable Energy Agency (IRENA). Renewable Energy Prospects: Mexico, Remap 2030 Analysis; International Renewable Energy Agency, Mexican Ministry of Energy (SENER): Abu Dhabi, United Arab Emirates, 2015. [Google Scholar]
  45. Secretaria de Gobernacion (SEGOB). Decreto por el que se Reforman y Adicionan Diversas Disposiciones de la Constitución Política de los Estados Unidos Mexicanos, en Materia de Energía; SEGOB: México City, México, 2013. [Google Scholar]
  46. Secretaría de Energía (SENER). Prodesden—Programa de Desarrollo del Sistema Eléctrico Nacional 2016–2030; Secretaría de Energía: Mexico City, Mexico, 2016. [Google Scholar]
  47. Secretaría de Energía (SENER). Estrategia Nacional de Energía; Secretaría de Energía: Mexico City, Mexico, 2013. [Google Scholar]
  48. Corrêa da Silva, R.; de Marchi Neto, I.; Silva Seifert, S. Electricity supply security and the future role of renewable energy sources in Brazil. Renew. Sustain. Energy Rev. 2016, 59, 328–341. [Google Scholar] [CrossRef]
  49. Schaeffer, R.; Szklo, A.S.; Pereira de Lucena, A.F.; Moreira Cesar Borba, B.S.; Pupo Nogueira, L.P.; Fleming, F.P.; Troccoli, A.; Harrison, M.; Boulahya, M.S. Energy sector vulnerability to climate change: A review. Energy 2012, 38, 1–12. [Google Scholar] [CrossRef]
  50. Lampreia, J.; de Araújo, M.S.M.; de Campos, C.P.; Freitas, M.A.V.; Rosa, L.P.; Solari, R.; Gesteira, C.; Ribas, R.; Silva, N.F. Analyses and perspectives for Brazilian low carbon technological development in the energy sector. Renew. Sustain. Energy Rev. 2011, 15, 3432–3444. [Google Scholar] [CrossRef]
  51. Ministério de Minas e Energia (MME). Balanço Energético Nacional 2015: Ano Base 2014; Ministério de Minas e Energia, Empresa de Pesquisa Energética (EPE): Brasilia, Brazil, 2015. [Google Scholar]
  52. Solomon, B.D.; Krishna, K. The coming sustainable energy transition: History, strategies, and outlook. Energy Policy 2011, 39, 7422–7431. [Google Scholar] [CrossRef]
  53. Lora, E.S.; Andrade, R.V. Biomass as energy source in Brazil. Renew. Sustain. Energy Rev. 2009, 13, 777–788. [Google Scholar] [CrossRef]
  54. La Rovere, E.L.; Pereira, A.S.; Simões, A.F. Biofuels and sustainable energy development in Brazil. World Dev. 2011, 39, 1026–1036. [Google Scholar] [CrossRef]
  55. Nass, L.L.; Pereira, P.A.A.; Ellis, D. Biofuels in Brazil: An overview. Crop Sci. 2007, 47, 2228–2237. [Google Scholar] [CrossRef]
  56. Bentivoglio, D.; Finco, A.; Bacchi, M. Interdependencies between biofuel, fuel and food prices: The case of the Brazilian ethanol market. Energies 2016, 9, 464. [Google Scholar] [CrossRef]
  57. De Paula Dias, M.A.; de Souza Vianna, J.N.; Felby, C. Sustainability in the prospective scenarios methods: A case study of scenarios for biodiesel industry in Brazil, for 2030. Futures 2016, 82, 1–14. [Google Scholar] [CrossRef]
  58. Filoso, S.; Braga do Carmo, J.; Mardegan, S.F.; Machado Lins, S.R.; Figueiredo Gomes, T.; Martinelli, L.A. Reassessing the environmental impacts of sugarcane ethanol production in Brazil to help meet sustainability goals. Renew. Sustain. Energy Rev. 2015, 52, 1847–1856. [Google Scholar] [CrossRef]
  59. Raele, R.; Gama-Boaventura, J.M.; Fischmann, A.A.; Sarturi, G. Scenarios for the second generation ethanol in Brazil. Technol. Forecast. Soc. Chang. 2014, 87, 205–223. [Google Scholar] [CrossRef]
  60. Albarelli, J.Q.; Ensinas, A.V.; Silva, M.A. Product diversification to enhance economic viability of second generation ethanol production in Brazil: The case of the sugar and ethanol joint production. Chem. Eng. Res. Des. 2014, 92, 1470–1481. [Google Scholar] [CrossRef]
  61. Aquila, G.; Rocha, L.C.S.; Rotela Junior, P.; de Oliveira Pamplona, E.; de Queiroz, A.R.; de Paiva, A.P. Wind power generation: An impact analysis of incentive strategies for cleaner energy provision in Brazil. J. Clean. Prod. 2016, 137, 1100–1108. [Google Scholar] [CrossRef]
  62. Pinto, J.T.M.; Amaral, K.J.; Janissek, P.R. Deployment of photovoltaics in Brazil: Scenarios, perspectives and policies for low-income housing. Sol. Energy 2016, 133, 73–84. [Google Scholar] [CrossRef]
  63. De Souza Noel Simas Barbosa, L.; Orozco, J.F.; Bogdanov, D.; Vainikka, P.; Breyer, C. Hydropower and power-to-gas storage options: The Brazilian energy system case. In Proceedings of the 10th International Renewable Energy Storage Conference, Düsseldorf, Germany, 15–17 March 2016. [Google Scholar]
  64. Pereira, A.O., Jr.; Cunha da Costa, R.; do Vale Costa, C.; de Moraes Marreco, J.; La Rovere, E.L. Perspectives for the expansion of new renewable energy sources in Brazil. Renew. Sustain. Energy Rev. 2013, 23, 49–59. [Google Scholar] [CrossRef]
  65. Filgueiras, A.; Silva, T.M.V. Wind energy in Brazil—Present and future. Renew. Sustain. Energy Rev. 2003, 7, 439–451. [Google Scholar] [CrossRef]
  66. Tomaschek, J.; Haasz, T.; Fahl, U. Concentrated solar power generation: Firm and dispatchable capacity for Brazil’s solar future? In Proceedings of the SOLARPACES 2015: International Conference on Concentrating Solar Power and Chemical Energy Systems, Abu Dhabi, United Arab Emirates, 11–14 October 2016; AIP Publishing: Melville, NY, USA, 2016. [Google Scholar]
  67. Juárez, A.A.; Araújo, A.M.; Rohatgi, J.S.; de Oliveira Filho, O.D.Q. Development of the wind power in Brazil: Political, social and technical issues. Renew. Sustain. Energy Rev. 2014, 39, 828–834. [Google Scholar] [CrossRef]
  68. Schmidt, J.; Cancella, R.; Pereira, A.O., Jr. The effect of windpower on long-term variability of combined hydro-wind resources: The case of Brazil. Renew. Sustain. Energy Rev. 2016, 55, 131–141. [Google Scholar] [CrossRef]
  69. Martins, F.R.; Abreu, S.L.; Pereira, E.B. Scenarios for solar thermal energy applications in Brazil. Energy Policy 2012, 48, 640–649. [Google Scholar] [CrossRef]
  70. Soria, R.; Portugal-Pereira, J.; Szklo, A.; Milani, R.; Schaeffer, R. Hybrid concentrated solar power (CSP)–biomass plants in a semiarid region: A strategy for CSP deployment in Brazil. Energy Policy 2015, 86, 57–72. [Google Scholar] [CrossRef]
  71. Malagueta, D.; Szklo, A.; Soria, R.; Dutra, R.; Schaeffer, R.; Moreira Cesar Borba, B.S. Potential and impacts of concentrated solar power (CSP) integration in the Brazilian electric power system. Renew. Energy 2014, 68, 223–235. [Google Scholar] [CrossRef]
  72. Soria, R.; Lucena, A.F.; Tomaschek, J.; Fichter, T.; Haasz, T.; Szklo, A.; Schaeffer, R.; Rochedo, P.; Fahl, U.; Kern, J. The role of CSP in Brazil: A multi-model analysis. In Proceedings of the SOLARPACES 2015: International Conference on Concentrating Solar Power and Chemical Energy Systems, Abu Dhabi, United Arab Emirates, 11–14 October 2016; AIP Publishing: Melville, NY, USA, 2016. [Google Scholar]
  73. Azevêdo, V.; Candeias, A.; Tiba, C. Location study of solar thermal power plant in the state of pernambuco using geoprocessing technologies and multiple-criteria analysis. Energies 2017, 10, 1042. [Google Scholar] [CrossRef]
  74. Schmidt, J.; Cancella, R.; Pereira, A.O., Jr. An optimal mix of solar PV, wind and hydro power for a low-carbon electricity supply in Brazil. Renew. Energy 2016, 85, 137–147. [Google Scholar] [CrossRef]
  75. Silva, A.R.; Pimenta, F.M.; Assireu, A.T.; Spyrides, M.H.C. Complementarity of Brazil’s hydro and offshore wind power. Renew. Sustain. Energy Rev. 2016, 56, 413–427. [Google Scholar] [CrossRef]
  76. Chade Ricosti, J.F.; Sauer, I.L. An assessment of wind power prospects in the Brazilian hydrothermal system. Renew. Sustain. Energy Rev. 2013, 19, 742–753. [Google Scholar] [CrossRef]
  77. De Andrade Guerra, J.B.S.O.; Dutra, L.; Schwinden, N.B.C.; de Andrade, S.F. Future scenarios and trends in energy generation in Brazil: Supply and demand and mitigation forecasts. J. Clean. Prod. 2015, 103, 197–210. [Google Scholar]
  78. Lucena, A.F.P.; Clarke, L.; Schaeffer, R.; Szklo, A.; Rochedo, P.R.R.; Nogueira, L.P.P.; Daenzer, K.; Gurgel, A.; Kitous, A.; Kober, T. Climate policy scenarios in Brazil: A multi-model comparison for energy. Energy Econ. 2016, 56, 564–574. [Google Scholar] [CrossRef]
  79. Nogueira de Oliveira, L.P.; Rodriguez Rochedo, P.R.; Portugal-Pereira, J.; Hoffmann, B.S.; Aragão, R.; Milani, R.; de Lucena, A.F.P.; Szklo, A.; Schaeffer, R. Critical technologies for sustainable energy development in Brazil: Technological foresight based on scenario modelling. J. Clean. Prod. 2016, 130, 12–24. [Google Scholar] [CrossRef]
  80. Leung, D.Y.C.; Caramanna, G.; Maroto-Valer, M.M. An overview of current status of carbon dioxide capture and storage technologies. Renew. Sustain. Energy Rev. 2014, 39, 426–443. [Google Scholar] [CrossRef] [Green Version]
  81. Cuéllar-Franca, R.M.; Azapagic, A. Carbon capture, storage and utilisation technologies: A critical analysis and comparison of their life cycle environmental impacts. J. CO2 Util. 2015, 9, 82–102. [Google Scholar] [CrossRef]
  82. International Renewable Energy Agency (IRENA). Renewable Energy Policy Brief: Brazil; International Renewable Energy Agency: Abu Dhabi, United Arab Emirates, 2015. [Google Scholar]
  83. Ministério das Minas e Energia (MME). Profina. Available online: http://www.mme.gov.br/programas/proinfa (accessed on 16 August 2016).
  84. Dutra, R.M.; Szklo, A.S. Incentive policies for promoting wind power production in Brazil: Scenarios for the Alternative Energy Sources Incentive Program (PROINFA) under the New Brazilian electric power sector regulation. Renew. Energy 2008, 33, 65–76. [Google Scholar] [CrossRef]
  85. Ministério das Minas e Energia, Empresa de Pesquisa Energéticas (MME, EPE). Plano Nacional de Energia 2030; Ministério das Minas e Energia, Empresa de Pesquisa Energéticas: Rio de Janeiro, Brazil, 2007. [Google Scholar]
  86. Ministério das Minas e Energia, Empresa de Pesquisa Energéticas (MME, EPE). Estudos de Demanda de Energia 2050: Nota Técnica dea 13/14; Ministério das Minas e Energia, Empresa de Pesquisa Energéticas Brasil: Rio de Janeiro, Brazil, 2014. [Google Scholar]
  87. Dieckhoff, C.; Appelrath, H.-J.; Fischedick, M.; Grunwald, A.; Höffler, F.; Mayer, C.; Weimer-Jehle, W. Zur Interpretation von Energieszenarien; Nationale Akademie der Wissenschaften, Acatech, Union der Deutschen Akademien der Wissenschaften: Halle, Germany, 2015. [Google Scholar]
  88. Seven2one, MESAP 4.11. 2010. Available online: http://www.seven2one.de/de/technologie/mesap.html (accessed on 31 March 2010).
  89. Pregger, T.; Nitsch, J.; Naegler, T. Long-term scenarios and strategies for the deployment of renewable energies in Germany. Energy Policy 2013, 59, 350–360. [Google Scholar] [CrossRef]
  90. New Energy Externalities Developments for Sustainability (NEEDS). The Needs Life Cycle Inventory Database. Available online: http://www.needs-project.org/needswebdb/index.php (accessed on 15 April 2016).
  91. Trieb, F.; Schillings, C.; Kronshage, S.; Viebahn, P.; Kabariti, M.; Daoud, K.; Jordan, A.; Bennouna, A.; El Nokrashy, H.; Hassan, S. Trans-Mediterranean Interconnection for Concentrating Solar Power; Federal Ministry for the Environment, Nature Conservation and Nuclear Safety: Bonn, Germany, 2006. [Google Scholar]
  92. Trieb, F.; Müller-Steinhagen, H. Concentrating solar power for seawater desalination in the Middle East and North Africa. Desalination 2008, 220, 165–183. [Google Scholar] [CrossRef]
  93. Gils, H.C.; Scholz, Y.; Pregger, T.; Luca de Tena, D.; Heide, D. Integrated modelling of variable renewable energy-based power supply in Europe. Energy 2017, 123, 173–188. [Google Scholar] [CrossRef]
  94. Fichter, T.; Soria, R.; Szklo, A.; Schaeffer, R.; Lucena, A.F.P. Assessing the potential role of concentrated solar power (CSP) for the northeast power system of Brazil using a detailed power system model. Energy 2017, 121, 695–715. [Google Scholar] [CrossRef]
  95. Gils, H.; Simon, S.; Soria, R. 100% renewable energy supply for Brazil—The role of sector coupling and regional development. Energies 2017, 10, 1859. [Google Scholar] [CrossRef]
  96. U.S. Energy Information Administration (EIA). Today in Energy—Electric Generator Capacity Factors Vary Widely across the World. Available online: https://www.eia.gov/todayinenergy/detail.php?id=22832 (accessed on 29 December 2016).
  97. Krewitt, W.; Teske, S.; Simon, S.; Pregger, T.; Graus, W.; Blomen, E.; Schmid, S.; Schäfer, O. Energy [R]evolution 2008—A sustainable world energy perspective. Energy Policy 2009, 37, 5764–5775. [Google Scholar] [CrossRef]
  98. Cao, K.-K.; Cebulla, F.; Vilchez, J.J.G.; Mousavi, B.; Prehofer, S. Raising awareness in model-based energy scenario studies—A transparency checklist. Energy Sustain. Soc. 2016, 6, 28. [Google Scholar] [CrossRef]
  99. International Energy Agency (IEA). Energy balance of OECD countries 2013. In IEA Energy Statistics (Beyond 20/20); International Energy Agency: Paris, France, 2013. [Google Scholar]
  100. International Energy Agency (IEA). Energy balance of non-OECD countries 2013. In IEA Energy Statistics (Beyond 20/20); International Energy Agency: Paris, France, 2013. [Google Scholar]
  101. Suganthi, L.; Samuel, A.A. Energy models for demand forecasting—A review. Renew. Sustain. Energy Rev. 2012, 16, 1223–1240. [Google Scholar] [CrossRef]
  102. Rodrigues, L.A.; Baitelo, R.; Nitta, R.; Simon, S.; Gils, H.C.; Fichter, T.; Schaeffer, R.; Sklo, A.; Pereira de Lucena, A.F.; Soria, R.; et al. Energy [R]evolution—For a Brazil with 100% Clean and Renewable Energy; Greenpeace Brazil: Sao Paulo, Brazil, 2016. [Google Scholar]
  103. United Nations Development Programme (UNPD). World Population Prospects: The 2012 Revision. Available online: http://esa.un.org/unpp/ (accessed on 3 September 2015).
  104. International Monetary Fund (IMF). World Economic Outlook Database; International Monetary Fund: Washington, DC, USA, 2015. [Google Scholar]
  105. International Energy Agency (IEA). Energy Balance of OECD Countries 2014. In IEA Energy Statistics (Beyond 20/20); International Energy Agency: Paris, France, 2014. [Google Scholar]
  106. Jannuzzi, G.M.; Jantim, H. Revolução Energética 2016—Eficiência Energética. Relatório 1, Relatório 2—Potenciais de Conservação de Energia e Relatório 3—Cenário Transição Para Renováveis; International Energy Initiative (IEI), Programa de Pós-Graduação em Planejamento de Sistemas Energéticos da Universidade Estadual de Campinas (UNICAMP): Campinas, Brazil, 2016. [Google Scholar]
  107. Vergara, W.; Rios, A.R.; Galindo Paliza, L.M.; Gutman, P.; Isbell, P.; Suding, P.H.; Samaniego, J.; Pachauri, R. The Climate and Development Challenge for Latin America and the Caribbean: Options for Climate-Resilient, Low-Carbon Development; Inter-American Development Bank (IDB), Economic Commission of Latin America and the Caribbean (ECLAC), World Wildlife Fund (WWF): Washington, DC, USA, 2013. [Google Scholar]
  108. International Energy Agency (IEA). World Energy-Related CO2 Emissions; International Energy Agency: Paris, France, 2016. [Google Scholar]
  109. Kermeli, K.; Graus, W.J.; Worrell, E. Energy efficiency improvement potentials and a low energy demand scenario for the global industrial sector. Energy Effic. 2014, 7, 987–1011. [Google Scholar] [CrossRef]
  110. de Almeida D’Agosto, M.; Schmitz Gonçalves, D.N.; Dos Santos Gonçalves, F.; Machado de Oliveira, C.; do Couto Assumpção, F. Revolução Energética Cenários Para os Transportes no Brasil em 2050; Relatório Final; Laboratório de Transporte de Carga (LTC) do Programa de Engenharia de Transportes (PET/COPPE) da Universidade Federal do Rio de Janeiro (UFRJ): Rio de Janerio, Brazil, 2016. [Google Scholar]
  111. Stetter, D. Enhancement of the Remix Energy System Model: Global Renewable Energy Potentials, Optimized Power Plant Siting and Scenario Validation. Ph.D. Thesis, University of Stuttgart, Stuttgart, Germany, 2014. [Google Scholar]
  112. Thrän, D.; Seidenberger, T.; Zeddies, J.; Offermann, R. Global biomass potentials—Resources, drivers and scenario results. Energy Sustain. Dev. 2010, 14, 200–205. [Google Scholar] [CrossRef]
  113. Deng, Y.Y.; Koper, M.; Haigh, M.; Dornburg, V. Country-level assessment of long-term global bioenergy potential. Biomass Bioenergy 2015, 74, 253–267. [Google Scholar] [CrossRef]
  114. Ferreira-Leitao, V.; Gottschalk, L.M.F.; Ferrara, M.A.; Nepomuceno, A.L.; Molinari, H.B.C.; Bon, E.P. Biomass residues in Brazil: Availability and potential uses. Waste Biomass Valoriz. 2010, 1, 65–76. [Google Scholar] [CrossRef]
  115. Portugal-Pereira, J.; Soria, R.; Rathmann, R.; Schaeffer, R.; Szklo, A. Agricultural and agro-industrial residues-to-energy: Techno-economic and environmental assessment in Brazil. Biomass Bioenergy 2015, 81, 521–533. [Google Scholar] [CrossRef]
  116. Valdez-Vazquez, I.; Acevedo-Benítez, J.A.; Hernández-Santiago, C. Distribution and potential of bioenergy resources from agricultural activities in Mexico. Renew. Sustain. Energy Rev. 2010, 14, 2147–2153. [Google Scholar] [CrossRef]
  117. Evans, A.; Strezov, V.; Evans, T.J. Assessment of sustainability indicators for renewable energy technologies. Renew. Sustain. Energy Rev. 2009, 13, 1082–1088. [Google Scholar] [CrossRef]
  118. Kahn, J.; Freitas, C.; Petrere, M. False shades of green: The case of Brazilian Amazonian hydropower. Energies 2014, 7, 6063–6082. [Google Scholar] [CrossRef]
  119. United Nations Framework Convention on Climate Change (UNFCCC). Greenhouse Gas Inventory Data; United Nations Framework Convention on Climate Change: New York, NY, USA, 2015. [Google Scholar]
  120. Karekezi, S.; Lata, K.; Coelho, S.T. Traditional biomass energy: Improving its use and moving to modern energy use. In Renewable Energy: A Global Review of Technologies, Policies and Markets; Aßmann, D., Laumanns, U., Uh, D., Eds.; Taylor & Francis: London, UK, 2006; p. 230. [Google Scholar]
  121. Luca de Tena, D. Large Scale Renewable Power Integration with Electric Vehicles. Ph.D. Thesis, University of Stuttgart, Stuttgart, Germany, 2014. [Google Scholar]
  122. Naegler, T.; Simon, S.; Klein, M.; Gils, H.C. Quantification of the European industrial heat demand by branch and temperature level. Int. J. Energy Res. 2015, 39, 2019–2030. [Google Scholar] [CrossRef]
  123. Wagner, H.-J.; Unger, H. Validierung und Kommunale Disaggregierung des Expertensystems Herakles, Ruhr-Universität Bochum. In Analyse des Nationalen Potenzials für den Einsatz Hocheffizienter Kraft-Wärme-Kopplung; Krewitt, W., Nast, M., Eikmeier, B., Gabriel, J., Schulz, W., Eds.; Final Report I A 2-37/05 for the Federal Ministry of Economic Affairs, 2006; Deutsches Zentrum für Luft- und Raumfahrt, Bremer Energie Institut.: Stuttgart, Germany, 2002. [Google Scholar]
  124. Augsten, E. Die welt der solaren prozesswärme. Sonne Wind Wärme 2014, 3, 68–76. [Google Scholar]
  125. Fehrenbach, D.; Merkel, E.; McKenna, R.; Karl, U.; Fichtner, W. On the economic potential for electric load management in the German residential heating sector—An optimising energy system model approach. Energy 2014, 71, 263–276. [Google Scholar] [CrossRef]
  126. European Photovoltaic Industry Association (EPIA). Market Report 2013; European Photovoltaic Industry Association: Brussels, Belgium, 2014. [Google Scholar]
  127. Dincer, F. The analysis on wind energy electricity generation status, potential and policies in the world. Renew. Sustain. Energy Rev. 2011, 15, 5135–5142. [Google Scholar] [CrossRef]
  128. Aghahosseini, A.; Bogdanov, D.; Breyer, C. A techno-economic study of an entirely renewable energy-based power supply for North America for 2030 conditions. Energies 2017, 10, 1171. [Google Scholar] [CrossRef]
  129. Global Wind Energy Council (GWEC). Global Wind Statistics 2017; Global Wind Energy Council: Brussels, Belgium, 2018. [Google Scholar]
  130. European Photovoltaic Industry Association (EPIA). Global Market Outlook for Solar Power 2017–2021; European Photovoltaic Industry Association: Brussels, Belgium, 2018. [Google Scholar]
  131. Blakers, A.; Lu, B.; Stocks, M. 100% renewable electricity in Australia. Energy 2017, 133, 471–482. [Google Scholar] [CrossRef]
  132. Peters, J.F.; Baumann, M.; Zimmermann, B.; Braun, J.; Weil, M. The environmental impact of Li-ion batteries and the role of key parameters—A review. Renew. Sustain. Energy Rev. 2017, 67, 491–506. [Google Scholar] [CrossRef]
  133. Pehlken, A.; Albach, S.; Vogt, T. Is there a resource constraint related to lithium ion batteries in cars? Int. J. Life Cycle Assess. 2017, 22, 40–53. [Google Scholar] [CrossRef]
  134. International Energy Agency (IEA). World Energy Outlook 2016—Power Generation Asssumptions; International Energy Agency, Organisation for Economic Co-operation and Development: Paris, France, 2016. [Google Scholar]
  135. Scholz, Y.; Gils, H.C.; Pietzcker, R. Application of a high-detail energy system model to derive power sector characteristics at high wind and solar shares. Energy Econ. 2017, 64, 568–582. [Google Scholar] [CrossRef]
  136. Global Wind Energy Council (GWEC). Global Wind Statistics 2013; Global Wind Energy Council: Brussels, Belgium, 2014. [Google Scholar]
  137. International Energy Agency (IEA). Energy Technology Perspectives 2014—Harnessing Electricity’s Potential; OECD Publishing: Paris, France, 2014. [Google Scholar]
  138. Napp, T.; Bernie, D.; Thomas, R.; Lowe, J.; Hawkes, A.; Gambhir, A. Exploring the feasibility of low-carbon scenarios using historical energy transitions analysis. Energies 2017, 10, 116. [Google Scholar] [CrossRef]
Figure 1. Overview of the Mesap PlaNet energy system model.
Energies 11 00907 g001
Figure 2. Final energy demand by sectors in Mexico and Brazil in E[R] compared to REF.
Energies 11 00907 g002
Figure 3. Fuel demand by source and renewable share in Brazil and Mexico for transport in E[R].
Energies 11 00907 g003
Figure 4. Figure 4. Fuel shares for heat supply (space heat, hot water, process heat) in Brazil and Mexico in E[R].
Energies 11 00907 g004
Figure 5. Power production from different sources in Brazil and Mexico in E[R].
Energies 11 00907 g005
Figure 6. Figure 6. Development of fuel costs and LCOE for Mexico and Brazil in E[R].
Energies 11 00907 g006
Figure 7. Primary energy supply and per capita CO2 emissions in Brazil and Mexico in E[R].
Energies 11 00907 g007
Table 1. Projections of population and economic growth in Brazil and Mexico.
Population (Mio cap)GDP Per Capita ($2010PPP/cap)
20122020203020502012202020302050
Brazil20221121822711,70012,50015,50021,500
Mexico12213213814814,90017,00022,70032,900
(Sources: population form [103]; GDP growth from [30,102,104], extended to 2050 by [14]; PPP = purchasing power parity).
Table 2. Reduction potential in final energy demand by 2050 considered in the E[R] scenarios.
CountryIndustryResidential & Commerce
Brazil40%38%
Mexico39%32%
Table 3. Summary of renewable energy potentials.
Wind OnshoreWind OffshorePVCSPBiomass Residues
GWh/aGWh/aGWh/aGW(th)h/aPJ
Brazil1383420211350098,200157032,30020007200–11,700
Mexico181275038284061,700175028,2002020400–1400
Table 4. Investment cost projections for Brazil and Mexico.
TechnologyUnit202020402050
Coal power plant$2012/kW130016001800
Gas power plant$2012/kW900900900
Gas CHP plant$2012/kW900900900
Photovoltaics$2012/kW1900900600
Concentrating Solar Power *$2012/kW560021001900
Wind onshore$2012/kW120012001100
Wind offshore$2012/kW350025002200
Biomass$2012/kW220021002100
Hydro small$2012/kW320031003000
* For Mexico we assume a solar multiple of 3.5 for Brazil with higher Biomass potentials we assume a solar multiple of 2.
Table 5. Fuel price assumptions in $2012/GJ.
($2012/GJ)Crude OilHard CoalNatural GasBiomass BrasilBiomas Mexico
202018.84.85.71.94.6
204025.15.38.93.55.7
205024.35.610.73.76.3
Table 6. Results for final energy demand in PJ/a by field of application in E[R].
BrazilMexico
(PJ/a)2012202020302040205020122020203020402050
Transport (incl. electricity)3313323227702183179221942269212418391710
Heat (incl. elctricity)2971304629933163329913561538177721312618
Power1986206923043116399010681331177825653367
for transport728166347455414100413573
for heat329379449535641135170198243400
Table 7. Modal & technology shares in final energy for transport in E [R] for 2015 and 2050.
Transportation ModeBrazilMexico
2015205020152050
Aviation domestic9%9%16%16%
Bio-kerosene0%100%0%40%
Navigation2%2%4%4%
Biofuel9%100%0%45%
Rail7%7%5%5%
Electric train etc.53%53%82%82%
Road82%82%75%75%
Biofuel59%59%1%1%
Electric & Hybrid40%40%51%51%
Hydrogen0%0%39%39%
(Source: own calculations based on [11,110]).
Table 8. Installed capacity by technology and dispatchable capacity in E [R] for 2012 and 2050.
Capacity (GW)BrazilMexico
2012205020122050
Fossil2006039
Hydro8411277
Biomass112415
Geothermal0016
Solarthermal045028
Hydrogen0101
Wind385295
PV01000175
Ocean01006
Total capacity 11737770362
Dispatchable capacity1151816986

