Article

A Novel Off-Grid Optimal Hybrid Energy System for Rural Electrification of Tanzania Using a Closed Loop Cooled Solar System

School of Electrical Engineering, Pusan National University, Busandaehak-ro 63beon-gil, Geumjeong-gu, Busan 46241, Korea
*
Author to whom correspondence should be addressed.
Energies 2018, 11(4), 905; https://doi.org/10.3390/en11040905
Submission received: 10 March 2018 / Revised: 5 April 2018 / Accepted: 10 April 2018 / Published: 12 April 2018

Abstract

:
A large proportion of the world’s populations live in developing countries. Rural areas in many of these countries are isolated geographically from grid connections and they have a very low rate of electrification. The uninterrupted power supply (UPS) in these regions is a considerable challenge. The use of renewable energy resources (RER) in an off-grid hybrid energy system can be a pathway to solving this problem. Tanzania has a very low electrification rate (rural 16.9%, urban 65.3%). This paper discussed, described, designed a novel uninterruptible, and environmental friendly solar-wind hybrid energy system (HES) for remote area of Tanzania having closed loop cooled-solar system (CLC-SS). An optimized configuration for the proposed HES was obtained by Hybrid Optimization Model for Electric Renewable (HOMER) analysis software using local solar and wind resources. The designed CLC-SS improved the efficiency of the hybrid solar-wind systems by extracting more power from the solar modules. An evaluation of CLC-SS revealed a 10.23% increase in power output from conventional solar PV modules. The results validate that the optimized system’s energy cost (COE) is 0.26 $/kWh and the net present cost (NPC) of the system is $7110.53. The enhanced output solar wind hybrid system, designed in this paper is cost-effective and can be applied easily to other regions of the world with similar climate conditions.

1. Introduction

In the modern era, there is an increasing need to utilize renewable energy resources (RES) due to the depletion of conventional energy resources (CER). Moreover, CER are causing environmental pollution [1]. Energy is essential to social and economic growth and advances the quality of life [
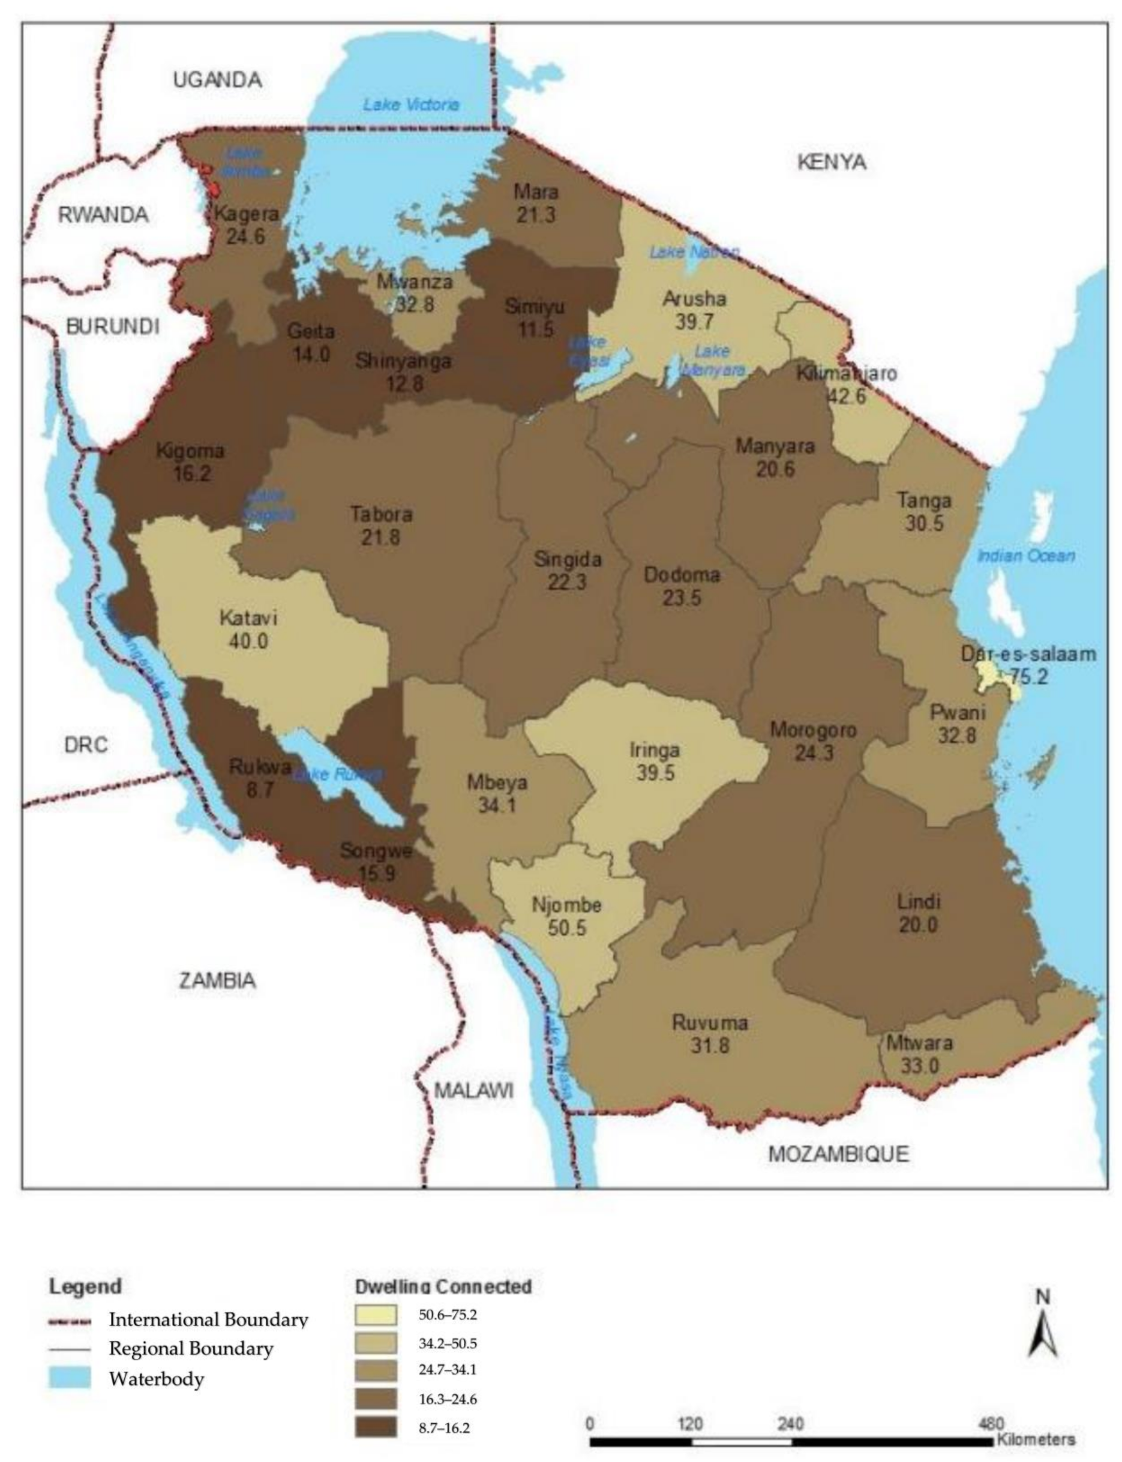
2]. Like most developing countries the main barrier to economic progress in Tanzania is low electrification. Nevertheless, the number of houses in rural areas connected to the national grid has increased significantly over the last half-decade. In [3], approximately 16.9% of rural households in Tanzania mainland were connected to different forms of electricity, which is much lower than the 65.3% of their equivalents in urban areas. The statistical data shows that the highest proportion of households connected to the grid was Dar es Salaam (75.2%) followed in order by Njombe region (50.5%), Kilimanjaro (42.6%), and Katavi (40.0%). Nevertheless, there are still areas with less than 20% access to electricity, such as Kigoma (16.2%), Songwe (15.9%), Geita (14.0%), Shinyanga (12.8%), Rukwa (8.7%), and Simiyu (11.5%), as presented in Figure 1.
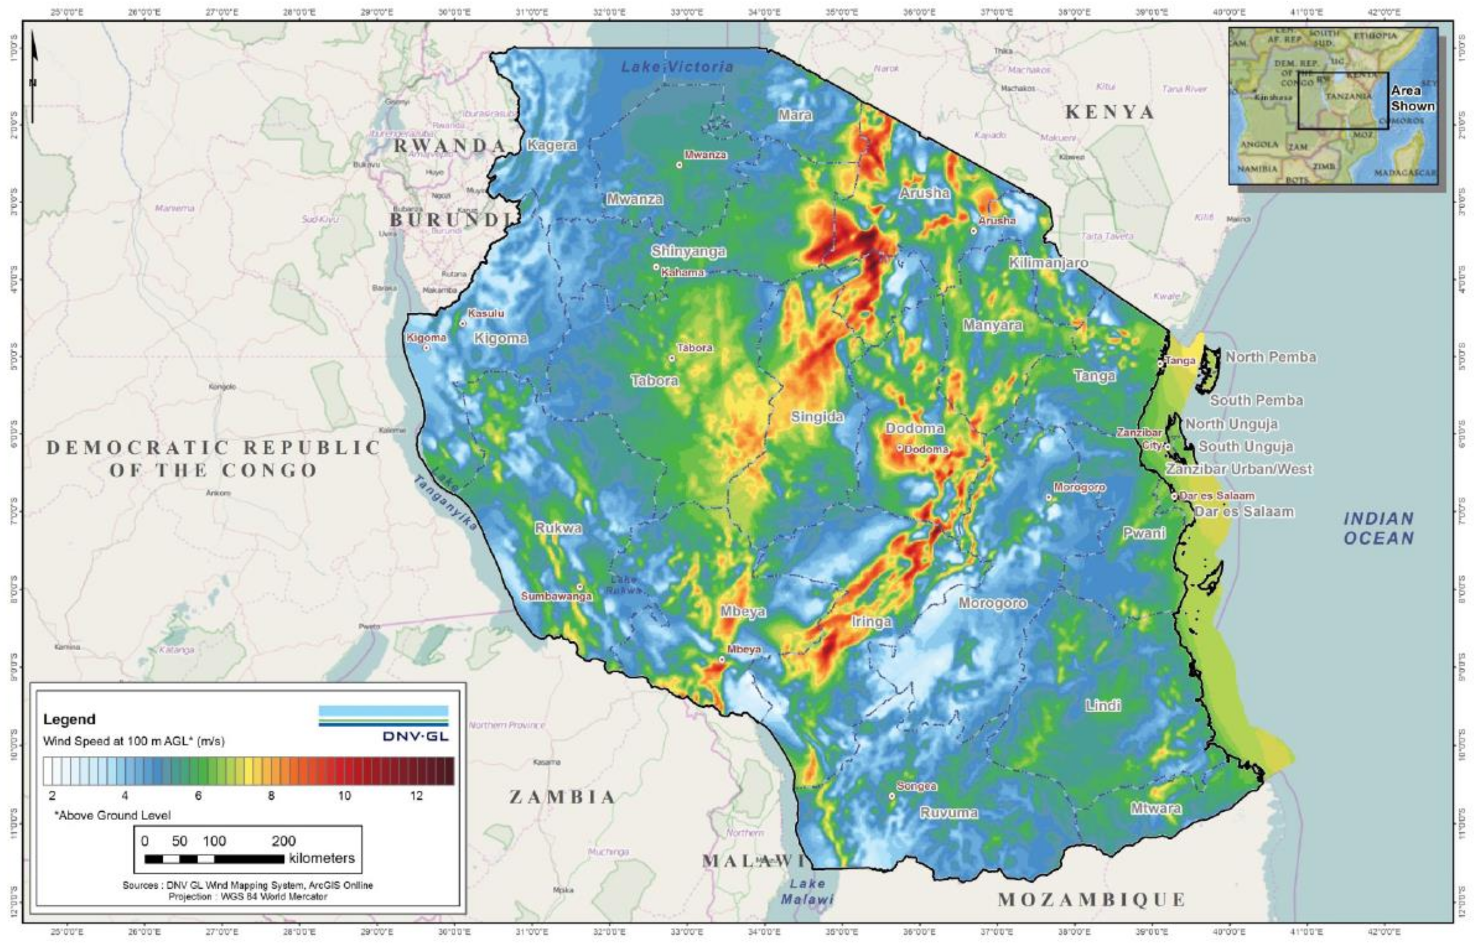
Tanzania has a high RER potential owing to its geographical position, i.e., global solar radiation and amount of wind. Over the last two decades, in Tanzania, the energy consumption has been improved considerably due to economic growth. On the other hand, because of improper future planning, an impressive energy policy is required to achieve sustainable development [4]. Fossil fuels are used as the main source of energy and sidelining with RES, i.e., wind and solar resources, comprising a very small component [5].
According to Tanzanian official generation expansion plan 2035, the dependency on fossil fuel is high, which highlights the lack of research on integrating renewable energy technologies [6]. Owing to increase in the population of Tanzania, installing electric grids in remote areas is expensive and not feasible [7]. The demand for HES is progressing gradually around the world due to the easy and quick installation [8]. Recent research indicates that if the RER are properly optimized, they can act as efficient power sources similar to fossil fuels [9]. Diesel-battery-PV, PV-wind-diesel, etc., can be utilized as hybrid energy system [10]. The RER-based HES can be installed quickly and easily, improving the quality and reliability of energy systems [
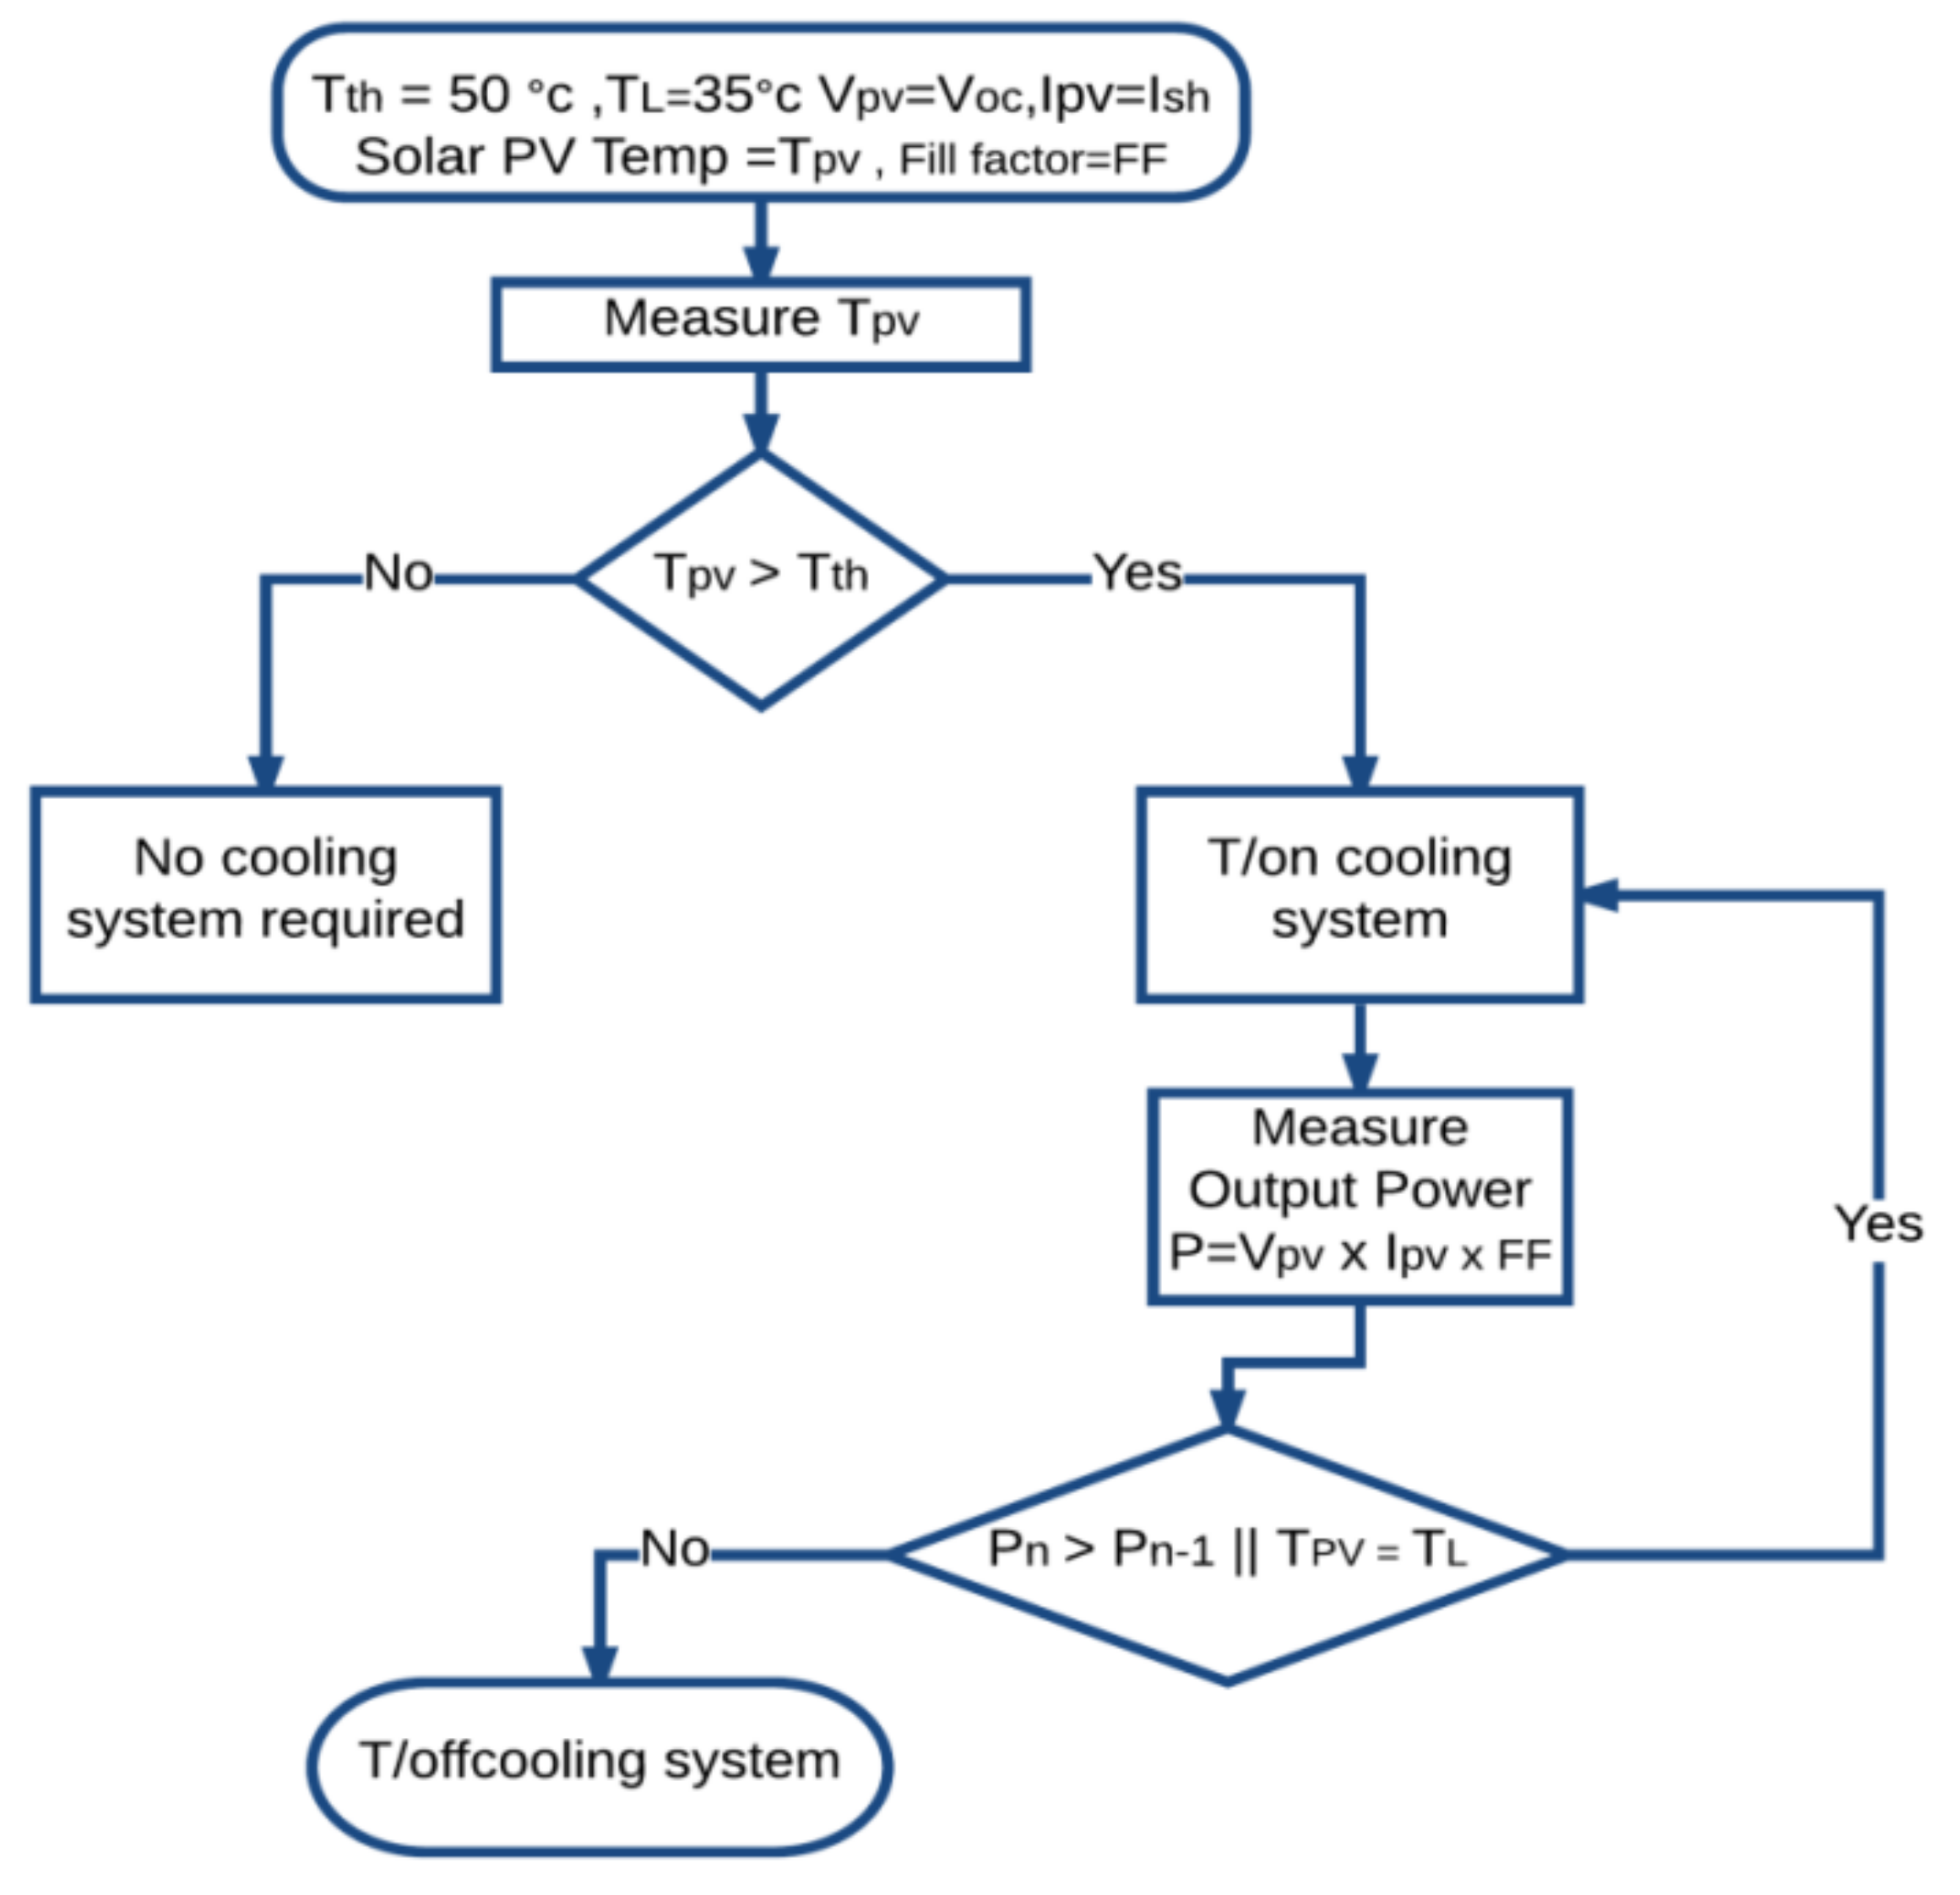
11]. In addition, the power generation capability of the solar based hybrid energy system can be increased using a cooling system [12]. The temperature of PV cells and the conversion efficiency dependency is calculated in [13]. Research has shown that with every 1 increase, the efficiency of an amorphous silicon solar cell decreases by 0.05%; similarly, the reduction varies from 0.4 to 0.5% for a crystalline silicon solar cell [14]. The performance of solar systems can be enhanced using a cooling system. However, the main challenge is to propose an efficient cooling system [15]. In the literature, various solutions have been proposed to minimize the operating temperature of solar PV system [16]. In [17], thermal solar/hybrid PV system is analyzed. The cooling system was attached to the PV panel’s rear side of the module. Comparative assessment of four different cooling systems for Tanzania weather conditions has been studied in [18].
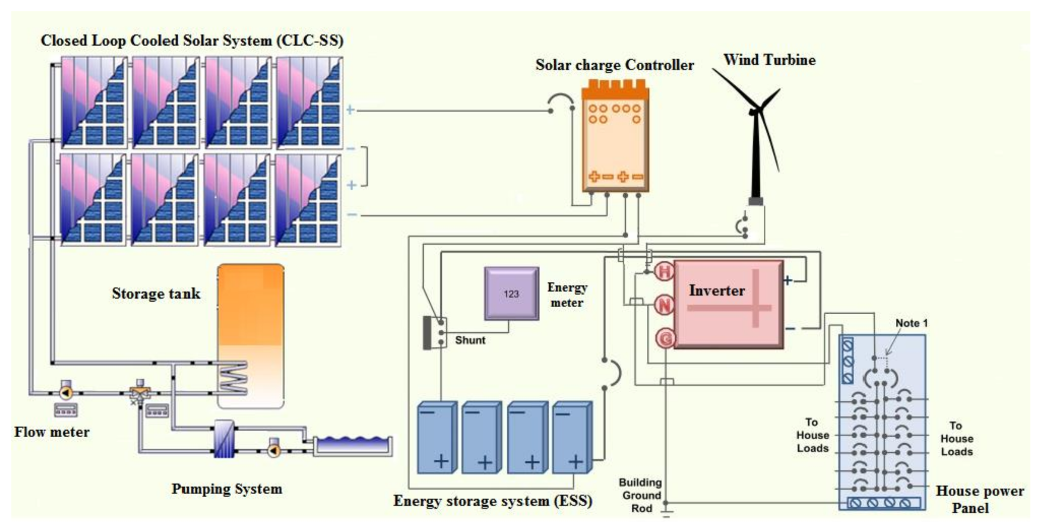
Extensive research has been conducted on the solar wind hybrid energy system, however, less attention has been given to real field conditions where most often the temperature of the solar PV module is greater than defined at standard test conditions. In general, the net power contributed by the solar PV system in solar-wind HES is lower than expected in countries near the equator with hot weather such as Tanzania, Kenya Udanga, and Somalia, etc. This leads to a lower user satisfaction and trust in renewable energy systems. This research proposes a novel hybrid solar wind hybrid energy system with a closed loop water cooling system. The CLC-SS is included in the HES for two very interesting reasons i.e., (1) to increase the net output power delivered by solar PV modules in the HES by cooling them to an optimal temperature range; (2) To utilize heated water generated by the temperature rise due to heat absorption from the PV module for performing useful daily activities with some auxiliary heating system. This approach of cooling solar PV modules will reduce the cost of electricity due to enhancement in electric power without high investments and also with save some power required to heat the water. To find an optimized solution, this study performed a number of simulations. The proposed solution was derived using wind and solar resources of the area and optimized using HOMER software with real-time experiments [19]. Furthermore, a prototype of the proposed solution was also installed on-site. The unique solution proposed in this research is equally applicable for improving electrification rate in rest Sub-Saharan Africa (e.g., Ethiopia, Ghana, Uganda, Zambia, Togo Somalia, Rwanda, Chad, etc.) and developing countries around the world with similar temperature conditions. The remaining of this paper is structured as follows: Section 2 discusses, describes, and elaborates the comprehensive overview of the methodology for investigating an optimized solution. Performance evaluation is carried out in Section 3. Section 4 concludes this paper along with a brief proposal for future work.

2. Methodology-Approach

2.1. Status of Renewable Energy Resources (Solar Wind Resources)

Tanzania is facing an energy crisis as the demand for energy is higher than its supply due to interruptions in electric supply, aging infrastructure, high revenue collection and high electricity tariff due to poor metering, as well as high transmission and distribution losses [20,21,22,23]. Owing to the aforementioned reasons, it is very difficult to connect to the national grid. On the other hand, the geographical position of Tanzania gives it abundant renewable resources, such as wind and solar radiation. Figure 2a shows the average daily/yearly sum of global horizontal irradiation (GHI) from 1994 to 2015 (22 years). The GHI values for the entire country vary from 5.2 to 6.4 kWh/m2, showing an abundance of solar radiation. Figure 2b presents the estimated potential of solar power generation of Tanzania. The average daily/yearly sum of electricity generation data for a 1 kW grid-connected power plant for 1994 to 2015 (22 years) having a daily solar generation capability ranging from 4.4 to 5.0 kWh/kWp [24].
Tanzania has significant wind resources. Using the Det Norske Veritas and Germanischer Lloyd (DNV GL) Wind Mapping System (WMS), 10-year simulations were performed, as elaborated in Figure 3. For the preliminary mesoscale wind speed [25]. Across the country, the long-term wind resources status is provided. The interesting wind climate features of Tanzania are detailed in this Map. In the north of the country, the finest wind resources are abundant, particularly in western Manyara, eastern Shinyanga, and in the mountains surrounding Lake Eyasi in the Arusha, stretching out up to the Kenyan border. Moving in a southwesterly to northwesterly direction in the Iringa region, a region of good wind resource is prominent along the Udzungwa Mountains. To the west and east of the Great Rift Valley, the great wind resources reach out to the Singida and Dodoma regions. Outside the edge of the cliff, the high winds from the east extend into the eastern Tabora region. The southeast regions have some of the country’s lowest wind speed, mostly at the top edge of the Udzungwa Mountains called the Morogoro Region. The offshore and coastal zones and Zanzibar have an enriched resource of easterly winds. In the southwest of the nation, good resources are also found beside the Mbeya Range.

2.2. An Overview of Proposed HES

The experimental study was performed in Mbuguni. Mbuguni is located in Arumeru district Arusha region of Tanzania, near the Tanzania-Kenya border (shown in Figure 4); it is approximately 36 km away from Arusha urban area. Mbuguni’s location makes it a typical Tanzanian rural area, representative of rest of rural areas in the country. The area is a remote rural village with moderately low electricity needs and analogous solar/wind potentials characteristic of the majority of Tanzania.
An overview of the proposed CLC-SS HES is shown in Figure 5. The entire system includes a wind turbine, a solar PV plant with a rear-mounted pipe, a motor pump for water circulation in the pipe with Arduino control ON/OFF system (titled as pumping system in the Figure 5), a water storage tank, an inverter, a charge controller, flow meters, an energy meter and additional optional components for safe and efficient distribution. Detailed information on cost assumptions and procedural factors of key system components is discussed in Section 2.3.

2.3. Components of Designed HES

A closed loop cooled solar-wind HES is designed for remote and distributed locations to meet the load demands, taking into account the weather data at that location. The weather data consisted of annual or monthly solar radiation, average wind speed, and average temperature. PV arrays were selected to account for the solar irradiance and load requirements for specific regions. The wind turbine was chosen considering the average wind speed, rated wind speed, and sweep area. The HOMER software/database (Pro 3.11, HOMER Energy, Boulder, CO, USA) was used to search for optimized solutions based on the available resources. The specifications of the components used for the analysis of the design of the HES are given as under.

2.3.1. Solar PV Modules/System

The electrical power (in kWp) generated by the solar PV module can be estimated using the following equation:
E = A × r × H × P R
where in Equation (1), E is the energy in kWh, A is the total area (m2) of panel, r stands for panel yield or efficiency (%), H is the annual average solar radiation and P R is the performance ratio. The performance ratio ranged from 0.5 to 0.9 [25]. To calculate the extraterrestrial horizontal radiation ( H o , a v e ), for a specific location (kWh/m2/day) we need to know about the declination ( δ ) and intensity of solar radiation ( G o n ) at the top of the earth’s atmosphere. The declination ( δ ) changes gradually, which can be calculated easily using the following Equation (2):
δ = 23.45 sin ( 360 284 + n 365 )
The intensity of solar radiation ( G o n ) at the top of the Earth’s atmosphere can be found as follow
G o n = G s c ( 1 + 0.033   cos 360 n 365 )
where G s c is the solar constant having a value of 1.367 kW/m2 and n is the day of the year [a number between 1 and 365].
Total daily extraterrestrial radiation per square meter from sunrise to sunset can be calculated as:
H o = 24 π ( cos cos δ sin ω s + π ω s 180 sin sin δ )
where H o the average extraterrestrial horizontal radiation for the day (kWh/m2/day), is latitude and ω s is angle of sunset.
The angle of sunset ( ω s ) needs to be determined to obtain the hours of sunlight available on a specific day. The angle of sunset ( ω s ) is related to the latitude and declination using the following relation:
ω s = cos 1 ( tan tan δ )
The average extraterrestrial horizontal radiation for the month ( H o , a v e ) (kWh/m2/day) can be calculated relating H o and the number of days in the month:
H o , a v e = n = 1 N H o N
The average monthly horizontal radiations for the location where experiments were performed (i.e., Mbuguni Tanzania) are explained in Section 3 (results and discussion) while the specifications and consideration of the PV system are given in Table 1 below.

2.3.2. Wind Turbine

In our research, we utilized a market available wind turbine designed specifically for low and moderate speeds instead of the built-in wind turbine in HOMER. The wind turbine with a power generation capability of 1 kW was used in the simulations with a hub height of 8 m.
The power curve for the wind turbine was obtained from the manufacturer and the simulations were conducted based on the power curve of the turbine as illustrated in Figure 6. The lifetime of the turbine was defined as 20 years. Table 2 lists the specifications of the wind turbine used for analysis.

2.3.3. Battery

Electric power generation by a solar PV module and wind turbines is related directly to the amount of solar radiation and wind speed, and the continuous availability of these two sources to generate electricity is not guaranteed. Therefore, a storage system is needed to save some energy when there are insufficient wind and solar power available to run a specific load. During the charging process, the available battery bank capacity at time (𝑡) can be described as:
E B A T ( t ) = E B A T ( t 1 ) E C C O U T ( t ) × η C H G
The available battery bank capacity during the discharging time can be given by Equation (8):
B A T ( t ) = E B A T ( t 1 ) E N e e d e d ( t )
The depth of discharge (DoD) is a measure of how much energy has been withdrawn from a storage device, and is expressed as a percentage of the full capacity according to Equation (9):
D o D = ( 1 d ) × 100
HOMER built-in batteries with a normal voltage 12 V, normal capacity 1 kWh, maximum capacity of 83.4 Ah, and capacity ratio of 0.403 were used for the analysis. Detail specifications of the battery model used for analysis are given in Table 3.

2.3.4. Converter Specification

Homer built-in converters have been considered to convert the direct current (DC) output of a solar panel and battery system to an AC load as well as to convert the electrical power from alternating current (AC) to direct current (DC) in a process called rectification. A given converter operates in inverter and rectifier mode with efficiencies of 95% and 90%, respectively. The size of the converter depends on the type of architecture used for the analysis.
The energy output of the converter in rectifier model are given by Equations (10) and (11):
E R E C O U T ( t ) = E R E C I N ( t ) × η R E C
E R E C I N ( t ) = E S U R A C ( t )
The energy output of the converter in the inverter model for battery bank is expressed as Equation (12) as follows:
E B A T I N V ( t ) = [ E B A T ( t 1 ) E L O A D ( t ) η I N V × η D C H G ]

2.3.5. Closed Loop Cooled–Solar System (CLC-SS)

The performance of a PV module is usually specified in standard test conditions (cell temperature ( T p v ) 25°, irradiance ( I r ) 1000 W/m2 and an air mass of 1.5). However, under actual field conditions, the performance of the module differs from the expected results of the standard test conditions (STC) due to a variety of continuously varying conditions. It is therefore important to monitor the operation of the PV module under actual conditions at a temperature higher than the ambient temperature defined by STC. Usually the working temperature of a PV is higher than environmental temperature: the problem is that with a higher environmental temperature there is no way to reduce the temperature of PV without the application of specific cooling system
In accordance with literature review and previous studies, we developed and compared the following cooling technologies to accomplish the most effective cooling topology for PV systems. The PV modules were integrated with approximately 20 mm thick pipes (for circulation of cooled water) attached to the back of the module. The water needed to be supplied to the solar module was stored in a storage tank having an insulation thickness of 10 mm. The outlet of the tank was connected to the pump to circulate the water at the required pressure. A flow meter with a maximum flow rate of 8.33 liters per minutes (LPM) was used to ensure a regulated flow of water. The circulating water served as coolant to capture unwanted thermal energy of the PV modules and generate hot (heated) water collected at the outlet. A water pump of the specifications outlined in Table 4 was used to develop an experimental setup for the CLC-SS. The temperatures at numerous points in the CLC-SS were recorded using submerged digital thermometers. Additionally, control algorithm for CLC-SS operation and experimental set up for proposed cooling systems as follows:
a. Control algorithm for CLC-SS operation
The non-stop operation of a cooling system is not recommended for a solar PV system. The enhancement in the output energy of a solar PV module will be less than the electricity required to run these cooling systems. The ON/OFF control of the cooling system is described by the developed algorithm (Figure 7). A threshold temperature (Tth) of 50 °C was selected as recommended in [26,27,28] for ON/OFF the cooling system. The algorithm was implemented on Arduino managed software with power and based on the if else condition decides to turn on the cooling system when Tth = 50 °C or turn off the cooling system when the temperature of PV module ( T P V ) = T L or when P n > P n 1 , i.e., no improvement in the output power even using cooling system.
b. Experimental set up for proposed cooling systems
The experimental arrangements were made to accomplish the effects of the CLC-SS on the output power and operating temperature. The experiments were conducted in January 2017 at the star secondary school, Mbuguni, Arusha, Tanzania ((latitude 3°23′58″ S and longitude 36°47′48″). An overview of the cooling system developed for the solar PV modules is given in Figure 8.
Thermo-graphic images were recorded at specified time intervals using a VT04A visual IR thermometer (FLUKE, Everett, WA, USA). An EL-USB-3 voltage data logger and EL-USB-3 temperature and humidity data logger (Lascar electronics, Erie, PA, USA) were used to record and store the open circuit voltage and operating temperature for the panel with no cooling ( T p v ( N C ) ), and CLC-SS ( T p v ( C L C S S ) ). Experiment settings consistently collected data from sunrise to sunset. An overview of the cooling system developed for the solar PV modules is given in Figure 8.

3. Results and Discussions

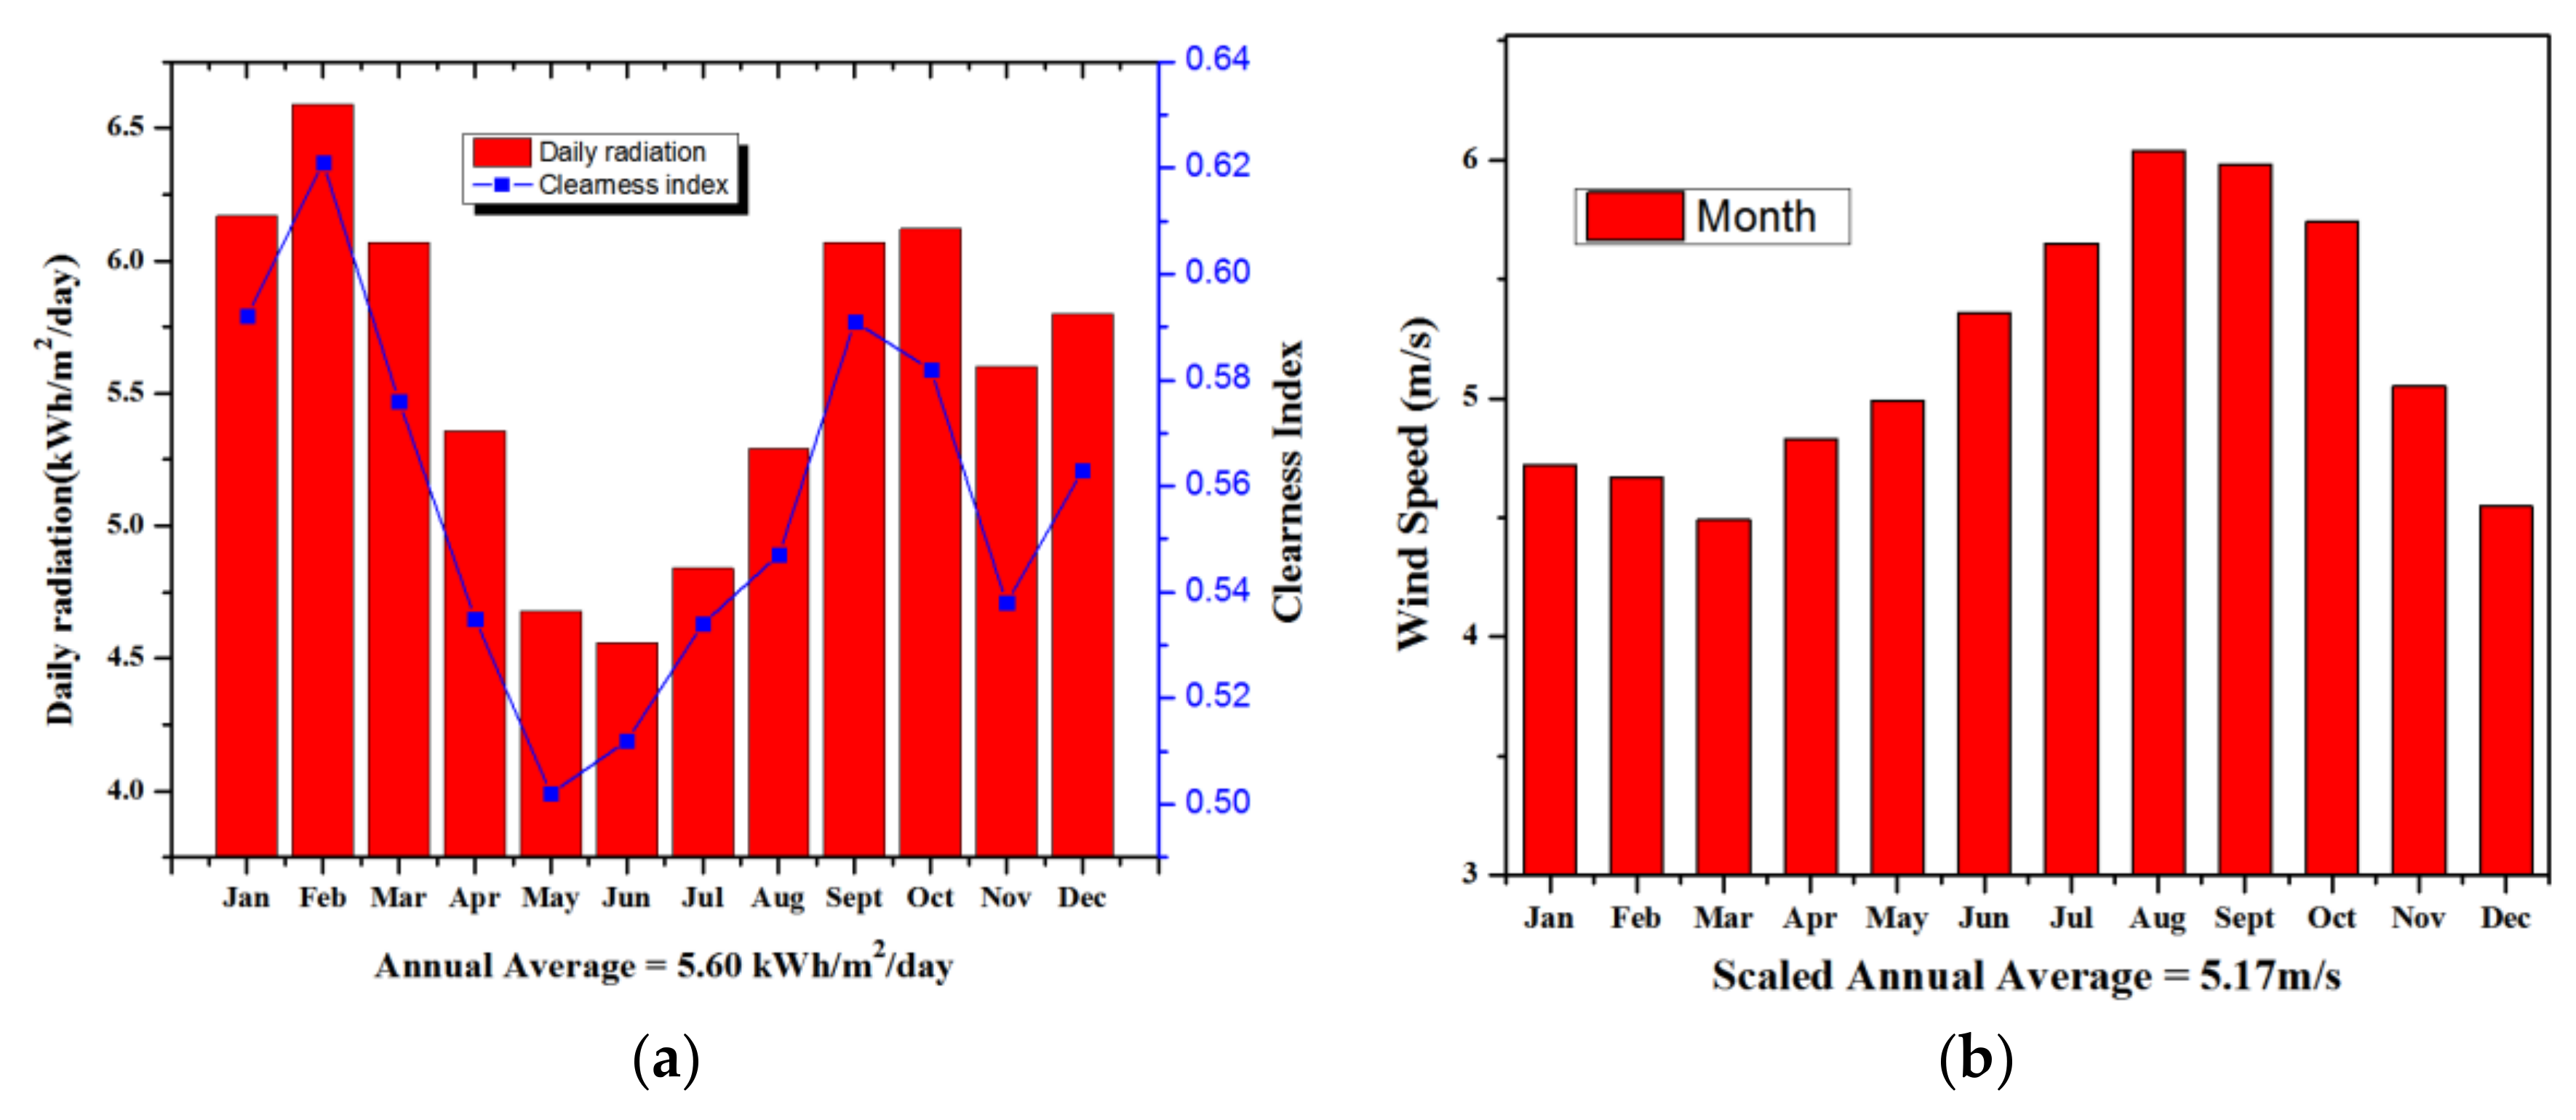
The daily solar radiation and wind speed data was collected from National Aeronautics and Space Administration (NASA) and National Renewable Energy Laboratory (NERL) and on-site weather stations. An evaluation of solar insulation on horizontal surfaces was performed using Angstrom Correlation and Arusha’s daylight time data. Like all of Tanzania, Mbuguni also receives a large amount of solar radiation (kW/m2/day) every day. The amount of solar radiation varies during different months of the year; with January, February, March, September, and October having a higher level of solar radiation than the average annual daily radiation: 6.17 kW/m2/day, 6.59 kW/m2/day, 6.07 kW/m2/day, 6.07 kW/m2/day and 6.12 kW/m2/day, respectively; and May, June, and July having comparatively less radiation (4.68 kW/m2/day, 4.56 kW/m2/day and 4.84 kW/m2/day, respectively). August, November, and December receive approximately 5.29 kW/m2/day, 5.60 kW/m2/day and 5.8 kW/m2/day, respectively, which is similar to the mean values of the year. The average solar radiation at each month is shown in Figure 9a. The wind speed (m/s) of Mbuguni is moderate and good enough to generate a significant amount of electricity using wind turbines. In contrast to the daily solar radiation of each month, Mbuguni have good wind speed in June, July, September, and October. Monthly average wind speed is given in Figure 9b.
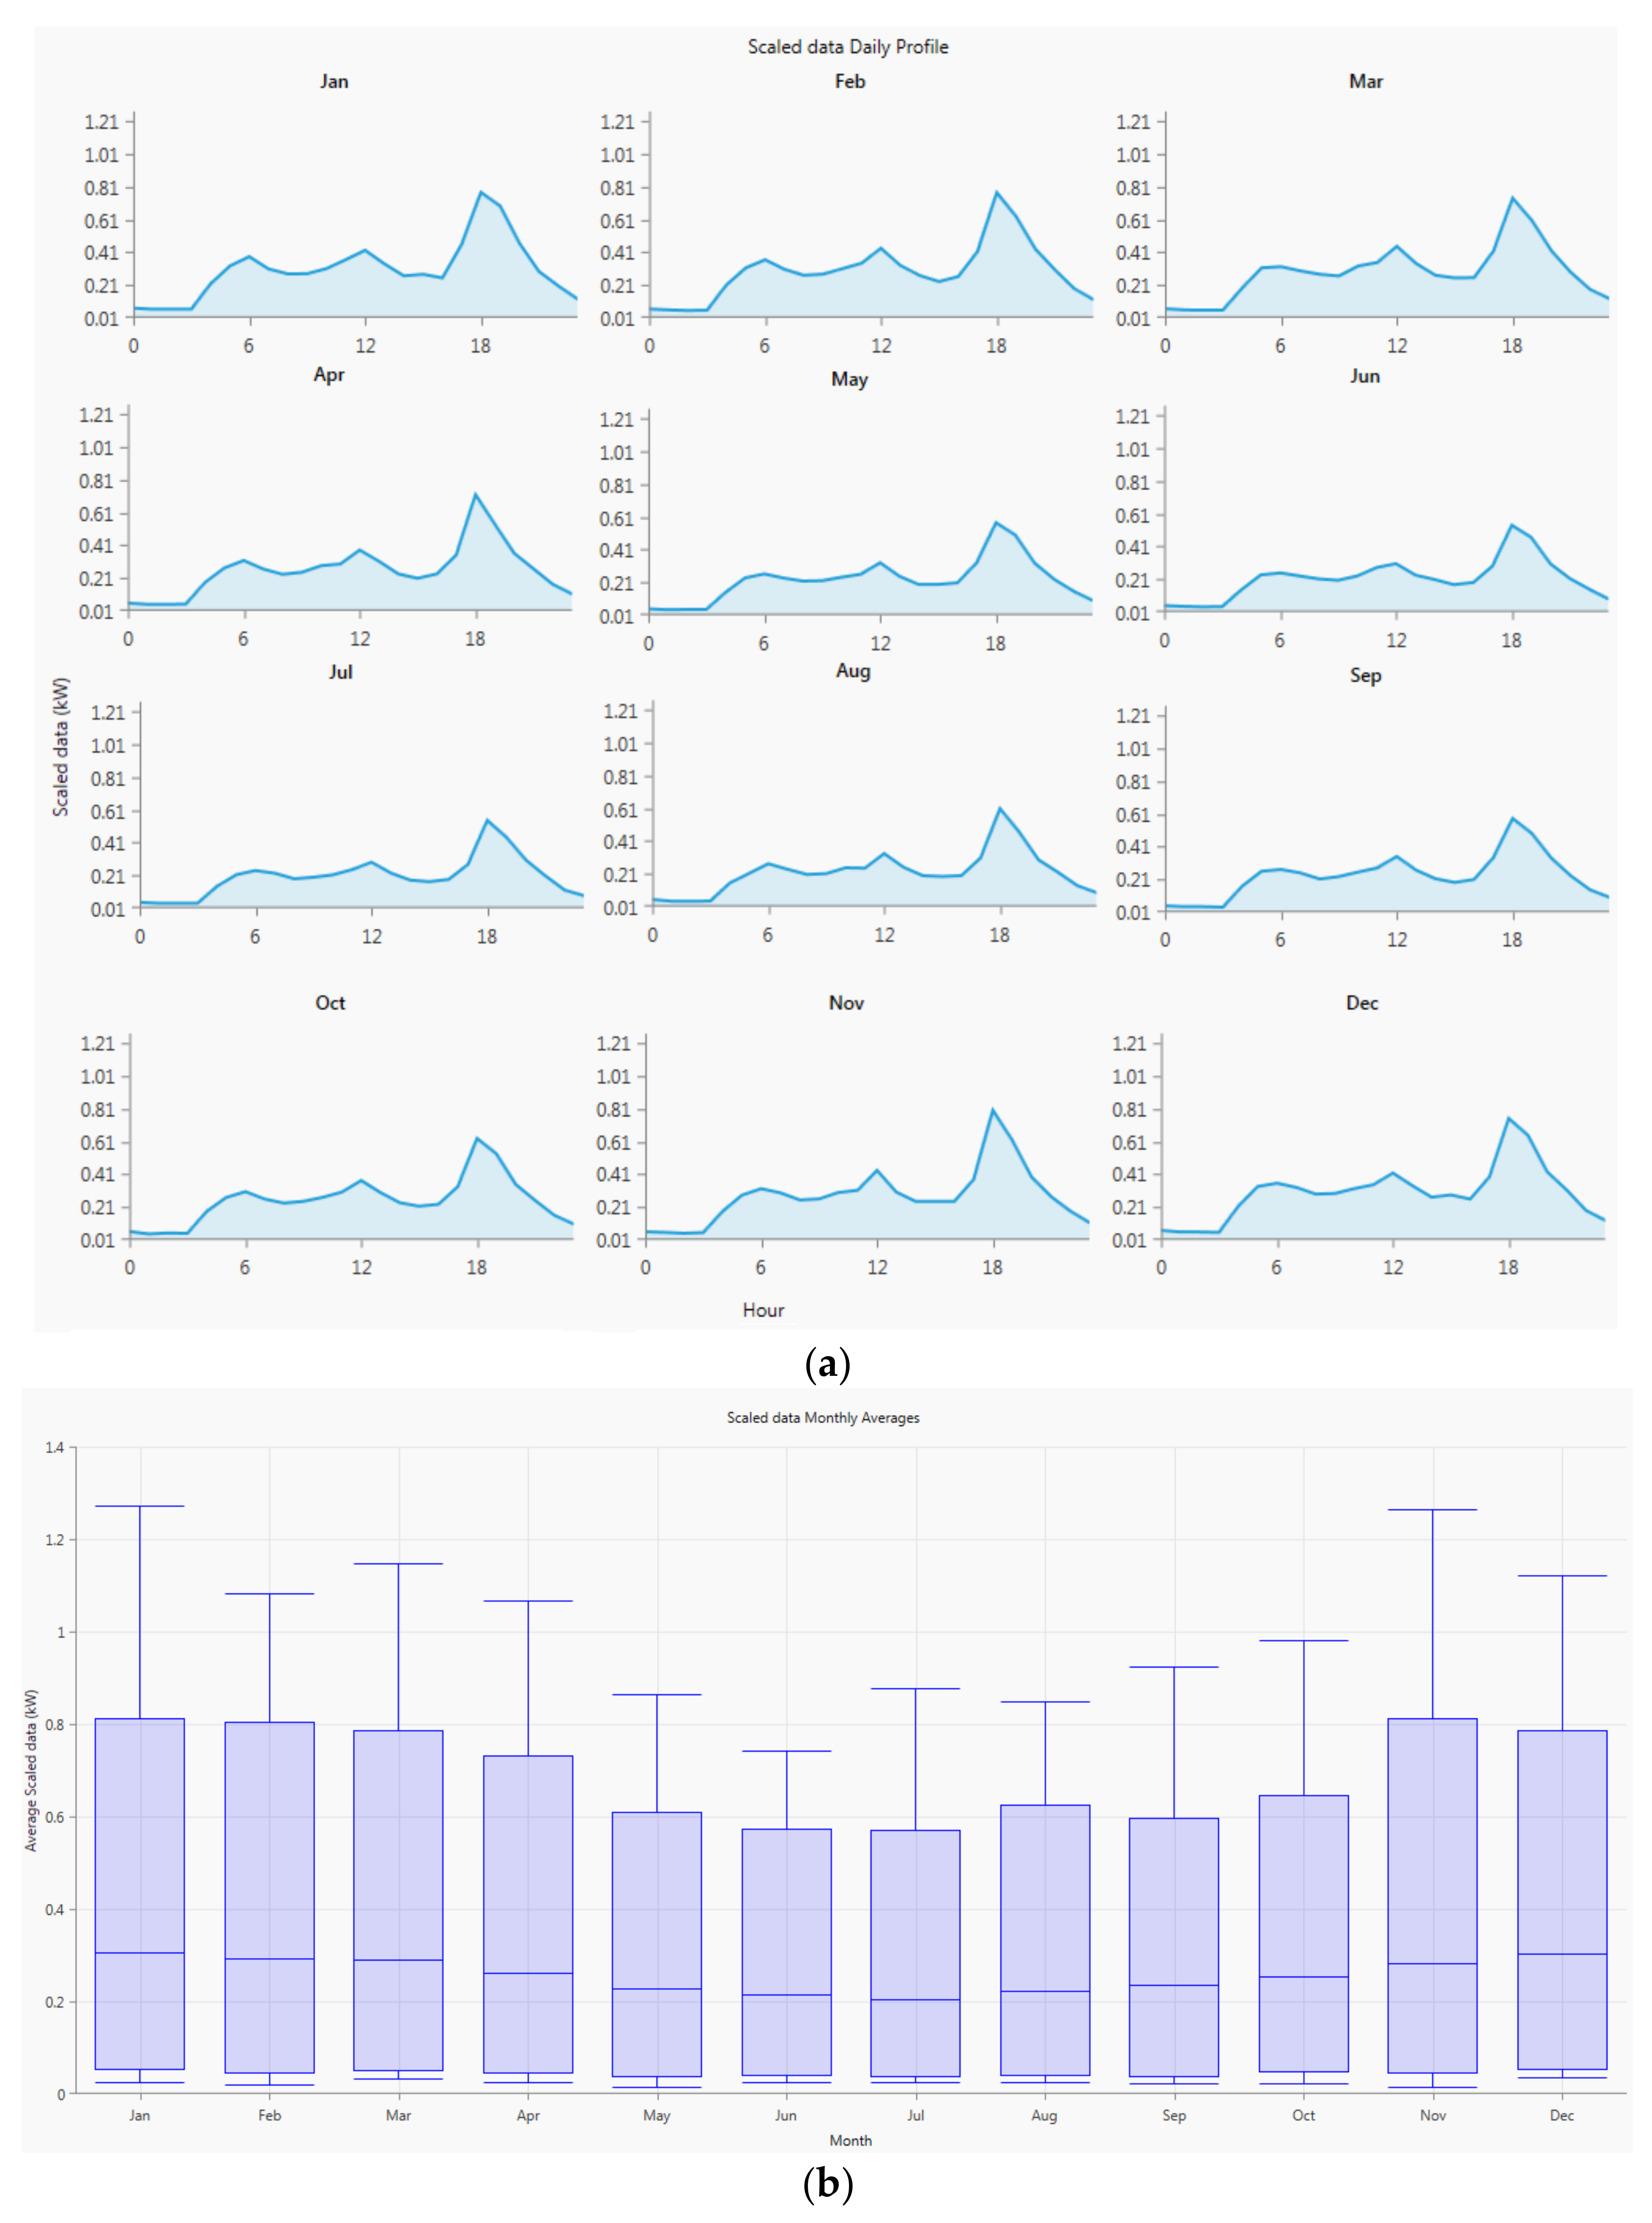
Most houses in Tanzania/Mbuguni have very little use of electricity except for charging mobile phones, watching television, lighting their houses, electric fans for cooling, and for water pumping motors. An average scaled annual load of 6.180 kW/day and the scaled peak load of 1.2722 kW with a load factor of 0.2024 was considered for the analysis, design, and selection optimal energy system for this area (Mbuguni/Arusha). The variations of load occur during different hours of the day and night, also varied with the different months of the year with January and February showing comparatively more power consumption and June and July showing comparatively less than the average electricity consumption within each month. Figure 10a,b show the average scale daily and monthly consumption, respectively. The average scaled annual daily loads selected were sufficient to provide electricity for the operation of these household activities.

3.1. Investigating Appropriate Architecture/Structure

HOMER can design optimal composite RER with many hourly simulations performed repeatedly by the software. The numerous values for wind speed, solar radiation, diesel cost, and minimum renewable fraction were considered to perform these simulations. The HOMER Optimizer® (Pro 3.11, HOMER Energy, Boulder, CO, USA) uses a trademarked derivative-free algorithm to search for the least-costly system. HOMER then displays a list of configurations, sorted by net present cost (sometimes called life-cycle cost), that can be used to compare system design options. For Mubuguni weather conditions, HOMER performed 10,648 simulations suggesting 5324 optimization cases arranged in ascending order of low net present cost. Diesel generators (DGs) were not part of our proposed HES, however, DGs were initially considered for HOMER analysis and comparison (as HOMER considers DGs as base case for cost estimates). Specifications and fuel cost for generator are provided in Table A1 (
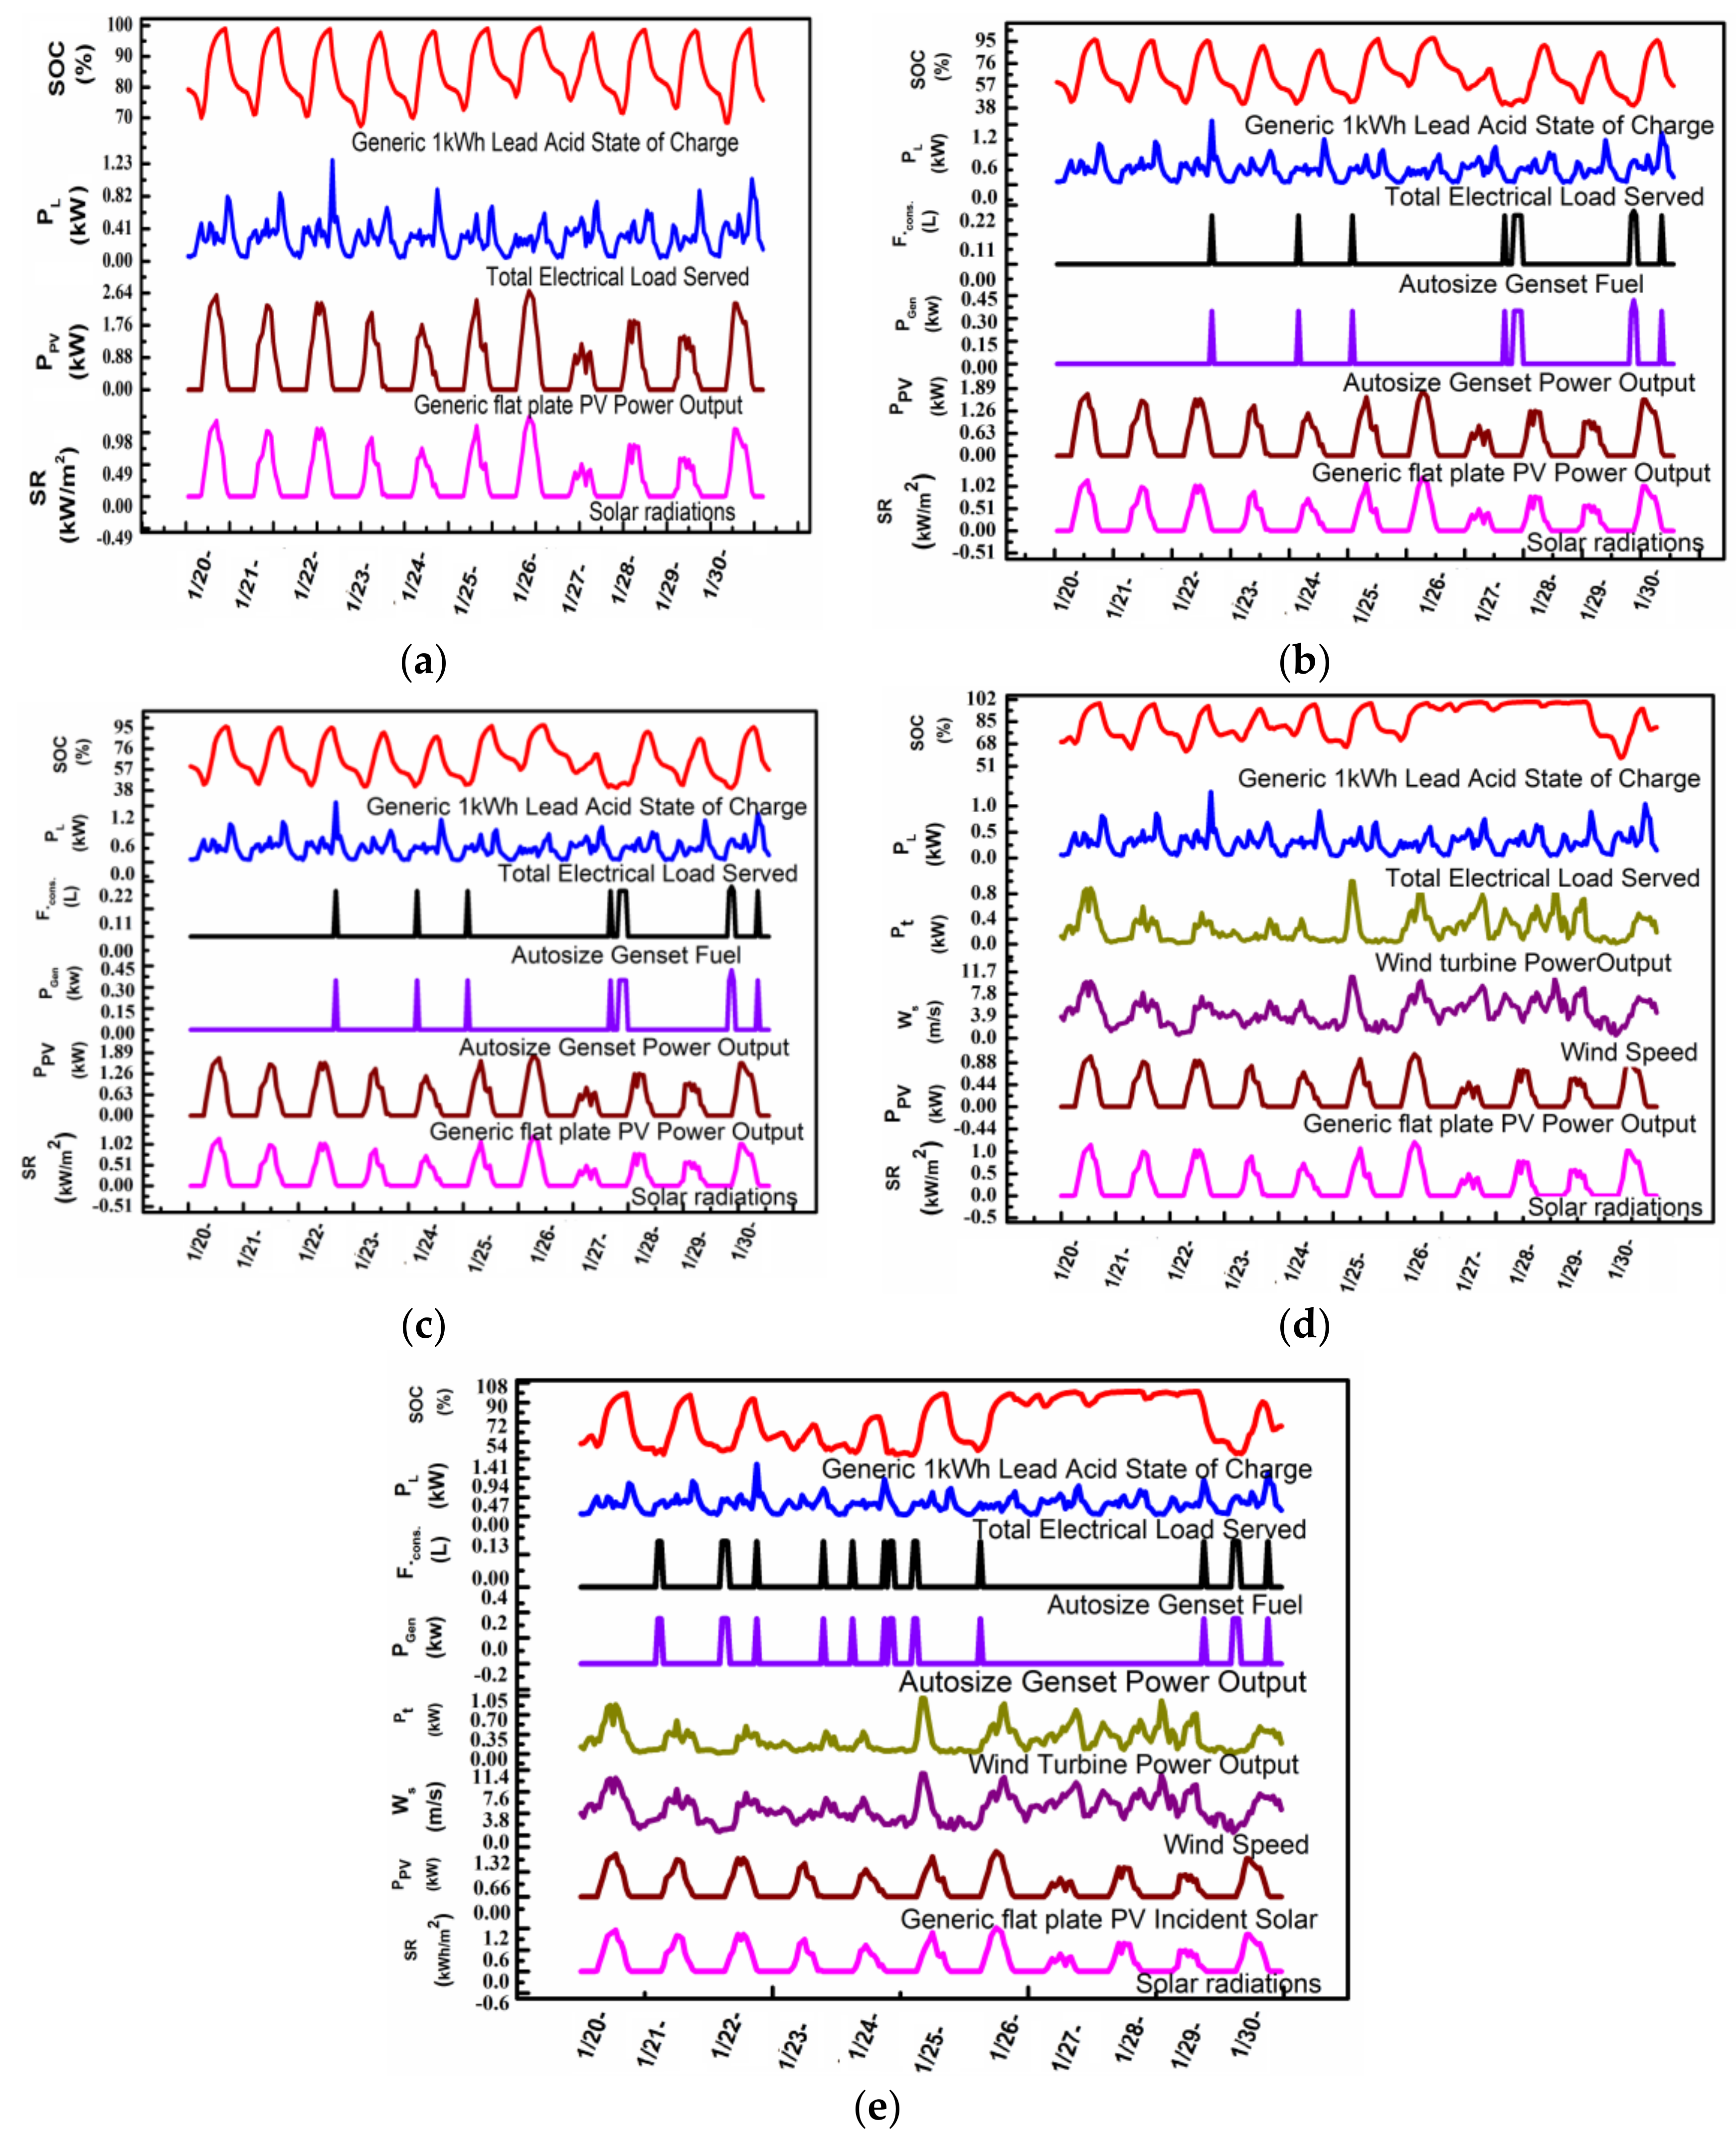
Appendix A). Based on the optimized system suggested after a brief analysis of local renewable resources by HOMER, five different configurations were considered as comparative and optimized solutions: (1) solar-wind-generator HES (SPV-W-GEN); (2) solar PV system (SPV); (3) solar–wind hybrid (SPV-W); (4) solar-generator HES (SPV-GEN); and (5) wind-generator (W-GEN) as depicted in Figure 5. All five systems were off-grid and the size of the system was optimized in such a way that all the energy generated by the systems used served the electrical load of houses, where these systems were installed to avoid any expenses related to grid expansion. Comparative analysis was performed by comparing the outcomes of these five systems with the base system comprised of a generator serving the load Table 5 depicts the analysis of different architecture with corresponding solar, battery, wind turbine, converter system, and DG required for each architecture.
The total amount of power delivered by the solar PV system, wind turbine, and auto size generator within these five structures (SPV-W-GEN, SPV, SPV-W, SPV-GEN, and W-GEN) in contribution to serve the total electric load was measured at the experimental location as presented in Figure 11. In the case of the SPV system, the entire load was served by the solar panel proposed in the architecture (3.36 kW). The lead-acid batteries state of charge (SOC) depends entirely on the amount of power provided by solar panels or the load served by these batteries in the case of no or low power from the solar panels. A large number of solar panels and lead-acid batteries (16 nos. in the case of SPV) are required because the amount of power generated in the SPV architecture is only due to the solar panel and its quality depends on the solar irradiance available, i.e., no power generation before sunrise and after sunset or less power generation on cloudy and least sunny days. Maintenance of the battery is also a bottleneck for the widespread adoption of this architecture. In the case of the SPV-W-GEN, SSPV-GEN, and W-GEN architectures, the load served by these architectures is contributed by the generator along with the other RER, i.e., solar and wind, and requires the continuous availability of fuel (diesel) whenever the generator is operated in these architectures to serve the load. The amount of power delivered by an auto size generator along with fuel consumption (L) in any of architectures as shown in the Figure 11. The transportation of fuel to the remote area of Mbuguni (Tanzania) is challenging and also it causes serious environmental pollution. SPV-W, on the other hand, does not require any generator to serve the load, and it requires a smaller number of lead-acid batteries (10 nos.) than SPV (16 nos.). The battery SOC depends on the power delivered by both the solar panel ( P P v ) and wind turbine ( P t ) and the load. Wind power is even available when there is little or no solar irradiance. The wind speed in Mbuguni helps generate a considerable amount of power using a wind turbine. All the systems were designed keeping in view an interrupted availability for power. For example, Figure 11b confirms the uninterruptible power supply by the designed solar wind HES. The Figure 11b shows that the power required for the analyzed load (6.18 KWp) is always available. The uninterruptible availability of power can be easily assured from the battery SOC. Even if there is insufficient solar or wind power, the SOC of the energy storage system (battery) never drops to the threshold value (discharge depth: 15%) and a sufficient amount of net power can be used even at peak load.

3.2. Economical Comparisons

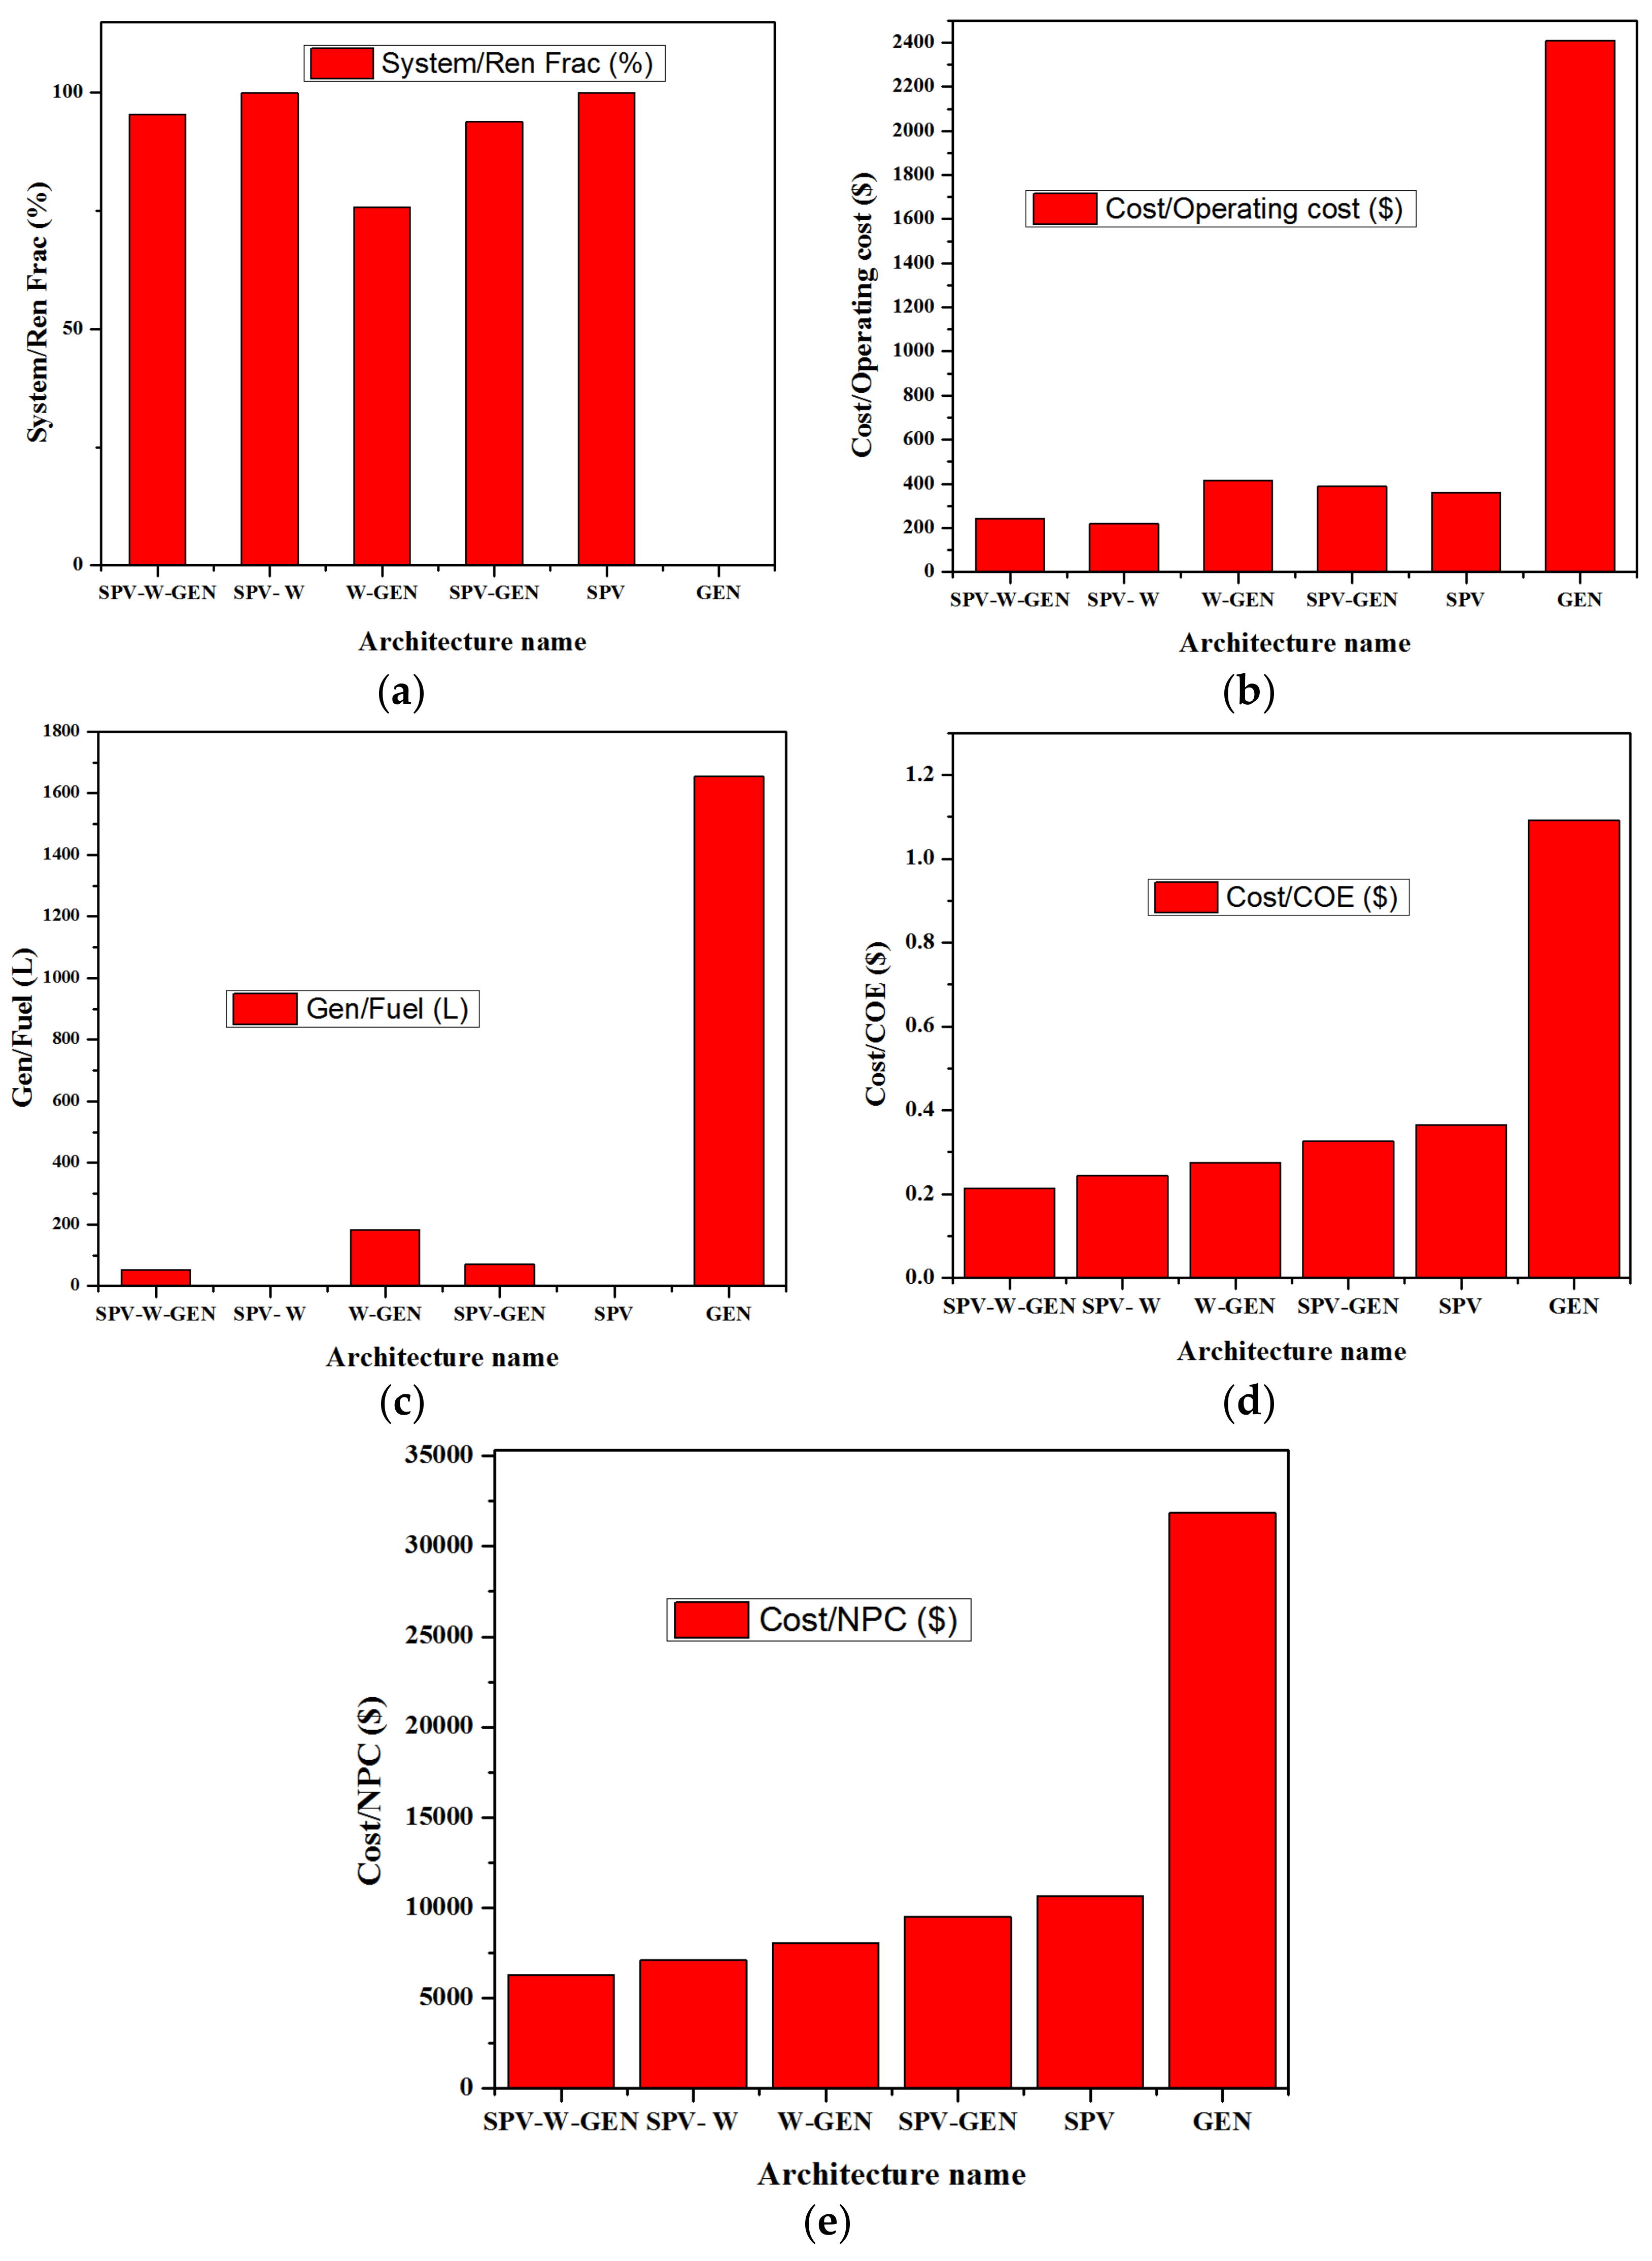
An assessment done by HOMER showed that SPV-W-GEN, W-GEN, and SPV-GEN offer 95.40%, 75.78%, and 93.86% renewable penetration, respectively. SPV-W and SPV offer 100% renewable penetration and are very economical while the base system of GEN is the worst with 0 renewable energy penetration as depicted in Figure 12a. The operating cost of the base system (GEN) is too high ($2409.94) to be selected as the source of electricity for the local community of Mbuguni. The operating cost of SPV-W-GEN, W-GEN, SPV-GEN, and SPV are $239.86, $413.81, $388.90 and $359.30, respectively (see Figure 12b). The operating cost of the SPV-W ($218.952) was least of all the systems considered. The fuel cost of all these systems was analyzed: SPV-W-GEN, W-GEN, SPV-GEN, and GEN were 52.42 L, 183.32 L, 69.92 L, and 1654.39 L, respectively as illustrated in Figure 12c. SPV-W and SPV are 100% percent based on renewable and do not require any fuel for their operation. This advantage makes them superior over the other methods. The COE for GEN is 1.09238, which is much higher than the rest. The COE of SPV-W-GEN, SPV-W, W-GEN, SPV-GEN, and SPV are $0.21467, $0.24394, $0.27541, and $0.32599, respectively as elaborated in Figure 12d. The net present cost (NOC) for SPV-W-GEN, SPV-W, W-GEN, SPV-GEN, SPV, and GEN are $6259.86, $7110.53, $8031.25, $9505.97, $10,638.53, and $31,854.57, respectively as shown in Figure 12e.
Based on the obtained results of Figure 12 from HOMER analysis, SPV-W, which requires low operating cost and no fuel consumption, 100% percent renewable penetration, and low COE, was selected as a good and feasible HES considering the weather conditions of Mbuguni.

3.3. Analysis of CLC-SS

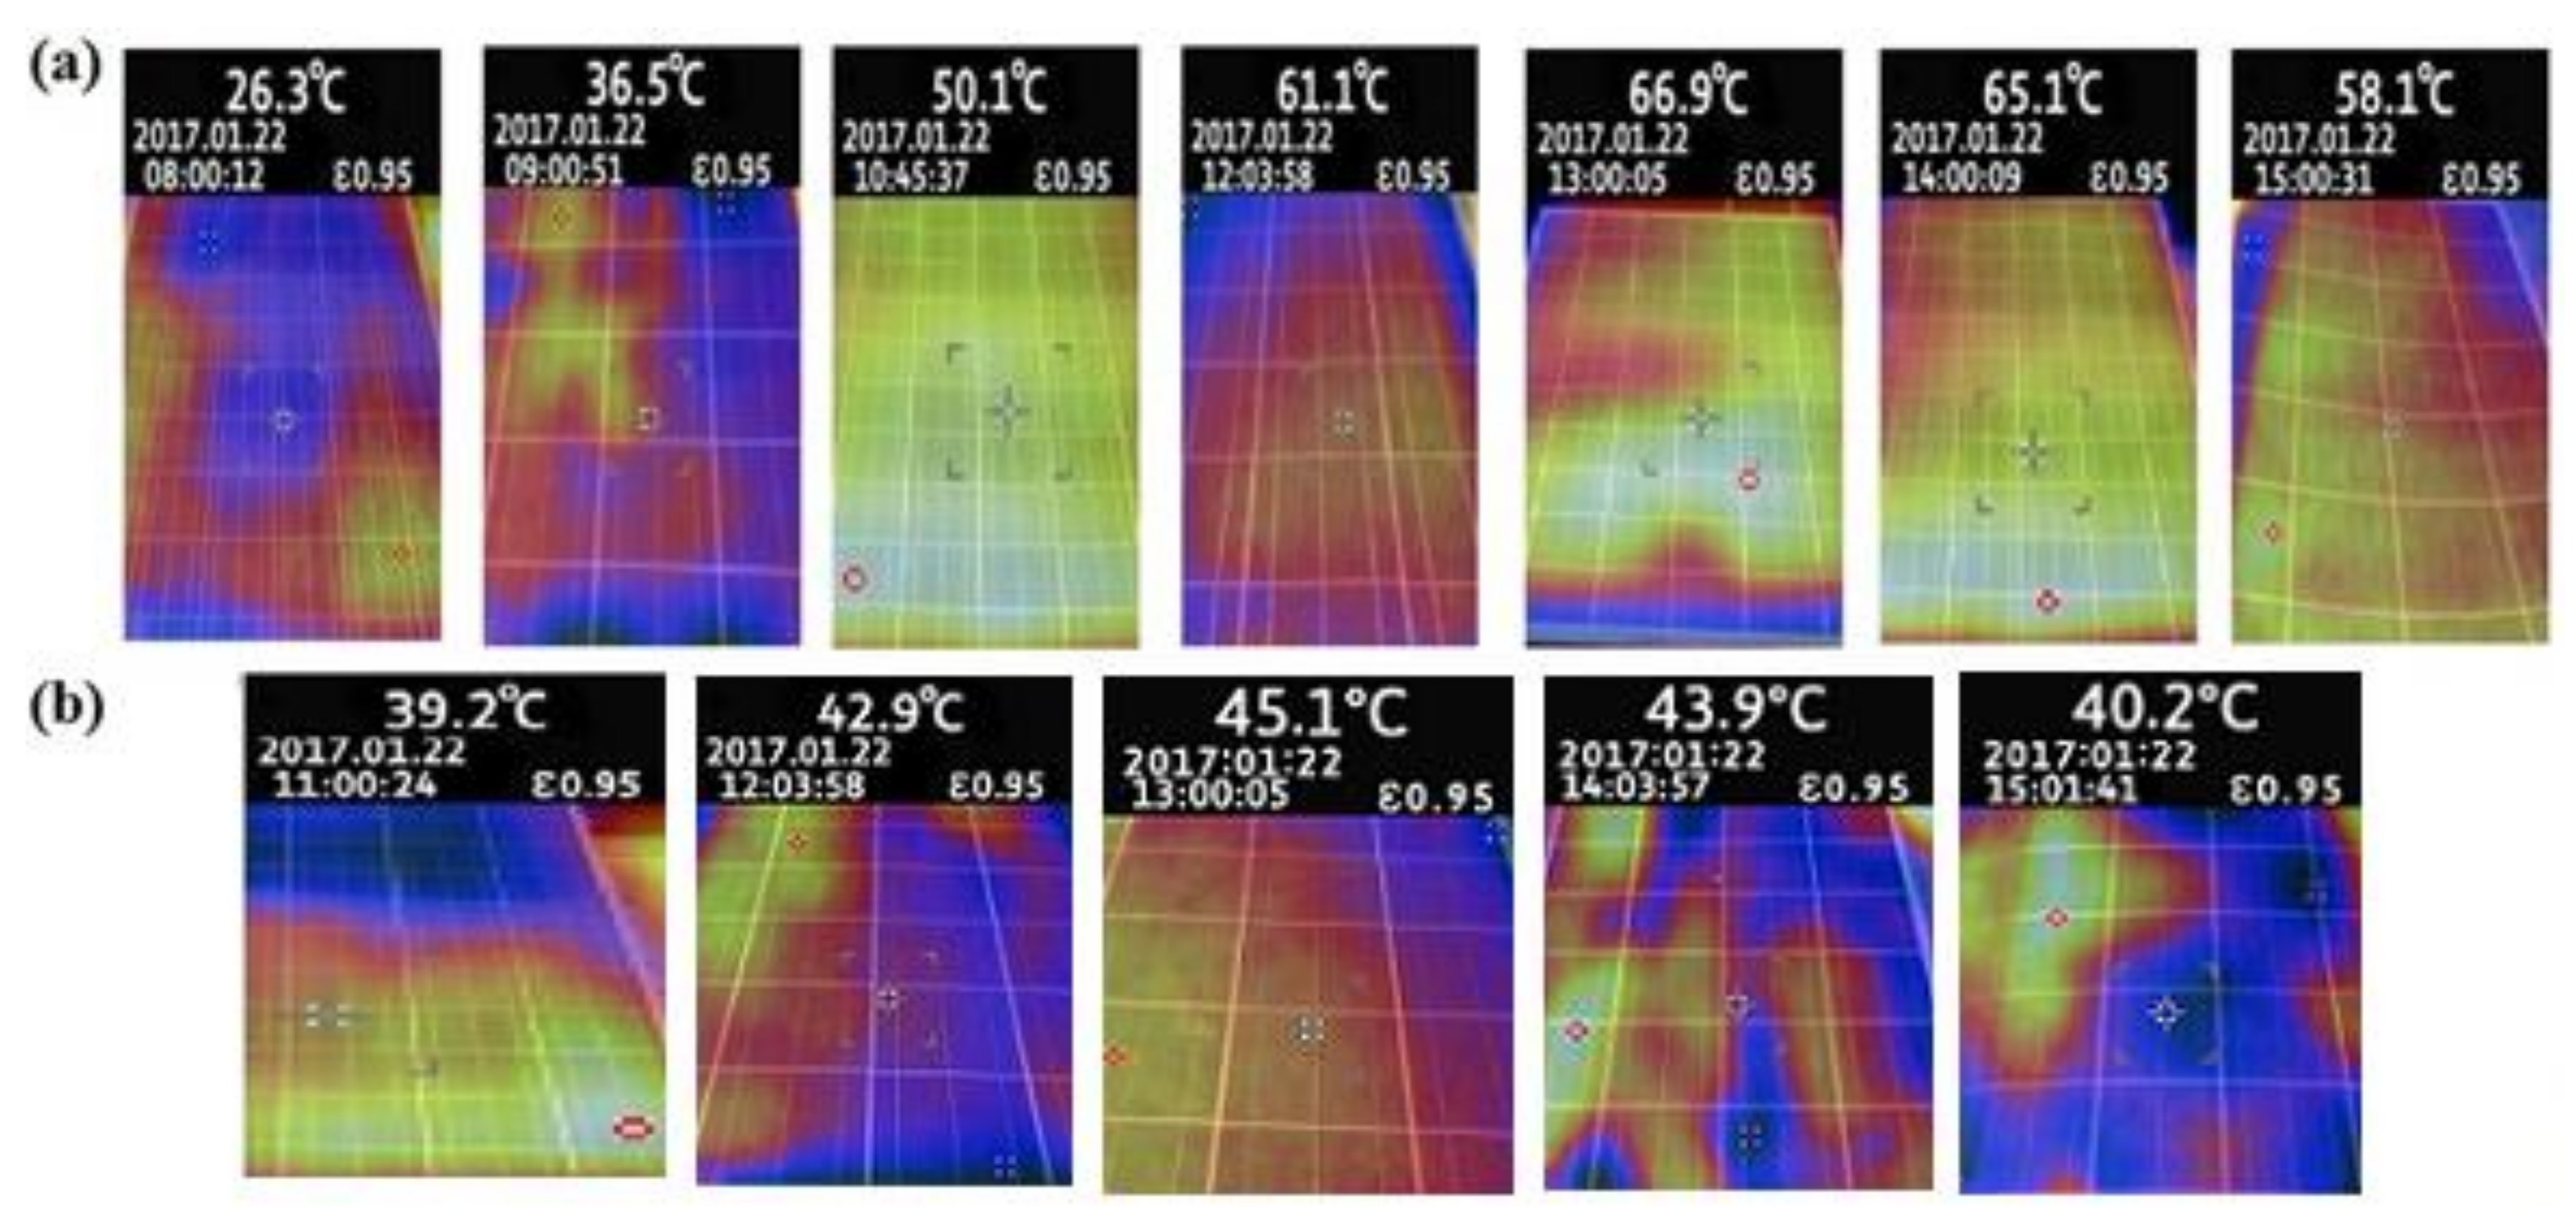
A closed loop cooled solar PV system is an essential part of HES proposed for Mbuguni weather conditions. Therefore, a comparative assessment was performed to determine the effect of cooling system. The proposed cooling system (Section 2.2) was examined using real-time experiments performed on the same day and time to obtain authenticated data for the temperature, open circuit voltage ( V o c ), and short circuit current ( I s h ). Initially, only the data from the solar panel with no cooling was monitored from 8:00 a.m. to 10:30 a.m. at specific time intervals while the CLC-SS was turned OFF. Temperature of panel with no cooling ( T p v ( N C ) ) was 28.3 °C at 8:00 a.m., which kept on increasing with passage of time until it reached 66.9 °C at 1:00 p.m. (13:00) as shown in Figure 13a. At this instant (1:00 p.m.), T p v ( N C ) was 42.1 °C more than the STC (25 °C). At 10:45 a.m., T p v ( N C ) reached 50.1 °C and CLC-SS was turned on. PV module with Closed-loop system (C-LS) reduced the temperature ( T p v ( C L S ) ) to 39.2 °C (as per data recorded on 11:02 a.m.). Closed loop water circulation tried to lower the panel temperature. However he T p v ( C L S ) continued to increase until 1:57 p.m. At 1:00 p.m., the T p v ( C L S ) was 45.1 °C (Figure 13b). The T p v ( C L S ) decreased to 43.9 °C at 2:03 p.m. and decreased to 40.2 °C at 3 p.m. Important data for system with no cooling and C-LS summarized in Table 6.
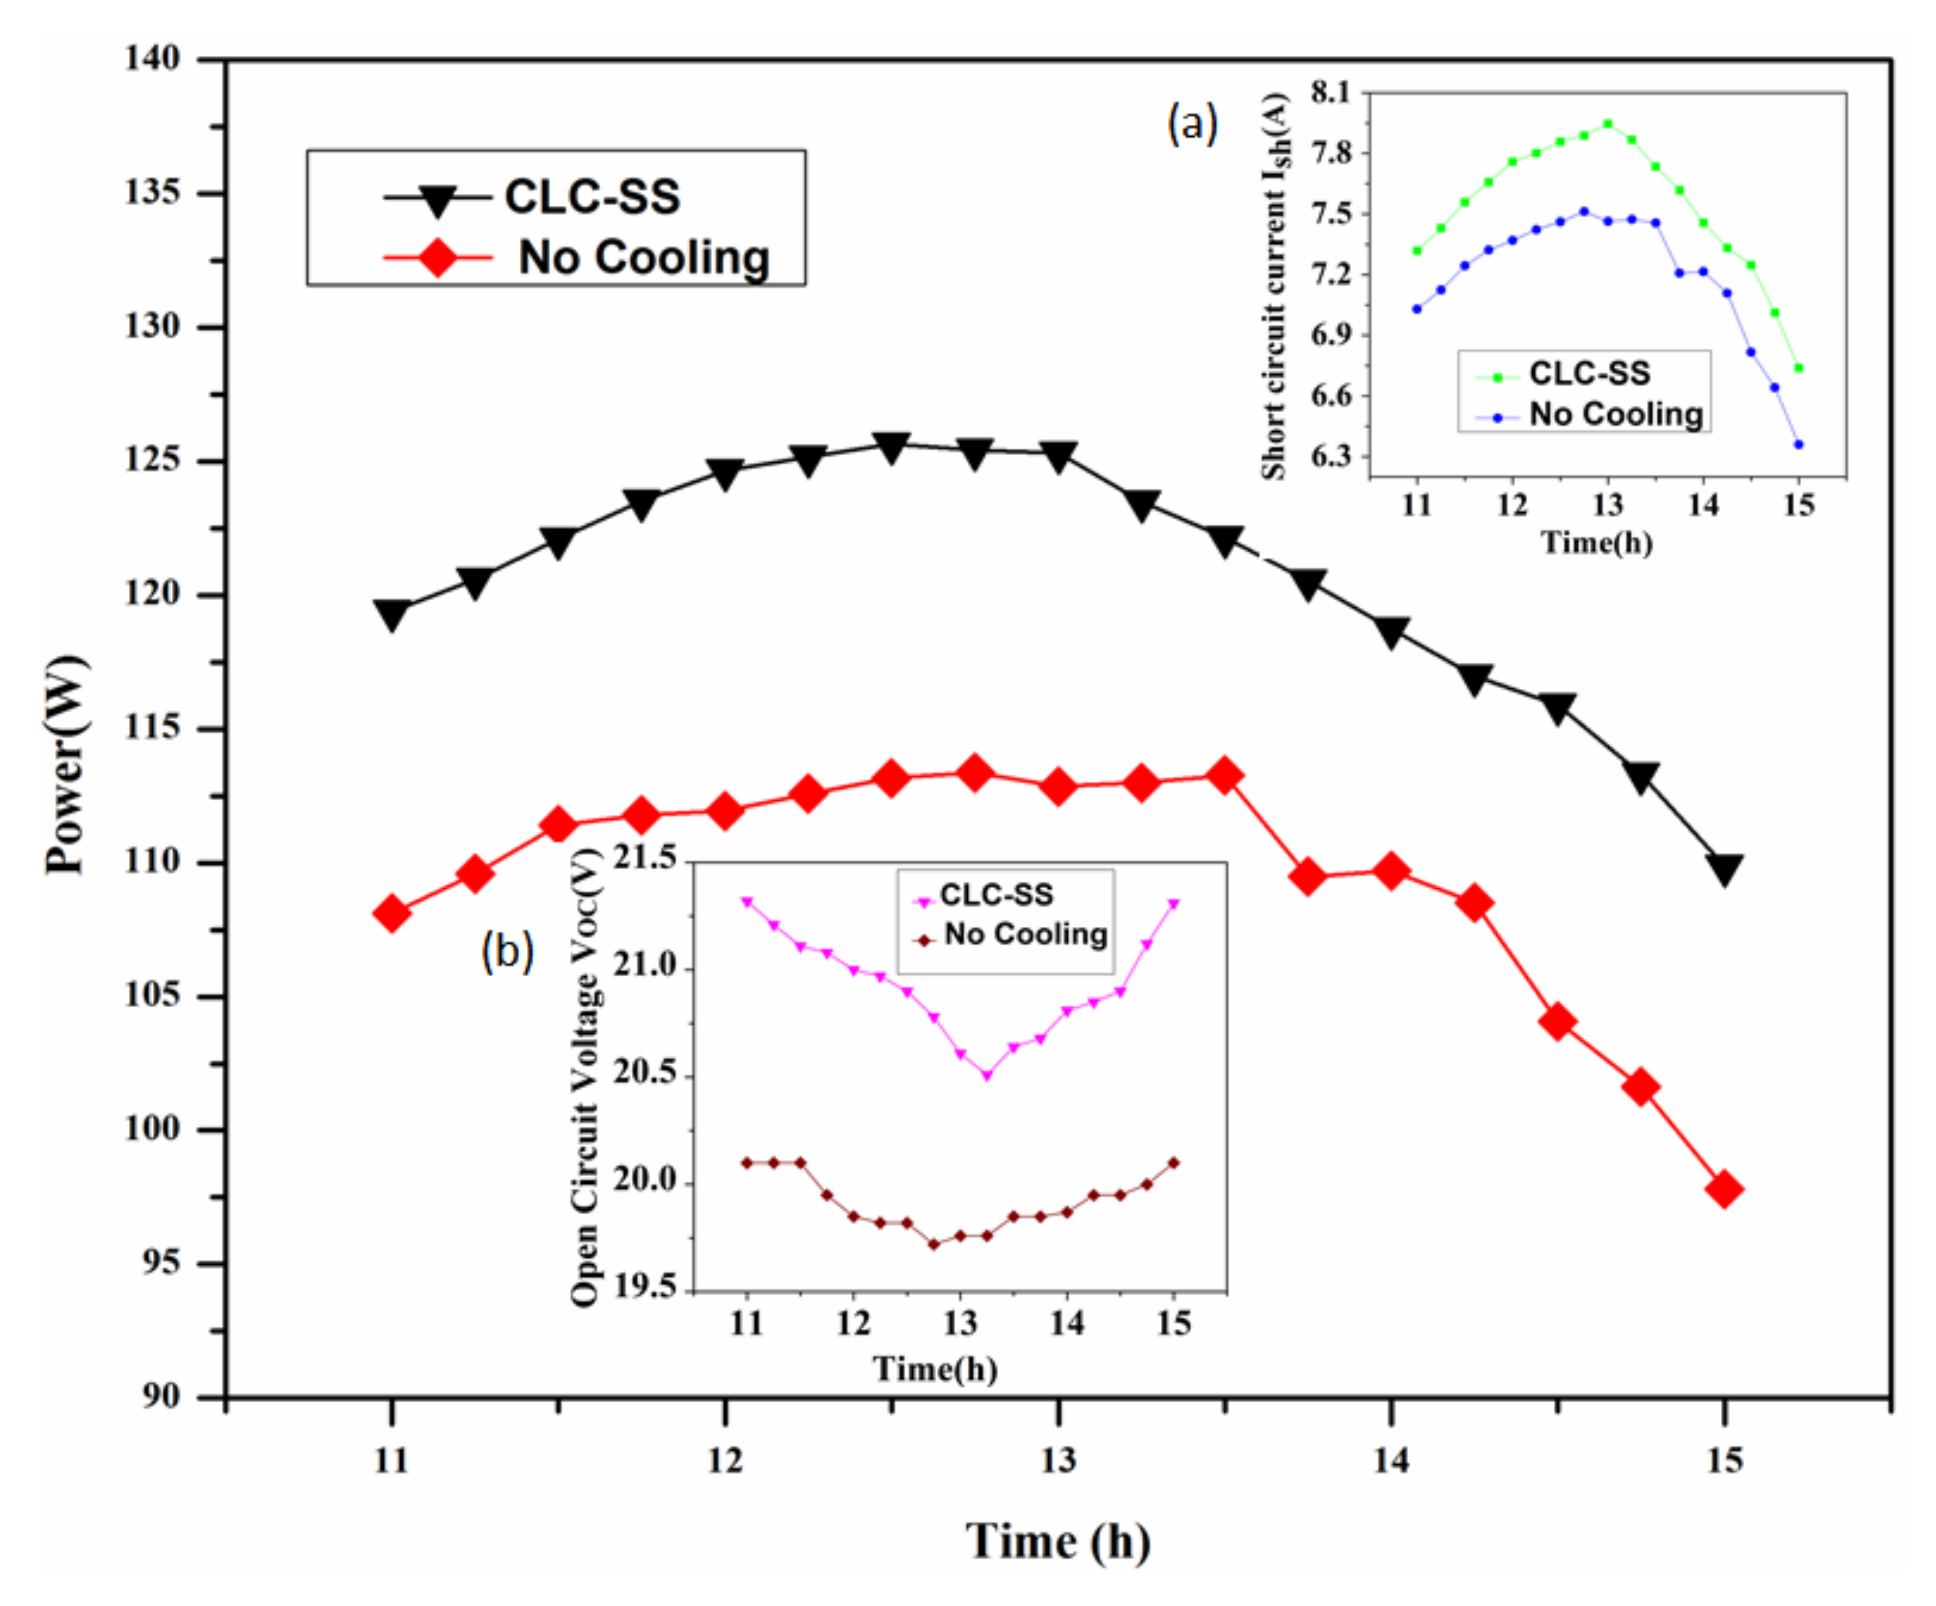
We then compared the data collected for output power, I s h and V o c values for CLC-SS and conventional solar system with no cooling system attached. Figure 14 exhibits that the maximum output electric power extracted from the PV module with no cooing and CLC-SS was 113.39 W and 125.66 W, respectively. The average power delivered by the solar PV module with no cooling, and C-LS noted over a time period of 11:00 a.m. to 3:00 p.m. was 109.55 W, and 120.75 W, respectively. Percentage increase in average output power of the CLS-SS was 10.23%. V o c and I s h curves for both systems as inset graphs. The top left inset graph (a) shows the I s h curves for both the arrangements. The I s h values for the solar panel with no cooling from 6.64 to 7.03 A between the time interval from 11:00 a.m. to 3:00 p.m., with maximum values within the time interval between 12:30 p.m. and 1:30 p.m. The I s h values for the CLC-SS ranged from 6.73 to 7.94 A between 11:00 a.m. and 3:00 p.m. The middle down Inset graph (b) reveals that the V o c decreases with increase in temperature. The lowest values for V o c were observed between 1:00 p.m. and 2:00 p.m. The V o c for the CLC-SS was in the range of 20.51 V to 21.32 V. The out power, V o c and I s h curves reveals better performance by CLC-SS than conventional solar system.
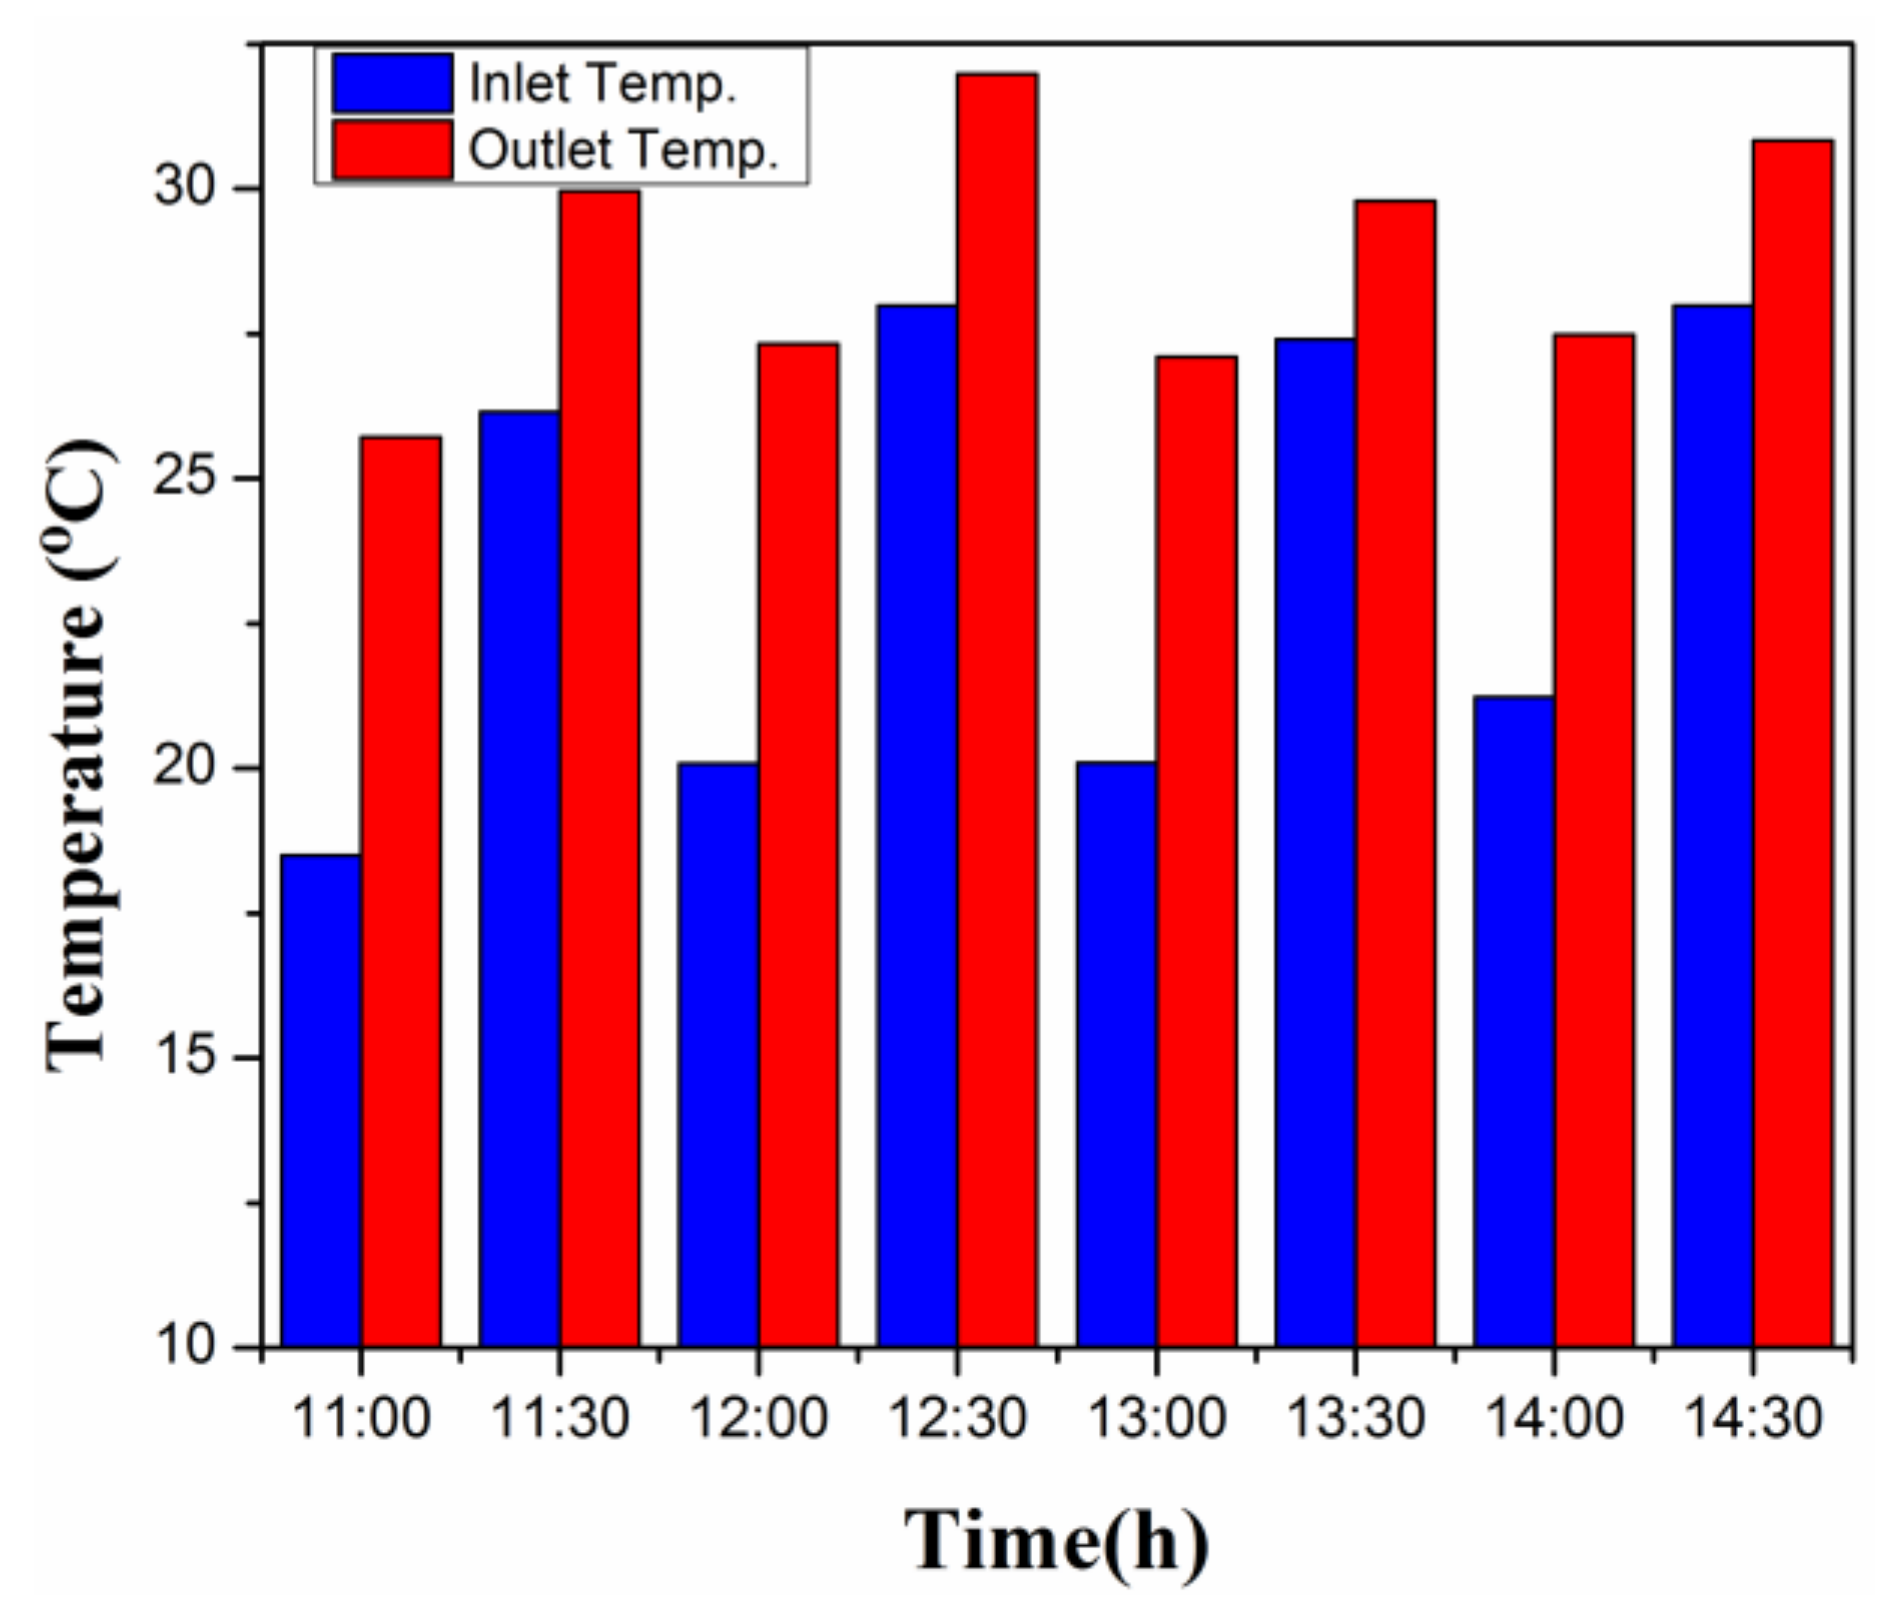
An increase (10.23%) in the output power of the CLC-SS is recorded. In addition, it also offers an increase in temperature of outlet water (the experimental setup shows an average increase of 5.09 °C as depicted in Figure 15). The water with enhanced temperature along with some auxiliary heating mechanism can also be used for some very useful daily activities. DC/AC electric power is required to run this motor (a 15 W pump was employed in CLC-SS during this experiment). The power required by the motor to circulate water through the pipes can be compensated by conserving power to heat that amount of water. In addition, the space required for discretely installing a solar wind hybrid system and a solar water heating can easily be reduced by installing CLS-SS-Wind HES with an auxiliary heating system. Results of Section 3.3 illustrate that the cooling system CLC-SS has a definite effect on the yield of PV modules within the HES.
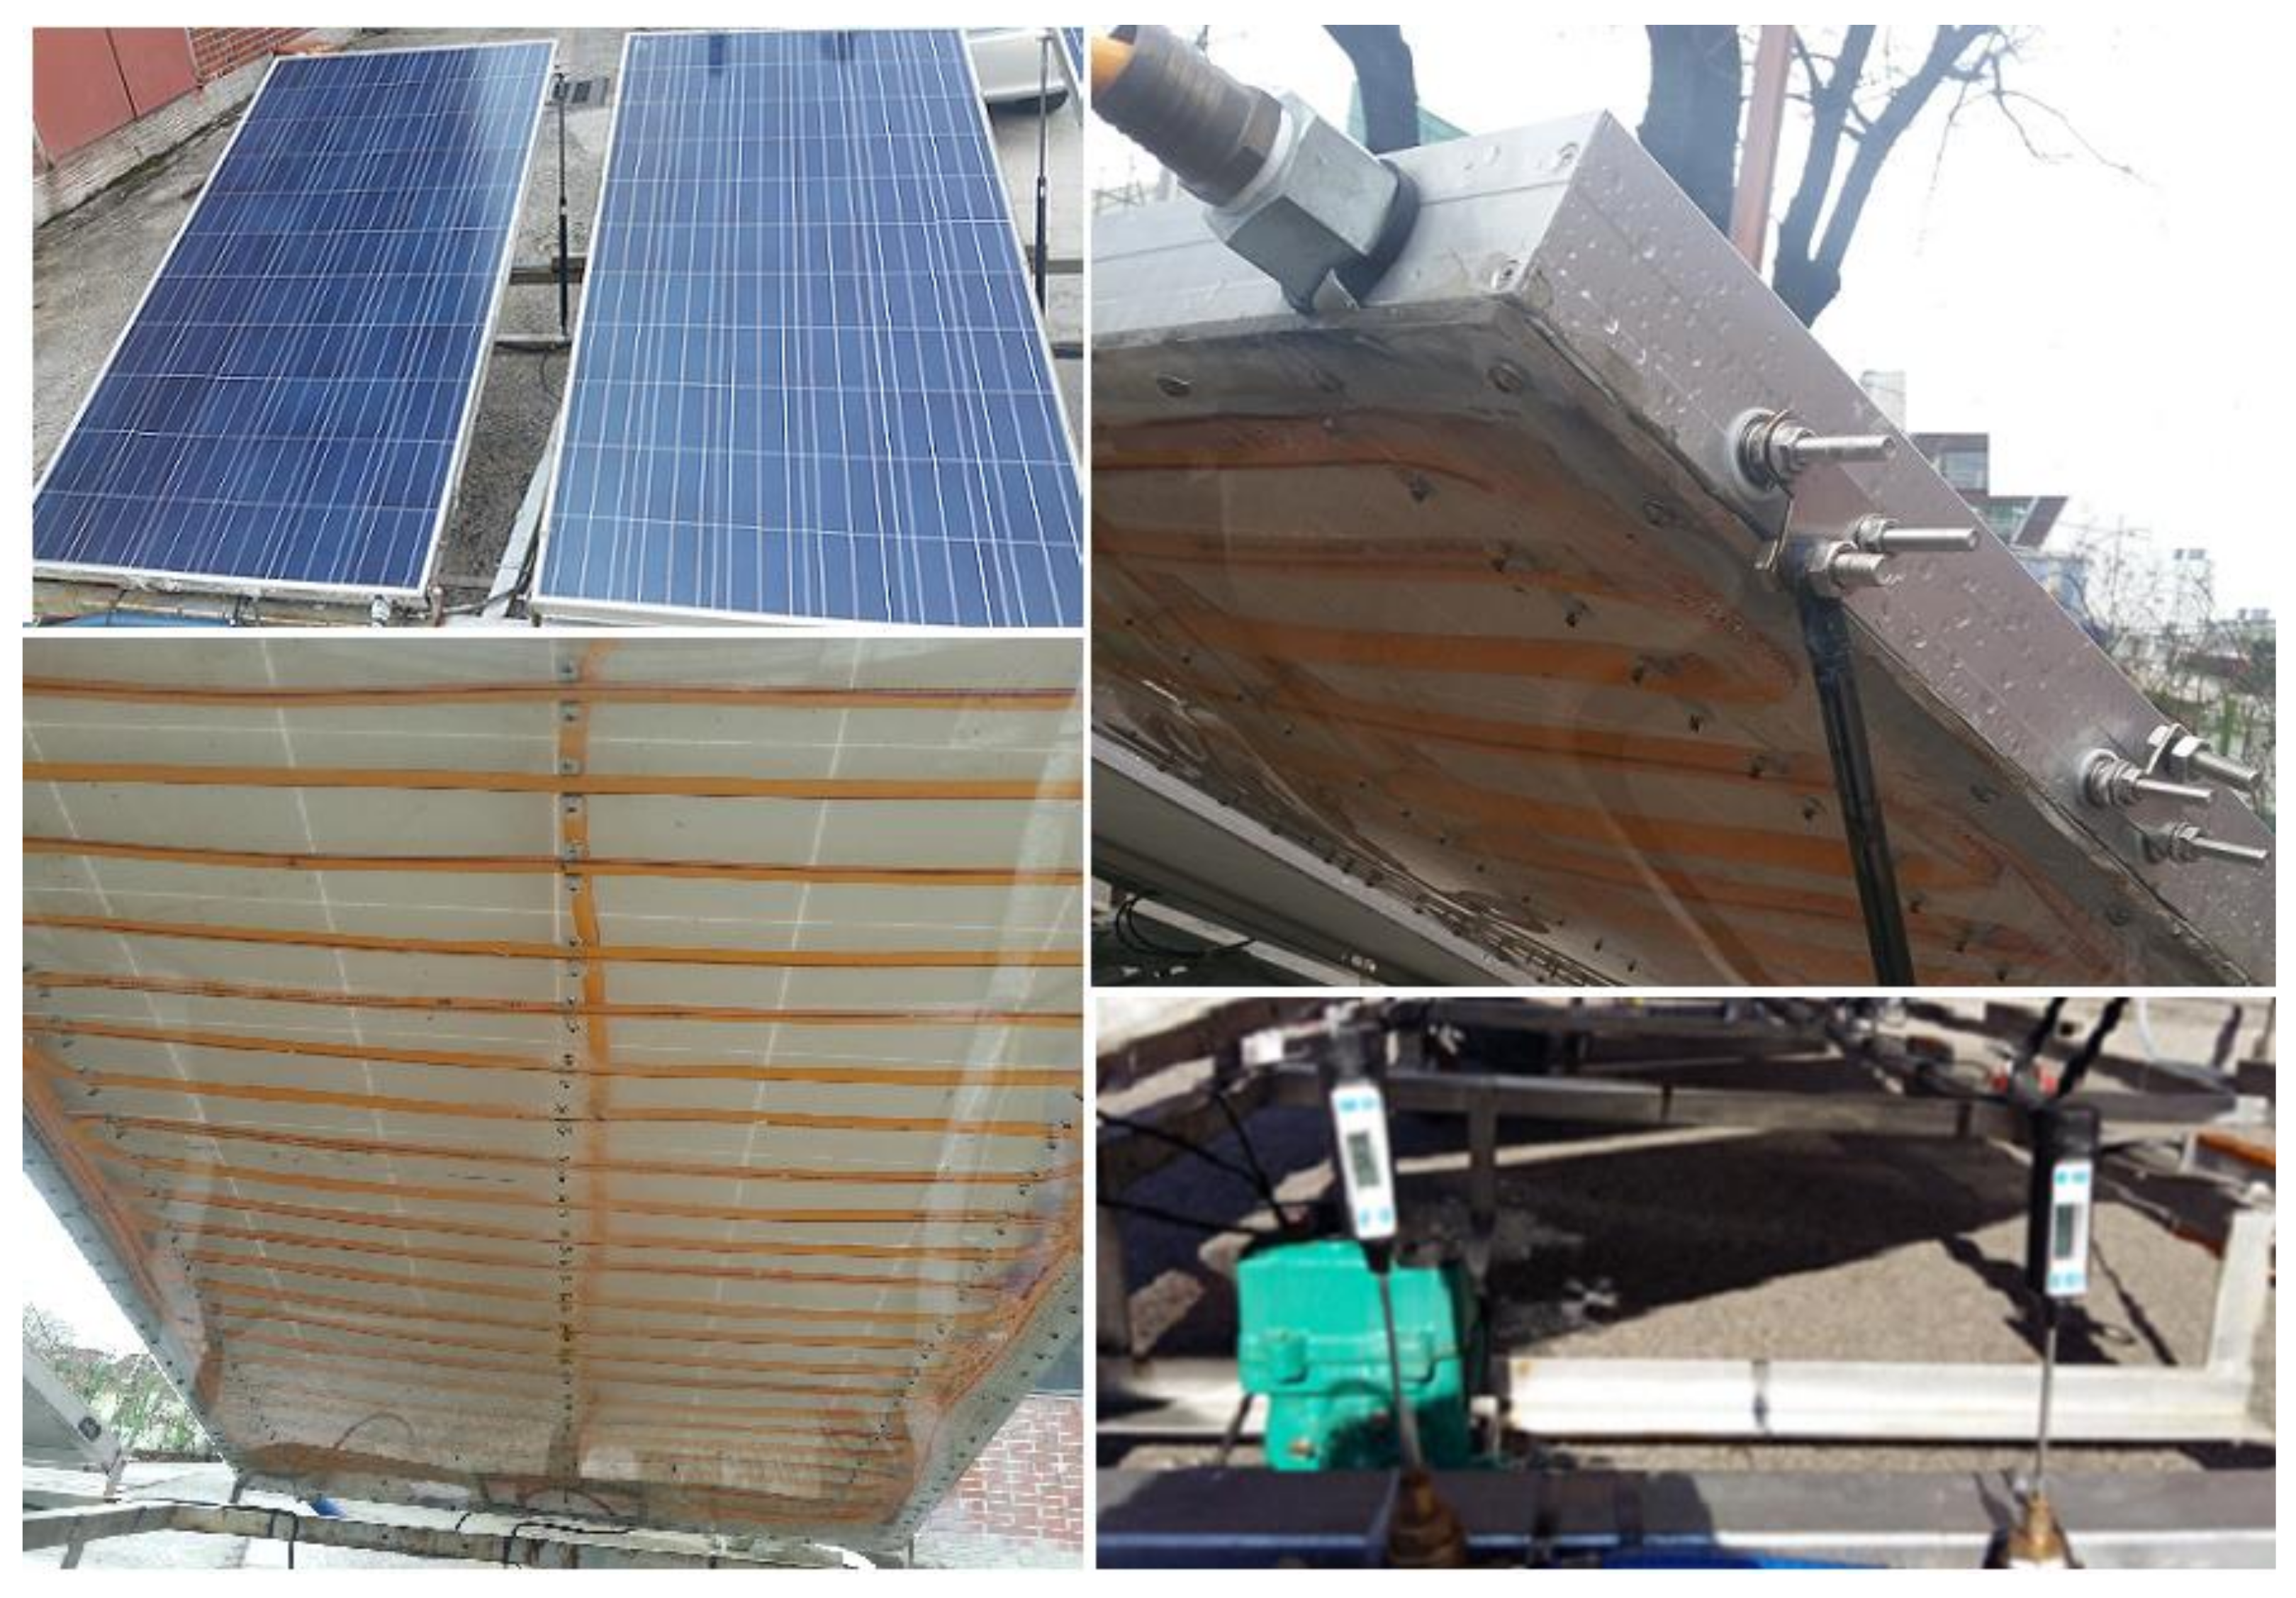
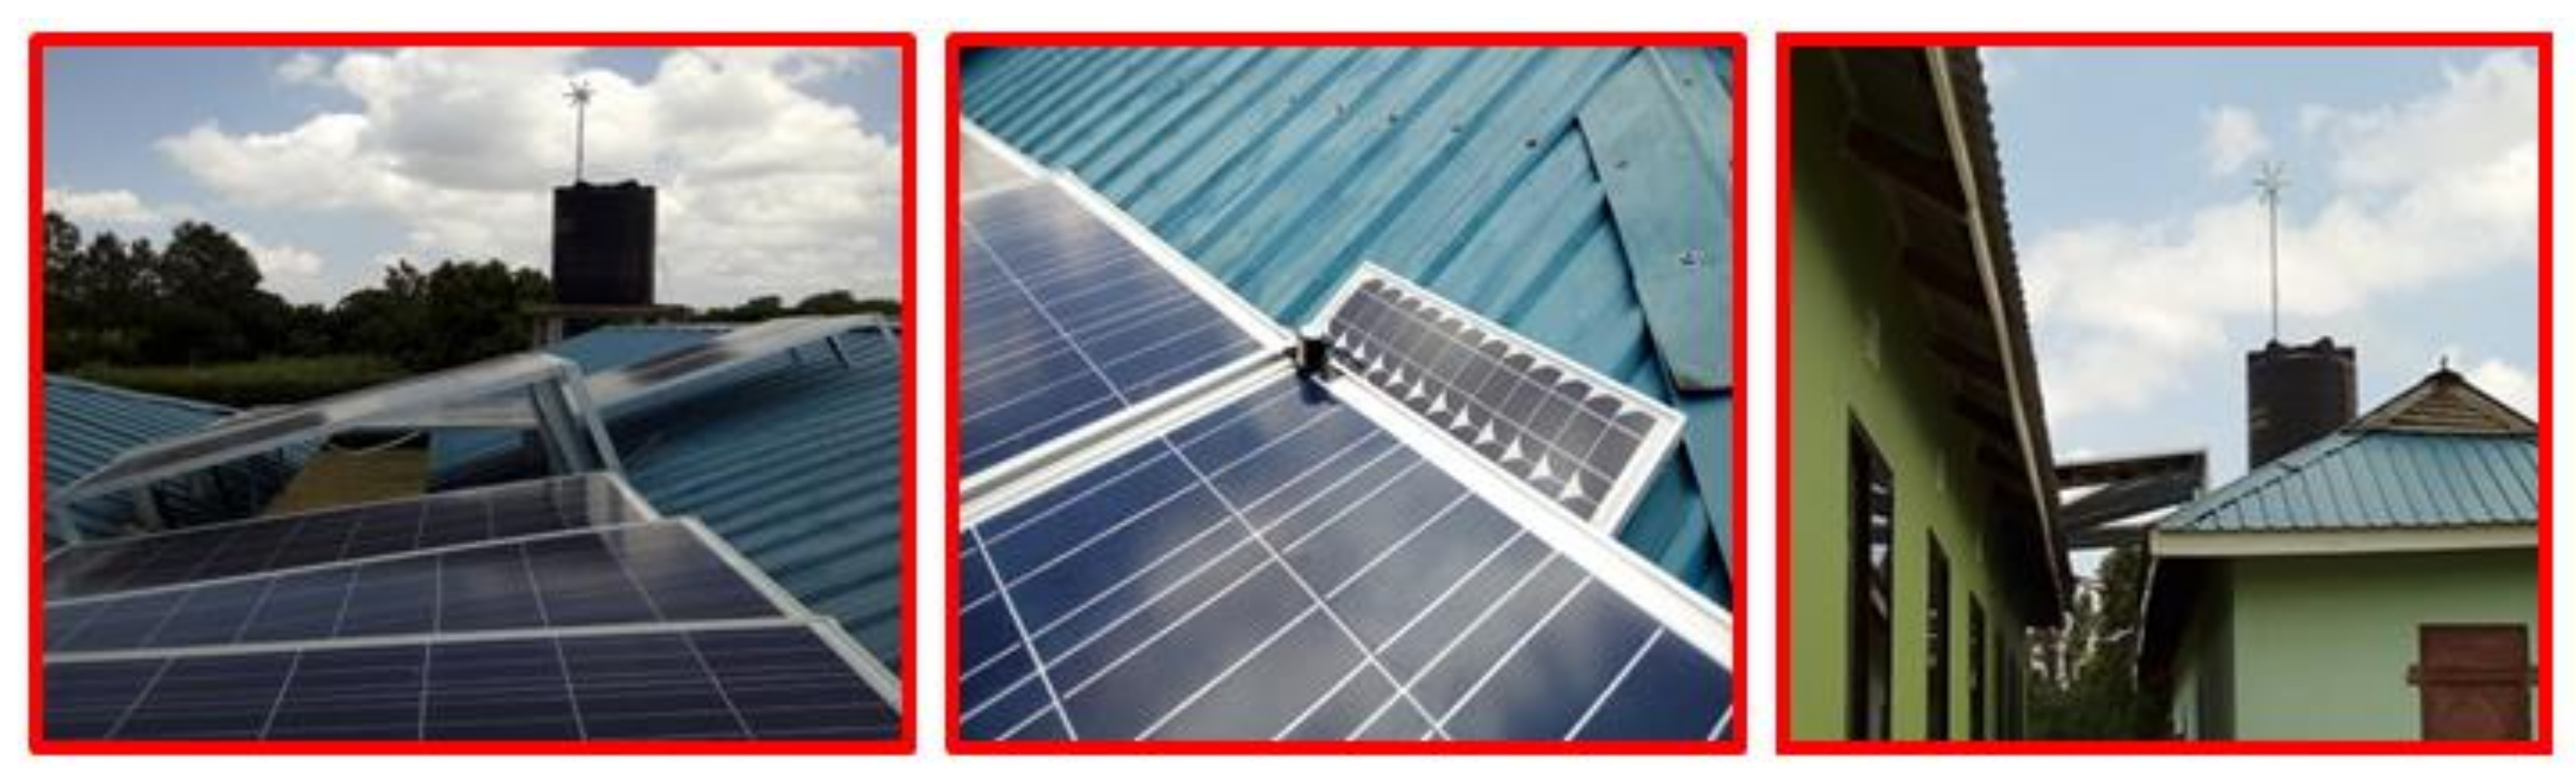
Based on this research, a real-time prototype HES comprised of a solar PV system integrated with closed loop cooling system and wind turbine was installed at Star Secondary School, Mbuguni, Tanzania (Figure 16).

4. Conclusions and Future Work

In this paper, an uninterruptible and environmentally friendly CLC-solar wind HES is designed and optimized for a remote area of Tanzania. The closed loop cooling solar system (CLC-SS) helps to extract more power from PV modules within HES (10.23% for our experimental study). However, continuous operation of cooling system is not recommended and requires to follow the controlled algorithm proposed in this paper. Moreover, detailed simulations were performed by HOMER software considering the manufacturing cost and efficiency for derivation of optimized values of solar PV, wind turbine, converter, battery size and quantity utilizing solar and wind resources of the considered location. The results also authenticate, that the cost of energy (COE) of the optimized system was 0.26 $/kWh and the net present cost (NPC) of the optimized system was $7110.53.
An improved output power solar wind HES designed in this research is cost-effective and can be adapted easily as a future green energy system, predominantly in countries with low electrification rate and high annual solar radiation and hot weather compared to the STC defined for a solar PV system. However, in the near future, some more convenient renewable energy models and appropriate cooling systems can be introduced into the HES, allowing the HES to be adopted across the globe.

Acknowledgments

This research was supported by Basic Research Laboratory through the National Research Foundations of Korea funded by the Ministry of Science, ICT and Future Planning (NRF-2015R1A4A1041584).

Author Contributions

The idea of this study was conceptualized by Hee-Je Kim and Muhammad Adil Khan. The experimental setup was developed and analyzed by Muhammad Adil khan with the help of P. Sathishkumar and Himanshu and Kamran Zeb. S. Srinivasa Rao, Kamran Zeb, and Chandu V. V. Muralee Gopi helped to organize the data and prepare the research manuscript.

Conflicts of Interest

The authors declare no conflict of interest

Appendix A

Table A1. Specification of DG used for analysis.
Net cost500 $/KW
Efficiency13%
Life span15,000 h
Fuel curve slope0.2512 L/h/kW
Replacement Cost500 $/kW
Fuel usedDiesel
Fuel price1.0 $/L
Fuel curve Intercept0.0664 L/h/kW

References

  1. Chen, H.H.; Kang, H.Y.; Lee, A.H. Strategic selection of suitable projects for hybrid solar-wind power generation systems. Renew. Sustain. Energy Rev. 2010, 14, 413–421. [Google Scholar] [CrossRef]
  2. Jovanovic, M. An analytical method for the measurement of energy systems sustainability in urban areas. FME Trans. 2008, 36, 157–166. [Google Scholar] [CrossRef]
  3. Energy Access/Situation Report. 2016. Available online: http://www.nbs.go.tz/nbstz/index.php/english/other-statistics/849-energy-access-situation-report-2016-tanzania-mainland (accessed on 12 December 2017).
  4. Ahlborg, H.; Hammar, L. Drivers and barriers to rural electrification in Tanzania and Mozambique-Grid-extension, off-grid, and renewable energy technologies. Renew. Energy 2014, 61, 117–124. [Google Scholar] [CrossRef]
  5. Mgonja, S. Electricity energy status in Tanzania. In Proceedings of the 9th Annual Engineers Day, Dar es Salaam, Tanzania, 1–2 September 2011. [Google Scholar]
  6. Ministry of Energy and Minerals (MEM). Power System Master Plan 2016 Update; Ministry of Energy and Minerals (MEM): Dar es Salaam, Tanzania, 2016. Available online: http://www.ewura.go.tz/wp-content/uploads/2017/01/Power-System-Master-Plan-Dec.-2016.pdf (accessed on 13 December 2017).
  7. TANESCO. Provision of Financial Advisory and Modeling Services to TANESCO; TANESCO: Dar es Salaam, Tanzania, 2010. [Google Scholar]
  8. Zhou, N.; Liu, N.; Zhang, J.; Lei, J. Multi-objective optimal sizing for battery storage of PV-based microgrid with demand response. Energies 2016, 9, 591. [Google Scholar] [CrossRef]
  9. Bhandari, B.; Lee, K.T.; Lee, C.S.; Song, C.K.; Maskey, R.K.; Ahn, S.H. A novel off-grid hybrid power system comprised of solar PV, wind, and hydro energy sources. Appl. Energy 2014, 133, 236–242. [Google Scholar] [CrossRef]
  10. Lu, J.; Wang, W.; Zhang, Y.; Cheng, S. Multi-Objective Optimal Design of Stand-Alone Hybrid Energy System Using Entropy Weight Method Based on HOMER. Energies 2017, 10, 1664. [Google Scholar] [CrossRef]
  11. Bakos, G.C. Feasibility study of a hybrid wind/hydro power-system for low-cost electricity production. Appl. Energy 2002, 72, 599–608. [Google Scholar] [CrossRef]
  12. Dubey, S.; Tiwari, G.N. Thermal modeling of a combined system of photovoltaic thermal (PV/T) solar water heater. Sol. Energy 2008, 82, 602–612. [Google Scholar] [CrossRef]
  13. Duffie, J.A.; Beckman, W.A. Solar Engineering of Thermal Processes; John Wiley & Sons, Inc.: Hoboken, NJ, USA, 2013. [Google Scholar]
  14. Alonso Garcia, M.C.; Balenzategui, J.L. Estimation of photovoltaic module yearly temperature and performance based on nominal operation cell temperature calculation. Renew. Energy 2004, 29, 1997–2010. [Google Scholar] [CrossRef]
  15. Kluth, A. Using Water as a Coolant to Increase Solar Panel Efficiency; California State Science Fair: Los Angeles, CA, USA, 2008. [Google Scholar]
  16. Tang, X.; Quan, Z.; Zhao, Y. Experimental investigation of solar panel cooling by a novel micro-heat pipe array. Energy Power Eng. 2010, 2, 171–174. [Google Scholar] [CrossRef]
  17. Tonui, J.K.; Tripanagnostopoulos, Y. Improved PV/T solar collectors with heat extraction by forced or natural air circulation. Renew. Energy 2007, 32, 623–637. [Google Scholar] [CrossRef]
  18. Khan, M.A.; Ko, B.; Alois Nyari, E.; Park, S.E.; Kim, H.-J. Performance Evaluation of Photovoltaic Solar System with Different Cooling Methods and a Bi-Reflector PV System (BRPVS): An Experimental Study and Comparative Analysis. Energies 2017, 10, 826. [Google Scholar] [CrossRef]
  19. Lal, D.K.; Dash, B.B.; Akella, A.K. Optimization of PV/Wind/Micro-Hydro/diesel hybrid power system in homer for the study area. Int. J. Electr. Eng. Inform. 2011, 3, 307–325. [Google Scholar]
  20. Kihwele, S.; Kyaruzi, A. Effect of poor designing of distribution system case study Tanzania electric supply company network. In Proceedings of the IEEE International Conference on Power System Technology, Dar es Salaam, Tanzania, 21–24 November 2004. [Google Scholar]
  21. Kihwele, S.; Hur, K.; Kyaruzi, A. Visions, Scenarios and Action Plans Towards Next Generation Tanzania Power System. Energies 2012, 5, 3908–3927. [Google Scholar] [CrossRef]
  22. Sathishkumar, P.; Piao, S.; Khan, M.A.; Kim, D.H.; Kim, M.S.; Jeong, D.K.; Lee, C.; Kim, H.J. A Blended SPS-ESPS Control DAB-IBDC Converter for a Standalone Solar Power System. Energies 2017, 10, 1431. [Google Scholar] [CrossRef]
  23. Khan, M.A.; Badshah, S. Measures for reducing transmission and distribution losses of Pakistan. Int. J. Sci. Eng. Res. 2014, 4, 616–619. [Google Scholar]
  24. Solar Resources of Tanzania. Available online: https://solargis.com/products/maps-and-gis-data/free/download/tanzania (accessed on 18 December 2017).
  25. Wind Resource Mapping in Tanzania Mesoscale Modeling Report. Available online: http://documents.worldbank.org/curated/en/758141468186533619/Wind-resource-mapping-in-Tanzania-mesoscale-modeling-report (accessed on 18 December 2017).
  26. Khan, M.A.; Badshah, S. Design and analysis of cross flow turbine for micro hydro power application using sewerage water. Res. J. Appl. Sci. Eng. Technol. 2014, 8, 821–828. [Google Scholar]
  27. Moharram, K.A.; Abd-Elhady, M.S.; Kandil, H.A.; El-Sherif, H. Enhancing the performance of photovoltaic panels by water cooling. Ain Shams Eng. J. 2013, 4, 869–877. [Google Scholar] [CrossRef]
  28. Shezan, S.A.; Julai, S.; Kibria, M.A.; Ullah, K.R.; Saidur, R.; Chong, W.T.; Akikur, R.K. Performance analysis of an off-grid wind-PV (PV)-diesel-battery hybrid energy system feasible for remote areas. J. Clean. Prod. 2016, 125, 121–132. [Google Scholar] [CrossRef]
Figure 1. Status of Electricity in Tanzania [3].
Energies 11 00905 g001
Figure 2. (a) Average daily/yearly sum of global horizontal irradiation (GHI); (b) Estimated average daily/yearly sum of electricity generation capacity of solar PV generation of Tanzania [24].
Energies 11 00905 g002
Figure 3. Wind Potential for various areas of Tanzania [25].
Energies 11 00905 g003
Figure 4. Geographical position of the proposed site at Mbuguni, Arusha Tanzania (Latitude 3 degrees 34 min South: Longitude 36 degrees 57 min East).
Energies 11 00905 g004
Figure 5. Schematic diagram of proposed hybrid energy system for a remote area of Tanzania.
Energies 11 00905 g005
Figure 6. Power curve of wind turbine used for analysis.
Energies 11 00905 g006
Figure 7. Optimal control algorithm developed for CLC-SS.
Energies 11 00905 g007
Figure 8. Experimental setup for proposed closed-loop cooled solar system (CLC-SS).
Energies 11 00905 g008
Figure 9. (a) Average Monthly solar Radiations with clearness index; and (b) Average Monthly wind speed (m/s) for Mbuguni Tanzania.
Energies 11 00905 g009
Figure 10. (a) Scaled daily load profile; and (b) Scaled Load averages (KW) for each month (January–December) of the year 2017, considered for analysis using HOMER.
Energies 11 00905 g010
Figure 11. State of charge of lead-acid batteries, available solar radiation, wind speed, total load served output power by wind and solar panels, power delivered by auto size-DG and Fuel consumption (a) SPV; (b) SPV-GEN; (c) W-GEN; (d) SPV-W; and (e) SPV-W-GEN.
Energies 11 00905 g011
Figure 12. (a) percentage renewable penetration; (b) Operating Cost ($); (c) Fuel consumption; (d) Cost of energy (COE) and (e) Net Present cost (NPS) for SPV-W-GEN, SPV, SPV-W, SPV-GEN, W-GEN and GEN.
Energies 11 00905 g012
Figure 13. Comparative assessment of temperature (a) No cooling system; (b) CLC-SS.
Energies 11 00905 g013
Figure 14. Comparative assessment of CLS-SS and conventional solar PV module with no cooling system.
Energies 11 00905 g014
Figure 15. Inlet and outlet water temperature for CLC-SS.
Energies 11 00905 g015
Figure 16. A prototype of off-grid hybrid CLC-SS-Wind HES at installed Mbuguni.
Energies 11 00905 g016
Table 1. Specifications and cost considerations of solar PV modules.
Net cost1000 $/KW
Efficiency13%
Replacement Cost900 $/KW
Derating factor80%
Operating Temp47 °C
Life span25 years
O&M Cost10 $/year
Temp. Coefficient−0.5
Short circuit current8.62 A
Maximum power150 W
Open circuit voltage22.19 V
Max Power Point Voltage18.6 W
Max Power Point Current8.06 A
Dimensions1510 mm × 674 mm × 50 mm
Test conditionsAM 1.5 25 °C 1000 W/m2
Table 2. Wind turbine specifications used for analysis.
Rated Power1000 W
Max Power1400 W
Cut-out wind speed15 m/s
Rated Voltage24 V/48 V
Wheel Diameter (m)2.0
Start-up wind speed3 m/s
Cost780 $/kW
Rated wind speed10 m/s
Survival wind speed45 m/s
LubricationGrease
Working Temperature−40 °C to 50 °C
Tower typeGuyed tower
Replacement Cost780 $/kW
O&M Cost40 $/year
Table 3. Cost assumptions and specifications for battery.
Maximum Capacity83.4 Ah
Normal Voltage12 V
Normal capacity1 kwh
Capacity ratio0.403
Rate constant0.827 1/h
Roundtrip efficiency80%
Maximum charge current16.7 A
Capital$150.00
Maximum charge rate1 A/Ah
Replacement$150.00
Maximum Discharge current24.3 A
O&M10.00 $/year
Time10.00 year
Throughput800.00 kwh
Table 4. Specification of water pump used for CLC-SS.
Voltage220–240 V
Frequency50 Hz
Head max3.6 m
Current0.07 A
Flow Rate500 L/H
Dimensions64 × 45 × 56 mm
Power15 W
Outlet13 mm Dia
Table 5. Different architecture with corresponding solar, battery, wind turbine, converter system, autosize-DG.
System ArchitectureSolar (kW)Battery 1 khWind Turbine (1 kW)Converter SystemAutosize-DG
SPV-W-GEN0.764 KW5 strings10.824 kW1.40 kW
SPV3.36 kW16 strings11.37 kW
SPV-W1.30 kW10 strings11.15 kW
SPV-GEN2.25 kW9 strings11.1 kW1.40 kW
W-GEN 10 strings10.75 kW1.40 kW
GEN (Base System) 1.40 kW
Table 6. Temperature of solar Panel without cooling system and C-LS.
Time T p v ( N C ) (°C) T p v ( C L S ) (°C)
8:0028.3OFF
9:0036.5OFF
10:4550.1Just turned ON
11:0054.839.2
12:0061.142.9
13:0066.945.1
14:0065.143.9
15:0058.140.2

