Article

Two-Phase Flow Modeling of Solid Dissolution in Liquid for Nutrient Mixing Improvement in Algal Raceway Ponds

1
School of Mechanical Engineering, Kyungpook National University, 80 Daehak-Ro, Buk-Gu, Daegu 41566, Korea
2
School of Chemical Engineering and Analytical Science, University of Manchester, Oxford Road, Manchester M1 3BU, UK
3
Department of Chemical Engineering, Imperial College London, South Kensington Campus, London SW7 2AZ, UK
*
Author to whom correspondence should be addressed.
Energies 2018, 11(4), 899; https://doi.org/10.3390/en11040899
Submission received: 15 March 2018 / Revised: 4 April 2018 / Accepted: 4 April 2018 / Published: 11 April 2018
(This article belongs to the Section D: Energy Storage and Application)

Abstract

:
Achieving optimal nutrient concentrations is essential to increasing the biomass productivity of algal raceway ponds. Nutrient mixing or distribution in raceway ponds is significantly affected by hydrodynamic and geometric properties. The nutrient mixing in algal raceway ponds under the influence of hydrodynamic and geometric properties of ponds is yet to be explored. Such a study is required to ensure optimal nutrient concentrations in algal raceway ponds. A novel computational fluid dynamics (CFD) model based on the Euler–Euler numerical scheme was developed to investigate nutrient mixing in raceway ponds under the effects of hydrodynamic and geometric properties. Nutrient mixing was investigated by estimating the dissolution of nutrients in raceway pond water. Experimental and CFD results were compared and verified using solid–liquid mass transfer coefficient and nutrient concentrations. Solid–liquid mass transfer coefficient, solid holdup, and nutrient concentrations in algal pond were estimated with the effects of pond aspect ratios, water depths, paddle wheel speeds, and particle sizes of nutrients. From the results, it was found that the proposed CFD model effectively simulated nutrient mixing in raceway ponds. Nutrient mixing increased in narrow and shallow raceway ponds due to effective solid–liquid mass transfer. High paddle wheel speeds increased the dissolution rate of nutrients in raceway ponds.

Graphical Abstract

1. Introduction

Microalgae cultivation in outdoor raceway ponds largely depends on sunlight, turbulent mixing, CO2, and nutrient distributions. Temperature and light energy could positively affect algal productivity when nutrients are excessively supplied [1,2]. The approximate composition of algae per dry mass is 45% carbon, 10% nitrogen, and 1.5% phosphorous. CO2 serves as the major carbon source, whereas different nutrients (i.e., nitrate, nitrite, ammonium, and phosphate) are introduced to supply other necessary chemical elements (i.e., nitrogen, phosphorous, and potassium) to algae cells. Optimal concentrations of 0.02 mol/m3 to 16.1 mol/m3 for nitrogen and 0.007 mol/m3 to 1.3 mol/m3 for phosphorous have been reported for maximum algal productivity [1]. Algal growth and nutrient uptake depend on various factors, including nutrient concentrations in ponds, boundary layer thickness, and different types of nutrients used [3]. A sufficient supply of nutrients is an effective approach to increase algal productivity of raceway ponds, but the necessary optimal nutrient concentration requirements are often ignored [4,5]. Various types of water-soluble chemical compound (KNO3, Na2HPO4, NaNO3, NaH2PO4, K2HPO4, MnCL, CuSO4, MgSO4, NaCl, FeCL3, etc.) are generally used to supply necessary nutrients to algae cells.
Paddle wheel or turbulent mixing has a significant effect on nutrient uptake by helping with the even distribution of nutrients in raceway ponds. Turbulent mixing increases the transfer of nutrients to algae cells by reducing boundary layer around cells [6,7]. Pond geometry is another parameter that can also affect nutrient uptake due to its direct effect on the hydrodynamic properties of ponds [3,8,9]. The water depth of raceway ponds is typically maintained between 0.1 m and 0.3 m to improve the interaction of algal cells with sunlight, nutrients, and CO2 through proper paddle wheel mixing [10]. Numerous researchers have focused on the relationship between supplied nutrients and algal growth in lab-scale aquacultures or lakes and coastal regions [11,12]. Mostert and Grobbelaar [1] evaluated the effects of nutrient (nitrate and phosphate) concentrations on microalgae growth and biomass yields in outdoor raceway ponds. Biomass production rates increased with the increase in supply of these nutrients [1]. Eustance et al. [13] studied the effects of water depth and nitrate concentrations on the biomass productivity of open-raceway ponds. Nitrogen concentrations significantly decreased with increasing water levels of ponds [13]. However, past experimental studies lack complete information regarding nutrient mixing in an algal raceway pond, especially in terms of pond hydrodynamic and geometric properties, to optimize biomass productivity.
Mass transfer is the most important phenomenon in a raceway pond and should be effectively assessed to optimize the amount of solids (nutrients) dissolved into liquid (water) [14]. Algal raceway pond is the only practical application of mass production of microalgae due to its low construction and operating expenses [15]. Despite the importance of raceway ponds in algal technology, no information can be found in the literature on the solid–liquid mass transfer phenomena in such systems. Estimating mass transfer between nutrients and water of raceway ponds contributes to achieving optimum nutrient concentrations and consequently enhancing algal productivity [14]. Several experimental studies on solid–liquid mass transfer in various industrial systems (fluidized beds and bubble columns) have been conducted, and numerous correlations of mass transfer coefficient have been proposed. The mass transfer coefficient significantly depends on liquid velocity, particle size, and reactor geometry [16,17]. Increasing liquid velocity helps dissolve considerable amounts of solids, thereby decreasing the amount of solid holdup in liquid [18]. A mixer is also used to promote mixing in the reactor. Mass transfer coefficient significantly improved at high rotational rates of mixers [19]. Operating large-scale experimental systems is difficult and requires substantial development costs. Thus, most experimental works were performed using small-scale reactors and low liquid flow rates. Developments in CFD codes have enabled inexpensive modeling of large-scale reactors. CFD modeling of solid–liquid mass transfer in various complex industrial flow systems have been performed. Chiesa et al. [20] modeled the fluid dynamics of a small-scale reactor using the Euler–Euler numerical scheme. Results obtained from the CFD model closely agreed with experimental results [20]. Enwald et al. [21] proposed possible ways to formulate two-phase systems. Euler–Euler numerical scheme is the most suitable choice to model the solid–liquid mixing in complex systems [21,22,23]. The Euler–Euler numerical scheme was used in our previous work [24,25] to model the gas–liquid flow mixing (air and CO2 mixing in water) in the raceway pond. Moreover, numerous efforts were also made on the modeling of solid–liquid mixing in fluidized beds using the Euler–Euler numerical scheme [20,21,22,23]. However, a detailed literature review suggests that a study investigating the mass transfer or nutrient dissolution in algal raceway ponds using the Euler–Euler numerical scheme does not exist. Therefore, a study based on modeling of nutrient dissolution in water must be conducted with the effects of the hydrodynamic and geometric properties of ponds to improve nutrient mixing in algal raceway ponds.
The present study proposes a novel CFD model to investigate and improve the nutrient mixing in algal raceway ponds. Nutrient mixing was investigated by estimating the dissolution of nutrients in raceway pond water. The effects of the pond’s hydrodynamic and geometric properties on nutrient dissolution were also considered. The Euler–Euler numerical scheme was applied to model the nutrient dissolution (solid–liquid mixing with mass transport) in algal raceway ponds [20,21,22,23]. The CFD model was compared and verified with the experimentally calculated nutrient mass transfer coefficient and concentration. Solid–liquid mass transfer coefficient, solid holdup, and nutrient concentrations in a raceway pond were estimated considering the effects of pond aspect ratios, water depths, paddle wheel rotational speeds, and nutrient particle sizes. This study helped in achieving optimal nutrient concentrations in algal raceway ponds to increase their biomass productivity.

2. Materials and Methods

2.1. Raceway Pond

This study used a large-scale 3D raceway pond with a length (L) of 23 m and a channel width (W) of 2.25 m (Figure 1a). The 2D paddle wheel comprises six blades ( 0.55   m × 0.04   m ) with a diameter of 0.6 m. The boundary-connected coupling technique was applied to import the flow effects of the 2D paddle wheel in the 3D raceway pond [24,25,26,27,28]. The Reynolds number ( R e ) based on hydraulic diameter ( D h ) was utilized to characterize the flow in the raceway pond.
R e l = ( ρ l D h V l ) / μ l
D h = 4 W d / ( 2 d + W )
where W is the water width, 2 W is the pond width, d is the water depth, ρ l is the liquid density, μ l is the liquid viscosity, and V l represents the average fluid velocity. The present study employed aspect ratio (AR) to study the influence of pond geometry on nutrient mixing because it directly affects the fluid dynamics of raceway pond [29,30].
A R = P o n d   w i d t h ( m ) / W a t e r   d e p t h ( m ) = 2 W / d
Three different values of A R s (5, 10, and 15) were utilized with different water depths, paddle wheel rotational speeds, and nutrient particle sizes to examine their effects on mass transfer coefficient, solid holdup, and nutrient concentration in the raceway pond. All results were computed in the downstream bend (Y-axis) of the raceway pond (Figure 1a). In a raceway pond, water and nutrients move at different speeds due to different gravitational forces, with the solid (nutrient) phase moving slower than the lighter (water) phase. Therefore, the solid holdup or volume fraction is the ratio of the water volume occupied by nutrients to the total water volume of a raceway pond. The presence of algal cells and any bioprocesses or chemical reactions was not considered.

2.2. Numerical Modeling

2.2.1. Solid–Liquid Modeling

The Euler–Euler numerical scheme was employed to simulate the mixture of nutrients and water in an algal raceway pond. The two phases comprised a dispersed phase (nutrients) and a continuous phase (water). The Euler–Euler model considered the continuous phase as liquid (water) and the dispersed phase as solid particles (nutrients). The momentum equation for the mixture of nutrients and water is as follows:
ρ u T + ρ ( u · ) u = p · ( μ + μ T ) [ u + u T ] + ρ g · [ ρ c d ( 1 c d ) ( u slip D m d ( 1 c d ) φ d φ d ) ( u slip D m d ( 1 c d ) φ d φ d ) T ] ,
where u represents the velocity vector, ρ refers the density, p denotes the pressure, μ is the mixture viscosity, μ T is the turbulent viscosity, c d is the mass fraction of the dispersed phase, u slip denotes the relative velocity vector between the two phases, D m d represents the turbulent dispersion coefficient, g refers to the gravity vector, and T is the transpose operator. The velocity ( u ) represents the mass-averaged mixture velocity and is defined as:
u = ( φ c ρ c u c + φ d ρ d u d ) / ρ ,
where φ c is the volume fraction of the continuous or liquid phase, φ d represents the volume fraction of the dispersed or solid phase, u c represents the continuous phase velocity vector, u d is the dispersed phase velocity vector, ρ c refers to the continuous phase density, ρ d is the dispersed phase density, and ρ is the mixture density. The mass fraction ( c d ), mixture density ( ρ ), and continuous phase volume fraction ( φ c ) are defined by the following relations:
c d = ( φ d ρ d ) / ρ
ρ = φ c ρ c + φ d ρ d
φ c = 1 φ d .
The Euler–Euler model used the following continuity equation for the mixture of nutrients and water in an algal pond:
( ρ c ρ d ) [ · ( φ d ( 1 c d ) u slip D m d φ d ) + m dc ρ d ] + ρ c ( · u ) = 0 ,
where m dc is the mass transfer rate from the dispersed to the continuous phase.
The Euler–Euler model utilized the Schiller–Naumann drag model [31] to define the relative velocity ( u slip ) between the two phases. The Schiller–Naumann drag model is particularly compatible with solid particles in a liquid. The following relation was utilized for the slip velocity to balance viscous drag and buoyancy forces acting on the dispersed phase:
3 4 C d d p ρ c | u slip | u slip = ( ρ c ρ d ) ρ ( u T ( u · ) u + g + 1 ρ ) ,
where C d denotes the particle or nutrient drag coefficient and d p refers the particle or nutrient size. The drag coefficient ( C d ) is modeled by the Schiller–Naumann drag model as follows:
C d = { 24 R e p ( 1 + 0.15 R e p 0.687 )   i f   R e p 1000 0.44   i f   R e p > 1000 ,
where R e p represents the Reynolds number based on particle size.

2.2.2. Turbulence Modeling

The governing equations for the turbulent kinetic energy ( k ) and the dissipation rate ( ε ) are represented as follows:
ρ k t = · ( ( μ + μ T σ k ) k ) + P k ρ ε
ρ ε t + ρ u · ε = · ( ( μ + μ T σ ε ) ε ) + C ε 1 ε k P k C ε 2 ε 2 k
P k = μ T ( u : ( u + ( u ) T ) 2 3 ( · u ) 2 ) 2 3 ρ k · u
μ T = ρ C μ k 2 ε ,
where σ k and σ ε represent the turbulent Prandtl numbers. C ε 1 and C ε 2 refers the first and second experimental model constants. This study determined the model constants from the experimental data of Wilcox [32] and used the following values for them: σ k = 1.0, σ ε = 1.3, C ε 1 = 1.44, C ε 2 = 1.92, and C μ = 0.09. The turbulent dispersion coefficient ( D m d ) is defined as follows:
D m d = μ T ρ S c ,
where S c is the turbulent Schmidt number with a value set at 0.35 [33]. An ordinary differential equation was applied to model the rotating motion of the paddle wheel and can be written as follows:
d w d t = ω ,
where w represents the rotational speed (revolutions per minute) and ω is the angular velocity. The range of paddle wheel rotational speed was between 15 and 30 (1/min) in a raceway pond.

2.2.3. Mass Transfer Modeling

Two-film theory defines the mass transfer rate ( m dc ) term of the continuity equation (Equation (9)) as follows [34]:
m dc = k s l ( c a c c ) M a ,
where k s l refers to the solid–liquid mass transfer coefficient, c a represents the initial solid particle concentration in liquid, c c is the dissolved particle concentration in liquid, M denotes the molecular weight of nutrient, and a is the interfacial area per volume. The mass transfer rate typically depends on the interfacial area between the dispersed and continuous phases. The following equation was applied to calculate the interfacial area ( a ):
a = ( 4 n π ) 1 / 3 ( 3 φ d ) 2 / 3
where n represents the number of solid particles per volume. Solving the number of solid particles per volume (n) is necessary to determine the interfacial area.
This study used the correlation of Kalaga et al. [16] to estimate the solid–liquid mass transfer coefficient ( k s l ) in a raceway pond. This correlation fully represents the parameters that affect the solid–liquid mass transfer in a raceway pond and is expressed as follows:
k s l = 0.672 V l ( R e p ) 0.643 ( S c ) 0.906 ( F r ) 0.649 ( M v ) 0.216 ( g μ l ρ l V l 3 ) 0.894
R e p = ( d p ρ l V l ) / μ l ,   S c = μ l / ( ρ l D ) ,   F r = V l 2 / ( g d p ) ,   M v = ( ρ s ρ l ) / ρ l ,
where F r represents the Froude number, M v refers the density number, D is the diffusion coefficient for turbulent flow, and ρ s is particle or nutrient density.
The population balance equation was employed for modeling the number of solid particles per volume (n). The governing equation for nutrient population is defined as follows [34,35]:
n t + · ( n ( u + u slip ( 1 c d ) ) ) = · ( D m d n ) .
The transport equation for the solid particle concentrations in liquid is expressed as follows:
c c t + c c · u c = · ( D c c ) + m dc M ,
where c c is the dissolved particle concentrations in liquid. The diffusion coefficient for turbulent flow is estimated with the following equation [33,36]:
D = μ T ρ c .

3. Numerical Simulation and Mesh Generation

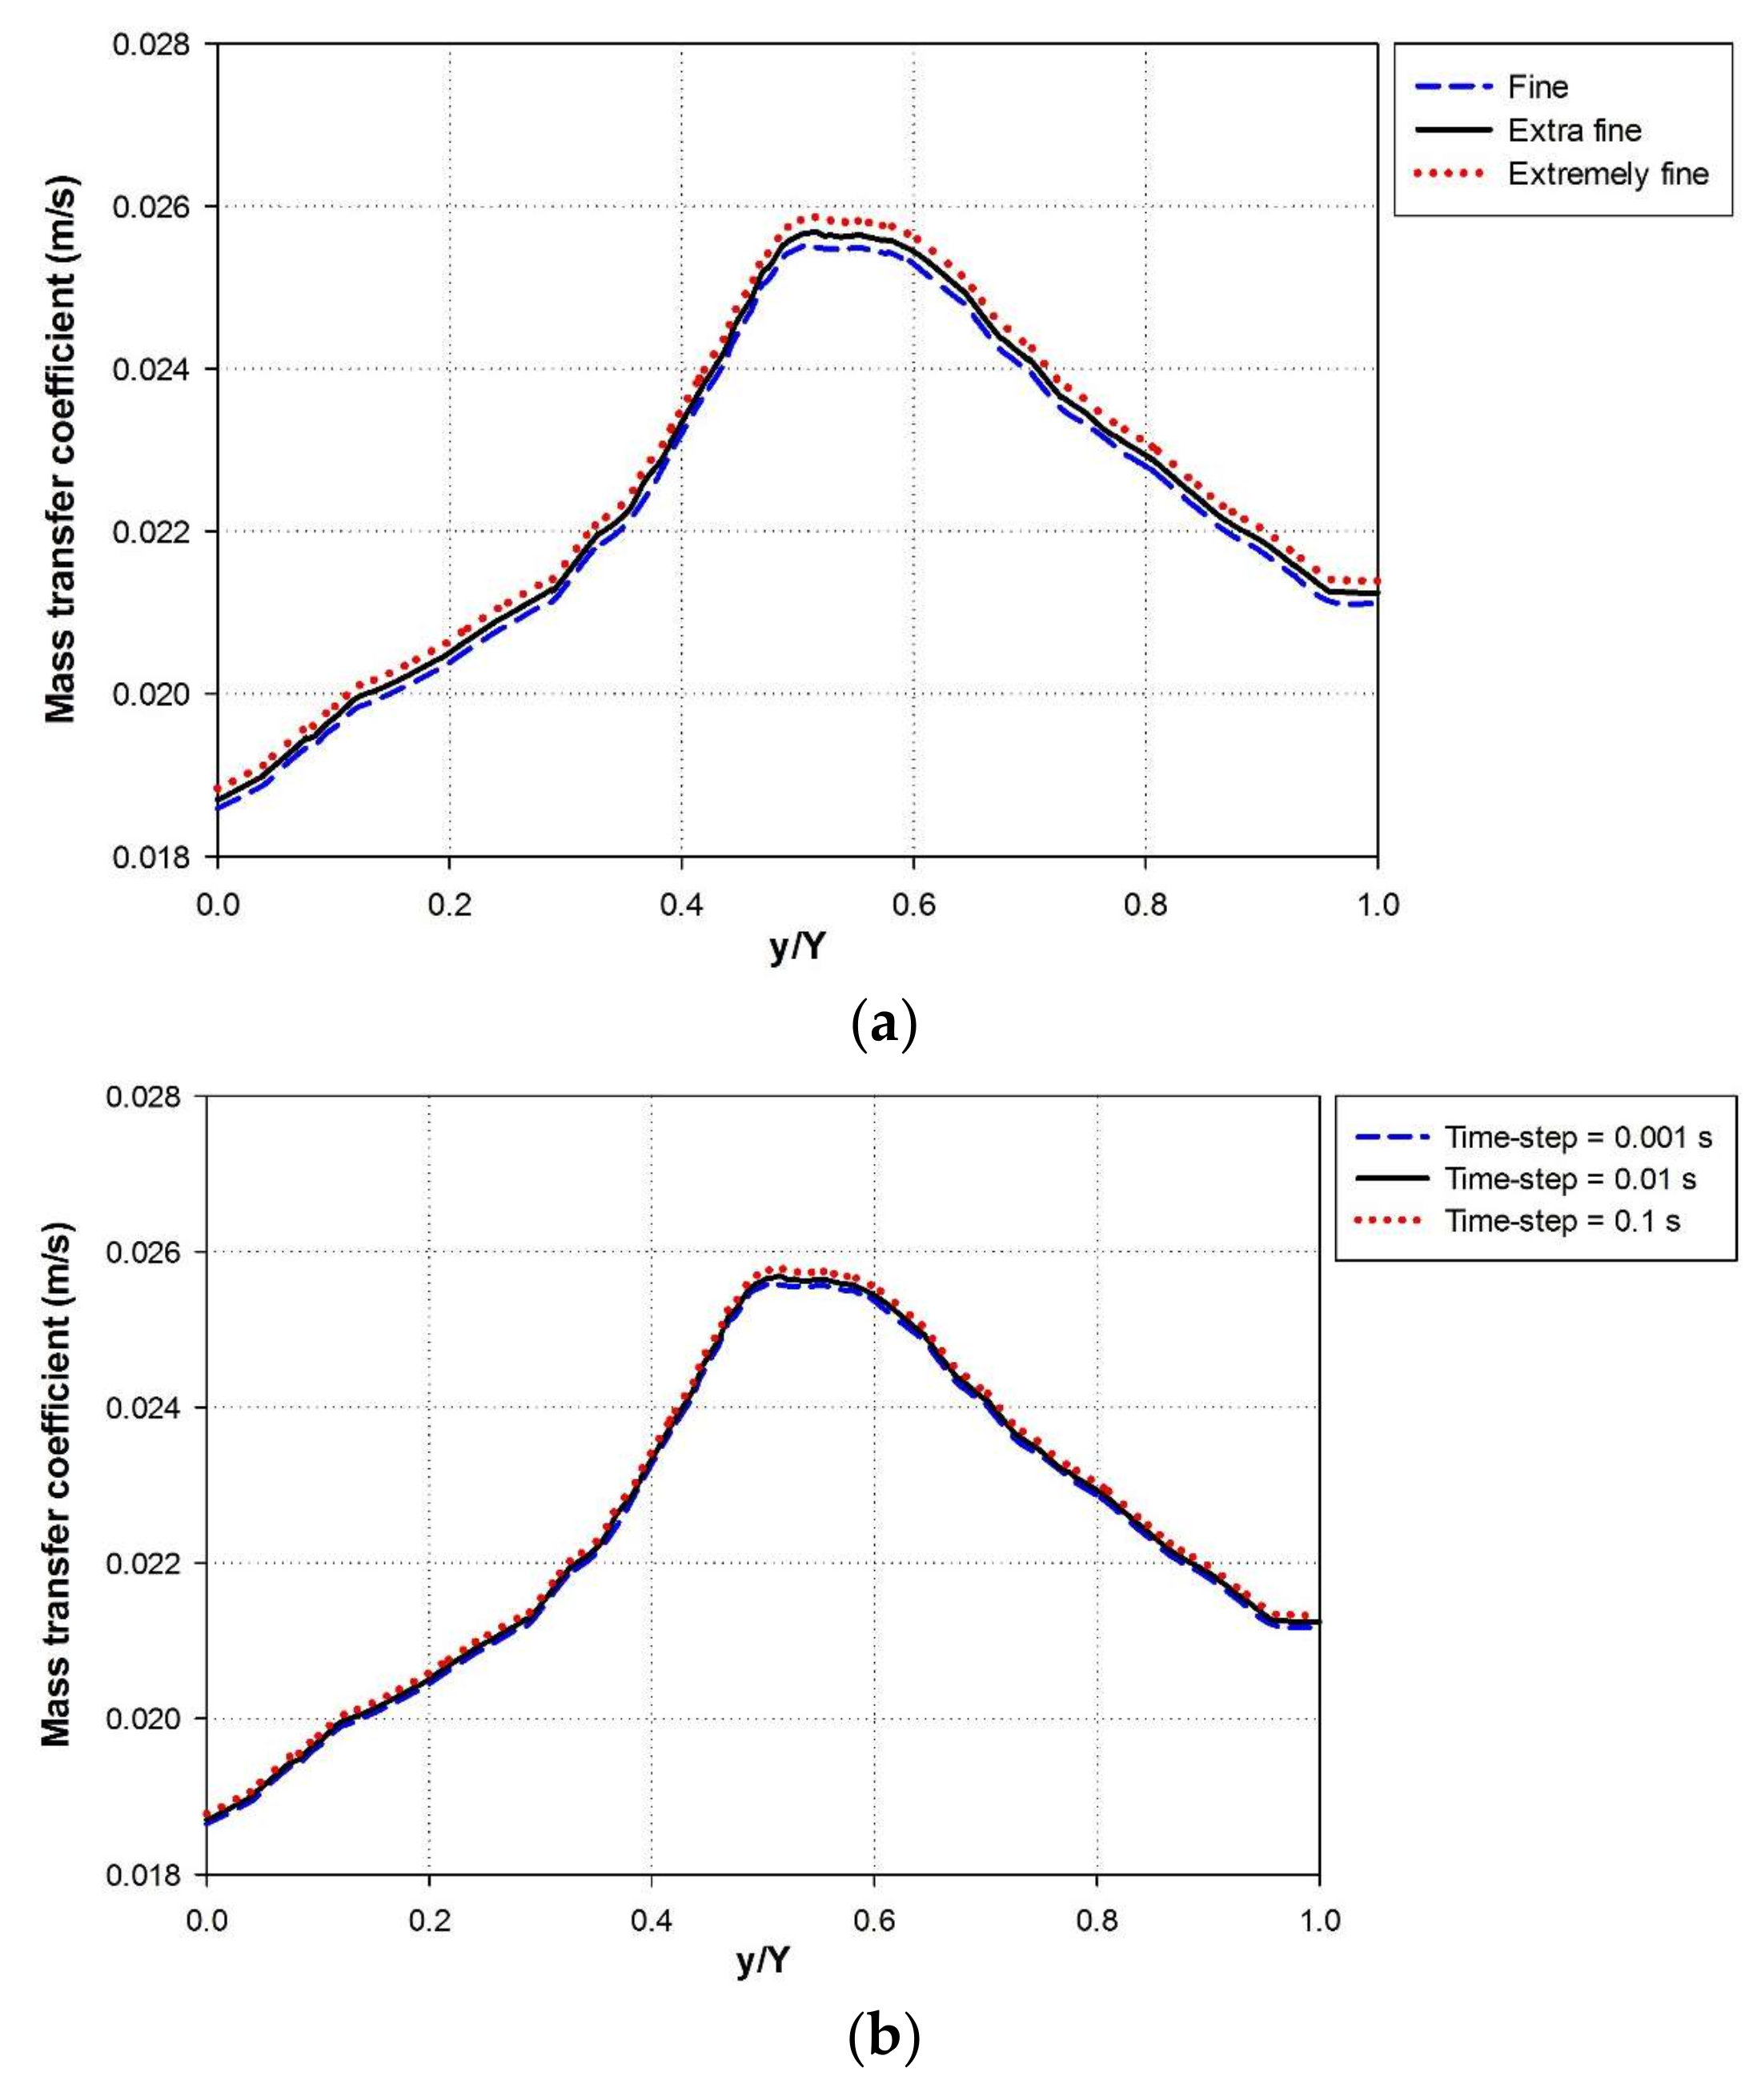
The CFD modelling and simulation of nutrient dissolution (solid–liquid mixing with mass transport) in algal raceway pond was carried out with COMSOL-Multiphysics (V 5.3 a, COMSOL Inc., Burlington, MA, USA). The Euler–Euler-based mixture model interface of the COMSOL-Multiphysics was selected to simulate the solid–liquid mixing with mass transport. The transport of diluted species interface of COMSOL-Multiphysics was utilized to simulate the concentration of nutrients in the raceway pond. A 2D paddle wheel was modeled and coupled with the 3D raceway pond using the boundary-connected coupling methodology to save the computational memory and time [24,25,26,27,28]. The 2D paddle wheel was simulated with the rotating machinery interface of the COMSOL-Multiphysics. A triangular and tetrahedral element type was used to construct the mesh of the 2D paddle wheel and the 3D raceway pond. A grid independence test was performed to determine the accuracy of the present CFD model using the solid–liquid mass transfer coefficient. This study selected three different grid sizes by varying the grid size with a factor of five: fine (paddle wheel = 4334 elements, raceway pond = 32,750 elements), extra fine (paddle wheel = 21,670 elements, raceway pond = 163,750 elements), and extremely fine (paddle wheel = 108,350 elements, raceway pond = 818,750 elements).
The solid–liquid mass transfer coefficient of potassium nitrate was calculated in the center (Y-axis) of the downstream bend or curve of the raceway pond. A slight variation was observed between the results of solid–liquid mass transfer coefficient for three different grid sizes (Figure 2a). Therefore, extra fine grid size was adopted to perform all simulations in this study. The dependency of results (CFD model) on time was also checked by carrying out a time-step independence test. A total of three distinct time steps were selected by changing the time step with a factor of 10 (i.e., 0.001, 0.01, and 0.1 s). The solid–liquid mass transfer coefficient of potassium nitrate showed a minimum difference for three different time steps (Figure 2b). Therefore, the rotating machinery, Euler–Euler mixture model, and transport of diluted species interfaces of COMSOL-Multiphysics were simulated using an implicit transient solver for 200 min at a time step of 0.01 s.

4. Results and Discussion

4.1. Experimental Validation

This study carried out an experiment in a laboratory-scale raceway pond to verify the proposed CFD model using solid-liquid mass transfer coefficient and nutrient concentrations. The laboratory-scale raceway pond had a surface area of 0.1 m2, a length ( L ) of 0.5 m, a width ( 2 W ) of 0.2 m, a height ( H ) of 0.15 m, and a water depth ( d ) of 0.05 (Figure 1b). The mixing in the raceway pond was performed using a paddle wheel (diameter = 0.1 m) with six blades. The paddle wheel was supplied with electric power using an AC induction motor (6 W) with a maximum rotational speed of 240 and a gear ratio of 7.5:1. The rotational speeds of paddle wheel were changed between 25 and 55. The fluid velocity and nutrient concentrations were measured for 1800 s in the downstream section of the raceway pond by using flow rate (FLO-BTA, Vernier, Beaverton, OR, USA) and salinity sensors (SAL-BTA, Vernier, Beaverton, OR, USA) (Figure 1b). The flow rate and salinity sensors were connected to a computer using LabQuest stream interface (Vernier, Beaverton, OR, USA) and visualized with Logger Lite software (V 1.9, Vernier, Beaverton, OR, USA). The fluid density was measured with a hydrometer due to the changes in magnitudes with the addition of nutrients. The experimentally measured flow properties (fluid velocity and density) were then utilized to estimate the experimental nutrient mass transfer coefficient (Equation (20)). Solid particles of potassium nitrate (KNO3) and disodium phosphate (Na2HPO4) were directly injected into the raceway pond to provide the necessary nutrients (Table 1). The experiment was conducted using 1 g of KNO3 and 0.225 g of Na2HPO4. The pH of the medium was maintained between 7 and 8. A total of three different nutrient compositions, namely, (a) KNO3 and Na2HPO4; (b) KNO3; and (c) Na2HPO4, were used to precisely examine their combined and individual effects on the nutrient mass transfer coefficient. The raceway pond was simulated using the proposed CFD model and compared with the experimentally computed results of mass transfer coefficient and nutrient concentrations.

4.1.1. Solid–Liquid Mass Transfer Coefficient

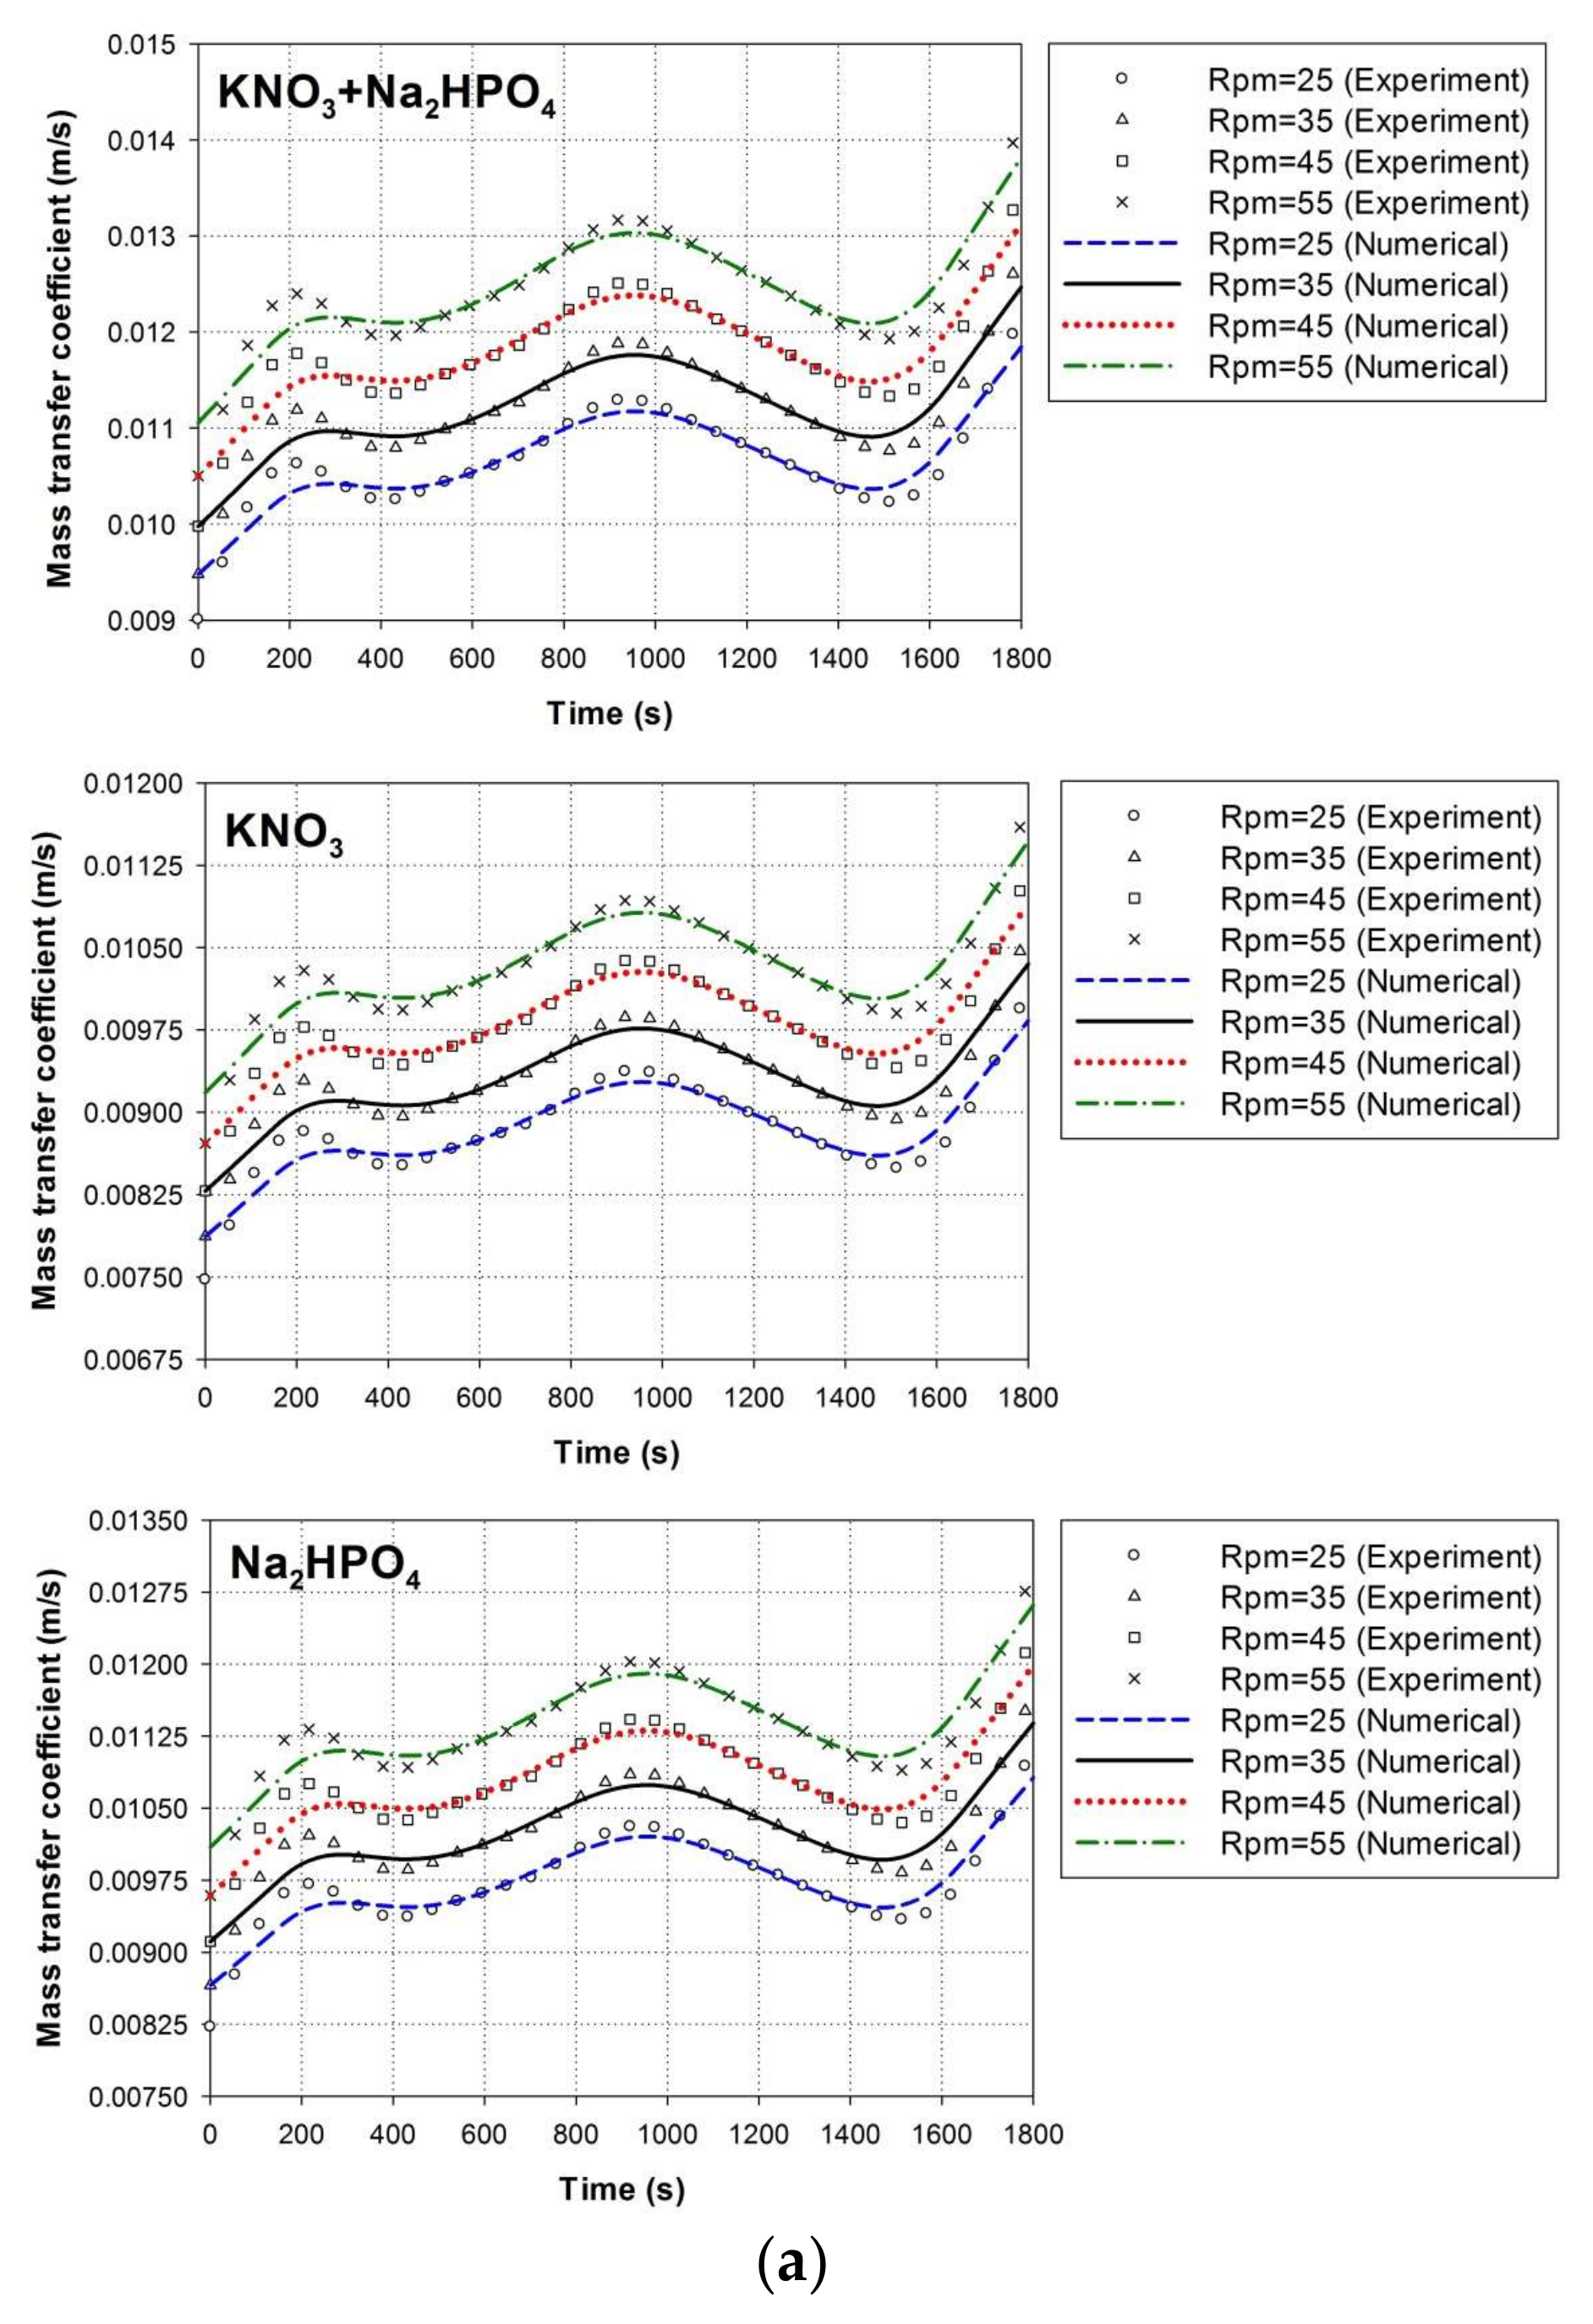
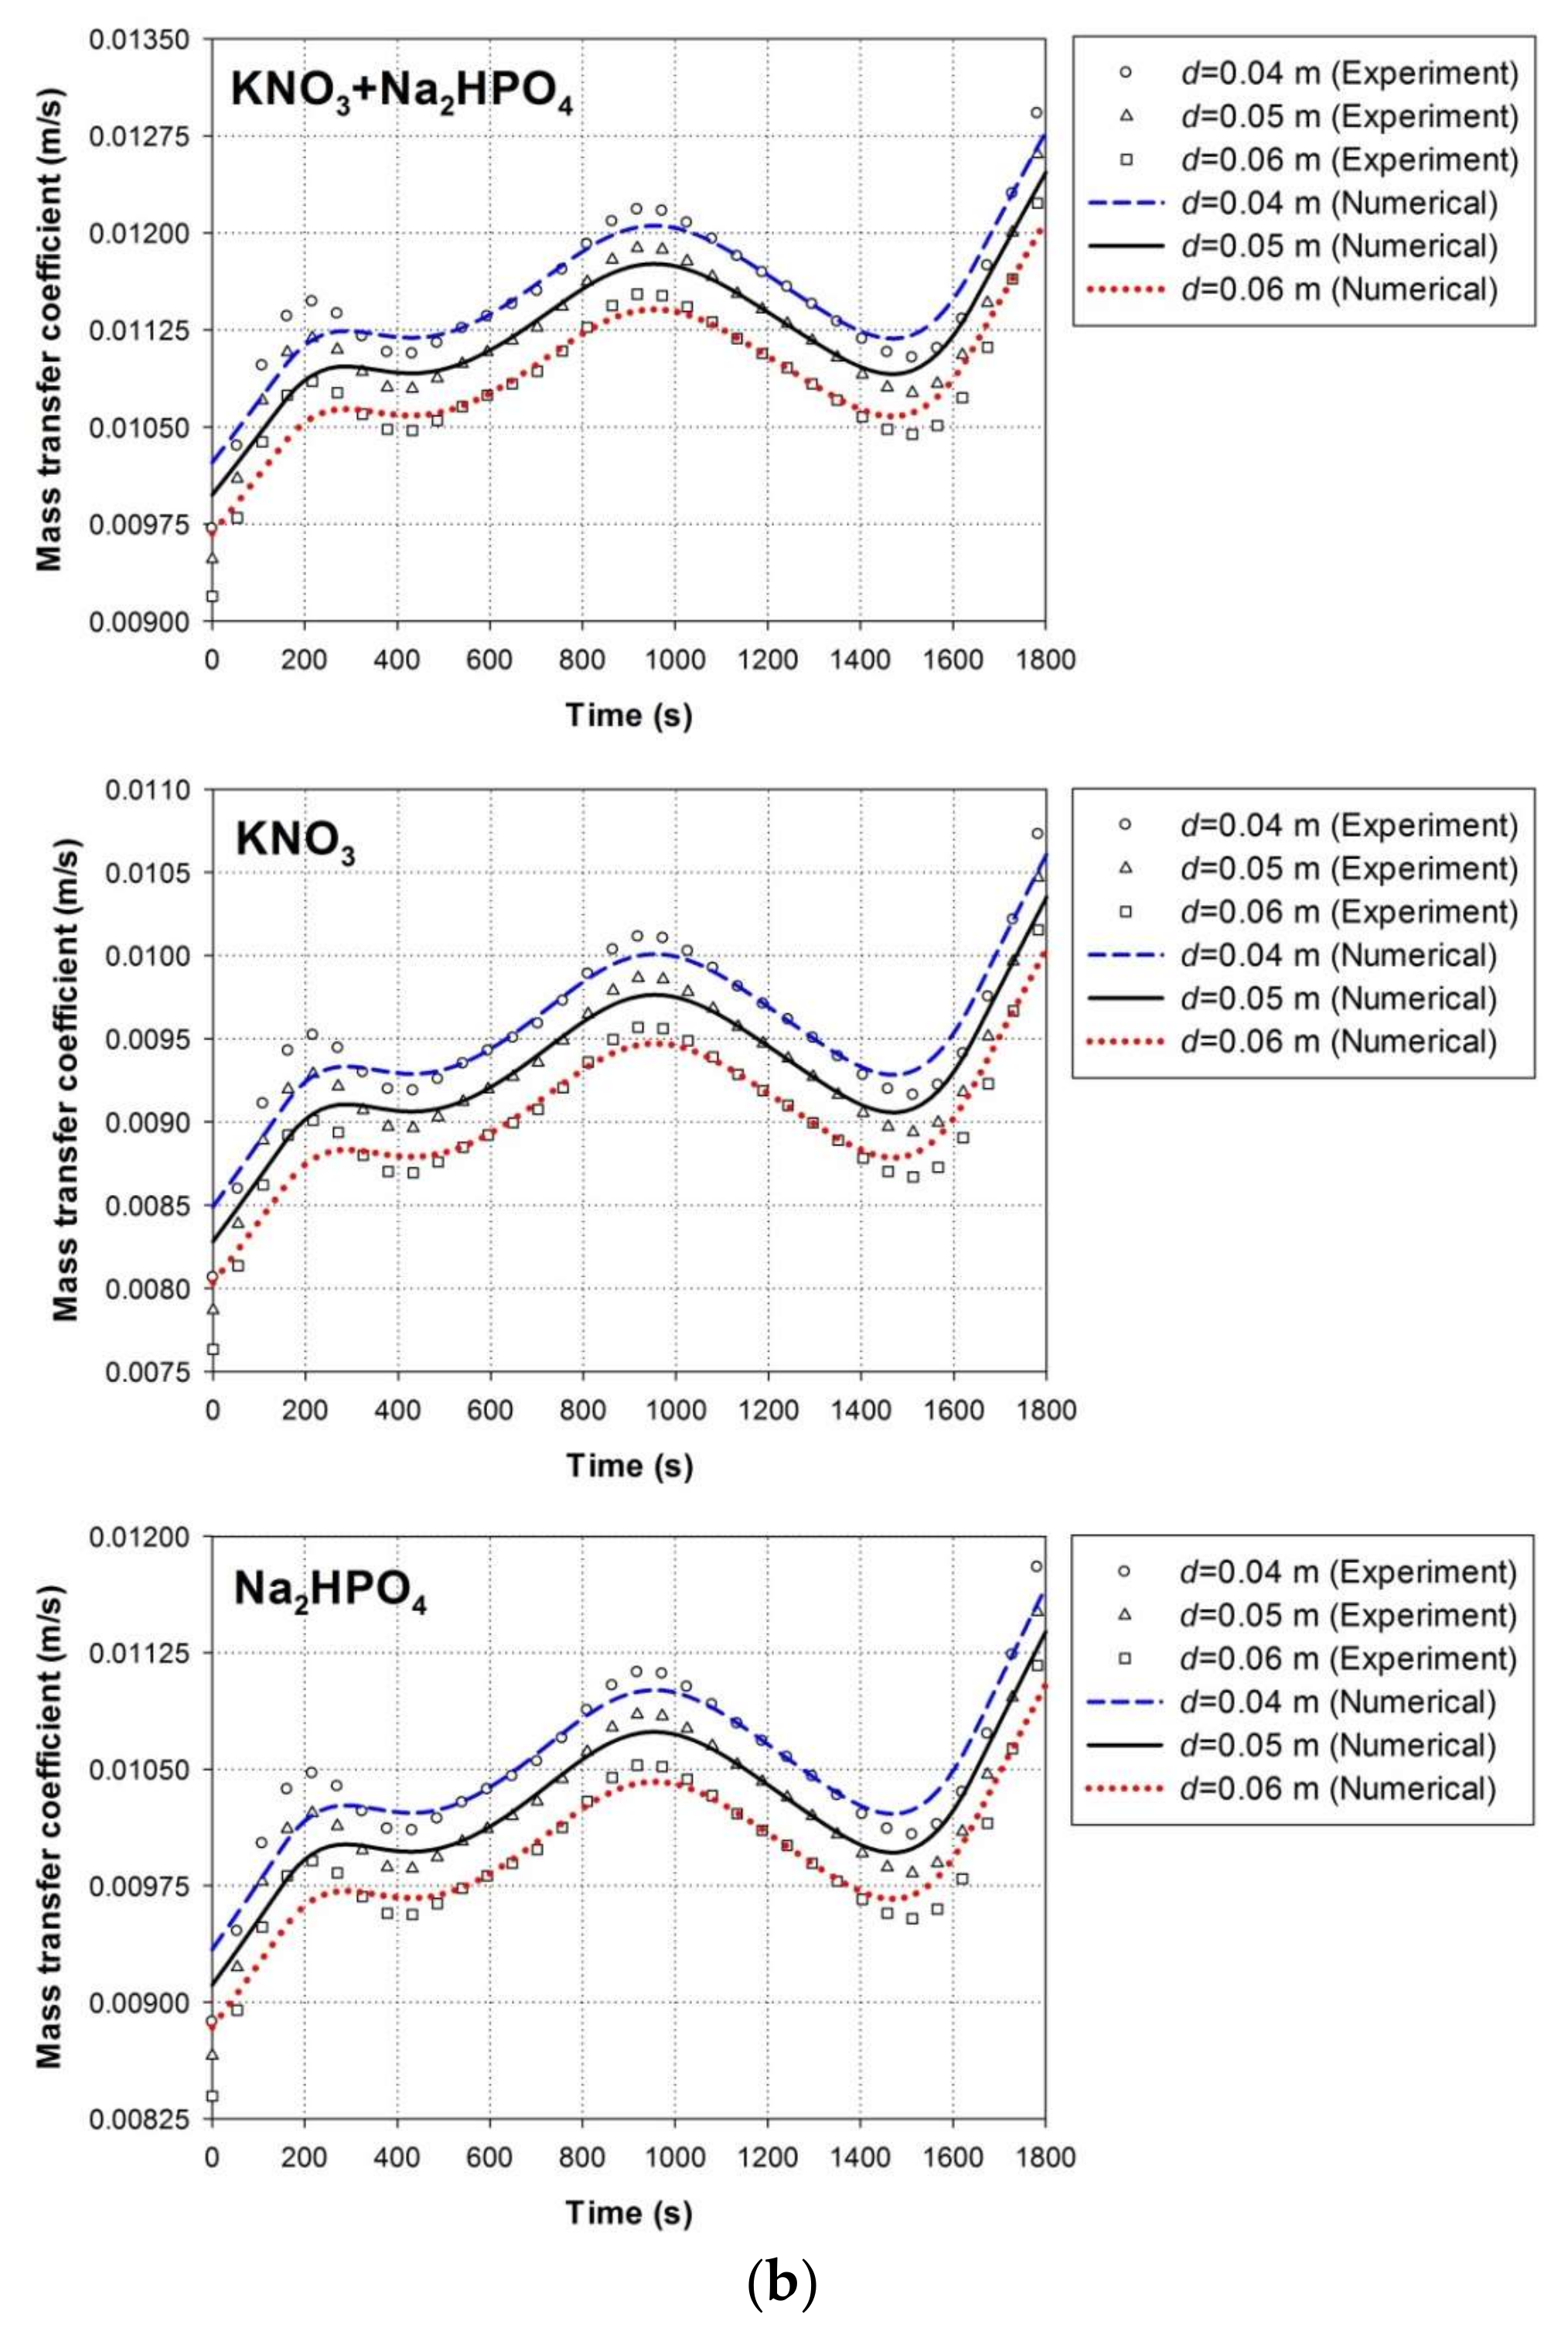
The mass transfer coefficient considerably depended on the liquid velocity. Periodic variations in the mass transfer coefficient were observed due to the paddle-wheel-generated pulsatile flow in the raceway pond. Increasing the paddle wheel speeds improved liquid velocity and thus augmented the mass transfer coefficient (Figure 3a). In addition to fluid velocity, the mass transfer coefficient was dependent on the difference between initial and current concentrations of nutrients in the raceway pond. The initial concentration of KNO3 was higher than the Na2HPO4 because the experiment was conducted using 1 g of KNO3 and 0.225 g of Na2HPO4. Therefore, the mass transfer coefficient of Na2HPO4 remained higher as compared to that of KNO3 due to its larger difference in initial and current concentrations and vice versa. The mass transfer coefficient could be employed to estimate the nutrient diffusion rate in the pond water. High mass transfer coefficient values of Na2HPO4 suggested an improved dissolution rate of phosphate in water, which could increase the supply of phosphorus to algae cells [1,3,14]. The effect of water depth on the mass transfer coefficient was also estimated since water depth influences the fluid velocity in a raceway pond. The results were computed using a constant paddle wheel speed of 35. As shown in Figure 3b, the mass transfer coefficient decreased with a rise in water depth. An increase in the water level of the raceway pond resulted in a decrease in liquid velocity, consequently reducing the mass transfer coefficient. The CFD model is based on many assumptions (empirical relation) because the literature lacks universally valid expressions for the solid–liquid flows. These limitations presumably caused a difference in the numerical and experimental results However, the maximum relative variance between the numerical and experimental results in this study remained less than 7%. Therefore, the proposed Euler–Euler-based CFD model is acceptable for simulating the nutrient dissolution in the algal raceway pond.

4.1.2. Nutrient Concentrations

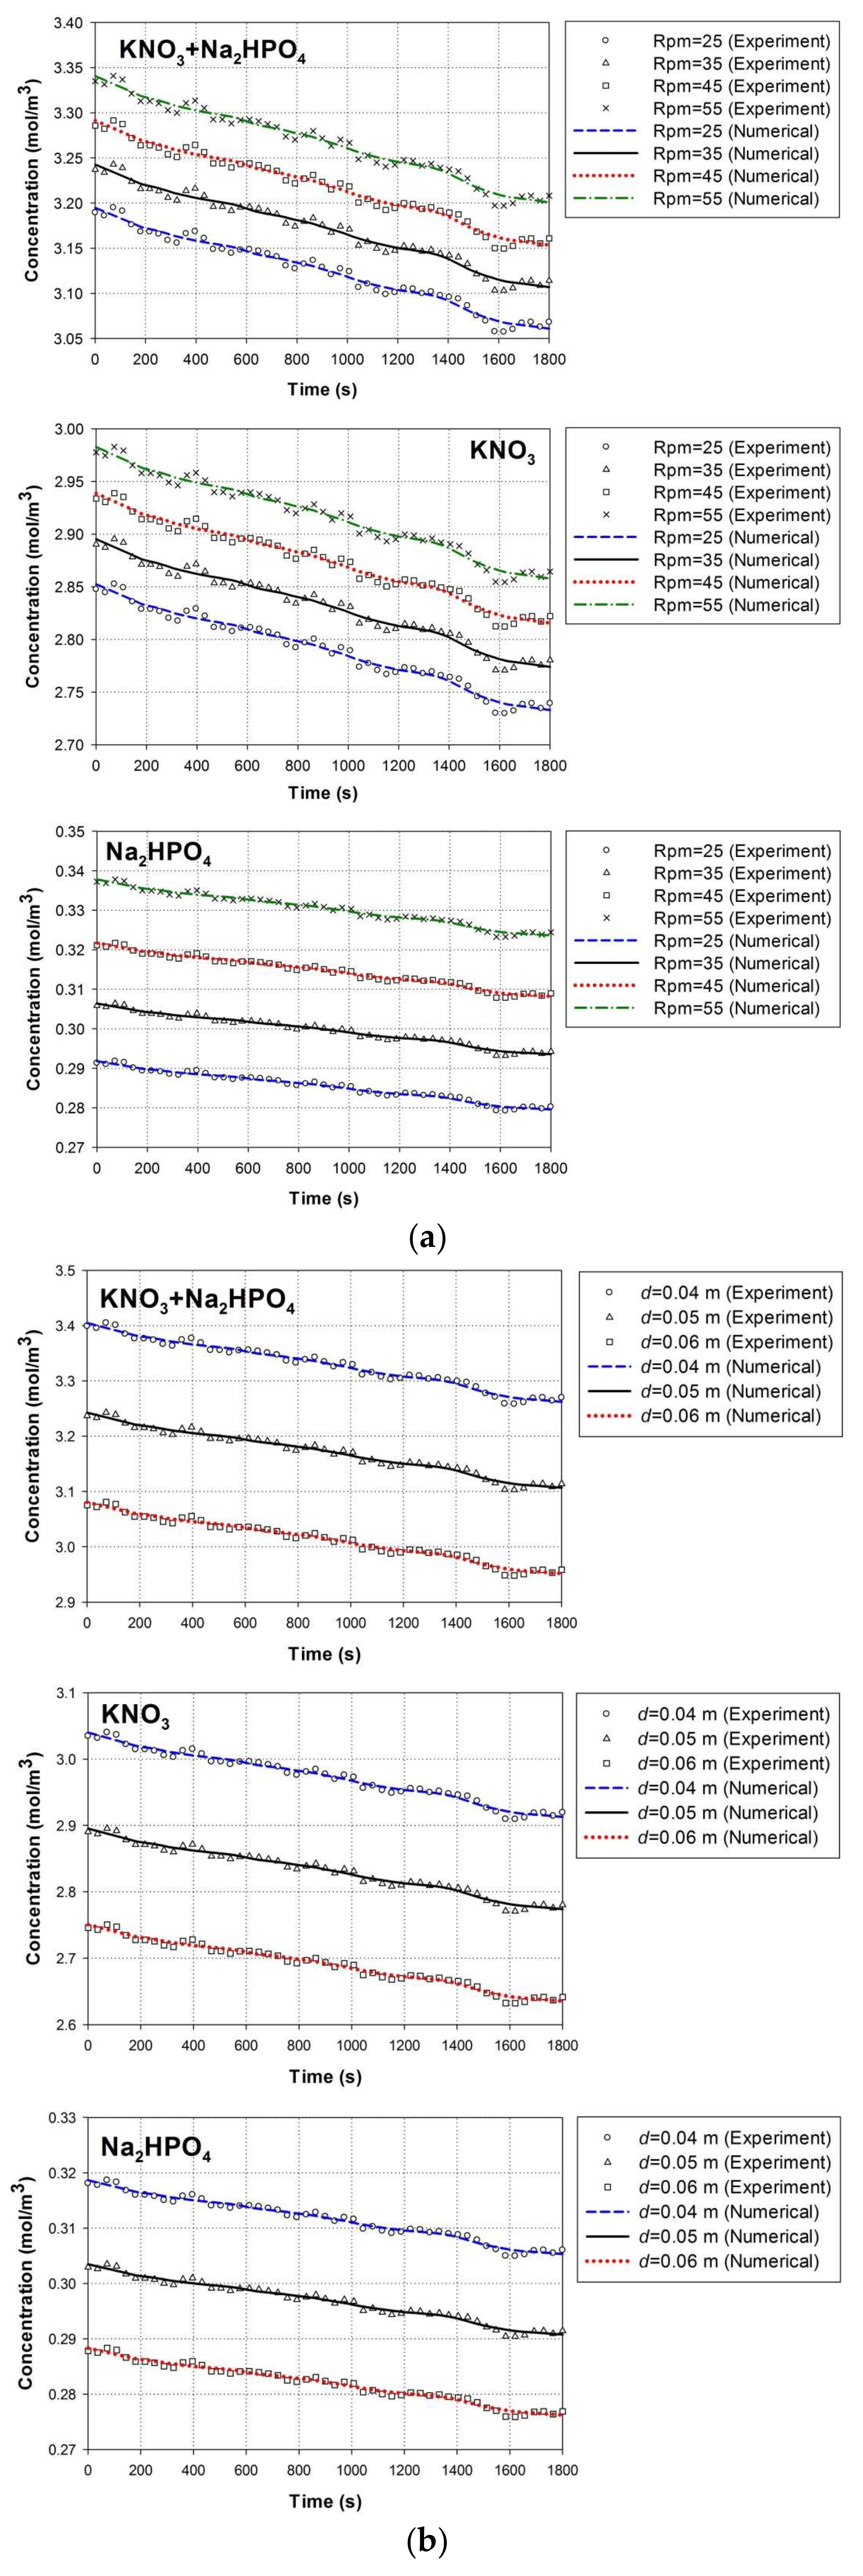
The concentrations of nutrients in the raceway pond obtained from the experiment and numerical simulation were compared to further verify the present CFD model. Nutrient concentrations were time-dependent quantities that decreased with an increase in time (Figure 4a). A change in the liquid velocity significantly affected the rate of nutrient dissolution in the liquid. High paddle wheel speeds improved the liquid mixing, which helped to dissolve more nutrients in the pond, thereby increasing their concentrations in water. The effects of water depth on nutrient concentrations using a constant paddle wheel speed of 35 are shown in Figure 4b. Increasing the water level of the raceway pond resulted in a decrease in liquid velocity and consequently reduced the nutrient concentrations in liquid [13]. The nutrient concentrations in deep ponds could be improved with high paddle wheel rotational speeds [10,27]. A rational agreement was found among the experimental and numerical findings, thus validating that the proposed CFD model could be adopted to simulate nutrient mixing in the raceway pond.

4.2. Effect of Pond Aspect Ratio

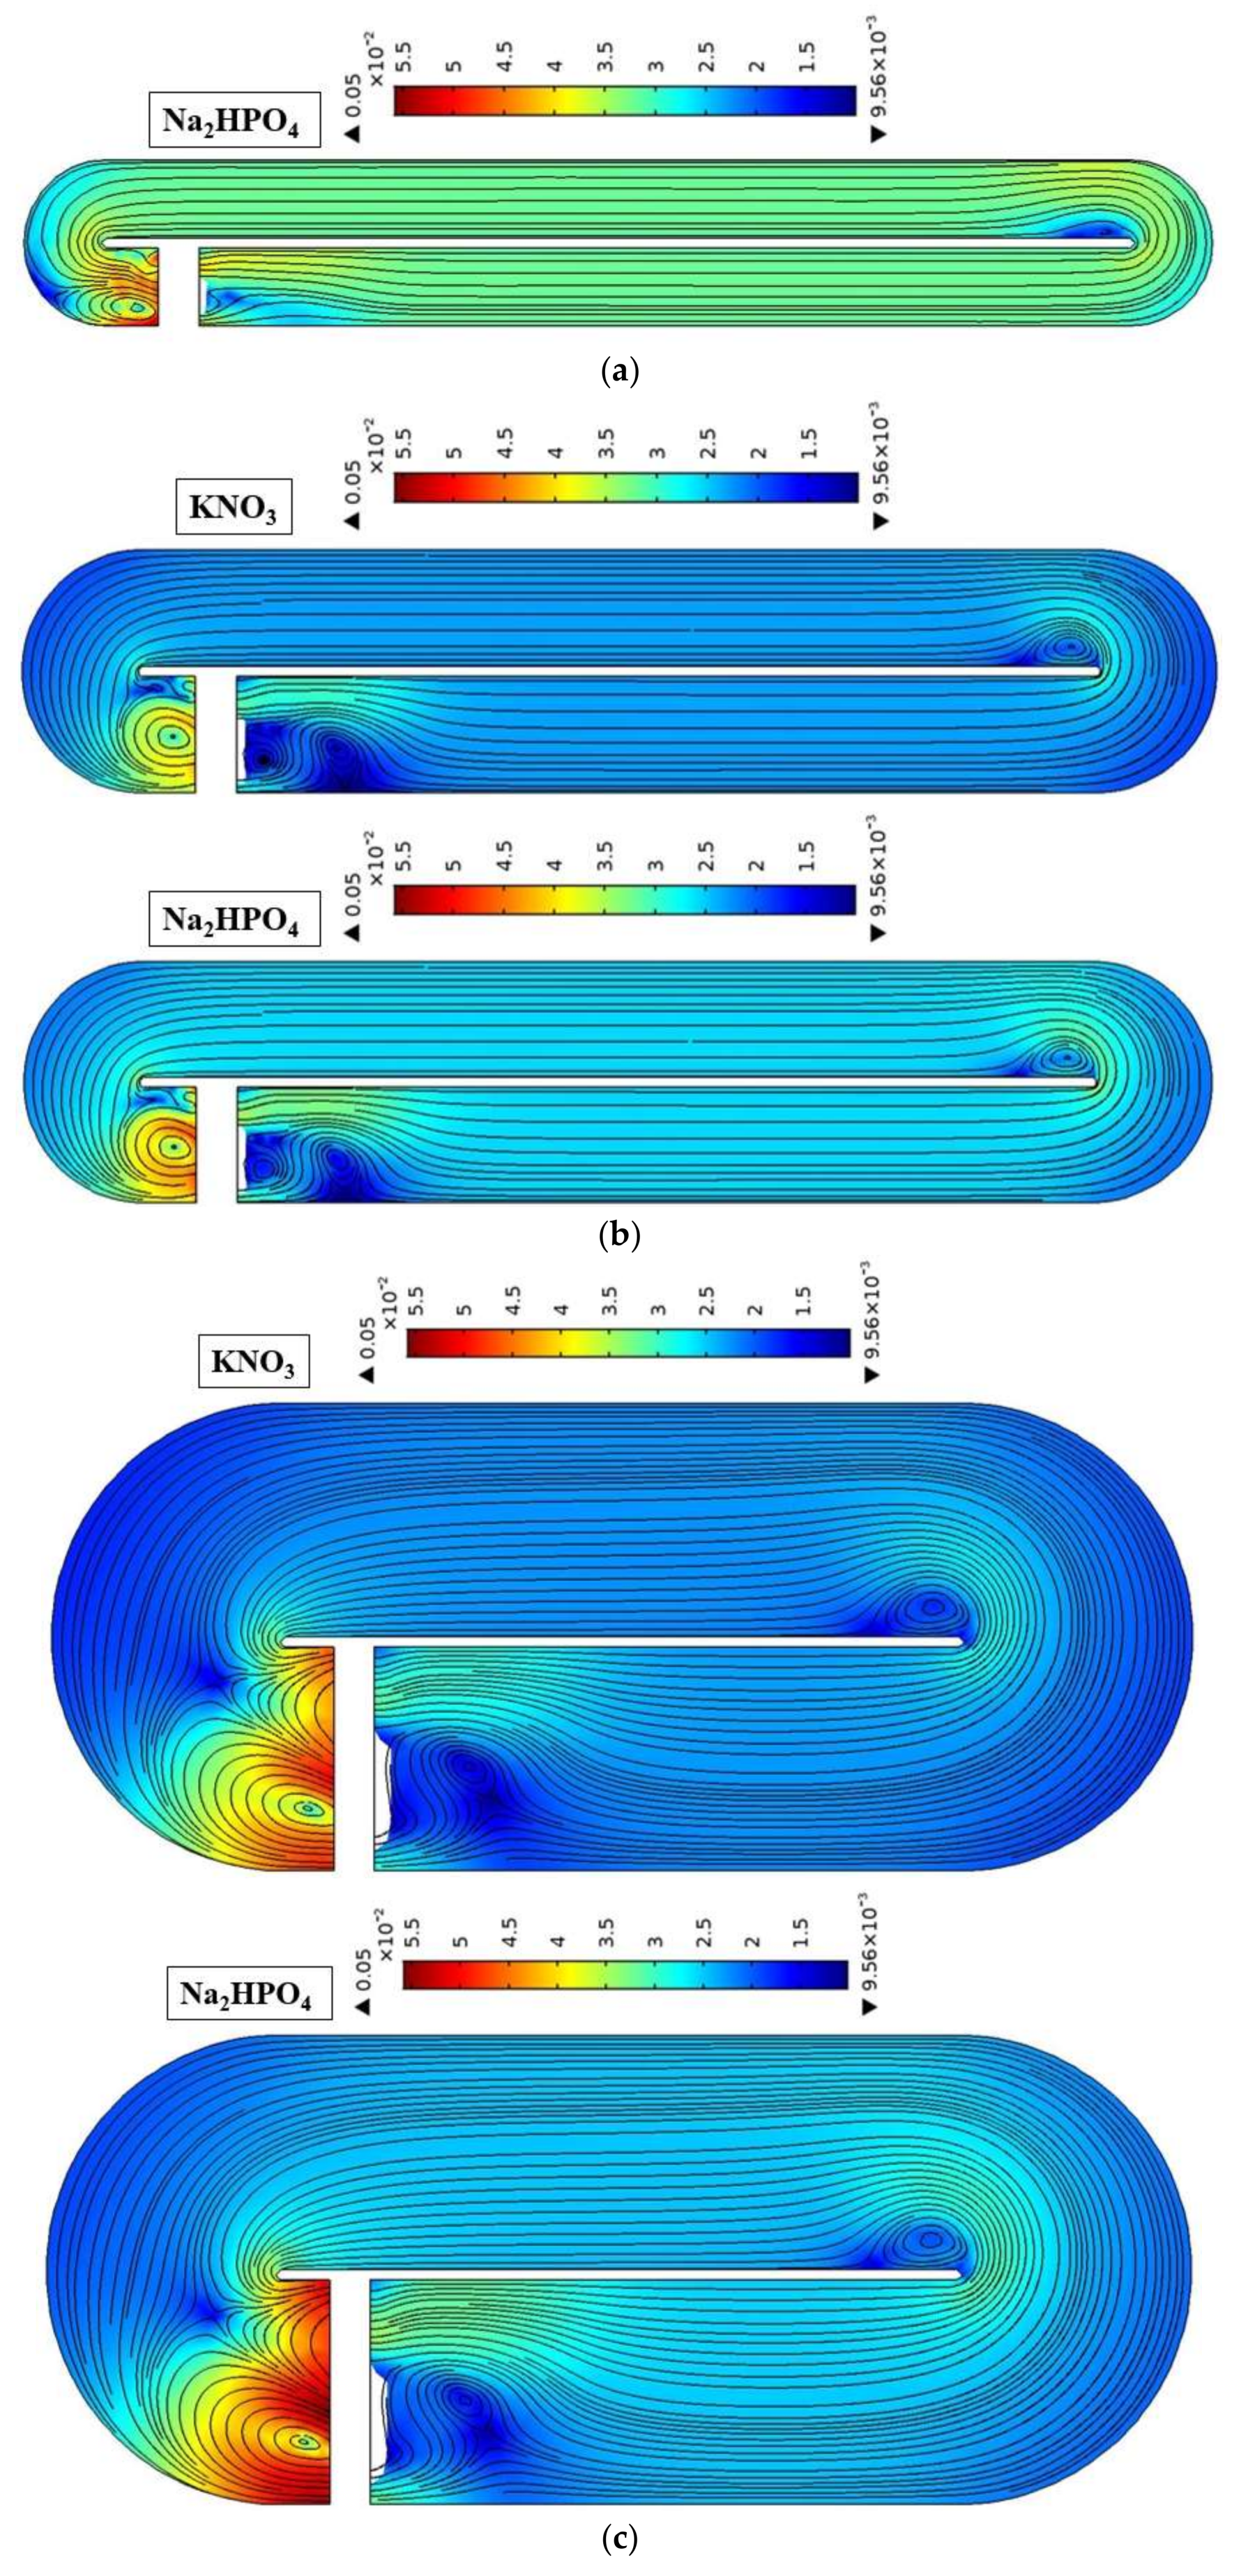
The pond aspect ratio ( A R ) can significantly affect the nutrient dissolution rate because of its substantial effect on the hydrodynamics of the raceway pond. Therefore, the influence of A R on nutrients was examined based on the mass transfer coefficient, solid holdup, and nutrient concentrations. The mass transfer coefficient and liquid velocity were computed (XY plane) to effectively visualize the dissolution of nutrients in water with the effects of different A R s (Figure 5). The mass transfer coefficient is denoted by surface plots, while the liquid velocity is symbolized by streamline plots. The A R of ponds influenced the liquid velocity, which, in turn, affected the mass transfer coefficient. The geometrical features of the raceway pond (bends and central wall) considerably influenced the mass transfer coefficient. Mass transfer was nearly zero near the paddle wheel (blank areas present in the mass transfer coefficient surface plots), which showed the start of nutrient-mixing phenomena. The mass transfer coefficient was nearly uniform in both raceway channels, as shown by the same scale of color. A decrease in liquid velocity near the bend walls significantly reduced the mass transfer coefficient. Liquid particles failed to follow the geometrical shape of the central wall, and a vortex was created adjacent to the central wall in the downstream bend of the raceway pond (Figure 5a). Several vortices were also produced in the channel region near the paddle wheel, which could be attributed to the rotational movement of the paddle wheel blades [27]. The mass transfer between nutrients and liquid was negligible in the regions with vortex flow due to the minimum liquid velocity. Recirculation regions are termed “dead zones” because microalgae cells present in these areas would not effectively receive sunlight, CO2, and nutrient supply, consequently reducing their biomass productivity [27,28]. An increase in A R significantly increased the dead zone because of the decrease in liquid velocity, which accordingly reduced the mass transfer coefficient (Figure 5b,c). The magnitude of mass transfer coefficient was higher with the use of Na2HPO4 than that when KNO3 was used for all A R s. Mass transfer coefficient was low near the walls of upstream and downstream bends and around the central wall, which suggested a minimum nutrient dissolution rate in these regions. These results implied that raceway pond with low A R s (5, 10) reduced dead zones and improved mass transfer rate.
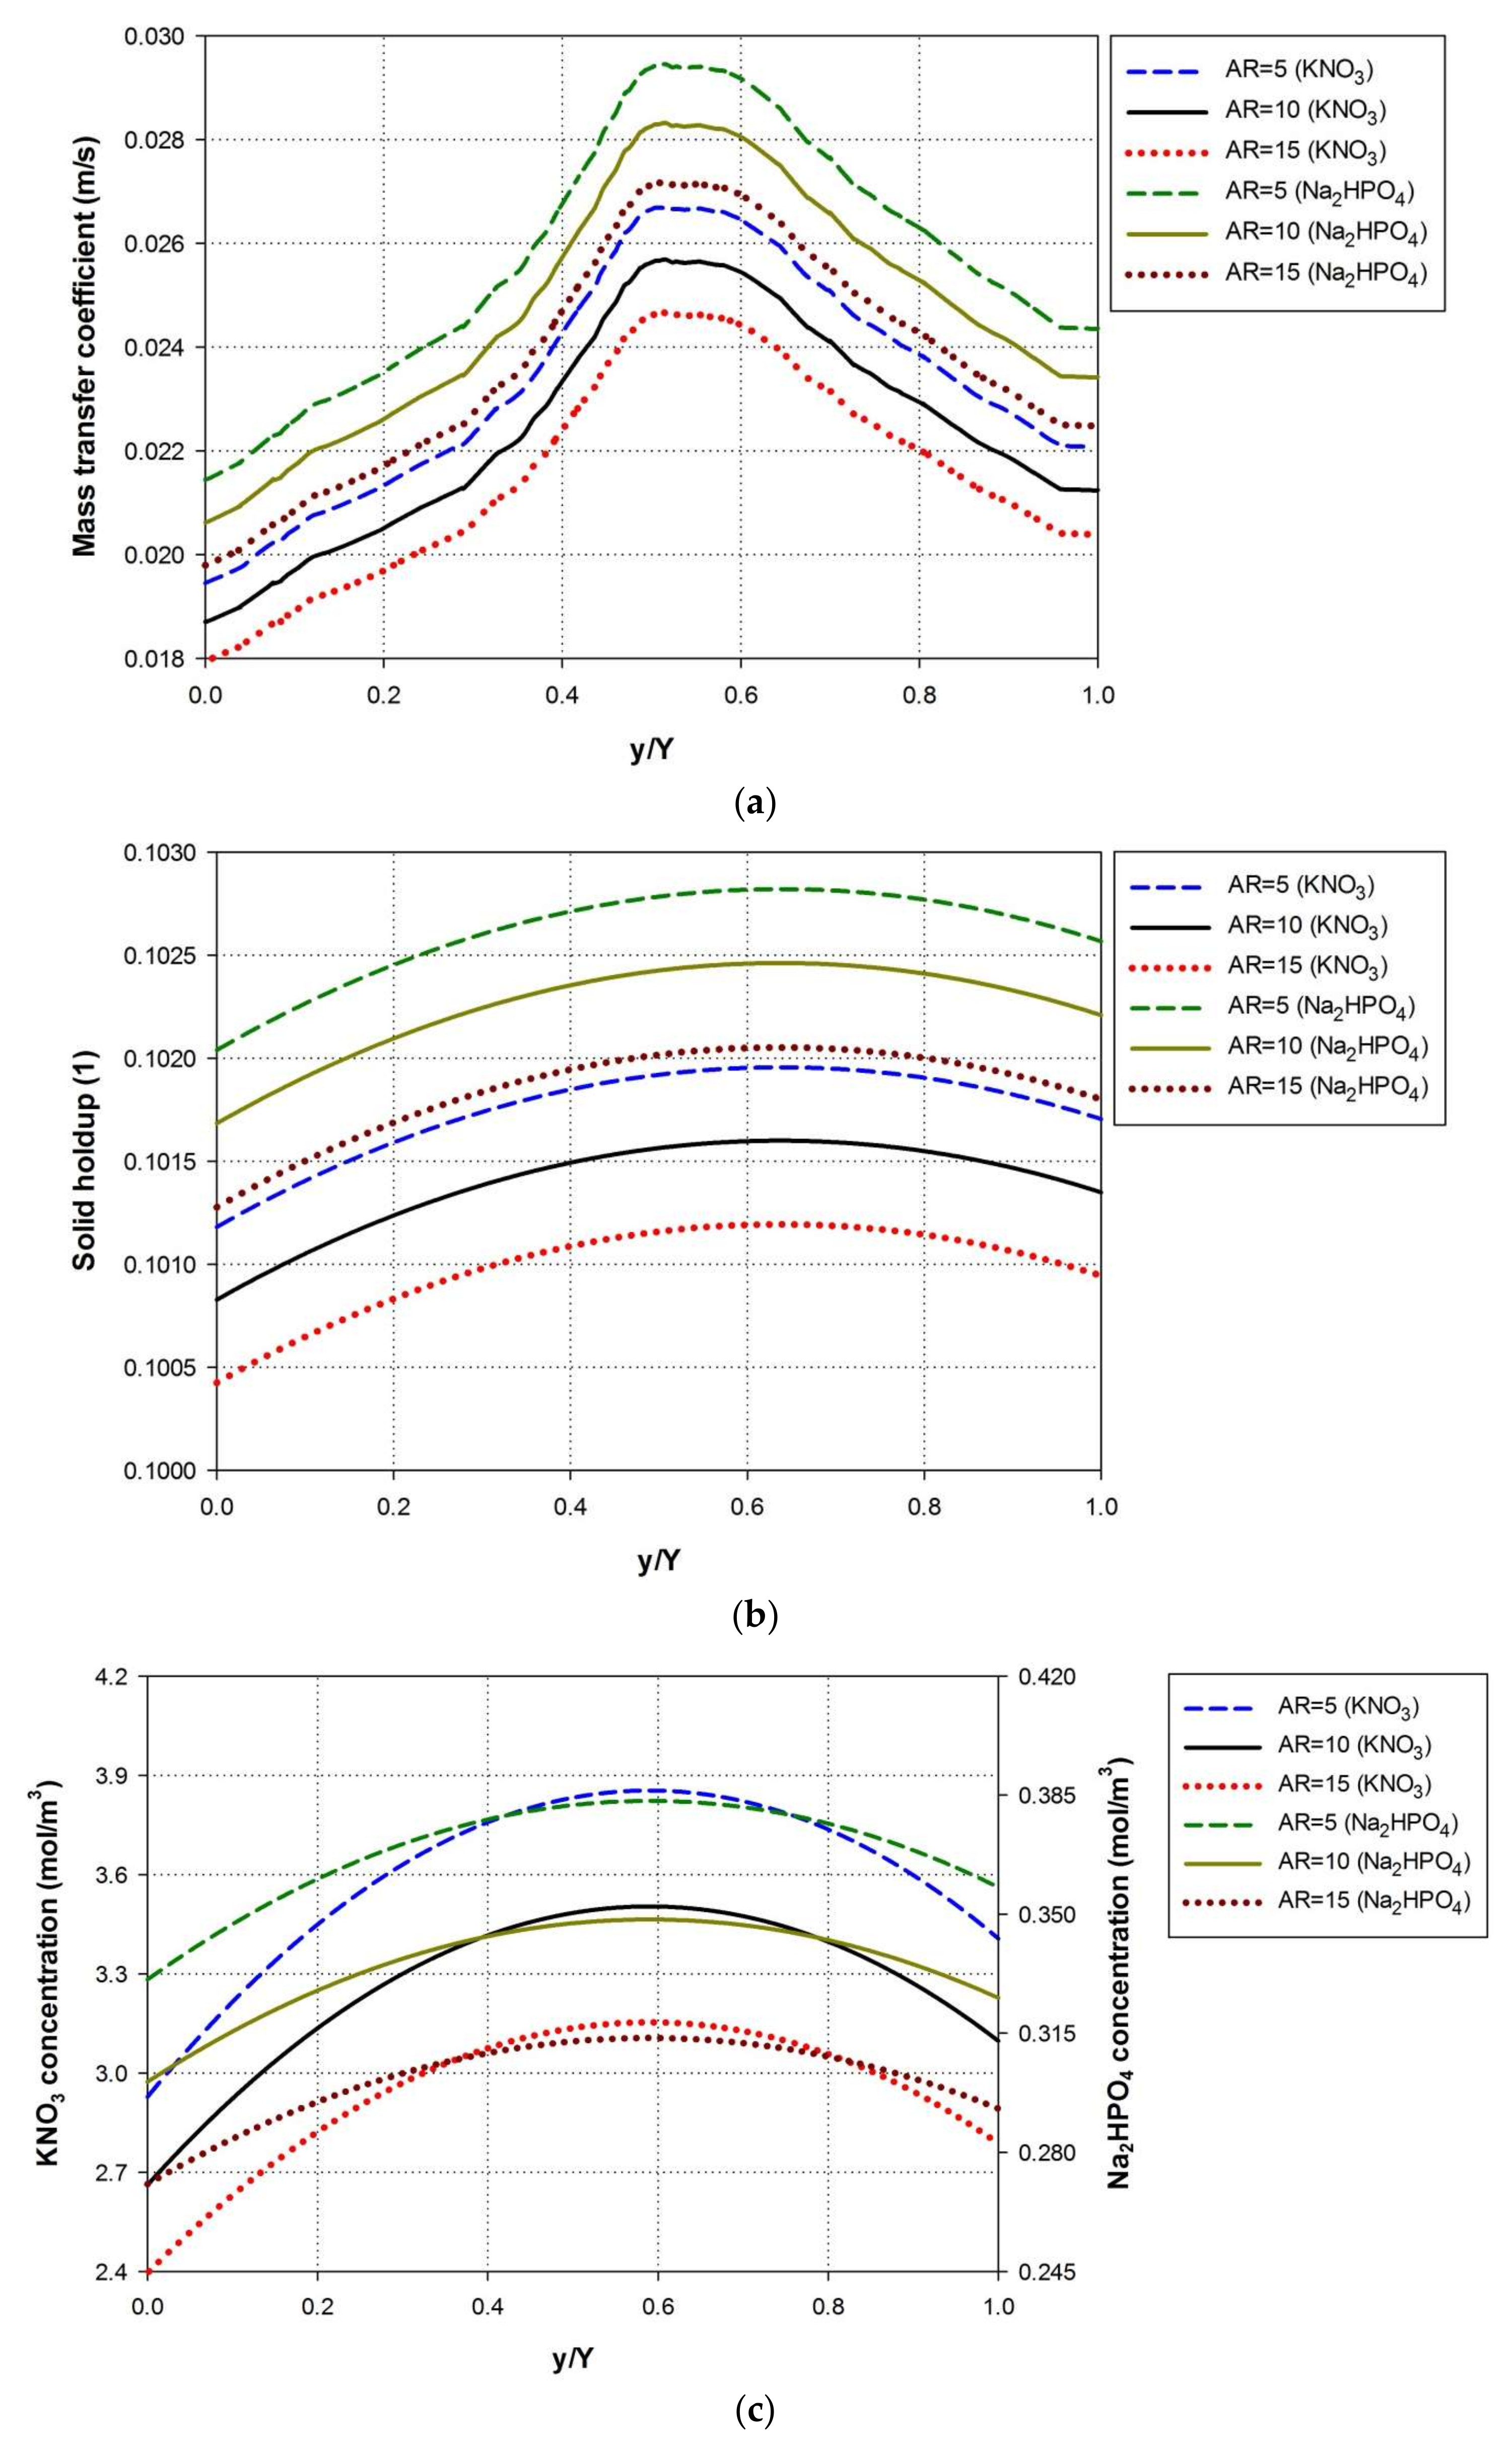
The solid–liquid mass transfer coefficient reduced with a rise in A R for both nutrients (Figure 6a). The pond walls offer flow friction, and thus the water velocity near the pond walls is low as compared to that in the center of the pond channel. Therefore, the mass transfer coefficient was high in the central section of the channel and low close to the walls of the raceway pond. The paddle wheel rotational speed was maintained constant, thereby increasing the A R decreased the fluid velocity in the raceway pond and accordingly diminished the mass transfer coefficient. The low mass transfer of KNO3 resulted in the insufficient dissolution of nitrate in water, particularly in raceway ponds with large A R s [1]. The solid holdup was decreased in the large pond size ( A R ) (Figure 6b). A high-magnitude solid holdup appeared in the channel center, whereas a low one occurred near the walls of the raceway pond. The high solid holdup in the channel center suggested a sufficient supply of nutrients. Nutrient concentrations displayed patterns similar to those of solid holdup, which were high in the mid of channel and low near the pond walls (Figure 6c). A significant difference between the concentrations of both nutrients was observed because of the difference in their initial concentrations. An increase in A R significantly reduced the nutrient concentrations in the raceway pond. Increasing pond size could reduce nutrient concentration below the optimum value [1,14]. These results suggested that nutrient dissolution reduced in raceway ponds with large A R s due to low solid–liquid mass transfer coefficient, solid holdup, and nutrient concentrations.

4.3. Effect of Water Depth

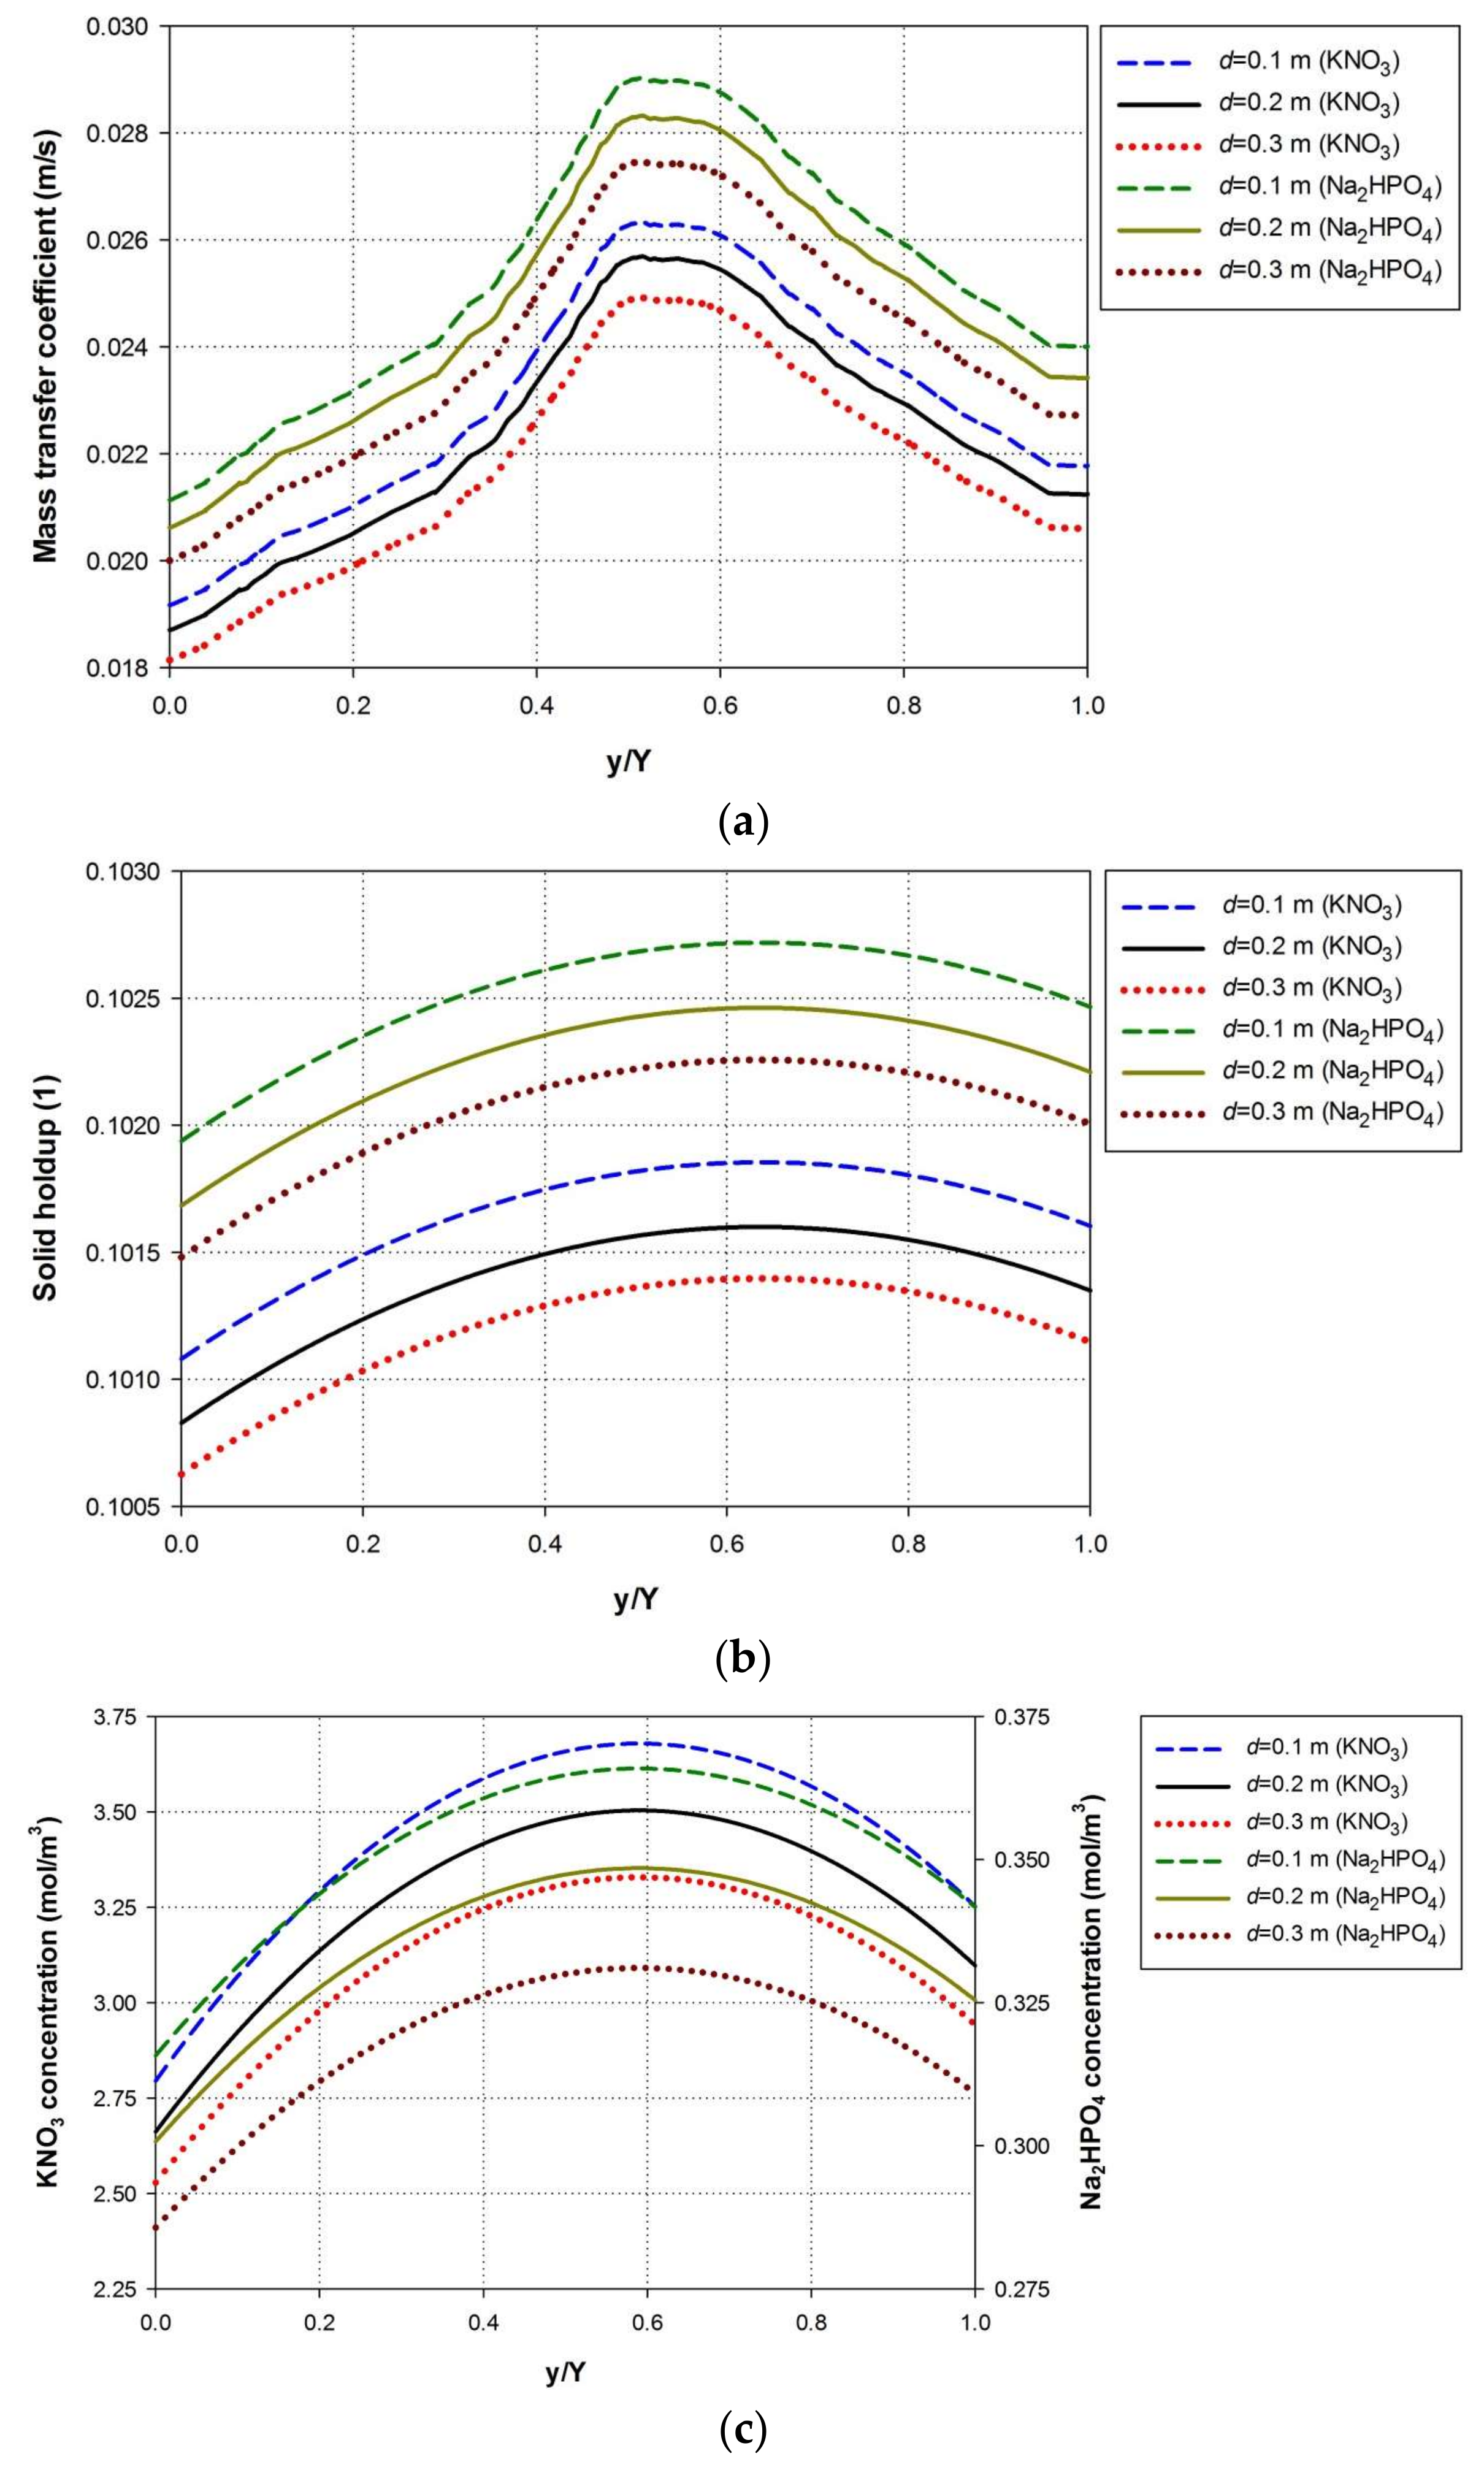
The water depth is another parameter that can affect the nutrient mixing in the raceway pond because of its influence on the water velocity. Thus, the influence of water depth on the mass transfer coefficient, solid holdup, and solid or nutrient concentrations were evaluated. The water depth is inversely related to the mass transfer coefficient (Figure 7a). A rise in water level caused a significant reduction in mass transfer coefficient because of a decrease in fluid circulation in the pond. The mass transfer coefficient (both nutrients) reduced by approximately 2.3% with a rise in water depth from 0.1 m to 0.2 m. A water depth of 0.3 m resulted in a reduction of 3.1% in the mass transfer coefficient. The results suggested that algae cells can effectively interacts with nutrients in shallow raceway ponds (with depths of 0.1 and 0.2 m) due to improved nutrient dissolution rates. The nutrient holdup in the raceway pond was remarkably reduced with the increase in the water volume (Figure 7b). An increase in water depth also caused a decline in nutrient concentrations because of the reduced mixing in the raceway pond [13]. KNO3 concentration was decreased by approximately 7% once the water depth was augmented from 0.2 m to 0.3 m. By contrast, a decline of 5% in Na2HPO4 concentration was found at the same water depths. The highest values of nutrient concentrations to increase nutrient supply to algae cells were unachievable with high water depths. High paddle wheel speeds could be used to improve nutrient concentrations in deep raceway ponds [10,27]. These results implied that shallow raceway ponds are suitable for microalgae cultivation due to their capability to maintain highest nutrient concentrations and high solid–liquid mass transfer rates.

4.4. Effect of Paddle Wheel Rotational Speeds

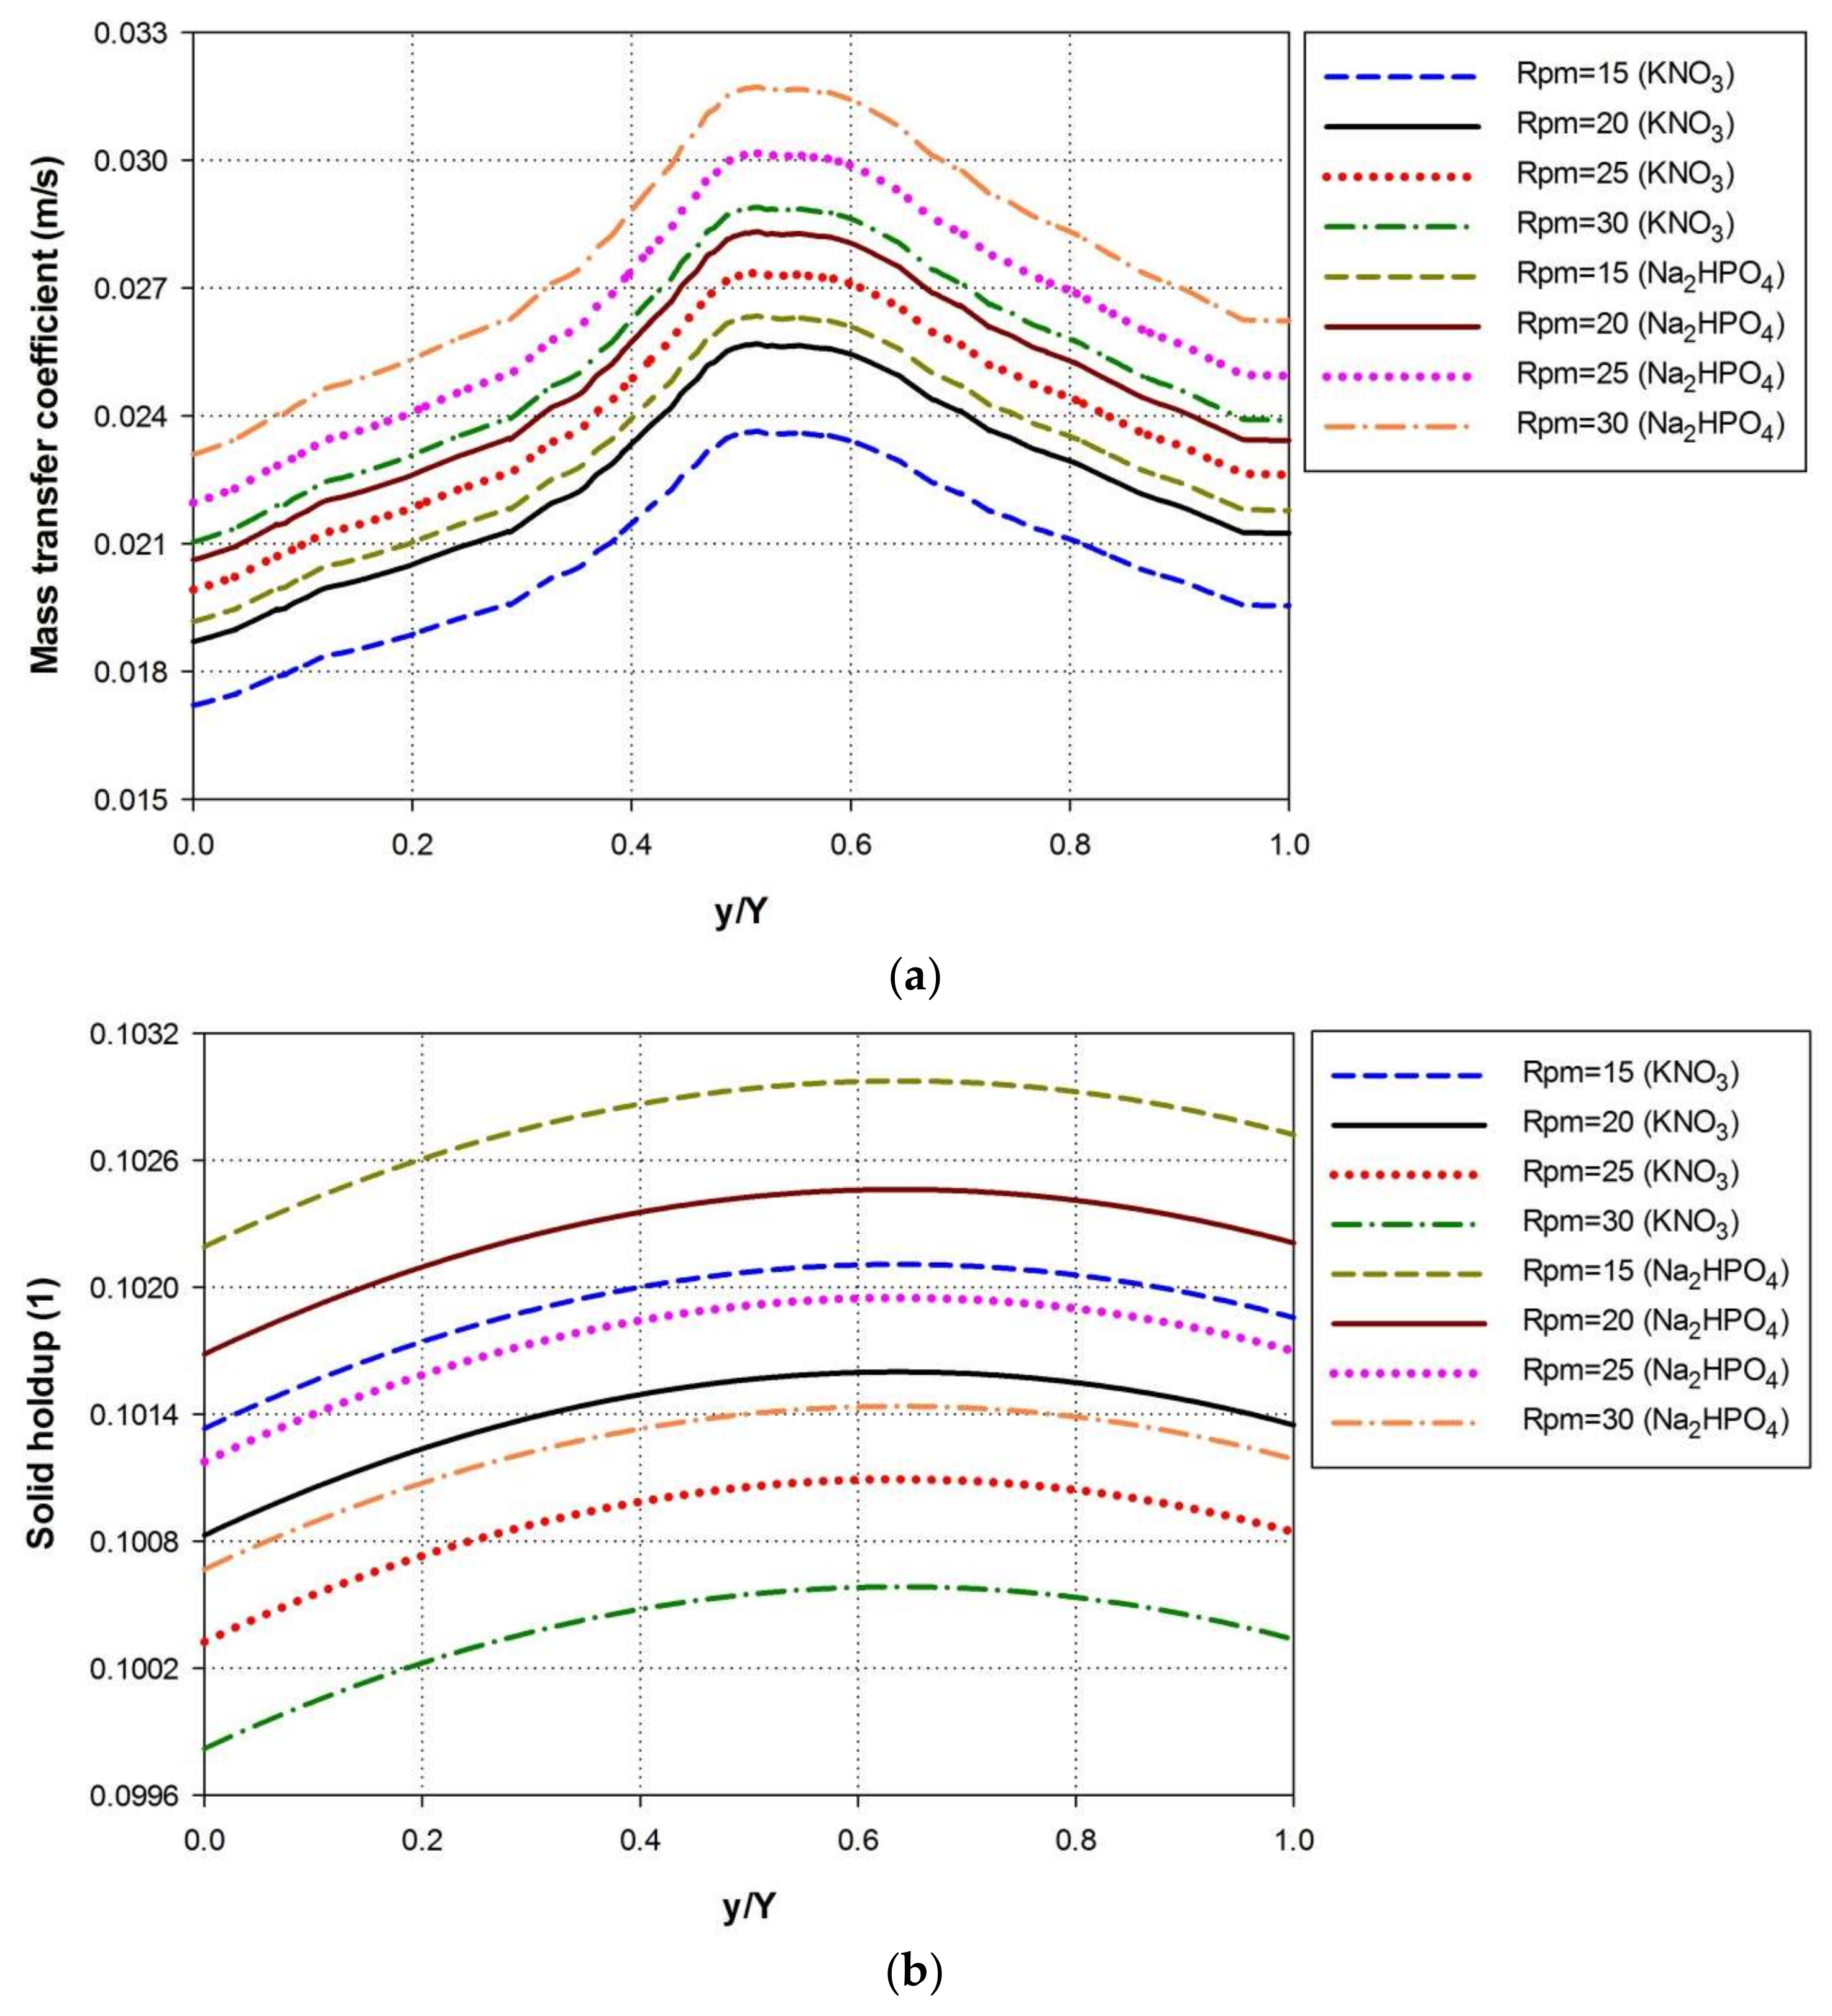
Paddle wheel mixing improved the liquid circulation and thus employed a substantial effect on nutrient dissolution in the raceway pond. The mass transfer coefficient depended linearly on paddle wheel speed. Therefore, increasing the paddle wheel speed enhanced the mass transfer coefficient by improving the liquid circulation (Figure 8a). Turbulent mixing generated by the paddle wheel also helps to diminish the boundary layer near algae cells, thereby increasing the nutrients diffusion to the cell [6,7]. However, algae cell structures are fragile in nature and thus can be damaged by large hydrodynamic stresses generated at high paddle wheel rotations [37,38]. Solid holdup remarkably reduced with the rise in paddle wheel speed (Figure 8b). Increasing the paddle wheel speed ensured the uniform distribution of nutrients in the raceway pond by moving them to the other pond regions, as shown by the low solid holdup in the downstream bend [18,22]. These findings implied that high paddle wheel speeds can increase the interaction of nutrients with algae cells [39]. The paddle wheel enhanced liquid circulation, which, in turn, helped dissolve considerable amounts of nutrients in the water (Figure 8c.). The nutrient concentrations in water improved at high speeds of paddle wheel. A rise of about 4% in both nutrient concentrations was found when the speed of paddle wheel was increased from 20 to 25 and 25 to 30. The optimum concentration value of nutrients could be achieved at high speeds of paddle wheel. However, high paddle wheel speeds could reduce algal productivity by damaging the mechanical boundaries of algae cells [38]. Therefore, paddle wheel rotational speeds must be between 20 and 30 to ensure that high dissolution rates are achieved without damaging algae cells.

4.5. Effect of Nutrient Particle Size

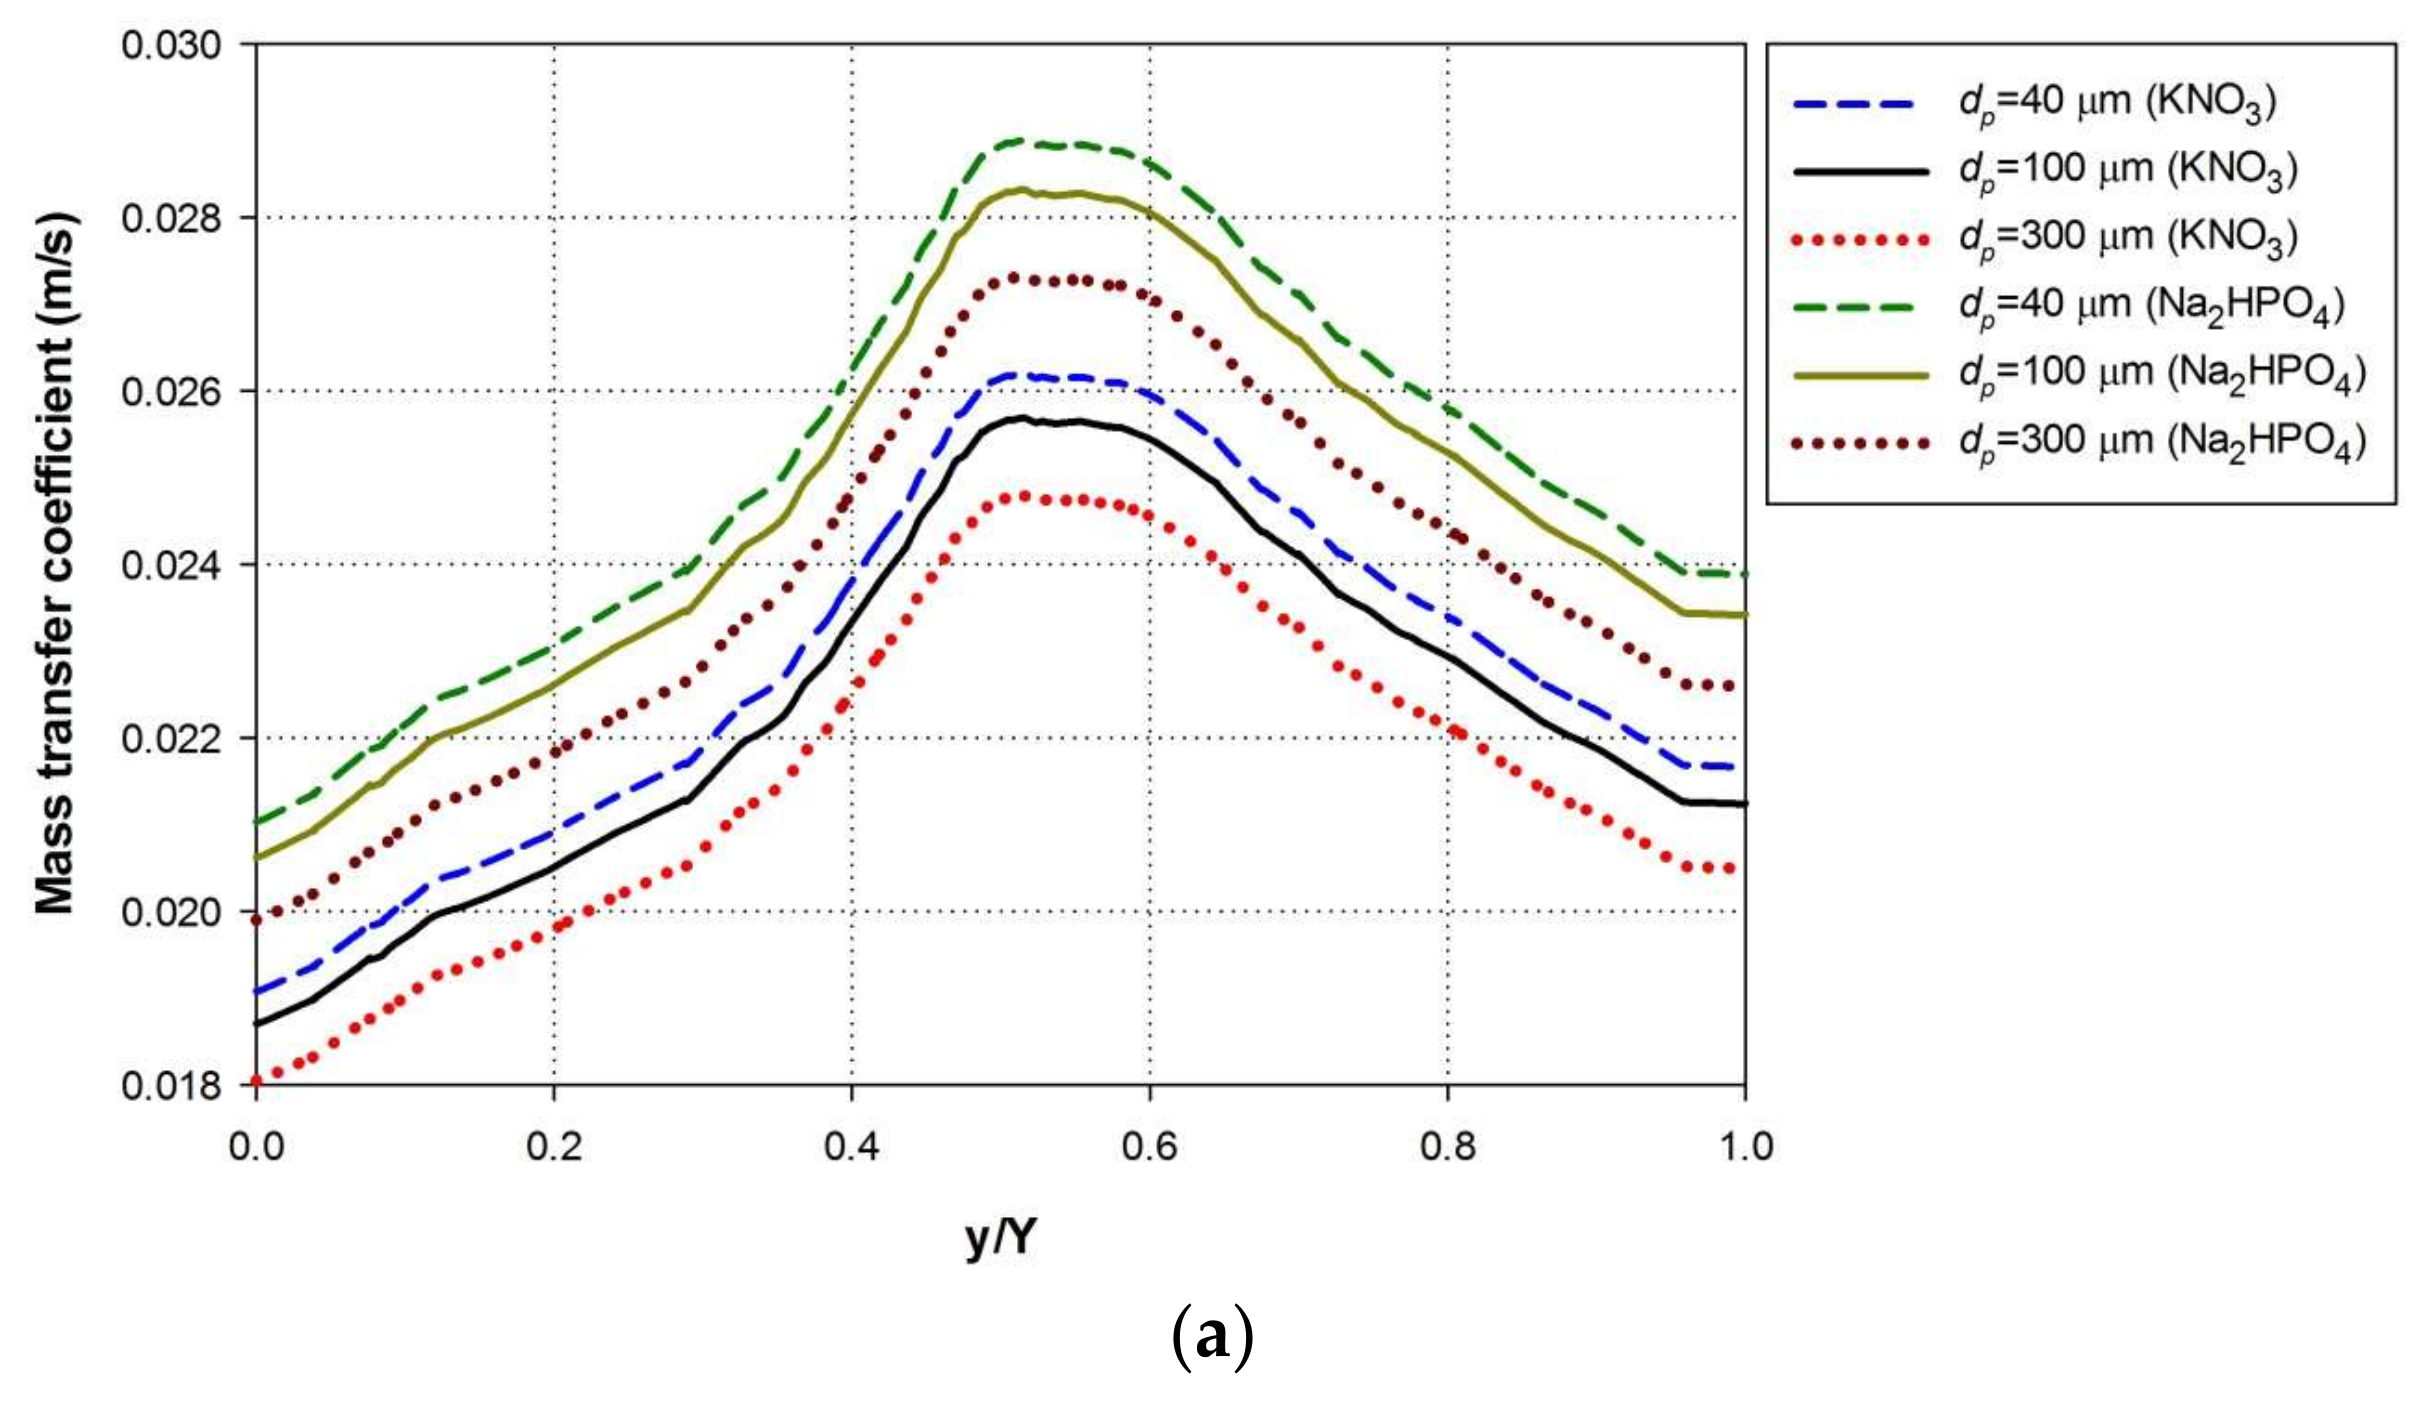
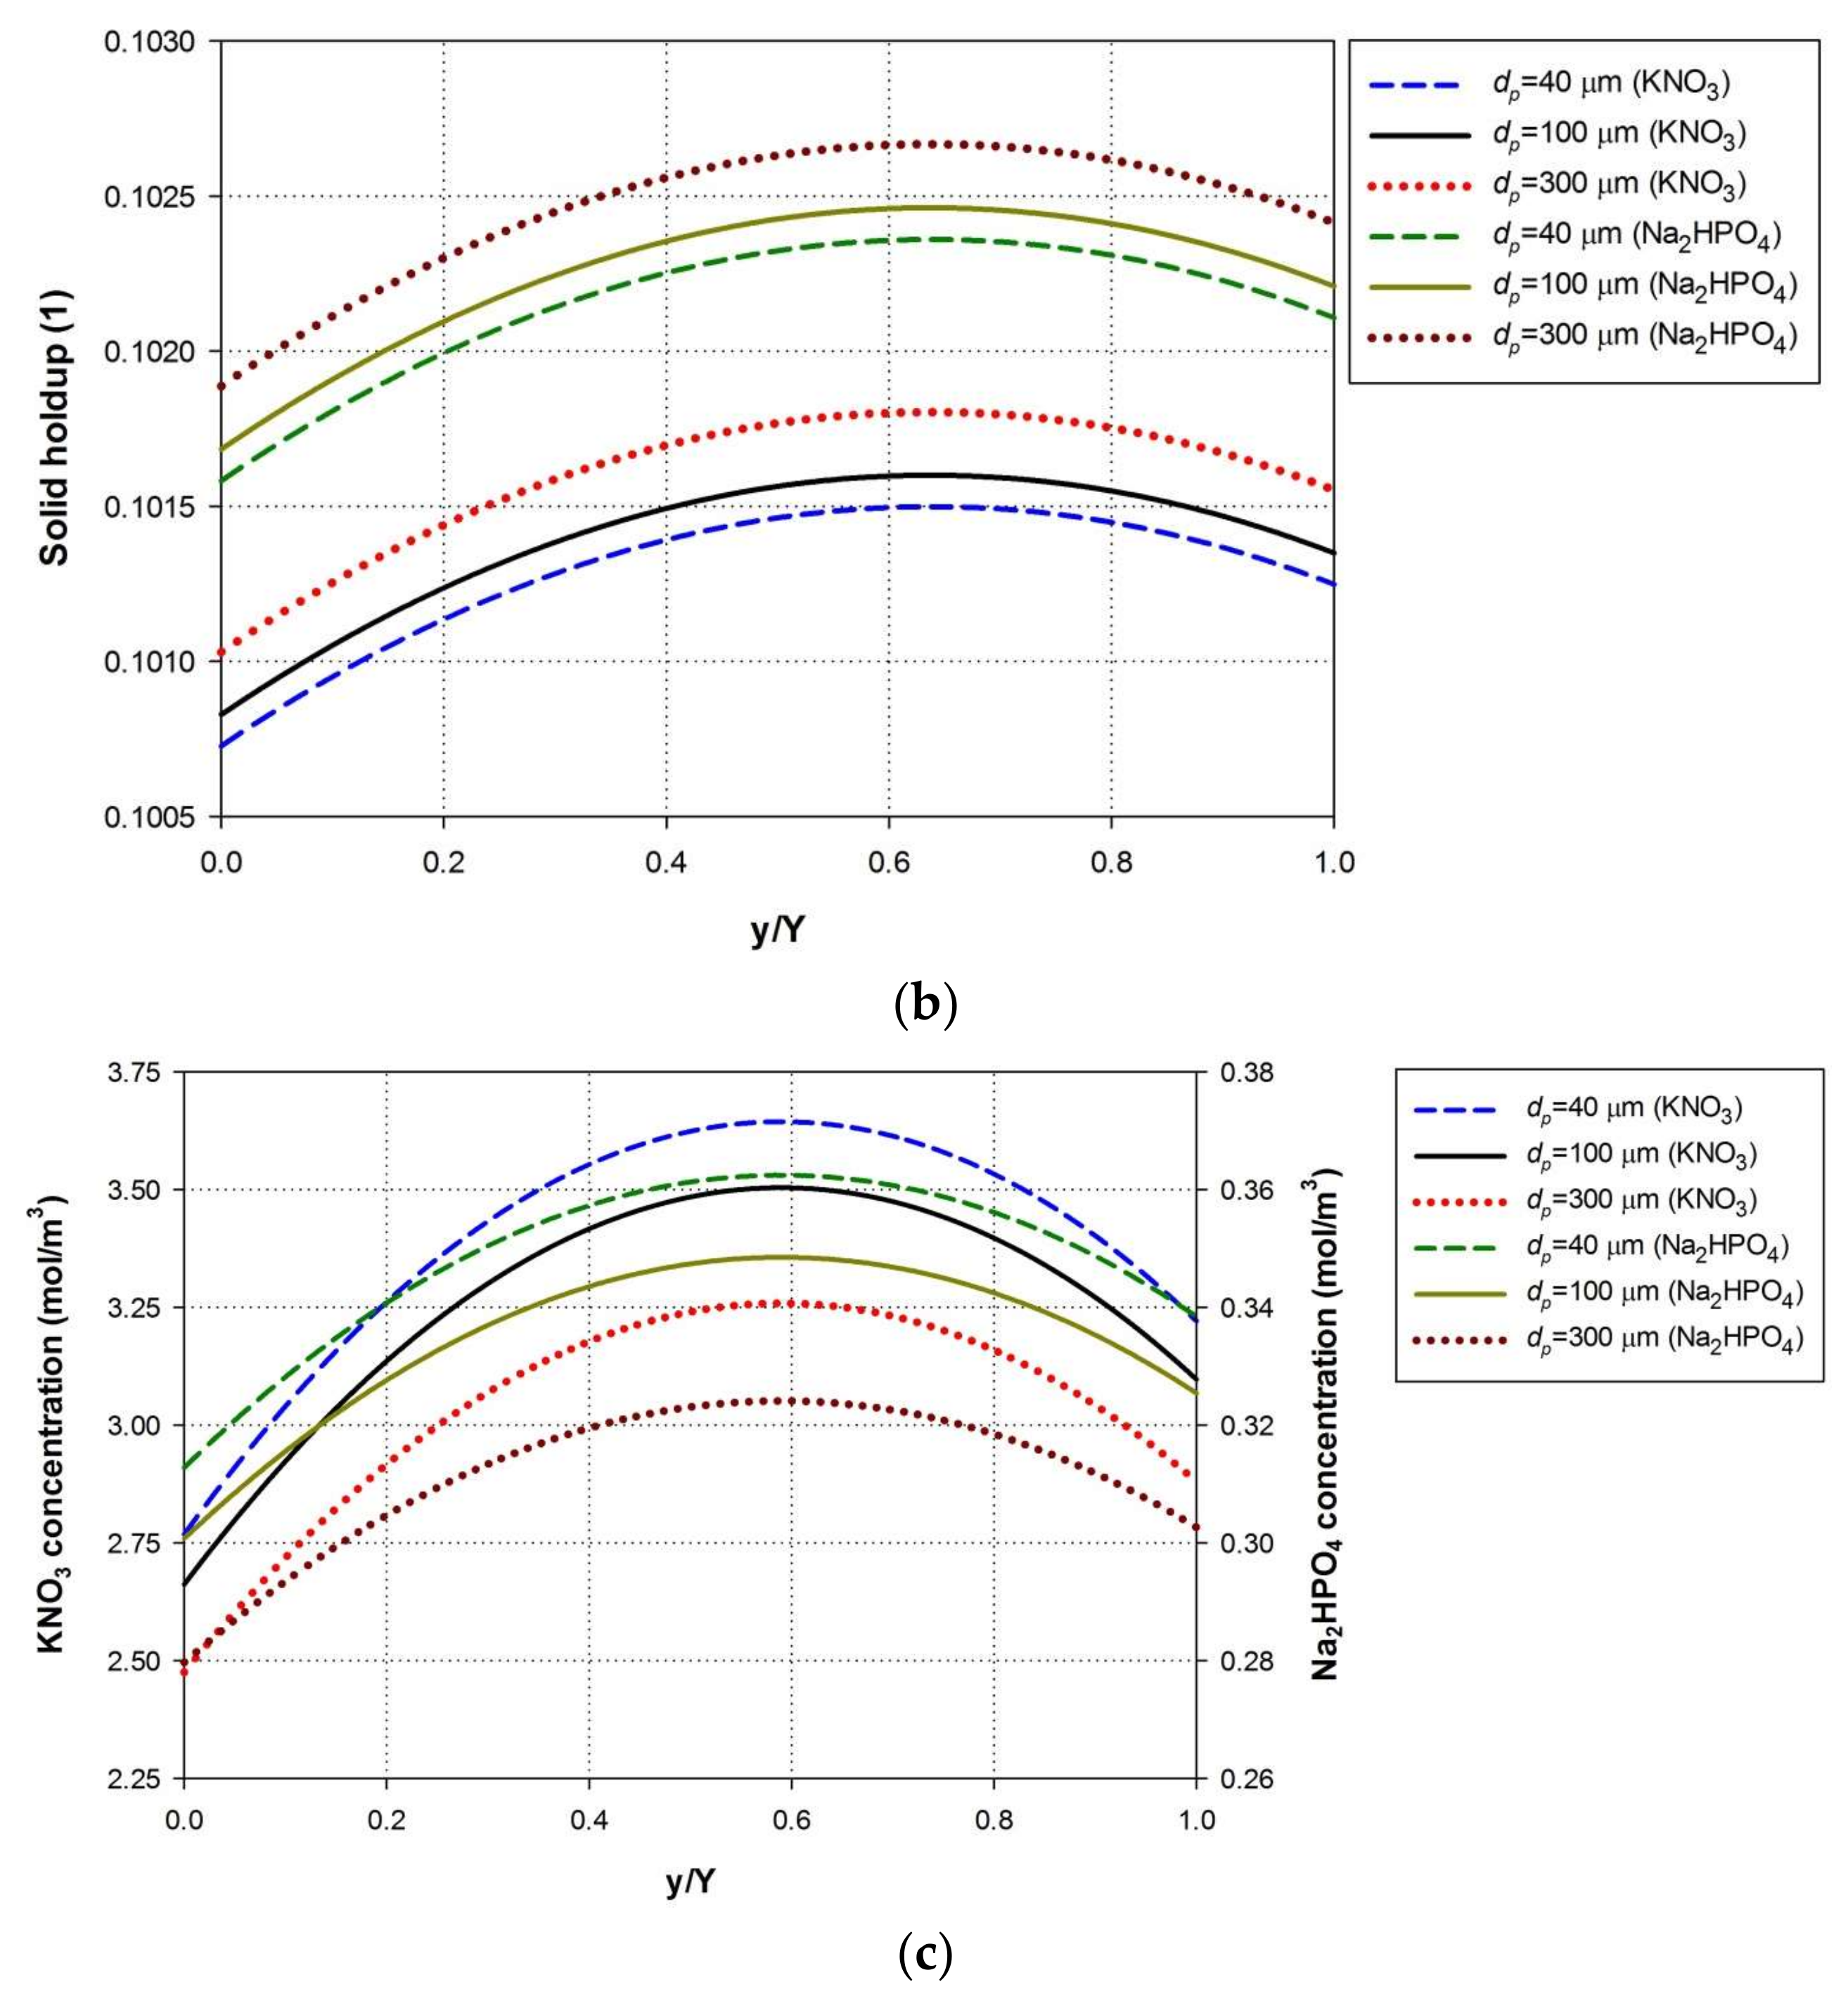
The mass transfer rate from nutrients to liquid significantly depends on their particle size. Therefore, this study considered three different particle sizes to observe their effects on nutrient mass transfer coefficient, solid holdup, and nutrient concentrations. The nutrient mass transfer coefficient in the raceway pond was inversely related to nutrient particle size (Figure 9a). A small nutrient particle dissolved quickly in the liquid thus increased the mass transfer coefficient [16]. Mass transfer coefficient increased by approximately 2.1% with the use of 30 µm nutrient particles. However, a decrease of 3.5% in the mass transfer coefficient was observed with the use of 300 µm particle sizes. The results indicated that nutrients with small sizes improved nutrient mixing in the raceway pond due to their high dissolution rate. The solid particle size exerted a direct effect on the solid holdup (Figure 9b). An increase in particle size showed a substantial rise in the solid holdup in the raceway pond [22]. The rise in solid holdup in the downstream bend was due to the difficulty of moving and distributing large solid particles in the raceway pond by the liquid. Large nutrient particles were inappropriate for algae cultivation since high paddle wheel speeds were required for even distribution in the pond, which would increase power consumption [10,27]. The nutrient concentrations decreased with the use of large nutrient particles because only a small amount of nutrients was dissolved in the liquid phase (Figure 9c). Dissolving large nutrient particles in liquid was difficult, and the optimum concentration value could be achieved with small particles. A decrease of approximately 7.1% in concentration was observed with the use of 300 µm particle sizes for both nutrient types. By contrast, nutrient concentrations were increased by approximately 3.8% with the use of 40 µm particle size. These results suggested that nutrient mixing increased with the use of small nutrient particles due to high dissolution rate.

5. Conclusions

This study utilized an Euler–Euler-based CFD model to simulate nutrient mixing in an algal raceway pond with the effects of pond’s hydrodynamic and geometric properties. The experimental and CFD results were verified by comparing the results of solid–liquid mass transfer coefficient and nutrient concentrations. Various pond A R s, water depths, paddle wheel speeds, and nutrient particle sizes were considered to ascertain their effects on solid–liquid mass transfer coefficient, solid holdup, and nutrient concentrations in a commercial raceway pond.
Pulsating flow in the raceway pond caused numerous fluctuations in nutrient mass transfer coefficient magnitudes. The geometrical aspects of the raceway pond significantly affected the nutrient dissolution rate. Dead zones produced near the central wall of the raceway pond reduced nutrient dissolution by significantly affecting the mass transfer coefficient and nutrient holdup and concentration. Nutrient dissolution is low close to the pond walls and high in the middle section of the raceway pond channel. Increasing A R significantly increased dead zones, consequently reducing nutrient mixing in the raceway pond. Deep raceway ponds must be operated at high paddle wheel speeds to achieve better nutrient dissolution rates. High paddle wheel speeds can be used to enhance nutrient dissolution, keeping in view the damage to algae cells. Small nutrient particles are suitable for microalgae cultivation due to their capability to easily dissolve in liquid and increase dissolution rates. From these results it was found that the hydrodynamic and geometric properties exerted a significant effect on nutrient mixing in the raceway pond. Thus, the A R s in the range of 5–10, water depths of 0.1–0.2 m, and paddle wheel speeds of 20–30 (rpm) are recommended to increase the nutrient mixing in algal raceway ponds. Algae cells rapidly consume nutrients, and the presence of algae cells significantly changes the distribution of nutrients alongside the culture movement direction. Therefore, the modeling of nutrient mixing in the presence of algae cells is suggested in forthcoming studies to improve the biomass productivity of raceway ponds.

Acknowledgments

This study was supported by the National Research Foundation of Korea (NRF) grant funded by the Korea government (MSIP) (No. 2017R1A2B2005515), and the grant from the Priority Research Centers Program through the NRF, as funded by the MEST (No. 2010-0020089).

Author Contributions

Haider Ali designed and performed the simulations and experiments and wrote the paper; Dongda Zhang and Jonathan L. Wagner designed the paper structure and analyzed the results; Cheol Woo Park made corrections in the paper.

Conflicts of Interest

The authors declare no conflict of interest.

Nomenclature

a interfacial area (1/m)
A R aspect ratio (1)
c a initial particle concentration in liquid (mol/m3)
c c dissolved particle concentration in liquid (mol/m3)
c d mass fraction (kg/kg)
C d drag coefficient (1)
dwater or pond depth (m)
d p solid particle size (m)
D diffusion coefficient (m2/s)
D h hydraulic diameter (m)
D m d dispersion coefficient (m2/s)
F r Froude number (1)
g gravity vector (m/s2)
H pond height (m)
k turbulent kinetic energy (m2/s2)
k s l solid–liquid mass transfer coefficient (m/s)
Lpond length (m)
m dc mass transfer rate (kg/(m3∙s))
M molecular weight (kg/mol)
M v density number (1)
n number of particles per volume (1/m3)
p pressure (Pa)
R e Reynolds number (1)
S c Schmidt number (1)
u velocity vector (m/s)
u slip slip velocity vector (m/s)
V l liquid velocity (m/s)
Wwater width (m)
gradient operator
Greek Symbols
ρ density (kg/m3)
ε turbulent energy dissipation rate (m2/s3)
μ dynamic viscosity (Pa·s)
μ T turbulent or eddy viscosity (Pa·s)
ω angular velocity (rad/s)
σ k Prandtl number for kinetic energy (1)
σ T turbulent particle Schmidt number (1)
σ ε Prandtl number for dissipation rate (1)
φ volume fraction or holdup (m3/m3)
Subscripts
c continuous phase
d dispersed phase
l liquid phase
p particle
s solid phase

References

  1. Mostert, E.S.; Grobbelaar, J.U. The influence of nitrogen and phosphorus on algal growth and quality in outdoor mass algal cultures. Biomass 1987, 13, 219–233. [Google Scholar] [CrossRef]
  2. Grobbelaar, J.U.; Soeder, C.J.; Stengel, E. Modeling algal productivity in large outdoor cultures and waste treatment systems. Biomass 1990, 21, 297–314. [Google Scholar] [CrossRef]
  3. Goldman, J.C. Outdoor algal mass cultures—II. Photosynthetic yield limitations. Water Res. 1979, 13, 119–136. [Google Scholar] [CrossRef]
  4. Ruiz-Marin, A.; Mendoza-Espinosa, L.G.; Stephenson, T. Growth and nutrient removal in free and immobilized green algae in batch and semi-continuous cultures treating real wastewater. Bioresour. Technol. 2010, 101, 58–64. [Google Scholar] [CrossRef] [PubMed]
  5. Marchetti, A.; Parker, M.S.; Moccia, L.P.; Lin, E.O.; Arrieta, A.L.; Ribalet, F.; Murphy, M.E.P.; Maldonado, M.T.; Armbrust, E.V. Ferritin is used for iron storage in bloom-forming marine pennate diatoms. Nature 2009, 457, 467–470. [Google Scholar] [CrossRef] [PubMed]
  6. Borowitzka, M.A. Commercial production of microalgae: ponds, tanks, tubes and fermenters. J. Biotechnol. 1999, 70, 313–321. [Google Scholar] [CrossRef]
  7. Grobbelaar, J.U.; Kroon, B.M.A.; Burger-Wiersma, T.; Mur, L.R. Influence of medium frequency light/dark cycles of equal duration on the photosynthesis and respiration of Chlorella pyrenoidosa. Hydrobiologia 1992, 238, 53–62. [Google Scholar] [CrossRef]
  8. Terry, K.L.; Raymond, L.P. System design for the autotrophic production of microalgae. Enzyme Microb. Technol. 1985, 7, 474–487. [Google Scholar] [CrossRef]
  9. Yang, Z.; del Ninno, M.; Wen, Z.; Hu, H. An experimental investigation on the multiphase flows and turbulent mixing in a flat-panel photobioreactor for algae cultivation. J. Appl. Phycol. 2014, 26, 2097–2107. [Google Scholar] [CrossRef]
  10. Weissman, J.C.; Goebel, R.P.; Benemann, J.R. Photobioreactor design: Mixing, carbon utilization, and oxygen accumulation. Biotechnol. Bioeng. 1988, 31, 336–344. [Google Scholar] [CrossRef] [PubMed]
  11. Conley, D.J.; Paerl, H.W.; Howarth, R.W.; Boesch, D.F.; Seitzinger, S.P.; Havens, K.E.; Lancelot, C.; Likens, G.E. Ecology: Controlling Eutrophication: Nitrogen and Phosphorus. Science 2009, 323, 1014–1015. [Google Scholar] [CrossRef] [PubMed]
  12. Talling, J.F.; Fogg, G.E. Algal Cultures and Phytoplankton Ecology. J. Appl. Ecol. 1966, 3, 215. [Google Scholar] [CrossRef]
  13. Eustance, E.; Wray, J.T.; Badvipour, S.; Sommerfeld, M.R. The effects of cultivation depth, areal density, and nutrient level on lipid accumulation of Scenedesmus acutus in outdoor raceway ponds. J. Appl. Phycol. 2016, 28, 1459–1469. [Google Scholar] [CrossRef]
  14. Marra, J. Algae Biomass: Production and Use. Gedaliah Shelef, Carl J. Soeder. Q. Rev. Biol. 1981, 56, 496–497. [Google Scholar] [CrossRef]
  15. Chisti, Y. Biodiesel from microalgae. Biotechnol. Adv. 2007, 25, 294–306. [Google Scholar] [CrossRef] [PubMed]
  16. Kalaga, D.V.; Dhar, A.; Dalvi, S.V.; Joshi, J.B. Particle-liquid mass transfer in solid-liquid fluidized beds. Chem. Eng. J. 2014, 245, 323–341. [Google Scholar] [CrossRef]
  17. Tang, C.; Liu, M.; Li, Y. Experimental investigation of hydrodynamics of liquid–solid mini-fluidized beds. Particuology 2016, 27, 102–109. [Google Scholar] [CrossRef]
  18. Palkar, R.R.; Shilapuram, V. Development of a model for the prediction of hydrodynamics of a liquid–solid circulating fluidized beds: A full factorial design approach. Powder Technol. 2015, 280, 103–112. [Google Scholar] [CrossRef]
  19. Grisafi, F.; Brucato, A.; Rizzuti, L. Solid-liquid mass transfer coefficients in gas-solid-liquid agitated vessels. Can. J. Chem. Eng. 1998, 76, 446–455. [Google Scholar] [CrossRef]
  20. Chiesa, M.; Mathiesen, V.; Melheim, J.A.; Halvorsen, B. Numerical simulation of particulate flow by the Eulerian–Lagrangian and the Eulerian–Eulerian approach with application to a fluidized bed. Comput. Chem. Eng. 2005, 29, 291–304. [Google Scholar] [CrossRef]
  21. Enwald, H.; Peirano, E.; Almstedt, A.-E. Eulerian two-phase flow theory applied to fluidization. Int. J. Multiph. Flow 1996, 22, 21–66. [Google Scholar] [CrossRef]
  22. Cornelissen, J.T.; Taghipour, F.; Escudié, R.; Ellis, N.; Grace, J.R. CFD modelling of a liquid–solid fluidized bed. Chem. Eng. Sci. 2007, 62, 6334–6348. [Google Scholar] [CrossRef]
  23. Yang, N.; Wang, W.; Ge, W.; Li, J. CFD simulation of concurrent-up gas–solid flow in circulating fluidized beds with structure-dependent drag coefficient. Chem. Eng. J. 2003, 96, 71–80. [Google Scholar] [CrossRef]
  24. Ali, H.; Park, C.W. Numerical multiphase modeling of CO2 absorption and desorption in microalgal raceway ponds to improve their carbonation efficiency. Energy 2017, 127, 358–371. [Google Scholar] [CrossRef]
  25. Ali, H.; Cheema, T.A.; Park, C.W. Numerical prediction of heat transfer characteristics based on monthly temperature gradient in algal open raceway ponds. Int. J. Heat Mass Transf. 2017, 106, 7–17. [Google Scholar] [CrossRef]
  26. Ali, H.; Cheema, T.; Park, C. Determination of the Structural Characteristics of Microalgal Cells Walls under the Influence of Turbulent Mixing Energy in Open Raceway Ponds. Energies 2018, 11, 388. [Google Scholar] [CrossRef]
  27. Ali, H.; Cheema, T.A.; Park, C.W. Effect of Paddle-Wheel Pulsating Velocity on the Hydrodynamic Performance of High-Rate Algal Ponds. J. Energy Eng. 2015, 141, 4014039. [Google Scholar] [CrossRef]
  28. Ali, H.; Cheema, T.A.; Yoon, H.-S.; Do, Y.; Park, C.W. Numerical prediction of algae cell mixing feature in raceway ponds using particle tracing methods. Biotechnol. Bioeng. 2015, 112, 297–307. [Google Scholar] [CrossRef] [PubMed]
  29. Cooper, A.R. Effect of Aspect Ratio and Viscosity Gradients on Flow Through Open Channels. J. Am. Ceram. Soc. 1960, 43, 97–103. [Google Scholar] [CrossRef]
  30. Auel, C.; Albayrak, I.; Boes, R.M. Turbulence Characteristics in Supercritical Open Channel Flows: Effects of Froude Number and Aspect Ratio. J. Hydraul. Eng. 2014, 140, 4014004. [Google Scholar] [CrossRef]
  31. Pang, M.J.; Wei, J.J. Analysis of drag and lift coefficient expressions of bubbly flow system for low to medium Reynolds number. Nucl. Eng. Des. 2011, 241, 2204–2213. [Google Scholar] [CrossRef]
  32. Wilcox, D.C. Turbulence Modeling for CFD; Turbulence Modeling for CFD; DCW Industries: Flintridge, CA, USA, 2006; ISBN 9781928729082. [Google Scholar]
  33. Silva, R.; Cotas, C.; Garcia, F.A.P.; Faia, P.M.; Rasteiro, M.G. Particle Distribution Studies in Highly Concentrated Solid-liquid Flows in Pipe Using the Mixture Model. Procedia Eng. 2015, 102, 1016–1025. [Google Scholar] [CrossRef]
  34. Ali, H.; Cheema, T.A.; Park, C.W. Numerical modeling of two-phase bubbly flow mixing with mass transport in an effective microorganism odor removing system. J. Chem. Technol. Biotechnol. 2016, 91, 1012–1022. [Google Scholar] [CrossRef]
  35. Randolph, A.D.; Larson, M.A.; Randolph, A.D.; Larson, M.A. Chapter 3—The population balance. In Theory of Particulate Processes; Academic Press Inc.: San Diego, CA, USA, 1988; pp. 50–79. ISBN 9780125796521. [Google Scholar]
  36. Harned, H.S.; Hudson, R.M. The Differential Diffusion Coefficient of Potassium Nitrate in Dilute Aqueous Solutions at 25°. J. Am. Chem. Soc. 1951, 73, 652–654. [Google Scholar] [CrossRef]
  37. Camacho, F.G.; Gómez, A.C.; Sobczuk, T.M.; Grima, E.M. Effects of mechanical and hydrodynamic stress in agitated, sparged cultures of Porphyridium cruentum. Process Biochem. 2000, 35, 1045–1050. [Google Scholar] [CrossRef]
  38. Thomas, W.H.; Gibson, C.H. Effects of small-scale turbulence on microalgae. J. Appl. Phycol. 1990, 2, 71–77. [Google Scholar] [CrossRef]
  39. Chen, C.-Y.; Yeh, K.-L.; Aisyah, R.; Lee, D.-J.; Chang, J.-S. Cultivation, photobioreactor design and harvesting of microalgae for biodiesel production: A critical review. Bioresour. Technol. 2011, 102, 71–81. [Google Scholar] [CrossRef] [PubMed]
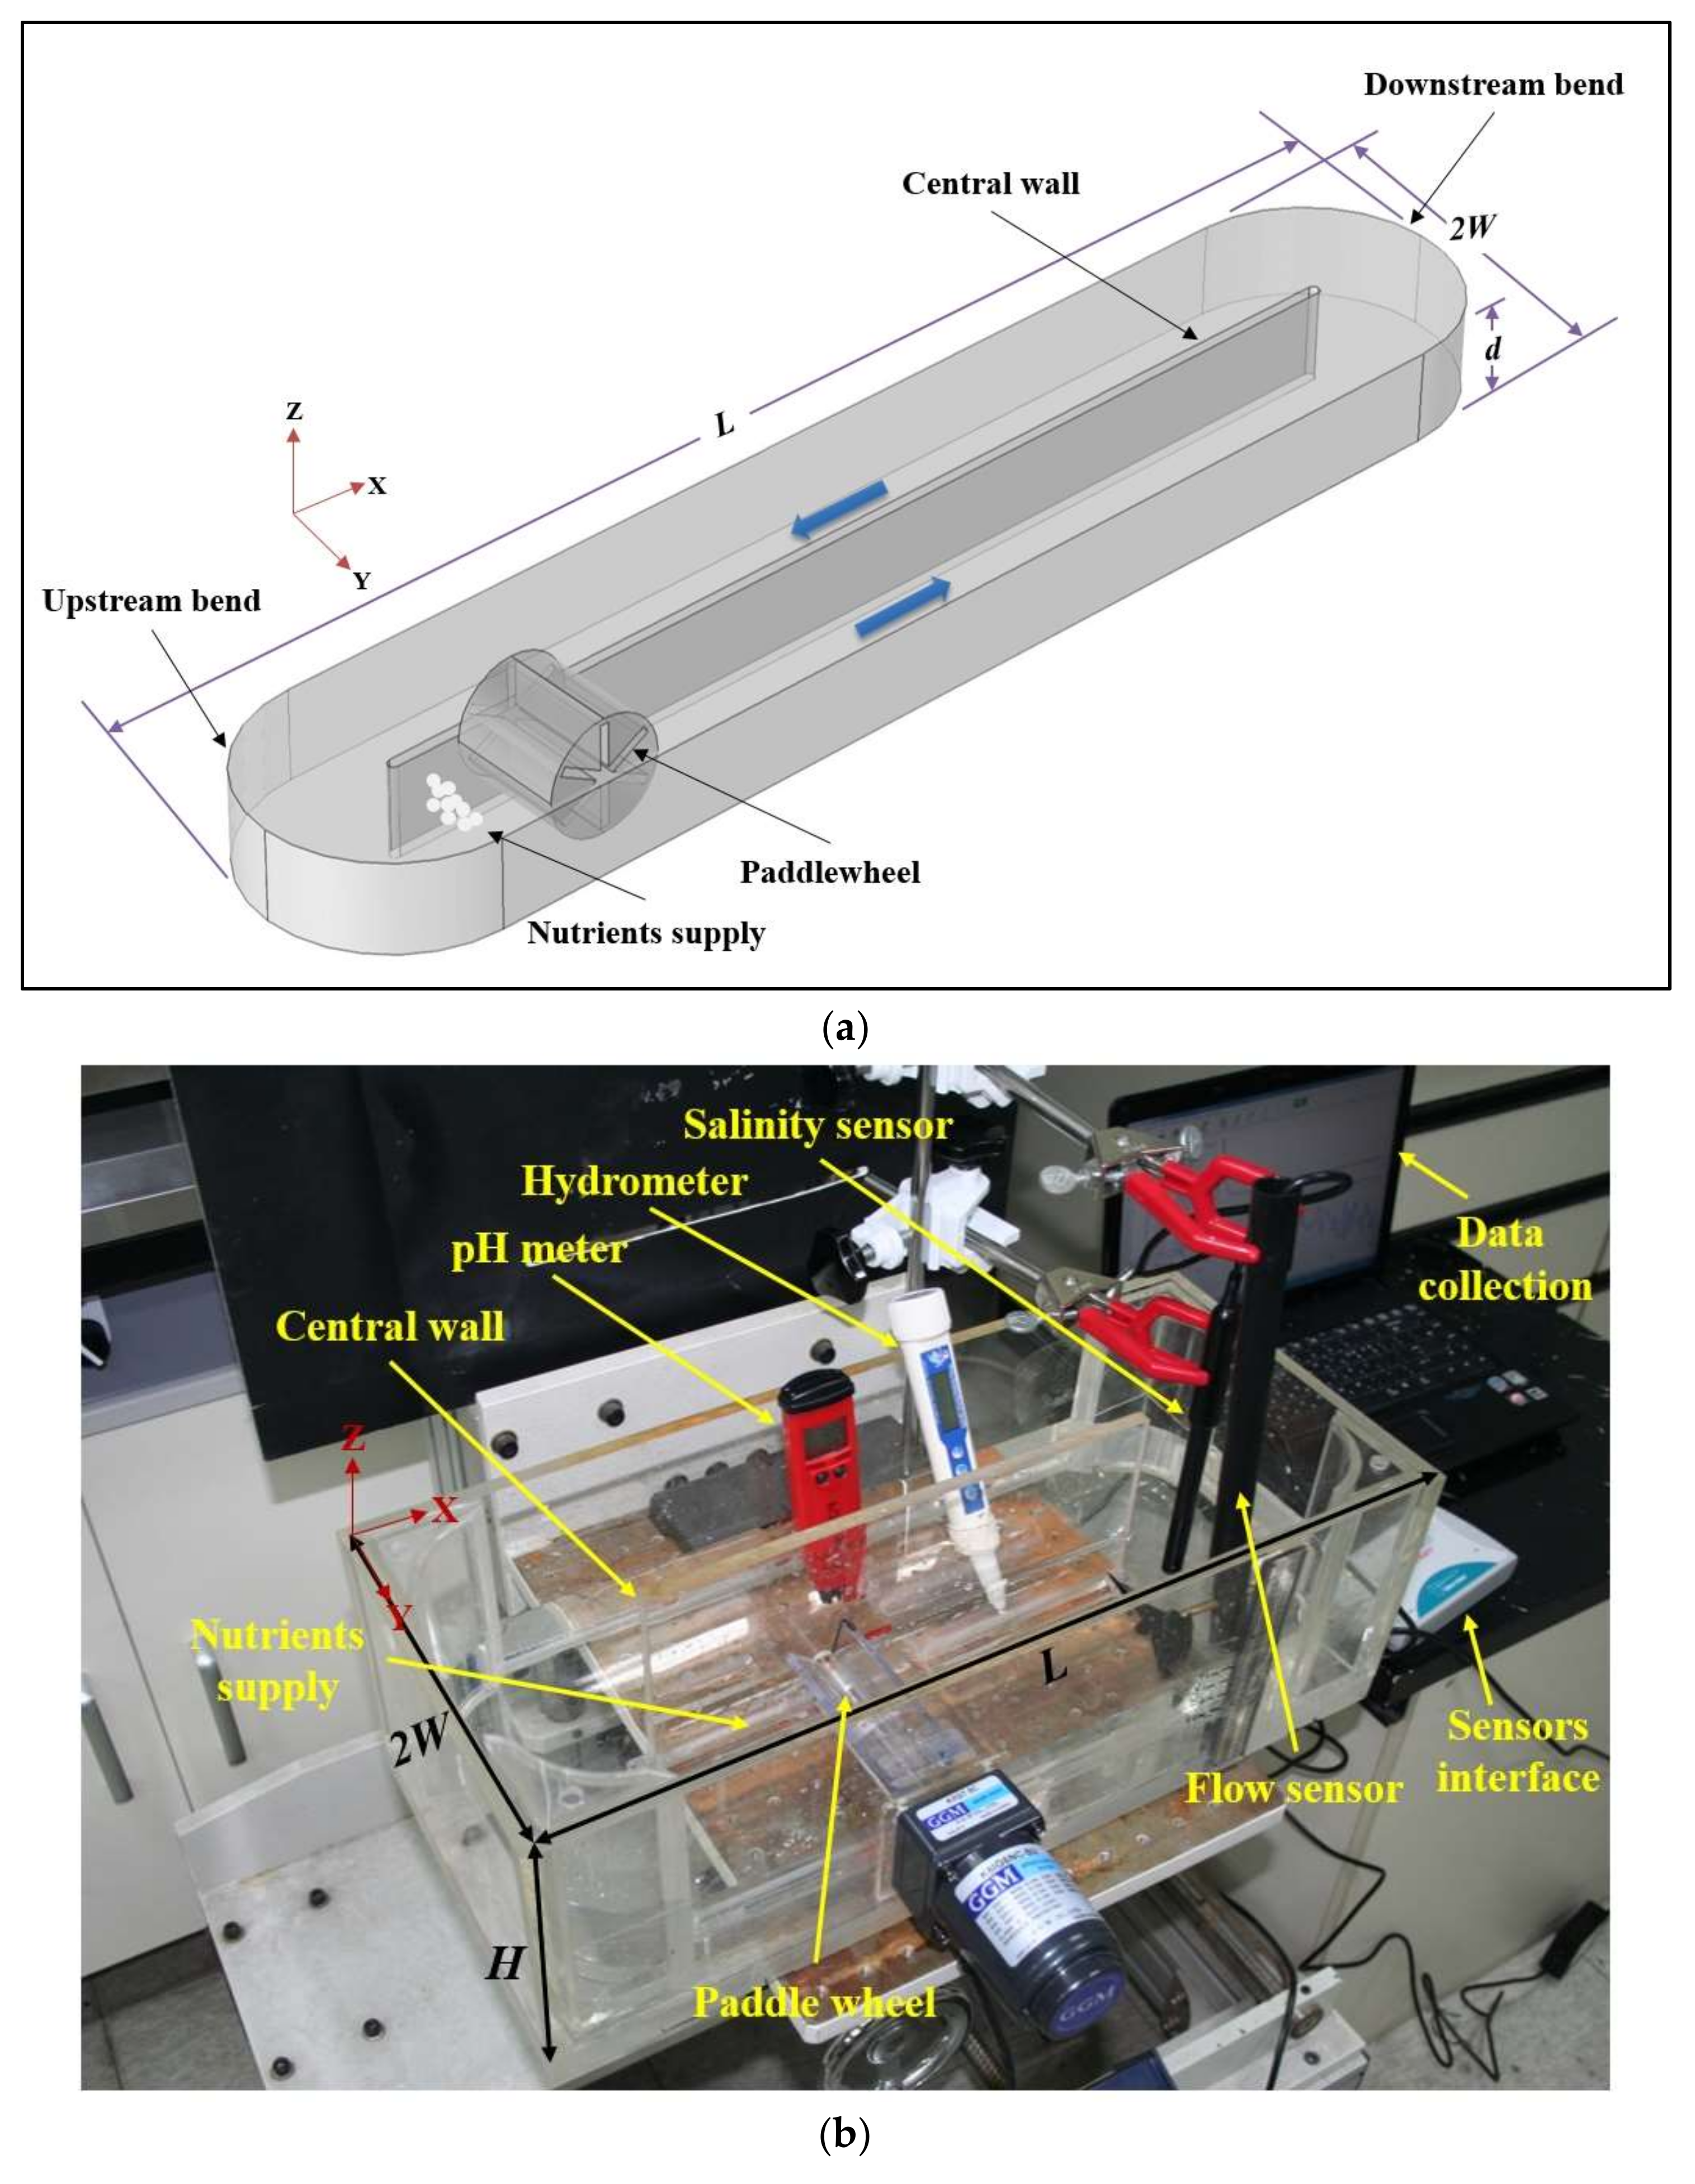
Figure 1. Computational fluid dynamics (CFD) model (a) and Laboratory set-up (b) of the raceway pond.
Energies 11 00899 g001
Figure 2. (a) Grid independence and (b) time-step independence tests for a raceway pond with A R = 10, water depth = 0.2 m, and paddle wheel paddle wheel speed = 20.
Energies 11 00899 g002
Figure 3. Comparison of the experimental and numerical results of solid–liquid mass transfer coefficient with the effects of different (a) paddle wheel speeds and (b) water depths.
Energies 11 00899 g003aEnergies 11 00899 g003b
Figure 4. Comparison of the experimental and numerical results of nutrient concentrations with the effects of different (a) paddle wheel speeds and (b) water depths.
Energies 11 00899 g004
Figure 5. Solid–liquid mass transfer coefficient (surface plots) and water velocity (streamline plots) for different A R s: (a) 5; (b) 10; and (c) 15 at water depth = 0.2 m and paddle wheel speed = 20.
Energies 11 00899 g005aEnergies 11 00899 g005b
Figure 6. Effects of A R s on (a) mass transfer coefficient; (b) solid holdup; and (c) nutrient concentrations at water depth = 0.2 m and paddle wheel speed = 20.
Energies 11 00899 g006
Figure 7. Effects of water depths on (a) mass transfer coefficient; (b) solid holdup; and (c) nutrient concentrations in a raceway pond with A R = 10 and paddle wheel speed = 20.
Energies 11 00899 g007
Figure 8. Effects of paddle wheel speeds on (a) mass transfer coefficient; (b) solid holdup; and (c) nutrient concentrations in a raceway pond with A R = 10 and water depth = 0.2 m.
Energies 11 00899 g008aEnergies 11 00899 g008b
Figure 9. Effects of nutrient diameters (m) on (a) mass transfer coefficient; (b) solid holdup; and (c) nutrient concentrations in a raceway pond with A R = 10, water depth = 0.2 m, and paddle wheel speed = 20.
Energies 11 00899 g009aEnergies 11 00899 g009b
Table 1. Properties of different chemical compounds used in this study.
NutrientDensity (kg/m3)Particle Size (µm)Molar Mass (g/mol)
KNO32110100101.1
Na2HPO41700100141.96