Evaluation of a Compact Coaxial Underground Coal Gasification System Inside an Artificial Coal Seam

 , and
, and
Abstract
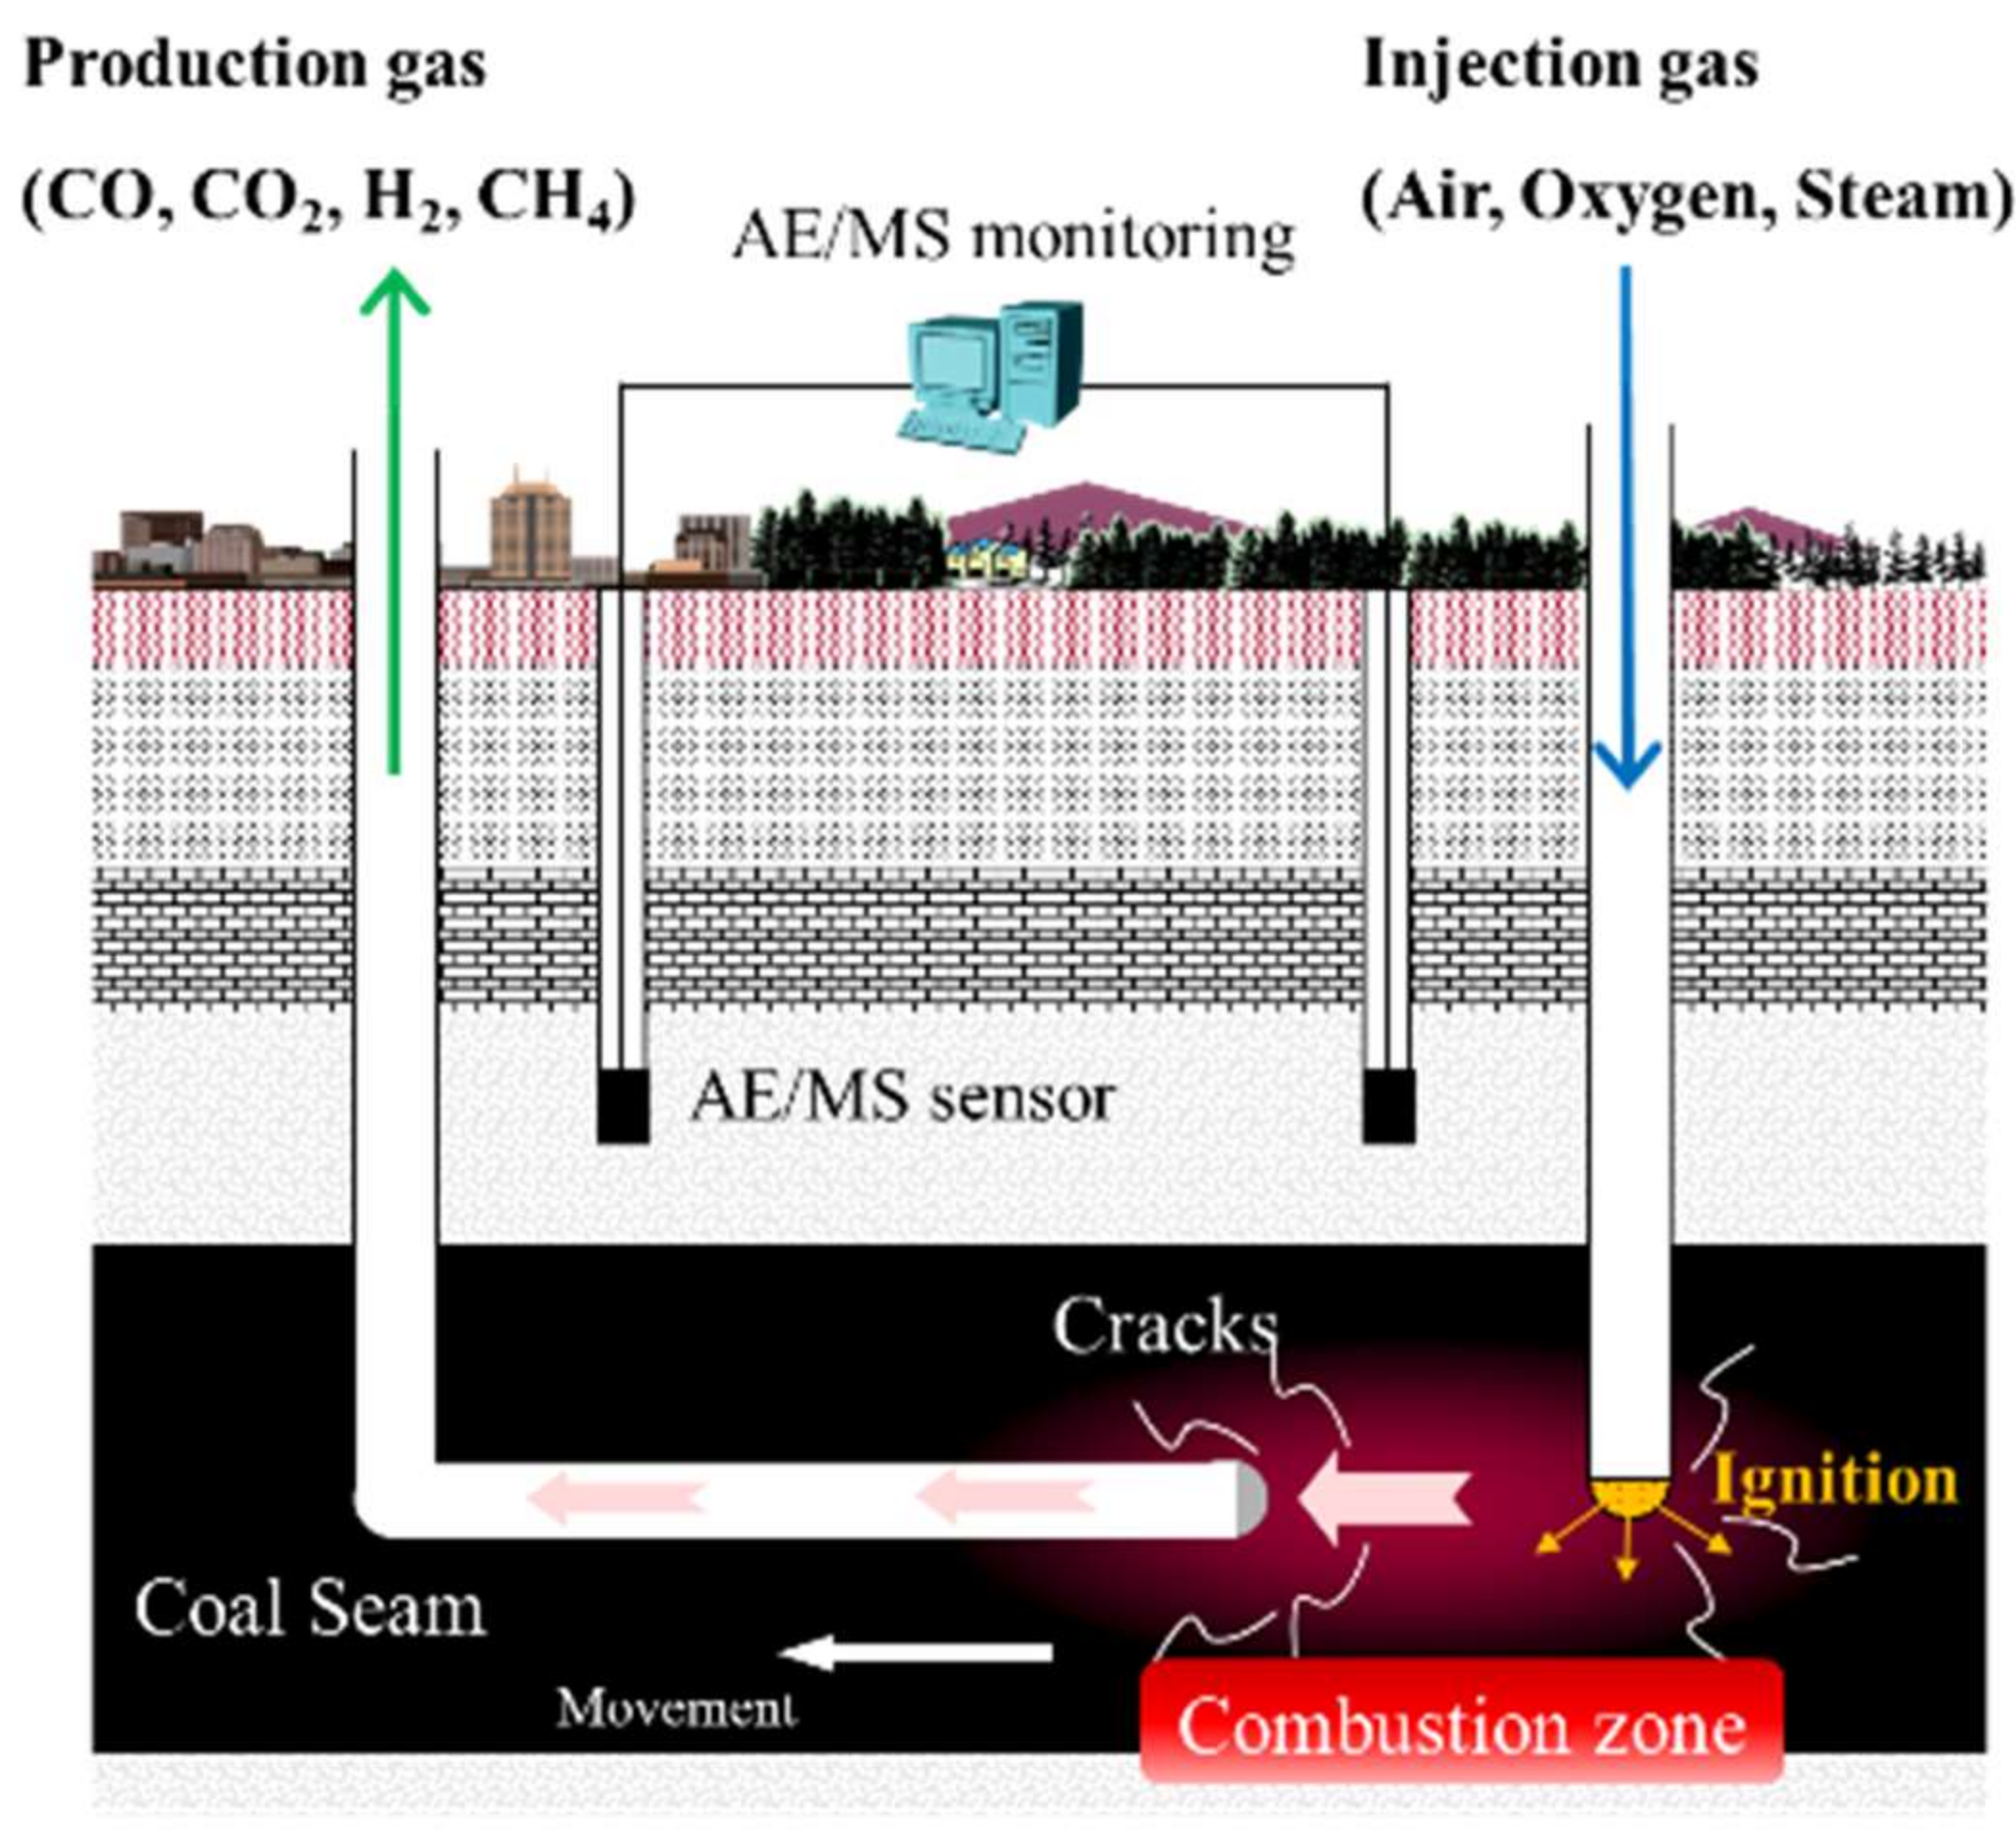
:1. Introduction
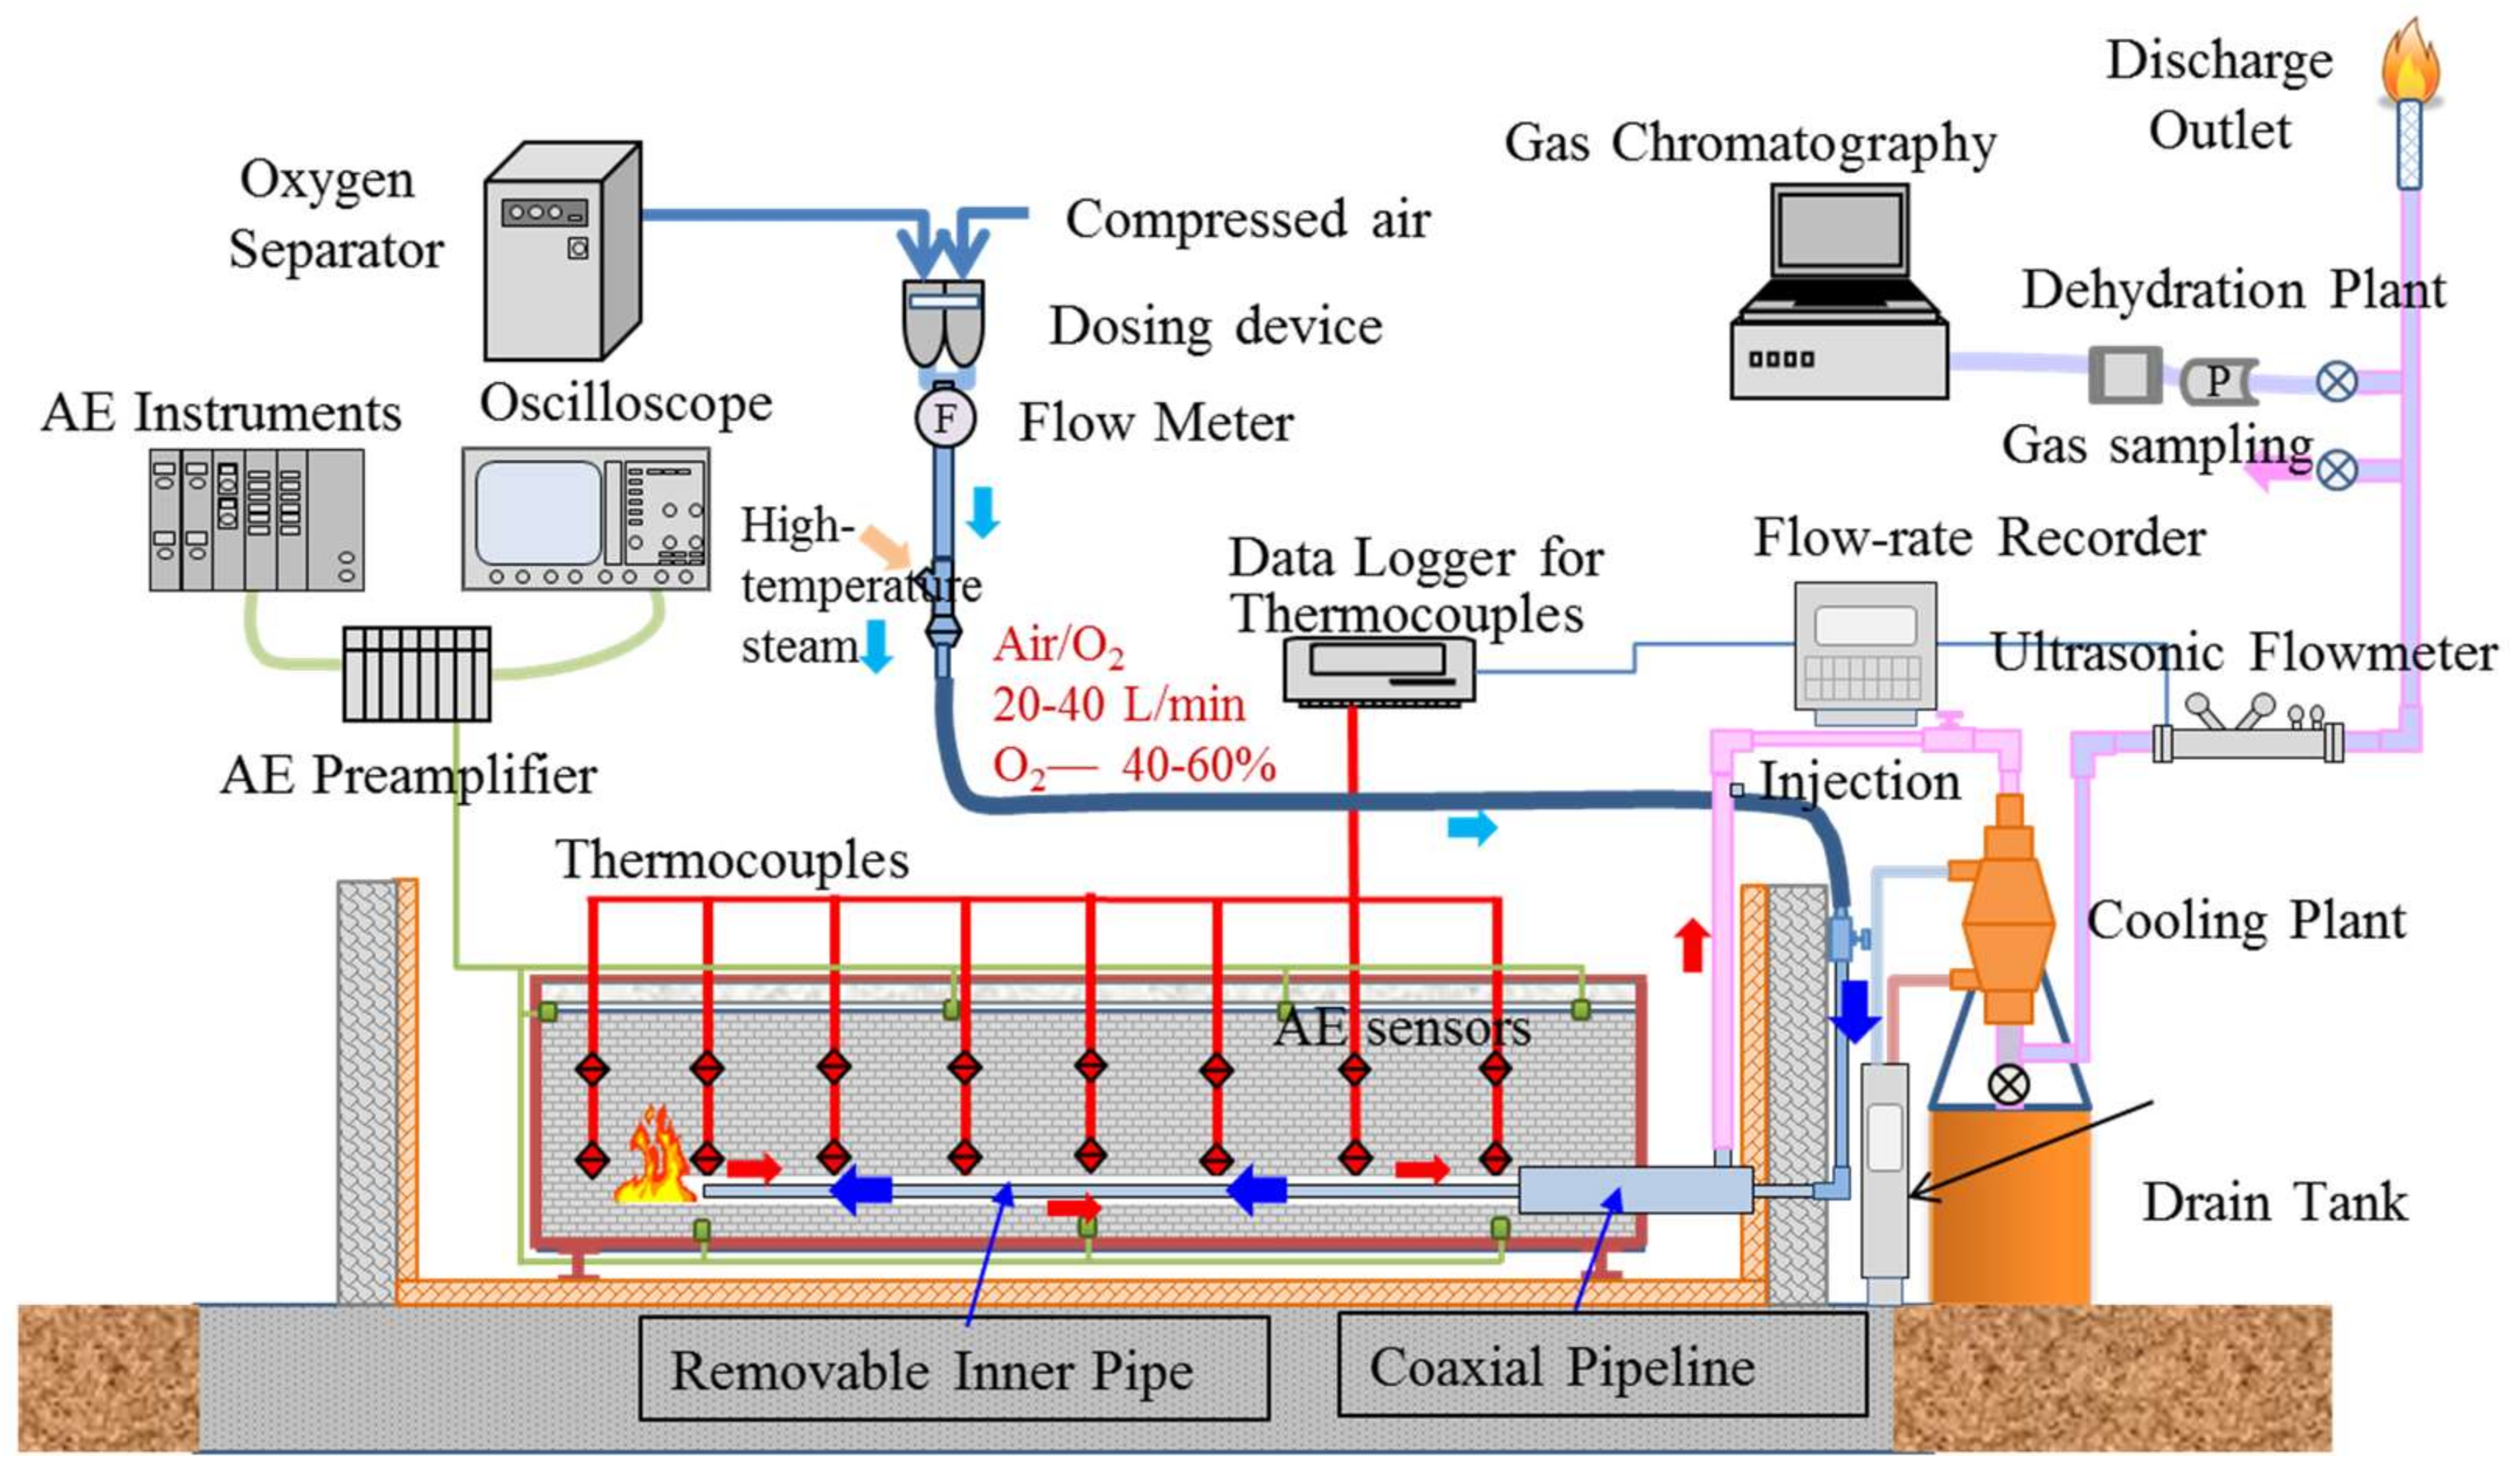
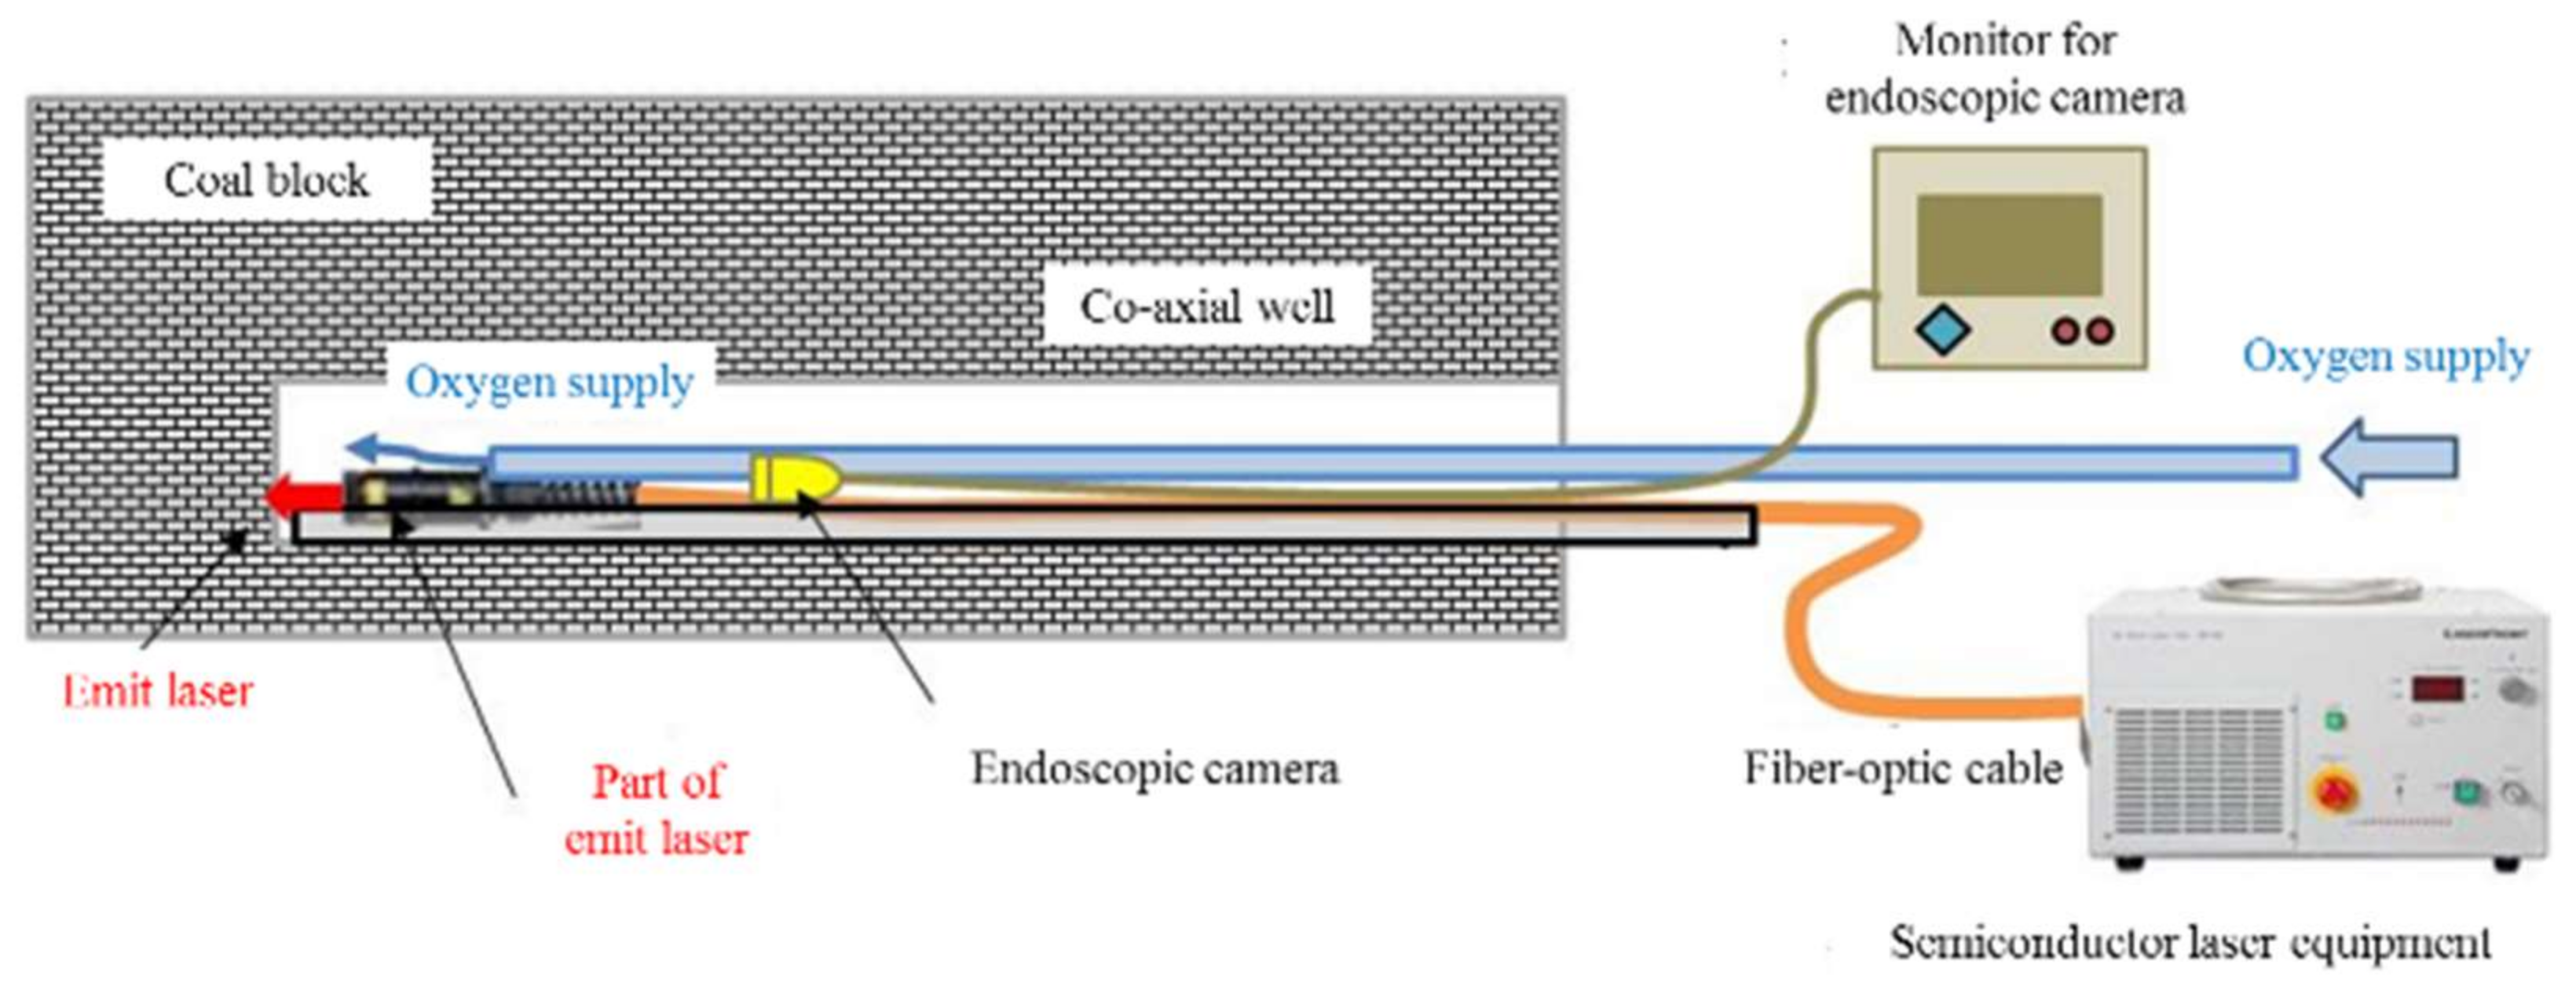
2. Material and Methods
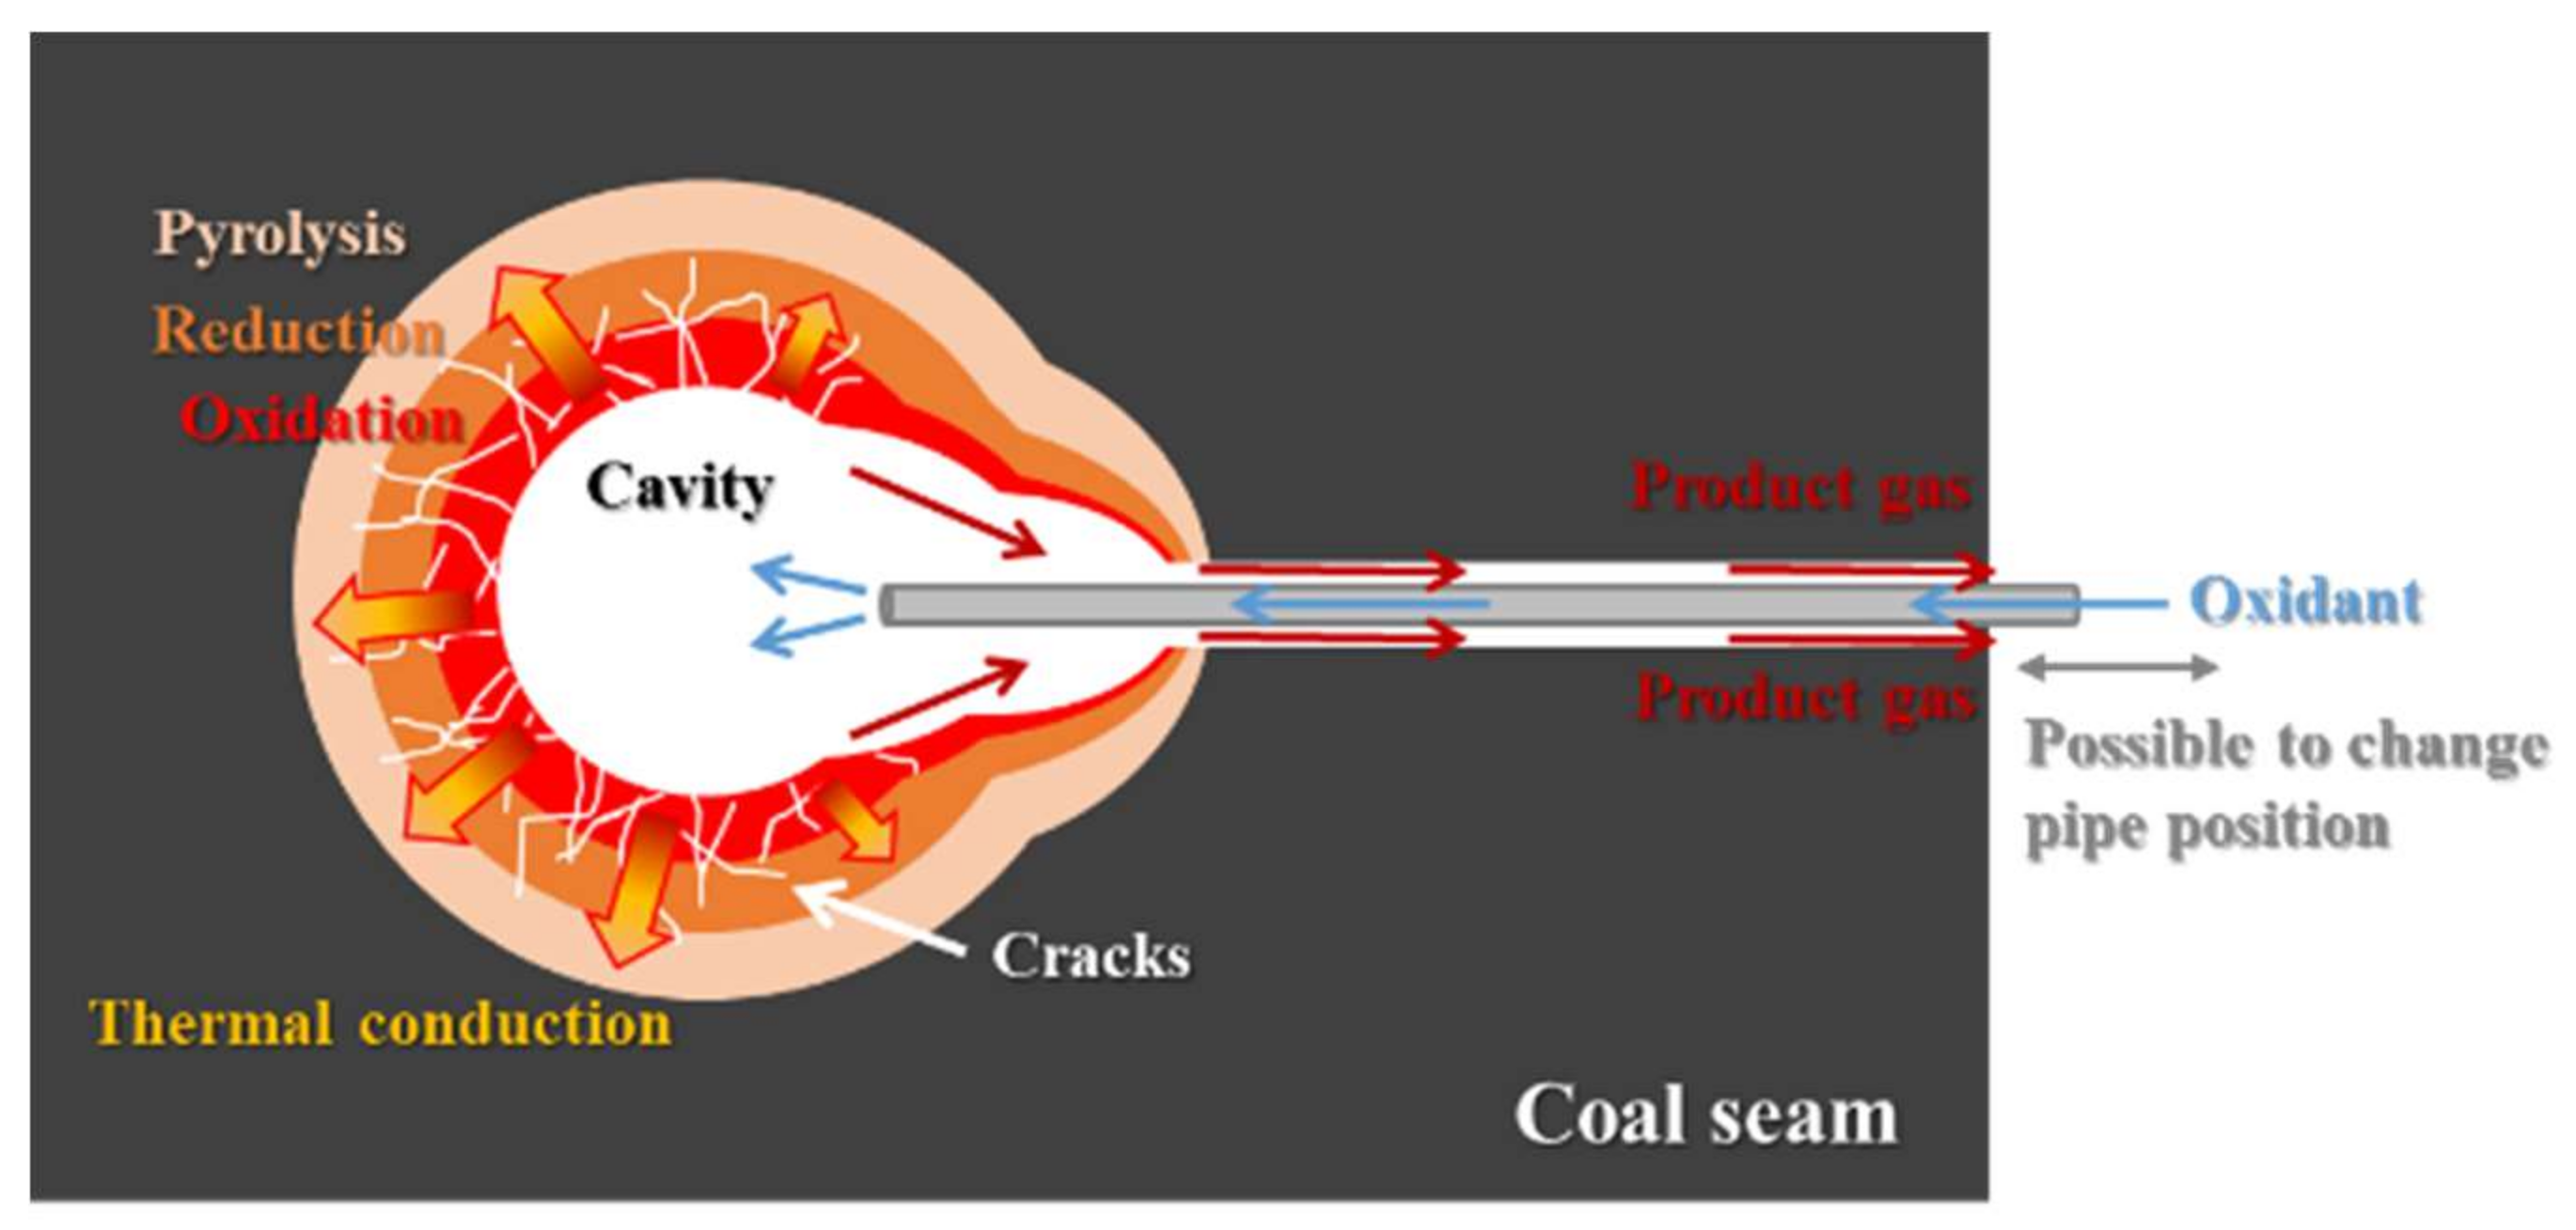
Description of the Simulated UCG Gasifiers
3. Results and Discussion
3.1. Gasification Zone Evolution
3.1.1. Temperature Distribution
3.1.2. Gasification Zone Evolution
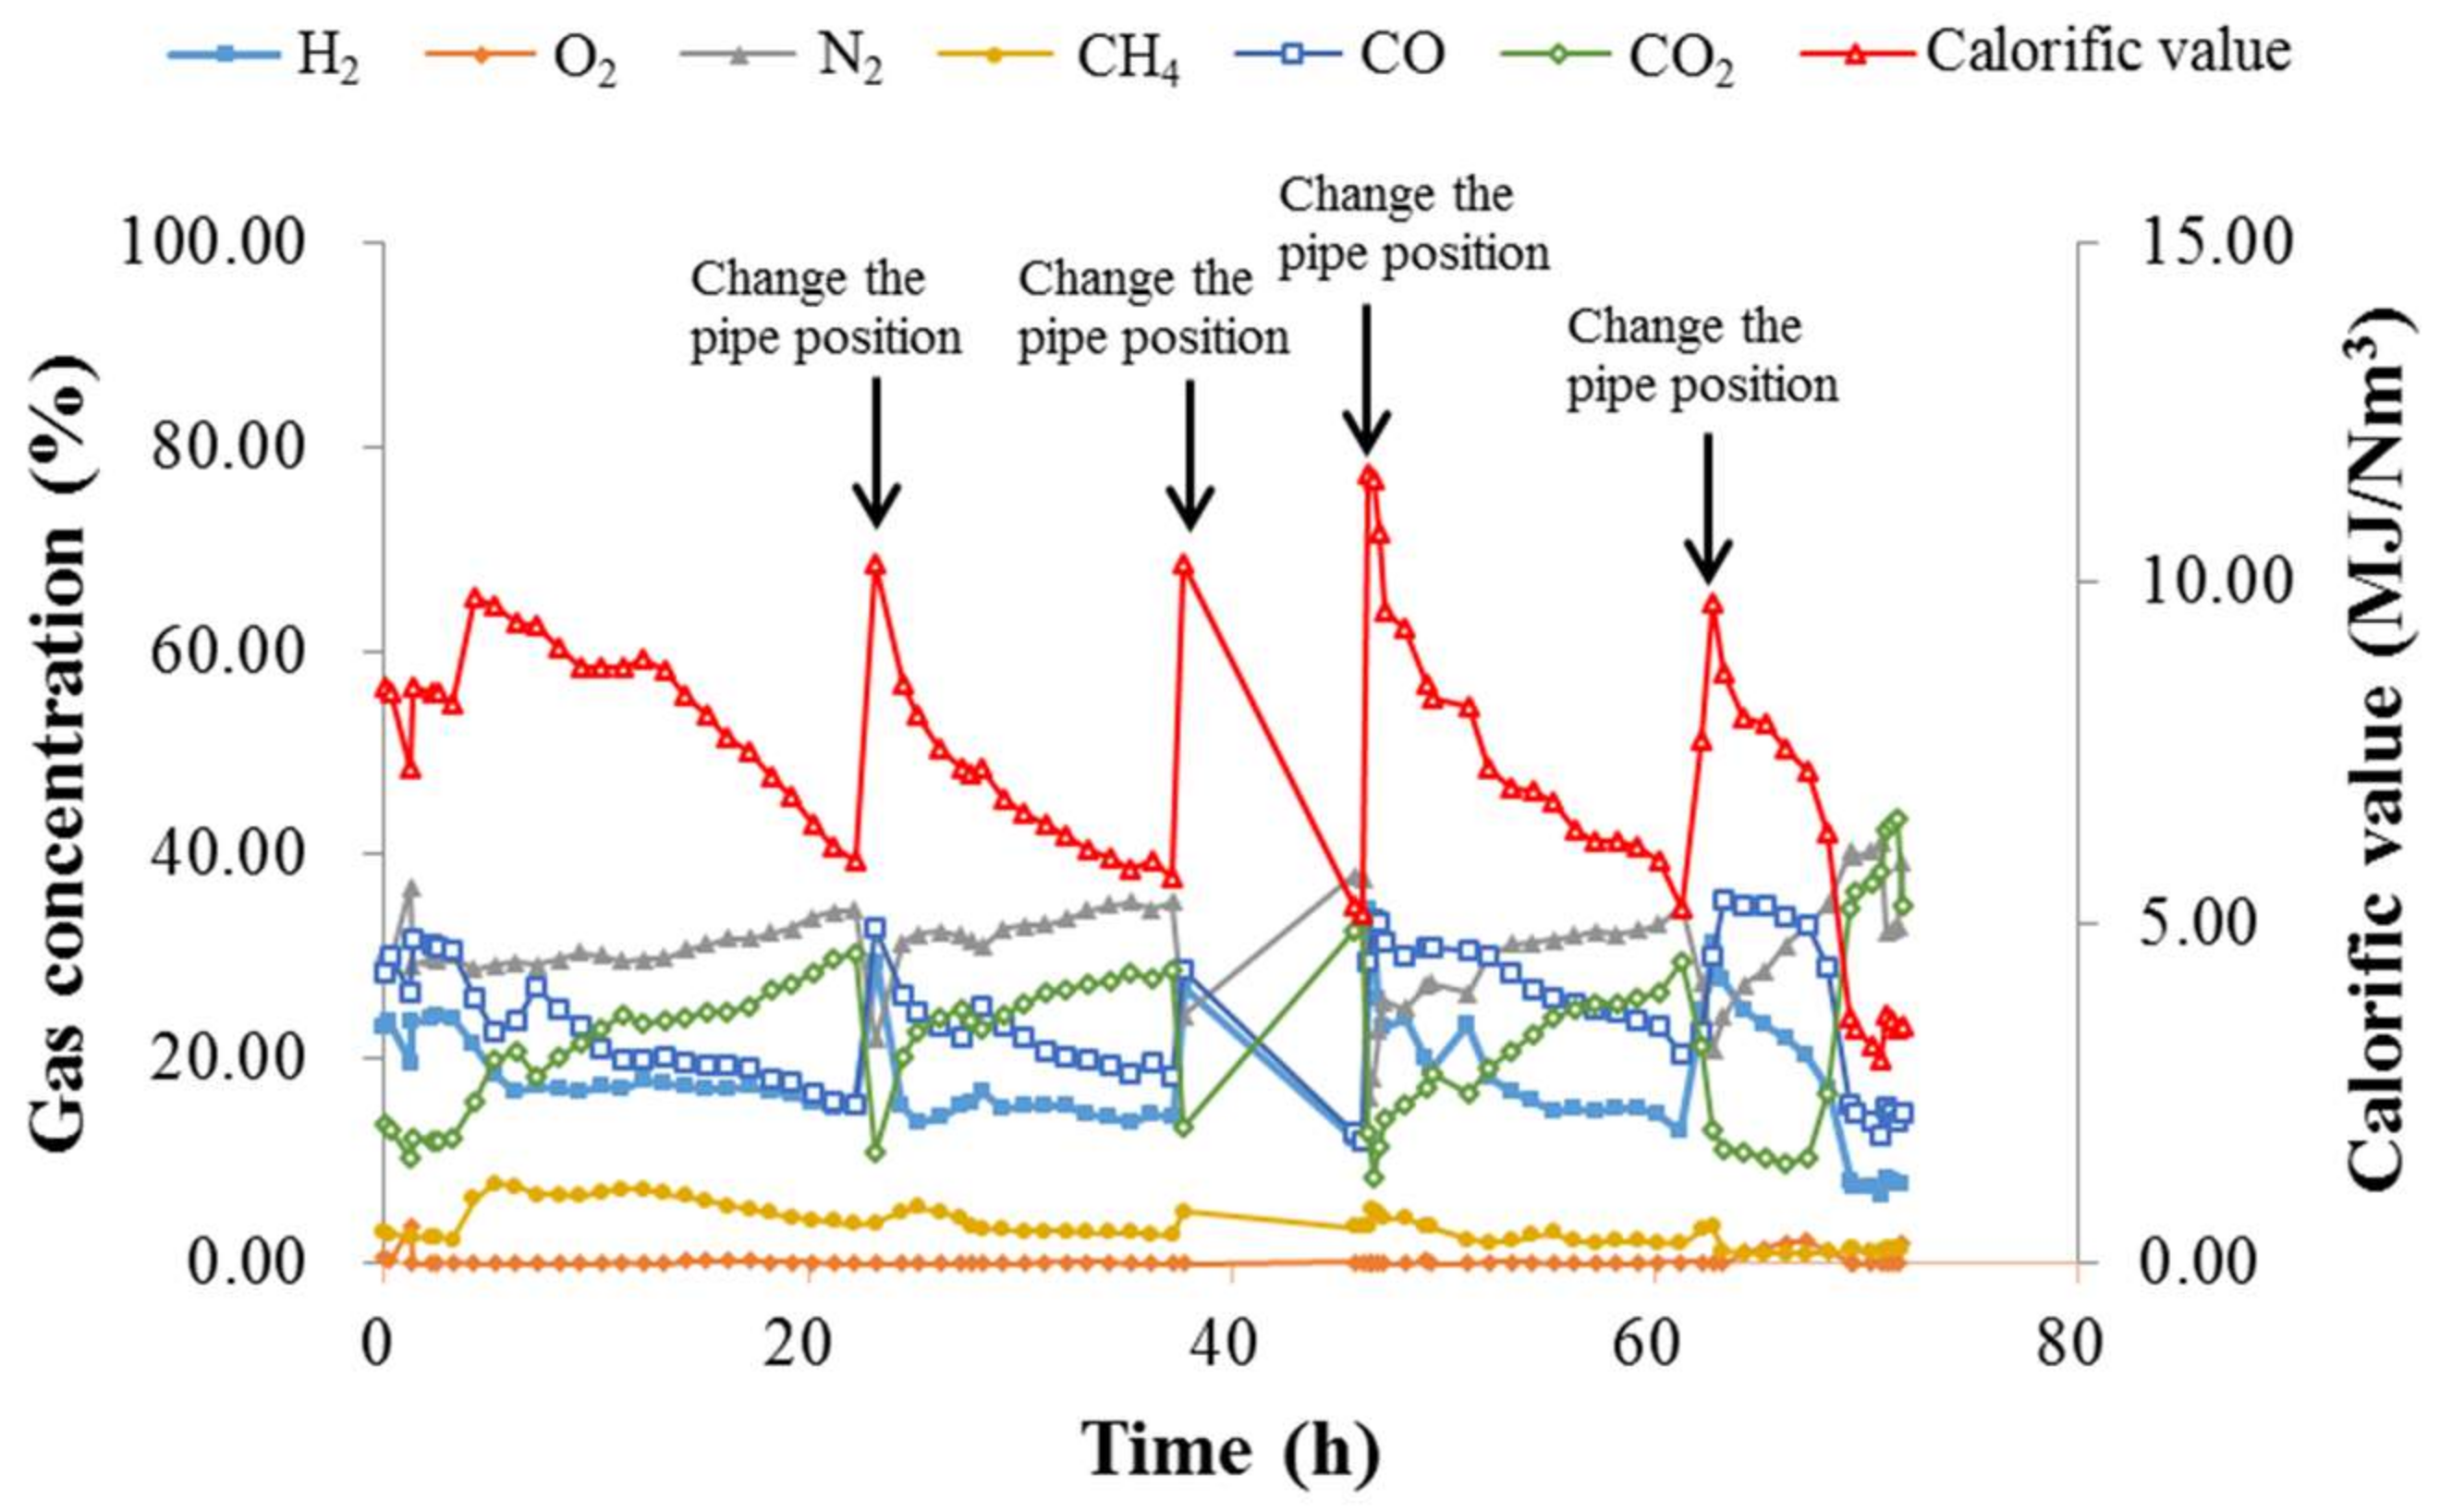
3.2. Compositions of Product Gas and Calorific Value
3.3. Comparison with the Results of Previous Study
4. Conclusions
Acknowledgments
Author Contributions
Conflicts of Interest
References
- Stańczyk, K.; Kapusta, K.; Wiatowski, M.; Swiądrowski, J.; Smoliński, A.; Rogut, J.; Kotyrba, A. Experimental simulation of hard coal underground gasification for hydrogen production. Fuel 2012, 91, 40–50. [Google Scholar] [CrossRef]
- Shafirovich, E.; Varma, A. Underground coal gasification: A brief review of current status. Ind. Eng. Chem. Res. 2009, 48, 7865–7875. [Google Scholar] [CrossRef]
- Alexander, Y.K. Early ideas in underground coal gasification and their evolution. Energies 2009, 2, 456–476. [Google Scholar]
- Duan, T.; Wang, Z.; Liu, Z.; Chen, Y.; Fu, Z. Experimental Study of Coal Pyrolysis under the Simulated High-Temperature and High-Stress Conditions of Underground Coal Gasification. Energy Fuels 2017, 31, 1147–1158. [Google Scholar] [CrossRef]
- Gregg, D.W.; Edgar, T.F. Underground coal gasification. AIChE J. 1978, 24, 753–781. [Google Scholar] [CrossRef]
- Couch, G.R. Underground Coal Gasification; IEA Clean Coal Centre, International Energy Agency: London, UK, 2009. [Google Scholar]
- Bhutto, A.W.; Bazmi, A.A.; Zahedi, G. Underground coal gasification: From fundamentals to applications. Prog. Energy Combust. Sci. 2013, 39, 189–214. [Google Scholar] [CrossRef]
- Khan, M.M.; Mmbaga, J.P.; Shirazi, A.S.; Trivedi, J.; Liu, Q.; Gupta, R. Modelling Underground Coal Gasification—A Review. Energies 2015, 8, 12603–12668. [Google Scholar] [CrossRef]
- Liu, S.; Zhang, S.; Chen, F.; Wang, C.; Liu, M. Variation of Coal Permeability under Dehydrating and Heating: A Case Study of Ulanqab Lignite for Underground Coal Gasification. Energy Fuels 2017, 31, 1147–1158. [Google Scholar] [CrossRef]
- Khadse, A.; Qayyumi, P.; Mahajani, S.; Aghalayam, P. Underground coal gasification: A new clean coal utilization technique for India. Energy 2007, 32, 2061–2071. [Google Scholar] [CrossRef]
- Bauman, J.H.; Deo, M. Simulation of a Conceptualized Combined Pyrolysis, In Situ Combustion, and CO2 Storage Strategy for Fuel Production from Green River Oil Shale. Energy Fuels 2012, 26, 1731–1739. [Google Scholar] [CrossRef]
- Prabu, V.; Jayanti, S. Heat-affected zone analysis of high ash coals during ex-situ experimental simulation of underground coal gasification. Fuel 2014, 123, 167–174. [Google Scholar] [CrossRef]
- Nourozieh, H.; Kariznovi, M.; Chen, Z.; Abedi, J. Simulation Study of Underground Coal Gasification in Alberta Reservoirs: Geological Structure and Process Modeling. Energy Fuels 2010, 24, 3540–3550. [Google Scholar] [CrossRef]
- Pei, P.; Barse, K.; Nasah, J. Competitiveness and Cost Sensitivity Study of Underground Coal Gasification Combined Cycle Using Lignite. Energy Fuels 2016, 30, 2111–2118. [Google Scholar] [CrossRef]
- Burton, E.; Friedmann, J.; Upadhye, R. Best Practices in Underground Coal Gasification; Lawrence Livermore National Laboratory: Livermore, CA, USA, 2006. [Google Scholar]
- Kacur, J.; Durdan, M.; Laciak, M.; Flegner, P. Impact analysis of the oxidant in the process of underground coal gasification. Measurement 2014, 51, 147–155. [Google Scholar] [CrossRef]
- Nakaten, N.; Schlüter, R.; Azzam, R.; Kempka, T. Development of a techno-economic model for dynamic calculation of cost of electricity, energy demand and CO2 emissions of an integrated UCG-CCS process. Energy 2014, 66, 779–790. [Google Scholar] [CrossRef]
- Nakaten, N.C.; Kempka, T. Techno-Economic Comparison of Onshore and Offshore Underground Coal Gasification End-Product Competitiveness. Energies 2017, 10, 1643. [Google Scholar] [CrossRef]
- Otto, C.; Kempka, T. Prediction of steam jacket dynamics and water balances in underground coal gasification. Energies 2017, 10, 739. [Google Scholar] [CrossRef]
- Wang, Z.; Huang, W.; Zhang, P.; Xin, L. A contrast study on different gasifying agents of underground coal gasification at Huating Coal Mine. J. Coal Sci. Eng. (China) 2011, 17, 181–186. [Google Scholar] [CrossRef]
- Kapusta, K.; Wiatowski, M.; Stańczyk, K. An experimental ex-situ study of the suitability of a high moisture ortho-lignite for underground coal gasification (UCG) process. Fuel 2016, 179, 150–155. [Google Scholar] [CrossRef]
- Lin, X.; Liu, Q.; Liu, Z. Estimation of Effective Diffusion Coefficient of O2 in Ash Layer in Underground Coal Gasification by Thermogravimetric Apparatus. Energies 2018, 11, 460. [Google Scholar] [CrossRef]
- Imran, M.; Kumar, D.; Kumar, N.; Qayyum, A.; Saeed, A.; Bhatti, M.S. Environmental concerns of underground coal gasification. Renew. Sustain. Energy Rev. 2014, 31, 600–610. [Google Scholar] [CrossRef]
- Otto, C.; Kempka, T. Thermo-Mechanical Simulations of Rock Behavior in Underground Coal Gasification Show Negligible Impact of Temperature-Dependent Parameters on Permeability Changes. Energies 2015, 8, 5800–5827. [Google Scholar] [CrossRef]
- Kapusta, K.; Stańczyk, K. Pollution of water during underground coal gasification of hard coal and lignite. Fuel 2011, 90, 1927–1934. [Google Scholar] [CrossRef]
- Kapusta, K.; Stańczyk, K.; Wiatowski, M.; Chećko, J. Environmental aspects of a field-scale underground coal gasification trial in a shallow coal seam at the Experimental Mine Barbara in Poland. Fuel 2013, 113, 196–208. [Google Scholar] [CrossRef]
- Shu-qin, L.; Jing-gang, L.; Mei, M.; Dong-lin, D. Groundwater Pollution from Underground Coal Gasification. J. China Univ. Min. Technol. 2007, 17, 467–472. [Google Scholar]
- Perkins, G.; Sahajwalla, V. A Numerical Study of the Effects of Operating Conditions and Coal Properties on Cavity Growth in Underground Coal Gasification. Energy Fuels 2006, 20, 596–608. [Google Scholar] [CrossRef]
- Yong, C.; Jie, L.; Zhangqing, W.; Xiaochun, Z.; Chenzi, F.; Dongyu, L.; Xuan, W. Forward and reverse combustion gasification of coal with production of high-quality syngas in a simulated pilot system for in situ gasification. Appl. Energy 2014, 131, 9–19. [Google Scholar]
- Itakura, K.; Goto, T.; Yoshida, K.; Belov, A.; Ram, G. Fundamental Experiments for Developing Underground Coal Gasification (UCG) System. Mem. Muroran Inst. Technol. 2010, 59, 51–54. [Google Scholar]
- Hamanaka, A.; Su, F.Q.; Itakura, K.; Takahashi, K.; Kodama, J.; Deguchi, G. Effect of Injection Flow Rate on Product Gas Quality in Underground Coal Gasification (UCG) Based on Laboratory Scale Experiment: Development of Co-Axial UCG System. Energies 2017, 10, 238. [Google Scholar] [CrossRef]
- Su, F.Q.; Itakura, K.; Deguchi, G.; Ohga, K. Monitoring of coal fracturing in underground coal gasification by acoustic emission techniques. Appl. Energy 2017, 189, 142–156. [Google Scholar] [CrossRef]
- Su, F.Q.; Hamanaka, A.; Itakura, K.; Deguchi, G.; Satoh, K.; Kodama, J. Evaluation of Coal Combustion Zone and Gas Energy Recovery for Underground Coal Gasification (UCG) Process. Energy Fuels 2017, 31, 154–169. [Google Scholar] [CrossRef]
- Hamanaka, A.; Itakura, K.; Su, F.Q.; Takahashi, K.; Satoh, K.; Deguchi, G.; Kodama, J. Model Experiment for Co-axial Underground Coal Gasification System Development. In Proceedings of the 24th World Mining Congress (Sustainability in Mining), Rio, Brazil, 18–21 October 2016; pp. 326–336. [Google Scholar]
- Su, F.Q.; Nakanowataru, T.; Itakura, K.; Ohga, K.; Deguchi, G. Evaluation of Structural Changes in the Coal Specimen Heating Process and UCG Model Experiments for Developing Efficient UCG Systems. Energies 2013, 6, 2386–2406. [Google Scholar] [CrossRef]
- Su, F.Q.; Itakura, K.; Deguchi, G.; Ohga, K.; Kaiho, M. Evaluation of energy recovery from laboratory experiments and small-scale field tests of underground coal gasification (UCG). J. MMIJ 2015, 131, 203–218. [Google Scholar] [CrossRef]


| No. | Parameter | Sanbi Coal (Japan) |
|---|---|---|
| Proximate analysis/(wt %) | ||
| 1 | Fixed moisture | 2.10 |
| 2 | Ash content | 4.30 |
| 3 | Volatile matter | 43.10 |
| 4 | Fixed carbon | 50.50 |
| 5 | Total sulfur | 0.07 |
| Ultimate analysis/(wt %) | ||
| 6 | Carbon | 78.40 |
| 7 | Hydrogen | 5.74 |
| 8 | Nitrogen | 1.44 |
| 9 | Oxygen | 9.94 |
| Linking-Hole Types | Co-Axial 1 | Co-Axial 2 | Linking-Hole | Co-Axial with a Horizontal Well |
|---|---|---|---|---|
| Gasification period (hour) | 24 | 51 | 111 | 72 |
| Average calorific value (MJ/Nm3) | 4.68 | 4.75 | 7.78 | 6.85 |
| Total energy (MJ) | 383.24 | 673.43 | 2804.82 | 1820.81 |
| Gasified coal (kg) | 25.91 | 48.54 | 138.28 | 86.63 |
| Gasification efficiency (%) | 45.93 | 43.19 | 63.15 | 65.43 |
© 2018 by the authors. Licensee MDPI, Basel, Switzerland. This article is an open access article distributed under the terms and conditions of the Creative Commons Attribution (CC BY) license (http://creativecommons.org/licenses/by/4.0/).
Share and Cite
Su, F.-q.; Hamanaka, A.; Itakura, K.-i.; Deguchi, G.; Zhang, W.; Nan, H. Evaluation of a Compact Coaxial Underground Coal Gasification System Inside an Artificial Coal Seam. Energies 2018, 11, 898. https://doi.org/10.3390/en11040898
Su F-q, Hamanaka A, Itakura K-i, Deguchi G, Zhang W, Nan H. Evaluation of a Compact Coaxial Underground Coal Gasification System Inside an Artificial Coal Seam. Energies. 2018; 11(4):898. https://doi.org/10.3390/en11040898
Chicago/Turabian StyleSu, Fa-qiang, Akihiro Hamanaka, Ken-ichi Itakura, Gota Deguchi, Wenyan Zhang, and Hua Nan. 2018. "Evaluation of a Compact Coaxial Underground Coal Gasification System Inside an Artificial Coal Seam" Energies 11, no. 4: 898. https://doi.org/10.3390/en11040898
APA StyleSu, F.-q., Hamanaka, A., Itakura, K.-i., Deguchi, G., Zhang, W., & Nan, H. (2018). Evaluation of a Compact Coaxial Underground Coal Gasification System Inside an Artificial Coal Seam. Energies, 11(4), 898. https://doi.org/10.3390/en11040898