Article

Effect of Mild-Temperature Thermo-Alkaline Pretreatment on the Solubilization and Anaerobic Digestion of Spent Coffee Grounds

School of Urban and Environmental Engineering, Ulsan National Institute of Science and Technology (UNIST), 50 UNIST-gil, Eonyang-eup, Ulju-gun, Ulsan 44919, Korea
*
Author to whom correspondence should be addressed.
Energies 2018, 11(4), 865; https://doi.org/10.3390/en11040865
Submission received: 28 February 2018 / Revised: 21 March 2018 / Accepted: 5 April 2018 / Published: 8 April 2018
(This article belongs to the Section A: Sustainable Energy)

Abstract

:
Mild-temperature thermo-alkaline pretreatment of spent coffee grounds (SCG) was studied to improve its solubilization and methanation. The simultaneous effects of NaOH concentration (0–0.2 M) and temperature (60–90 °C) were investigated. Significant solubilization of SCG was achieved by the pretreatment, particularly under high-NaOH-concentration and high-temperature conditions. However, adding NaOH above a certain concentration adversely affected the methane production. Therefore, the degree of solubilization (SD) correlated poorly with methane yield (Ym). Response surface models of SD and Ym were successfully generated. The maximum response of SD (36.4%) was obtained at 0.18 M NaOH and 90.0 °C, while that of Ym (263.31 mL CH4/g COD added) was obtained at 0.13 M NaOH and 70.5 °C. Hydrogenotrophic Methanospirillum species were the dominant methanogens in all the SCG digestion tests. It is likely that NaOH concentration had a more significant influence on the development of microbial community structure, particularly of methanogens than temperature.

1. Introduction

With the advent of energy and climate crises, there is a growing demand for carbon-neutral renewable energy sources. Biofuels produced from biomass are attracting increasing interest as a promising energy source for the future due to their sustainable nature. Feedstock supply is a key factor that determines the feasibility of biofuel production. Food crops, such as sugarcane and corn, have been and are still the primary sources of feedstock. Increasing consumption of food crops for biofuel production has led to significant ethical and economic issues. In recent years, extensive efforts have been made to replace conventional feedstocks by non-edible feedstocks, such as lignocellulosic residues and wastes, to avoid competition with food production.
Due to the continuous increase in worldwide coffee consumption, the production of spent coffee grounds (SCG), which is the solid residue remaining after brewing coffee, has also been increasing continuously. Global SCG production is approximately 8 million tons per year [1], and proper management of SCG is an increasingly challenging task. Generally, SCG is disposed of as general waste in landfills, although small amounts are used as boiler fuel [2] or a mushroom cultivation medium [3]. If SCG is improperly managed, serious pollution issues will develop due to the decomposition of easily degradable organic matter and the release of potentially toxic compounds such as caffeine, tannin, and polyphenols [1,4]. On the other hand, due to its high organic content, SCG has recently attracted increasing interest as a feedstock for biofuel production [5].
Methane production through anaerobic digestion (AD) of organic matter is one of the most extensively applied biofuel production methods, particularly from waste feedstocks. When combined with waste treatment, AD can remove pollutants and produce renewable energy simultaneously. Although AD can provide a more sustainable approach to handling organic-rich SCG, the low bioavailability of SCG due to its high lignocellulosic content is a critical concern. This adversely affects the hydrolysis of feedstock, the first step of AD, followed by acidogenesis, acetogenesis, and methanogenesis. A practical way to overcome this limitation is pretreating the feedstock to make it more easily decomposable.
Pretreatment methods using biological, mechanical, chemical, and thermal means and their combinations have been applied to improve the degradability of lignocellulosic biomass [6]. Thermochemical pretreatment is considered a highly effective method because of low time, resource, and energy requirements [7]. Thermo-alkaline pretreatment can be particularly effective because alkali causes swelling of cellulose thereby increasing the surface area of the fibers that is accessible to hydrolytic enzymes [8,9,10]. Alkali and energy requirements can be reduced when alkali and thermal pretreatment methods are combined [11]. This enables energy-efficient and effective pretreatment at mild temperatures (<100 °C). Additionally, at temperatures above 180 °C, refractory or inhibitory compounds may form [12]. To the best of our knowledge, studies on mild-temperature thermo-alkaline pretreatment methods for enhancing AD of SCG are limited.
To address this research gap, this study examines the effects of thermo-alkaline pretreatment using NaOH on the solubilization and methane yield of SCG. Response surface analysis (RSA) was applied for experimental design and analysis of the results obtained to investigate the simultaneous effects of NaOH concentration (0–0.2 M) and temperature (60–90 °C). The biochemical methane potential (BMP) of pretreated SCG were examined. Additionally, the optimum pretreatment conditions to achieve maximum solubilization and methane yield of SCG were estimated. For a more comprehensive insight, the microbial community structures in the BMP reactors with different pretreatment conditions were comparatively analyzed using a molecular fingerprinting assay.

2. Materials and Methods

2.1. Seed Sludge and Spent Coffee Grounds

SCG was collected from a coffee shop in UNIST (Ulsan, Republic of Korea) (Table 1). Anaerobic sludge used as the inoculum for the BMP tests was obtained from a full-scale anaerobic digester co-digesting food wastewater, sewage sludge, and human feces. The seed sludge was starved for a week at 35 °C prior to use to avoid errors in experimental results due to endogenous biogas produced from the inoculum. The total solids (TS) content of the inoculum was 31.9 g/L, 65% of which was volatile solids (VS), and the chemical oxygen demand (COD) was 34.4 g/L.

2.2. Experimental Design for Response Surface Analysis

RSA with a two-factor, three-level face-centered design (FCD) was employed to design the experiments for evaluating the simultaneous effects of NaOH dose and temperature. The FCD matrix was comprised of nine experimental points to produce statistically sound results with a minimal number of experimental trials (Table 2). The center point was replicated five times for statistical analysis. Therefore, a total of thirteen pretreatment trials were conducted. Based on previous studies on thermochemical pretreatment of different feedstocks [11,13], NaOH concentrations and temperatures in the ranges of 0–0.2 M and 60–90 °C, respectively, were tested in this study. A sequential procedure of collecting data, testing polynomial equations, and evaluating model adequacy was followed for the RSA. Increasingly complex polynomials were fitted to the experimental data for model estimation and validation using Design Expert 7 software (Stat-Ease, Minneapolis, MN, USA). The RSA calculation converts the independent variables, i.e., NaOH concentration and temperature in this study, to coded values for ease of computation. The upper limit, central level, and lower limit of a variable were converted to +1, 0, and −1, respectively. The experimental design information is given as coded and actual values in Table 2.

2.3. Thermo-Alkaline Pretreatment

Different NaOH doses and temperatures were used to treat SCG according to the experimental design presented in Table 2. SCG was suspended in 200 mL of distilled water (DW) at a VS concentration of 12.5 g/L in a 250 mL glass beaker. Different amounts of NaOH were added to the suspension to achieve the desired concentration. The suspension was subsequently thoroughly mixed with a magnetic stirrer for 10 min and placed in an oven with the thermostat set at a designated temperature. Thermal treatment was conducted for 6 h with magnetic stirring for 10 min every 2 h.
The degree of solubilization (SD) was determined by the ratio of the increase in soluble COD before and after pretreatment to the maximum possible change in soluble COD using the equation below:
SD ( % ) = SCOD t SCOD 0 TCOD 0 SCOD 0 × 100
where SCODt is the soluble COD of SCG after pretreatment, SCOD0 is the soluble COD of SCG before pretreatment, and TCOD0 is the total COD of raw SCG.

2.4. Biochemical Methane Potential Assay

The BMP tests of pretreated SCG samples were conducted in 120-mL glass serum bottles in triplicates: 13 samples × 3 replicates = 39 trials (Table 2). Each reactor was filled with 40 mL each of inoculum and pretreated SCG suspension. DW was used instead of a substrate in the blank run, which was also conducted in triplicate to determine endogenous methane production from the inoculum. The pretreated SCG samples were cooled down to room temperature and the pH was adjusted to 7.0–7.2 with HCl or NaOH before inoculation. Each reactor was flushed with pure nitrogen to remove oxygen in the headspace and sealed gas-tight with a rubber stopper and a crimp cap. The reactor bottles were incubated at 35 °C for 30 days with intermittent manual shaking. Biogas produced was measured periodically using a gas-tight syringe.

2.5. Molecular Analyses

One of the triplicate BMP reactors of each pretreated SCG sample was randomly selected for microbial community analysis by denaturing gradient gel electrophoresis (DGGE). The digestates from the five reactors selected for the center point were uniformly mixed into one sample. Therefore, a total of nine samples corresponding to each pretreatment run (Table 2) were prepared for DNA extraction. Total genomic DNA was extracted from the digestates at the end of the 30-day BMP incubation period using a fully automated nucleic acid extractor (ExiProgen, Bioneer, Daejeon, Korea) according to the manufacturer’s instructions. One milliliter of each sample was pelleted by centrifugation at 13,000 g for 1 min. The pellets were washed repeatedly by resuspending (in 1 mL DW), decanting (0.9 mL of DW), and re-pelleting (13,000× g, 1 min) to remove cell debris and impurities. A 200-μL portion of the final resuspension was loaded on the extractor with the ExiProgen Bacteria Genomic DNA kit (Bioneer). Purified DNA was recovered in 200 μL of elution buffer and stored at −20 °C until use.
Archaeal and bacterial 16S rRNA genes were amplified by touchdown polymerase chain reaction (PCR) using the ARC787F/1059R and BAC338F/805R primer sets [14], respectively, as previously described [11]. The obtained amplicons (20 μL) were electrophoresed in 8% (w/v) polyacrylamide gels with 30–55% (archaea) or 20–60% (bacteria) denaturant gradients (100% denaturant corresponds to 7 M urea and 40% (v/v) formamide) for 16 h at 80 V in a Dcode Universal Mutation Detection System (Bio-Rad, Hercules, CA, USA). After electrophoresis, the DGGE gels were stained with SYBR Safe dye (Molecular Probes, Eugene, OR, USA) and visualized under blue light. Bands of interest were excised from the gels and eluted in 40-μL sterile water. The retrieved DNA was re-amplified with the same primer sets used for DGGE but without the GC clamp. The resulting amplicons were purified and cloned using the MG TA TOPO cloning kit (MGmed, Seoul, Korea). The cloned 16S rRNA gene fragments were sequenced using the T7 forward primer. These sequences were compared against the GenBank and RDP databases. The RDP Classifier (bootstrap value: 80%) was used for taxonomic classification of the 16S rRNA sequences. The nucleotide sequences obtained in this study were deposited in the GenBank database under accession numbers: MG434698-434703.

2.6. Cluster Analysis of DGGE Profiles

The archaeal and bacterial DGGE patterns were transformed into individual binary matrices by scoring the presence or absence of individual bands as one or zero, respectively, using an image processing software (TotalLab 1D, TotalLab, Newcastle upon Tyne, UK). Cluster analysis of the obtained binary matrices was performed using the unweighted pair group method with arithmetic mean (UPGMA) with the Dice similarity coefficient (DC). Cluster dendrograms were constructed using PAST 3.16 software.

2.7. Physicochemical Analyses

Spectrophotometric measurements of COD were taken with the HS-COD-MR kit (HUMAS, Daejeon, Korea). Samples were membrane filtered (pore size, 0.45 μm) prior to the measurement of soluble COD. Solids were determined according to the Standard Methods for the Examination of Water and Wastewater [15]. The dry weight contents of C, H, O, N, and S in SCG were analyzed using an organic elemental analyzer (Flash 2000, Thermo Scientific, Delft, The Netherlands). The biogas composition during the BMP tests was analyzed using a 7820A gas chromatograph (Agilent, Palo Alto, CA, USA) equipped with a thermal conductivity detector and a ShinCarbon ST column (Restek, Bellefonte, PA, USA). Cation concentrations were measured using an ion chromatograph (Dionex ICS-1100, Thermo Scientific) equipped with a Dionex Ionpac CS12A column (Thermo Scientific). All analyses were performed at least in duplicate.

3. Results and Discussion

3.1. Effects of Pretreatment

Pretreatment of SCG significantly improved its SD. The SD values of SCG pretreated with NaOH (Runs 2, 3, 5, 6, 8, and 9) ranged from 25.1% to 35.1%, while those of SCG subjected to thermal-only pretreatment (Runs 1, 4, and 7) were much lower and ranged from 1.0 to 2.9% (Table 3). These results indicate that pretreatment with NaOH has a more significant effect on SCG solubilization than thermal pretreatment, within the ranges explored in this study. A point to note is that the SD increased significantly with increasing temperature in the presence of NaOH; however, increasing the temperature in thermal-only pretreatment did not increase the SD significantly. These results accord with the consensus that coupling thermal and chemical pretreatment methods can have a synergistic effect. Cellular structures of biomass are first attacked by the chemical reagents, and the resulting loosened macromolecules are easily damaged by heat [16].
Biogas production started without apparent lag in all BMP runs (Figure 1). Increase in the soluble fraction of organics in the feedstock after pretreatment provides a more easily utilizable substrate for microbial growth. This is expected to improve AD efficiency and rate. However, interestingly, the methane yields (Ym, methane production per unit mass of substrate COD added) in the BMP tests did not correlate with the SD values (Pearson correlation, p > 0.05). The maximum Ym (254.0 mL CH4/g COD added) was observed at the center point (Run 5; Table 3). This was followed by Run 6 with a Ym of 253.2 mL CH4/g COD added. However, the maximum SD (35.1%) was achieved at the harshest pretreatment condition (Run 9), with a corresponding Ym of 151.9 mL CH4/g COD added. This is the lowest value of Ym observed in this study and is even lower than that of Run 1 (155.1 mL CH4/g COD added), with the lowest SD (1.0%). The highest Ym was observed for SCG pretreated with the central-level concentration of NaOH (i.e., 0.1 M), although SCG pretreated with higher concentrations of NaOH showed higher SD values. These results indicate that enhancement of SCG solubilization is not directly translated into an increase in methane production from SCG. Since the reduction in VS (24.0–32.9%; data not shown) showed a significant correlation with Ym (Pearson correlation, p < 0.05), the poor correlation between SD and Ym appears to be associated with the partial or limited microbial utilization of soluble organic matter released from the disintegration of SCG.

3.2. Response Surface Model for SCG Solubilization

Increasingly higher-order polynomials were tested to fit the experimental data (Table 3) to find the most appropriate model that can approximate the response surface of SD. Model adequacy was assessed based on R2, p-value, lack-of-fit (LOF), and adequacy of precision (AP). A quadratic model was selected as the best-fit model (Table 4):
YSD = 26.99 + 15.14Xn + 2.30Xt + 0.83XnXt − 10.50Xn2 + 1.02Xt2
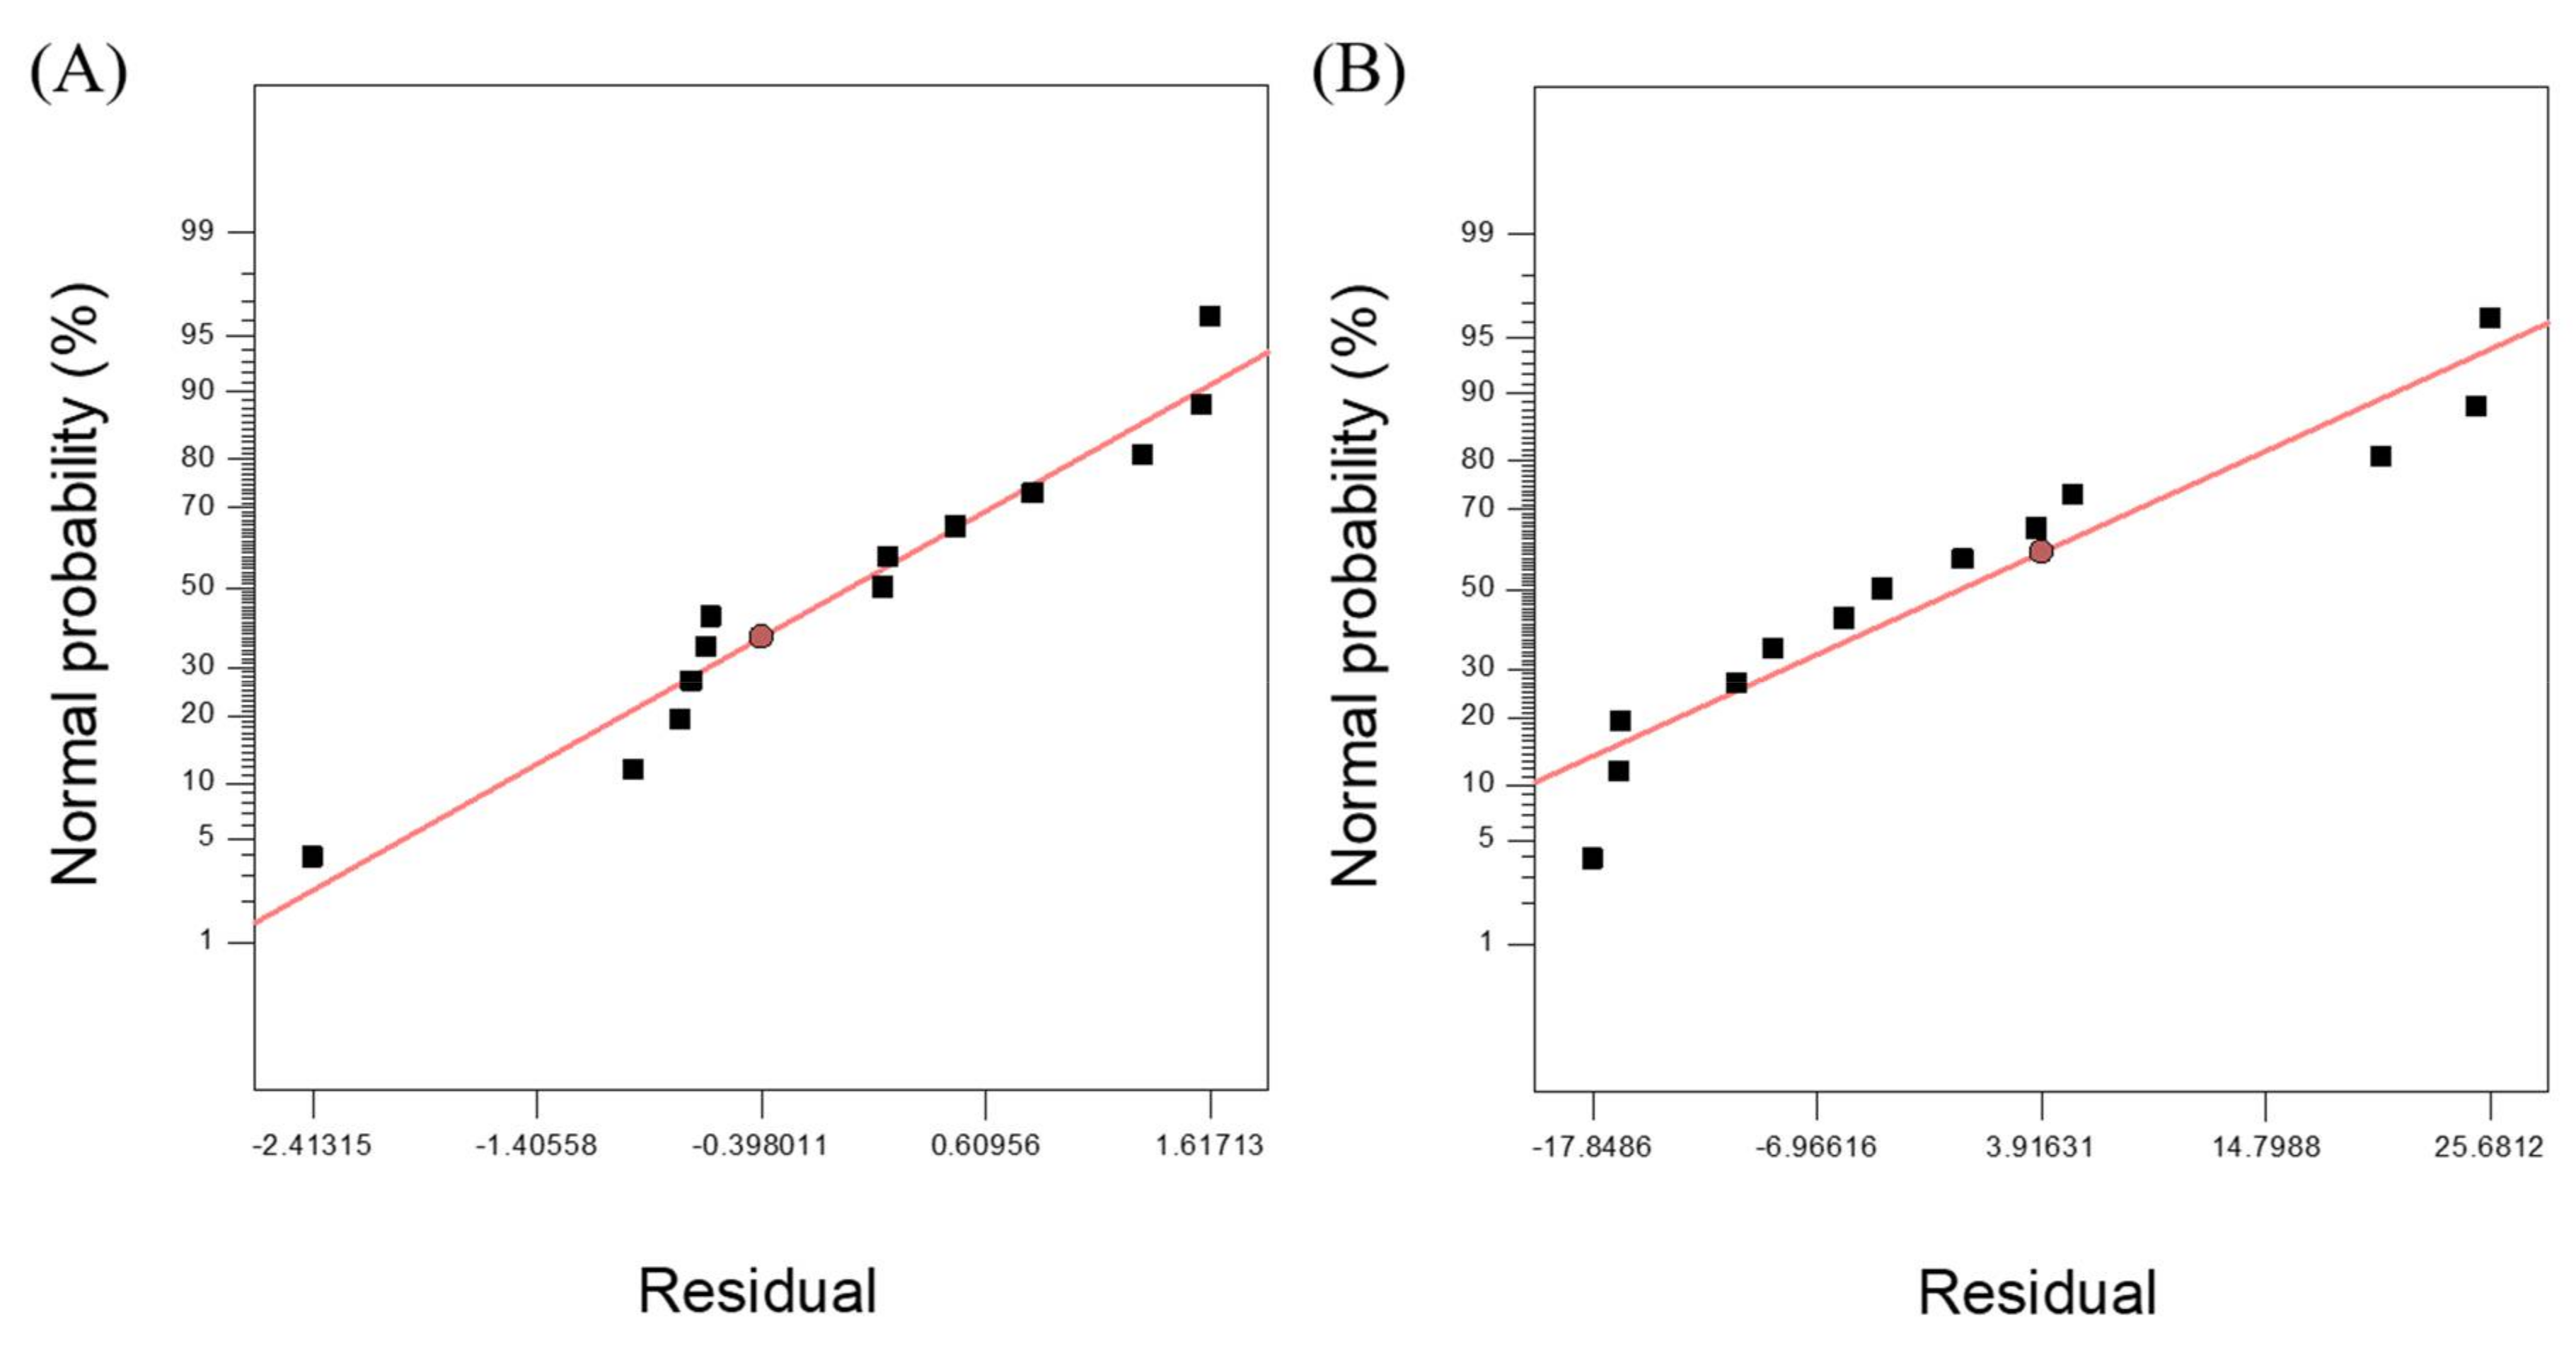
where YSD is the estimated response of SD, Xn is the coded value of NaOH concentration, and Xt is the coded value of temperature. Statistical significance of the model and individual terms were evaluated by analysis of variance (ANOVA). The generated model showed an excellent fit to the experimental data (R2 > 0.99, p < 0.0001), and LOF was not significant for the model (p > 0.05). The calculated AP value (33.515) was sufficiently high to guarantee the adequacy of the model. AP measures the range of model responses relative to the average estimation error, e.g., signal to noise ratio. A high AP value indicates a statistically reliable regression. An AP value greater than four is recommended to ensure adequacy of the model [11]. Furthermore, the model was checked for the normal and random distribution of regression residuals (i.e., constant variance of errors) by constructing the normal probability plot of residuals (Figure 2A). The results obtained confirm that the obtained model is adequate to describe the response surface of SD within the explored range.
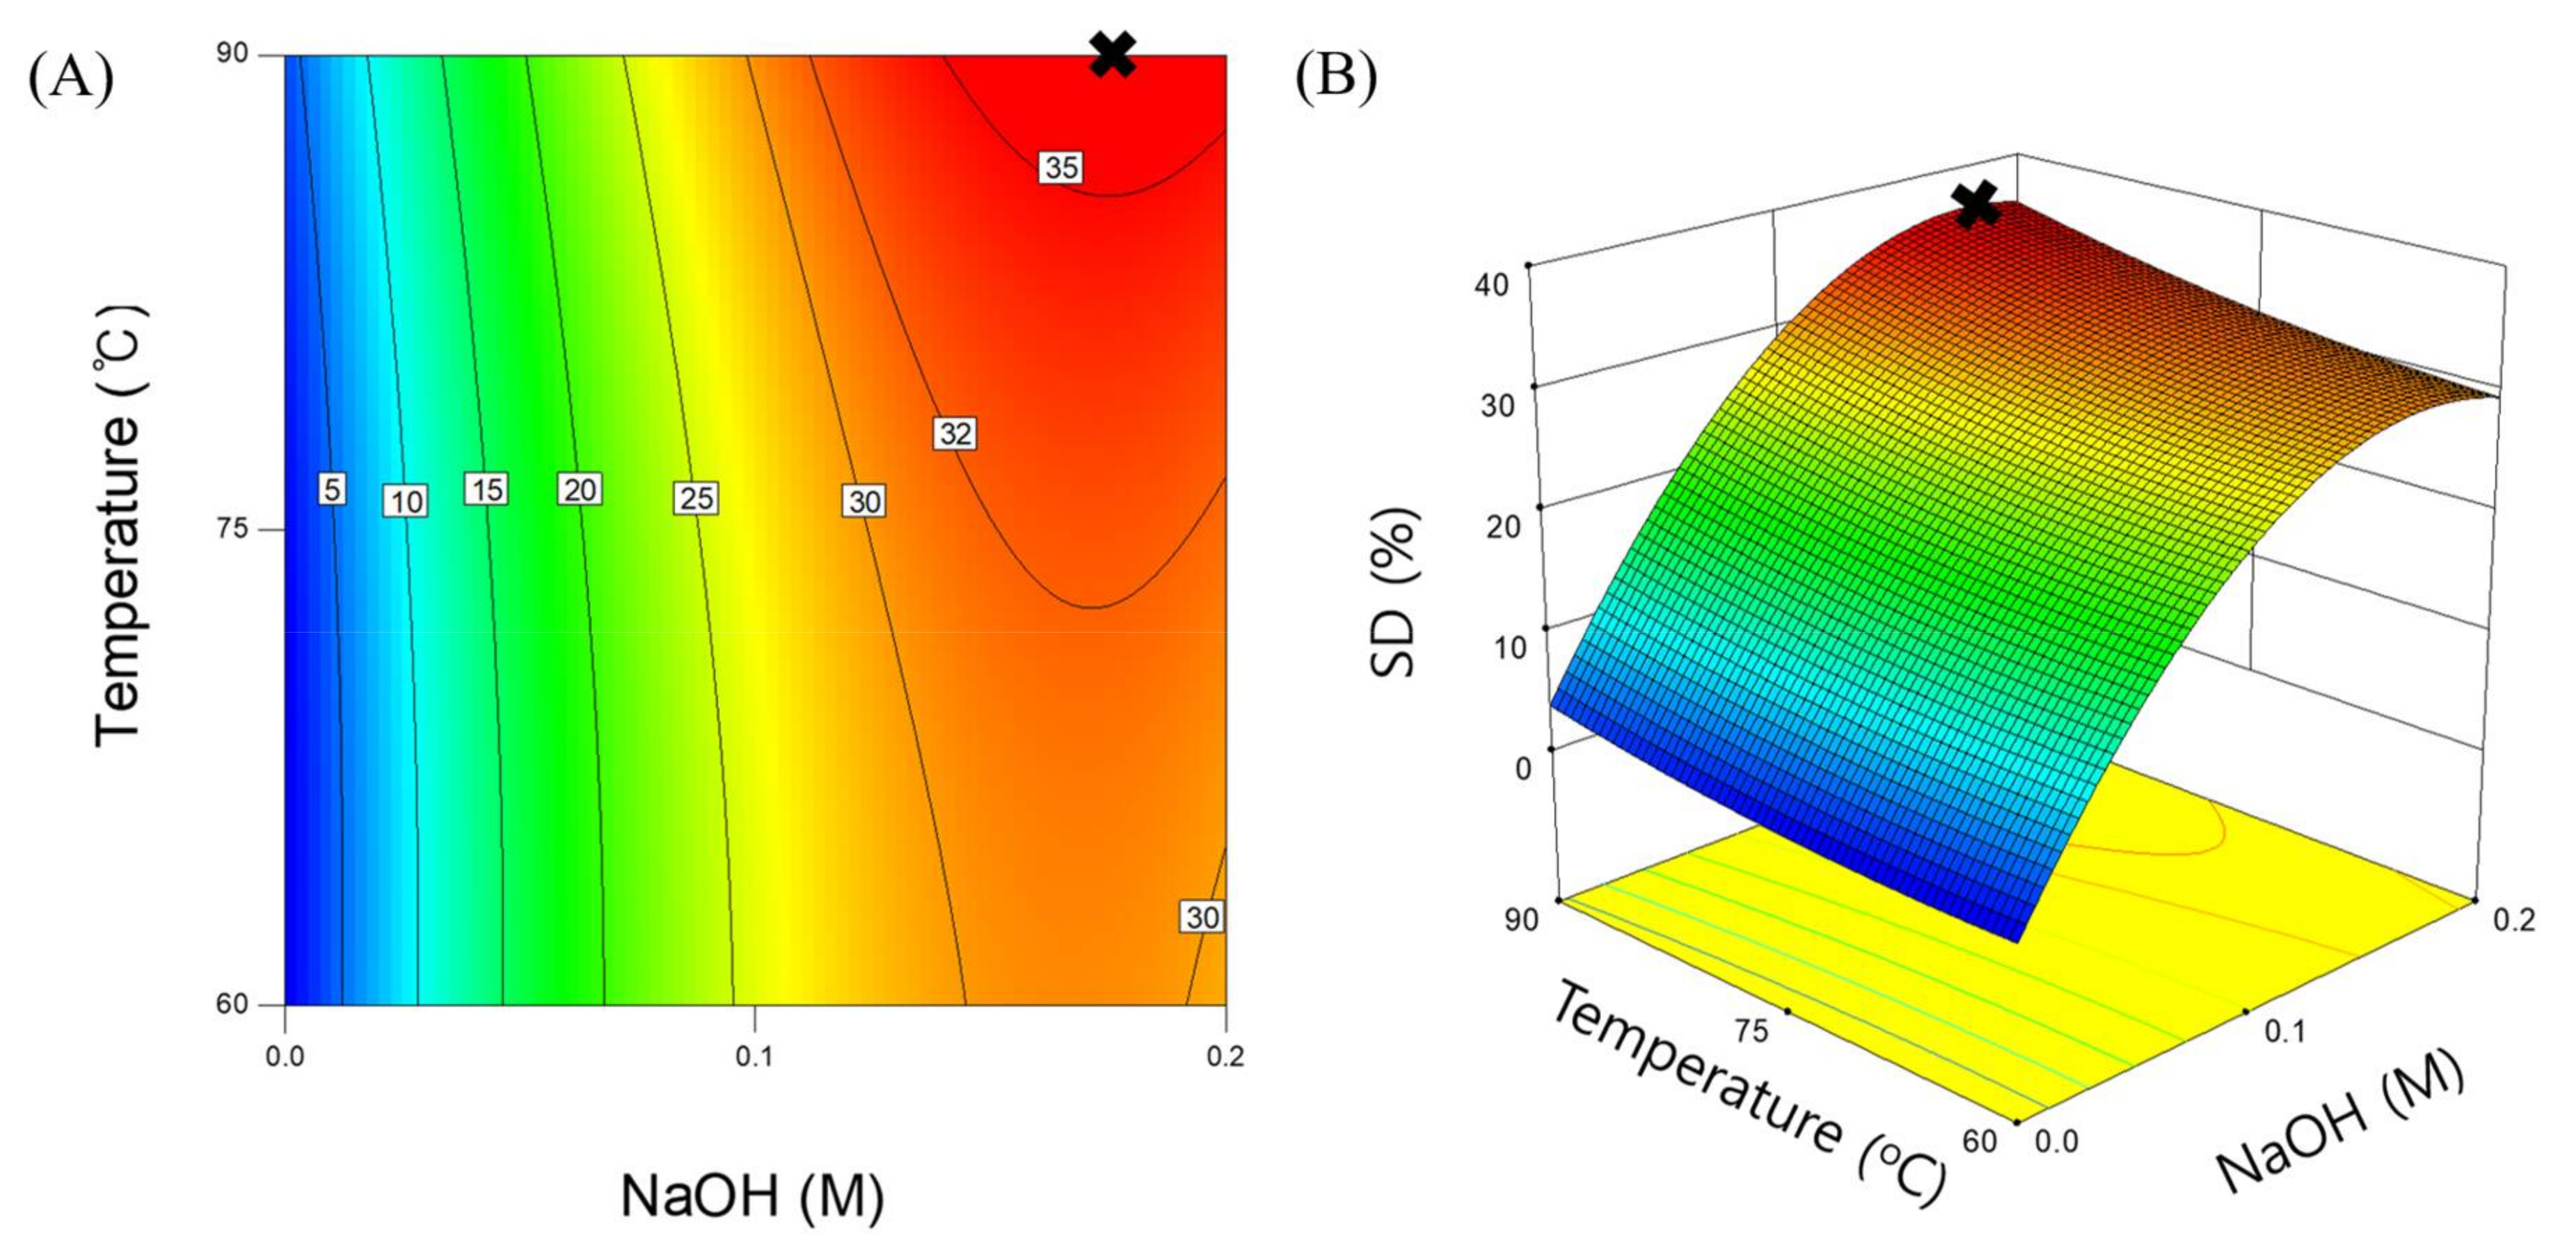
The linear and quadratic terms of NaOH concentration (Xn and Xn2) showed significantly lower p-values (<0.0001) than those of other variables. This indicates that NaOH concentration has a more significant influence on the SD response surface model than temperature. The linear term of temperature (Xt) was significant at the 1% level, while the remaining two terms (XnXt and Xt2) were not significant at the 5% level. These results indicate that SD is more significantly influenced by NaOH concentration than by temperature. This dominant effect of NaOH concentration is clearly reflected in the response surface plot of SD (Figure 3), where the model response varies rapidly along the NaOH concentration axis. On the other hand, the model contours are highly elongated with limited response variations along the temperature axis, particularly at lower NaOH concentrations. The model predicts greater SD responses (>27%) in the higher-NaOH-concentration and higher-temperature region (i.e., the upper right region of the plot). The maximum model output (36.4%) was obtained at a NaOH concentration of 0.18 M and temperature of 90.0 °C. These results accord with the observation of the maximum SD value (35.1%) in Run 9 (0.2 M NaOH, 90 °C) among all the pretreatment experimental runs (Table 2 and Table 3).

3.3. Response Surface Model for Methane Yield

After a series of models were fitted to the experimental data (Table 3), a quadratic model was selected as the most suitable model to illustrate the response surface of Ym (Table 5):
YYm = 259.12 + 18.40Xn − 9.91Xt − 25.62XnXt − 44.73Xn2 − 28.82Xt2
where YYm is the estimated response of Ym, Xn is the coded value of NaOH concentration, and Xt is the coded value of temperature. The obtained model showed a good regression (R2 > 0.85) and a low p-value (<0.01). The LOF was not significant (p > 0.05), and the AP value was 7.848, which is sufficiently high to confirm model adequacy. The regression residuals were randomly scattered about a straight line, indicating a normal distribution of the estimation errors (Figure 2B). These results prove that the model is adequate to approximate the response surface of Ym within the explored range.
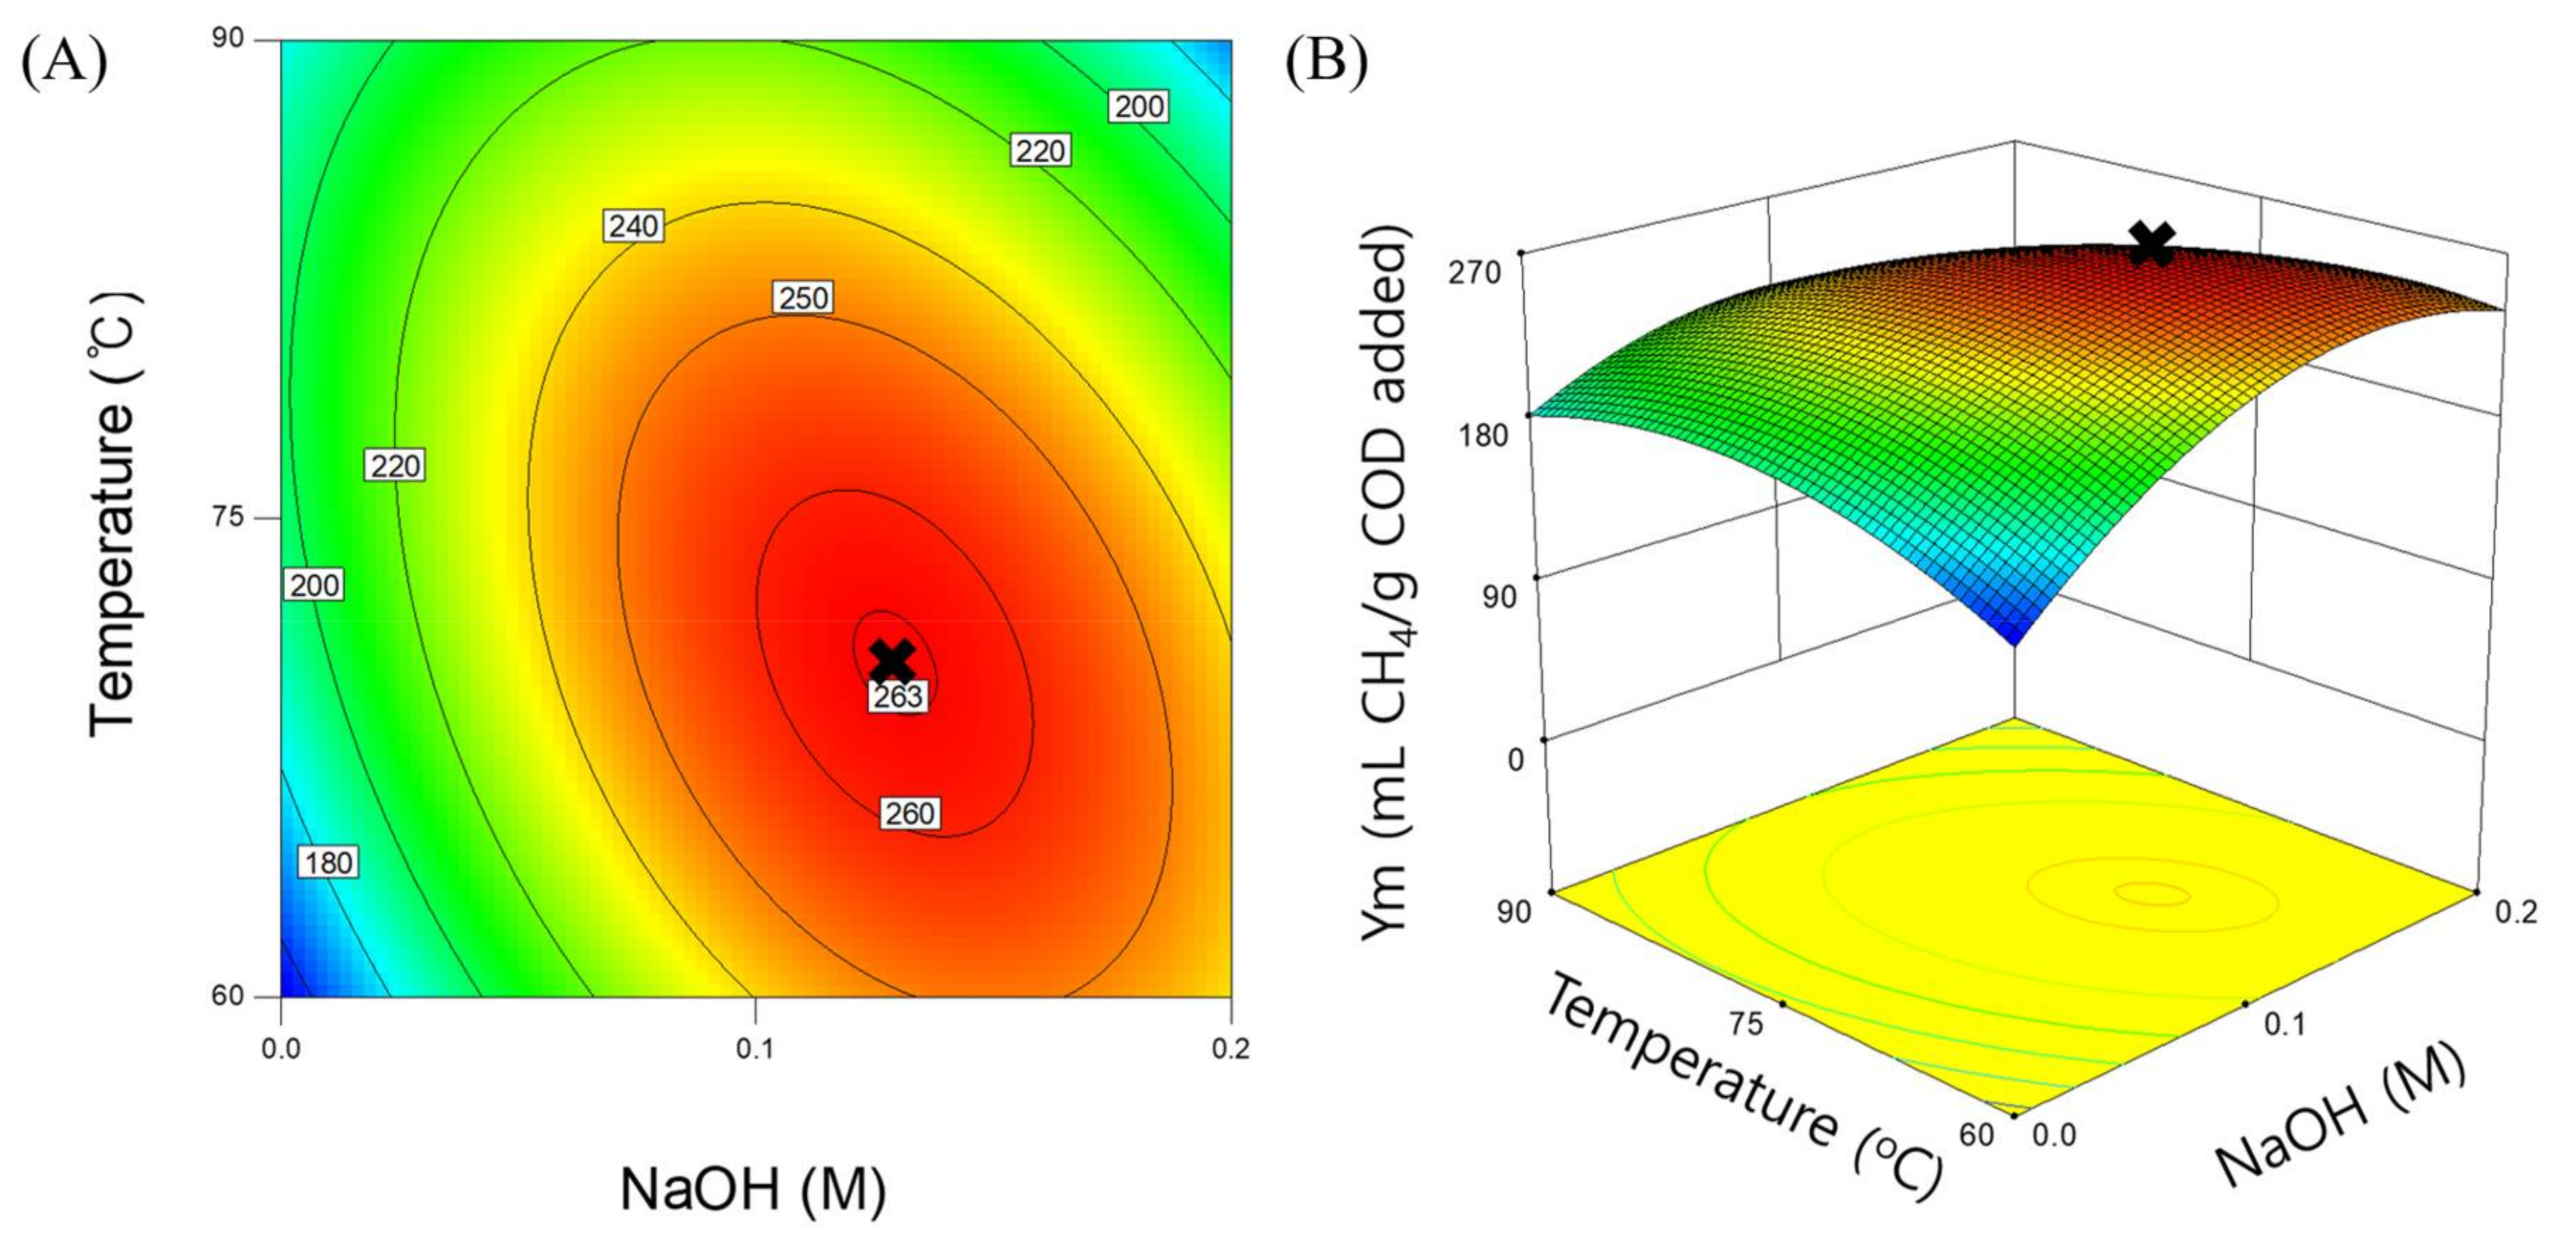
The squared terms of NaOH concentration and temperature (Xn2 and Xt2) were significant (p < 0.05). However, their linear terms (Xn and Xt) were not significant, although the p-value of Xn was considerably lower than that of Xt (Table 5). This indicates that Ym is significantly influenced by NaOH concentration and to a comparable extent by temperature through a quadratic relationship. Additionally, the interaction term (XnXt) that represents the interdependence of the independent variables was significant. Correspondingly, a hill of concentric elapses appears in the Ym response surface plot (Figure 4). The occurrence of a peak indicates the existence of the optimum condition for the maximum response within the design boundary. The estimated maximum Ym was 263.31 mL CH4/g COD added at pretreatment conditions: 0.13 M NaOH and 70.5 °C.
Interestingly, SD and Ym responded to variations in pretreatment conditions (i.e., NaOH concentration and temperature) in very different ways. Therefore, the optimum pretreatment conditions for maximizing SD and Ym were estimated to be significantly different. Since the purpose of pretreatment is to improve the biodegradability of feedstock and thereby the methane yield in AD, it seems reasonable to suggest that using the estimated condition for the maximum Ym (i.e., 0.13 M NaOH, 70.5 °C) as the optimum pretreatment condition for AD of SCG.

3.4. Correlation between SD and Ym

This mild-temperature thermo-alkaline pretreatment method was effective for solubilizing SCG, which can be attributed to the enhanced hydrolysis of lignocellulose due to the synergistic effect of heat and NaOH [16]. Interestingly, however, the enhanced solubilization of SCG was not directly translated into enhanced anaerobic digestibility of SCG. The response surface plots of SD and Ym have different shapes within the explored range (Figure 3 and Figure 4). These plots clearly show that adding NaOH up to a certain concentration increases both SD and Ym. However, a further increase in NaOH concentration has a negative effect on Ym and a positive effect on SD. These observations can also be made by comparing the observed SD and Ym values of SCG pretreated at the same temperatures but with different NaOH doses (Table 3).
The negative effect of high NaOH concentration on Ym may be related to the inhibition of methanogenic activity [13]. One concern regarding pretreatment methods that use strong alkalis is the inhibitory effect of salt stress caused by the addition of alkali (for pretreatment) and acid (for pH neutralization) on methanogenesis [17]. It has been reported that Na+ concentrations higher than 3 g/L are highly toxic for methanogens [18,19]. This may explain part of the decrease in Ym with the increase in NaOH concentration in the higher-dose region (>0.13 M NaOH or 3.0 g Na+/L) despite the availability of greater amounts of soluble organics for microbial utilization (i.e., higher SD) in this region (Figure 3 and Figure 4). The bulk Na+ concentration in SCG pretreated with 0.2 M NaOH at the end of the BMP test was up to 2.2 g/L (data not shown). Although this concentration is less than 3.0 g/L, it is sufficiently high to be potentially inhibitory for methanogens. Additionally, the Ym of SCG pretreated with the same NaOH doses but at different temperatures were different (Table 3). This suggests that there are temperature-related factors that negatively affect the Ym at higher temperatures. Thermochemical hydrolysis of lignocellulosic biomass produces different types of inhibitory substances [6]. Hemicellulose sugars may be converted to inhibitory forms, such as furfural and hydroxymethyl-furfural, particularly at high temperatures [20,21]. In addition, inhibitory aromatic, polyaromatic, phenolic, and aldehydic compounds may be released from the lignin fraction [21]. The combined adverse effect of high NaOH dose and temperature is clearly seen in the upper right region of the Ym response surface plot (Figure 4). In a recent study, alkaline pretreatment of SCG was performed using NaOH doses of 2–8% of the substrate on a dry weight basis (100 g of SCG was suspended in 100 mL NaOH solution of different molarities in the range of 0.19–0.74 M) for 24 h [22]. There was no inhibitory effect of NaOH, within the tested concentration range, and the maximum Ym was obtained for SCG pretreated with the highest NaOH dose. This supports our observation that the negative effect of alkaline pretreatment becomes more pronounced when it is combined with thermal pretreatment. Additionally, these results are supported by the observation of the maximum Ym response in the mid-temperature region (Figure 4).

3.5. Microbial Community Structure

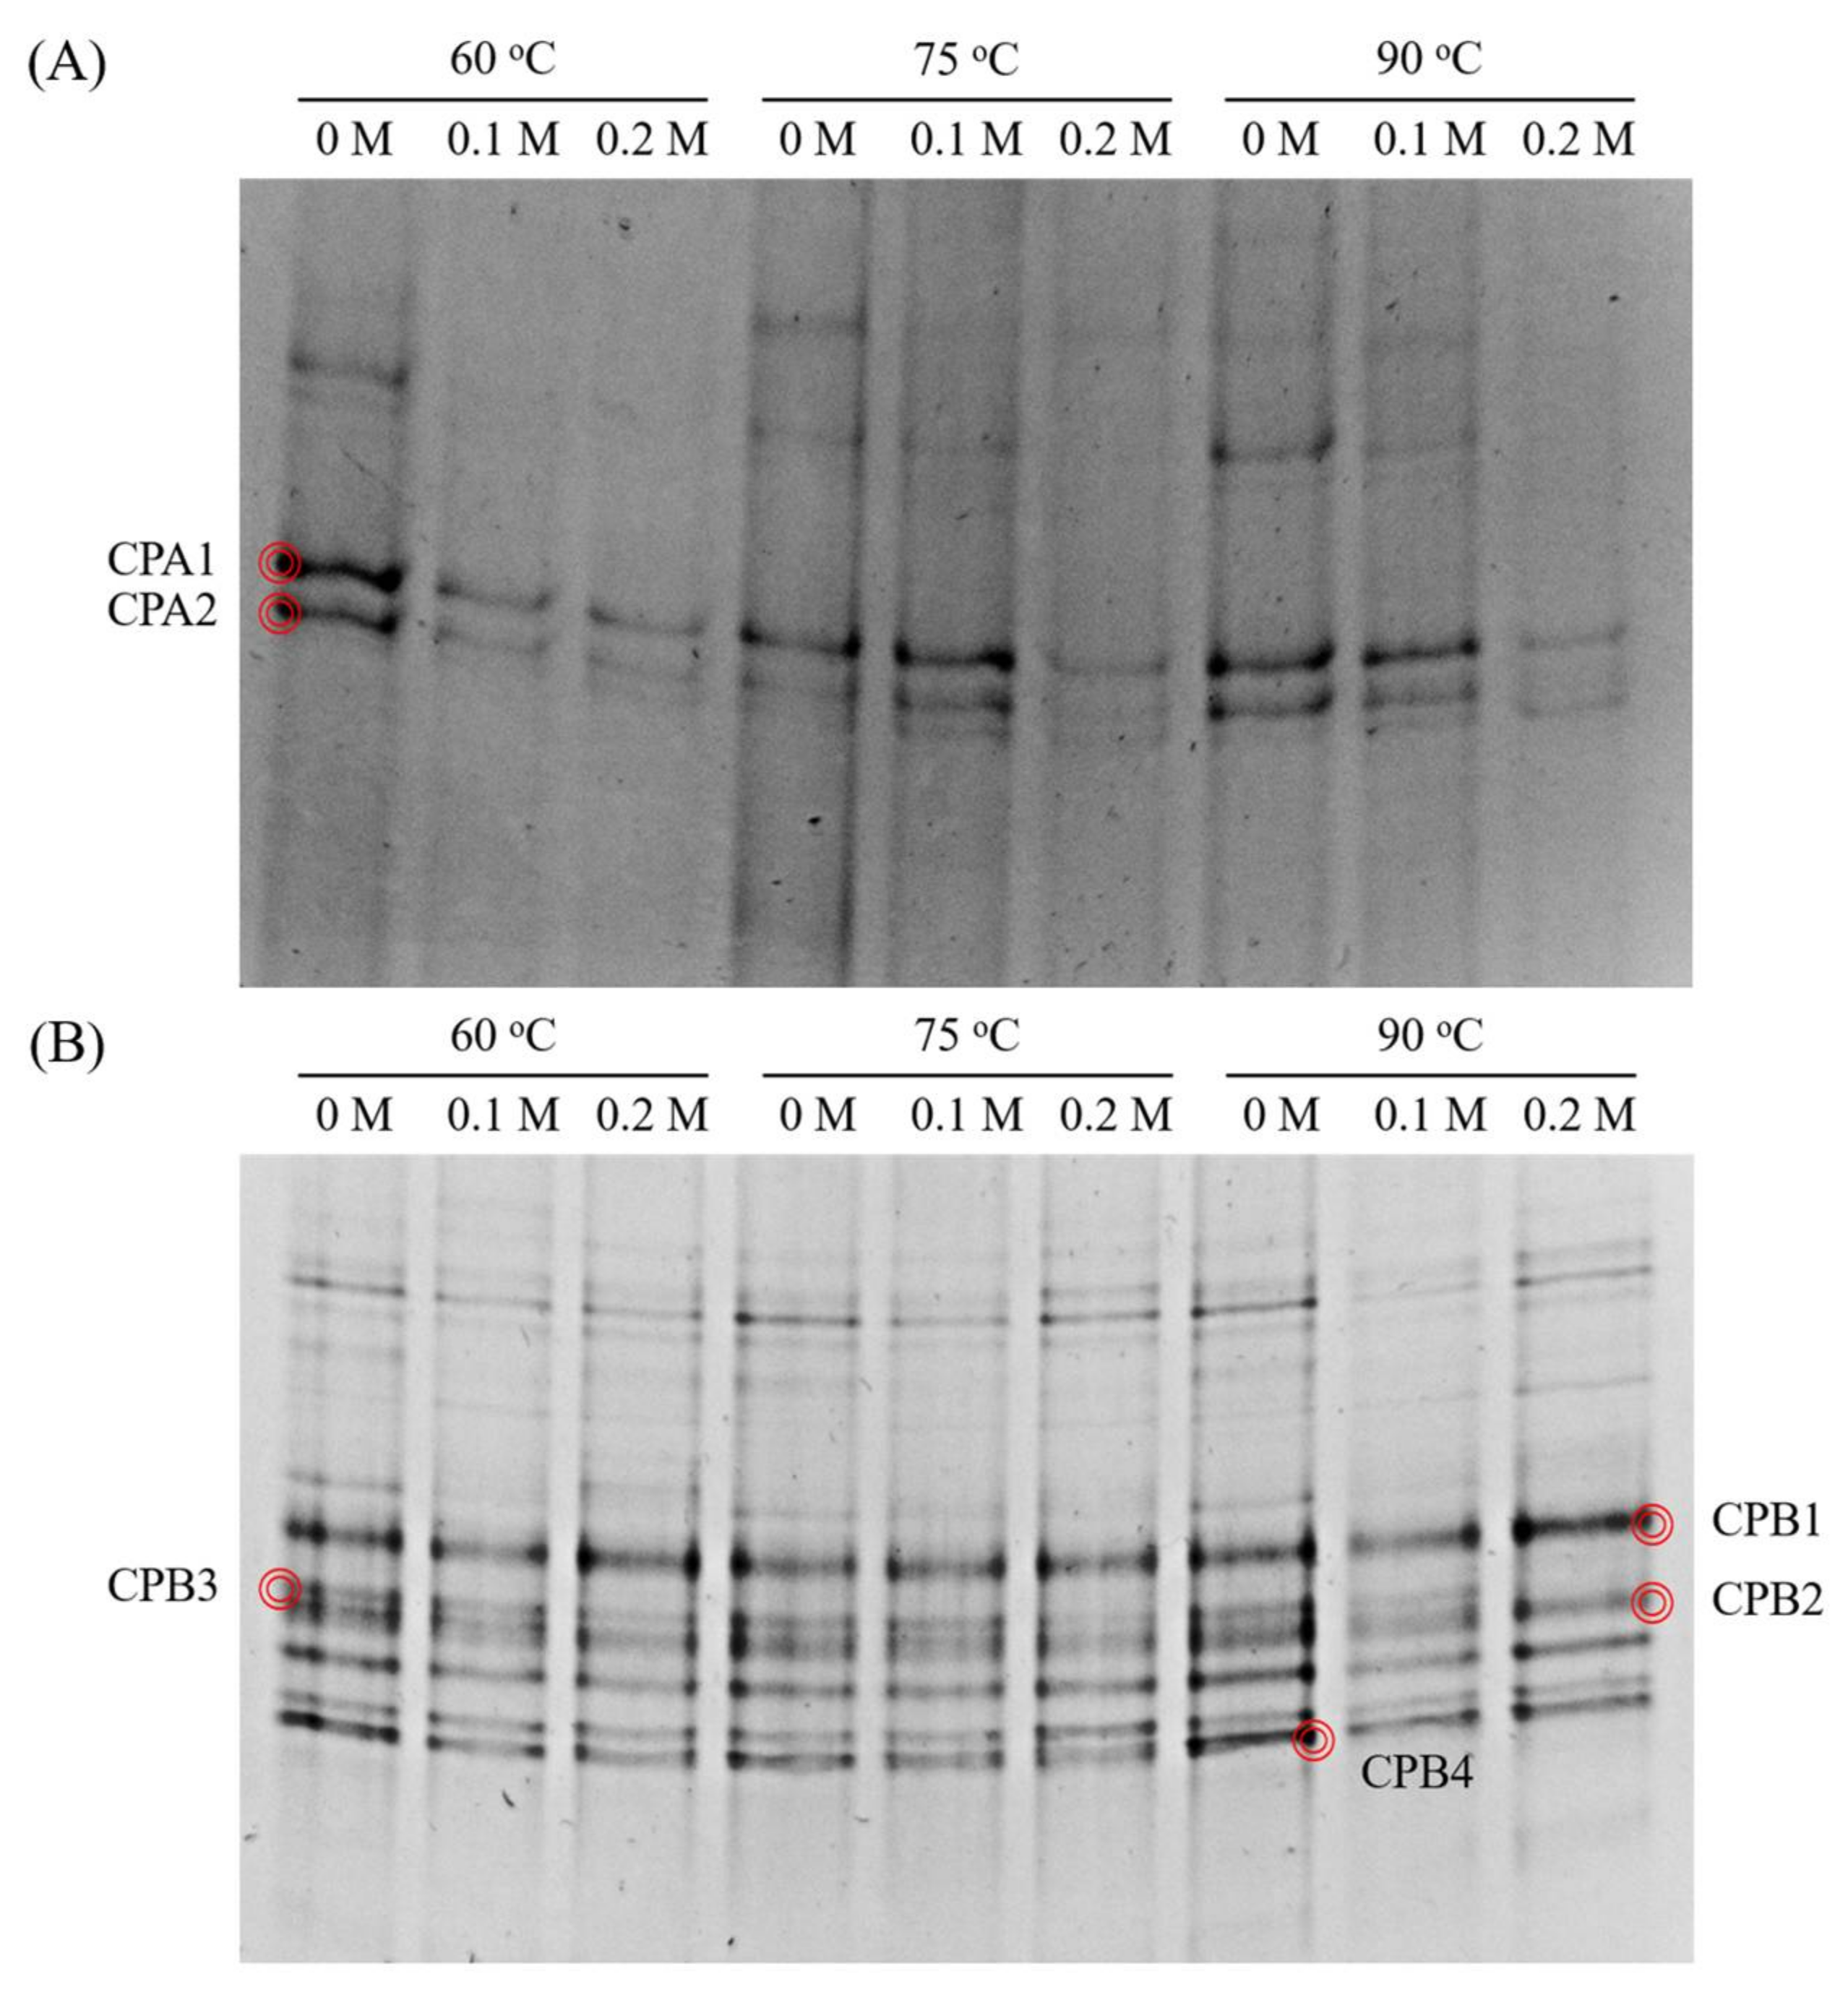
Archaeal and bacterial community structures in the BMP runs were investigated using DGGE at the end of the 30-day incubation period (Figure 5). CPA1 and 2 were the dominant archaeal bands in all runs. Both bands were closely related (≥97% sequence similarity) to several Methanospirillum species (Table 6). Methanogens belonging to the hydrogenotrophic Methanospirillum genus are commonly found in mesophilic AD processes treating different feedstocks [23,24]. The relative band intensities of CPA1 and 2 are significantly higher than those of other bands in all the lanes. Although relative band intensities are not robustly quantitative, this suggests that Methanospirillum species, which correspond to CPA1 and 2 were probably the dominant methanogens and primarily responsible for methane production in all BMP runs regardless of the pretreatment conditions.
Four bacterial bands (CPB1 to 4) of interest were sequenced for phylogenetic analysis, and only one band (CPB2) was closely related to a known species (Table 6). CPB2 showed a high sequence similarity (99.8%) to Petrimonas sulfuriphila, which ferments carbohydrates to produce organic acids (primarily acetate), H2, and CO2 [25]. This suggests that the CPB2-related bacterium was likely involved in the hydrolysis and acidogenic fermentation of carbohydrates in SCG. Similarly, a recent study on the microbial ecology of digesters treating sugar beet tailings reported Petrimonas as a dominant bacterial group [26]. CPB1 and 3 were classified at the family level, whereas CPB4 was not classified even at the phylum level. This indicates that there is still a vast unknown diversity of microorganisms in AD systems. CPB1 was assigned to the family Ruminococcaceae. Bacteria belonging to this family are capable of hydrolyzing and fermenting various polysaccharides, including cellulose, using cellulolytic enzyme complexes and affiliated adhesion proteins [27,28]. CPB3 was assigned to the family Porphyromonadaceae whose members commonly occur and play a central role in fermenting sugars in AD processes [29]. It is likely that the bacteria corresponding to CPB1 and 3 contributed to the hydrolysis and/or fermentation of fibers and sugars during the AD of SCG.
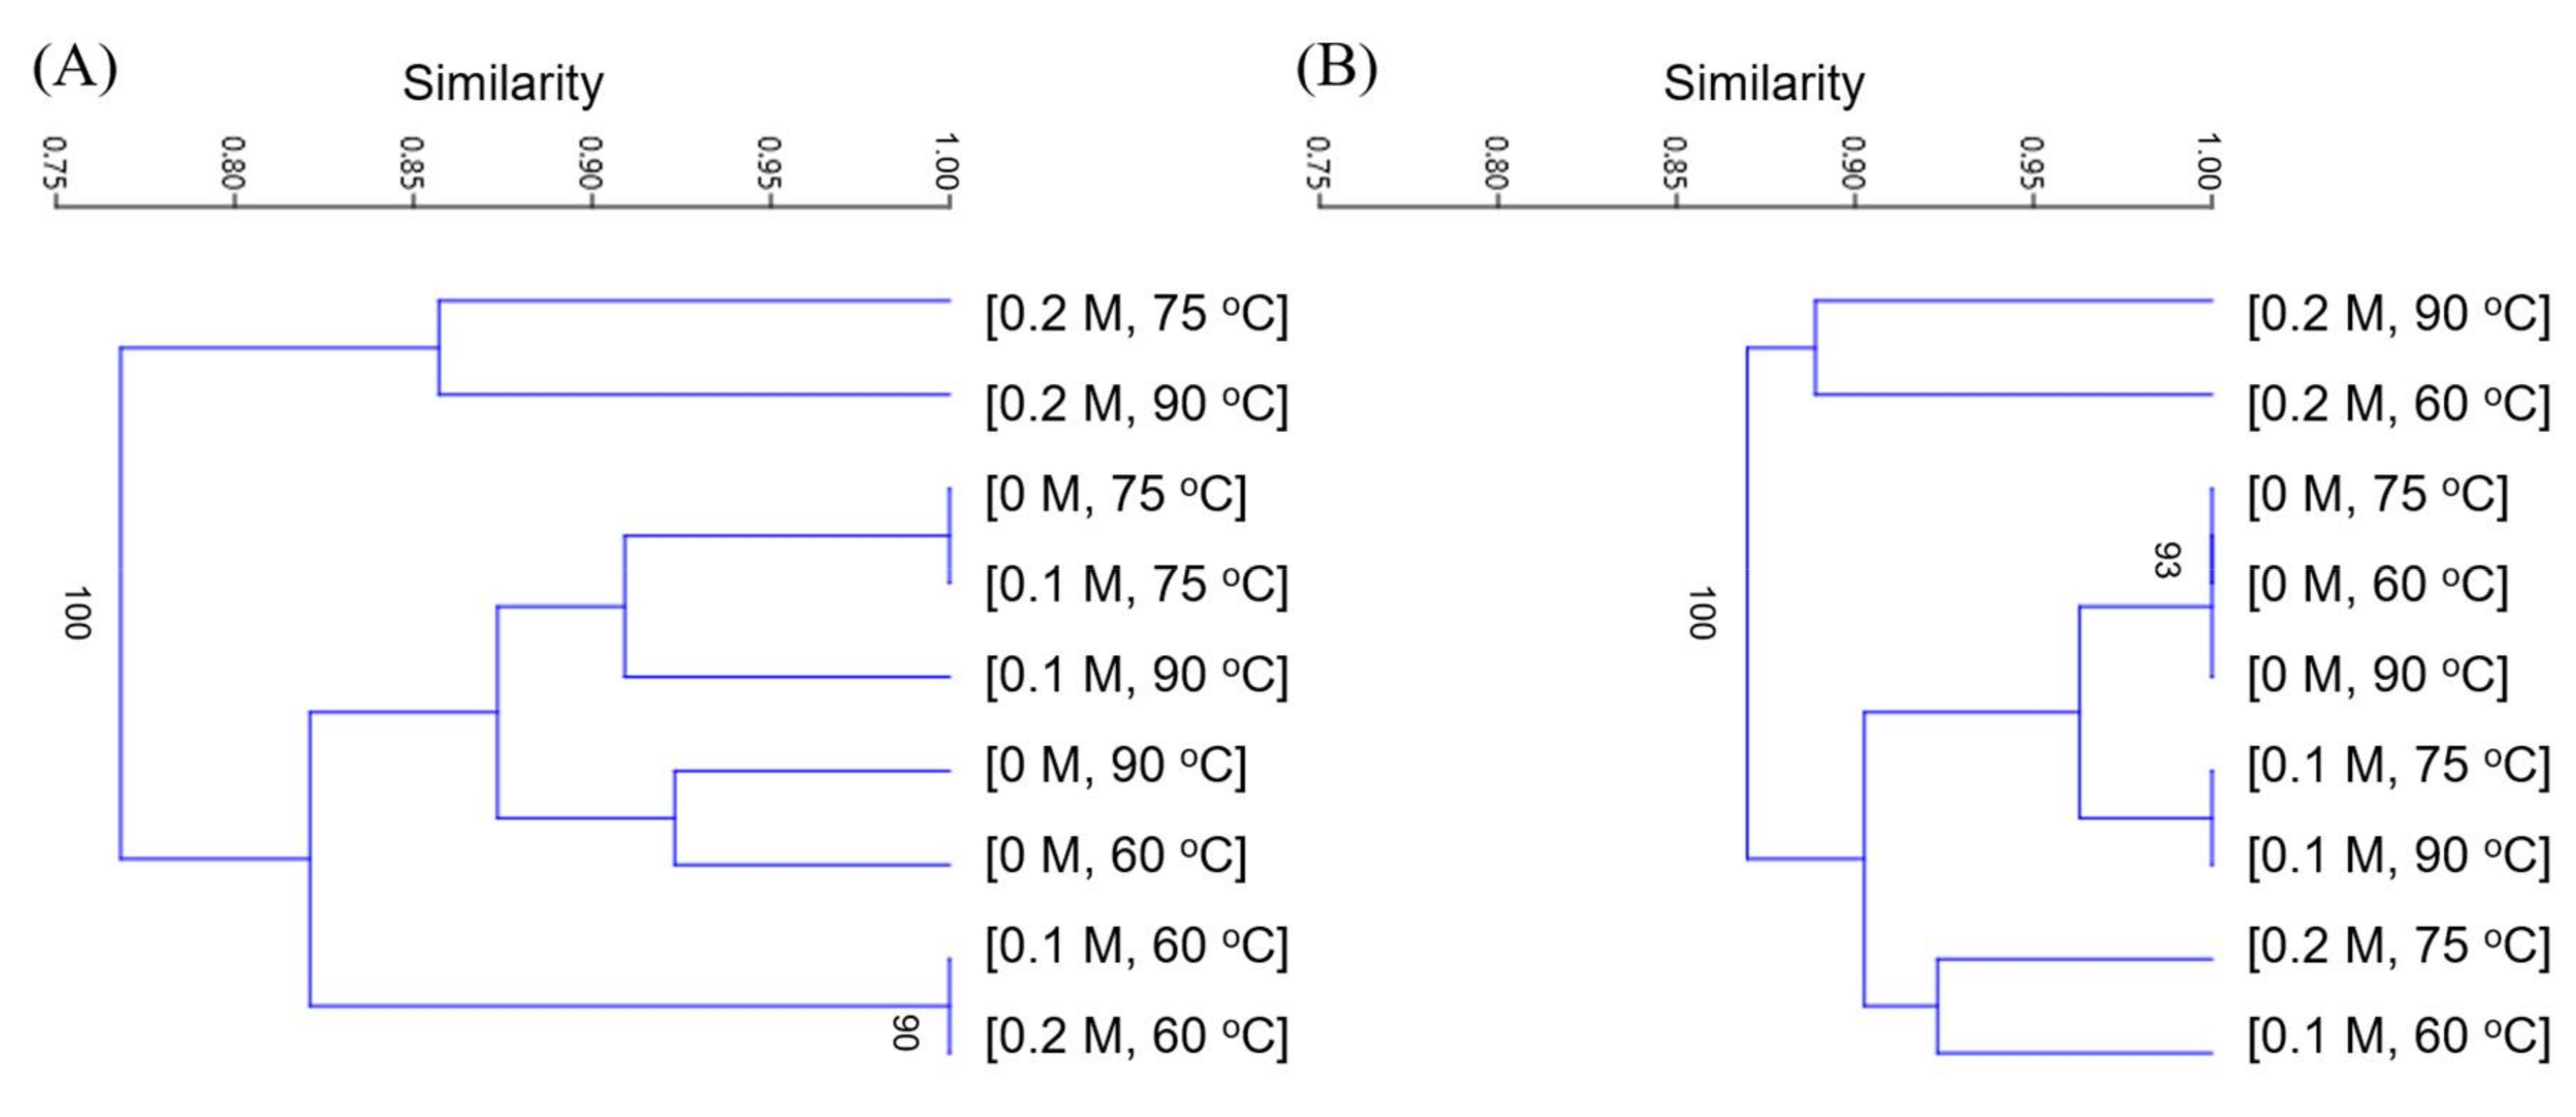
It is worth noting that total band intensity is noticeably lower in the runs with SCG pretreated with higher NaOH concentrations. The total intensity of archaeal bands was particularly low for SCG pretreated with 0.2 M NaOH. However, no significant variation in the total band intensity was observed for bacteria (Figure 5). This suggests that the inhibitory effects of high NaOH concentrations may be more significant on methanogens than on acidogens in the BMP runs. Although band intensity is not a robust quantitative indicator, this may account for part of the apparent discrepancies between SD and Ym (Figure 3 and Figure 4). Interestingly, cluster analysis revealed that the archaeal community structures of Runs 6 and 9 (i.e., higher-NaOH-concentration and higher-temperature runs; Table 2) were significantly different from those of the other runs, while the variations in bacterial community structures of different experimental runs were much less (CDice > 0.85) (Figure 6). Greater variations in the archaeal community structures might in part be attributable to the limited diversity of methanogens in the samples (Figure 5A). Appearance or disappearance of a population (i.e., a DGGE band) can exert a much more significant influence on the similarity calculation for simpler communities than for complex communities.

4. Conclusions

The effects of thermo-alkaline pretreatment on the solubilization and methanation of SCG, at NaOH concentration range of 0–0.2 M and temperature range of 60–90 °C, were examined. Response surface models for SD and Ym were successfully constructed (R2 > 0.85, p < 0.01). The pretreatment method was effective for solubilizing SCG, particularly under high-NaOH-concentration and high-temperature conditions. However, the improved solubilization of SCG was not directly translated into its enhanced methanation because adding NaOH above a certain concentration negatively affected Ym. Additionally, NaOH concentration appeared to exert a significant influence on the development of the methanogen community structure.

Acknowledgments

This research was supported by Korea Institute of Energy Technology Evaluation and Planning (KETEP) through the “Human Resource Program in Energy Technology” (No. 20164030201010) funded by the Ministry of Trade, Industry and Energy, Republic of Korea and the Basic Science Research Program through the National Research Foundation of Korea (NRF) funded by the Ministry of Education, Republic of Korea (No. 2016R1A6A3A11934571).

Author Contributions

Danbee Kim and Jaai Kim designed and performed the experiment, with advice from Changsoo Lee. Danbee Kim and Changsoo Lee wrote the paper. Changsoo Lee supervised the preparation of the manuscript. All authors have approved the final manuscript.

Conflicts of Interest

The authors declare no conflicts of interest.

References

  1. Vardon, D.R.; Moser, B.R.; Zheng, W.; Witkin, K.; Evangelista, R.L.; Strathmann, T.J.; Rajagopalan, K.; Sharma, B.K. Complete utilization of spent coffee grounds to produce biodiesel, bio-oil, and biochar. ACS Sustain. Chem. Eng. 2013, 1, 1286–1294. [Google Scholar] [CrossRef]
  2. Silva, M.A.; Nebra, S.A.; Machado Silva, M.J.; Sanchez, C.G. The use of biomass residues in the Brazilian soluble coffee industry. Biomass Bioenergy 1998, 14, 457–467. [Google Scholar] [CrossRef]
  3. Chang, S.-T. Overview of mushroom cultivation and utilization as functional foods. In Mushrooms as Functional Foods; Cheung, P.C.K., Ed.; John Wiley & Sons, Inc: Hoboken, NJ, USA, 2008; pp. 1–33. [Google Scholar]
  4. Qiao, W.; Takayanagi, K.; Niu, Q.; Shofie, M.; Li, Y.Y. Long-term stability of thermophilic co-digestion submerged anaerobic membrane reactor encountering high organic loading rate, persistent propionate and detectable hydrogen in biogas. Bioresour. Technol. 2013, 149, 92–102. [Google Scholar] [CrossRef] [PubMed]
  5. Kim, J.; Kim, H.; Lee, C. Ulva biomass as a co-substrate for stable anaerobic digestion of spent coffee grounds in continuous mode. Bioresour. Technol. 2017, 241, 1182–1190. [Google Scholar] [CrossRef] [PubMed]
  6. Amin, F.R.; Khalid, H.; Zhang, H.; u Rahman, S.; Zhang, R.; Liu, G.; Chen, C. Pretreatment methods of lignocellulosic biomass for anaerobic digestion. AMB Express 2017, 7, 72. [Google Scholar] [CrossRef] [PubMed]
  7. Hassan, M.; Ding, W.; Bi, J.; Mehryar, E.; Talha, Z.A.A.; Huang, H. Methane enhancement through oxidative cleavage and alkali solubilization pre-treatments for corn stover with anaerobic activated sludge. Bioresour. Technol. 2016, 200, 405–412. [Google Scholar] [CrossRef] [PubMed]
  8. Zheng, Y.; Zhao, J.; Xu, F.; Li, Y. Pretreatment of lignocellulosic biomass for enhanced biogas production. Prog. Energy Combust. Sci. 2014, 42, 35–53. [Google Scholar] [CrossRef]
  9. Fernández-Cegrí, V.; Raposo, F.; de la Rubia, M.; Borja, R. Effects of chemical and thermochemical pretreatments on sunflower oil cake in biochemical methane potential assays. J. Chem. Technol. Biotechnol. 2013, 88, 924–929. [Google Scholar] [CrossRef]
  10. Battista, F.; Fino, D.; Mancini, G. Optimization of biogas production from coffee production waste. Bioresour. Technol. 2016, 200, 884–890. [Google Scholar] [CrossRef] [PubMed]
  11. Kim, J.; Yu, Y.; Lee, C. Thermo-alkaline pretreatment of waste activated sludge at low-temperatures: Effects on sludge disintegration, methane production, and methanogen community structure. Bioresour. Technol. 2013, 144, 194–201. [Google Scholar] [CrossRef] [PubMed]
  12. Wilson, C.A.; Novak, J.T. Hydrolysis of macromolecular components of primary and secondary wastewater sludge by thermal hydrolytic pretreatment. Water Res. 2009, 43, 4489–4498. [Google Scholar] [CrossRef] [PubMed]
  13. Jung, H.; Baek, G.; Kim, J.; Shin, S.G.; Lee, C. Mild-temperature thermochemical pretreatment of green macroalgal biomass: Effects on solubilization, methanation, and microbial community structure. Bioresour. Technol. 2016, 199, 326–335. [Google Scholar] [CrossRef] [PubMed]
  14. Yu, Y.; Lee, C.; Kim, J.; Hwang, S. Group-specific primer and probe sets to detect methanogenic communities using quantitative real-time polymerase chain reaction. Biotechnol. Bioeng. 2005, 89, 670–679. [Google Scholar] [CrossRef] [PubMed]
  15. APHA-AWWA-WEF. Standard Methods for the Examination of Water and Wastewater, 21st ed.; American Public Health Association: Washington, DC, USA, 2005. [Google Scholar]
  16. Tyagi, V.K.; Lo, S.-L. Enhancement in mesophilic aerobic digestion of waste activated sludge by chemically assisted thermal pretreatment method. Bioresour. Technol. 2012, 119, 105–113. [Google Scholar] [CrossRef] [PubMed]
  17. Li, H.; Li, C.; Liu, W.; Zou, S. Optimized alkaline pretreatment of sludge before anaerobic digestion. Bioresour. Technol. 2012, 123, 189–194. [Google Scholar] [CrossRef] [PubMed]
  18. Feijoo, G.; Soto, M.; Méndez, R.; Lema, J.M. Sodium inhibition in the anaerobic digestion process: Antagonism and adaptation phenomena. Enzyme Microb. Technol. 1995, 17, 180–188. [Google Scholar] [CrossRef]
  19. Manu, B.; Chaudhari, S. Anaerobic decolorisation of simulated textile wastewater containing azo dyes. Bioresour. Technol. 2002, 82, 225–231. [Google Scholar] [CrossRef]
  20. Larsson, S.; Palmqvist, E.; Hahn-Hägerdal, B.; Tengborg, C.; Stenberg, K.; Zacchi, G.; Nilvebrant, N.-O. The generation of fermentation inhibitors during dilute acid hydrolysis of softwood. Enzyme Microb. Technol. 1999, 24, 151–159. [Google Scholar] [CrossRef]
  21. Harmsen, P.; Huijgen, W.; Bermudez, L.; Bakker, R. Literature Review of Physical and Chemical Pretreatment Processes for Lignocellulosic Biomass; 9085857570; Wageningen UR-Food & Biobased Research: Wageningen, The Netherland, 2010. [Google Scholar]
  22. Girotto, F.; Lavagnolo, M.C.; Pivato, A. Spent coffee grounds alkaline pre-treatment as biorefinery option to enhance their anaerobic digestion yield. Waste Biomass Valoriz. 2017, 1–6. [Google Scholar] [CrossRef]
  23. Wang, P.; Wang, H.; Qiu, Y.; Ren, L.; Jiang, B. Microbial characteristics in anaerobic digestion process of food waste for methane production—A review. Bioresour. Technol. 2017, 248, 29–36. [Google Scholar] [CrossRef] [PubMed]
  24. Kim, J.; Lee, C. Response of a continuous anaerobic digester to temperature transitions: A critical range for restructuring the microbial community structure and function. Water Res. 2016, 89, 241–251. [Google Scholar] [CrossRef] [PubMed]
  25. Grabowski, A.; Tindall, B.J.; Bardin, V.; Blanchet, D.; Jeanthon, C. Petrimonas sulfuriphila gen. Nov., sp. Nov., a mesophilic fermentative bacterium isolated from a biodegraded oil reservoir. Int. J. Syst. Evol. Microbiol. 2005, 55, 1113–1121. [Google Scholar] [CrossRef] [PubMed]
  26. Tian, Z.; Cabrol, L.; Ruiz-Filippi, G.; Pullammanappallil, P. Microbial ecology in anaerobic digestion at agitated and non-agitated conditions. PLoS ONE 2014, 9, e109769. [Google Scholar] [CrossRef] [PubMed]
  27. Morrison, M.; Miron, J. Adhesion to cellulose by ruminococcus albus: A combination of cellulosomes and pil-proteins? FEMS Microbiol. Lett. 2000, 185, 109–115. [Google Scholar] [CrossRef] [PubMed]
  28. Ziganshin, A.M.; Liebetrau, J.; Pröter, J.; Kleinsteuber, S. Microbial community structure and dynamics during anaerobic digestion of various agricultural waste materials. Appl. Microbiol. Biotechnol. 2013, 97, 5161–5174. [Google Scholar] [CrossRef] [PubMed]
  29. Langer, S.G.; Ahmed, S.; Einfalt, D.; Bengelsdorf, F.R.; Kazda, M. Functionally redundant but dissimilar microbial communities within biogas reactors treating maize silage in co-fermentation with sugar beet silage. Microb. Biotechnol. 2015, 8, 828–836. [Google Scholar] [CrossRef] [PubMed]
Figure 1. Cumulative biogas (A) and methane (B) production per gram of substrate COD added in the BMP runs with pretreated SCG. Each curve is labeled with the corresponding pretreatment conditions, i.e., NaOH concentration (M) and temperature (°C).
Energies 11 00865 g001
Figure 2. Normal probability plots for the response surface models of the degree of solubilization (SD) (A) and the methane yield (Ym) (B).
Energies 11 00865 g002
Figure 3. Two-dimensional (A) and three-dimensional (B) contour plots of the response surface for the degree of solubilization (SD). The cross mark indicates the point of the maximum SD response.
Energies 11 00865 g003
Figure 4. Two-dimensional (A) and three-dimensional (B) contour plots of the response surface for methane yield (Ym). The cross mark indicates the point of the maximum Ym response.
Energies 11 00865 g004
Figure 5. DGGE profiles of archaeal (A) and bacterial (B) 16S rRNA gene PCR fragments from the BMP runs with pretreated SCG. Each lane is labeled with the corresponding pretreatment conditions, i.e., NaOH concentration (M) and temperature (°C).
Energies 11 00865 g005
Figure 6. Cluster dendrograms constructed based on the archaeal (A) and bacterial (B) DGGE profiles. Each community profile is labeled with the corresponding pretreatment conditions, i.e., NaOH concentration (M) and temperature (°C). Bootstrap values higher than 80% (1000 replicates) are shown.
Energies 11 00865 g006
Table 1. Physicochemical characteristics of the spent coffee grounds used in this study.
ParameterUnitValue a
Total CODmg/L20951.0 (570.6)
Soluble CODmg/L714.9 (0.9)
Total solidsmg/L13,550.0 (70.7)
Volatile solidsmg/L13,350.0 (70.7)
Carbon%54.3 (0.1)
Hydrogen%7.4 (0.1)
Nitrogen%2.1 (0.1)
Sulfur%0
Oxygen%36.9 (0.4)
pH 5.91
a Standard deviations are in parentheses.
Table 2. Experimental design for response surface analysis.
RunNaOH (M)Temperature (°C)
CodedActualCodedActual
1–10–160
200.1–160
310.2–160
4–10075
5 a00.1075
610.2075
7–10190
800.1190
910.2190
a Center point was replicated five times.
Table 3. Observed data from the experimental trials for response surface analysis.
RunDegree of Solubilization (%)Methane Yield (mL CH4/g COD added) b
11.0155.1
225.1240.3
330.0235.7
42.2201.4
5 a26.8 (1.7)254.0 (17.5)
631.8253.2
72.9173.8
831.9246.1
935.1151.9
a Center point was replicated five times. b Standard deviations are in parentheses.
Table 4. Statistical significance of the model coefficients for predicting the response of the degree of solubilization (SD).
TermsThermo-Alkaline Pretreatment (NaOH)
CoefficientF-Valuep-Value
Intercept26.99--
Xn15.14585.79<0.0001
Xt2.313.570.0078
XnXt0.831.170.3153
Xn2–10.5129.6<0.0001
Xt21.021.210.307
Modelp-valueR2AP
Regression<0.00010.990733.515
Lack-of-fit0.6121--
Table 5. Statistical significance of the model coefficients for predicting the response of the methane yield (Ym).
TermsThermo-Alkaline Pretreatment (NaOH)
CoefficientF-Valuep-Value
Intercept259.12--
Xn18.44.980.0608
Xt–9.911.450.2683
XnXt–25.626.440.0388
Xn2–44.7313.560.0078
Xt2–28.825.630.0495
Modelp-valueR2AP
Regression0.00670.86027.848
Lack-of-fit0.2939--
Table 6. Phylogenetic affiliation of archaeal and bacterial 16S rRNA gene sequences retrieved from the DGGE bands.
BandClosest SpeciesSimilarity (%)Accession No.Classification a
Archaea
 CPA1Methanospirillum hungatei strain JF-197.8CP000254Methanospirillum
Methanospirillum lacunae strain Ki8-197.8NR_112981
Methanospirillum stamsii strain ps97.8NR_117705
 CPA2Methanospirillum stamsii strain ps 16S98.2NR_117705Methanospirillum
Methanospirillum lacunae strain Ki8-198.2NR_112981
Methanospirillum hungatei strain JF-198.2CP000254
Bacteria
 CPB1Clostridiales bacterium clone 1G04492.2JN713505Ruminococcaceae
Uncultured bacterium clone B36100.0HM066994
Uncultured bacterium clone 12Bac R899.8JF421649
 CPB2Petrimonas sulfuriphila strain BN399.8NR_042987Petrimonas
 CPB3Proteiniphilum acetatigenes strain TB10790.5NR_043154Porphyromonadaceae
Uncultured bacterium clone LC599.6FJ982805
Uncultured bacterium clone 5Bac R899.6JF421645
 CPB4Egibacter rhizosphaerae strain EGI 8075988.6NR_147752Bacteria
Uncultured Firmicutes bacterium clone B5100.0AB721095
Uncultured Firmicutes bacterium clone QEEA1DA02100.0CU918783
a The lowest rank assigned by the RDP Classifier at a bootstrap confidence threshold of 80%.