Abstract
Every country in the world is striving to deal with climate change such as global warming and environmental pollution caused by greenhouse gas emission as well as the depletion of fossil fuel including oil, coal, gas, etc. Countries have set long-term greenhouse gas emission reduction targets in this effort. Korea announced its goal to reduce the national greenhouse gas in medium- and long-term by 25.7% of the observed value of 2030 greenhouse gas emission (BAU) in 2011, and set to reduce the greenhouse gas by 18.2% in the building sector. In addition, according to IPCC (Intergovernmental Panel on Climate Change), greenhouse gas emission in the building sector takes up about 19% of entire emission, a very high percentage along with 31% from the industry sector. This paper calculates the national and building sector greenhouse gas emission based on energy consumption statistics, in order for Korea to achieve Post-2020 greenhouse gas reduction target, predict building sector’s greenhouse gas emission, and implement and reduction policy. The greenhouse gas emission from buildings is about 124.9 million ton CO2equivalent as of 2015, taking up about 20% of greenhouse gas emission in Korea’s entire sectors, and decreased in 1998 from 105.0 million ton CO2eq in 1997. However, the greenhouse gas emission consistently increased from 119.3 million ton CO2eq in 2007 to 127.1 million ton CO2eq in 2010 and 127.3 million ton CO2eq in 2013.
1. Introduction
The “Paris Agreement” was adopted as a new climate agreement in the 21st Climatic Change Convention (COP 21), which was held in Paris, France recently (UN, 2015) [1]. As an agreement switching from the existing Kyoto Protocol to the New Climate System (Post 2020), the Paris Agreement aims to maintain the average increase of global temperature below 2 °C, compared to pre-industrialization. This is very important because all nations must contribute to greenhouse gas reduction to prevent climate change with emphasis on leading roles by developed countries.
According to the Intended Nationally Determined Contribution (INDC), Korea submitted its plan to the UN to reduce greenhouse gas emission by 37% of the observed value (850.6 million ton CO2eq) in all economic sectors. Before then, Korea announced that it aims to reduce the national greenhouse gas in medium- and long-term by 25.7% (219 million ton CO2eq) of the observed value of 2030 greenhouse gas emission (BAU) in 2011, and set to reduce the greenhouse gas by 18.2% (35.8 million ton CO2eq) in the building sector [2]. Since it is difficult to reduce greenhouse gas in the industry sector, which has the highest greenhouse gas emission, due to conflicts of interest, it is very important to make efforts to reduce greenhouse gas in the building sector.
Since Korea’s building energy is increasing rapidly and has much more room to be reduced than other industries, the building sector’s greenhouse gas reduction is treated as the core research for development of national greenhouse gas reduction plan.
Asia including Korea was recommended to reduce greenhouse gas emission by 30–50% from 2010 by 2050, and the countries proposed policy implementations such as energy standard improvement and cooling/healing energy reduction in the building sector [3].
For Korea to meet international agreement standards such as the Climate Change Convention and the Post-2020 greenhouse gas reduction target, the building sector’s energy and greenhouse gas emission must be identified and the characteristics must be analyzed. Through this, a standardized DB (Database) that can reflect the greenhouse gas emission characteristics of the domestic building sector by energy source and region can be built, to develop the building sector’s medium- and long-term greenhouse gas reduction potential model and a reduction roadmap.
The purpose of this study is to calculate and analyze greenhouse gas emission in Korean buildings using the calculation methodology that meets the international standard shown Figure 1.
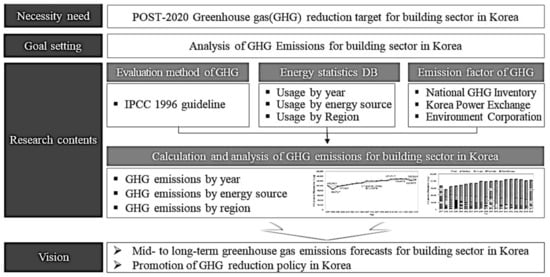
Figure 1.
Research process.
2. Trend Analysis of Greenhouse Gas (GHG) Emission
2.1. Policy and Status Analysis
According to the 5th IPCC report, the industry sector (31%) and the building sector (19%) take up the highest percentage in the entire greenhouse gas emission. The report also projected that the building sector has the highest potential of energy efficiency, as it would require the lowest cost of greenhouse gas reduction over the next 20–30 years [4]. An IEA report (2012) states that the building sector takes up 19% of the global greenhouse gas emission, and black carbon emission takes up 1/3. More specifically, the global greenhouse gas emission from buildings in the world is 9.2 Giga-ton CO2eq as of 2010. Direct emission from fossil fuel is 3.2 Giga-ton CO2eq, and indirect gas emission from electric power consumption, etc. is 6.02 Giga-ton CO2eq, showing a rapid increase [5].
Greenhouse emitted from Korea’s industry, building, transport, and public sector was 296.1 million metric tons CO2eq in 1990, 559.5 million metric tons CO2eq in 2003, and 694.5 million metric tons CO2eq in 2013, as shown Figure 2. Greenhouse gas emission is divided into the industry sector (67%) (average), building sector (12%) (average), transportation sector (19%) (average), and public sector (1.2%) (average). To achieve greenhouse gas reduction in the building sector by 2020, Korea announced to reduce air-conditioning and heating energy consumption in new houses by 60% from 2017 and to make energy housing compulsory for new structures from 2025 [6]. Most developed countries have declared to require the distribution of zero-energy housing by around 2020 (EU: 2021; UK: 2016; and U.S.: 2030), and are formulating a roadmap to execute in cooperation with policy, technology, and market. About 38% (as of 2013) of the UK’s greenhouse gas is emitted from the building sector, and the UK is striving to improve energy efficiency in buildings. According to research, improving energy efficiency in the residential sector not only reduces energy demand but also decreases its energy cost and improves public healthcare and welfare [7]. To achieve the distribution of zero-energy buildings, UK’s Department of Energy and Climate Change (DECC) has identified energy consumption by region, which is used by the government to manage the domestic energy consumption.
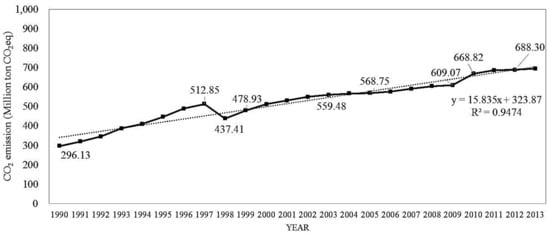
Figure 2.
Total greenhouse gas emission in all sectors of Korea.
The U.S. Energy Information Administration (EIA) publishes energy statistics data such as Residential Energy Consumption Survey (RECS) and the Commercial Buildings Energy Consumption Survey (CBECS) every four years to examine the characteristics of energy consumption and expenditure in each building by natural gas, electricity, oil, LPG, and kerosene. In the U.S., greenhouse gas emission from the building sector was 2358 million metric tons CO2eq, which was 45% of the entire domestic greenhouse gas emission and a greater amount of emission than that of other countries except China. Research shows that most greenhouse gas emission was from the combustion of fossil fuel to supply electric power to air-conditioning, heating, lighting, and electricity equipment in buildings [8].
2.2. Preliminary Research
Kim et al. [9] calculated greenhouse gas emission by the purpose, type, and constructed year of buildings based on the National Energy Survey, and found that greenhouse gas emission from electric power and urban gas took up the highest proportion in most buildings. There was also greenhouse gas emission from briquette and other oil in a small amount and the characteristics by building varied. Cho et al. [10] analyzed the status and characteristics of greenhouse gas emission by the purpose and form of buildings using the energy consumption of the integrated energy management system in state buildings. Rui Jiang et al. [11] tried to calculate life-cycle carbon emission, analyze influencing factors of carbon emission, and assess the delinking index of carbon emission in China’s building sector. In China’s building industry, the total carbon emission increased from 984.69 million tons of CO2 in 2005 to 3753.98 million tons of CO2 in 2013. Jeong [12] analyzed potential energy savings and reduction in CO2 emissions which were provided by Korea’s residential building energy efficiency policies and plans.
Airaksinen et al. [13] studied a new office building in design phase and offered different alternatives to influence building energy consumption, CO2equivalent emissions of embodied energy from building materials, and CO2equivalent emissions from energy use as well as their relationships. Lin et al. [14] provided an assessment of the potential of CO2 mitigation in buildings by conducting an empirical research on the determinants of building energy-related CO2 emissions. This study filled the research gap by investigating economic factors that determined energy-related CO2 emissions in China’s commercial and residential buildings.
Kavgic, M. et al. [15] briefly described bottom-up and top-down methods and an overview of common bottom-up modeling techniques (based on statistical and building physics), while critically analyzing the existing bottom-up building physics based residential energy models.
Calise, F. et al. [16] analyzed possible decarbonization scenarios in Italy for the year 2050 and envisaged high electrification of transports and residential buildings, high use of renewable energies, and a modal shift towards public transport. Li, K. et al. [17] presented an efficient optimization framework to facilitate optimization designs with the aid of commercial simulation software and MATLAB. The performances of three optimization strategies, including the proposed approach, GenOpt method and artificial neural network (ANN) method, are investigated using a case study of a simple building energy model.
Astiaso Garcia, D. et al. [18] provided preliminary information about economic costs and energy consumption reductions (benefits) of some considered interventions in existing public buildings. Methods included an analysis of some feasible interventions in four selected public buildings. Energy efficiency improvements were assessed for each feasible intervention.
3. Calculation of Greenhouse Gas Emission
3.1. Calculation Method
Greenhouse gas emission is calculated to measure its emission and absorption based on the greenhouse gas inventory calculation or the international calculation method. This study calculated greenhouse gas emission using the calculation formula based on the consumption by energy source. Calculation method (formula), activity materials, emission and absorption coefficients, etc. are needed, and calculation ratings are divided from Tier 1 to Tier 3 depending on the calculation method. The calculation methods of international greenhouse gas emission include IPCC 1996 [19] and IPCC 2006 guideline [20], ISO 14064 [21], KS Q ISO 14064-1 [22], and GHG Protocol (WRI/WBCSD) guideline [23]. Korea has 2006 IPCC Guidelines for National Greenhouse Gas Inventories [24] and Guidelines on the Operation of Greenhouse Gas/Energy Target Management System by the Ministry of Environment (Announcement No. 2011-29) [25]. IPCC 1996 guideline was applied for the calculation of greenhouse gas emission in the building sector. IPCC 1996 guideline targets all energy sources used in buildings, such as coal, oil, urban gas, electric power, local heating (thermal energy), new and renewable energy, etc., that are directly consumed during the operation of buildings. In addition, the total caloric value by energy source was converted into net calorie value to calculate the greenhouse gas emission. The consumption of new and renewable energy was also included, but was applied emission coefficient “0” to calculate the greenhouse gas emission to emit no greenhouse gas.
The range of greenhouse gas in this study includes six types of greenhouse gas that must be reduced according to “Climatic Change Convention”: Carbon dioxide (CO2), methane (CH4), nitrous oxide (N2O), hydrofluorocarbons (HFCs), perfluorocarbon (PFCs), and sulfur hexafluoride (SF6). In the building sector, greenhouse gas generated by fuel combustion and energy use in buildings, targeting carbon dioxide (CO2), methane (CH4), and nitrous oxide (N2O), must be reduced. Hydrofluorocarbons (HFCs), perfluorocarbon (PFCs), and sulfur hexafluoride (SF6) were excluded from calculation because they are generated from the refrigerant of air conditioners and industry process. This study applied Global Warming Potential (GWP) value on CO2, CH4, and N2O, calculated as CO2equivalent (CO2eq), and applied IPCC basic emission coefficient for the tiers of greenhouse gas emission calculation ratings to follow the methodology of Tier 1. When the nation-specific emission coefficient and caloric value were developed and officially announced, greenhouse gas emission was calculated as Tier 2. Finally, this study applied Equation (1) according to IPCC 1996 guideline and an announcement by the Ministry of Environment in Korea to calculate greenhouse gas emission
- Tier 1:
- Applied basic emission coefficient by fuel and greenhouse gas suggested by IPCC 1996 guideline.
- Tier 2:
- Applied the nation-specific emission coefficient by fuel and greenhouse gas.
- Tier 3:
- Applied emission coefficient developed and recognized by fuel suppliers by users, fuel consumption facility (equipment), etc.Ei,j = ∑{Qi × ECi × EFi,j × fi × Feq.i × K}
- Ei,j: Greenhouse gas (j) emission [ton CO2eq] by fuel (i) combustion;
- Qi: By fuel consumption (L, KWh, TOE, kcal, etc.);
- ECi: by fuel calorie conversion coefficient;
- EFi,j: by fuel greenhouse gas emission coefficient;
- Fi: Oxidation coefficient by fuel;
- Feq.i: CO2, equivalence coefficient (CO2 = 1, CH4 = 21, N2O = 310) by greenhouse gas; and
- K: Unit conversion coefficient.
Conversion coefficient is used to convert calorie by energy source into TOE (ton of oil equivalent), which is the amount equivalent to 1 ton of crude oil (about 107 kcal). Greenhouse gas emission coefficient is the coefficient of greenhouse gas amount by energy source from each unit energy.
Equivalent (Eq) is the short form of equivalent and is a value unifying the amount of greenhouse gas CO2, CH4 (21 times higher than CO2 greenhouse effect), and N2O (310 times higher than CO2 greenhouse effect) into CO2. Oil conversion coefficient is the converted caloric value of 1 kg = 10,000 kcal by energy source (1 TOE = 107 kcal = 104 Mcal).
3.2. Statistics DB of Energy Consumption
To calculate the greenhouse gas emission in Korea’s building sector, energy consumption statistics DB (energy statistical yearbook) [26] was applied. Written based on the monthly production and sales achievements from energy suppliers, energy statistics DB compares and analyzes various factors influencing energy demand and supply to help the Korean government formulate energy policy such as project energy demand and demand, energy saving effect, etc. The study investigated oil products, anthracite, bituminous coal, electric power, natural gas, urban gas, etc. used in each sector from 1997 to 2015 (Table 1) and examined the consumption of energy in the building sector by region (Table 2). The energy consumption in Korea’s building sector in 2015 was 35.4 million TOE (Ton of Oil Equivalent, 1 TOE = 10 Million kcal), 17% of the nationwide energy consumption. As of 2015, the final energy consumption in Korea was 218.61 million TOE, and the final energy consumption per capita was 4.29 TOE, steadily increasing from 1990. Final energy is energy converted for consumers to use, such as oil, coal, urban gas, electric power, etc.

Table 1.
Database of building energy consumption. (Unit: 1000 toe).
Table 2.
Database of building energy consumption by region.
3.3. Selection of Greenhouse Gas Emission Coefficient
This study applied Intergovernmental Panel for Climate Change (IPCC; overseas) and National Greenhouse Gas Inventory (Korea) for greenhouse gas emission coefficient (emission factor) by energy source. The nation-specific emission coefficient can decrease the uncertainty of each nation’s emission and estimate it more accurately than the basic coefficient of IPCC. Korea applied the basic emission coefficient of IPCC because it does not have the nation-specific emission coefficient of methane (CH4) and nitrous oxide (N2O) while it has the nation-specific emission coefficient of carbon dioxide (CO2) by energy source (Table 3).
Table 3.
Database of by energy source emission coefficient.
Korea’s emission coefficient by energy source is consistent for oil, coal, and gas because it mostly uses IPCC’s emission coefficient to calculate the national greenhouse gas inventory. However, the emission coefficient of electric power changes every year by the composition of power generation system (thermal, nuclear, etc.), energy source mix, change of electric power demand, and adoption of new and renewable energy by each nation. Therefore, for the emission coefficient of electric power, this study applied the value calculated through projecting power generation by energy source in Korea and the existing emission coefficient, as shown in Table 4.
Table 4.
Database of by energy source greenhouse gas emission coefficient.
4. Analysis of Greenhouse Gas Emission in Buildings
4.1. Greenhouse Gas Emission by Year
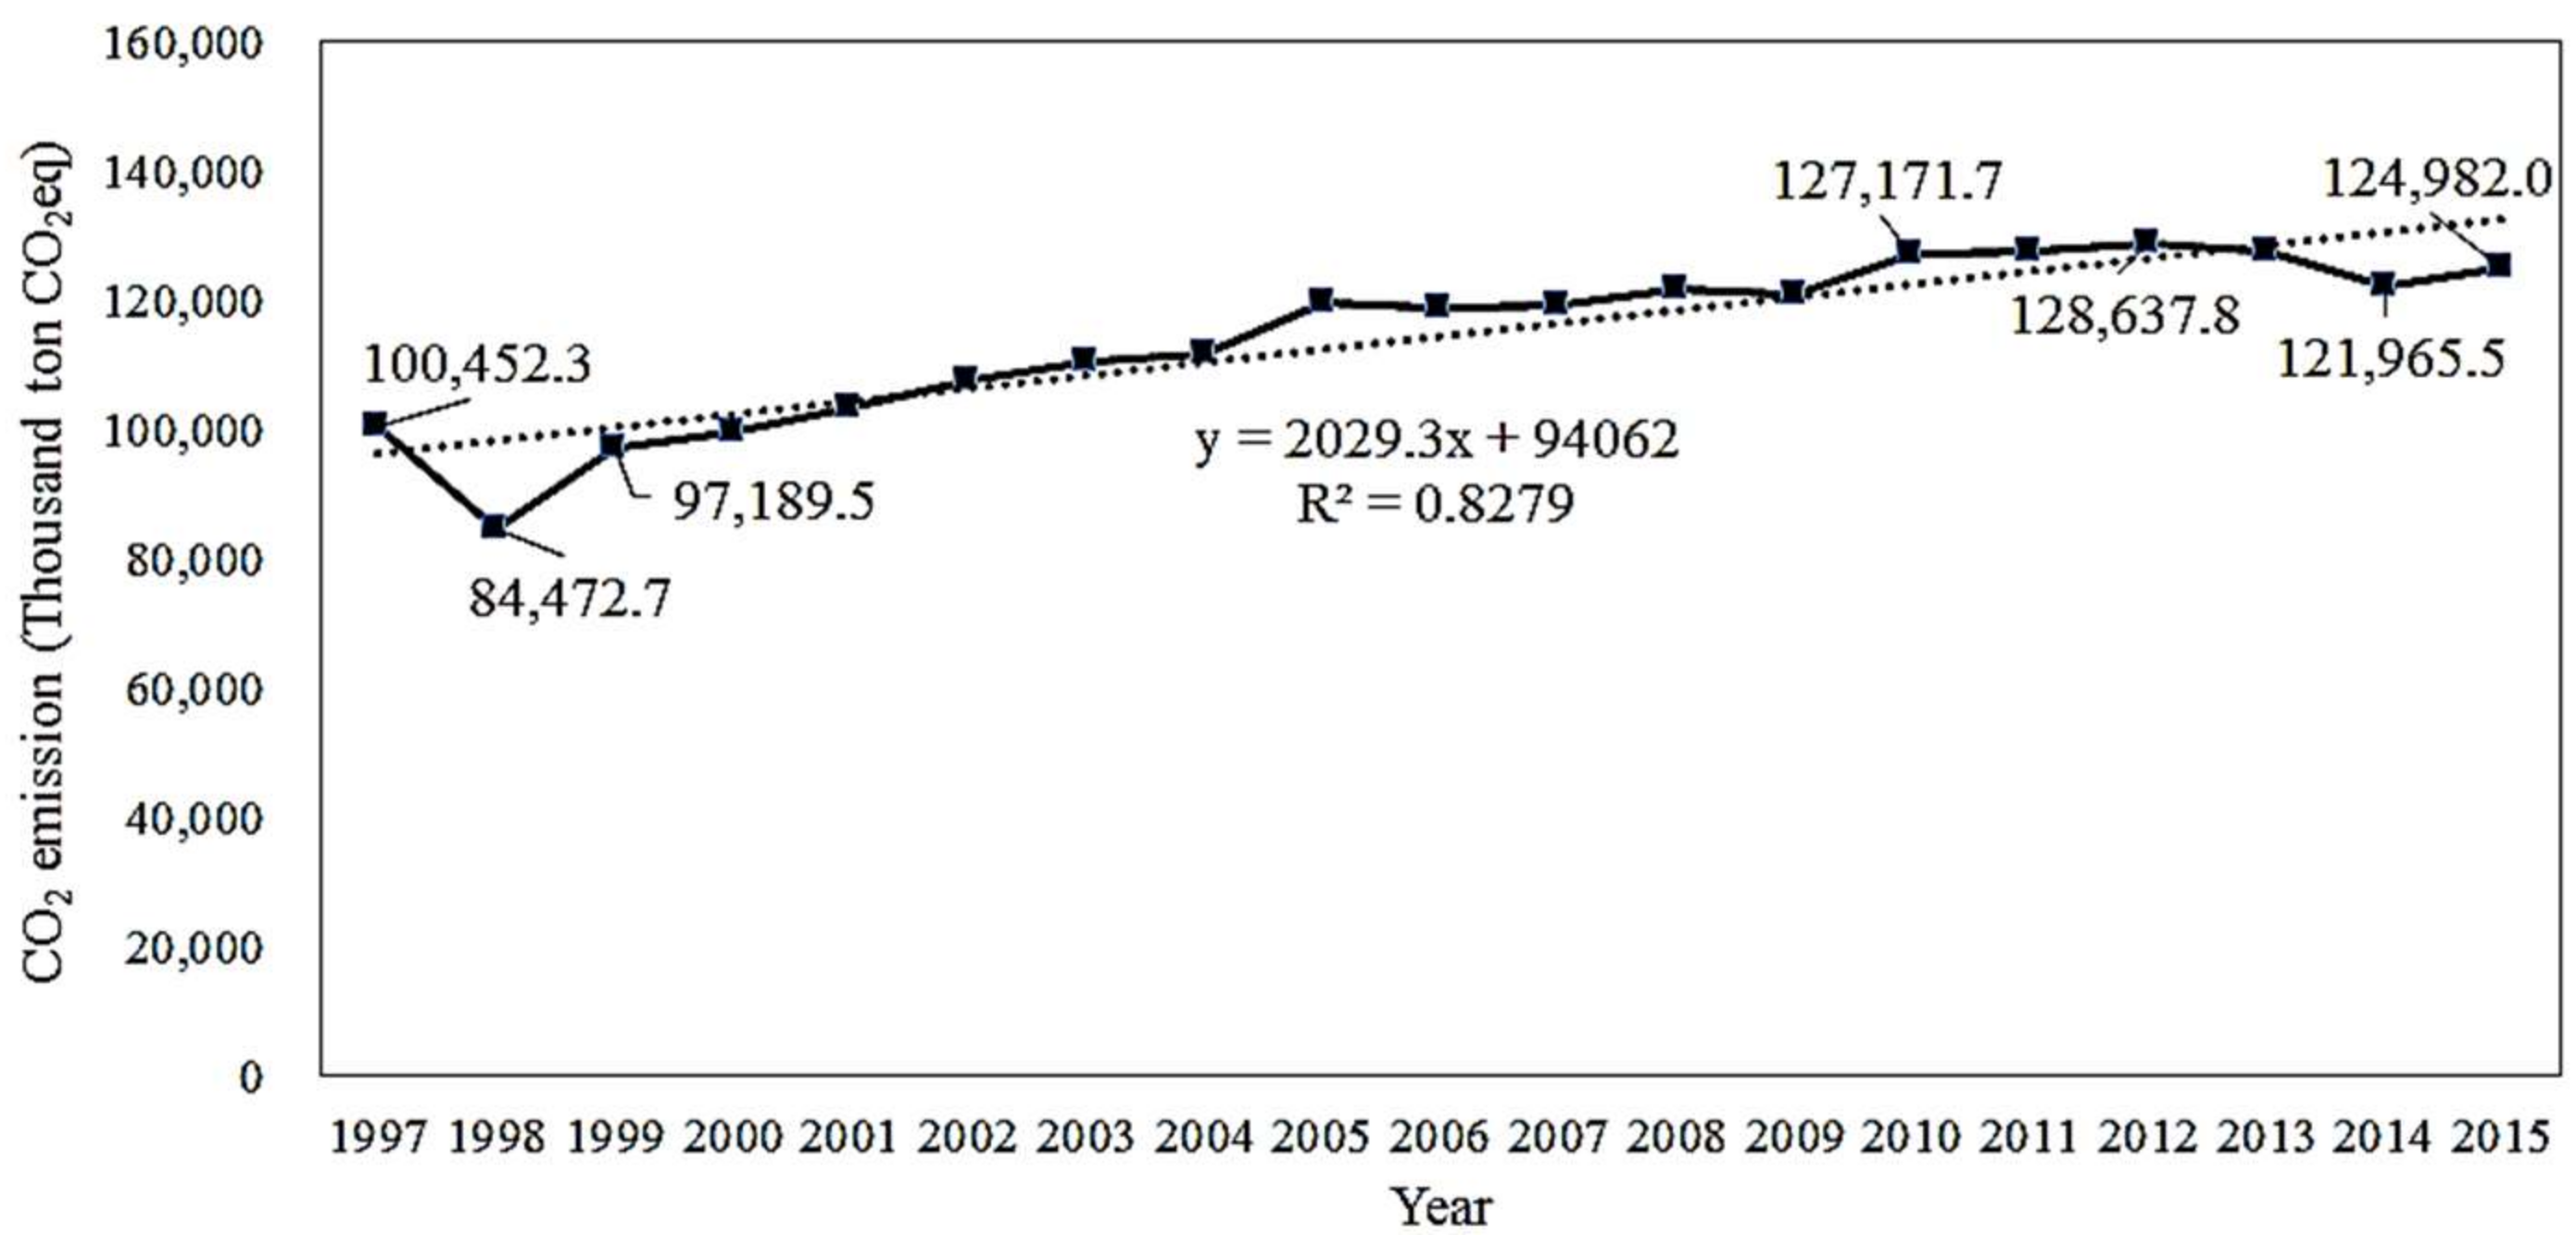
The greenhouse gas emission from buildings was about 124.9 million ton CO2eq as of 2015, taking up about 20% of greenhouse gas emission in Korea’s entire sectors (Figure 3), and decreased in 1998 from 100.4 million ton CO2eq in 1997. However, the greenhouse gas emission consistently increased from 119.3 million ton CO2eq in 2007 to 127.1 million ton CO2eq in 2010 and 127.3 million ton CO2eq in 2013.
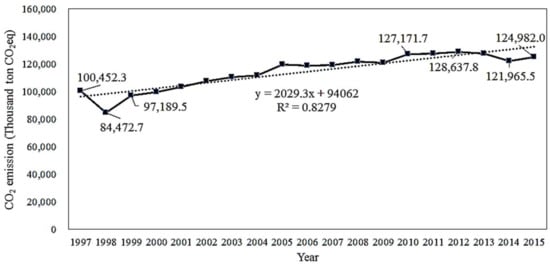
Figure 3.
Greenhouse gas emission in buildings (residential/commercial).
As shown in Figure 4, the number of building units increased by 1% every year from 2006 (6.29 million units) to 2015 (6.98 million units), indicating that the increase of greenhouse gas emission in the building sector was closely related with the increase in the number of building units. Network (electric power, thermal energy, and urban gas) energy consumption stood out very much for energy consumption in the building sector. The recent (2015) trend of energy consumption showed that electric power increased by 163%, urban gas by 97%, and thermal energy by 70% from 1997, implying that the consumption of network energy would continue to increase.
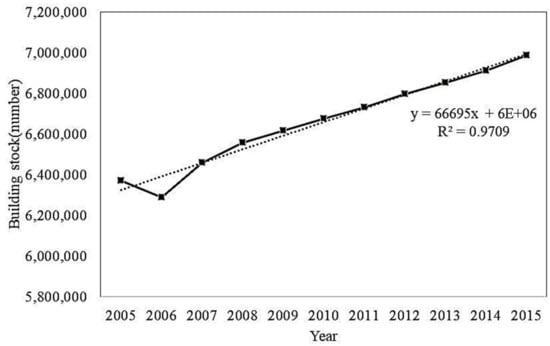
Figure 4.
Increase in the number of building units by year.
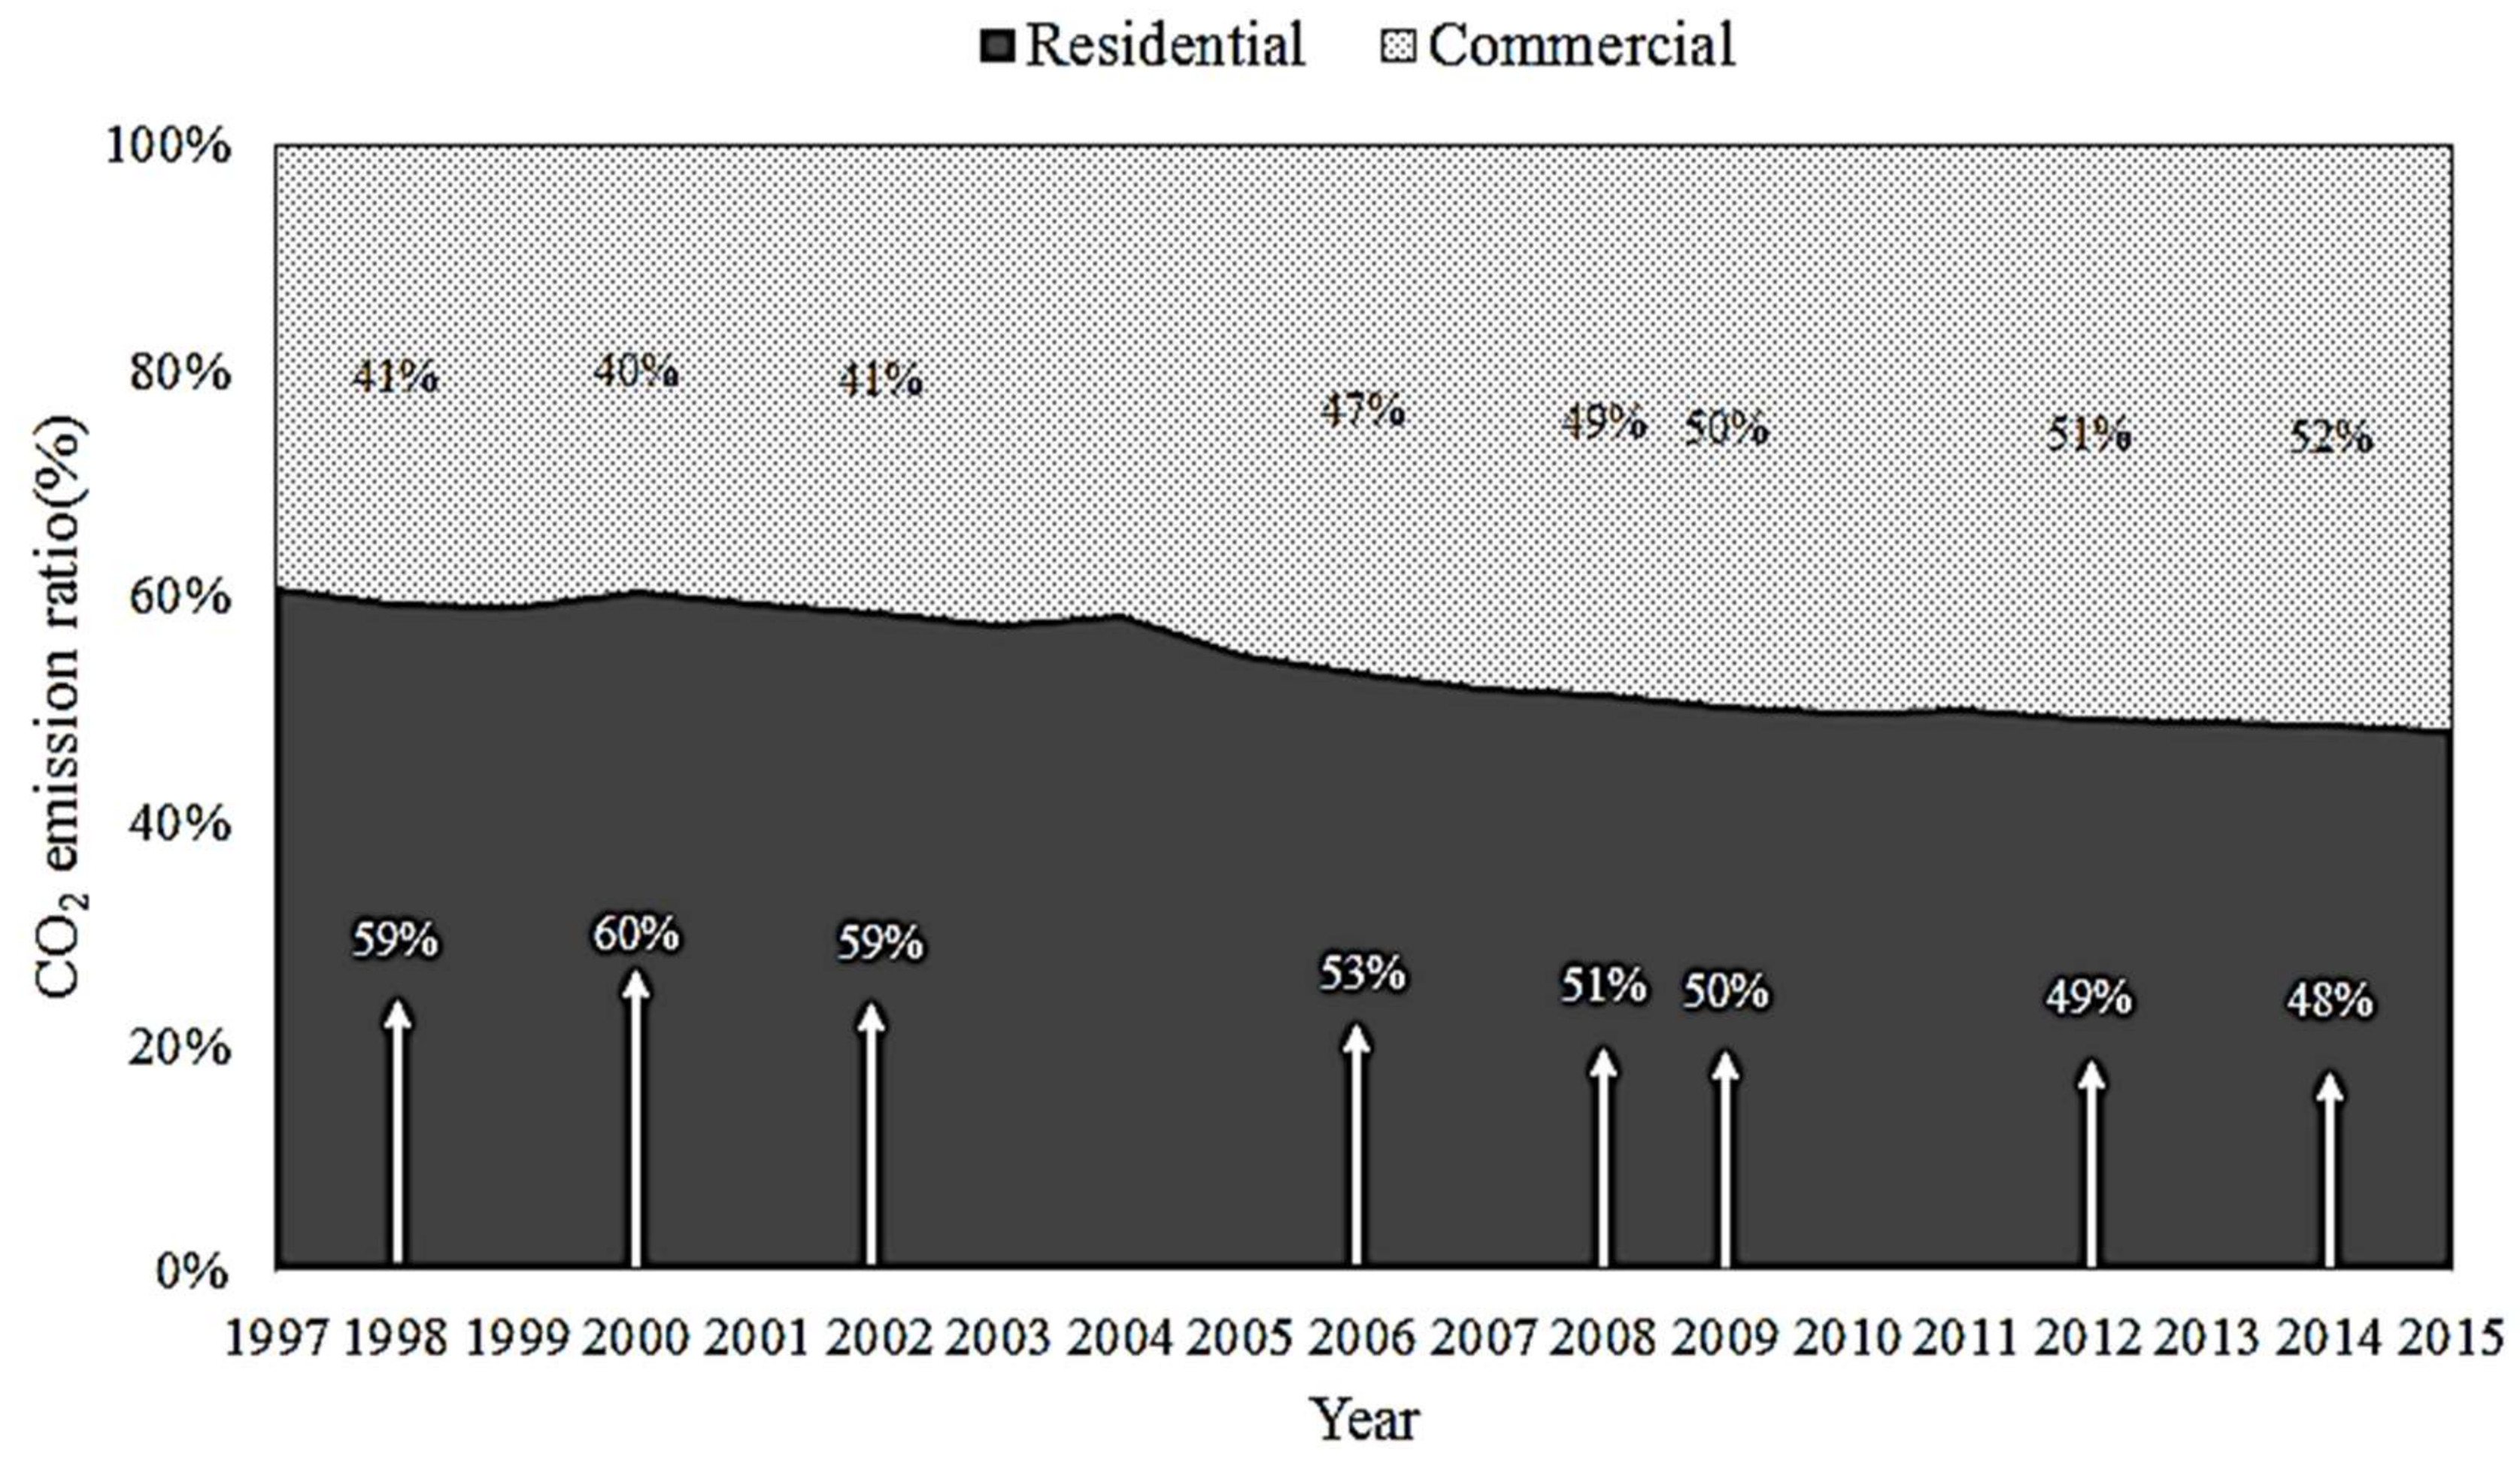
Among greenhouse gas emission in the building sector, residential buildings took up 59% of the entire sector as 60.8 million ton CO2eq (1997) and commercial buildings took up 41% as 39.6 million ton CO2eq (1997) of the entire sector. In 2015, however, residential buildings took up 48% of the entire sectors as 60.1 million ton CO2eq and commercial buildings took up 52% as 64.9 million ton CO2eq (Figure 5) because greenhouse gas emission from commercial buildings rose by 40%, not because greenhouse gas emission from residential buildings decreased, from 1997.
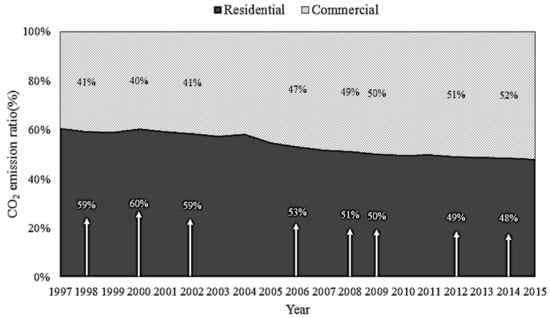
Figure 5.
Comparison of residential and commercial greenhouse gas emission.
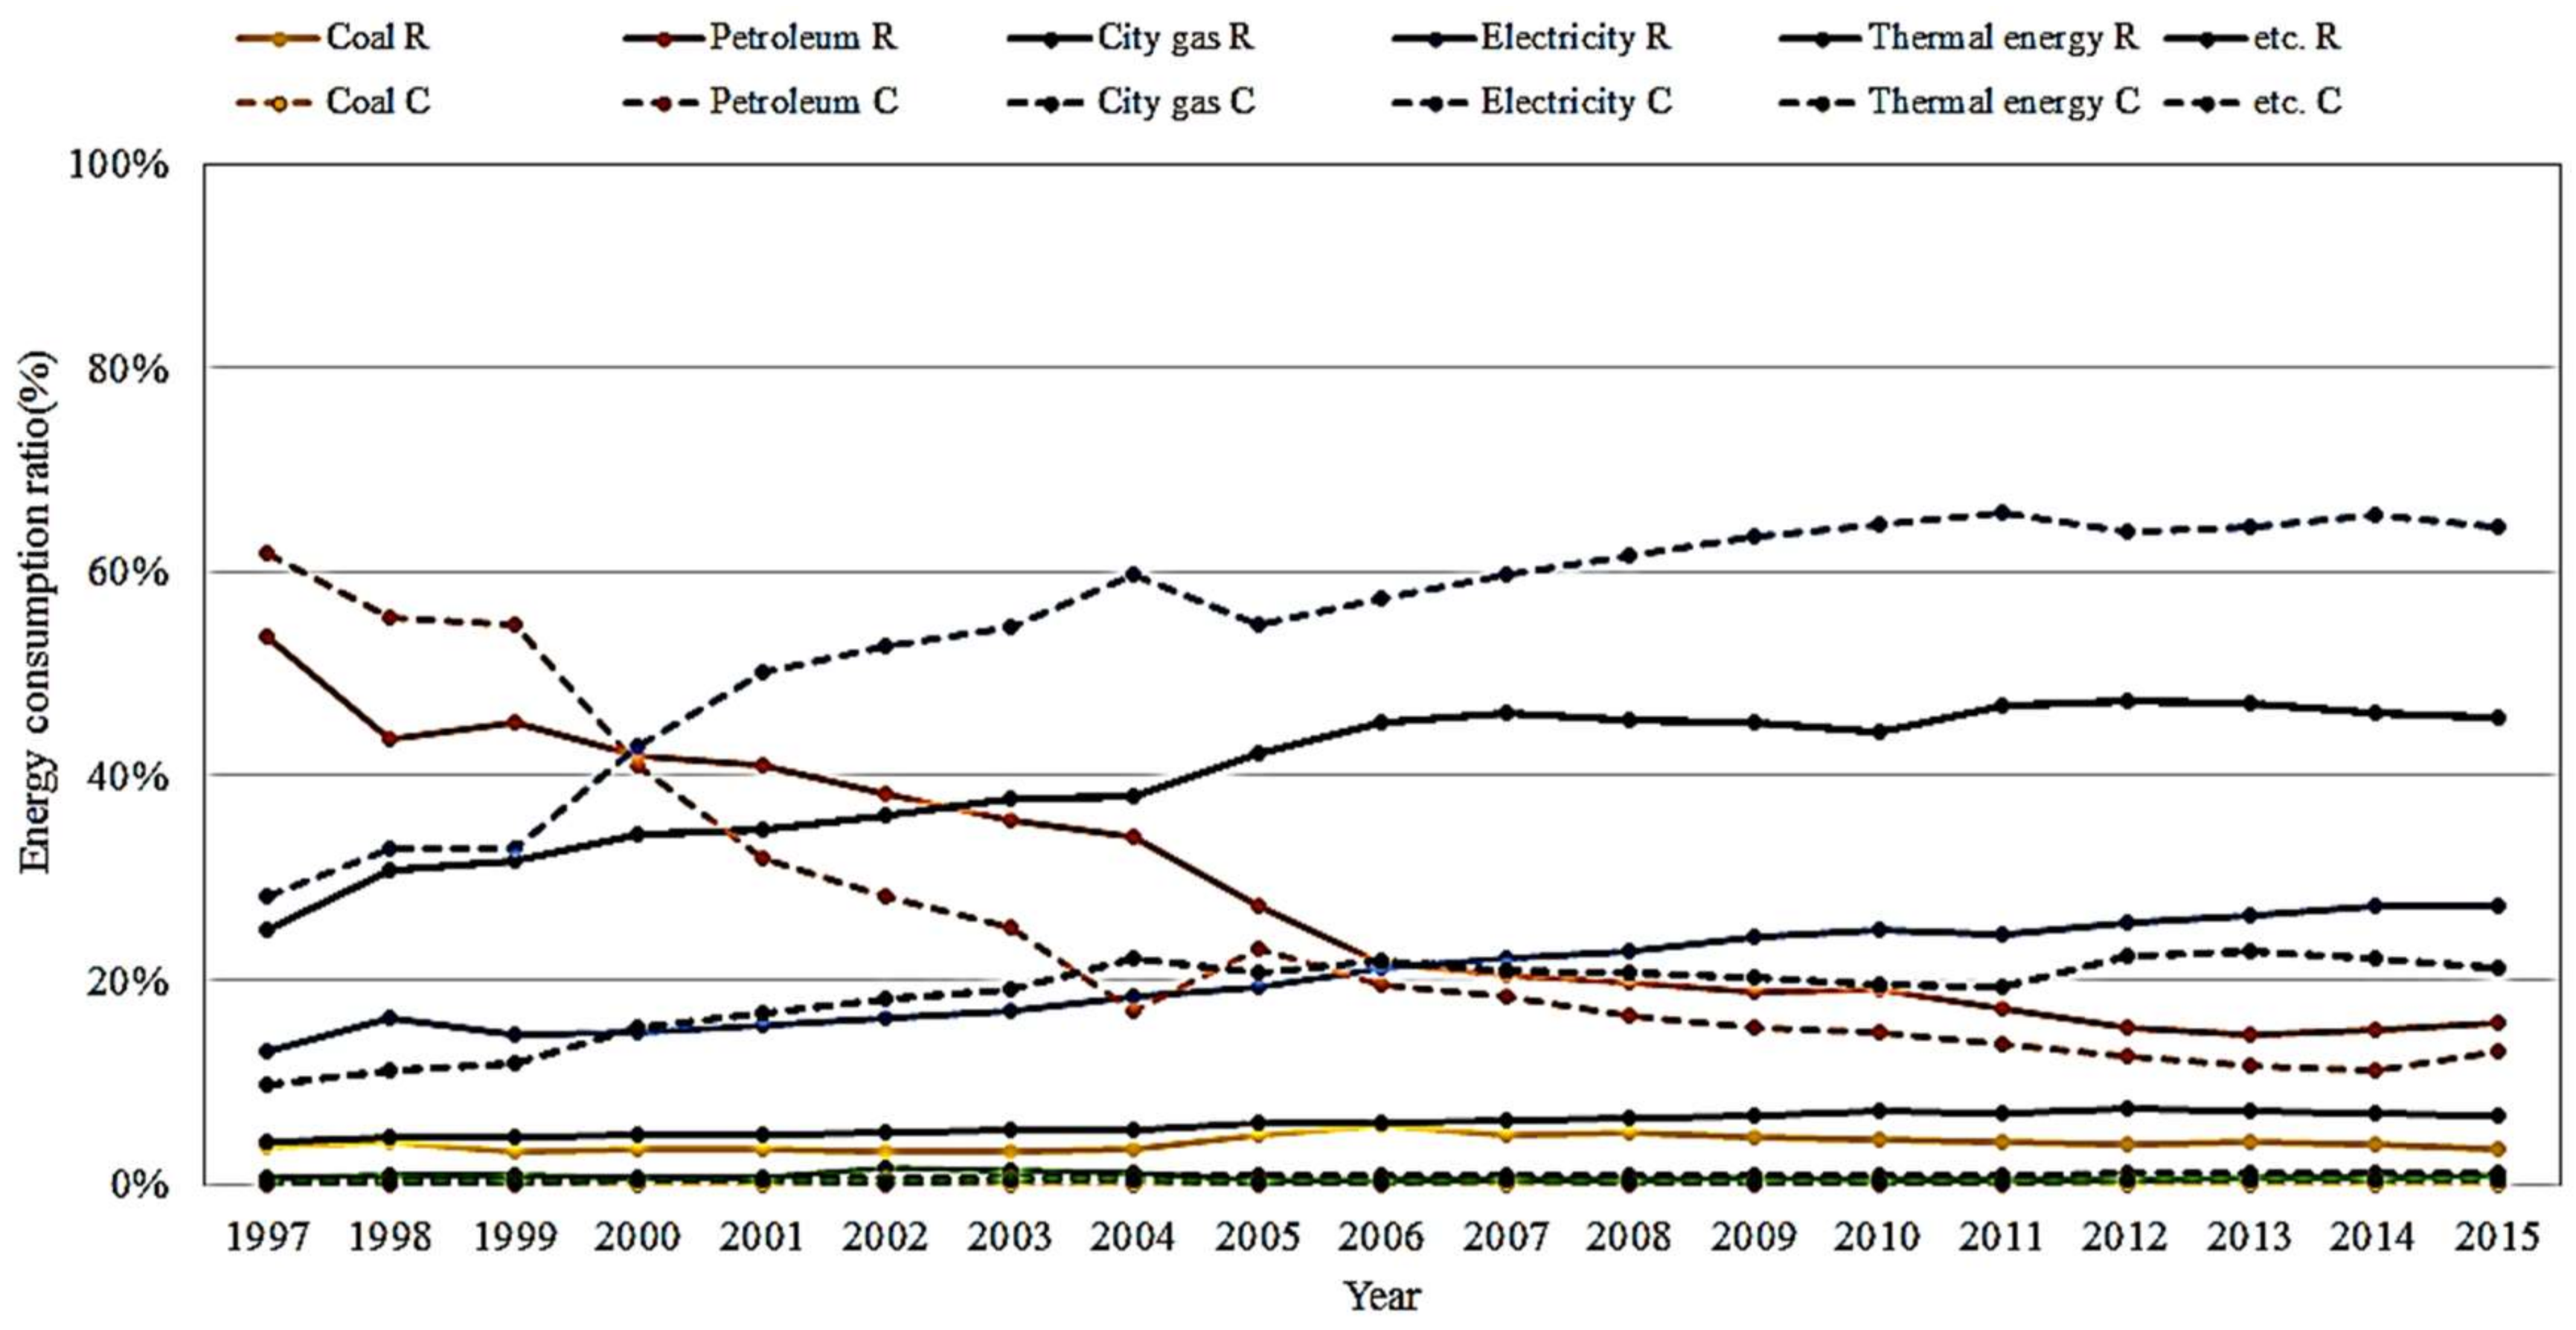
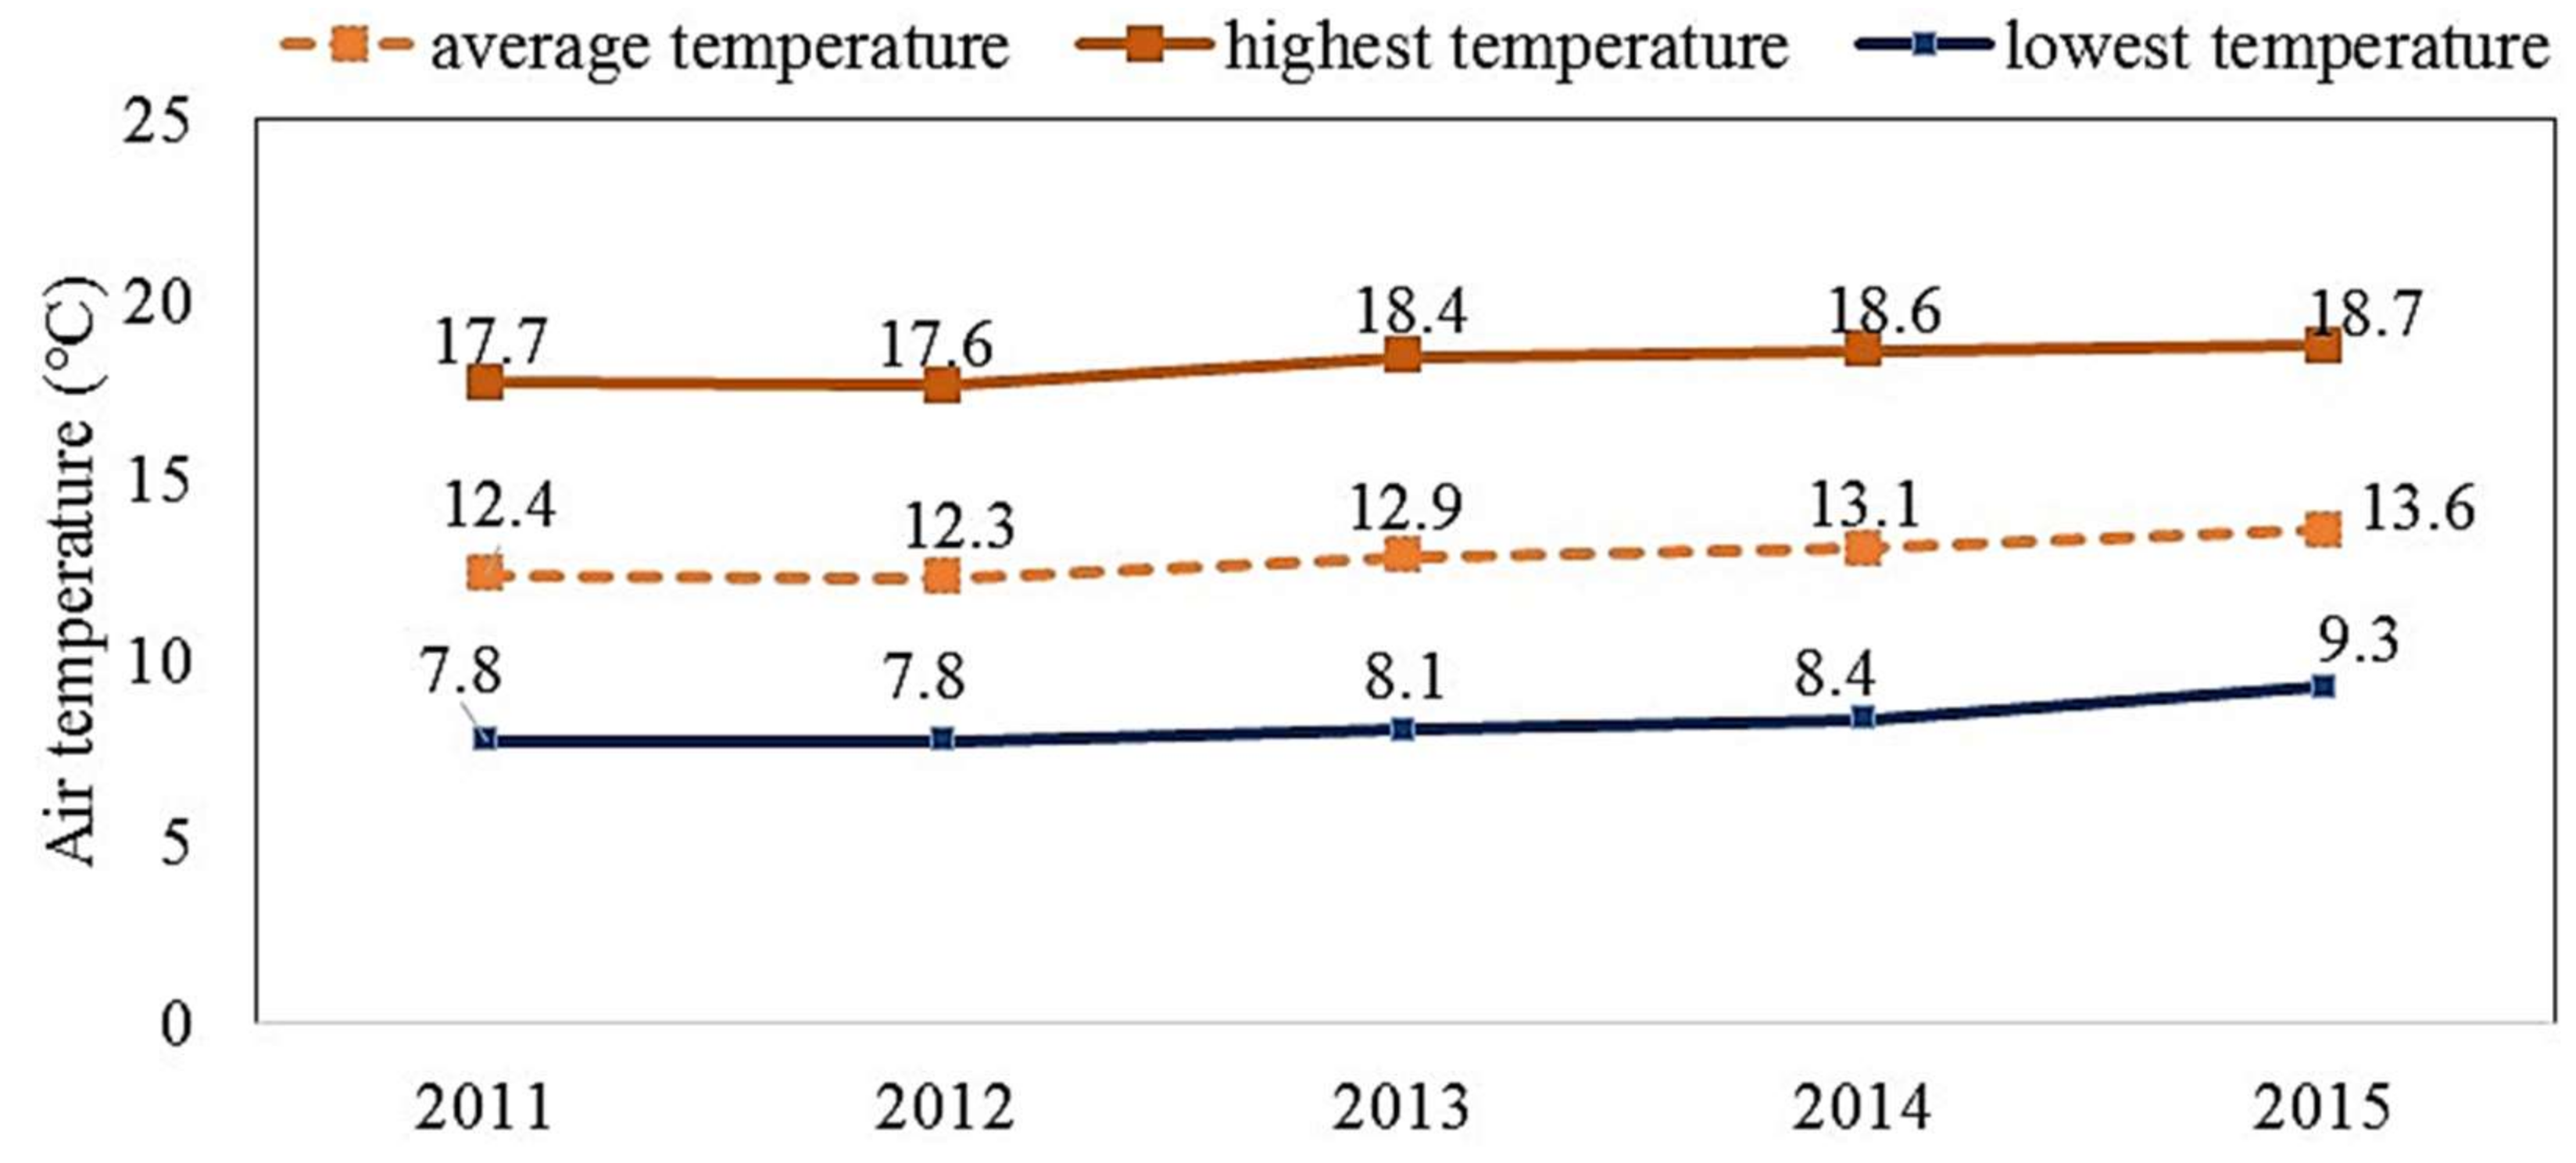
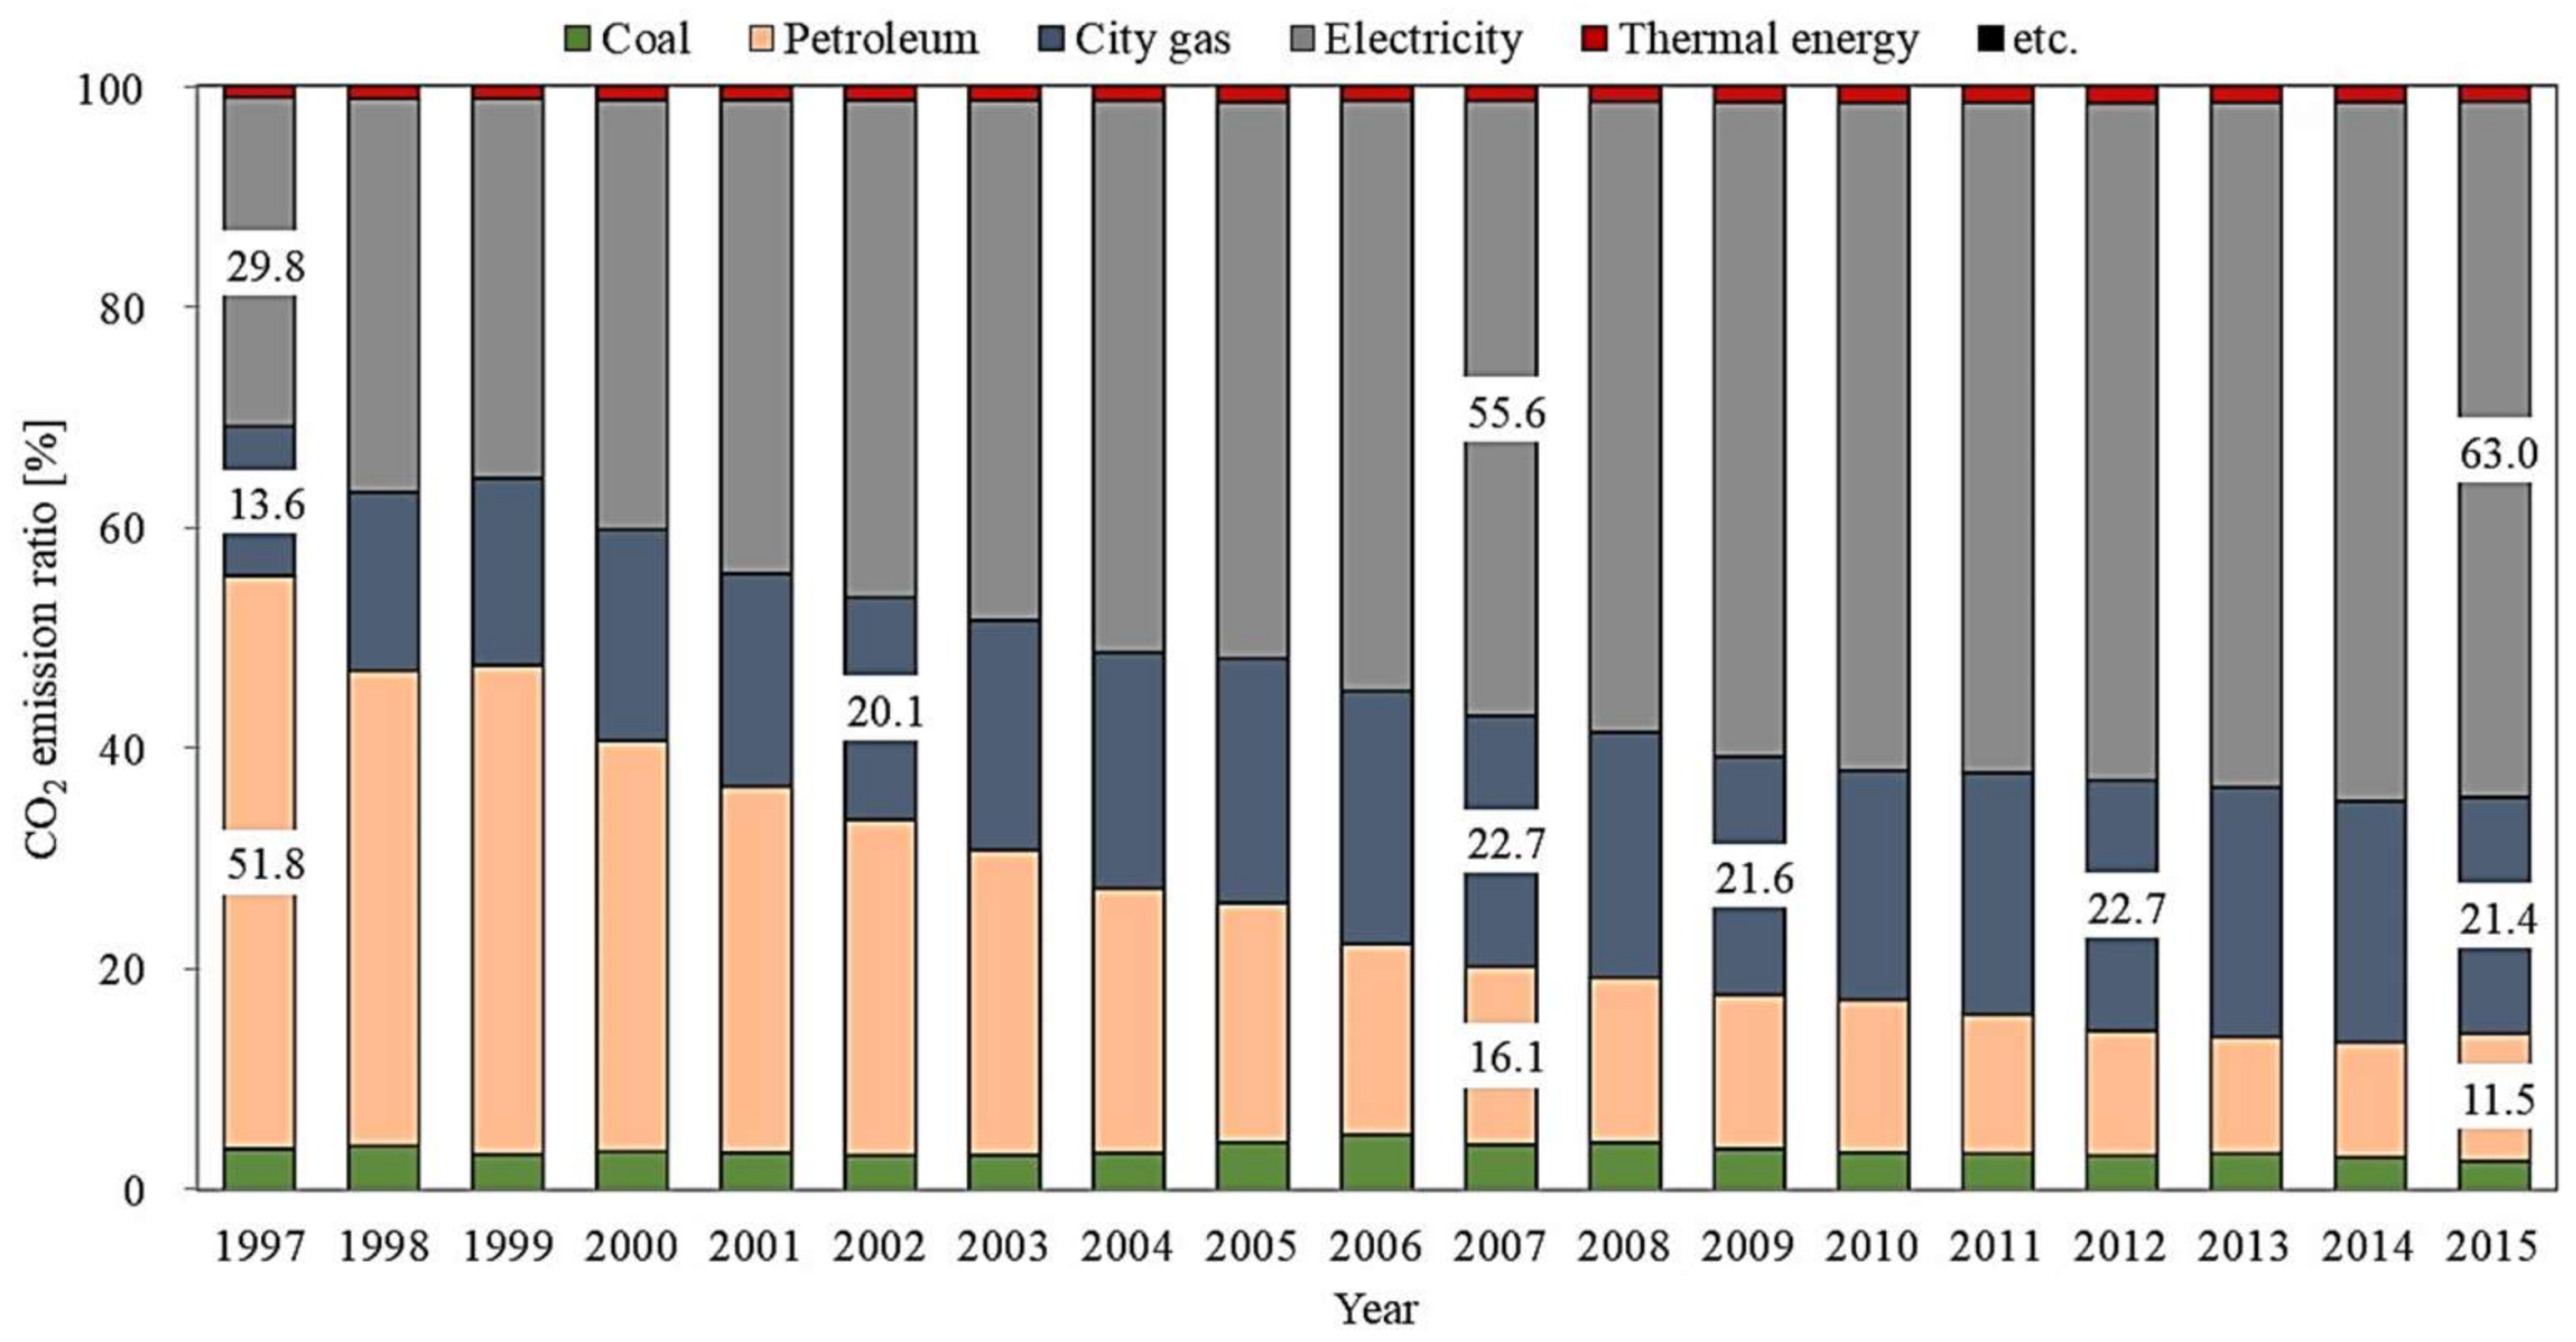
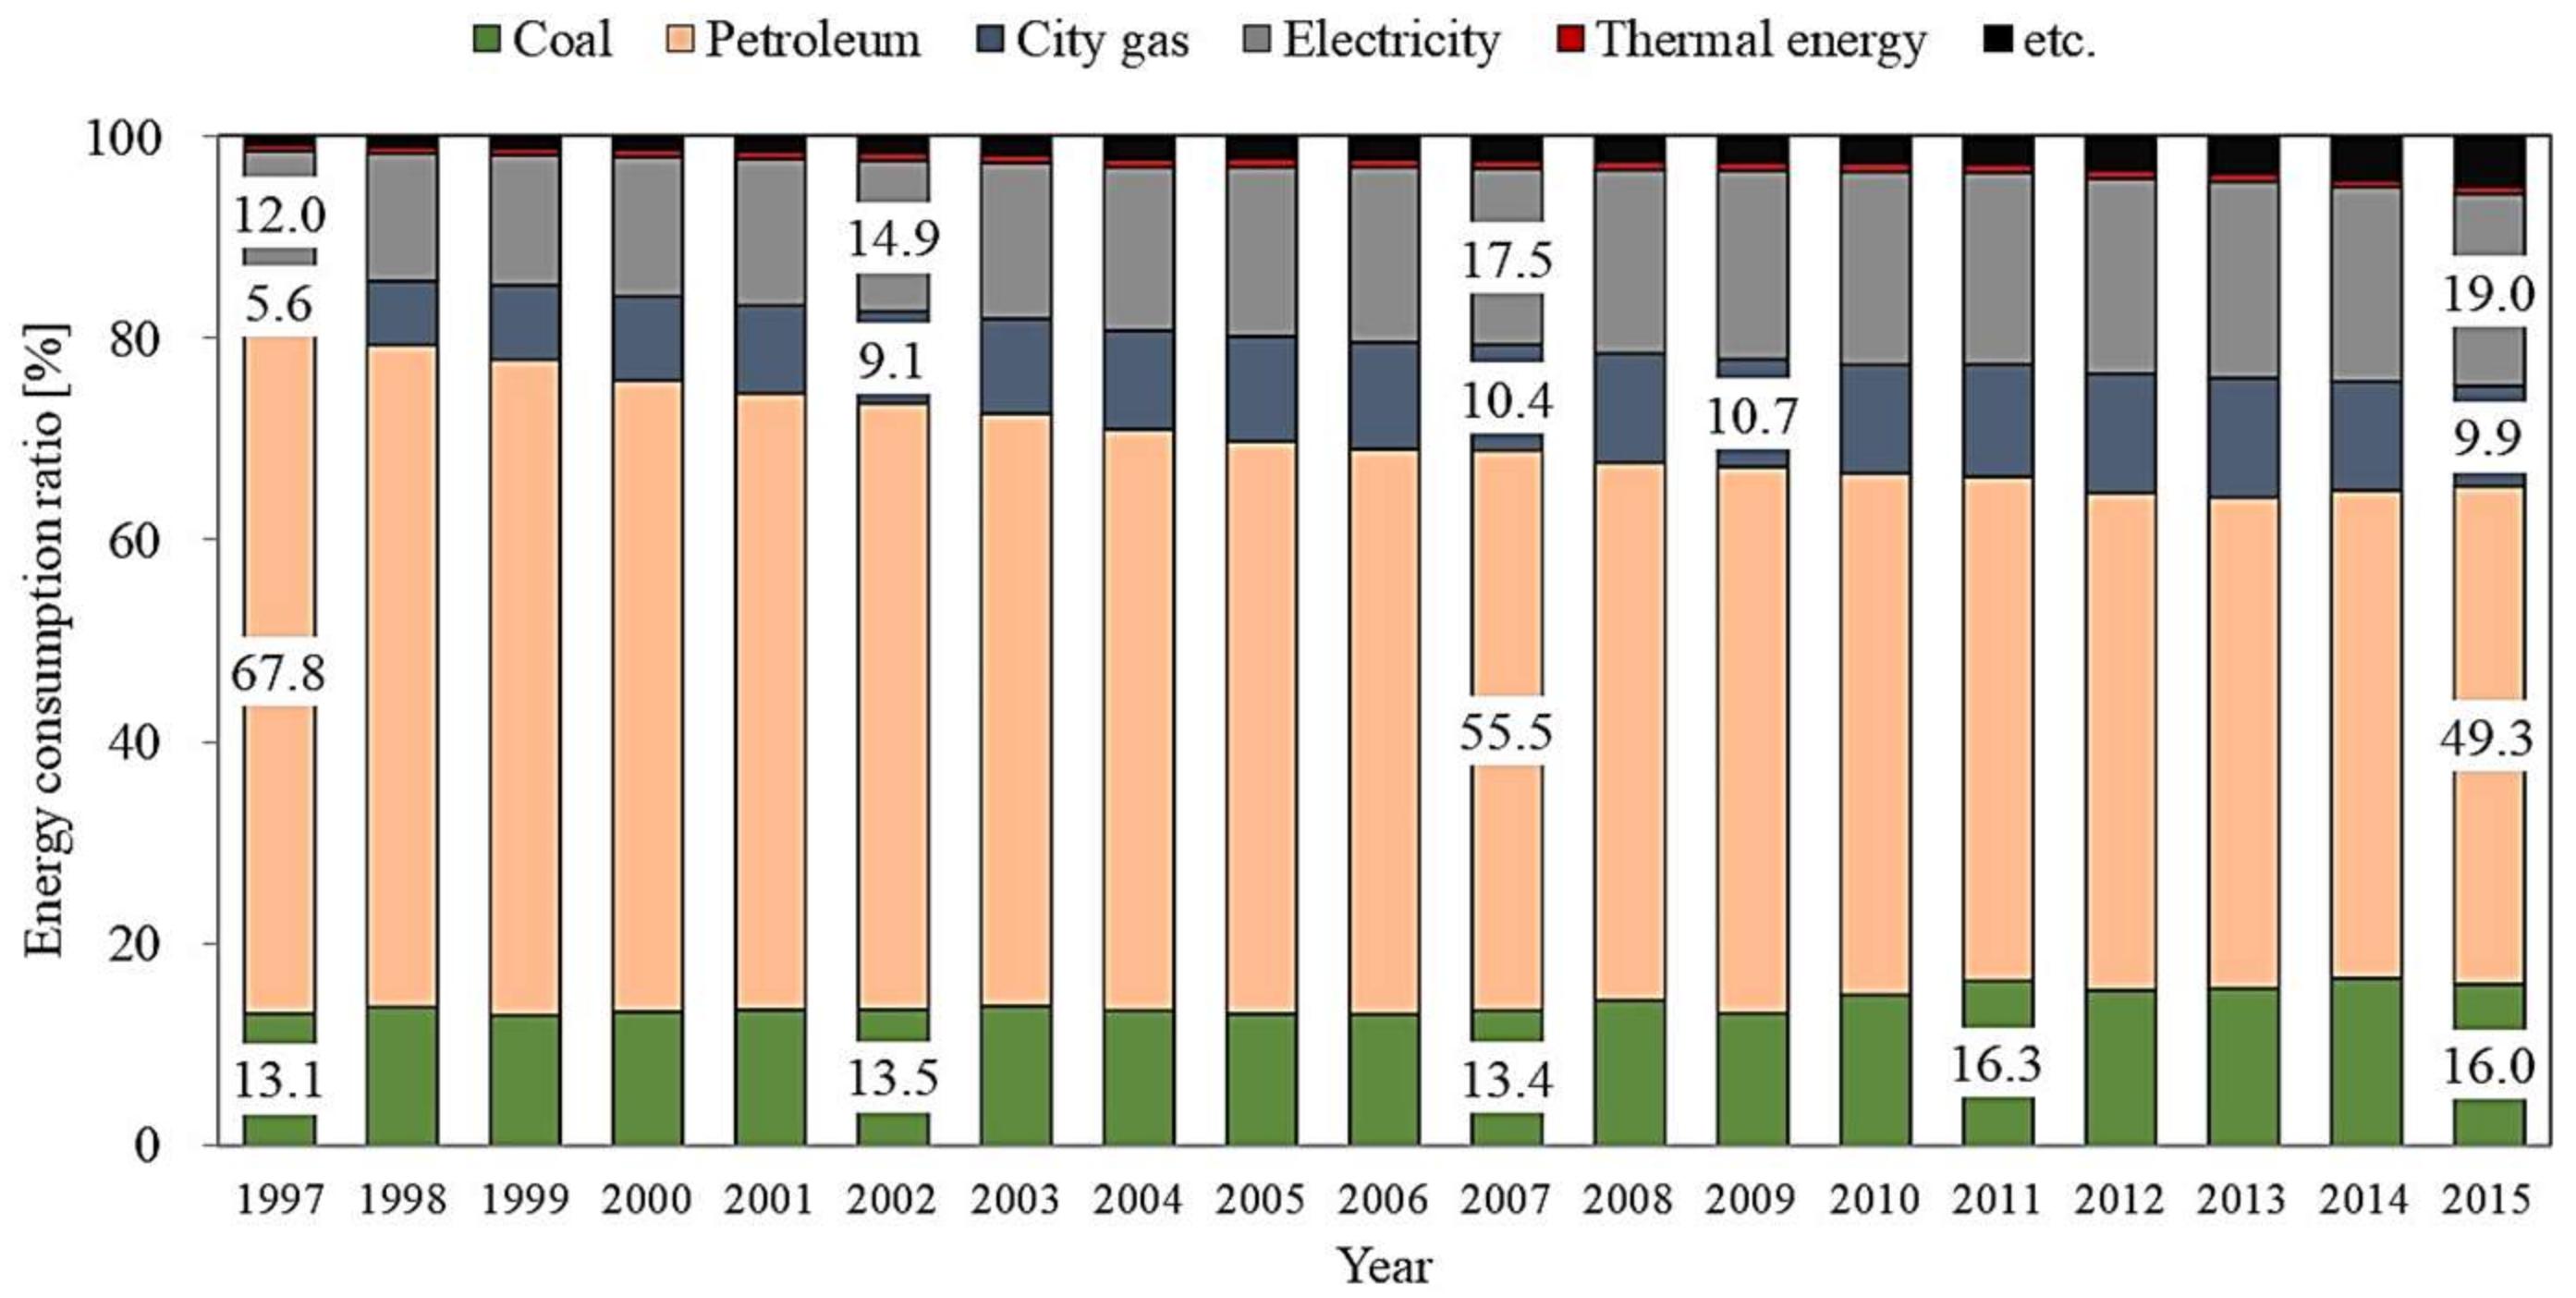
In 2015, the rate (%) of coal (Coal R) energy use in the residential building sector was 3%, similar to 1997, but the rate (%) of oil (Petroleum R) use decreased by 38% from 53% to 15%. The use rate (%) of urban gas and electric power energy increased from 25% and 13%, respectively, to 46% and 27% (Figure 6). In the commercial building sector, the rate (%) of coal (Coal R) energy use in 2015 was 13%, a decrease by 48% from 1997, but the use rate (%) of urban gas and electric power energy increased from 9% and 28%, respectively, to 21% and 63%. It was analyzed that the rate of oil use in commercial buildings decreased, but greenhouse gas emission increased from the past due to an increase in the rate (%) of electric power use, which has a high greenhouse gas emission coefficient. In addition, buildings’ greenhouse gas emission varied depending on climate conditions due to their location (latitude and longitude) and energy sources used. For example, greenhouse gas emission from buildings continued to increase from 1999 than decreased in 2014 and 2015. As for climate conditions, the average temperatures in 2014 and 2015 (average temperature) were 13.1 °C and 13.6 °C, respectively, 0.6 °C and 1.1 °C higher than the normal year temperature (Figure 7). Energy consumption decreased due to warmer weather in the winter, resulting in the reduction of greenhouse gas.
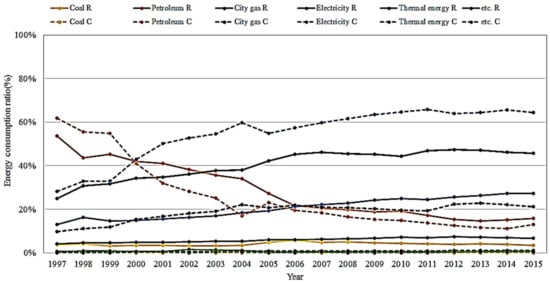
Figure 6.
Comparison of the energy use rate (%) in residential and commercial buildings.
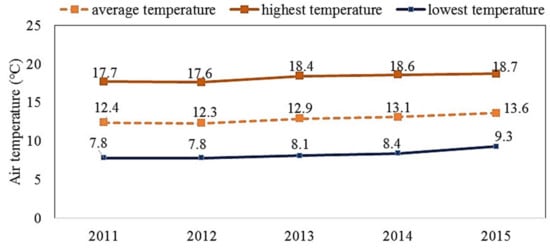
Figure 7.
Comparison of annual temperature.
4.2. Greenhouse Gas Emission by Energy Source
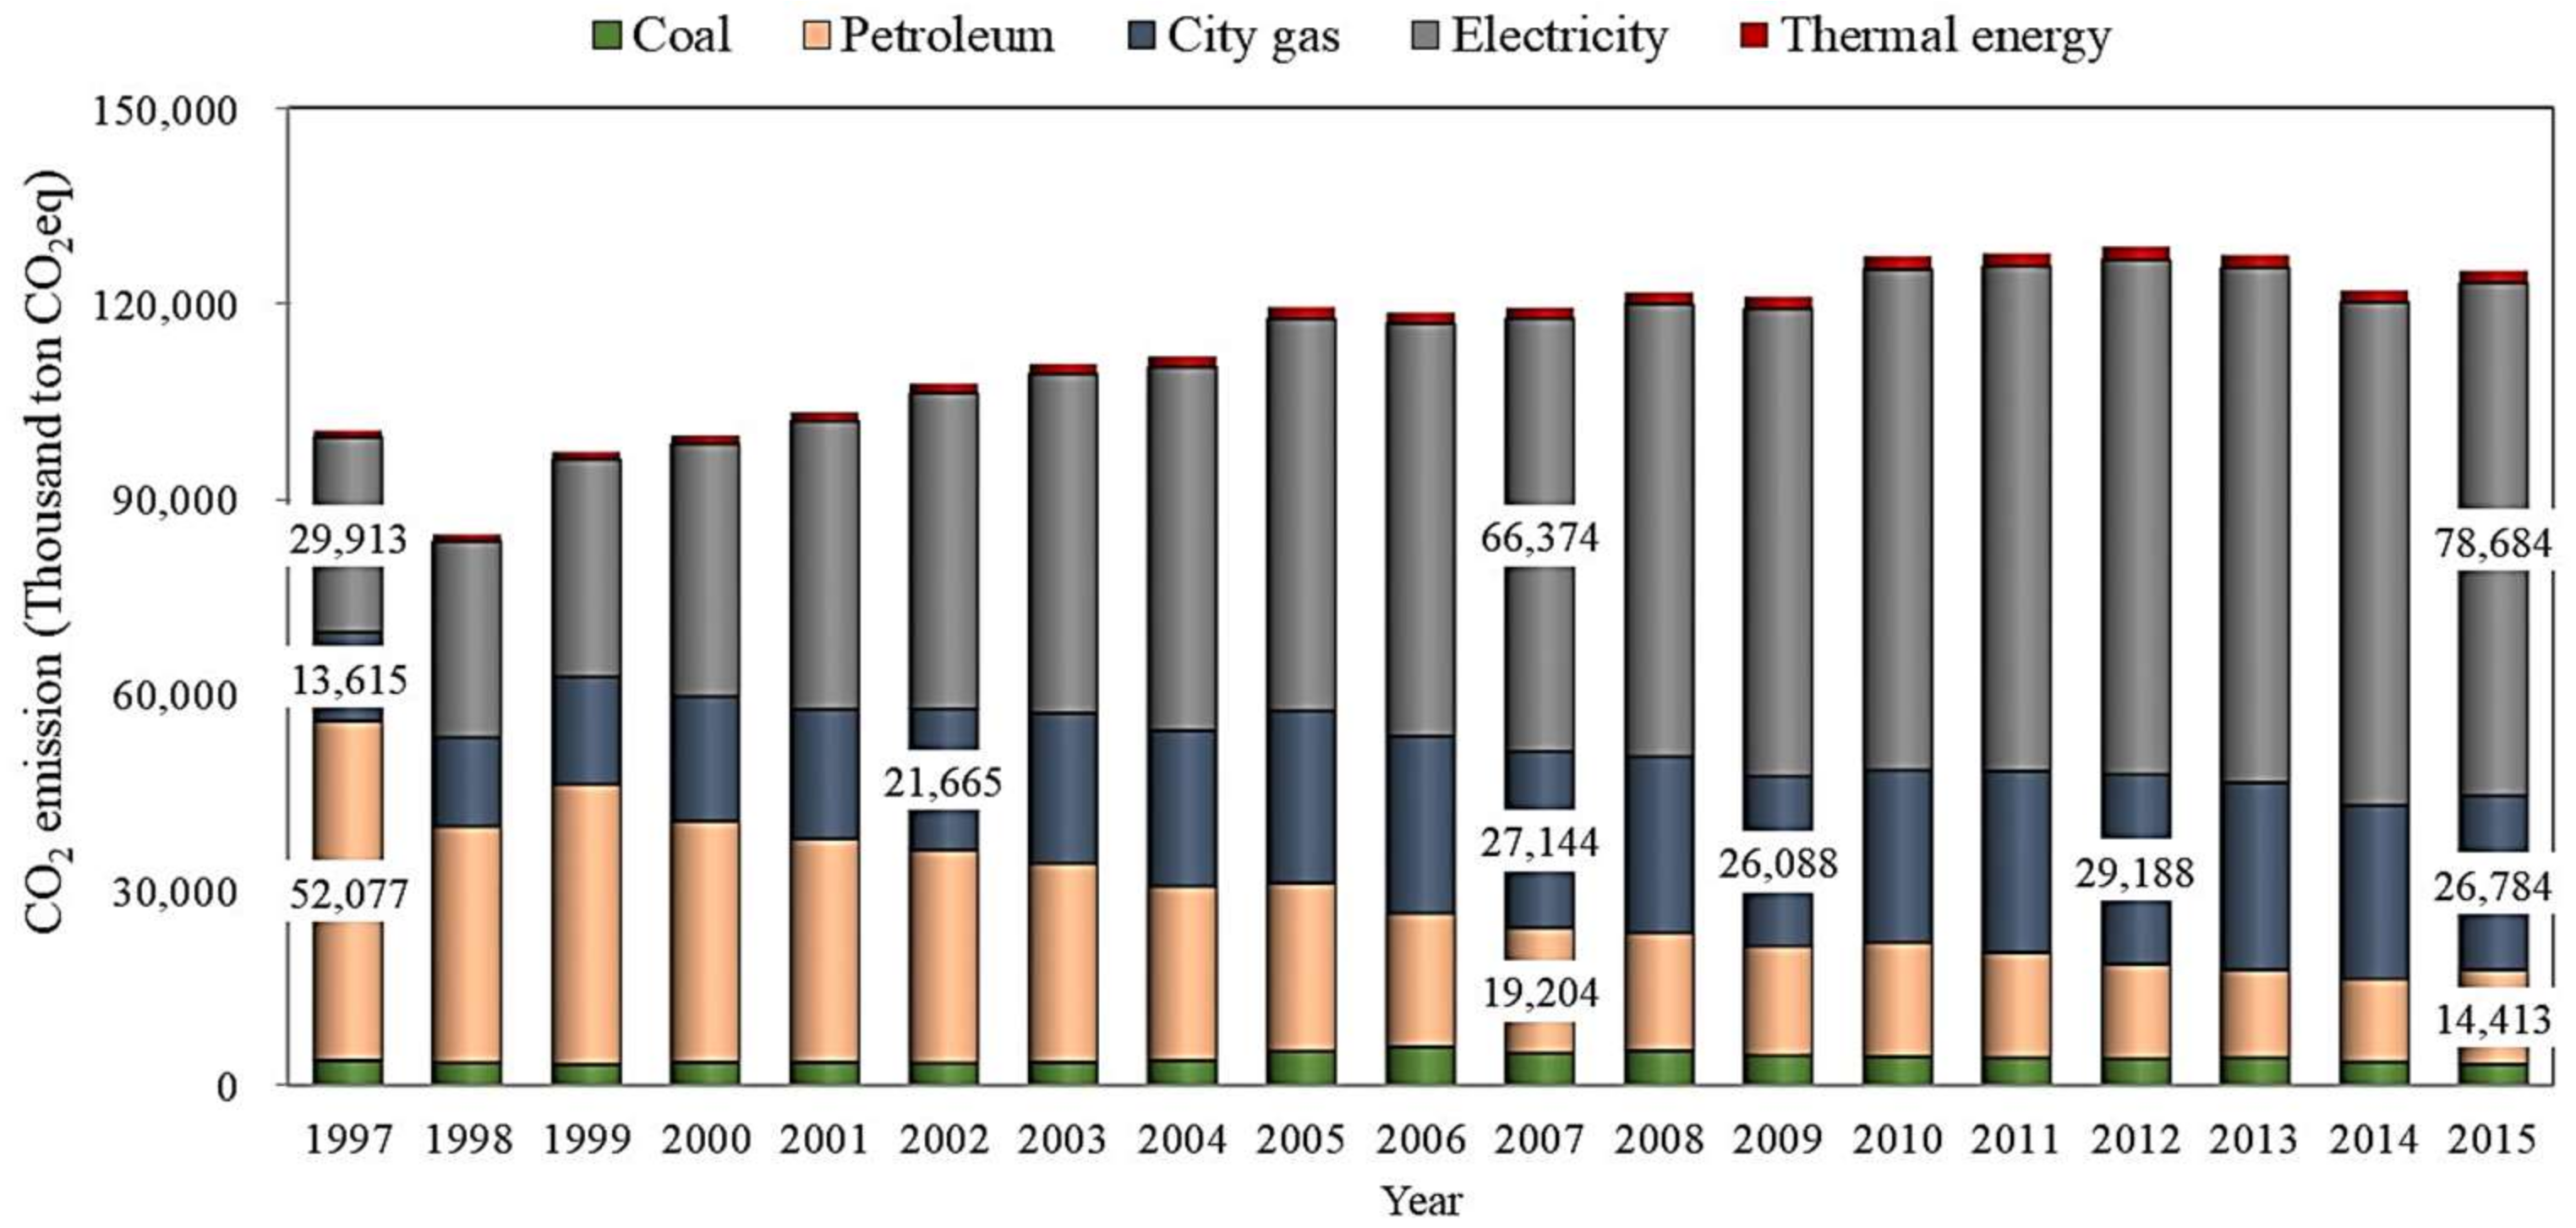
The distribution of greenhouse gas emission by energy source in 2015 was electric power 63%, urban gas 21%, oil 11%, thermal energy 3%, and coal 2% (Figure 8). Among the greenhouse gas emission by energy source, oil which is direct emission decreased greatly from 52% (1997) to 12% (2015), and electric power and thermal energy which are indirect emissions increased greatly from 32% (1997) to 66% (2015). Among greenhouse gas emission in the building sector, petroleum as the highest energy source until 1999, but the greenhouse gas emission of petroleum continuously decreased from 52.1 million ton CO2eq (1997) to 19.2 million ton CO2eq (2007) and 14.4 million ton CO2eq (2015). It is because oil consumption decreased by an annual average of 1.5% (2000–2012) due to the influence of high oil prices since 2000 and because fuel oil was replaced with urban gas, electric power, etc. Next, the greenhouse gas emission of electric power in the building sector increased greatly from 29.9 million ton CO2eq (1997) to 66.3 million ton CO2eq (2007) and 78.6 million ton CO2eq (2015), and emission ratio (%) of electric power greenhouse doubled from 30% (1997) to 56% (2007) and 63% (2015) (Figure 9) because the consumption of electric power increased from 6,090,000 TOE (1997) to 13,513,000 TOE (2007) and 16,019,000 TOE (2015), by 120% and 160%, respectively (Figure 10).
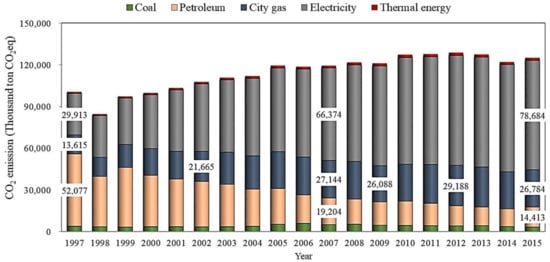
Figure 8.
Greenhouse gas emission in buildings by energy source.
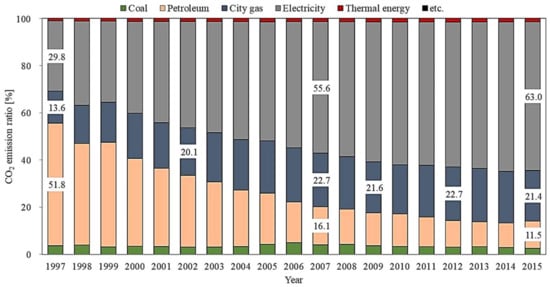
Figure 9.
Percentage of greenhouse gas emission by energy source (%).
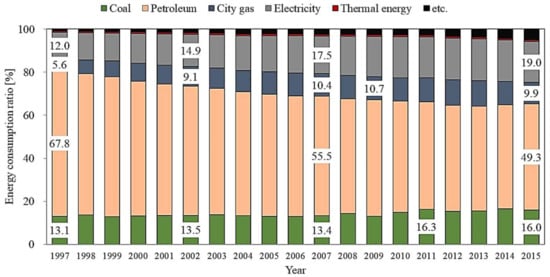
Figure 10.
Percentage of energy use by energy source (%).
Electric power consumption increased relatively quickly after 2000 due to low cost, diversification and the expanded distribution of electricity equipment/devices (power/air-conditioning, heating/lighting, etc.), use convenience, etc. The greenhouse gas emission from urban gas also increased from 13.6 million ton CO2eq (1997) to 21.6 million ton CO2eq (2002) and 27.1 million ton CO2eq (2007), but it fluctuated recently from 26.1 million ton CO2eq (2009) to 29.2 million ton CO2eq (2012), and 26.7 million ton CO2eq (2015) (Figure 8). Urban gas (LNG) consumption (%) generally increased until the mid-2000s, but recently decreased due to an increase in single households, electric heating apparatus, and the growth of alternative industry. Likewise, with the saturation of urban gas distribution, the rate (%) of LNG use for power generation was higher than the rate (%) of LNG use for urban gas manufacturing. In addition, the greenhouse emission of coal decreased from 3.7 million ton CO2eq (1997) to 4.8 million ton CO2eq (2007) and 3.2 million ton CO2eq (2015) (Figure 8), and the greenhouse gas emission ratio (%) of coal decreased from about 3.7% (1997) to 2.6% (2015) (Figure 9).
As the use of oil and natural gas as residential fuel increased from the 1990s to early 2000, the consumption of anthracite decreased. However, demand for residential and commercial anthracite consumption has increased from 2002 due to high oil prices and anthracite consumption in 2011 increased by 20% from 2002. The change in energy consumption by source between 2005 and 2007 in buildings was due to the decreased dependence on oil and coal and the increased use of electric power and LNG.
4.3. Greenhouse Gas Emission by Region
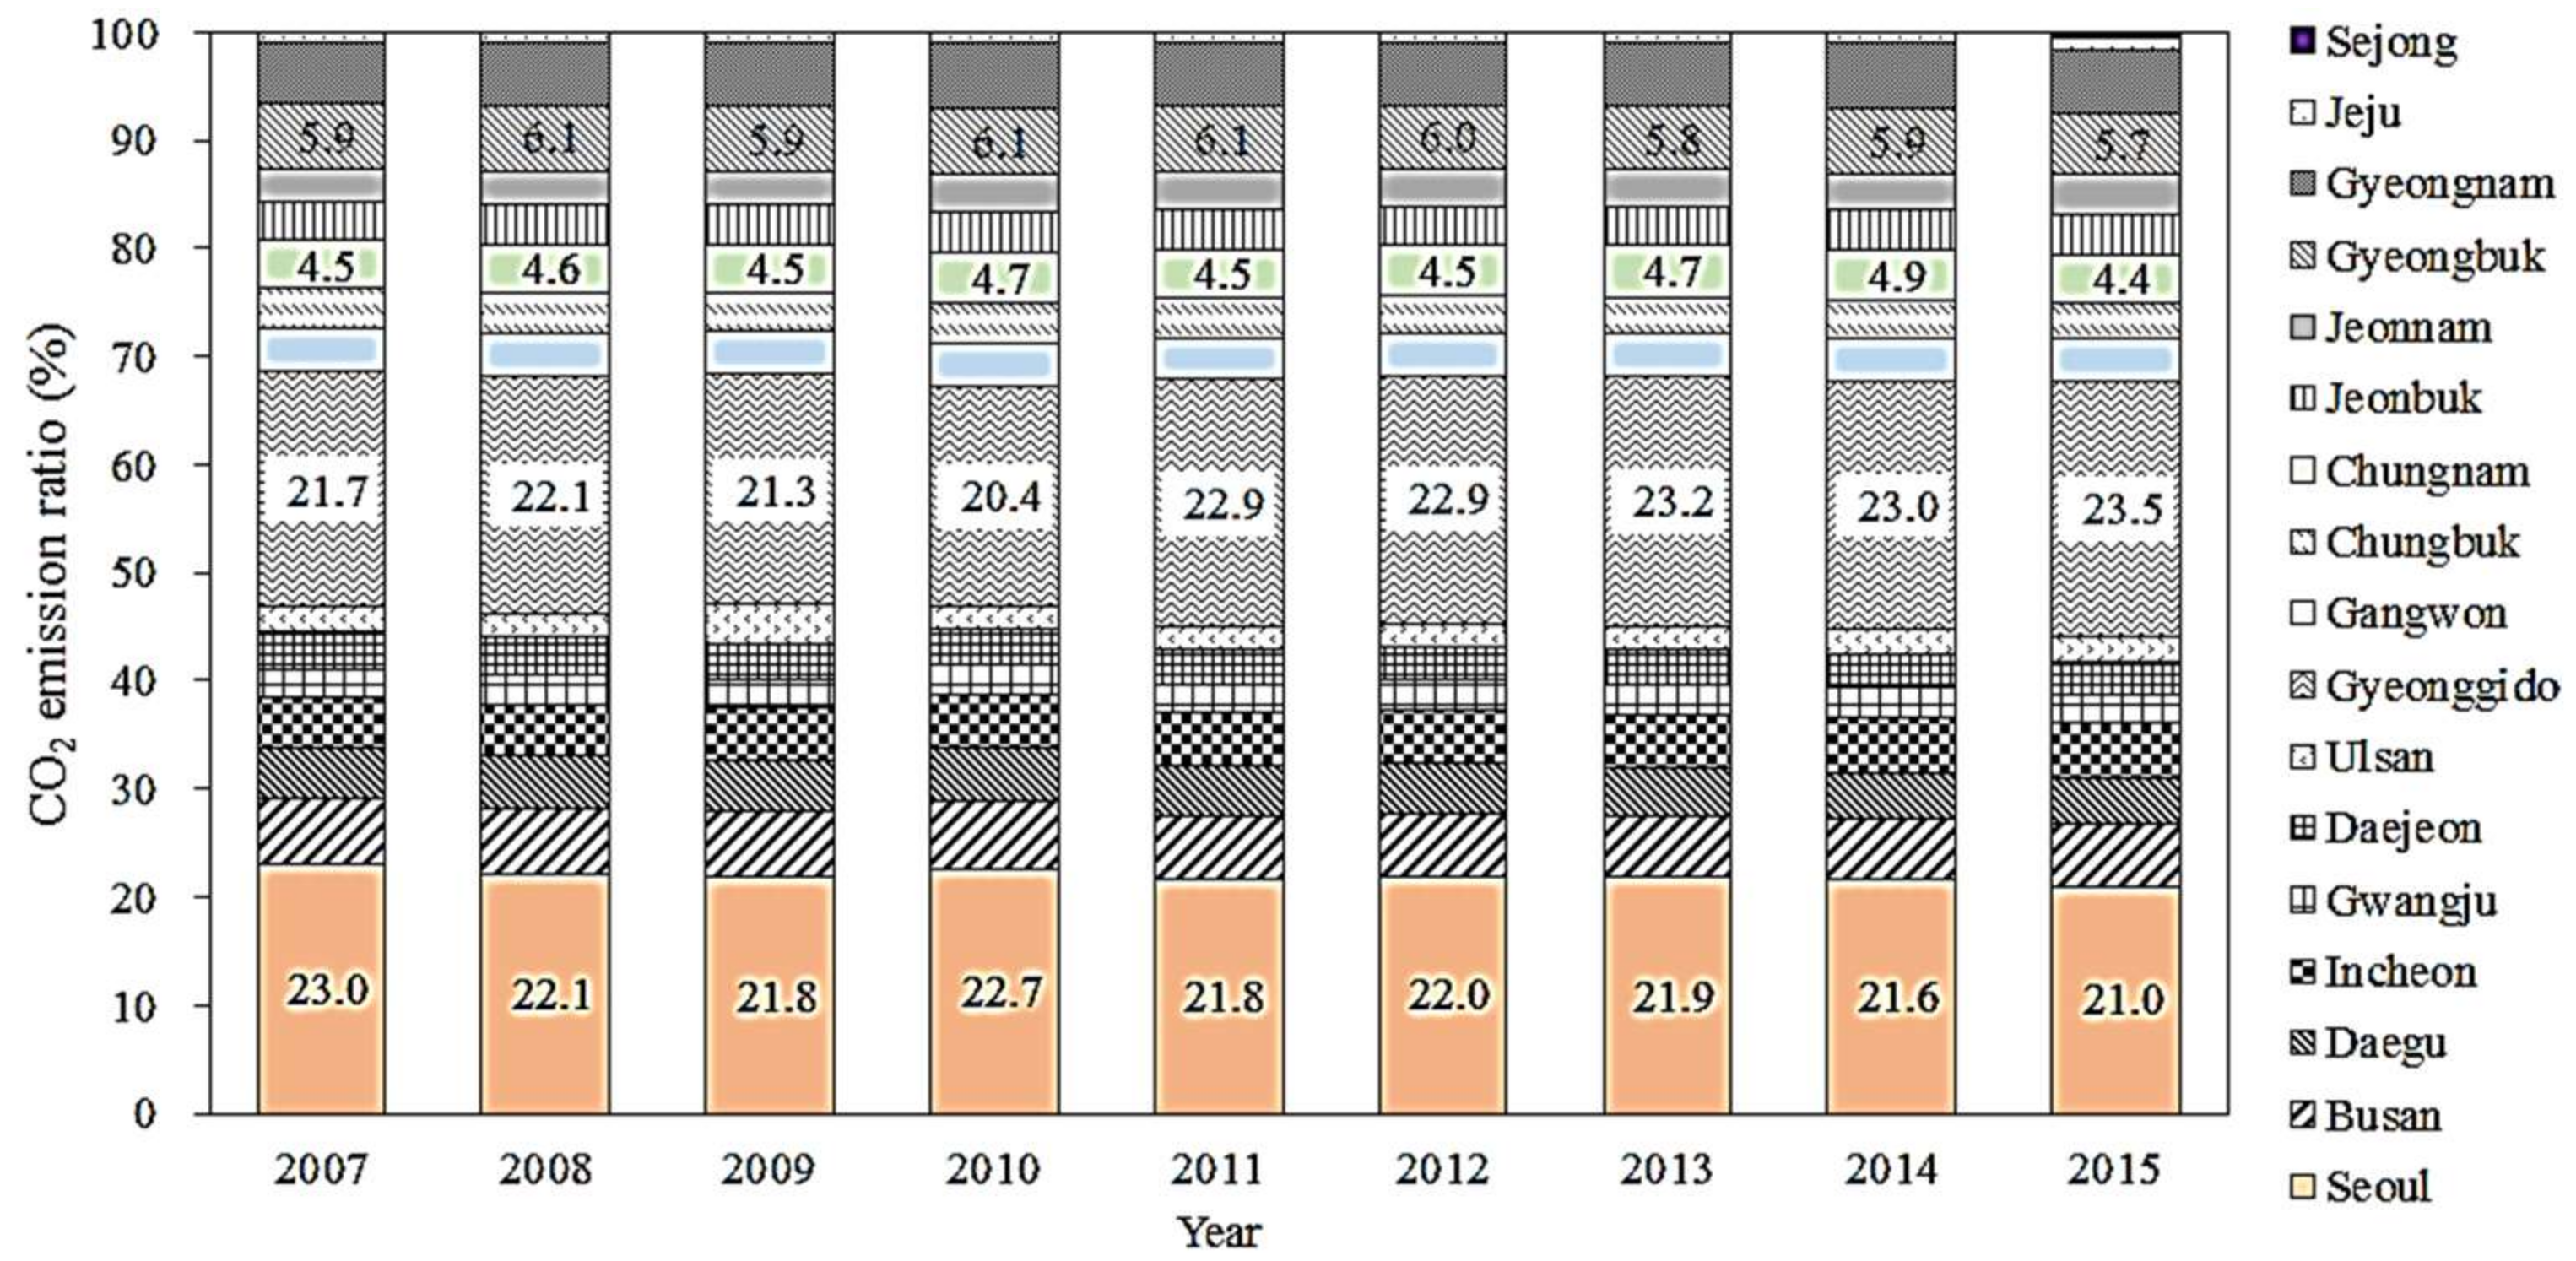
As of 2015, regions with the highest greenhouse gas emission (124.9 million tCO2) from Korea’s residential and commercial buildings were Gyeonggi (24%), Seoul (21%), Busan (5.8%), Gyeongbuk (5.8%), and Gyeongnam (5.7%) (Figure 11). These five regions took up 62% of the greenhouse gas emission of the entire building sector, while Jeju (0.6%), Gwangju (2.6%), Ulsan (2.5%), Daejeon (3.0%), and Chungbuk (3.4%) had little greenhouse gas emission.
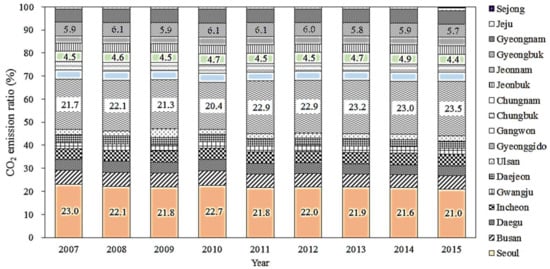
Figure 11.
Percentage comparison of greenhouse emission in buildings by region (%).
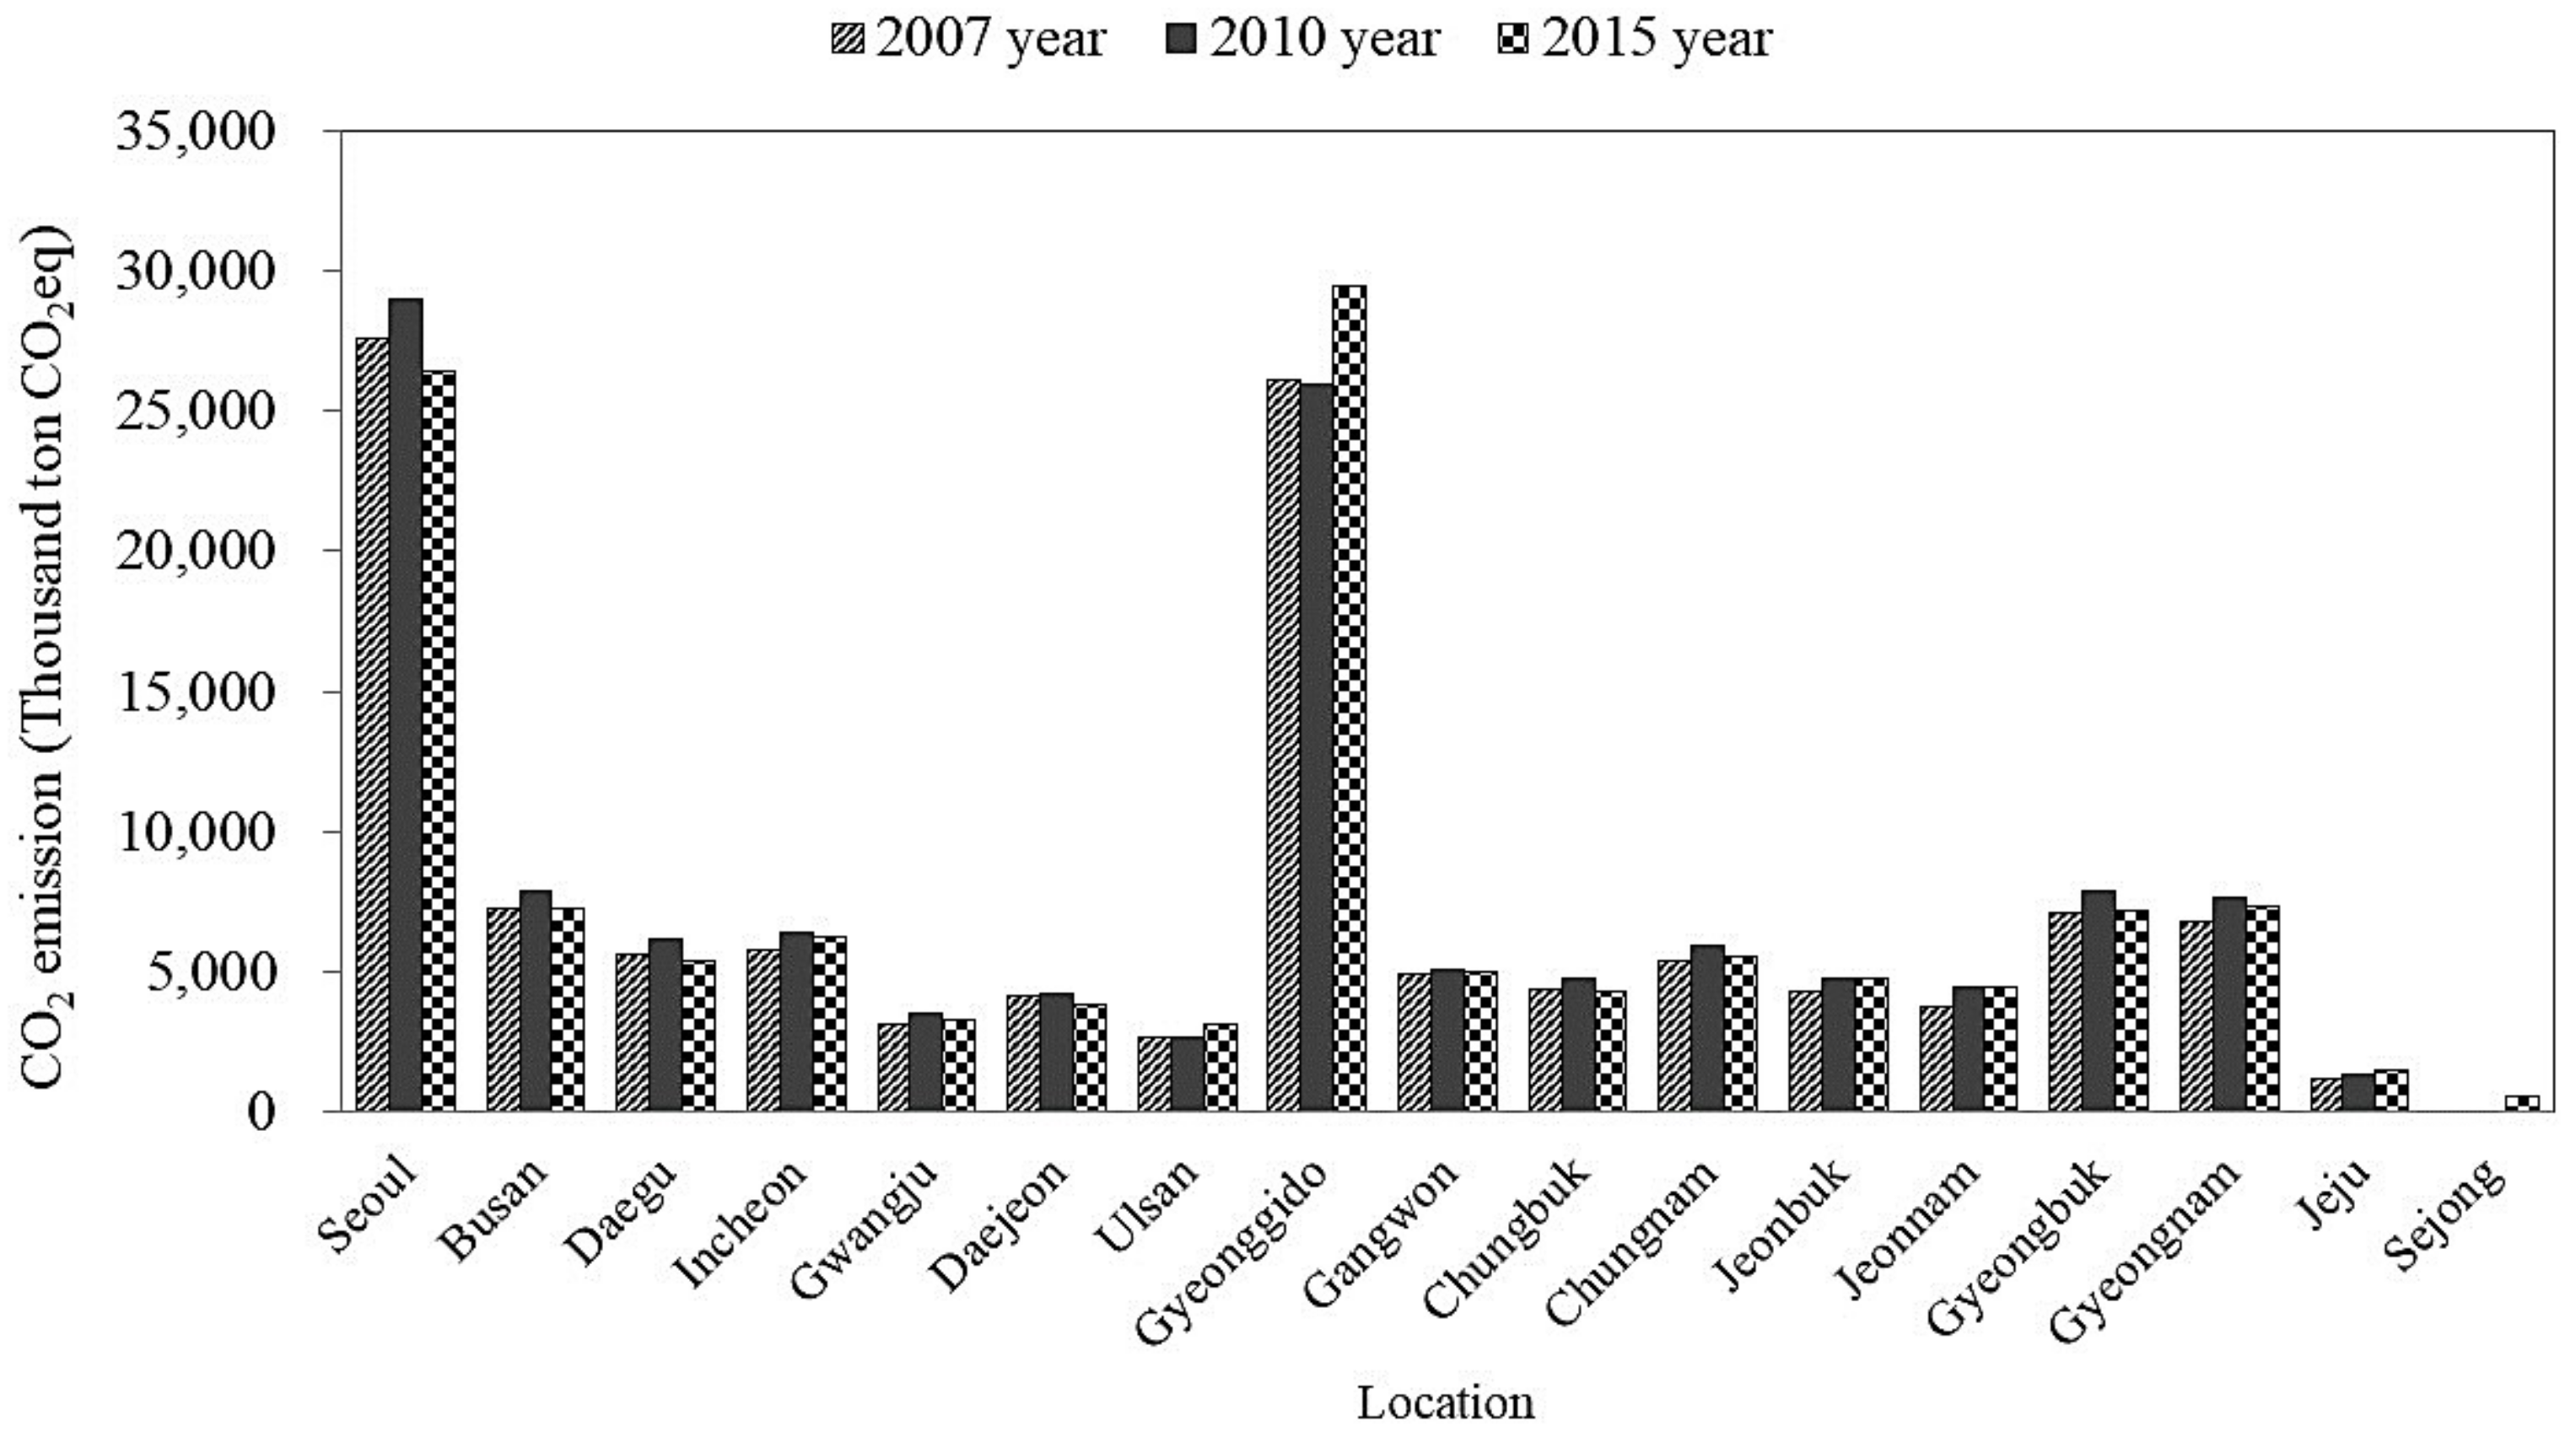
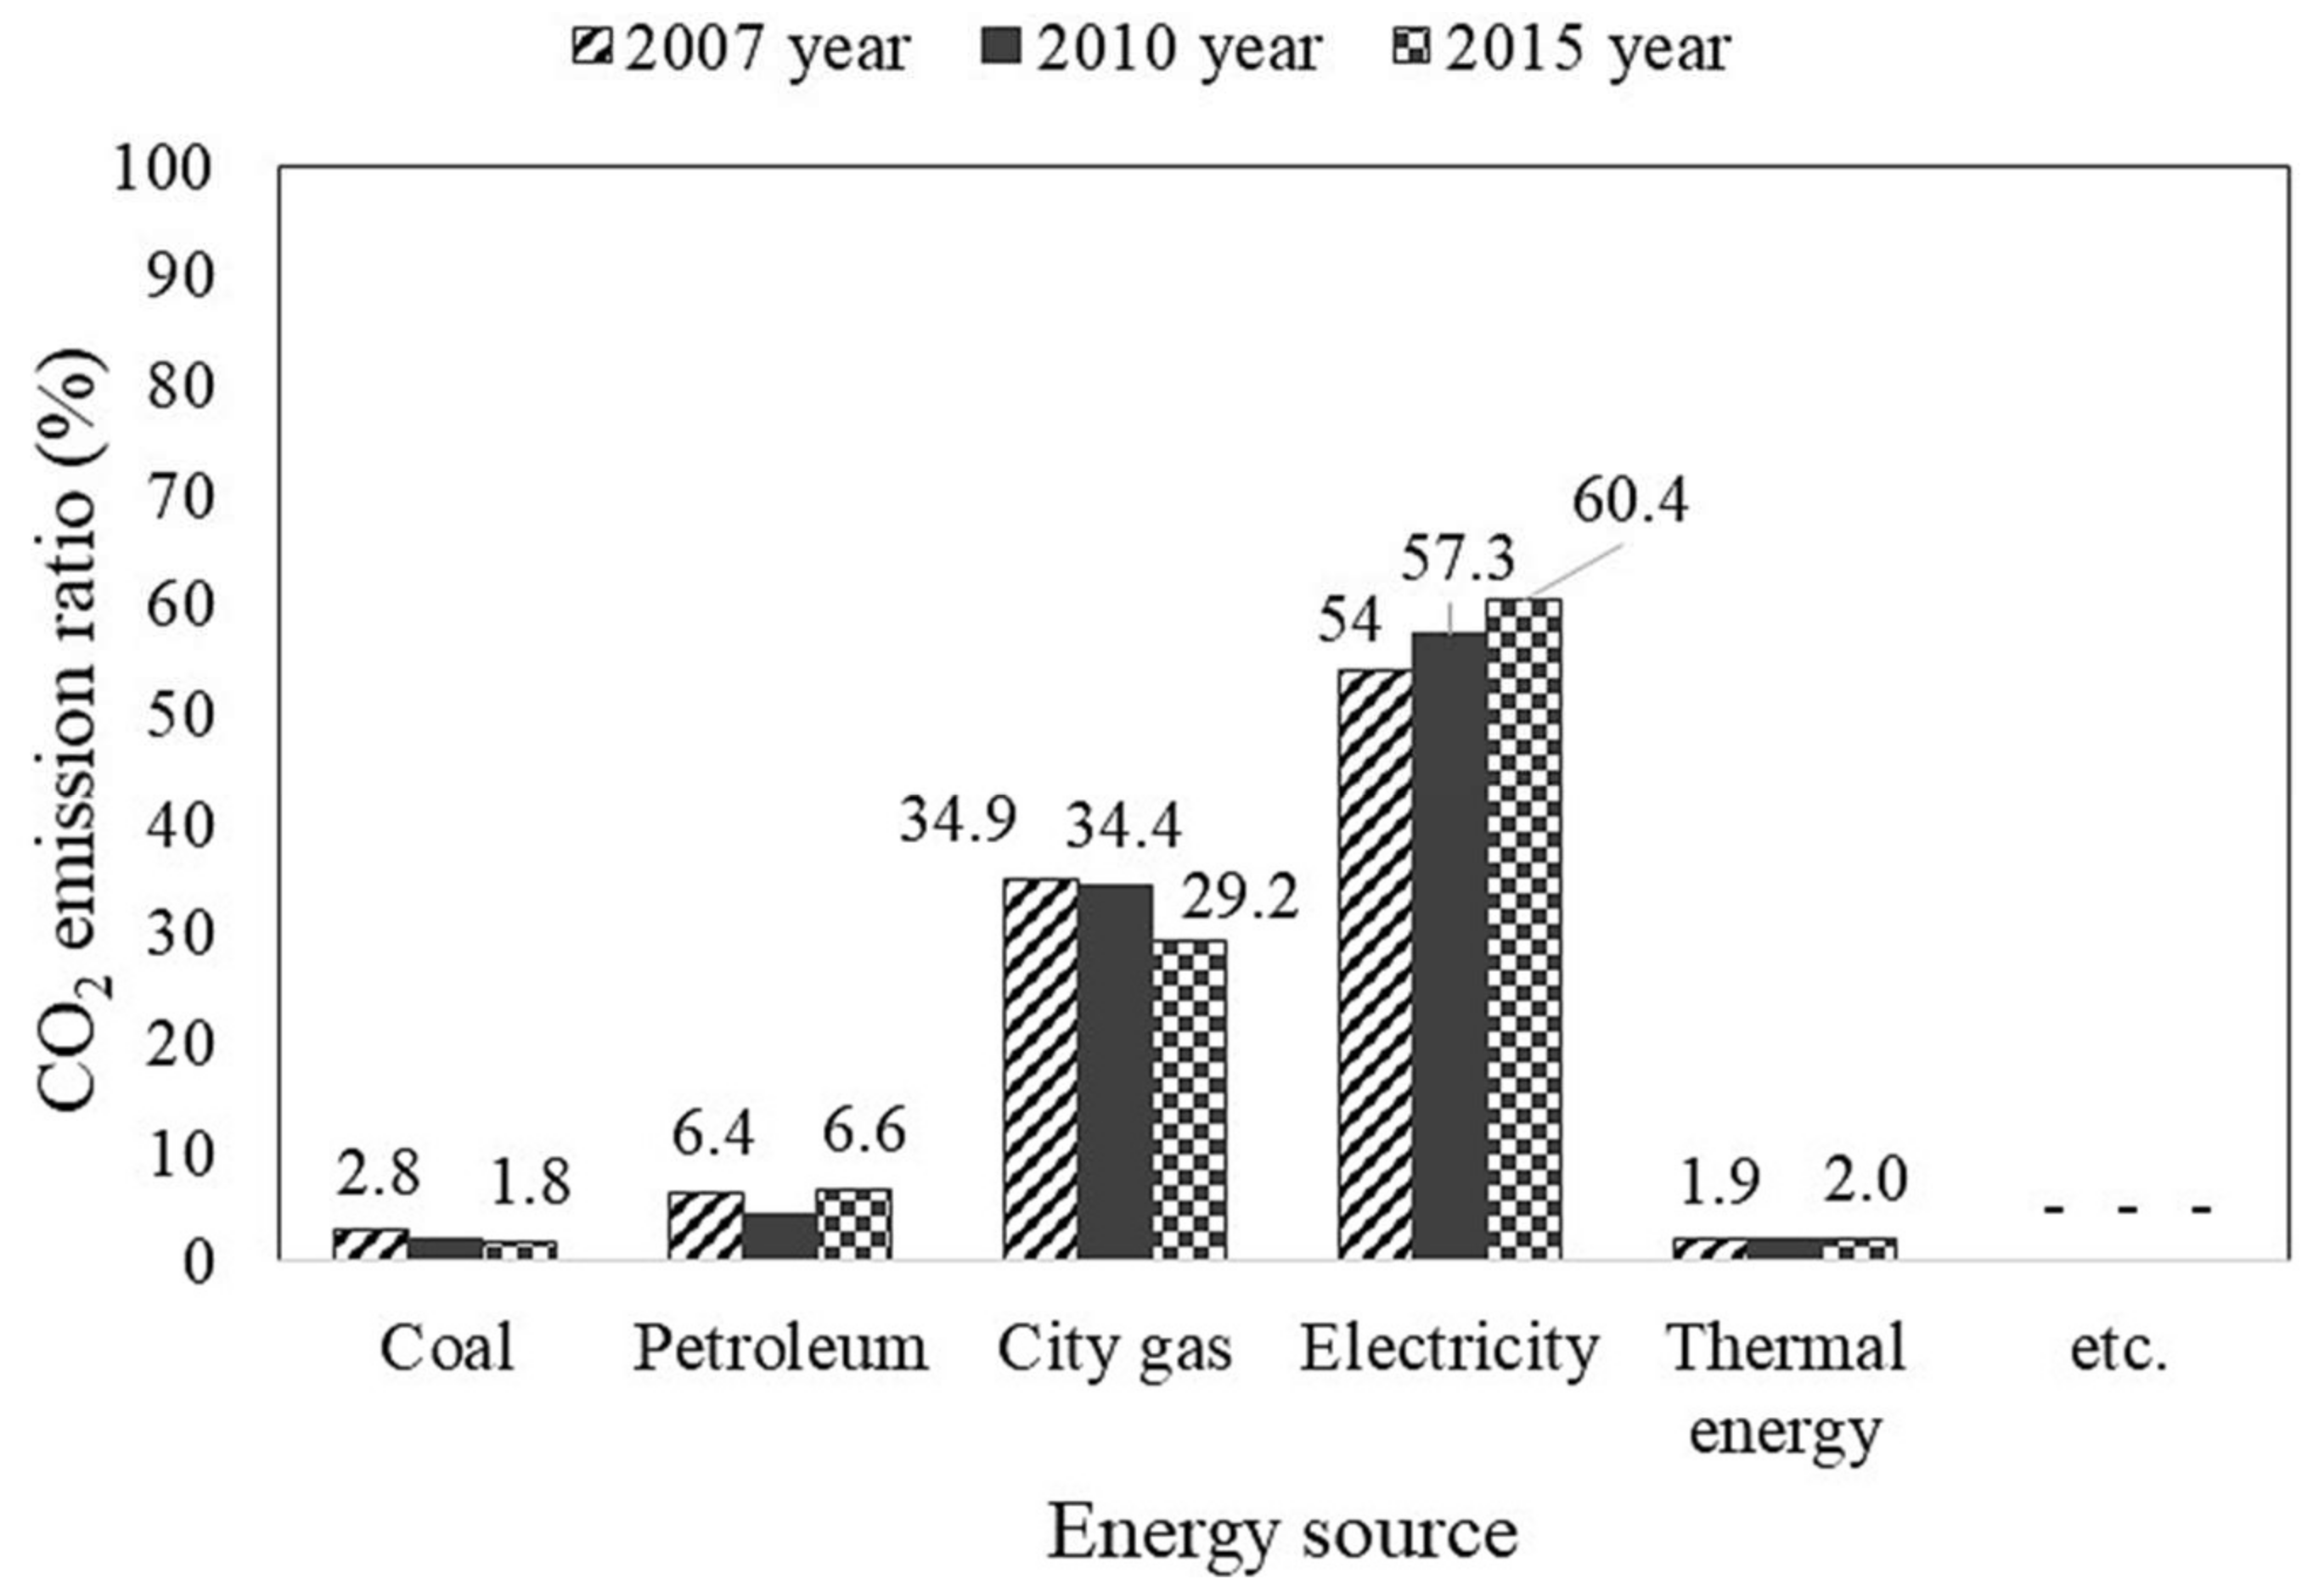
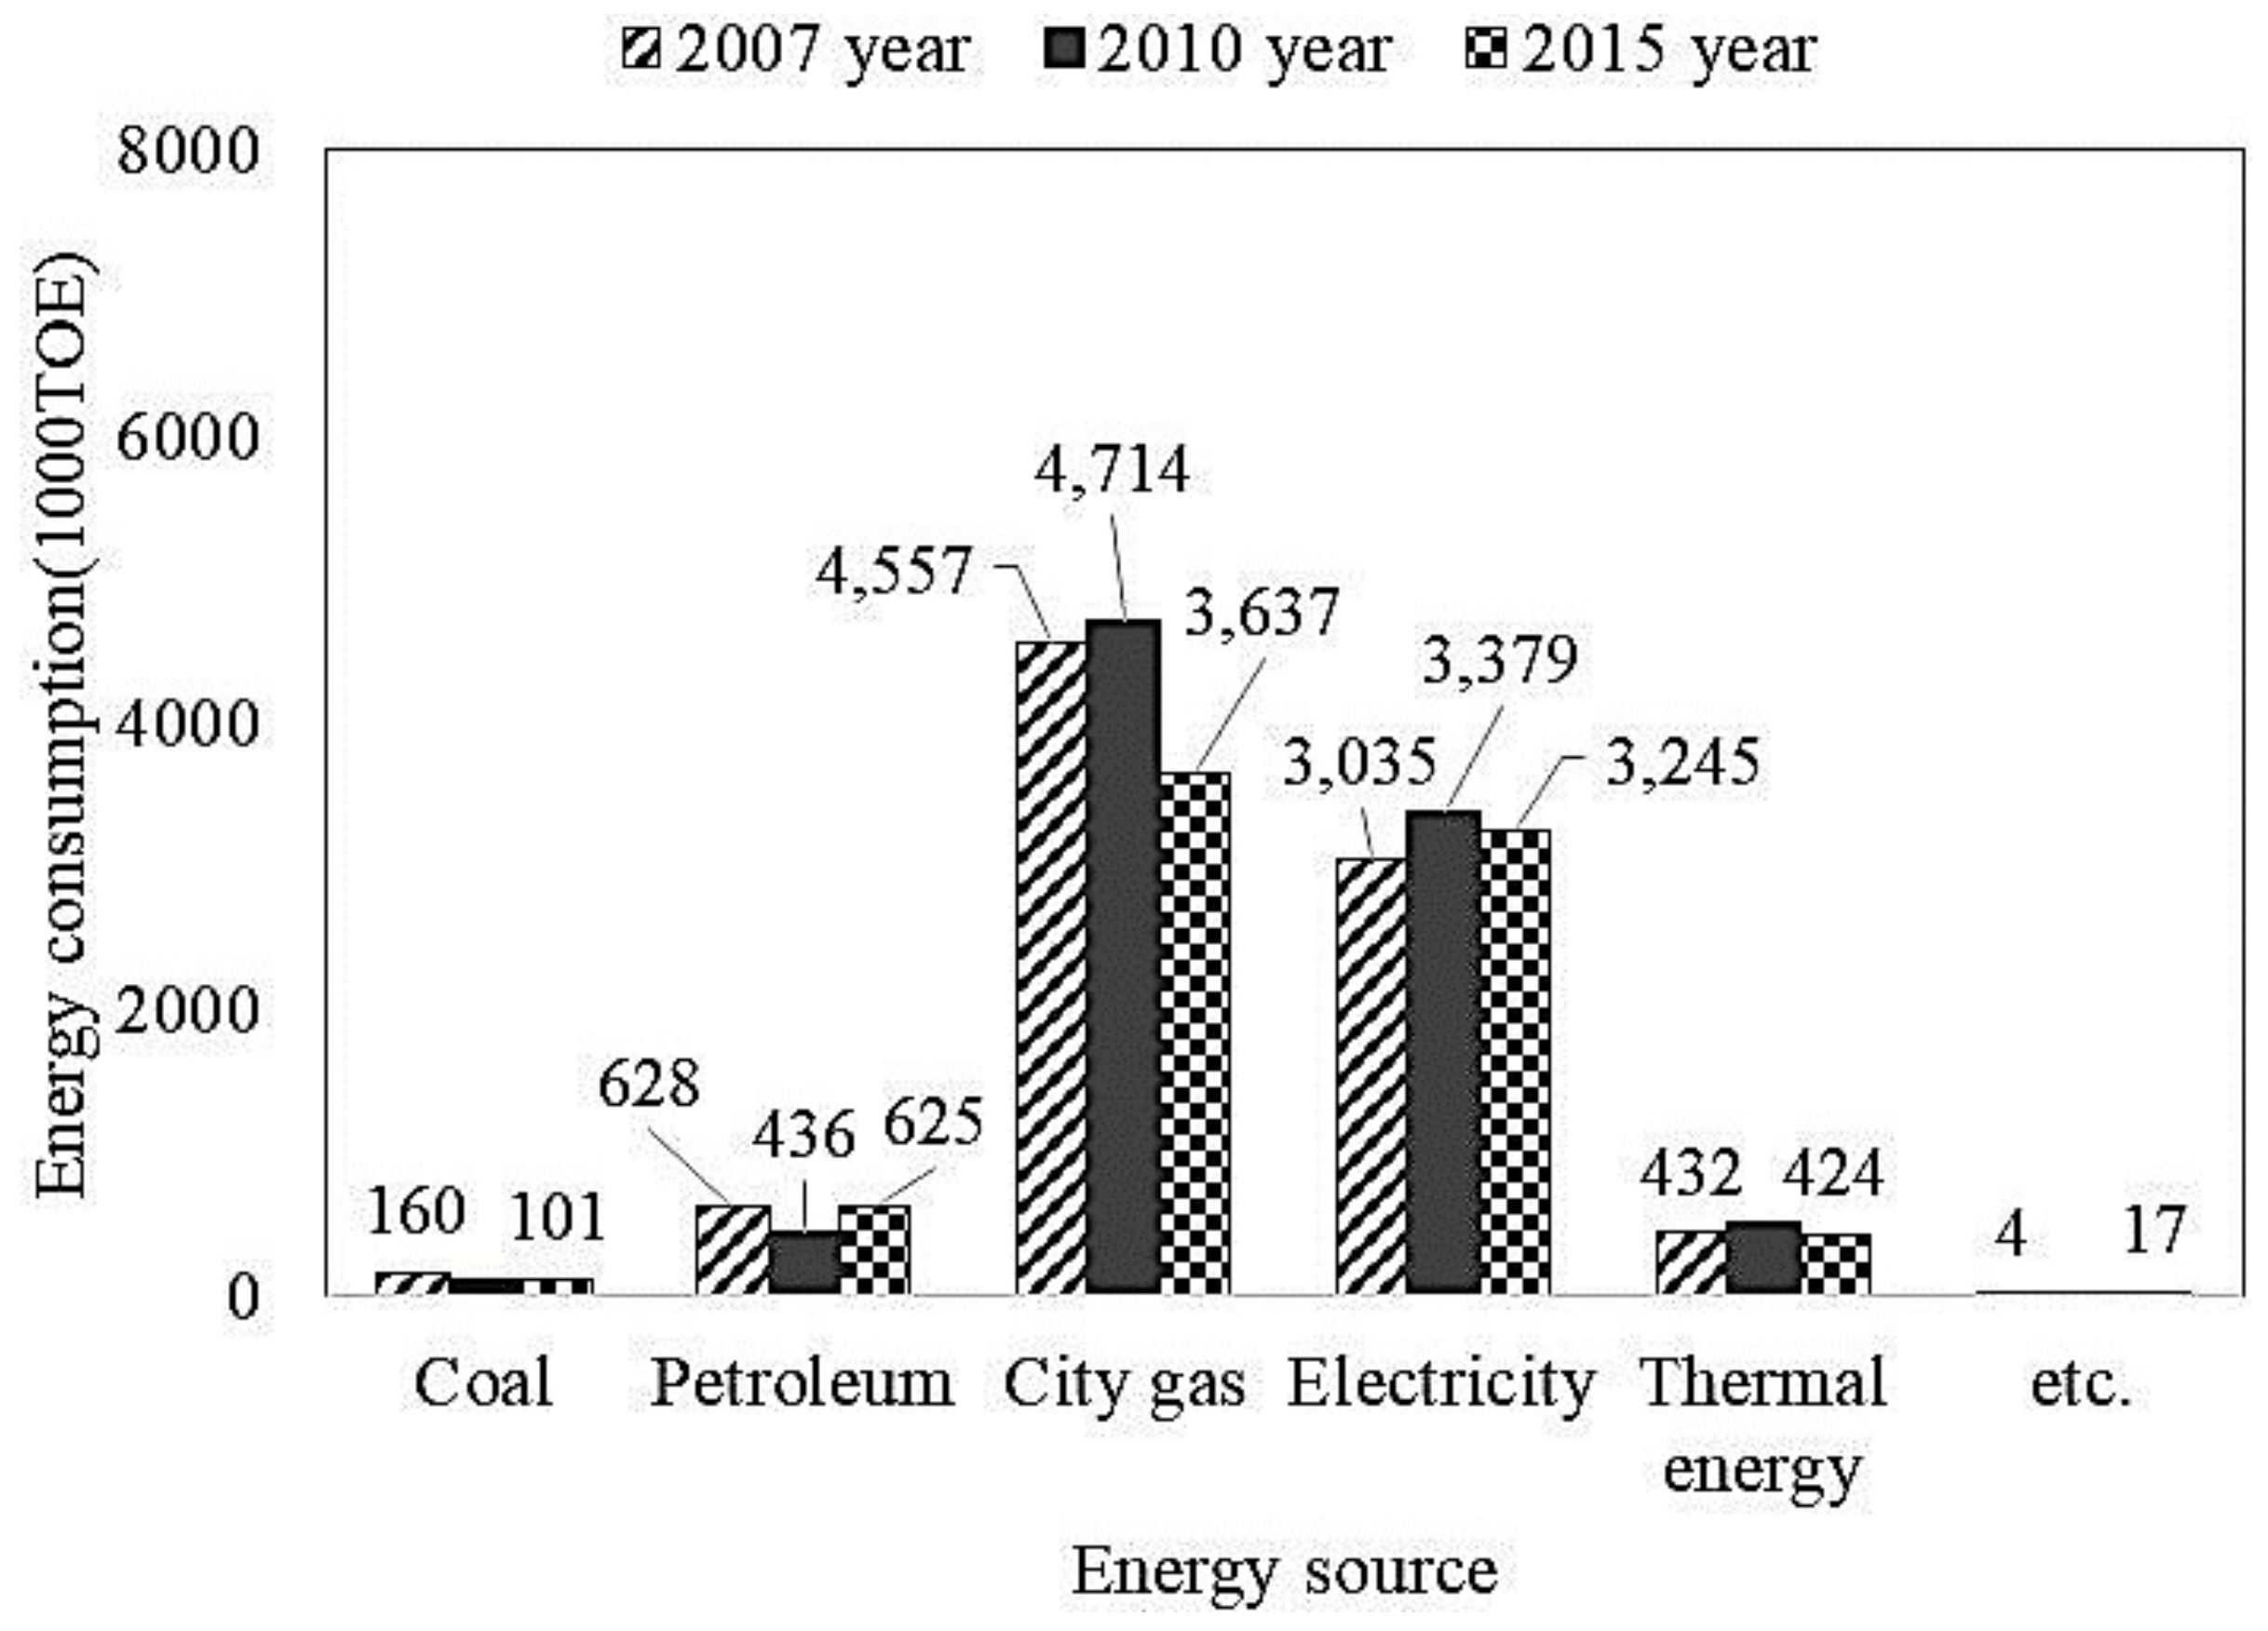
In 2010, greenhouse gas emission from Gyeonggi-do’s building sector increased only by 1% from 2007 but increased by 12% from 2010 to 2015 (Figure 12); greenhouse gas emission decreased because greenhouse gas emission due to electric power increased by 10% from 2007 but the emission was reduced due to the use of urban gas, oil, and coal (Figure 13). Gyeonggi-do’s electric power consumption increased by 16% in 2007 to 3,636,000 TOE (2010) and urban gas consumption decreased by 47% (Figure 14). Although urban gas consumption was reduced by 47% in 2010, greenhouse gas emission decreased only by 1% because the greenhouse gas emission coefficient of electric power is 4.91 (ton CO2eq/TOE), which is about twice the greenhouse gas emission coefficient (2.34-ton CO2eq/TOE) of urban gas. Seoul’s greenhouse gas emission in the building sector increased by 5% from 2007, but decreased by 6% from 2010 to 2015 (Figure 12).

Figure 12.
Comparison of greenhouse gas emission in buildings by region (2007, 2010, and 2015).
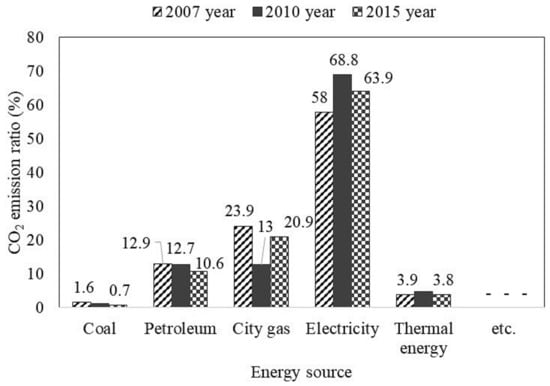
Figure 13.
Comparison of greenhouse gas emission in Gyeonggi-do.
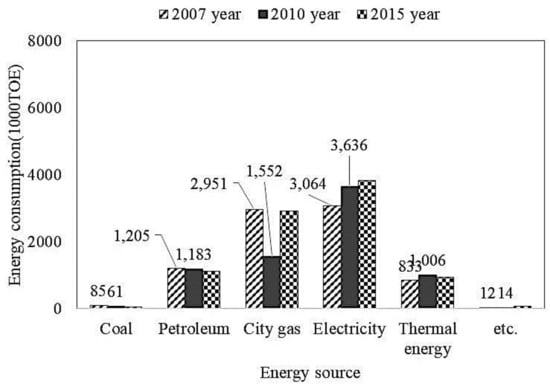
Figure 14.
Energy consumption by buildings in Gyeonggi-do.
Greenhouse gas emission decreased in 2015 because greenhouse gas emission from oil and electric power increased by 2% and 3%, respectively, from 2010 while urban greenhouse gas emission decreased by 5% (Figure 15). The analysis results of energy consumption show that electric power consumption was 3,245,000 TOE and urban gas consumption was 3,637,000 TOE in Seoul, a decrease by 4% and 30%, respectively, from 2010 (Figure 16).
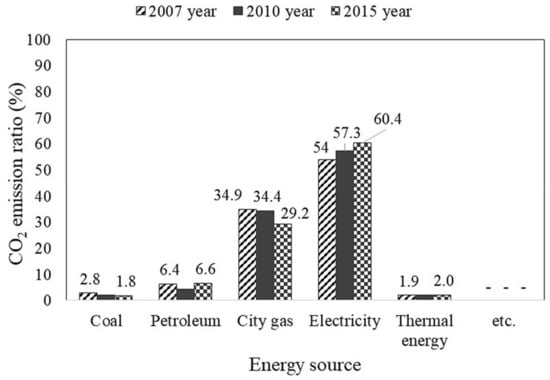
Figure 15.
Comparison of greenhouse gas emission in Seoul.

Figure 16.
Energy consumption by buildings in Seoul.
5. Discussion
The Joint Research Centre (JRC) of European Commission announced that Korea’s greenhouse gas emission in 2010 was 590 million ton (European Commission Joint Research Centre & Netherlands Environmental Assessment Agency, 2011). However, this was considerably different from what Internationales Wirtschaftsforum Regenerative Energien (IRW) of Germany announced: its World Greenhouse Gas Emission Trend Report said Korea’s greenhouse gas emission was 716 million ton. The greenhouse gas emission announced by the Greenhouse Gas Inventory and Research Center of the Ministry of Environment in Korea was 668 million ton. There are various reasons that a country’s greenhouse gas emission varies by announcing institution.
First, the calculation range of greenhouse gas emission can vary because, while some institutions only calculate the energy sector, other institutions include industry process and wastes. Second, different calculation methods, greenhouse gas emission coefficients, etc. are applied. The IPCC revised the calculation guidelines presented in 1996 and published 2006 guidelines, so institutions applied different calculation standards and greenhouse gas emission coefficients. For example, there are various greenhouse gas emission coefficients of electric power with a huge influence on the greenhouse gas emission of Korea. As shown in Figure 17, when the three electric power greenhouse gas emission coefficients that Korea announced are applied, greenhouse gas emission in the building sector differed from 26% to 54%; the greenhouse gas emission of electric power varied by 130%.
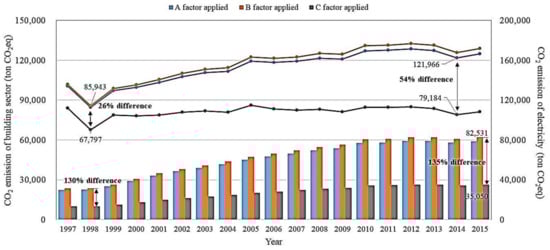
Figure 17.
Comparison of greenhouse gas emission in the building sector by electric power emission coefficient.
Nevertheless, as a member of the Climatic Change Convention, the Korean government has calculated greenhouse gas emission according to the UN standard and presented official greenhouse gas emission. However, there have been continuous disputes on whether the values of greenhouse gas emission announced by the governments of each country are true values. For example, it is questionable whether the greenhouse gas emissions announced by underdeveloped countries, which have not developed proper greenhouse gas database, are reliable. Similarly, a problem can be raised on the reliability of greenhouse gas emission data announced by the Korean government.
Regarding this, IPCC has required to report how accurate the officially announced values of greenhouse gas emission are, regulating countries to report “uncertainty” for the deviation of greenhouse gas emission by country. Based on this, the Korean government calculates uncertainty from the “National Greenhouse Gas Inventory Report” announced every year. However, it merely applies the basic value provided by the IPCC and has missing values, so it only enumerates the uncertainty of each specific item rather than calculating the entire uncertainty.
6. Conclusions and Limitations
Every country in the world is striving to deal with climate change, such as global warming and environmental pollution caused by greenhouse gas emission as well as the depletion of fossil fuel including oil, coal, gas, etc. Countries have set a long-term greenhouse gas emission reduction target in this effort.
This paper calculates the national and building sector greenhouse gas emission based on energy consumption statistics, in order for Korea to achieve Post-2020 greenhouse gas reduction target, predict building sector’s greenhouse gas emission, and implement and reduction policy.
In Korea, the national greenhouse gas emission was 694.5 million Ton CO2eq, which was an increase by 2.36 times from 1990. For emission composition by sector, industry accounted for 67% (average), building sector (residential/commercial) for 12% (average), transportation sector for 19% (average), and public sector for 1.2% (average). For emission composition by energy source, coal accounted for 16% (average), petroleum for 48% (average), urban gas for 7% (average), and electricity for 27% (average), while thermal energy had no influence.
Greenhouse gas emission in Korea’s building sector was about 124.9 million ton CO2eq, 20% of the national greenhouse gas emission; it decreased slightly in 1998 but has continuously increased from 2007. As of 2015, the proportion by energy source showed that electric power accounted for 63%, urban gas for 21%, oil for 11%, thermal energy for 3%, and coal for 2%. Among greenhouse gas emission by energy source, oil decreased greatly from 52% (1997) to 12% (2015), while the gas emission by electric power and thermal energy increased from 32% (1997) to 66% (2015).
The regions with the highest percentage among the building sector’s greenhouse gas emission (124.9 million ton CO2eq) in Korea were Gyeonggi (24%), Seoul (21%), Busan (5.8%), Gyeongbuk (5.8%), and Gyeongnam (5.7%), which accounted for 62% of the greenhouse gas emission of the building sector.
If a limit value of 28.2 million ton CO2eq (Gyeonggi) suggested by the 1st Basic Plan for Green Structures is applied, the greenhouse gas emission (29.4 million ton CO2eq) of Gyeonggi-do in 2015 exceeds the standard by 1.2 million ton CO2eq, which requires a reduction measure.
The limitations of this study are that the entire emission can considerably vary by evaluator, depending on the application of different greenhouse gas emission coefficients by energy source to calculate greenhouse gas emission. Therefore, follow-up studies need to have consistent analysis with improved reliability by applying the standardized greenhouse gas emission coefficient among institutions in Korea. In addition, additional research is required to integrate and estimate the direct and indirect influence of the increase in gross domestic production (GDP), building area, building form, population, number of households, temperature, city size, etc. to analyze the characteristics of the greenhouse gas emission
It is necessary to continuously conduct research on energy consumption trends according to households, time, and patterns, and not only the analysis of greenhouse gas emission generated by the consumption of energy in buildings. Especially, since residential buildings have an increasing consumption of thermal energy, it is necessary to perform more specific research on load types.
Through greenhouse gas reduction, it is possible to enhance the ability of climate change response with the new climate system and achieve the medium- and long-term national greenhouse gas reduction target of Post-2020. This will contribute to more efficient national energy consumption, switch to a non-carbon society, and the active creation of green cities and green structures.
Acknowledgments
This research was supported by a grant from the Urban Architecture Research Program, funded by the Ministry of Land, Infrastructure and Transport (No. 17AUDP-C127876-01).
Author Contributions
All the authors contributed substantially to all aspects of this article.
Conflicts of Interest
The authors declare no conflict of interest.
References
- World Energy Outlook; International Energy Agency: Paris, France, 2015. Available online: http://www.worldenergyoutlook.org/ (accessed on 5 January 2018).
- Office for Government Policy Coordination in Korea. The First Basic Plan for Response to Climate Change; Sejong-si, Korea, 2016; 12, 68–70. Available online: http://www.motie.go.kr/motie/ne/presse/press2/bbs/bbsView.do?bbs_seq_n=158865&bbs_cd_n=81 (accessed on 4 April 2018).
- IPCC Fifth Assessment Report. 2014. Available online: http://www.ipcc.ch/ (accessed on 5 January 2018).
- IPCC Forth Assessment Report. 2007. Available online: http://www.ipcc.ch/ (accessed on 5 January 2018).
- International Energy Agency. World Energy Outlook. 2012. Available online: https://www.iea.org/publications/freepublications/publication/IEA_Annual_Report_publicversion.pdf (accessed on 5 January 2018).
- Ministry of Trade, Industry and Energy (MOTIE). 2030 Energy New Industry Proliferation Strategy for Responding to the Post-Sourcing System: Sejong-si, Korea, 2015, 11. Available online: http://academic.naver.com/article.naver?doc_id=301608061 (accessed on 4 April 2018).
- Jan, R.; Anne, M. Energy Efficiency Trends and Policies in the United Kingdom; Ricardo Energy & Environment: Oxfordshire, UK, 2015. [Google Scholar]
- U.S. Energy Information Administration (EIA). 2012. Available online: https://www.eia.gov/ (accessed on 5 January 2018).
- Kim, D.K.; Lee, J.H.; Park, H.S.; Jung, J.S. Calculation and Analysis of GHG Emissions from Building by analysis of Energy Consumption Survey. Korea Soc. Energy Clim. Chang. 2013, 8, 30–44. [Google Scholar]
- Cho, S.K.; Kim, Y.H. Compiling and Analyzing GHGs Emission Statistics in Building Sector for Green Building Policy; AURI (Architecture & Urban Research Institute): Sejong-si, Korea, 2013; p. 194. [Google Scholar]
- Jiang, R.; Li, R. Decomposition and Decoupling Analysis of Life-Cycle Carbon Emission in China’s Building Sector. Sustainability 2017, 9, 793. [Google Scholar] [CrossRef]
- Jeong, Y.-S. Assessment of Alternative Scenarios for CO2 Reduction Potential in the Residential Building Sector. Sustainability 2017, 9, 394. [Google Scholar] [CrossRef]
- Airaksinen, M.; Matilainen, P. A Carbon Footprint of an Office Building. Energies 2011, 4, 1197–1210. [Google Scholar] [CrossRef]
- Lin, B.; Liu, H. CO2 emissions of China’s commercial and residential buildings: Evidence and reduction policy. Build. Environ. 2015, 92, 418–431. [Google Scholar] [CrossRef]
- Kavgic, M.; Mavrogianni, A.; Mumovica, D.; Summerfield, A.; Stevanovic, Z.; Djurovic-Petrovic, M. A review of bottom-up building stock models for energy consumption in the residential sector. Build. Environ. 2010, 45, 1683–1697. [Google Scholar] [CrossRef]
- Calise, F.; D’Accadia, M.D.; Barletta, C.; Battaglia, V.; Pfeifer, A.; Duic, N. Detailed Modelling of the Deep Decarbonisation Scenarios with Demand Response Technologies in the Heating and Cooling Sector: A Case Study for Italy. Energies 2017, 10, 1535. [Google Scholar] [CrossRef]
- Li, K.; Pan, L.; Xue, W.; Jiang, H.; Mao, H. Multi-Objective Optimization for Energy Performance Improvement of Residential Buildings: A Comparative Study. Energies 2017, 10, 245. [Google Scholar] [CrossRef]
- Astiaso Garcia, D.; Cumo, F.; Tiberi, M.; Sforzini, V.; Piras, G. Cost-Benefit Analysis for Energy Management in Public Buildings: Four Italian Case Studies. Energies 2016, 9, 522. [Google Scholar] [CrossRef]
- IPCC Guidelines for National Greenhouse Gas Inventories. 1996. Available online: http://www.ipcc-nggip.iges.or.jp/public/gl/invs1.html (accessed on 5 January 2018).
- IPCC Guidelines for National Greenhouse Gas Inventories. 2006. Available online: http://www.ipcc-nggip.iges.or.jp/public/2006gl/ (accessed on 5 January 2018).
- ISO 14064, Standards Provide Tools for Assessing and Supporting Greenhouse Gas Reduction and Emissions Trading. Available online: https://www.iso.org/news/2006/03/Ref994.html (accessed on 5 January 2018).
- Greenhouse Gases—Part 1: Specification with Guidance at the Organization Level for Quantification and Reporting of Greenhouse Gas Emissions and Removals. Available online: https://www.iso.org/standard/38381.html (accessed on 5 January 2018).
- Greenhouse Gas Protocol. Available online: http://www.ghgprotocol.org/ (accessed on 5 January 2018).
- IPCC. Guidelines for National Greenhouse Gas Inventories; IPCC: Geneva, Switzerland, 2006. [Google Scholar]
- Guidelines for Greenhouse Gas, Energy Target Management; Ministry of Environment: Sejong City, Korea, 2011.
- Yearbook of Energy Statistics, Korea Energy Economics Institute. Available online: http://www.keei.re.kr/main.nsf/index.html (accessed on 5 January 2018).


© 2018 by the authors. Licensee MDPI, Basel, Switzerland. This article is an open access article distributed under the terms and conditions of the Creative Commons Attribution (CC BY) license (http://creativecommons.org/licenses/by/4.0/).