Abstract
The porous structure of oil shale plays a vital role in heat transfer and mass transport. In this study, the pore evolution of oil shale samples during sub-critical water extraction was investigated by scanning electron microscope (SEM), N2 adsorption/desorption, and low field nuclear magnetic resonance (NMR). The following results were obtained: (1) With increased extraction time and extraction temperature, the yield of bitumen increased, pores in spent samples obviously developed and extended to the inner of the shale matrix, and their pore size gradually increased from the nano to micron size; (2) Pore volume and surface area of mesopores increased with increasing yield, indicating that the extraction of organic matter improves the development of organic matter pores distributed in mesopores; (3) The formation of secondary organic matter pores primarily contributes to the increment of pore volume in oil shale samples. The diameter of kerogen may range from 100 to 1600 nm; (4) Fractures probably propagated parallel to the bedding direction, and their evolution led to an initial increase in the total pore volume followed by a decrease. This is likely because fractures will be strongly compacted by pressure due to the weakening of inner support after more organic matter is extracted.
1. Introduction
Oil shale is a natural, fine-grained, laminated black or brown combustible material, and it consists of complex organic material of high molecular weight called kerogen, which is finely distributed in an inorganic matrix [1,2,3,4,5,6]. Oil shale is structurally heterogeneous, porous, and amorphous [7,8]. As an important complementary and alternative energy source of oil, oil shale has been gaining wide attention. Sub-critical water extraction technique is a promising method; its operating cost is low and environmental pollution caused by organic solvents and catalysts can be avoided. Sub-critical water as a new medium and good solvent can recover organic matter from oil shale owing to its solvent properties similar to polar organic solvents [9,10,11]. During sub-critical water extraction, pore evolution of oil shale influences the processes of conversion and hydrocarbon expulsion [12], especially for organic matter. Therefore, the pore evolution of oil shale during sub-critical water extraction remains a topic of interest to be explored, and findings related to it will serve as a guide towards the development of in-situ conversion [13,14].
In the last few years, many researchers have paid increasing attention to the pore evolution of oil shale during sub-critical water or the super critical water extraction [15,16,17,18,19]. Mastalerz et al. [16] used low-pressure nitrogen adsorption measurements to analyze to study the pore characteristics of two shale samples with similar maturities but different total organic carbon (TOC) contents. Pour et al. [20] used the mercury intrusion method on shales to determine two fractal dimensions, pore volume and pore length. Some of the most widely used laboratory methods for measuring pore characteristic of oil shale include scanning electron microscope (SEM), N2 adsorption/desorption, and mercury intrusion porosimetry (MIP) [15,16,17,18,19,20,21,22]. However, these methods all have some limitations. For example, in MIP, high-pressure intrusion by mercury may either distort the skeletal porous structure of samples [23] or reduce the amount of large pores due to the shielding effect of smaller pores [24]. Therefore, a nondestructive, accurate, and efficient method for measuring the pore characteristics of oil shale has become an urgent requirement.
Recently, the low-field nuclear magnetic resonance (NMR) technique, a fast, convenient and non-destructive detection method which has been widely used in porosity measurements and fine reservoir descriptions of shale in both laboratory and well logging [25,26,27,28,29], is improved to investigate and estimate the pore characteristics of reservoir rocks [30,31,32,33,34]. While, the application of the low-field NMR in the research of the pore evolution of oil shale during sub-critical water extraction has rarely been reported.
In this study, we simulated the in-situ mechanical state of oil shale samples using special grips and aimed to clarify the pore evolution of the oil shale samples during sub-critical water extraction. The samples were analyzed using SEM, N2 adsorption/desorption, and low-field NMR method.
2. Material and Methods
2.1. Samples
Huadian Basin is located along the Dunhua–Mishan fault zone in northeastern China, and it is an important oil-shale and coal-bearing basin. According to Sun et al. [35], these correspond to three 3rd order sequences. From bottom to top, the members (sequences) are: pyrite member (Sequence I), oil shale member (Sequence II), and carbonaceous shale member (Sequence III). The oil shale samples were collected from the 4th layer (within the depth of 70.0–60.0 m) of Dachengzi mine located in Huadian, Jilin Province of China. All samples were carefully packed and immediately sent to the laboratory. The fundamental characteristics of the oil shale samples are given in Table 1. Before sub-critical water extraction, oil shale samples were prepared as cylinders of 25 mm diameter and 30 mm height using a diamond wire saw machine (Taizhou Chenhong NC Equipment Manufacturing Ltd., Taizhou, China).

Table 1.
Fundamental Characteristics of Huadian Oil Shale Samples.
2.2. Experimental Procedure
The in-situ mechanical state of raw sample was simulated by constraining the radial deformation of raw sample prior to the sub-critical water extraction: firstly, the raw sample was circumferentially warped by a strip of copper foil. Then, the raw sample was gripped by the clamps and banded by the ring. The gripped sample is presented in Figure 1.
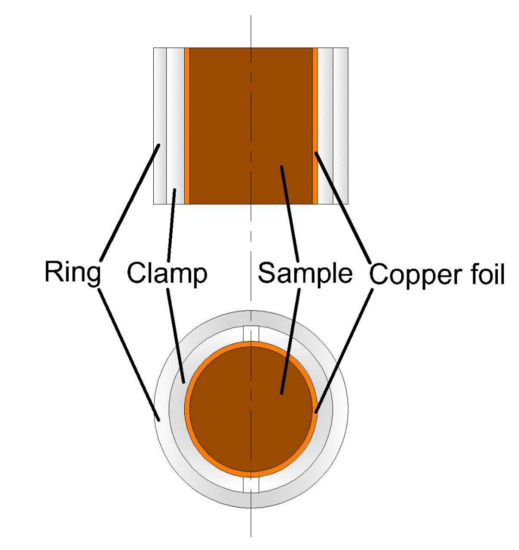
Figure 1.
Gripped oil shale sample.
Sub-critical water extraction was performed in a 500 mL stainless steel reactor. The design temperature and pressure of the reactor were 400 °C and 30.0 MPa, respectively. Firstly, the gripped raw sample and 250 mL water were placed in the reactor. Then, nitrogen was filled into the reactor for displacing air. Finally, the reactor was quickly heated to the set temperature by an electric oven and held for the specified period of time. After sub-critical water extraction, the gases, bitumen, spent aqueous solution, and spent samples were subsequently collected when the reactor was cooled down to the room temperature.
The pore characteristics of the spent samples were measured using SEM, N2 adsorption/desorption, and NMR. In addition, the porosity of spent samples was measured by density measurement and NMR.
2.3. Experimental Methods
The surface micro-structure of oil shale samples was observed using an Hitachi S-4800 field emission SEM with an acceleration voltage of 1.5 kV. Moreover, sections cut in the direction parallel to the bedding plane of the oil shale samples were partially coated with gold conductive material for SEM observation.
The XRD pattern of the finely ground sample (<75 μm) was recorded on a Rigaku D/MAX 2550 diffractometer with Cu Ka radiation.
The low temperature N2 isotherm adsorption/desorption analysis was performed by using a SSA-7000 specific surface area and aperture analyzer (BIAODE Electronic Technology Ltd., Beijing, China). Prior to the nitrogen adsorption measurement, samples underwent vacuum degassing at 180 °C for 3 h. The specific surface area was determined by the multipoint Brunauer–Emmett–Teller (BET) method using adsorption data. The adsorption branch of the isotherm was used to calculate pore size distribution (PSD) with the Barrett–Joyner–Halenda method.
The NMR tests were conducted by using the Niumag MesoMR23-060H-1 low field NMR spectrometer. The spectrometer has a constant magnetic field strength of 0.55 T and a resonance frequency of 23.51 MHz. The measurement parameters were set as follows: echo spacing, 0.2 ms; waiting time, 2 s; echo numbers, 6000; numbers of scans, 32. Prior to sub-critical water extraction, the raw samples were vacuumed for 8 h, and then saturated in 100% distilled water for 8 h for NMR test, whereas spent samples could be tested without these preparations. The PSD of raw samples and spent samples was measured using the NMR method and their porosity was measured using the density measurement and NMR methods.
3. Results and Discussion
3.1. Effect of Extraction Condition on the Extract Yield
Figure 2a shows the yields (wt.ad) of bitumen extracted by sub-critical water at 350 °C. It can be observed that the yield rises dramatically from 3.4 to 12.5 wt % as the extraction time is increased from 10 to 50 h. It then increases slowly from 12.5 to 17.0 wt % with the extraction time prolonged from 50 to 150 h, and finally reduced to 16.4 wt % at 200 h. The maximum extract yield is achieved at 150 h, indicating that the initial bitumen extraction is much more rapid. The decrease of extraction efficiency later may be due to the decomposition of a large amount of weak-binding kerogen fragments [10]. The yield decreases with extraction time exceeding 150 h possibly due to the decomposition of more extracted bitumen to gases [9,10,11].
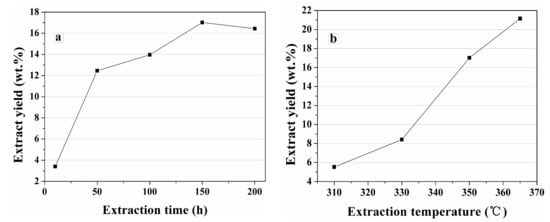
Figure 2.
Yield of bitumen extracted by sub-critical water at (a) 350 °C and (b) 150 h.
Figure 2b describes the yields of bitumen extracted by sub-critical water for 150 h at different temperatures. It is obvious that the increase of temperature improves the extraction of bitumen by sub-critical water. The yield of bitumen increases almost linearly from 5.5 to 21.1 wt % as the extraction temperature is increased from 310 to 365 °C. Thus, the extraction efficiency of subcritical water is significantly improved with increasing temperature.
3.2. SEM Analysis
The comparison of the surface morphology of raw oil shale and spent shale can directly reveal the pore evolution of oil shale during sub-critical water extraction. Figure 3 shows the SEM images of raw Huadian and five spent shale samples extracted by sub-critical water at 350 °C. As shown in Figure 3a, few pores are observed on the surface of the raw oil shale. The number of pores in the spent sample extracted for 10 h slightly increased (Figure 3b). In contrast, with the extension of the extraction, pores in spent samples obviously developed and extended to the inner part of the shale matrix, and their pore size gradually increased from the nano- to micron-scale as shown in Figure 3. The evolution of yields with time (Figure 2a) is similar to that of pore size.
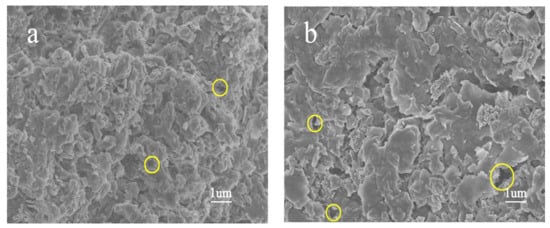
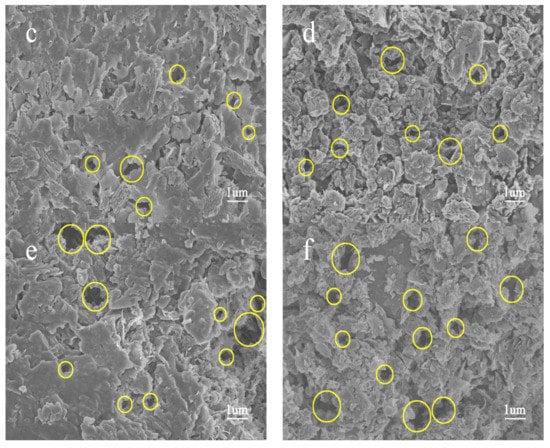
Figure 3.
SEM images of (a) raw sample and spent shale samples extracted by sub-critical water at 350 °C for (b) 10 h; (c) 50 h; (d) 100 h; (e) 150 h; and (f) 200 h extraction, respectively.
Figure 4 shows SEM images of the spent shale samples after 150 h extraction by sub-critical water at 310 °C to 365 °C. Compared with the pore distribution of the raw sample (Figure 3a), only few pores were generated after 310 °C sub-critical water extraction (Figure 4a). Pores in spent samples obviously developed and extended to the inner part of the shale matrix, and their pore size gradually increased from the nano- to micron-size with increasing extraction temperature (Figure 4b–d). This correlates with results obtained by Bai et al. [8]. The evolution of yields with temperature (Figure 2b) were similar to those of pore size.
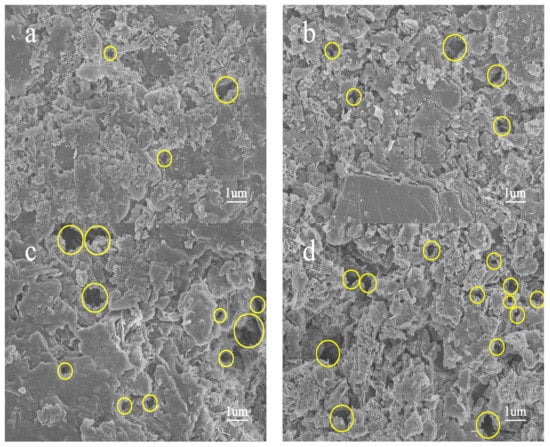
Figure 4.
SEM images of spent shale samples extracted by sub-critical water for 150 h, at: (a) 310 °C; (b) 330 °C; (c) 350 °C; and (d) 365 °C extraction, respectively.
The evolution of the pores in oil shale after sub-critical water extraction is probably due to the release of kerogen matter and some inorganic minerals. Figure 5 and Table 2 shows XRD analyses of raw oil shale and spent shale extracted by sub-critical water at 350 °C for 150 h. The dominant mineral components of oil shale were silicates, quartz, kaolinite, and calcite. Comparing curves in Figure 5 and data in Table 2, the contents of the carbonate minerals of the raw sample and the spent sample obtained after the sub-critical water extraction at 350 °C for 150 h were similar. This implies that, with increased extraction time or extraction temperature, the extract yield increases, number of pores in spent samples increases, and their pore size gradually increases from nano- to micron-sized, whereas the contents of the carbonate minerals do not significantly change. Therefore, the increment in the number of pores is probably caused by the release of organic matter.
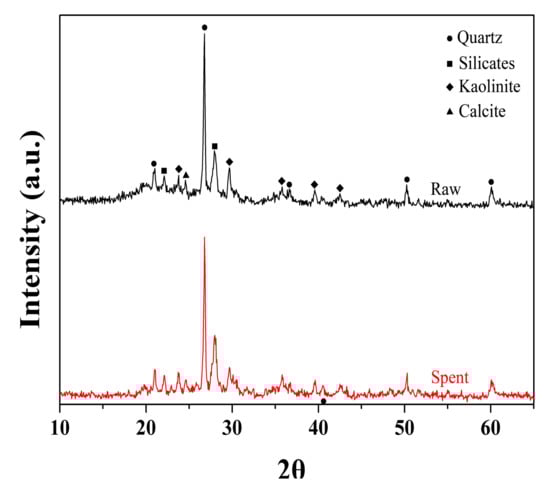
Figure 5.
XRD patterns of raw sample and spent sample extracted by sub-critical water at 350 °C for 150 h.
Table 2.
Mineral content of raw oil shale and spent shale sample.
3.3. Analysis of N2 Adsorption/Desorption
The SEM analysis mainly reveals the surface pore morphology evolution of shale samples, while it contributes little to the specific surface area and PSD. The N2 adsorption/desorption method is widely used to explore the pore shape and structure, particularly for mesopores (2–50 nm), according to the IUPAC classification. Typical nitrogen adsorption/desorption isotherms of the raw and spent shale samples extracted by sub-critical water at 350 °C for different time are shown in Figure 6, which correspond to a composite of Types II defined by IUPAC and indicate multi-layer adsorption. The adsorption branches of the isotherms gradually rise below P/P0 ≈ 0.8. When P/P0 > 0.9, the adsorption quantity sharply increases because of capillary condensation [36]. At relative pressures below 0.7, the adsorption isotherm is essentially coincident with the desorption isotherm, indicating that small pores are accessible via a single pore throat. As the relative pressure rises, a hysteresis loop occurs, which is attributed to the difference between the adsorption and desorption mechanisms. The hysteresis loops of the spent samples are similar to type H3 under the IUPAC classification [37], indicative of a slit pore shape.
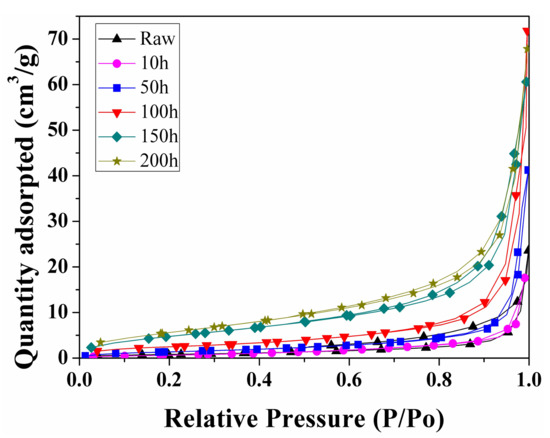
Figure 6.
Nitrogen adsorption/desorption isotherms of the raw sample and spent samples extracted by sub-critical water at 350 °C for different times.
Figure 7 shows the pore size distribution and specific surface area of spent samples extracted at 350 °C for different times.
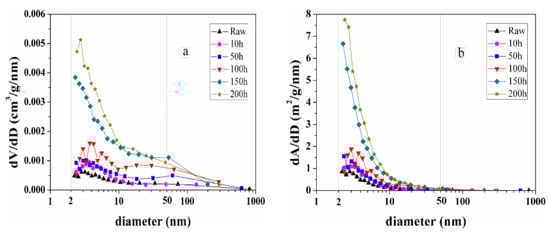
Figure 7.
(a) Pore size distribution and (b) specific surface area of raw sample and spent samples extracted by sub-critical water at 350 °C for different times.
Most of the pore volumes recorded by nitrogen adsorption were found to correspond to mesopores. As the extraction time increases, the volume of mesopores increases, especially in the range of 2–10 nm (Figure 7a). Based on the descriptive classification for pores developed by Loucks et al. four major shale pore types have been defined as organic matter pores, interparticle pores, intraparticle pores, and fractures [38,39]. It should be noted the pore system in shale consists of organic and mineral matrix pores, but only the former might be significantly impacted by thermal maturation [40,41]. Therefore, according to the pore classification and corresponding size [38,39,42], the main part of mesopores in spent samples probably corresponds to organic matter pores. The development of organic matter pores distributed in the mesopores of spent samples is closely related to the increment of extract yield, and the generation of mesopores (<10 nm) at high maturity probably resulted from the secondary cracking of bitumen [43]. The evolution of the specific surface area distribution with temperature (Figure 7b) is similar to that of the pore size.
Figure 8 displays a typical nitrogen adsorption/desorption isotherm of the spent shale samples extracted by sub-critical water for 150 h at different temperature. They are assigned to type II, and the four hysteresis loops are similar to type H3. The adsorption branches of the isotherms gradually rise below P/P0 ≈ 0.8. When P/P0 > 0.9, the adsorption quantity sharply increases because of capillary condensation. At relative pressures below 0.7, the adsorption isotherm is essentially coincident with the desorption isotherm, indicating that small pores are accessible via a single pore throat. As the relative pressure rises, a hysteresis loop occurs, which is attributed to the difference between the adsorption and desorption mechanisms.
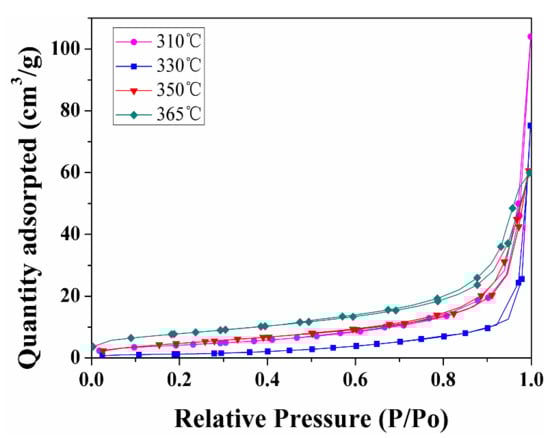
Figure 8.
Nitrogen adsorption isotherms for spent samples extracted by sub-critical water for 150 h at different temperatures.
Figure 9 shows the pore size distribution and specific surface area of spent samples extracted for 150 h at different temperatures.
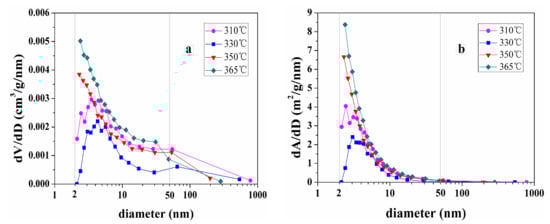
Figure 9.
(a) Pore size distribution and (b) specific surface area of spent samples extracted by sub-critical water for 150 h at different temperature.
As the extraction temperature increases from 310 to 330 °C, the volume of the mesopores and the specific surface areas decrease. Furthermore, as the extraction temperature is increased from 330 to 365 °C, the volume of the mesopores and the specific surface areas increases, especially mesopores ranging from 2 to 10 nm. This is probably because pyrobitumen, which is not soluble and fills some of the pores created during oil and gas generation, is not extracted by sub-critical water at low temperature. We therefore attribute the decreasing pore volume in extracted samples to the bitumen infilling effect on the pore measurement of shale samples. This is similar with results obtained by Sun et al. [19].
3.4. Analysis of NMR Pore Size Distribution
N2 adsorption/desorption can provide information only on the mesopores of spent shale samples. When detected by NMR, the samples need not be dried and thus pore structural damage can be avoided. The low field NMR method can truly reflect the effect of sub-critical water extraction on the PSD evolution of spent shale samples, especially macropores. Figure 10 shows the NMR PSD of the raw sample and spent samples extracted by sub-critical water at 350 °C for different times. The PSD of the raw sample displays two peaks (left peak area > right peak area). Every peak in the NMR PSD corresponds to a type of pores. According to the pore classification and corresponding size, the left peak (ranging from 8 to 340 nm) of the raw sample PSD curve probably corresponds to interparticle pores and organic matter pores, and the right peak (ranging from 3 to 80 μm) probably corresponds to fractures.
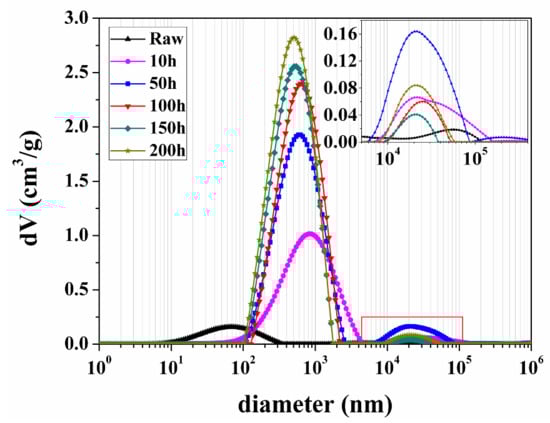
Figure 10.
Pore size distribution (PSD) of the raw sample and spent samples extracted by sub-critical water at 350 °C for different times. The inset figure is the local enlarged drawing of curves in the red rectangle.
All PSD curves of the spent samples extracted by sub-critical water at 350 °C exhibited two peaks from left to right (Figure 10). According to the pore classification and corresponding size, the left peak (100–1600 nm) and the right peak (8–40 μm) of the spent samples PSD curve can be attributed to secondary organic matter pores and fractures, respectively. After the extraction, the left peak of the raw sample PSD curve moved to right. This may be because interparticle pores always occur between organic matter and different mineral grains [18,42]; after the organic matter is extracted, both of interparticle and organic matter pores become larger and connect together. The peak value and the area of the left peak in the PSD curve of the spent samples increase whereas the peak width decreases with prolonged extraction time. This may be because, with the extension of extraction time, the number of mutually connective organic matter pores increase with the release of organics, and secondary organic matter pores tend to distribute in largely centralized areas. The right peak area increases firstly, then decreases with the increase of extraction time. The appearance of these fractures is considered to be due to the tensile stress generated by expansion associated with kerogen conversion to bitumen [44]; thus fracture propagation occurs as the extraction time increases from 0 to 50 h. After more organic matter is extracted by sub-critical water, without inner support from organic matter, the fractures probably have been strongly compacted by the pressure of sub-critical water [36].
Figure 11 shows the PSD of the raw and spent samples extracted by sub-critical water for 150 h at different temperatures. All the PSD curves of spent samples have two peaks. The left peak (100–1600 nm) and the right peak (10–45 μm) of the PSD curve of the spent samples can be attributed to organic matter pores and fractures according to the pore classification and corresponding size, respectively. The peak value and the area of the left peak increased, whereas the range of the left peak decreased with increasing extraction temperature. This may be because more organic matter is extracted by sub-critical water with increased extraction temperature, and secondary organic matter pores tend to distribute in largely centralized areas. The right peak moves to right, and its area and peak value firstly increase and then decrease with increasing extraction temperature. This implies that the pore size and volume of fractures in these spent samples increase and decrease, respectively, as the extraction temperature is increased. The expansion of fracture is preferentially accommodated perpendicular to the bedding plane because of the horizontal layering of organic matter and clay minerals [45]. Nevertheless, the radial deformation of raw sample is constrained in this study. Therefore, the fracture propagation probably occurred parallel to the bedding plane as the extraction temperature increased from 0 to 310 °C. After more organic matter was extracted, the fractures may have been strongly compacted by pressure. The decrease of the area and the peak value of the right peak may become significant when the pressure of sub-critical water increases with the extraction temperature.
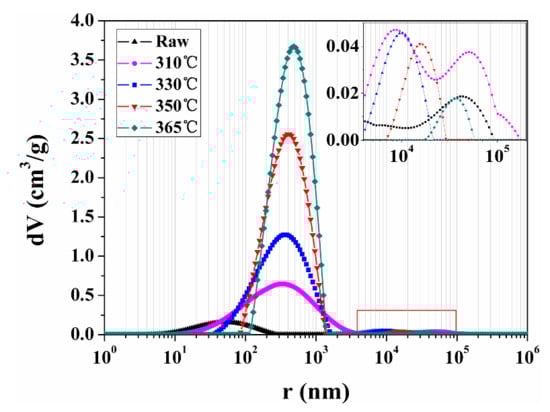
Figure 11.
PSD of the raw and spent samples extracted by sub-critical water for 150 h at different temperatures. The inset figure is the local enlarged drawing of curves in the red rectangle.
The evolution of NMR PSD reveals that during the sub-critical water extraction, the increment of pore volume in oil shale samples was caused by the formation of secondary organic matter pores. Furthermore, the diameter of kerogen aggregates distributed in Huadian oil shale may range from 100 to 1600 nm. The evolution of fractures of oil shale under a confining pressure is different from that in normal extraction by sub-critical water [10]. After a certain amount of organic matter is released, the weakening of inner support from organic matter would result in fractures strongly compacted by pressure from sub-critical water, and it might become more significant when the pressure is increased.
3.5. Analysis of NMR Porosity
Because the NMR PSD of samples and the hydrogen content in fluids have a strong positive correlation, NMR can also be used in analyzing porosity. Figure 12 shows a comparison between the porosity of the above spent samples extracted by sub-critical water measured by density measurement (DM) [46] and the NMR method. The x-axis and y-axis data of points in this figure correspond to the DM porosity and the NMR porosity of spent shale samples, respectively. The blue curve in Figure 12 is the DM porosity-NMR porosity parity line and all points are close to it revealing porosity measured using NMR has a good correlation with that measured using DM. Consequently, the NMR method can truly reveal the porosity of oil shale samples, and the NMR method is suitable for determining the porosity of shale.
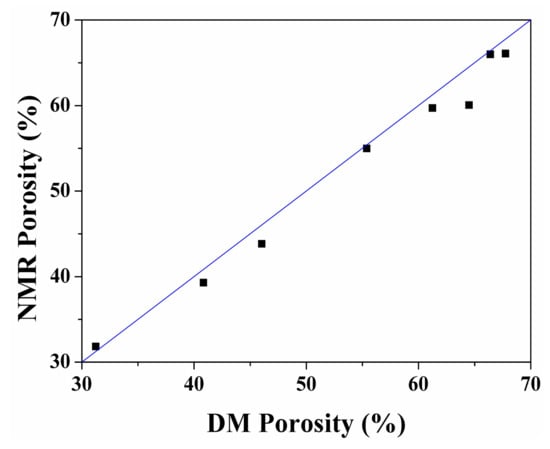
Figure 12.
Comparison between the porosity of spent shale samples after sub-critical water extraction determined using the density measurement (DM) and nuclear magnetic resonance (NMR) methods.
Figure 13 shows the porosity of spent samples extracted by sub-critical water determined using NMR. In Figure 13a, porosity increases dramatically, and then increases slowly with prolonged extraction time. In Figure 13b, porosity rises dramatically with increased extraction temperature. With increased extraction time, increments in the yield of bitumen and the evolution of porosity showed a similar tendency (Figure 2a and Figure 13a). There is a similar situation that as the temperature increases, increments in the yield of bitumen and the evolution of porosity showed a similar tendency (Figure 2b and Figure 13b).
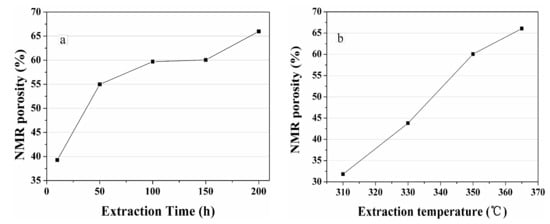
Figure 13.
Porosity of spent shale samples after (a) 350 °C and (b) 150 h sub-critical water extraction determined using NMR.
Remarkably, the maximum extract yield is achieved at 150 h (Figure 2a) while the porosity raises with the increase of extraction time (Figure 13a). The decrease of extract yield after 150 h result from the secondary decomposition of the extracted bitumen to gases. Meanwhile, the release of the residual bitumen inside of the shale matrix to sub-critical water leads to a sustained increase of the porosity of oil shale.
Figure 14 shows the fitting results of extract yield and NMR porosity. The x-axis and y-axis data of points in this figure correspond to the extract yield and the NMR porosity of spent shale samples, respectively. The red curve in Figure 14 is the fitted line and it reveals a positive correlation was found between extract yield and NMR porosity (R2 = 0.9). As mentioned in the discussion of Figure 9 and Figure 13, the bitumen infilling effect attributes to the decrease of porosity, the extract yield decreases with increasing extraction time after the maximum extract yield has been gotten, and these two phenomena lead to the fitting error of curves in Figure 14. A previous study reported that the porosity of spent shale samples increase with decreasing TOC content due to kerogen conversion [15]. The porosity evolution is in agreement with the evolution of NMR PSD. Therefore, during sub-critical water extraction, the porosity evolution of spent samples is caused by the formation of secondary organic matter pores.
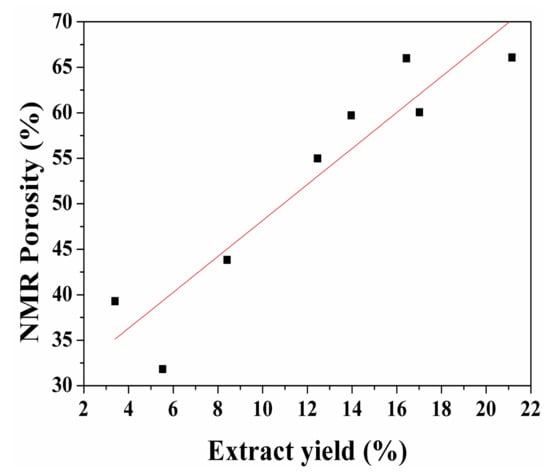
Figure 14.
Correlation between yield and NMR porosity after sub-critical water extraction.
4. Conclusions
The yields of bitumen extracted by sub-critical water increased with increasing extraction time and temperature. The maximum extract yield reached 21.1% when the sample was extracted by sub-critical water at 365 °C for 150 h. However, the extraction efficiency decreased under the effect of secondary cracking with prolonged extraction time.
With increased extraction time and temperature, surface pore morphology of spent samples obviously developed. Pores in spent samples extended to the inner part of the shale matrix, and their size gradually increased from the nano- to micron-scale, probably due to the release of organic matter.
Type II nitrogen adsorption isotherms with Type H3 hysteresis loops were observed in these samples. The increase of pore volume and surface area of mesopores in spent samples are closely related to the increment of extract yield, indicating that the extraction of organic matter improves the development of organic matter pores distributed in mesopores.
From the experimental results, only few pores were found to be distributed in the raw shale sample. The macropores (especially pores ranging from 100 to 1600 nm) remarkably developed with the increasing extraction time and temperature. The evolution of NMR PSD reveals that during the sub-critical water extraction, the increment of pore volume in oil shale samples is caused by the formation of secondary organic matter pores. This is in agreement with the micro-structural evolution and porosity evolution of oil shale samples. It is also suggested that the diameter of kerogen aggregates distributed in Huadian oil shale may range from 100 to 1600 nm.
The fractures probably propagated parallel to the bedding plane in this study. The evolution of fractures in oil shale under simulated in-situ mechanical state is different from that under normal extraction by sub-critical water. After a certain amount of organic matter is released, inner support from organic matter is weakened, resulting in fractures strongly compacted by pressure from sub-critical water. This effect might become more significant when the pressure is increased.
A positive correlation was found between the extract yield and porosity (R2 = 0.9). Considering results of NMR PSD, it is suggested that during sub-critical water extraction, the porosity evolution of spent samples is caused by the formation of secondary organic matter pores.
The evolution was observed for these factors in the simulated in-situ mechanical state of oil shale samples using special grips with sub-critical water extraction. The findings of this study are expected to contribute to the advancement of research on in-situ heat injection in oil shale, especially in-situ sub-critical water extraction.
Acknowledgments
This work was supported by the National Natural Science Foundation of China (No. 21406084), the Project of Jilin Province Development and Reform Commission of China, the Cooperative Project between Universities and Jilin Province, China (Grant No. SF2017-5-1), Natural Science Foundation of Jilin Province, China (No. 20160520086JH), the Program for JLU Science and Technology Innovative Research Team (Grant No. 2017TD-13), the Fundamental Research Funds for the Central Universities.
Author Contributions
Youhong Sun, Sunhua Deng conceived and designed the research; Li He, Shijie Kang, Wei Guo and Qiang Li performed the research; Youhong Sun, Li He and Sunhua Deng analyzed the data; and Li He and Sunhua Deng wrote the paper.
Conflicts of Interest
The authors declare no conflicts of interest.
References
- Kyotani, T.; Kubota, K.; Cao, J.Q.; Yamashita, H.; Tomita, A. Combustion and CO2 gasification of coals in a wide temperature range. Fuel Process. Technol. 1993, 36, 209–217. [Google Scholar] [CrossRef]
- Subasinghe, N.D.; Awaja, F.; Bhargava, S.K. Variation of kerogen content and mineralogy in some Australian tertiary oil shales. Fuel 2009, 88, 335–339. [Google Scholar] [CrossRef]
- Wang, G.; Wang, Y.; Sun, L.L.; Song, X.; Liu, Q.; Xu, H.; Du, W. Study on the Low-Temperature Oxidation Law in the Co-Mining Face of Coal and Oil Shale in a Goaf—A Case Study in the Liangjia Coal Mine, China. Energies 2018, 11, 174. [Google Scholar] [CrossRef]
- Külaots, I.; Goldfarb, J.L.; Suuberg, E.M. Characterization of Chinese, American and Estonian oil shale semicokes and their sorptive potential. Fuel 2010, 89, 3300–3306. [Google Scholar] [CrossRef]
- Martins, M.F.; Salvador, S.; Thovert, J.F.; Debenest, G. Co-current combustion of oil shale—Part 1: Characterization of the solid and gaseous products. Fuel 2010, 89, 144–151. [Google Scholar] [CrossRef]
- Tiwari, P.; Deo, M. Compositional and kinetic analysis of oil shale pyrolysis using TGA–MS. Fuel 2012, 94, 333–341. [Google Scholar] [CrossRef]
- John, R.D. Geology and resources of some world oil-shale deposits. Oil Shale 2003, 20, 193–252. [Google Scholar]
- Bai, F.T.; Sun, Y.H.; Liu, Y.M.; Guo, M.Y. Evaluation of the porous structure of Huadian oil shale during pyrolysis using multiple approaches. Fuel 2017, 187, 1–8. [Google Scholar] [CrossRef]
- Deng, S.H.; Wang, Z.J.; Gu, Q.; Meng, F.Y.; Li, J.F.; Wang, H.Y. Extracting hydrocarbons from Huadian oil shale by sub-critical water. Fuel Process. Technol. 2011, 92, 1062–1067. [Google Scholar] [CrossRef]
- Deng, S.H.; Wang, Z.J.; Gao, Y.; Gu, Q.; Cui, X.J.; Wang, H.Y. Sub-critical water extraction of bitumen from Huadian oil shale lumps. J. Anal. Appl. Pyrolysis 2012, 98, 151–158. [Google Scholar] [CrossRef]
- Wang, Z.J.; Deng, S.H.; Gu, Q.; Cui, X.J.; Zhang, Y.M.; Wang, H.Y. Subcritical Water Extraction of Huadian Oil Shale under Isothermal Condition and Pyrolysate Analysis. Energy Fuels 2014, 28, 2305–2313. [Google Scholar] [CrossRef]
- Ferhat, M.F.; Ekinci, E.; Tsyntsarski, B.; Petrova, B.; Budinova, T.; Razvigorova, M. Steam Pyrolysis of Bulgarian Oil Shale Kerogen. Oil Shale 2008, 25, 27–36. [Google Scholar]
- Bagci, S.; Guner, G.; KÖK, M.V. Laboratory Steam Injection Applications for Oil Shale Fields of Turkey. Oil Shale 2008, 25, 37–46. [Google Scholar]
- Johannes, I.; Tiikma, L.; Zaidentsal, A. A comparison of thermobituminization kinetics of Baltic oil shale in open retorts and autoclaves. Oil Shale 2010, 27, 17–25. [Google Scholar] [CrossRef]
- Tang, X.; Zhang, J.C.; Jin, Z.J.; Xiong, J.; Lin, L.; Yu, Y.; Han, S. Experimental investigation of thermal maturation on shale reservoir properties from hydrous pyrolysis of Chang 7 shale, Ordos Basin. Mar. Pet. Geol. 2015, 64, 165–172. [Google Scholar] [CrossRef]
- Mastalerz, M.; He, L.; Melnichenko, Y.B. Porosity of coal and shale: Insights from gas adsorption and SANS/USANS techniques. Energy Fuel 2012, 26, 5109–5120. [Google Scholar] [CrossRef]
- Hu, H.; Zhang, T.W.; Wiggins-Camacho, J.D.; Ellis, G.S.; Lewan, M.D.; Zhang, X.L. Experimental investigation of changes in methane adsorption of bitumen-free Woodford Shale with thermal maturation induced by hydrous pyrolysis. Mar. Pet. Geol. 2015, 59, 114–128. [Google Scholar] [CrossRef]
- Jiang, F.J.; Chen, J.; Xu, Z.Y.; Wang, Z.; Hu, T.; Chen, D.; Li, Q.; Li, Y. Organic Matter Pore Characterization in Lacustrine Shales with Variable Maturity Using Nanometer-Scale Resolution X-ray Computed Tomography. Energy Fuels 2017, 31, 2669–2680. [Google Scholar] [CrossRef]
- Sun, L.N.; Tuo, J.C.; Zhang, M.F.; Wua, C.J.; Wang, Z.X.; Zheng, Y.W. Formation and development of the pore structure in Chang 7 member oil-shale from Ordos Basin during organic matter evolution induced by hydrous pyrolysis. Fuel 2015, 158, 549–557. [Google Scholar] [CrossRef]
- Pour, A.S.; Li, W.F. Fractal dimensions of shale. J. Nat. Gas. Sci. Eng. 2016, 30, 578–582. [Google Scholar] [CrossRef]
- Kuila, U.; Mccarty, D.K.; Derkowski, A. Nano-scale texture and porosity of organic matter and clay minerals in organic-rich mudrocks. Fuel 2014, 135, 359–373. [Google Scholar] [CrossRef]
- Curtis, M.E.; Sondergeld, C.H.; Ambrose, R.J.; Rai, C.S. Microstructural investigation of gas shales in two and three dimensions using nanometer-scale resolution imaging. AAPG Bull. 2012, 96, 665–677. [Google Scholar] [CrossRef]
- Suuberg, E.M.; Deevi, S.C.; Yun, Y. Elastic behaviour of coals studied by mercury porosimetry. Fuel 1995, 74, 1522–1530. [Google Scholar] [CrossRef]
- Gane, P.A.C.; Ridgway, C.J.; Lehtinen, E.; Valiullin, R.; Furo, I.; Schoelkopf, J.; Paulapuro, H.; Daicic, J. Comparison of NMR cryoporometry, mercury intrusion porosimetry, and DSC thermoporosimetry in characterizing pore size distributions of compressed finely ground calcium carbonate structures. Ind. Eng. Chem. Res. 2004, 43, 7920–7927. [Google Scholar] [CrossRef]
- Kevin, M.; Douglas, M.; Smith, A. NMR technique for the analysis of pore structure: Numerical inversion of relaxation measurements. J. Colloid Interface Sci. 1987, 19, 117–126. [Google Scholar]
- Kenyon, W.E. Nuclear magnetic resonance as a petrophysical measurement. Nucl. Geophys. 1992, 6, 153–171. [Google Scholar]
- Karacan, C.O.; Okandan, E. Adsorption and gas transport in coal microstructure: Investigation and evaluation by quantitative X-ray CT imaging. Fuel 2001, 80, 509–520. [Google Scholar] [CrossRef]
- Li, S.; Tang, J.; Ding, Y.H.; Liu, S.M.; Liu, G.F.; Cai, B. Recovery of Low Permeability Reservoirs Considering Well Shut-Ins and Surfactant Additivities. Energies 2017, 10, 1279. [Google Scholar] [CrossRef]
- Yao, Y.B.; Liu, D.M. Comparison of low-field NMR and mercury intrusion porosimetry in characterizing pore size distributions of coals. Fuel 2012, 95, 152–158. [Google Scholar] [CrossRef]
- Hodgkins, M.A.; Howard, J.J. Application of NMR logging to reservoir characterization of low-resistivity sands in the gulf of Mexico. AAPG Bull. 1999, 83, 114–127. [Google Scholar]
- Kathryn, E.W.; Justin, E.B. Updated methodology for nuclear magnetic resonance characterization of shales. J. Magn. Reson. 2013, 233, 17–28. [Google Scholar]
- Hinai, A.A.; Rezaee, R.; Esteban, L.; Labani, M. Comparisons of pore size distribution: A case from the western Australian gas shale formations. J. Unconv. Oil Gas Res. 2014, 8, 1–13. [Google Scholar] [CrossRef]
- Xu, H.; Tang, D.Z.; Zhao, J.L.; Li, S. A precise measurement method for shale porosity with low-field nuclear magnetic resonance: A case study of the Carboniferous–Permian strata in the Linxing area, eastern Ordos Basin, China. Fuel 2015, 143, 47–54. [Google Scholar] [CrossRef]
- Zhou, L.; Kang, Z.H. Fractal characterization of pores in shales using NMR: A case study from the Lower Cambrian Niutitang Formation in the Middle Yangtze Platform, Southwest China. J. Nat. Gas Sci. Eng. 2016, 35, 860–872. [Google Scholar] [CrossRef]
- Sun, P.C.; Sachsenhofer, R.F.; Liu, Z.J. Organic Matter Accumulation in the Oil Shale- and Coal-bearing Huadian Basin (Eocene; NE China). Int. J. Coal Geol. 2013, 105, 1–15. [Google Scholar] [CrossRef]
- Han, X.X.; Jiang, X.M.; Yu, L.J.; Cui, Z.G. Change of pore structure of oil shale particles during combustion. Part 1. Evolution mechanism. Energy Fuels 2006, 20, 2408–2412. [Google Scholar] [CrossRef]
- Li, S.; Tang, D.Z.; Pan, Z.J.; Xu, H.; Huang, W.Q. Characterization of the stress sensitivity of pores for different rank coals by nuclear magnetic resonance. Fuel 2013, 111, 746–754. [Google Scholar] [CrossRef]
- Jiao, K.; Yao, S.P.; Liu, C.; Gao, Y.; Wu, H.; Li, M.; Tang, Z. The characterization and quantitative analysis of nanopores in unconventional gas reservoirs utilizing FESEM–FIB and image processing: An example from the lower Silurian Longmaxi Shale, upper Yangtze region, China. Int. J. Coal Geol. 2014, 128–129, 1–11. [Google Scholar] [CrossRef]
- Loucks, R.G.; Reed, R.M.; Ruppel, S.C.; Hammes, U. Spectrum of pore types and networks in mudrocks and a descriptive classification for matrix-related mudrock pores. AAPG Bull. 2012, 96, 1071–1098. [Google Scholar] [CrossRef]
- Ghanizadeh, A.; Amann-Hildenbrand, A.; Gasparik, M.; Gensterblum, Y.; Krooss, B.M.; Littke, R. Experimental study of fluid transport processes in the matrix system of the European organic-rich shales: II. Posidonia Shale (Lower Toarcian, northern Germany). Int. J. Coal Geol. 2014, 123, 20–33. [Google Scholar] [CrossRef]
- Curtis, M.E.; Cardott, B.J.; Sondergeld, C.H.; Rai, C.S. Development of organic porosity in the Woodford Shale with increasing thermal maturity. Int. J. Coal Geol. 2012, 103, 26–31. [Google Scholar] [CrossRef]
- Shi, M.; Yu, B.S.; Xue, Z.P.; Wu, J.S.; Yuan, Y. Pore characteristics of organic-rich shales with high thermal maturity: A case study of the Longmaxi gas shale reservoirs from well Yuye-1 in southeastern Chongqing, China. J. Nat. Gas Sci. Eng. 2015, 26, 948–959. [Google Scholar] [CrossRef]
- Liu, Y.K.; Xiong, Y.Q.; Li, Y.; Peng, P.A. Effects of oil expulsion and pressure on nanopore development in highly mature shale: Evidence from a pyrolysis study of the Eocene Maoming oil shale, south China. Mar. Pet. Geol. 2017, 86, 526–536. [Google Scholar] [CrossRef]
- Lewan, M.D.; Roy, S. Role of water in hydrocarbon generation from Type-I kerogen in Mahogany oil shale of the Green River Formation. Org. Geochem. 2011, 42, 31–41. [Google Scholar] [CrossRef]
- Fernando, F.P.; Patrick, J.D.; Anne-Laure, F.; Courtois, L.; Bay, B.; Ma, L.; Taylor, K.G.; Mecklenburgh, J.; Lee, P.D. Synchrotron tomograp hic quantification of strain and fractureduring simulated therm al maturation of an organic-richshale, UK Kimmeridge Clay. J. Geophys. Res. 2017, 122, 2553–2564. [Google Scholar]
- Rushdi, A.; Gupta, R. Investigation of coals and blends deposit structure: Measuring the deposit bulk porosity using thermomechanical analysis technique. Fuel 2005, 84, 595–610. [Google Scholar] [CrossRef]
© 2018 by the authors. Licensee MDPI, Basel, Switzerland. This article is an open access article distributed under the terms and conditions of the Creative Commons Attribution (CC BY) license (http://creativecommons.org/licenses/by/4.0/).