Effect of Scour on the Natural Frequency Responses of the Meteorological Mast in the Taiwan Strait

Abstract
1. Introduction
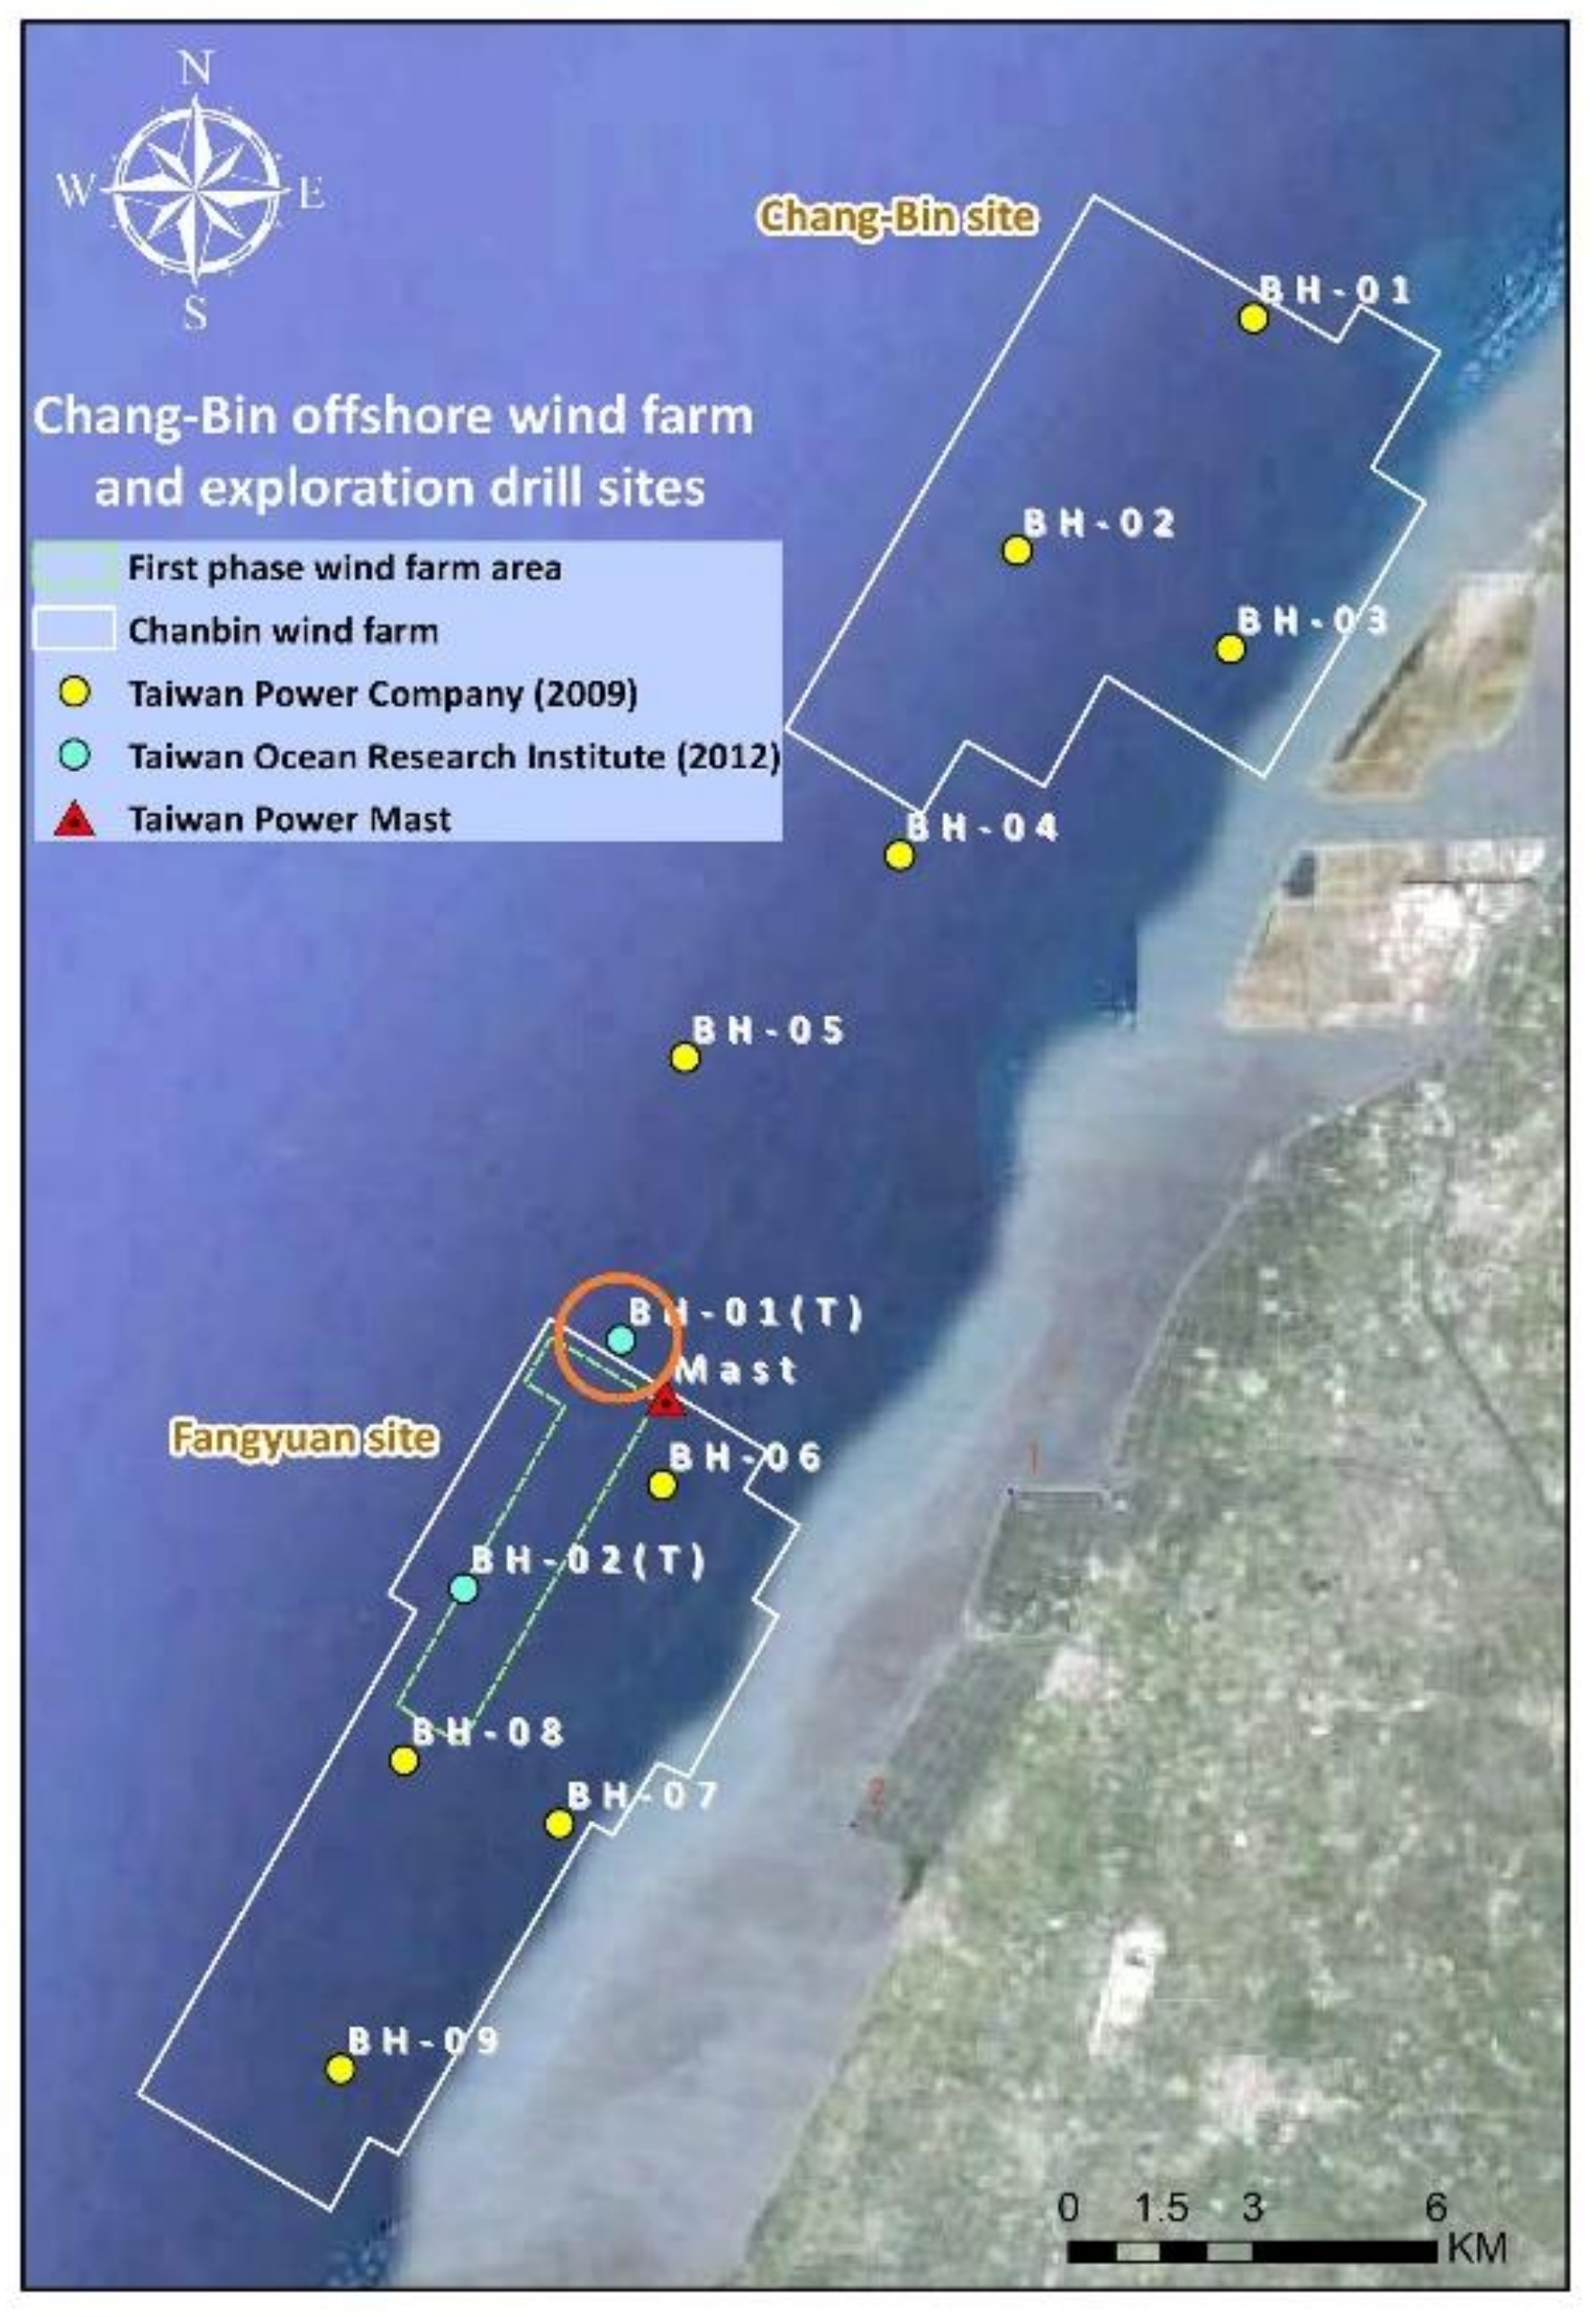
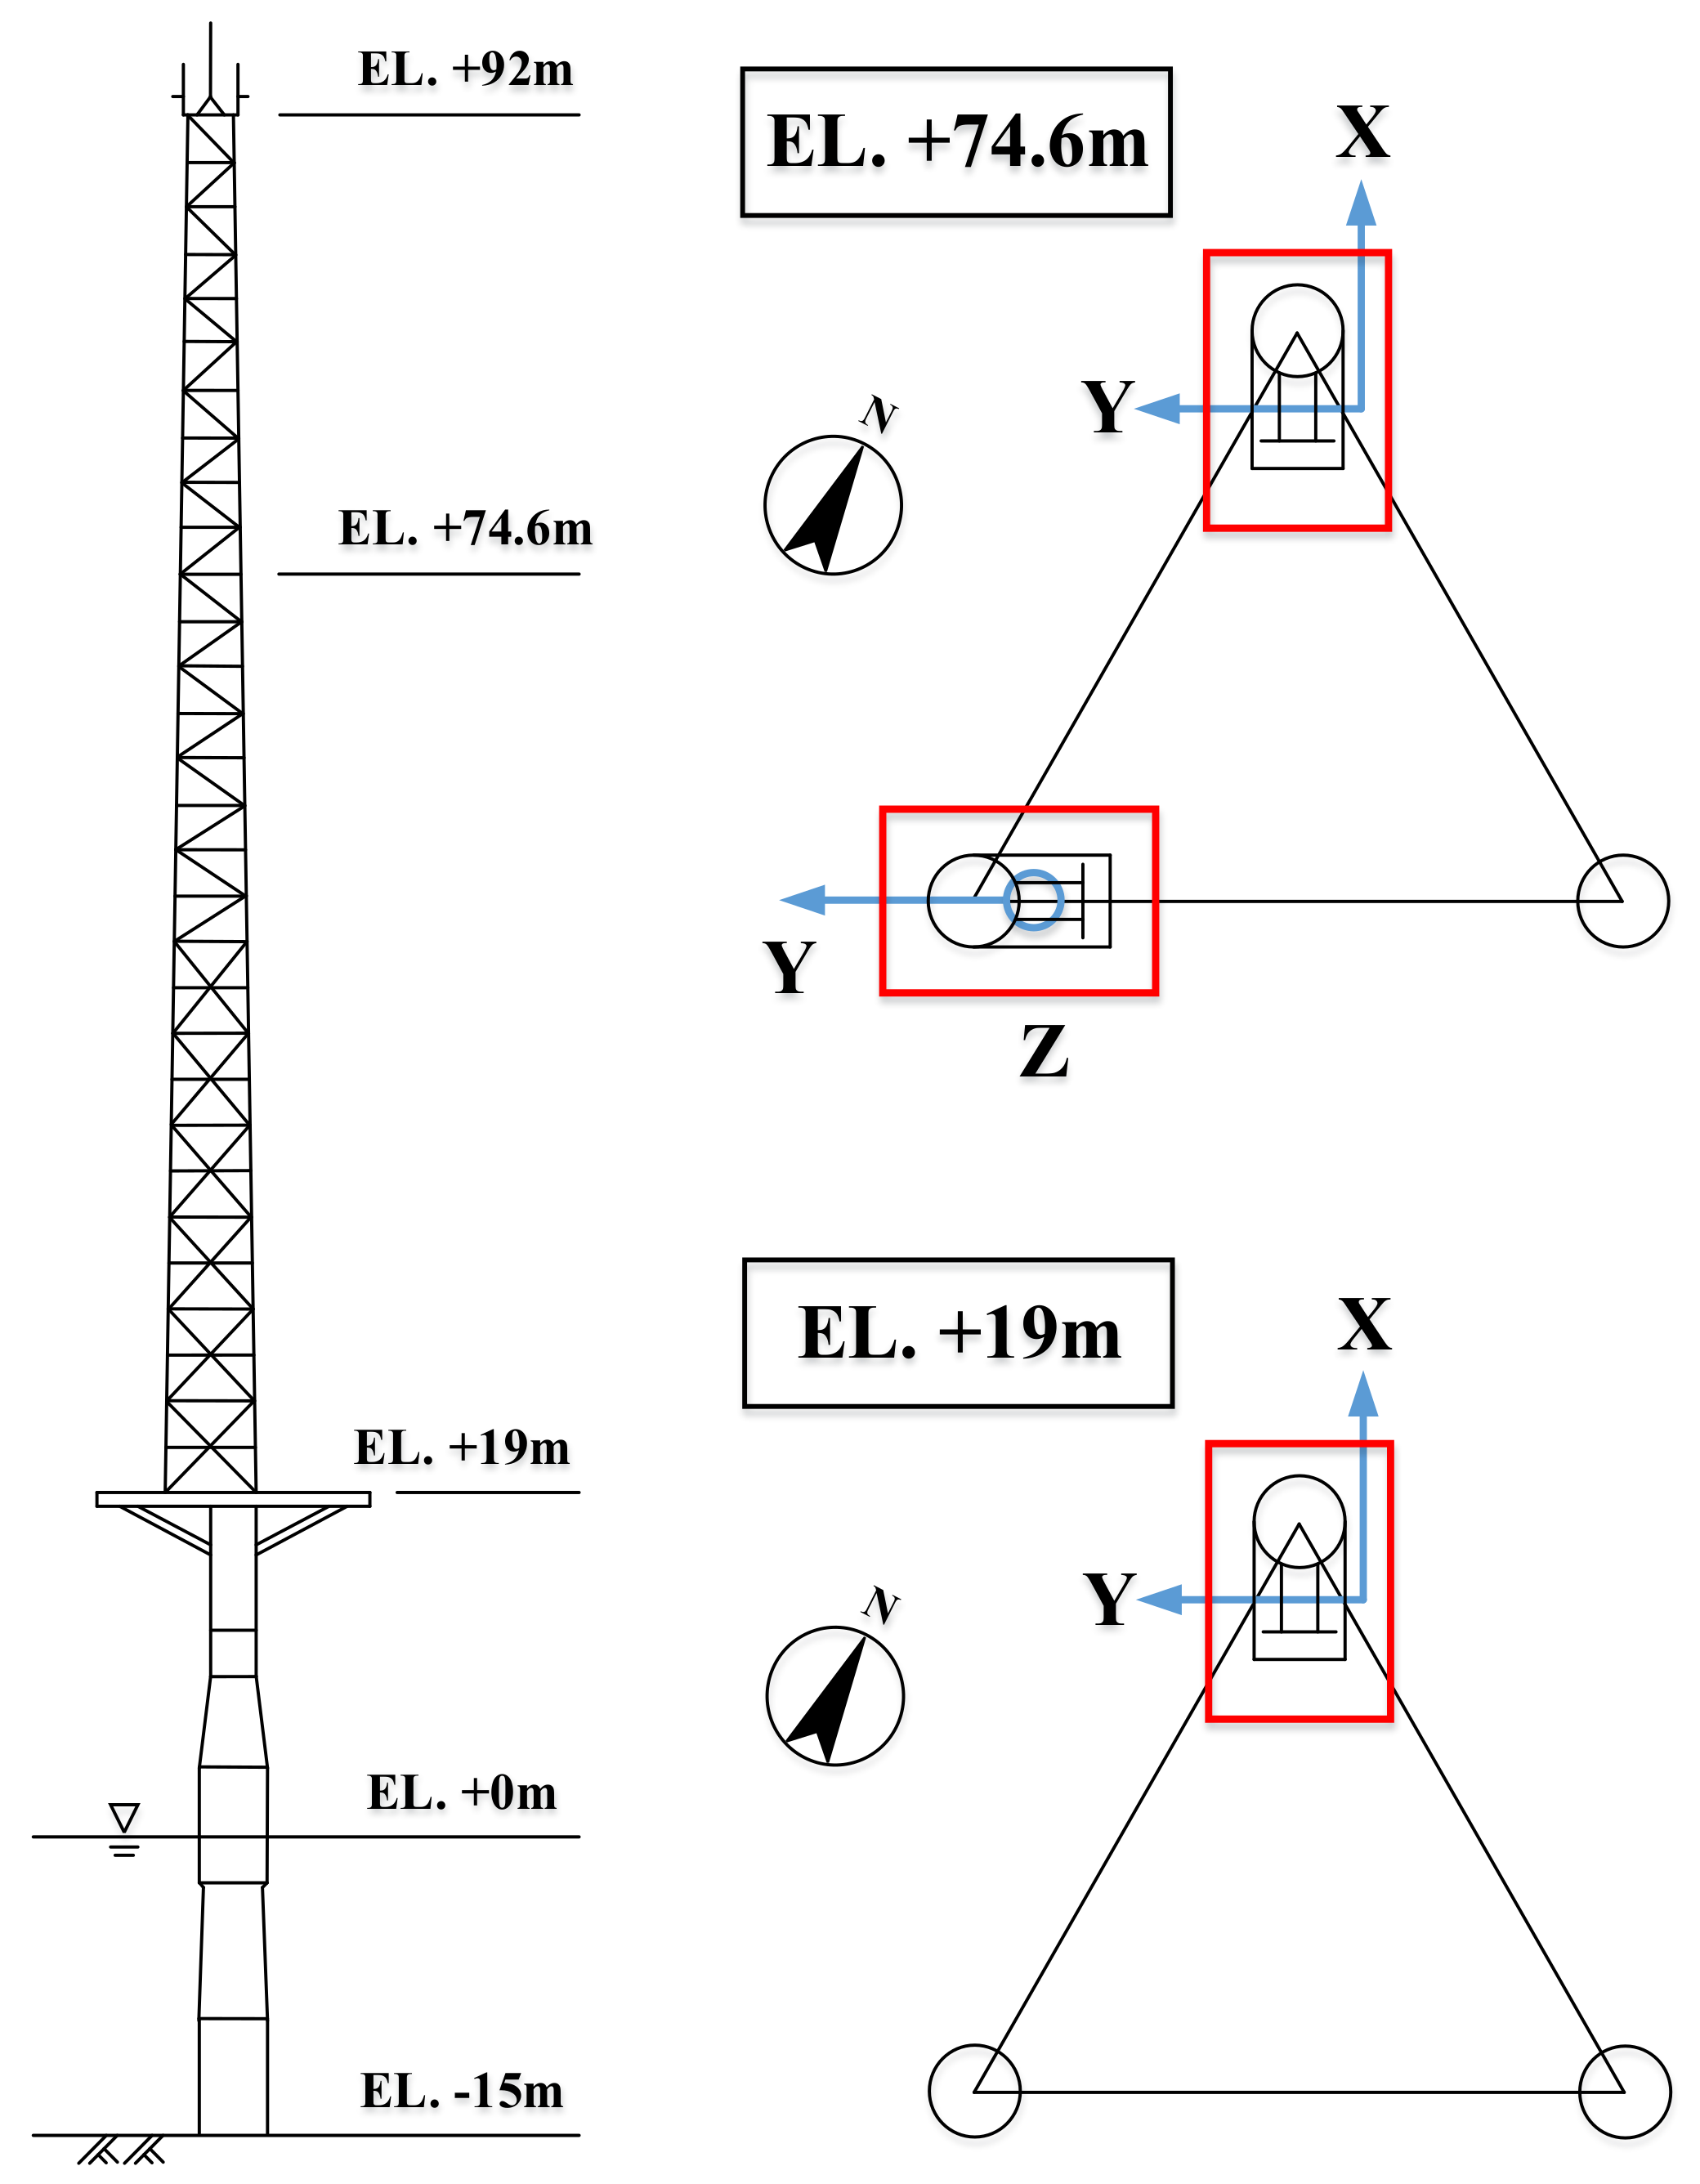
2. Met mast of TPC in the Chang-Bin offshore Wind Farm
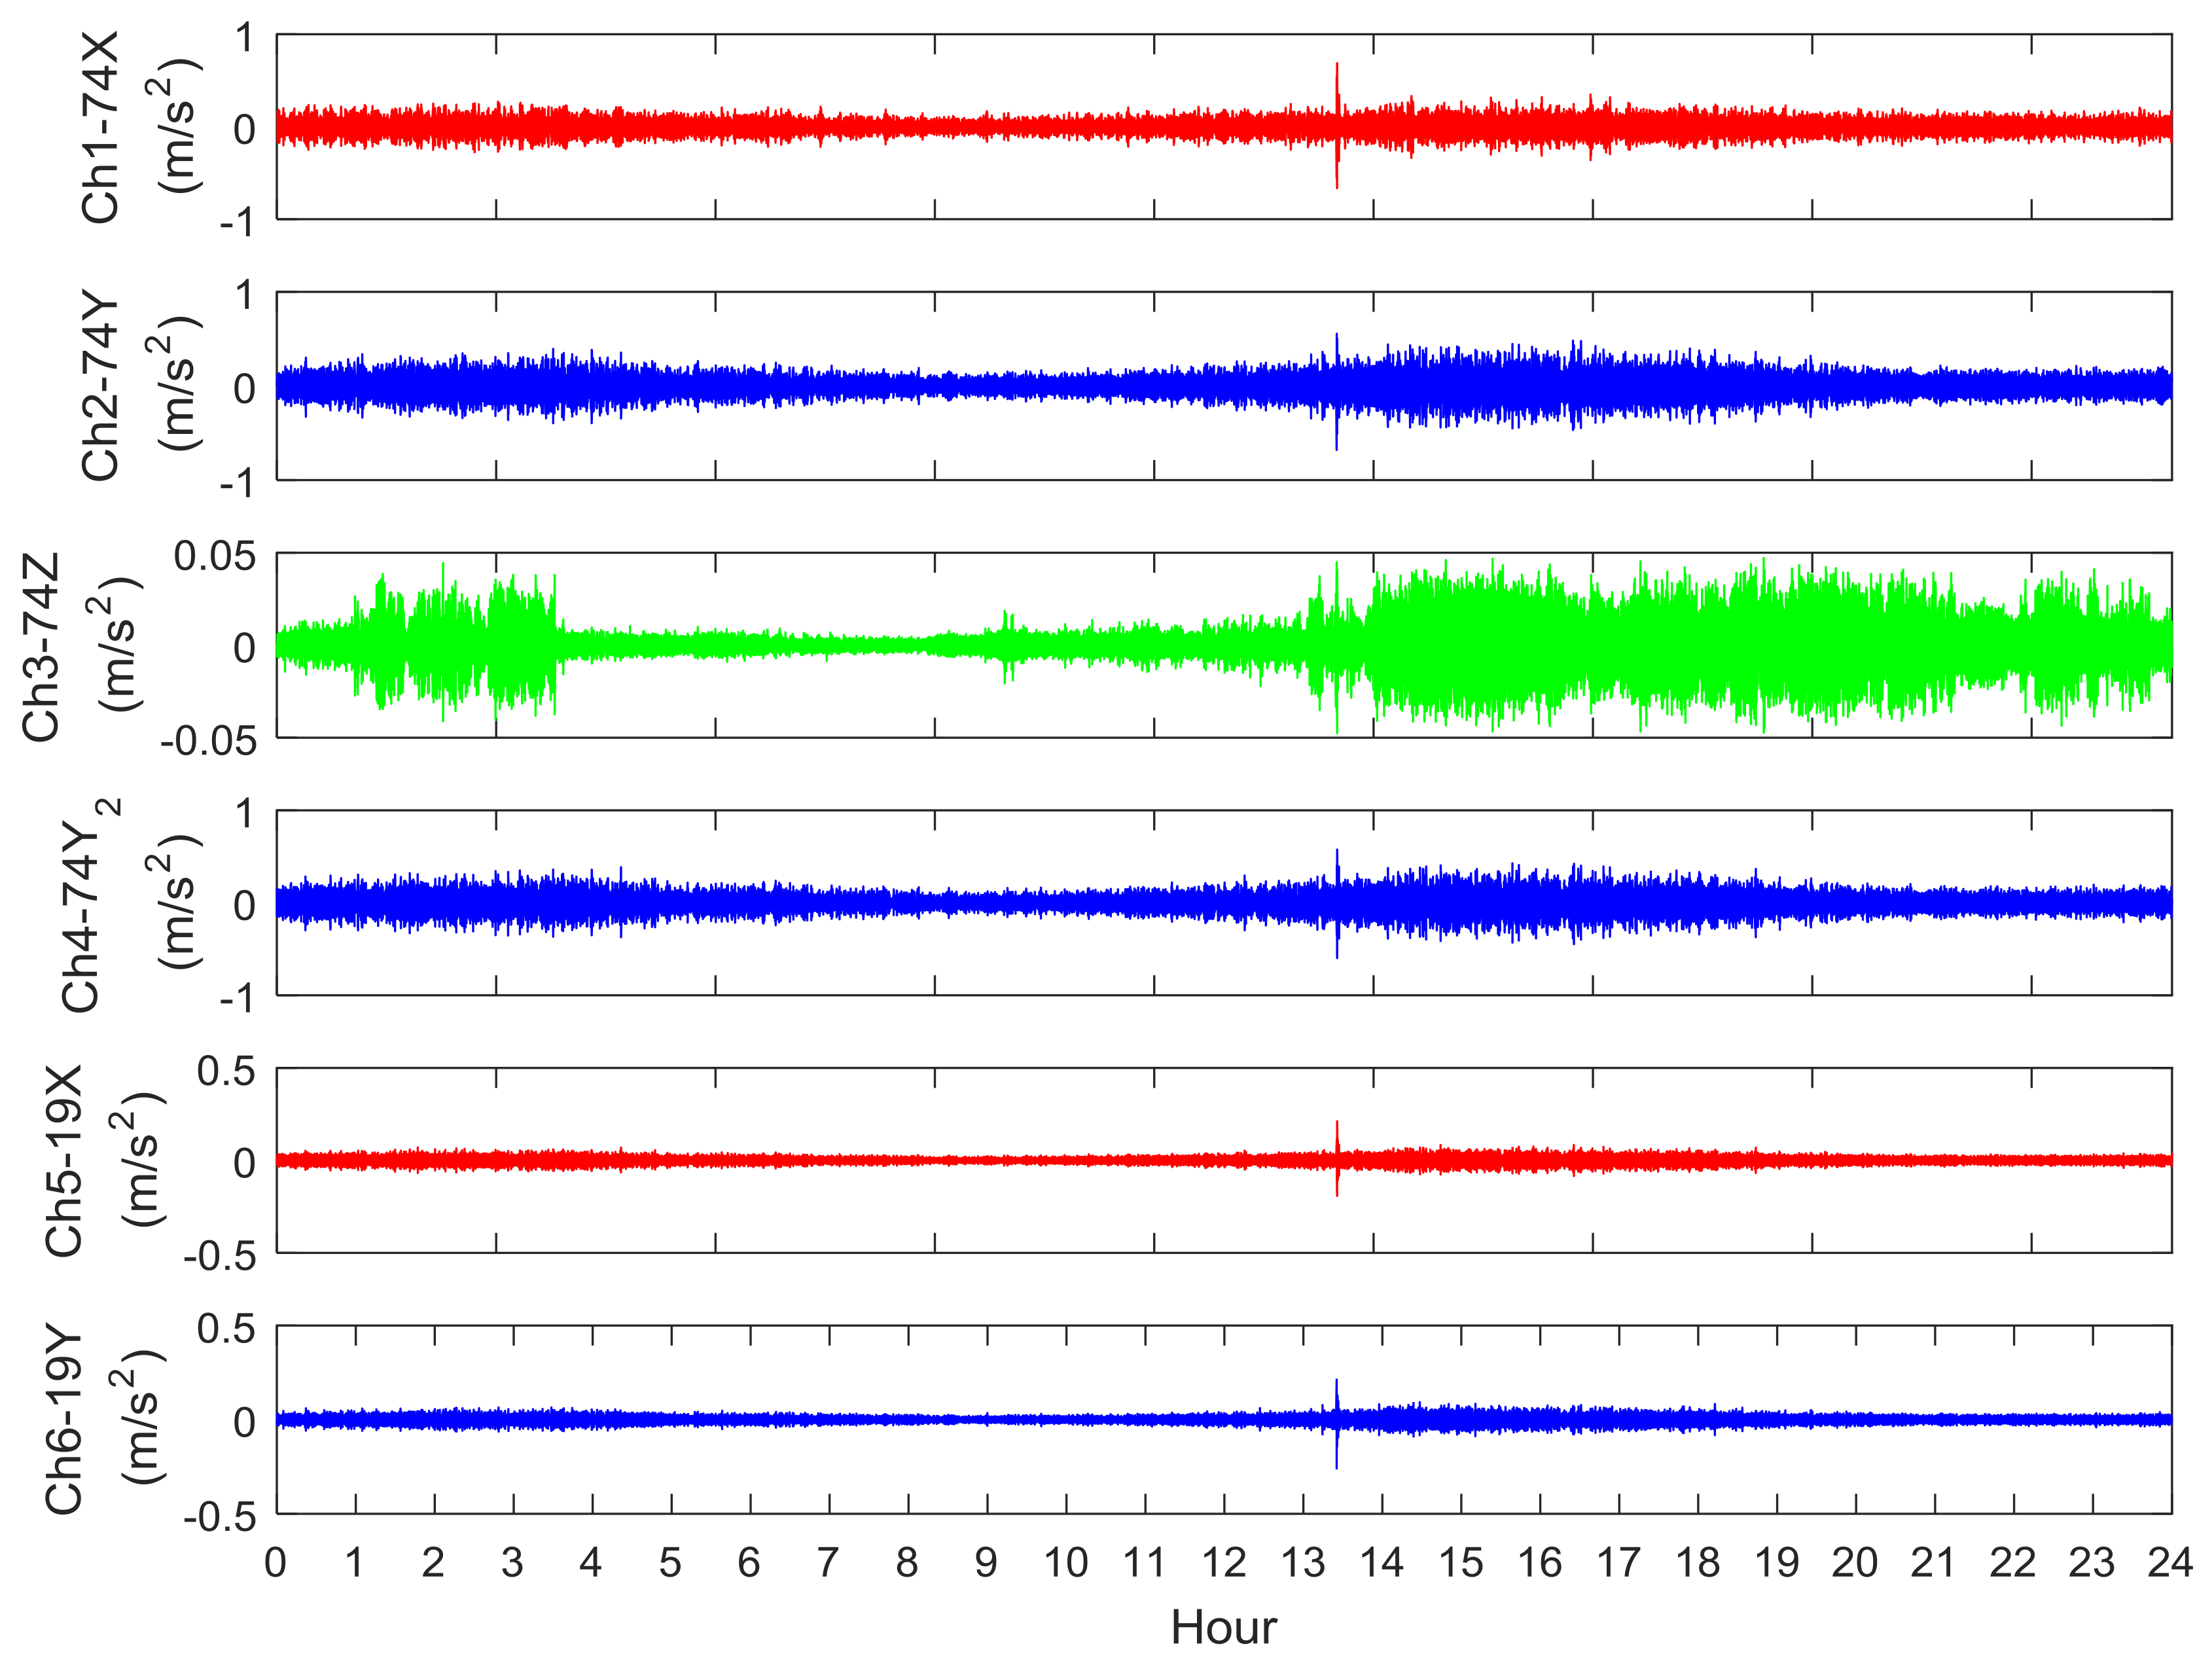
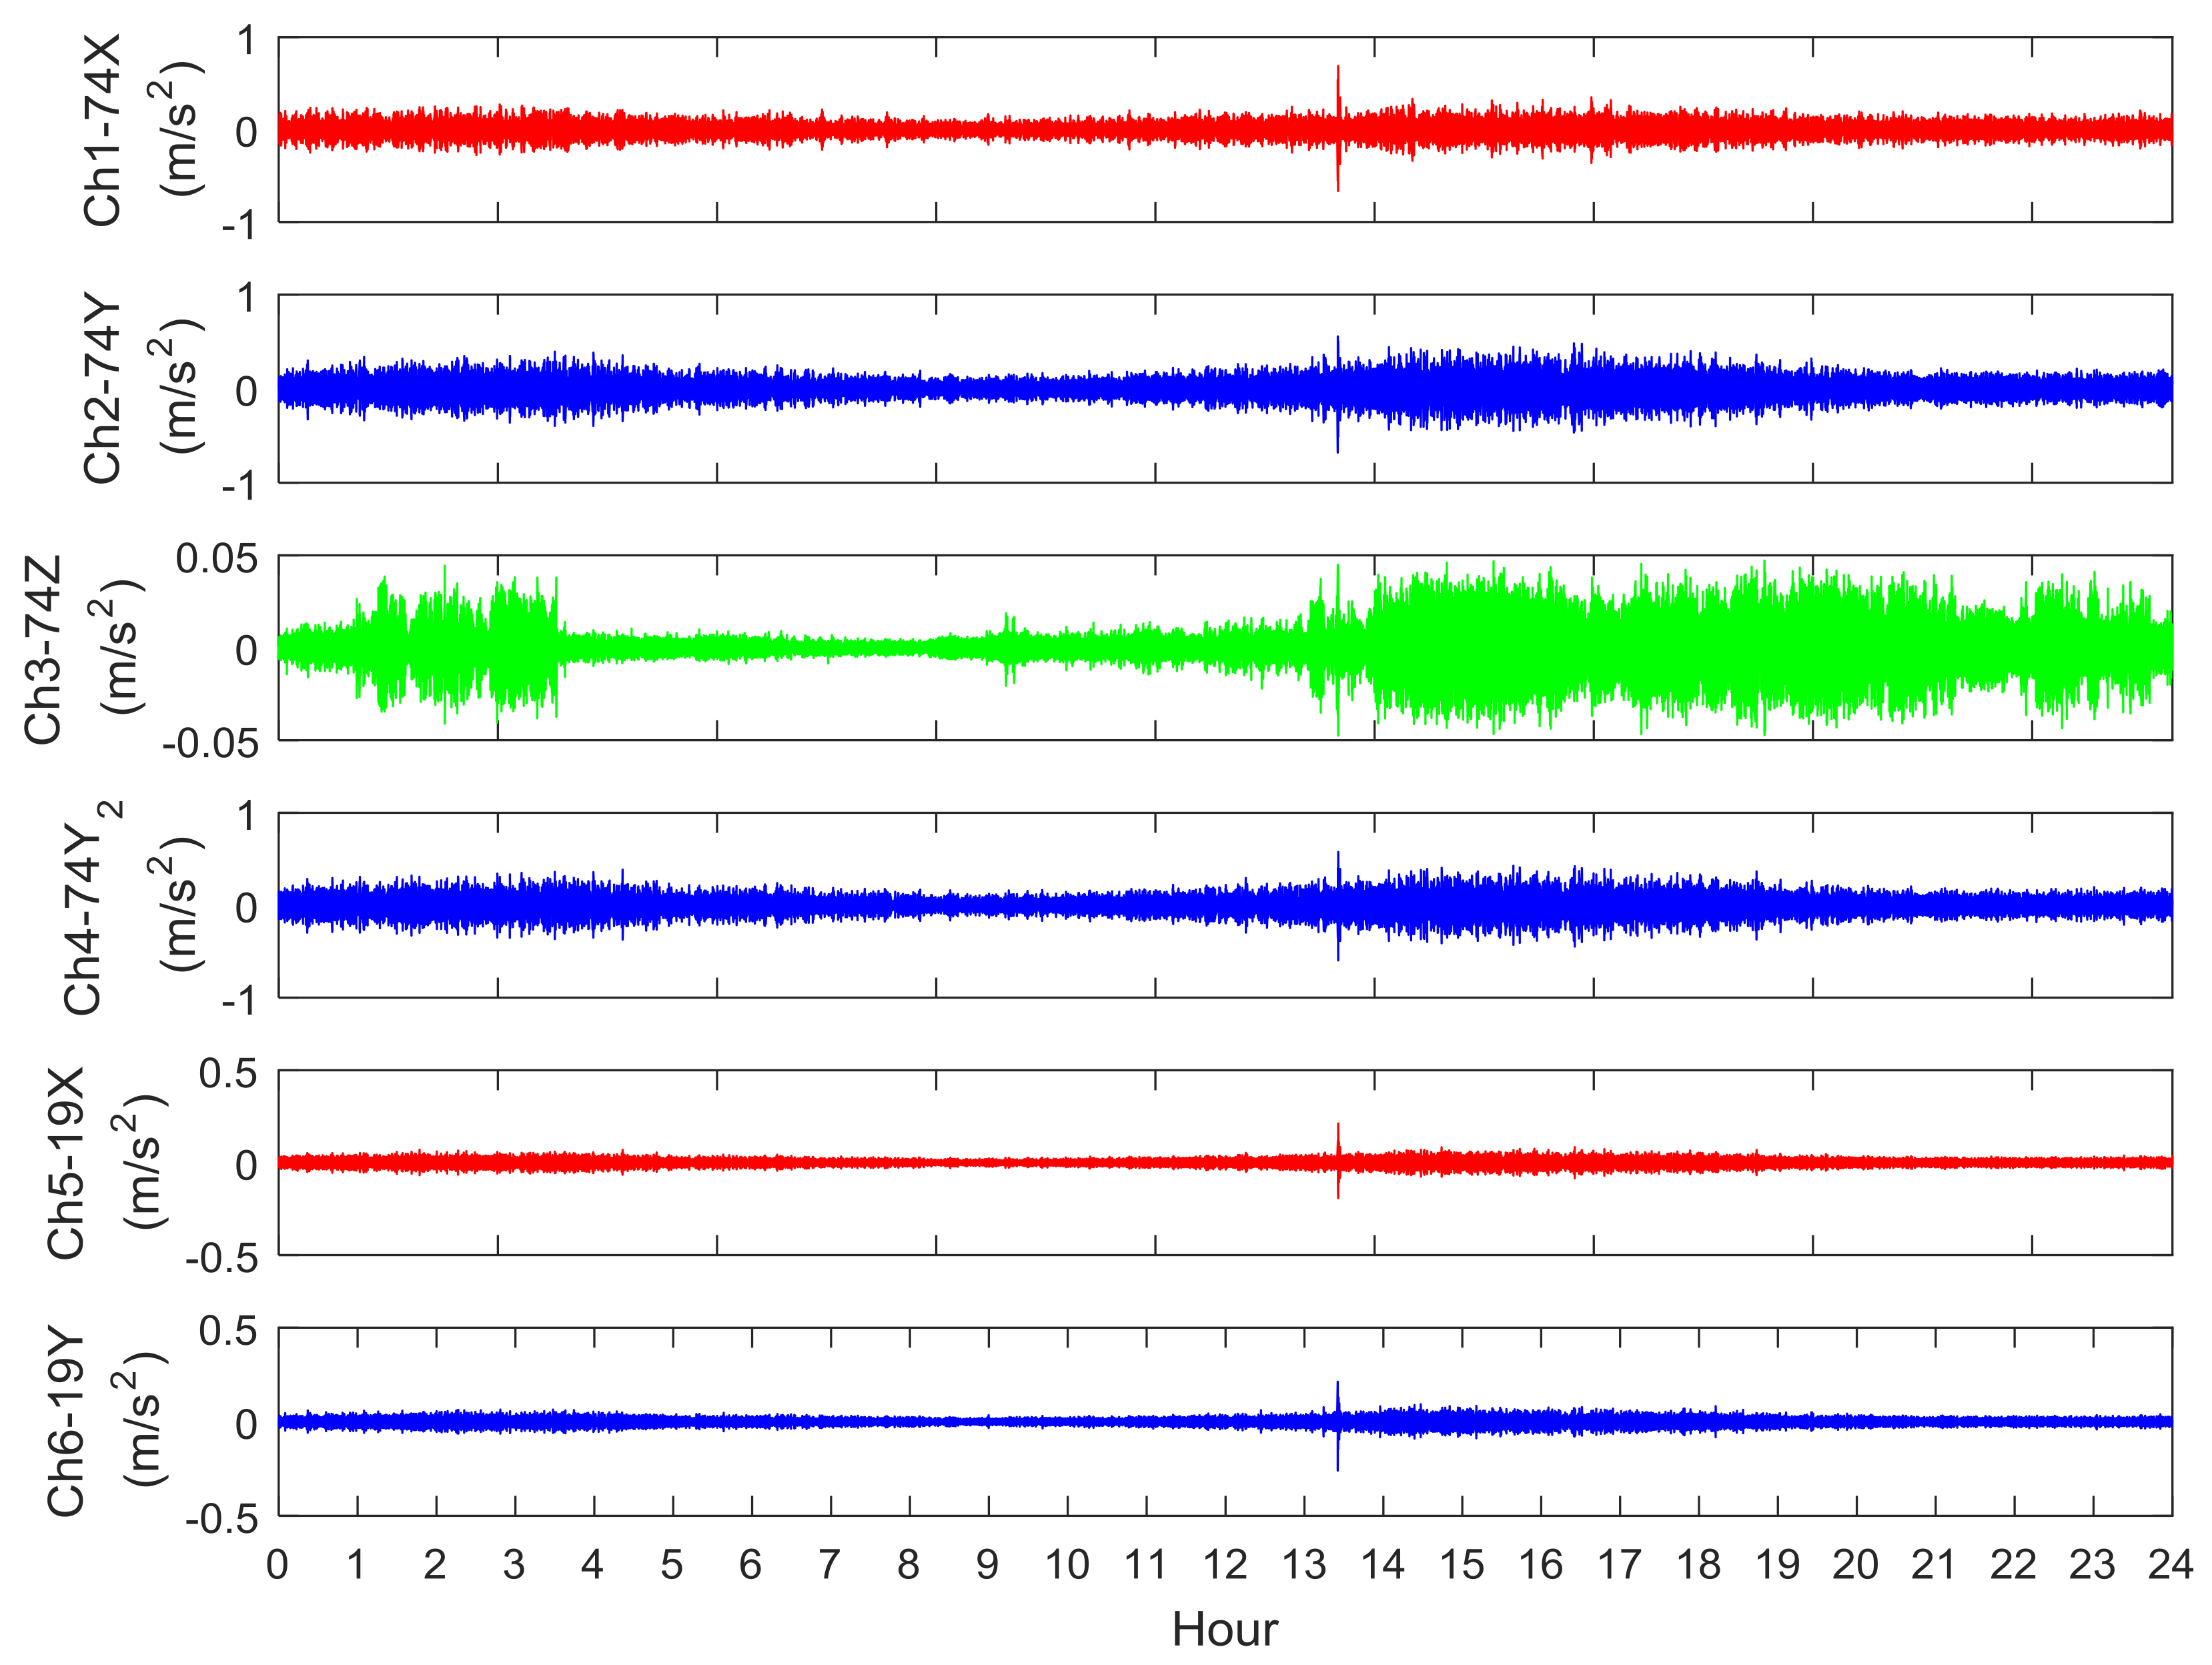
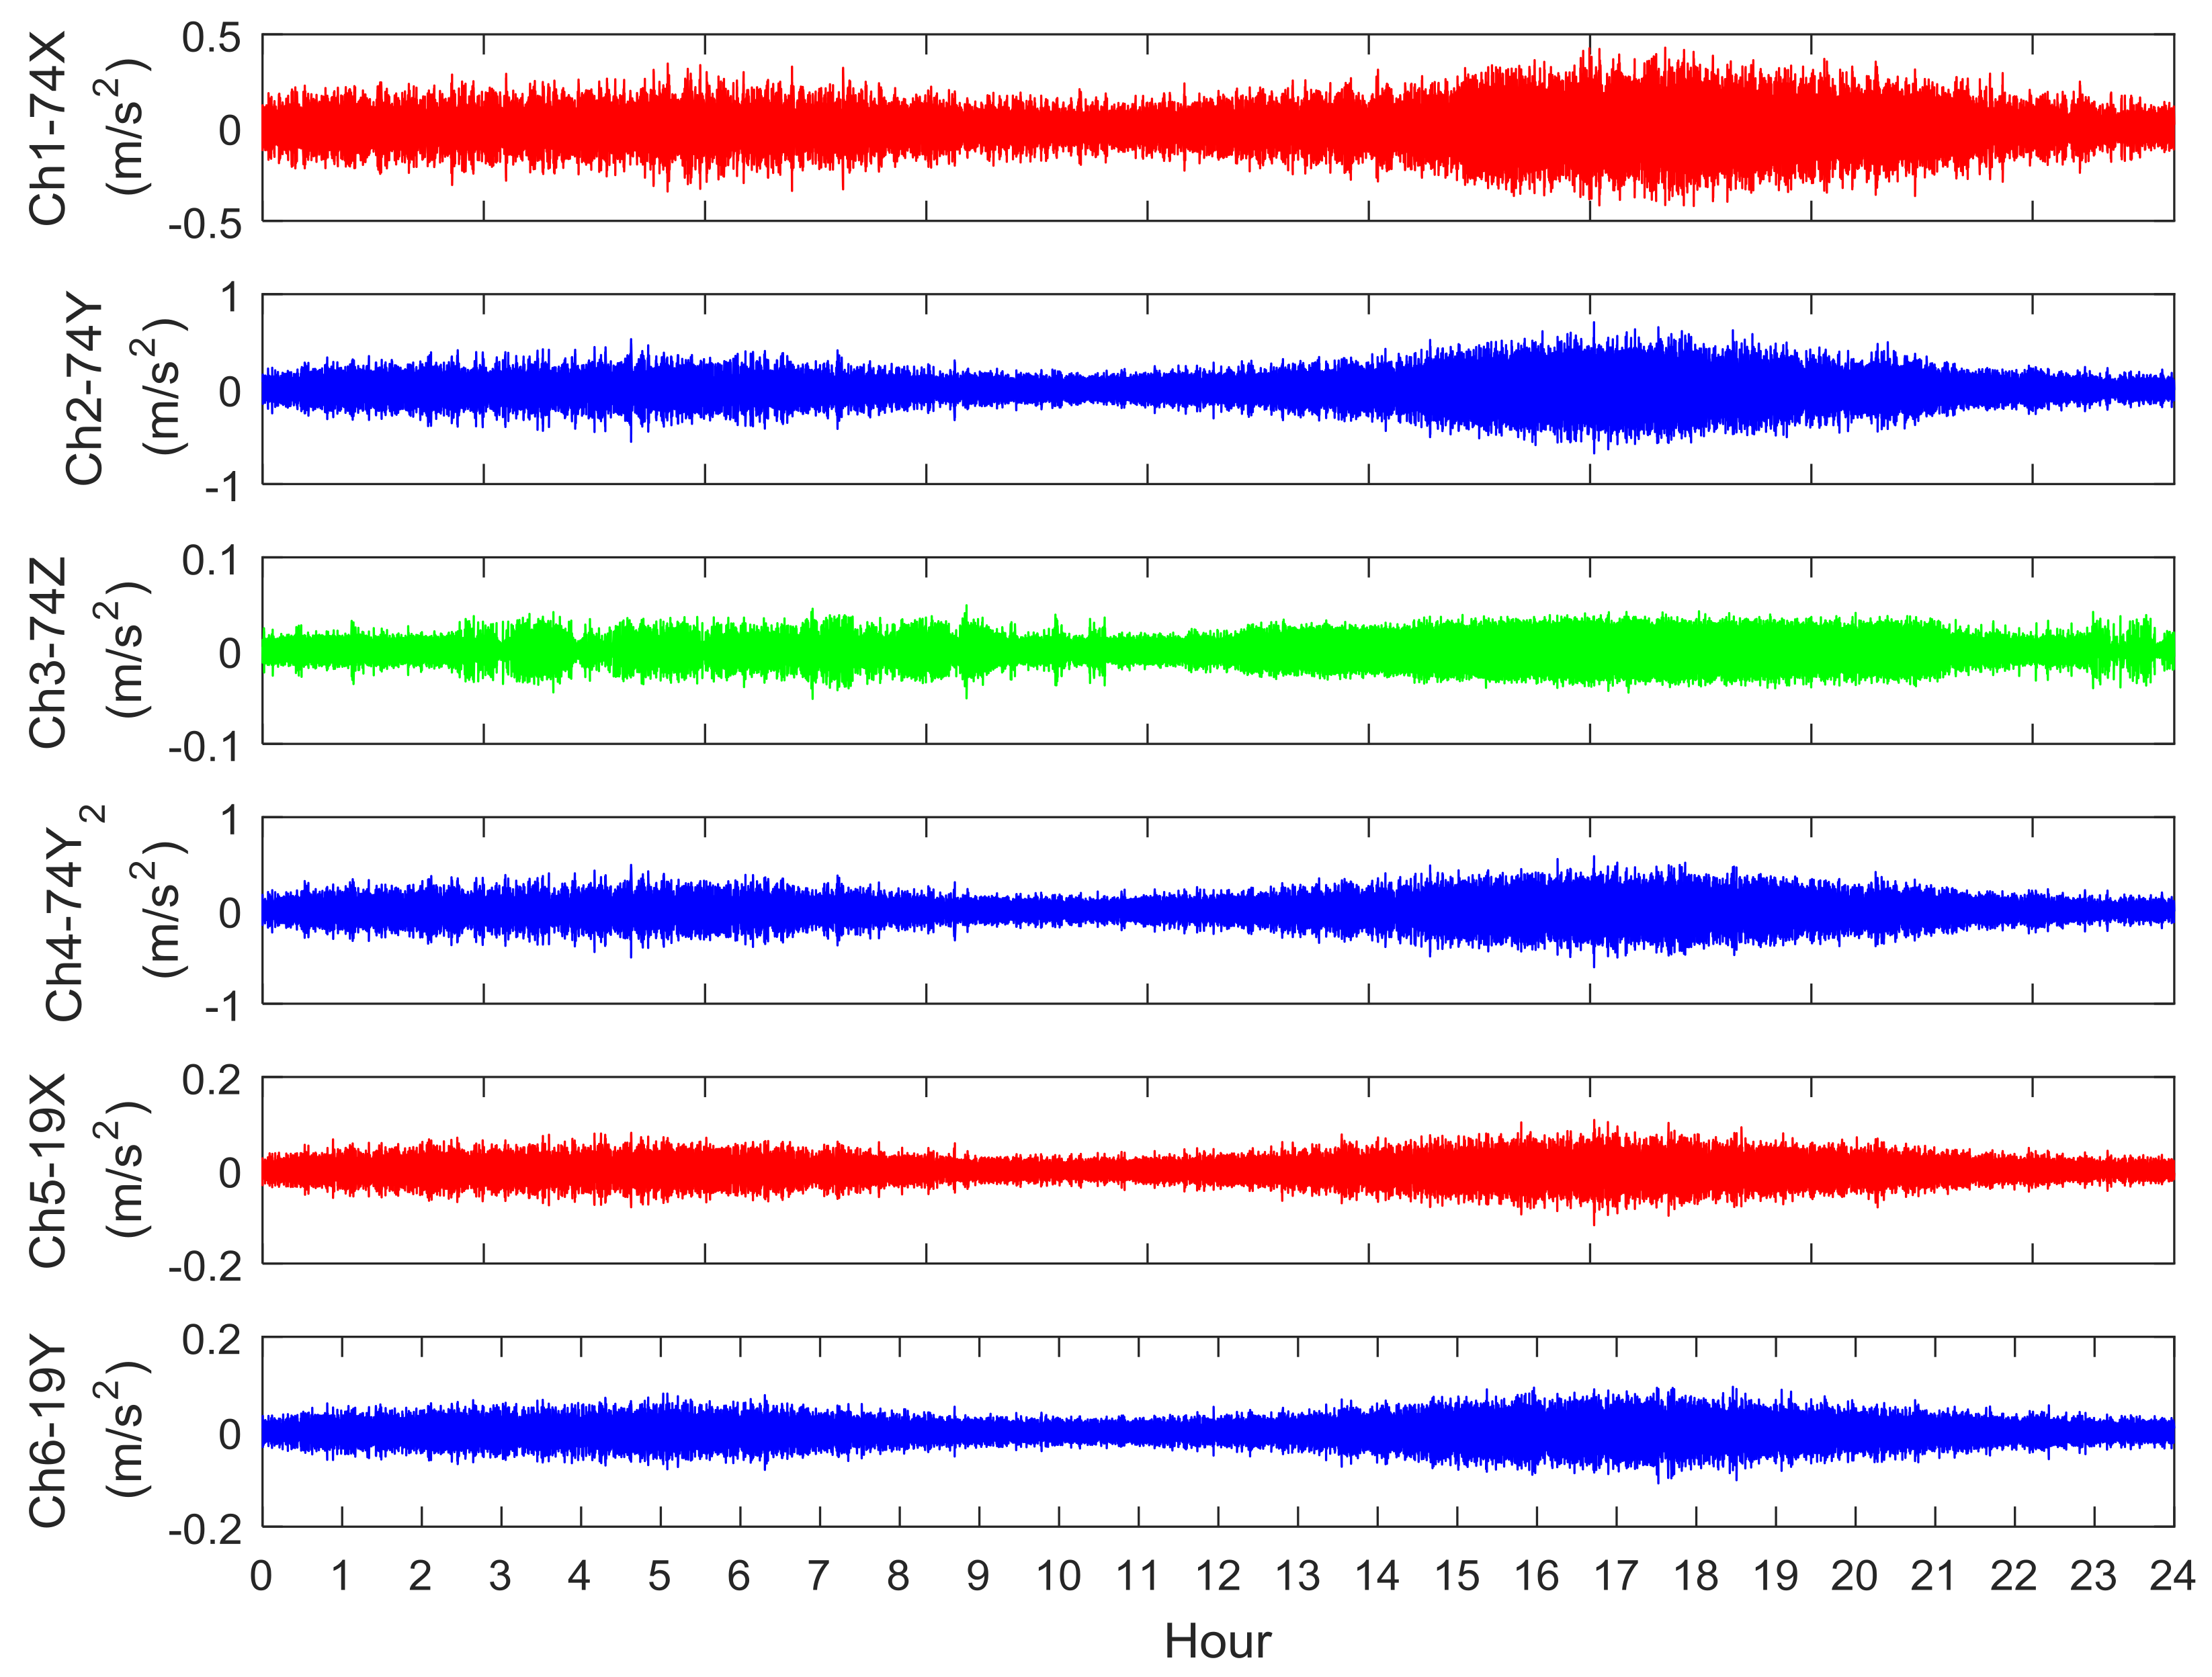
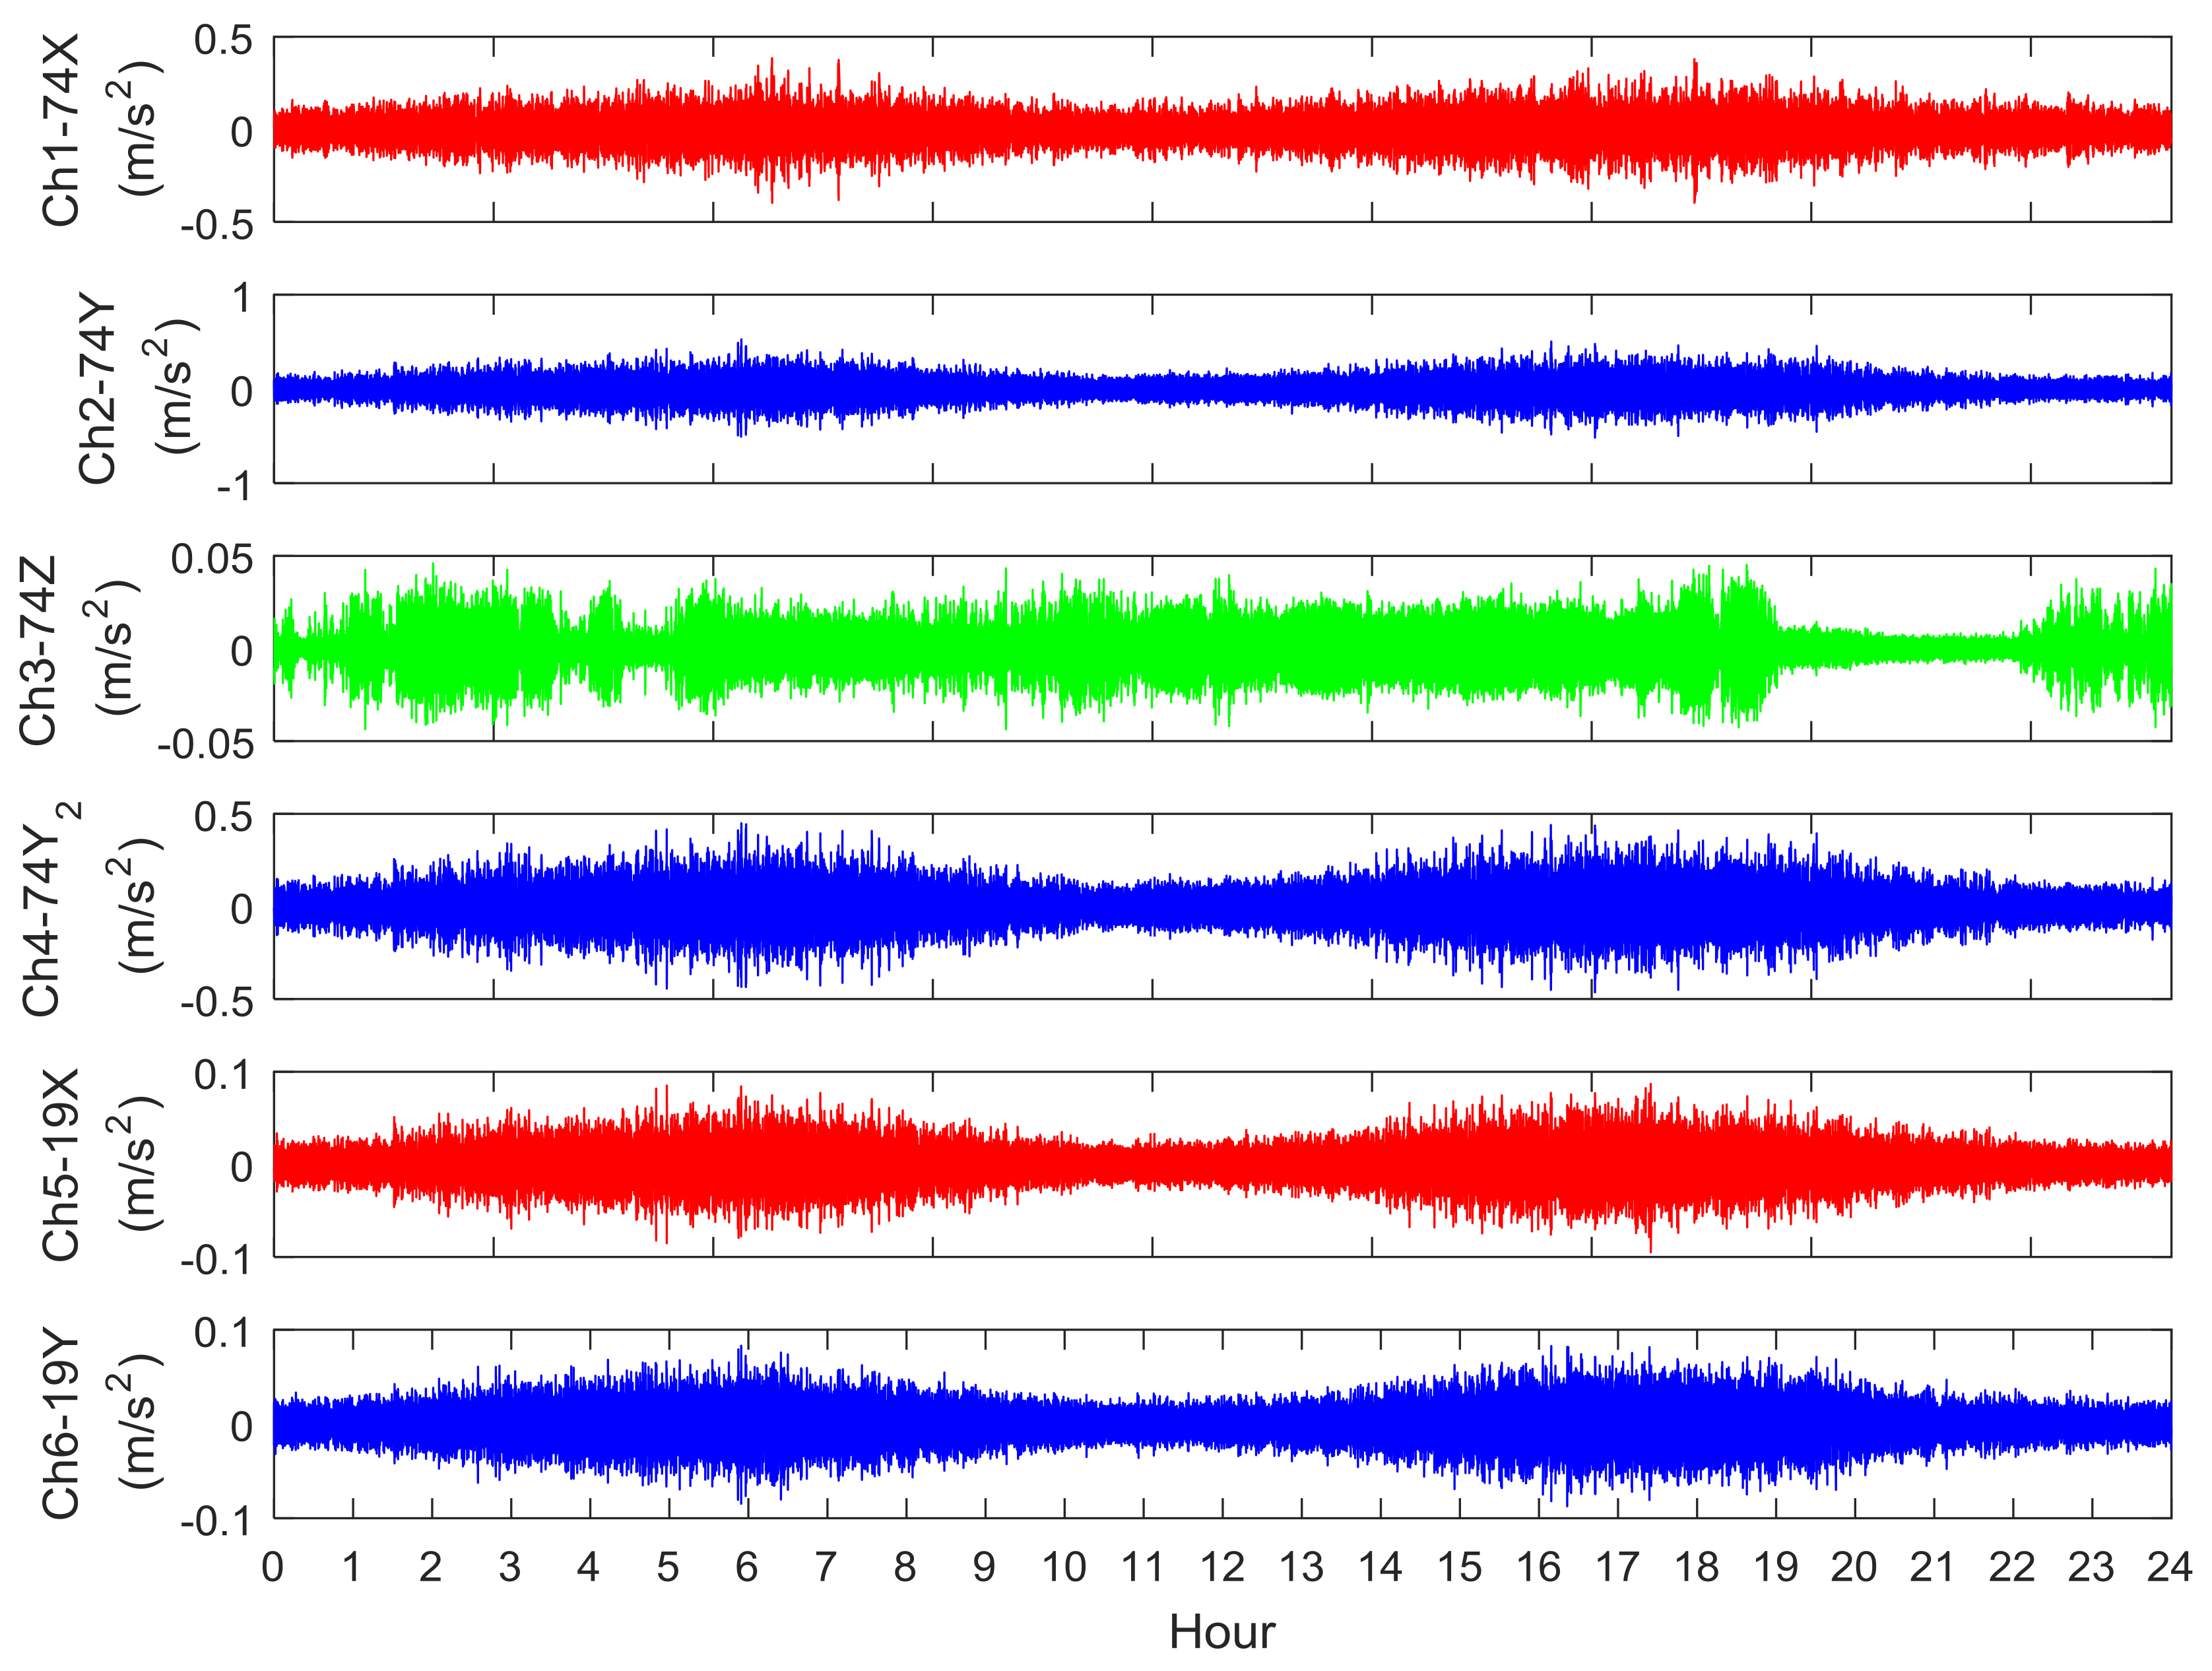
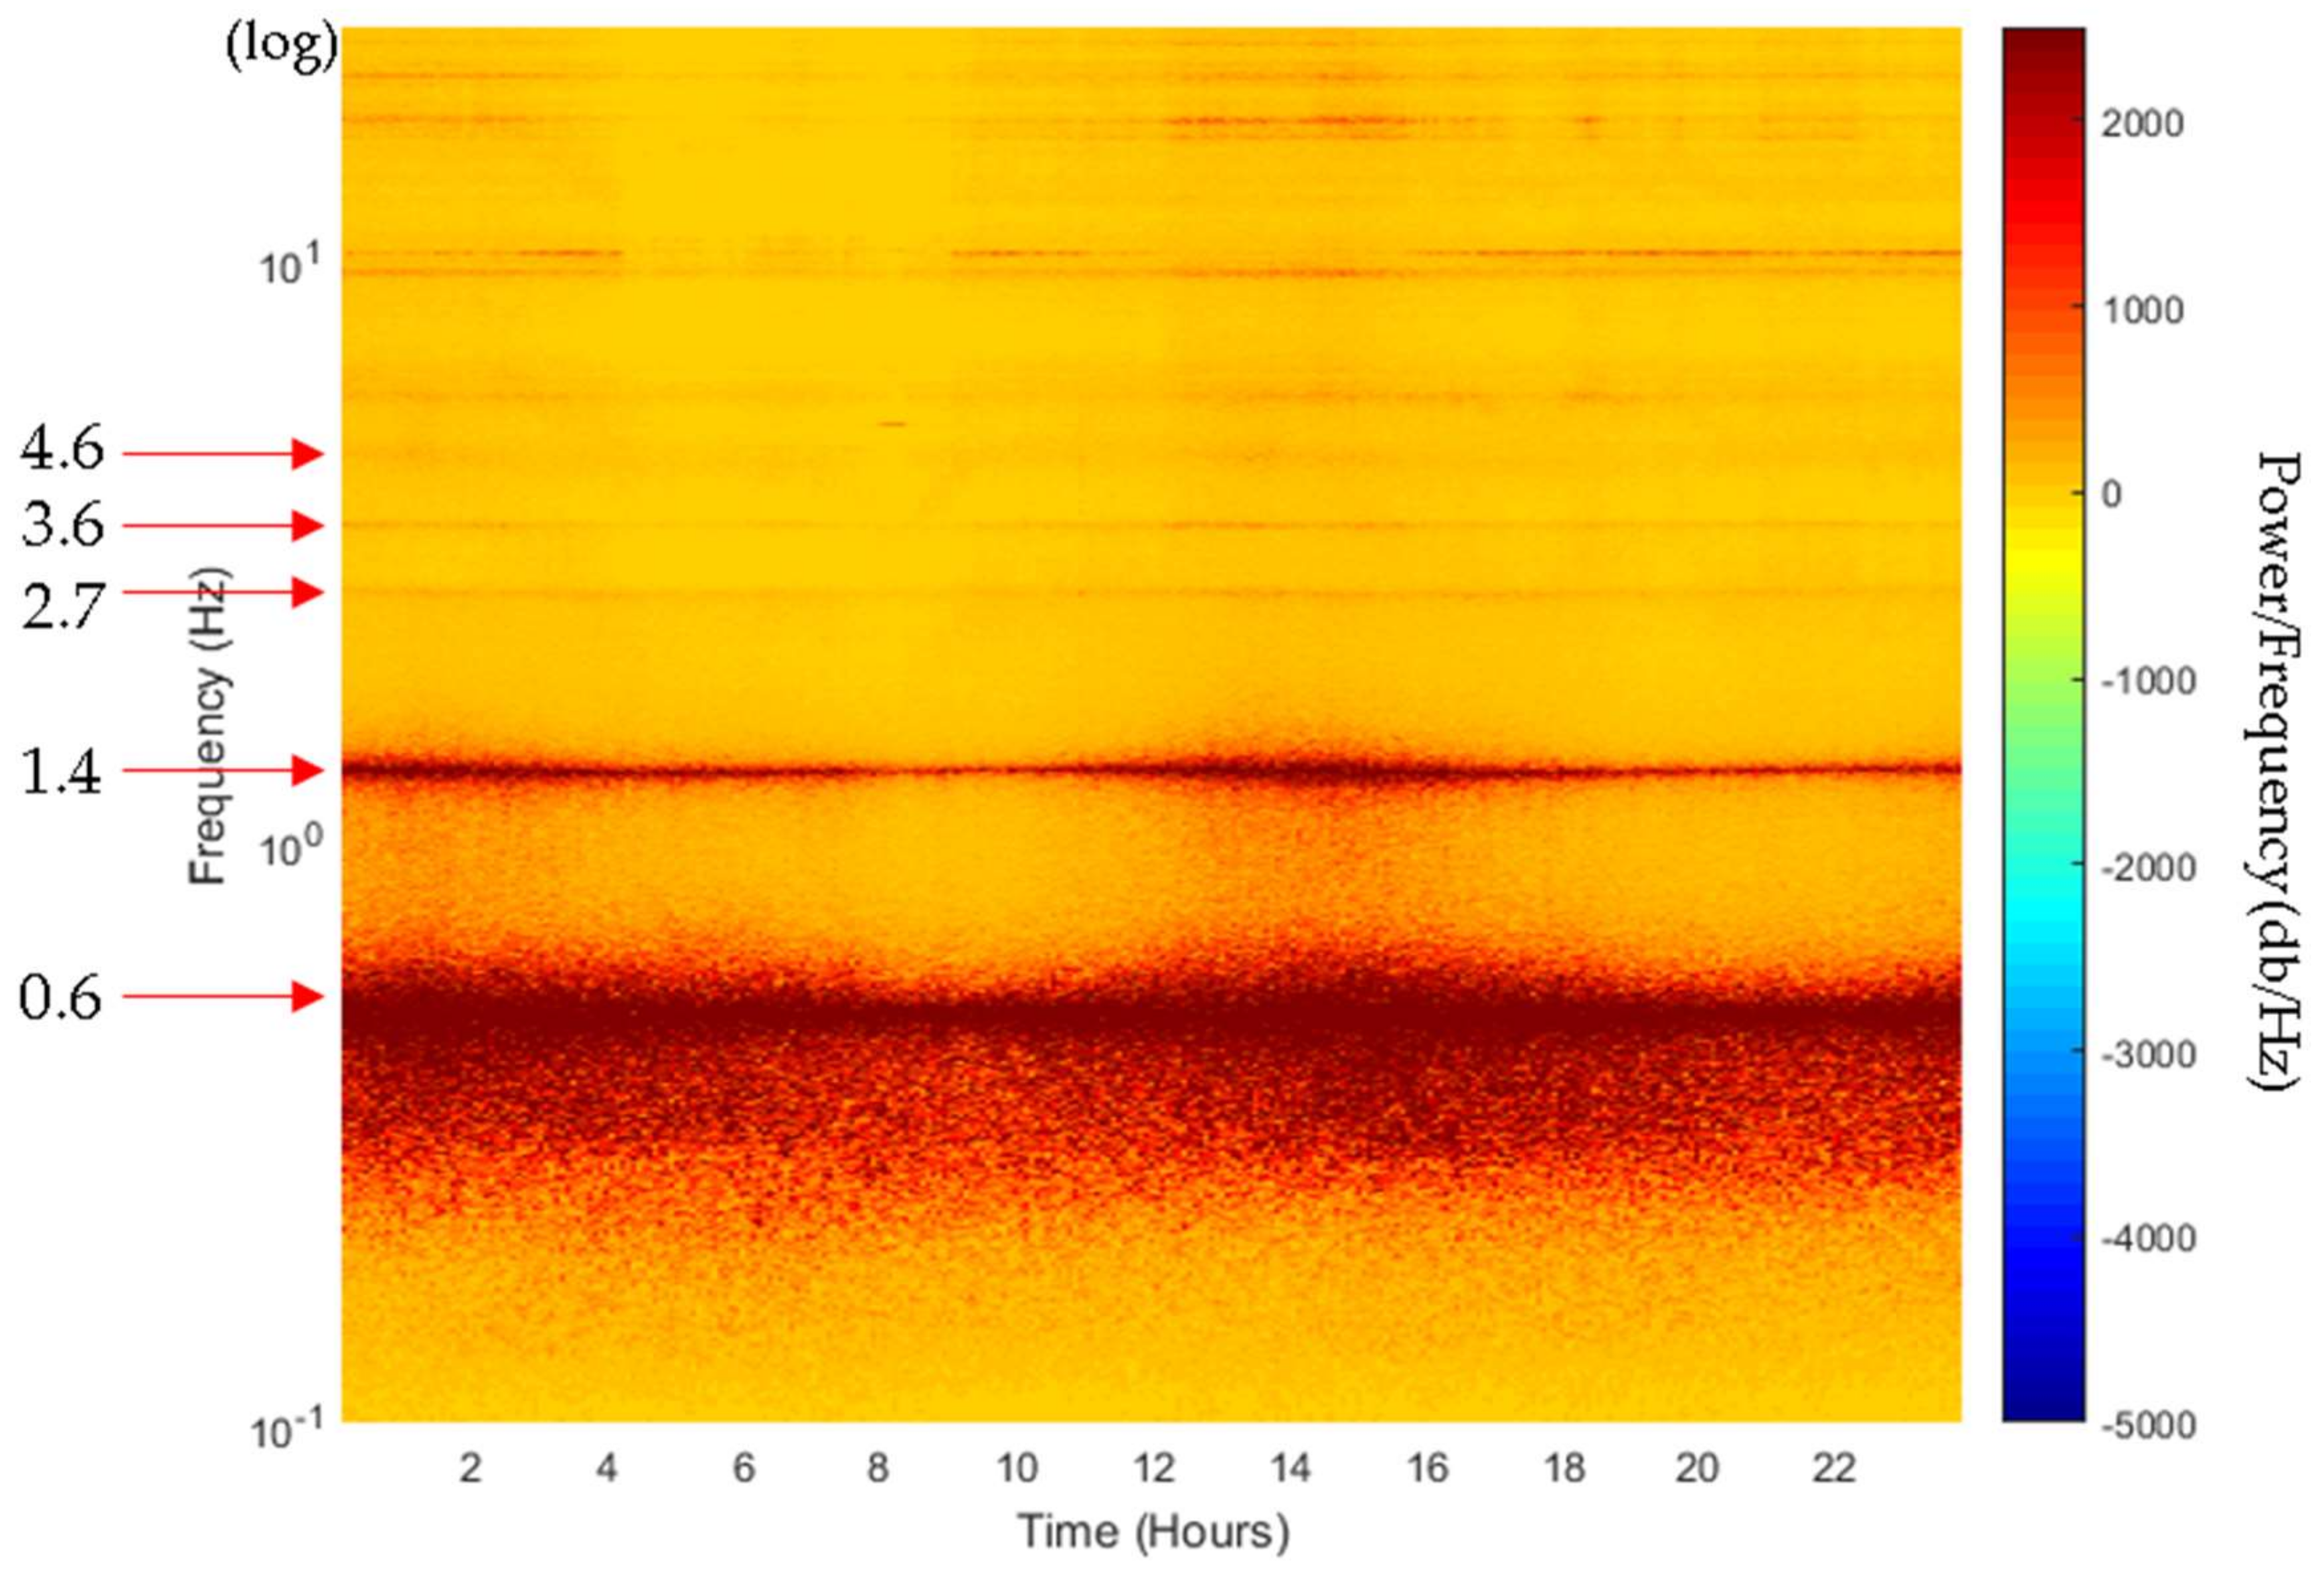
3. Vibration Measurements and Analysis of the Met Mast
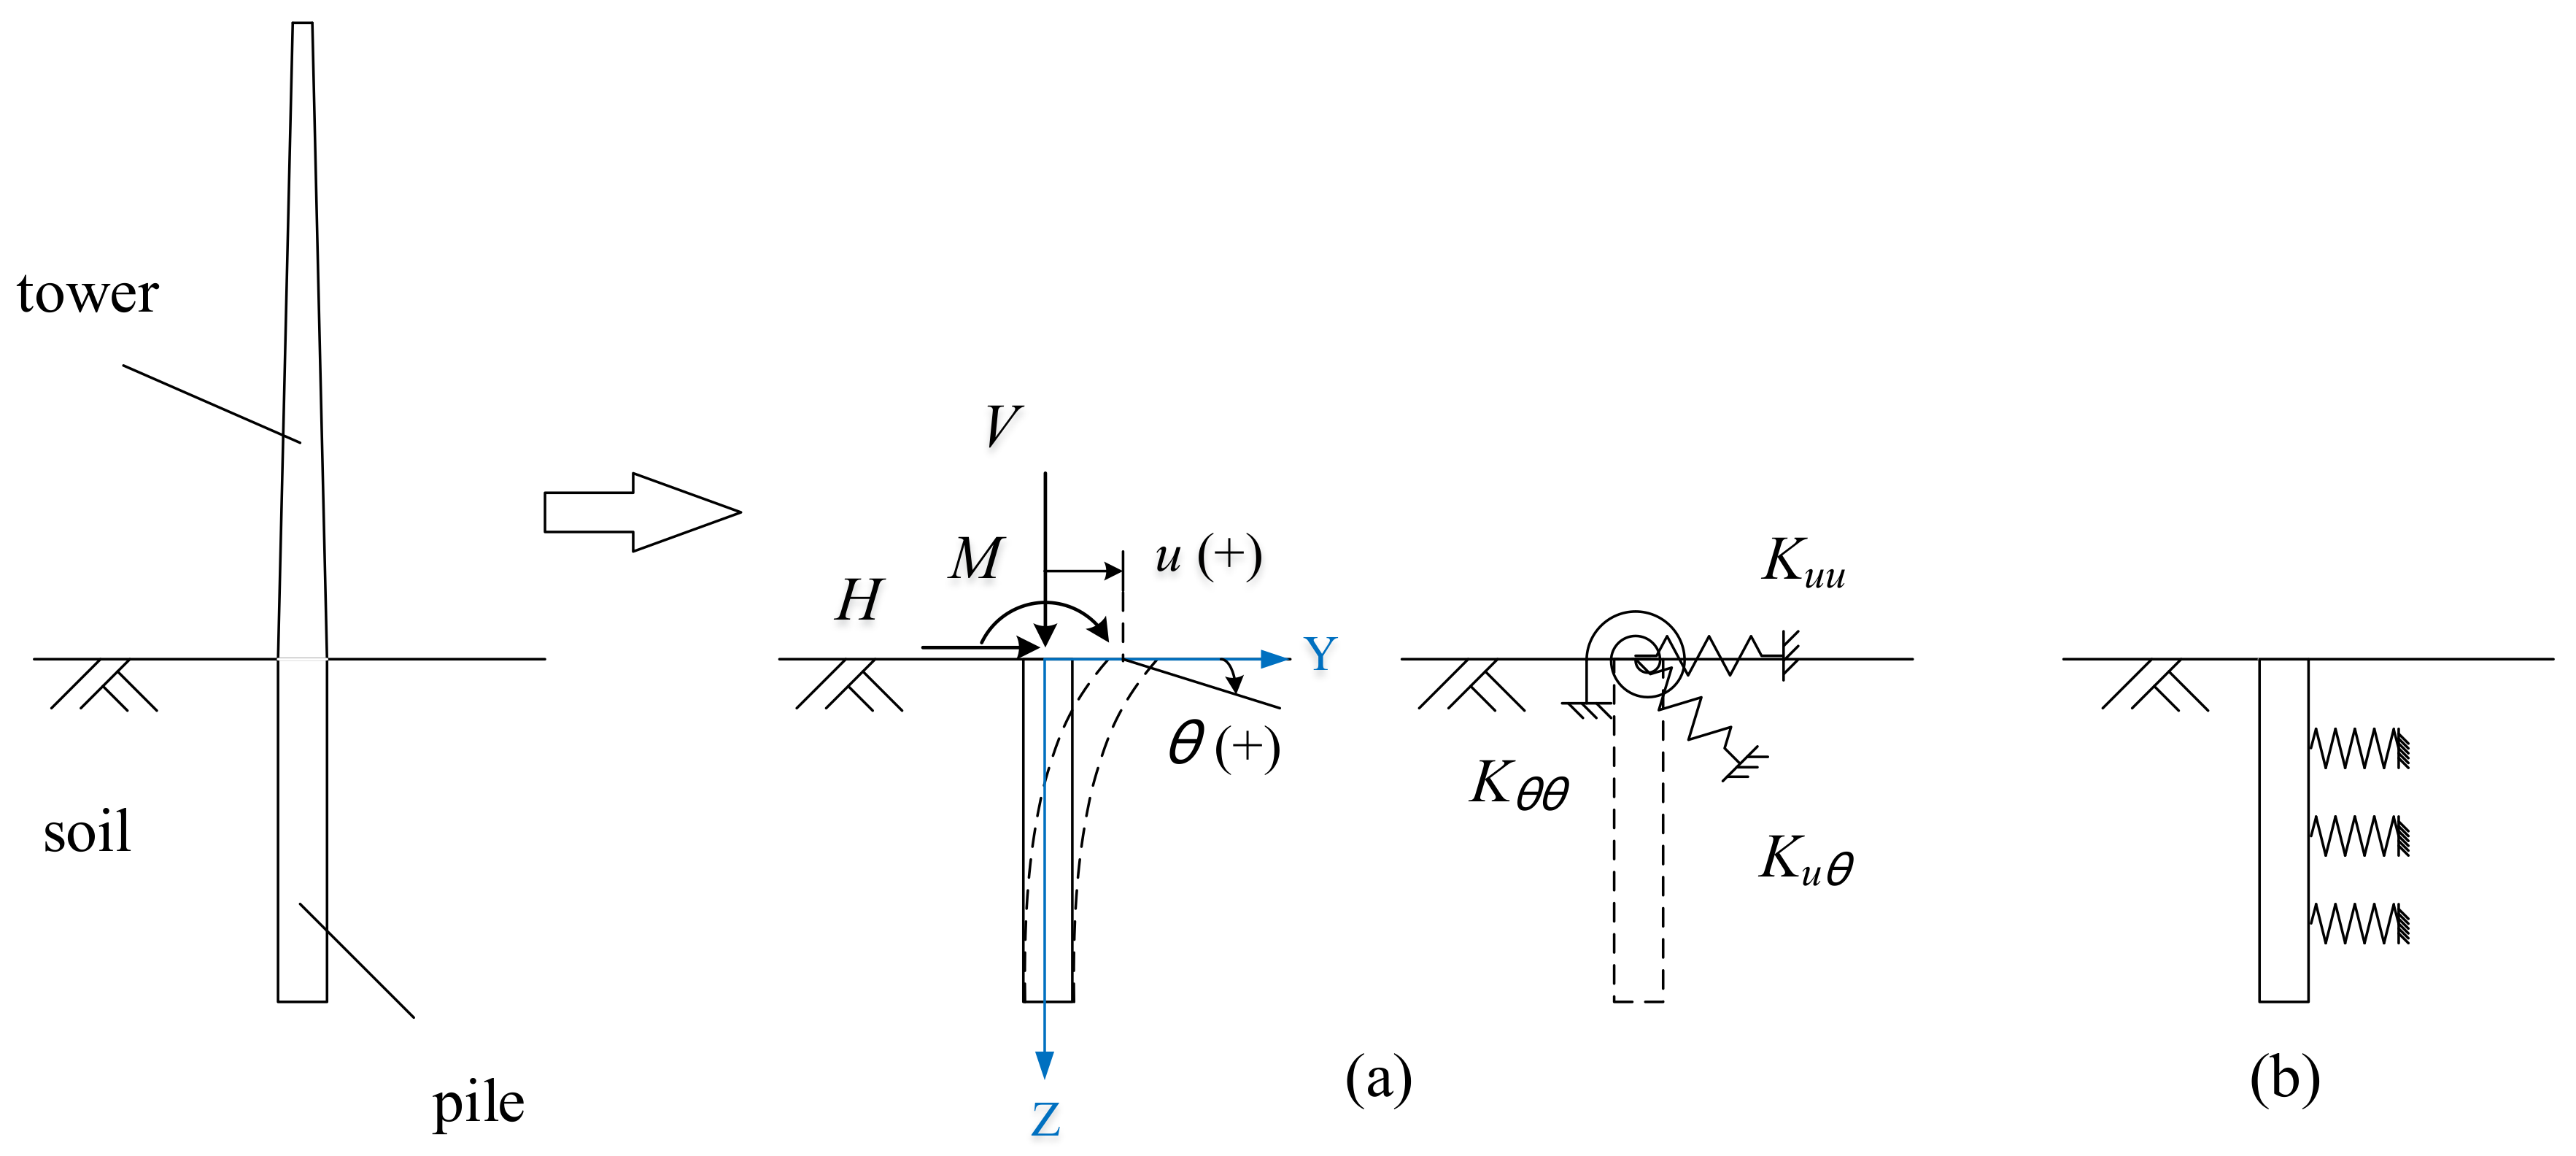
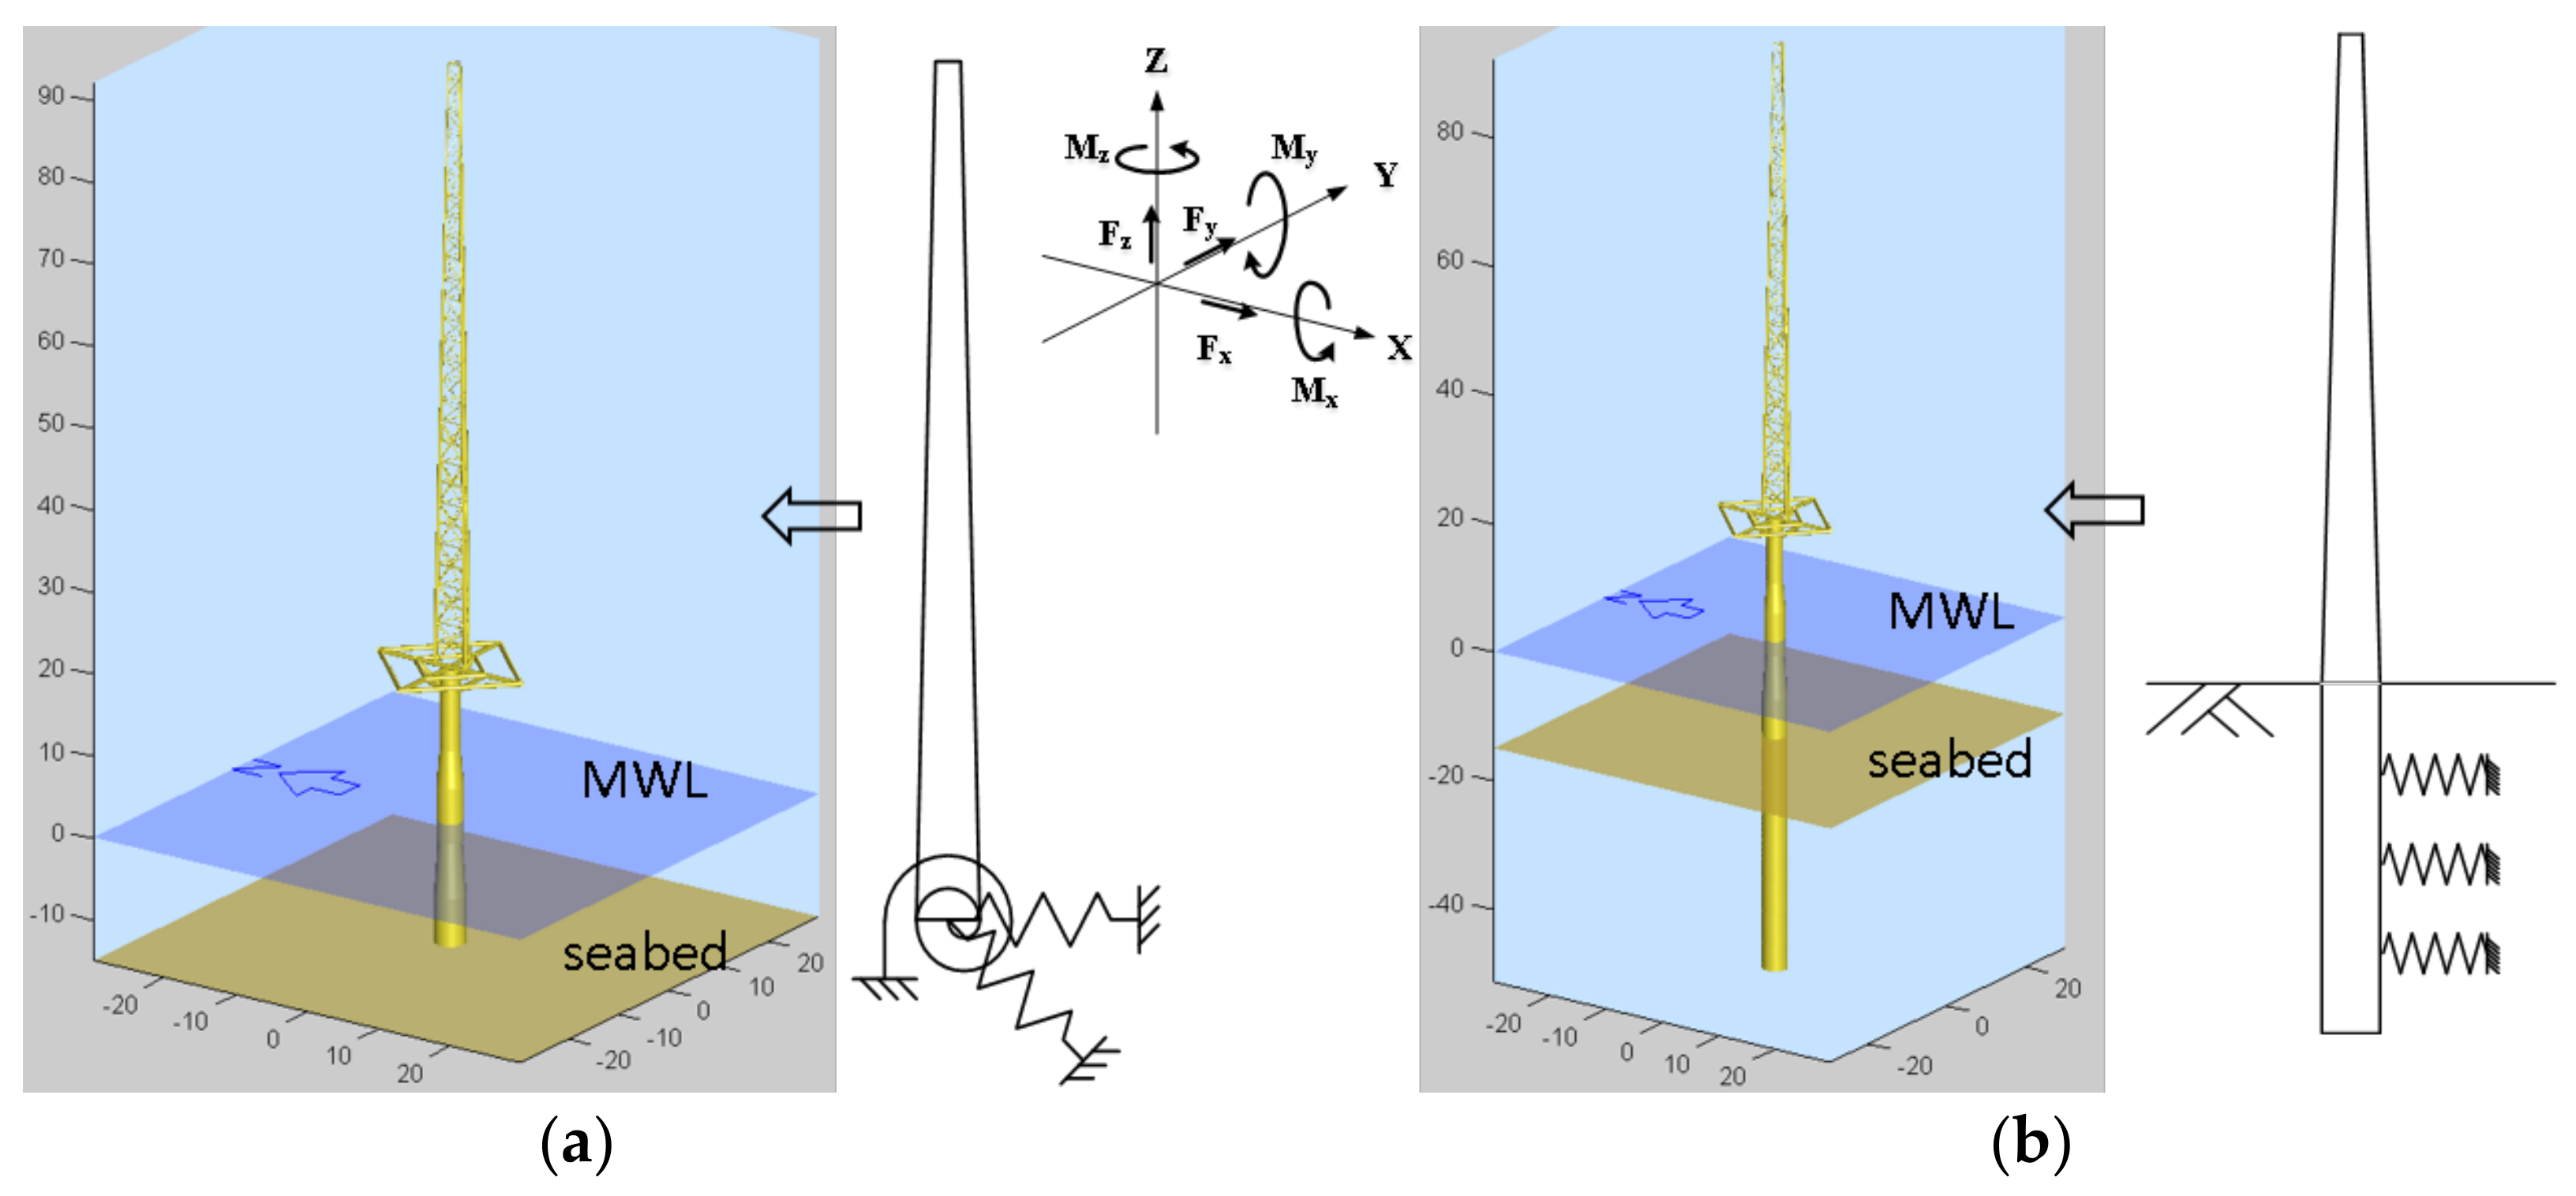
4. Numerical Model to Analyze the Dynamic Responses of Offshore Structures
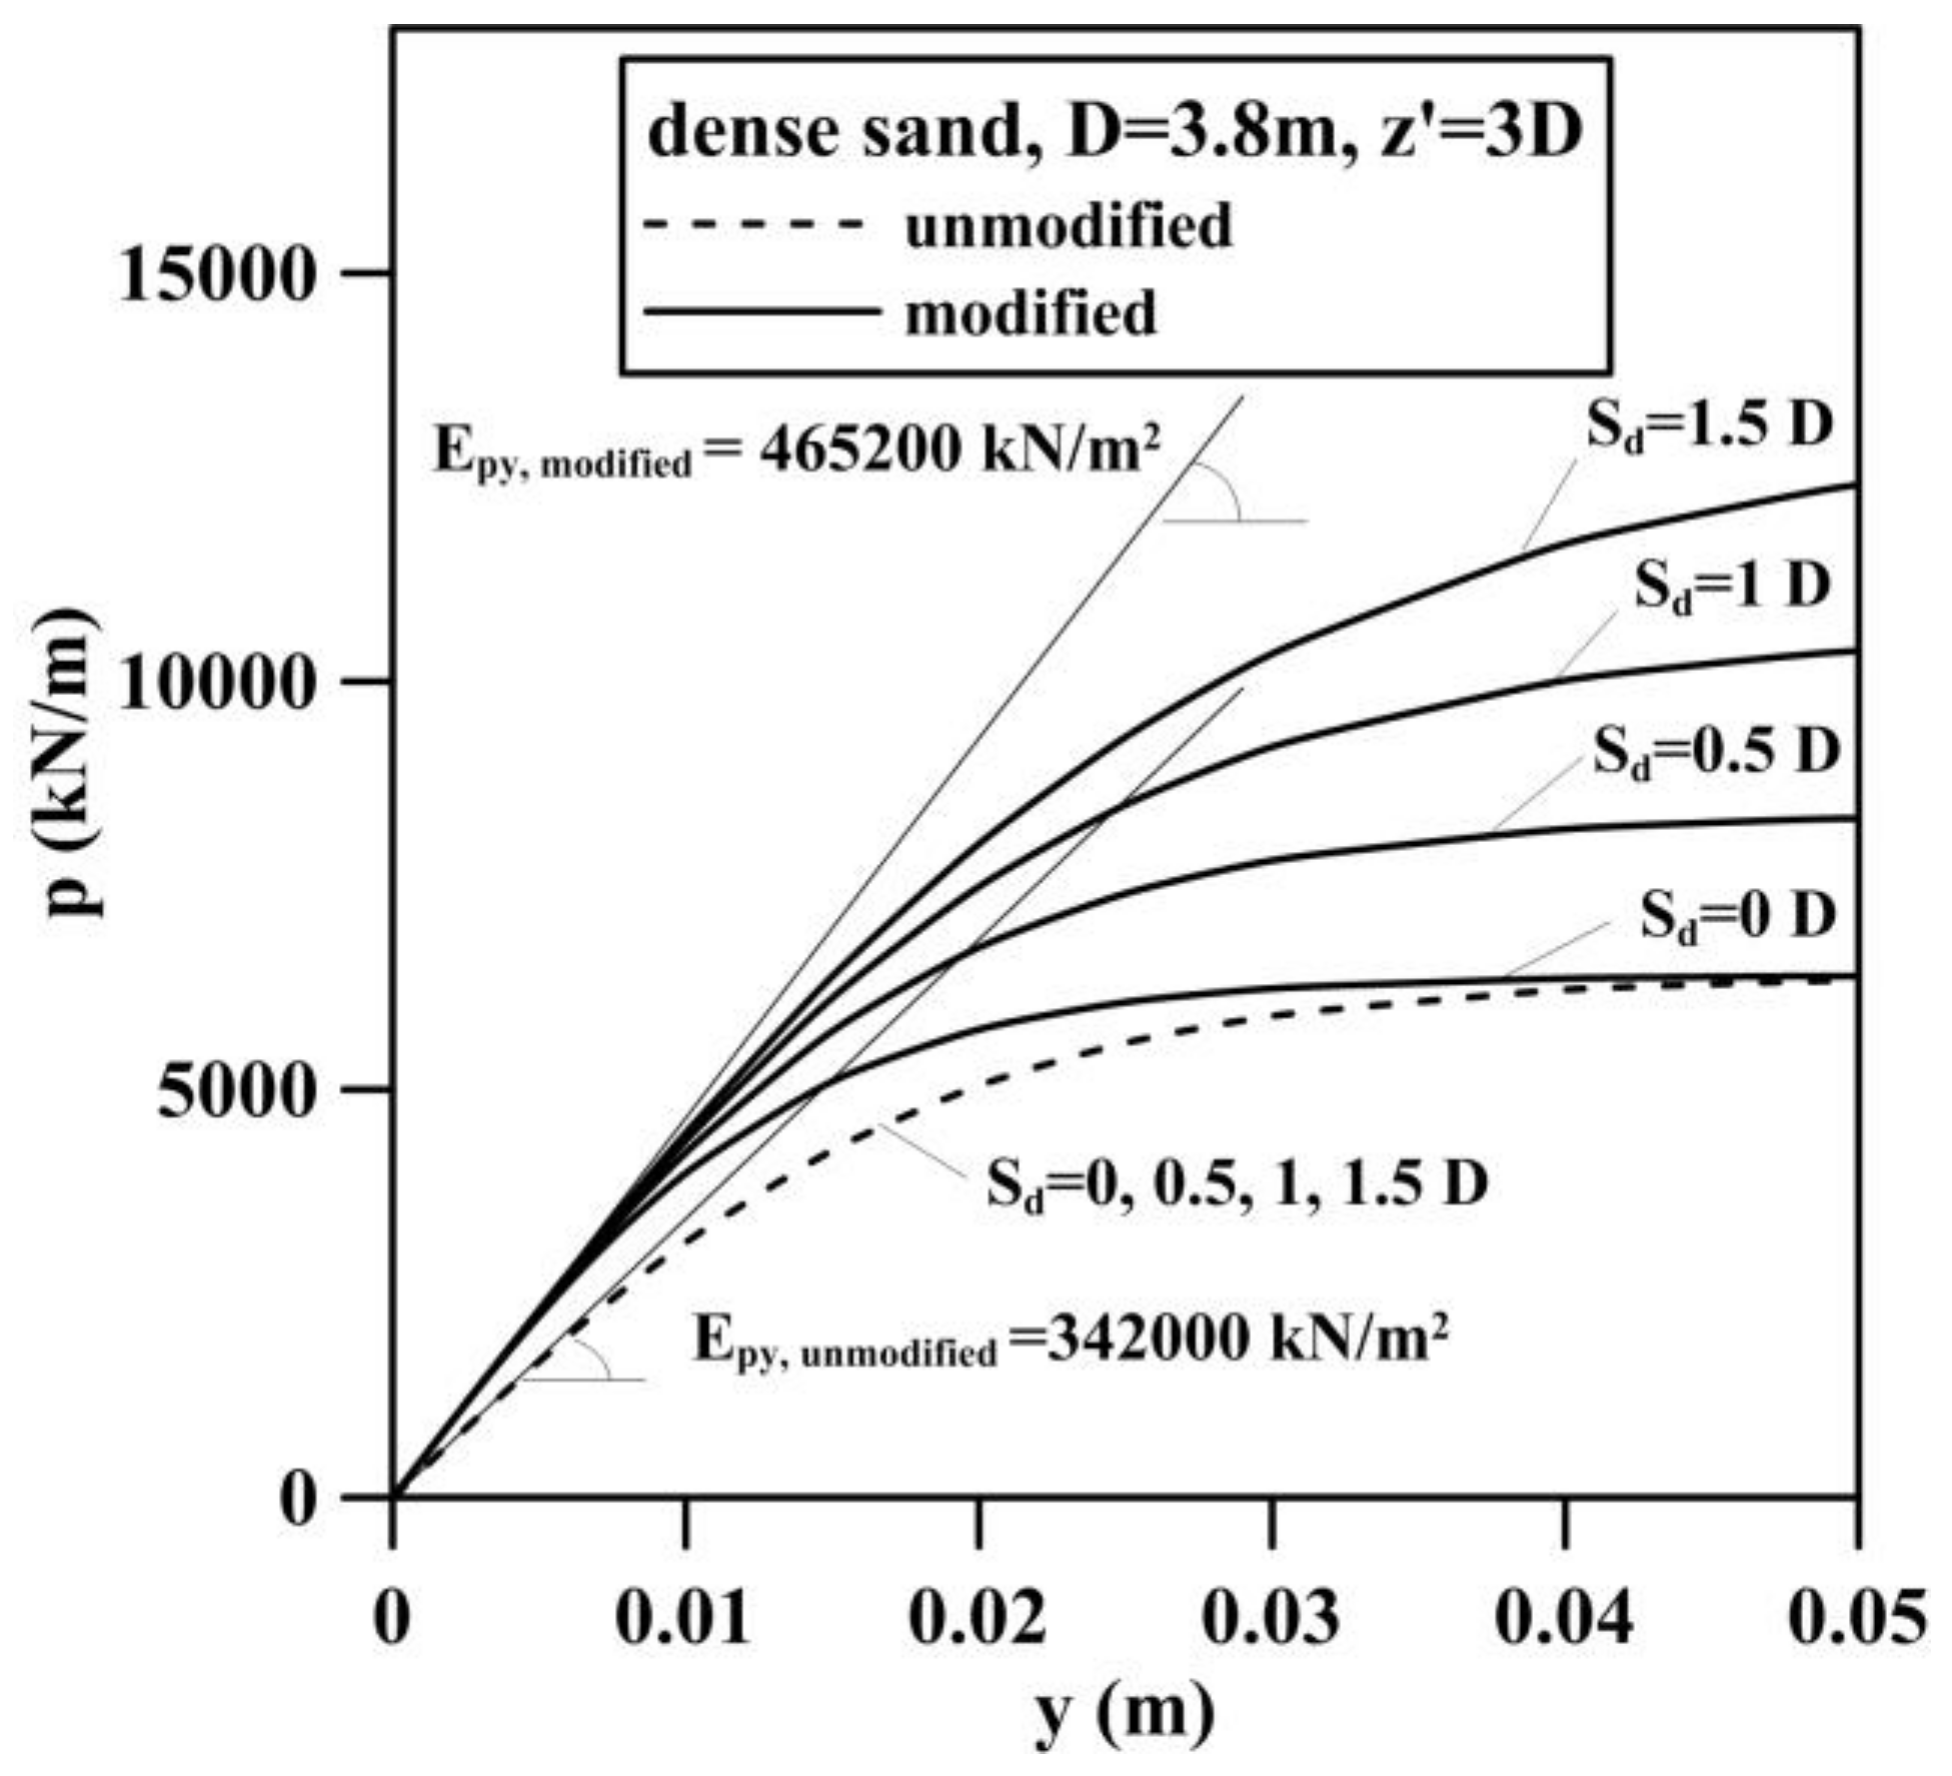
4.1. Load–Deformation Response of the Pile–Soil Interaction
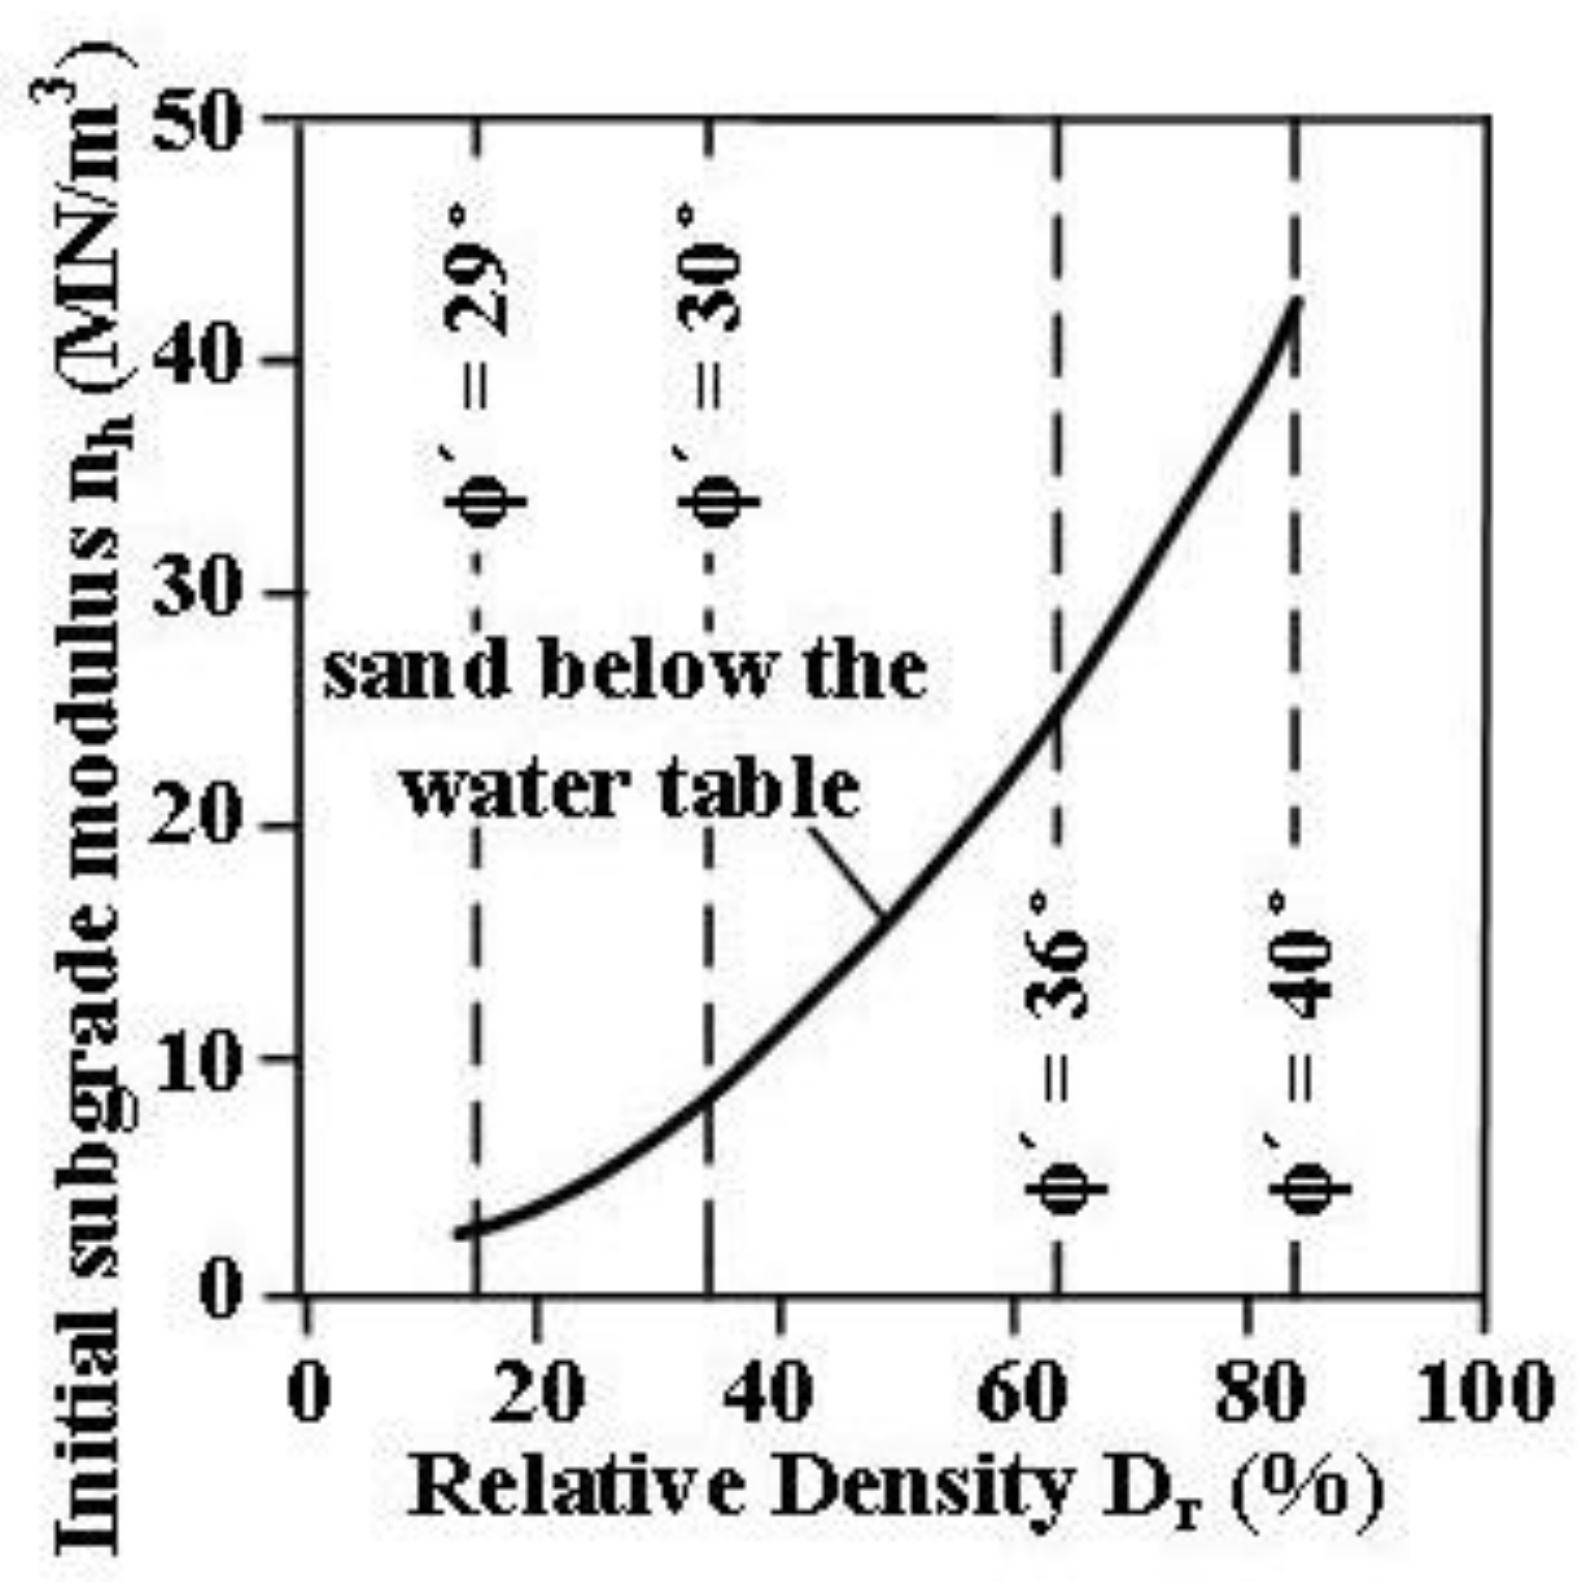
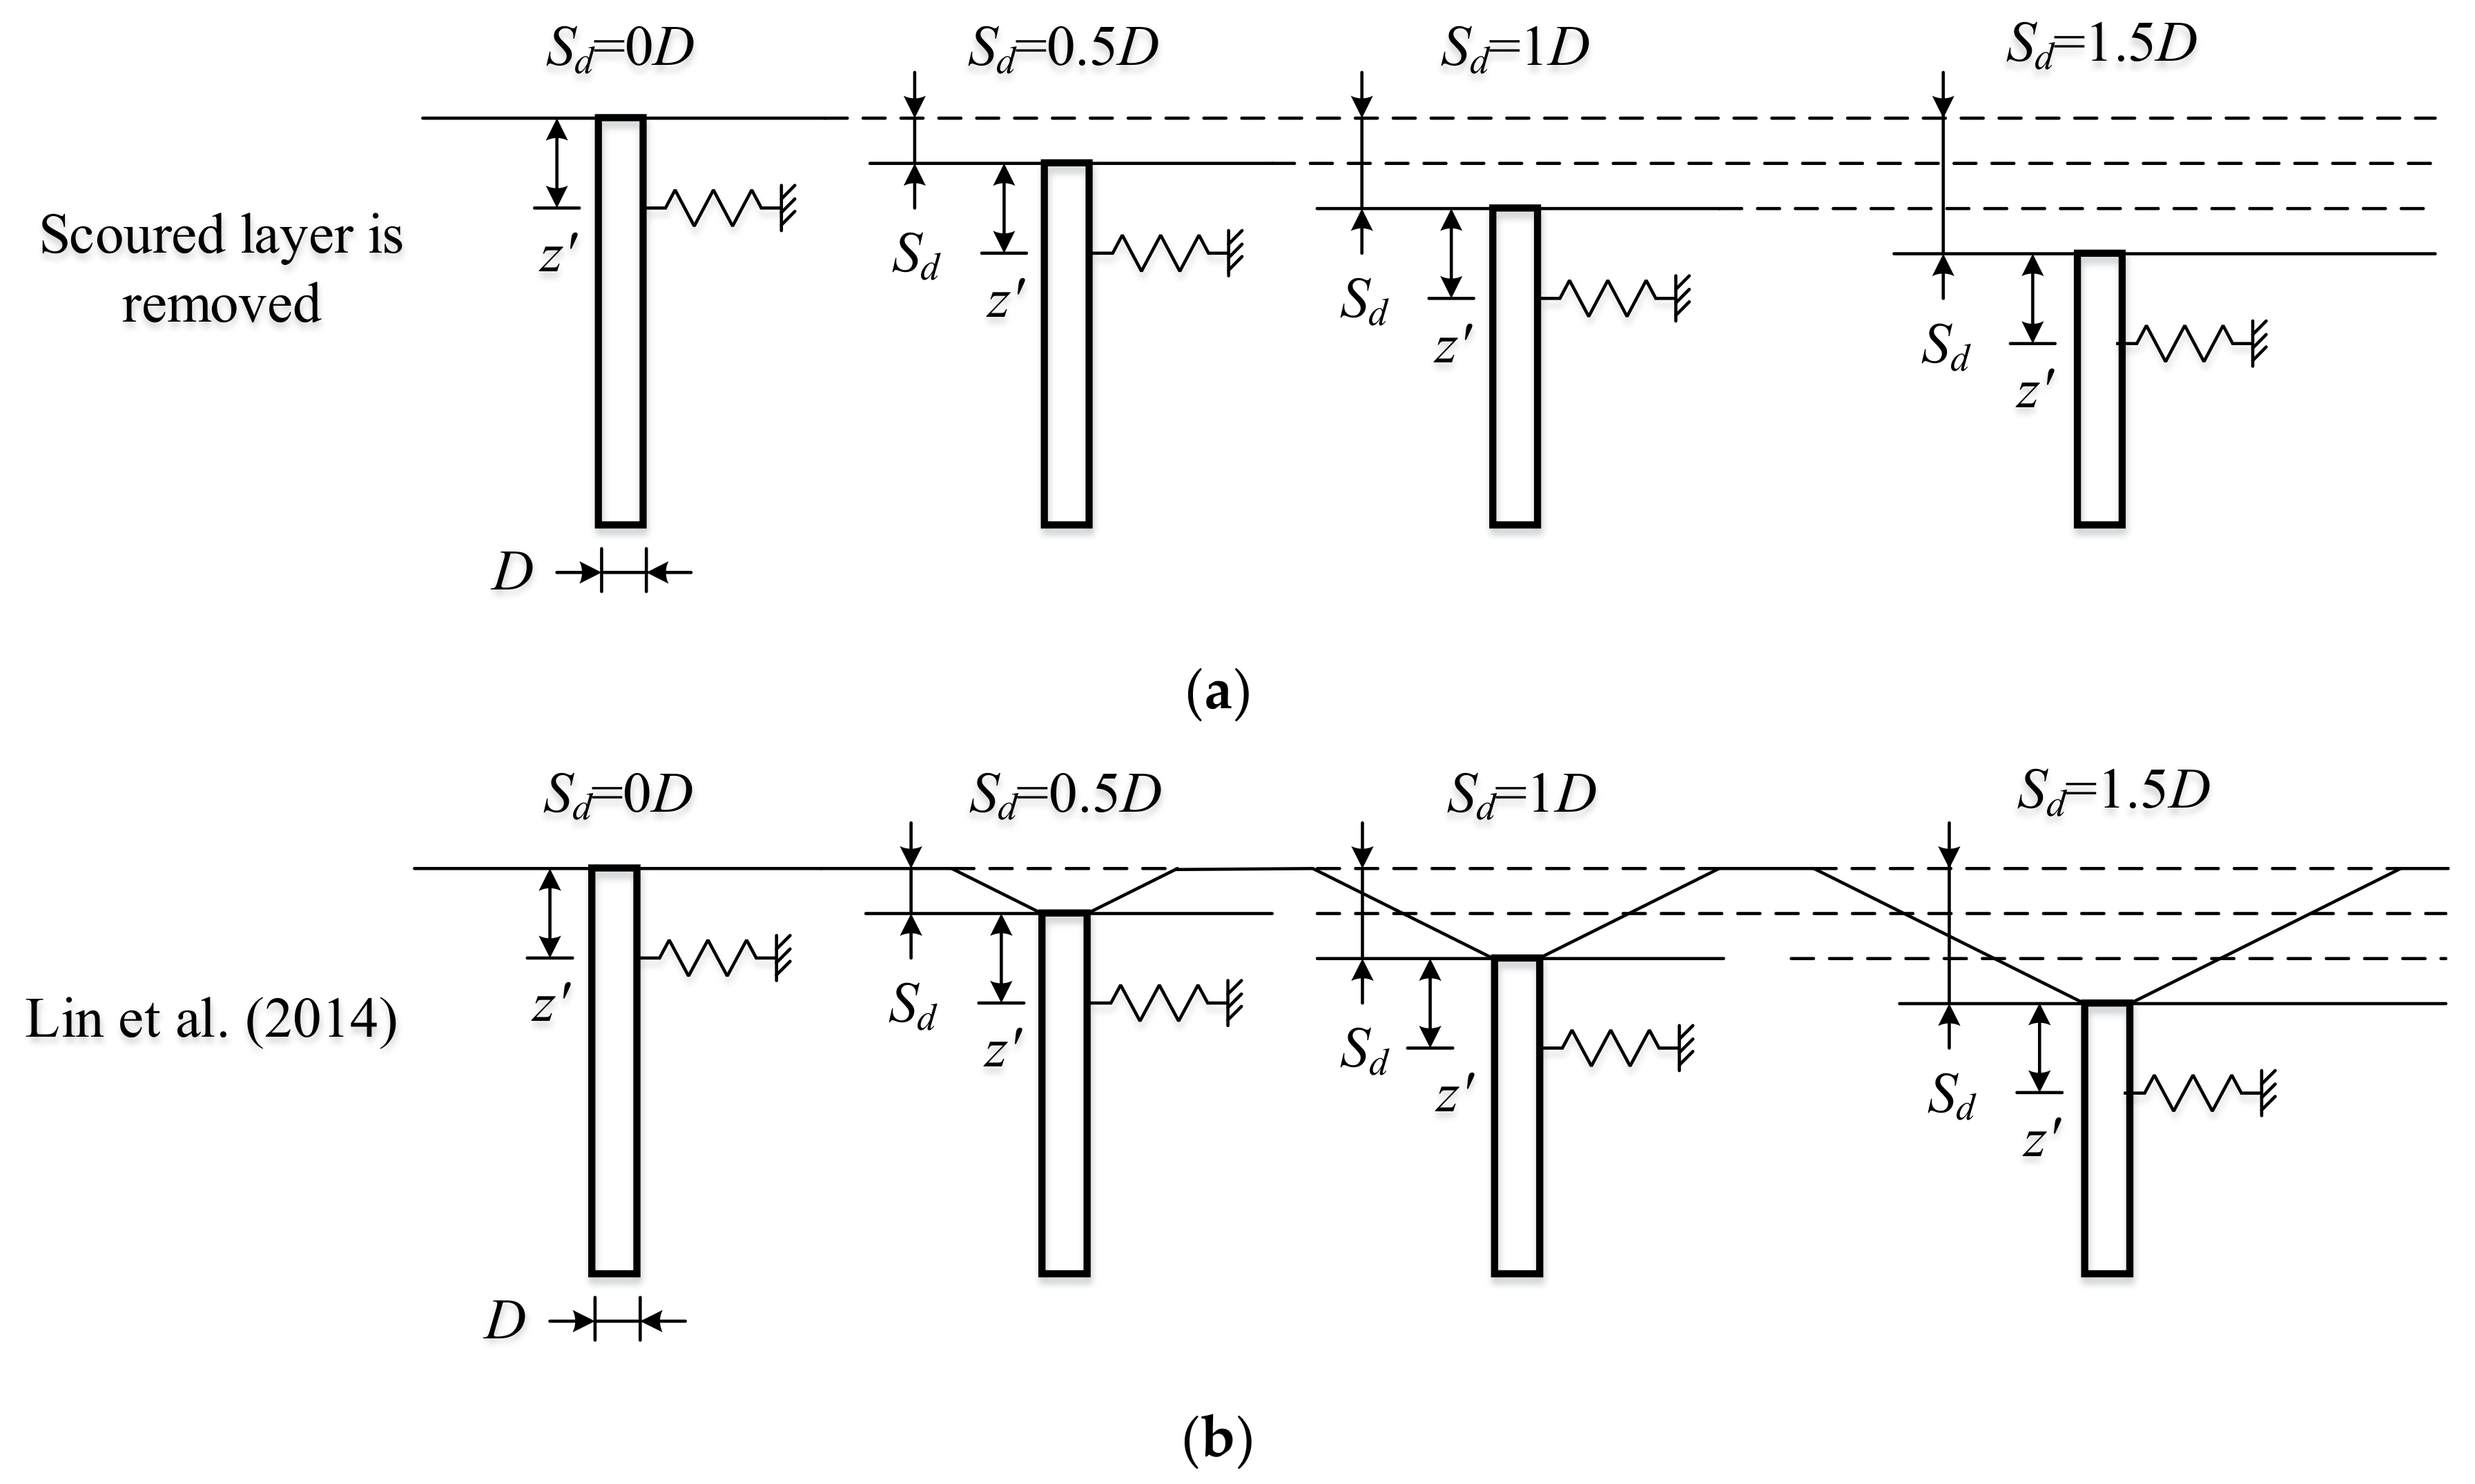
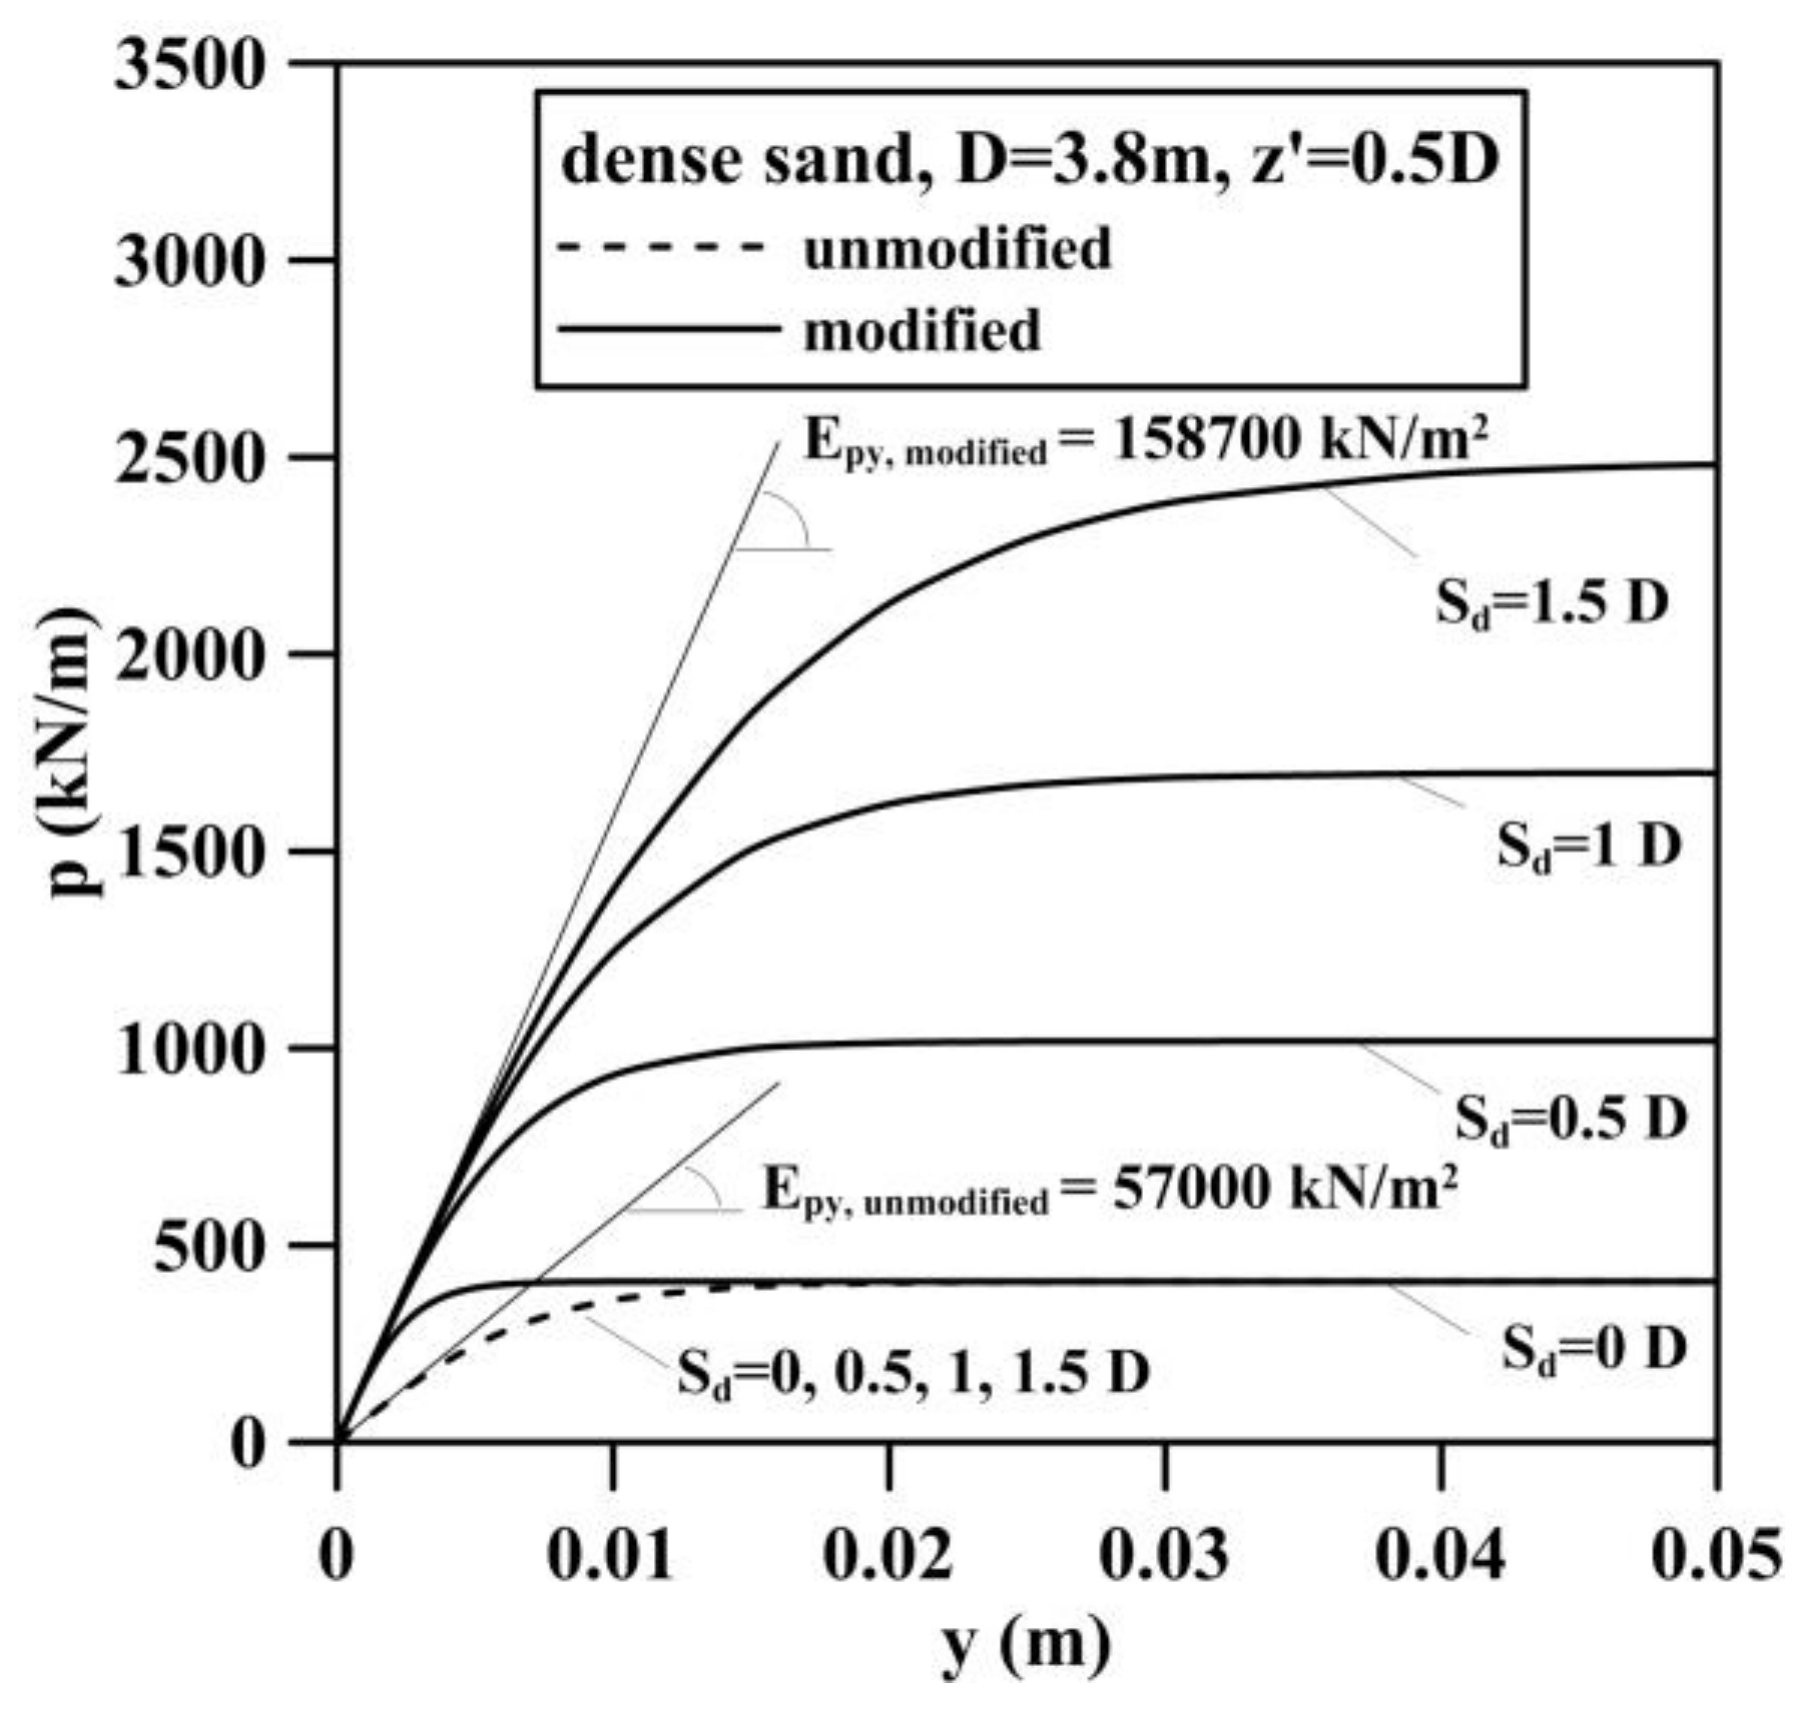
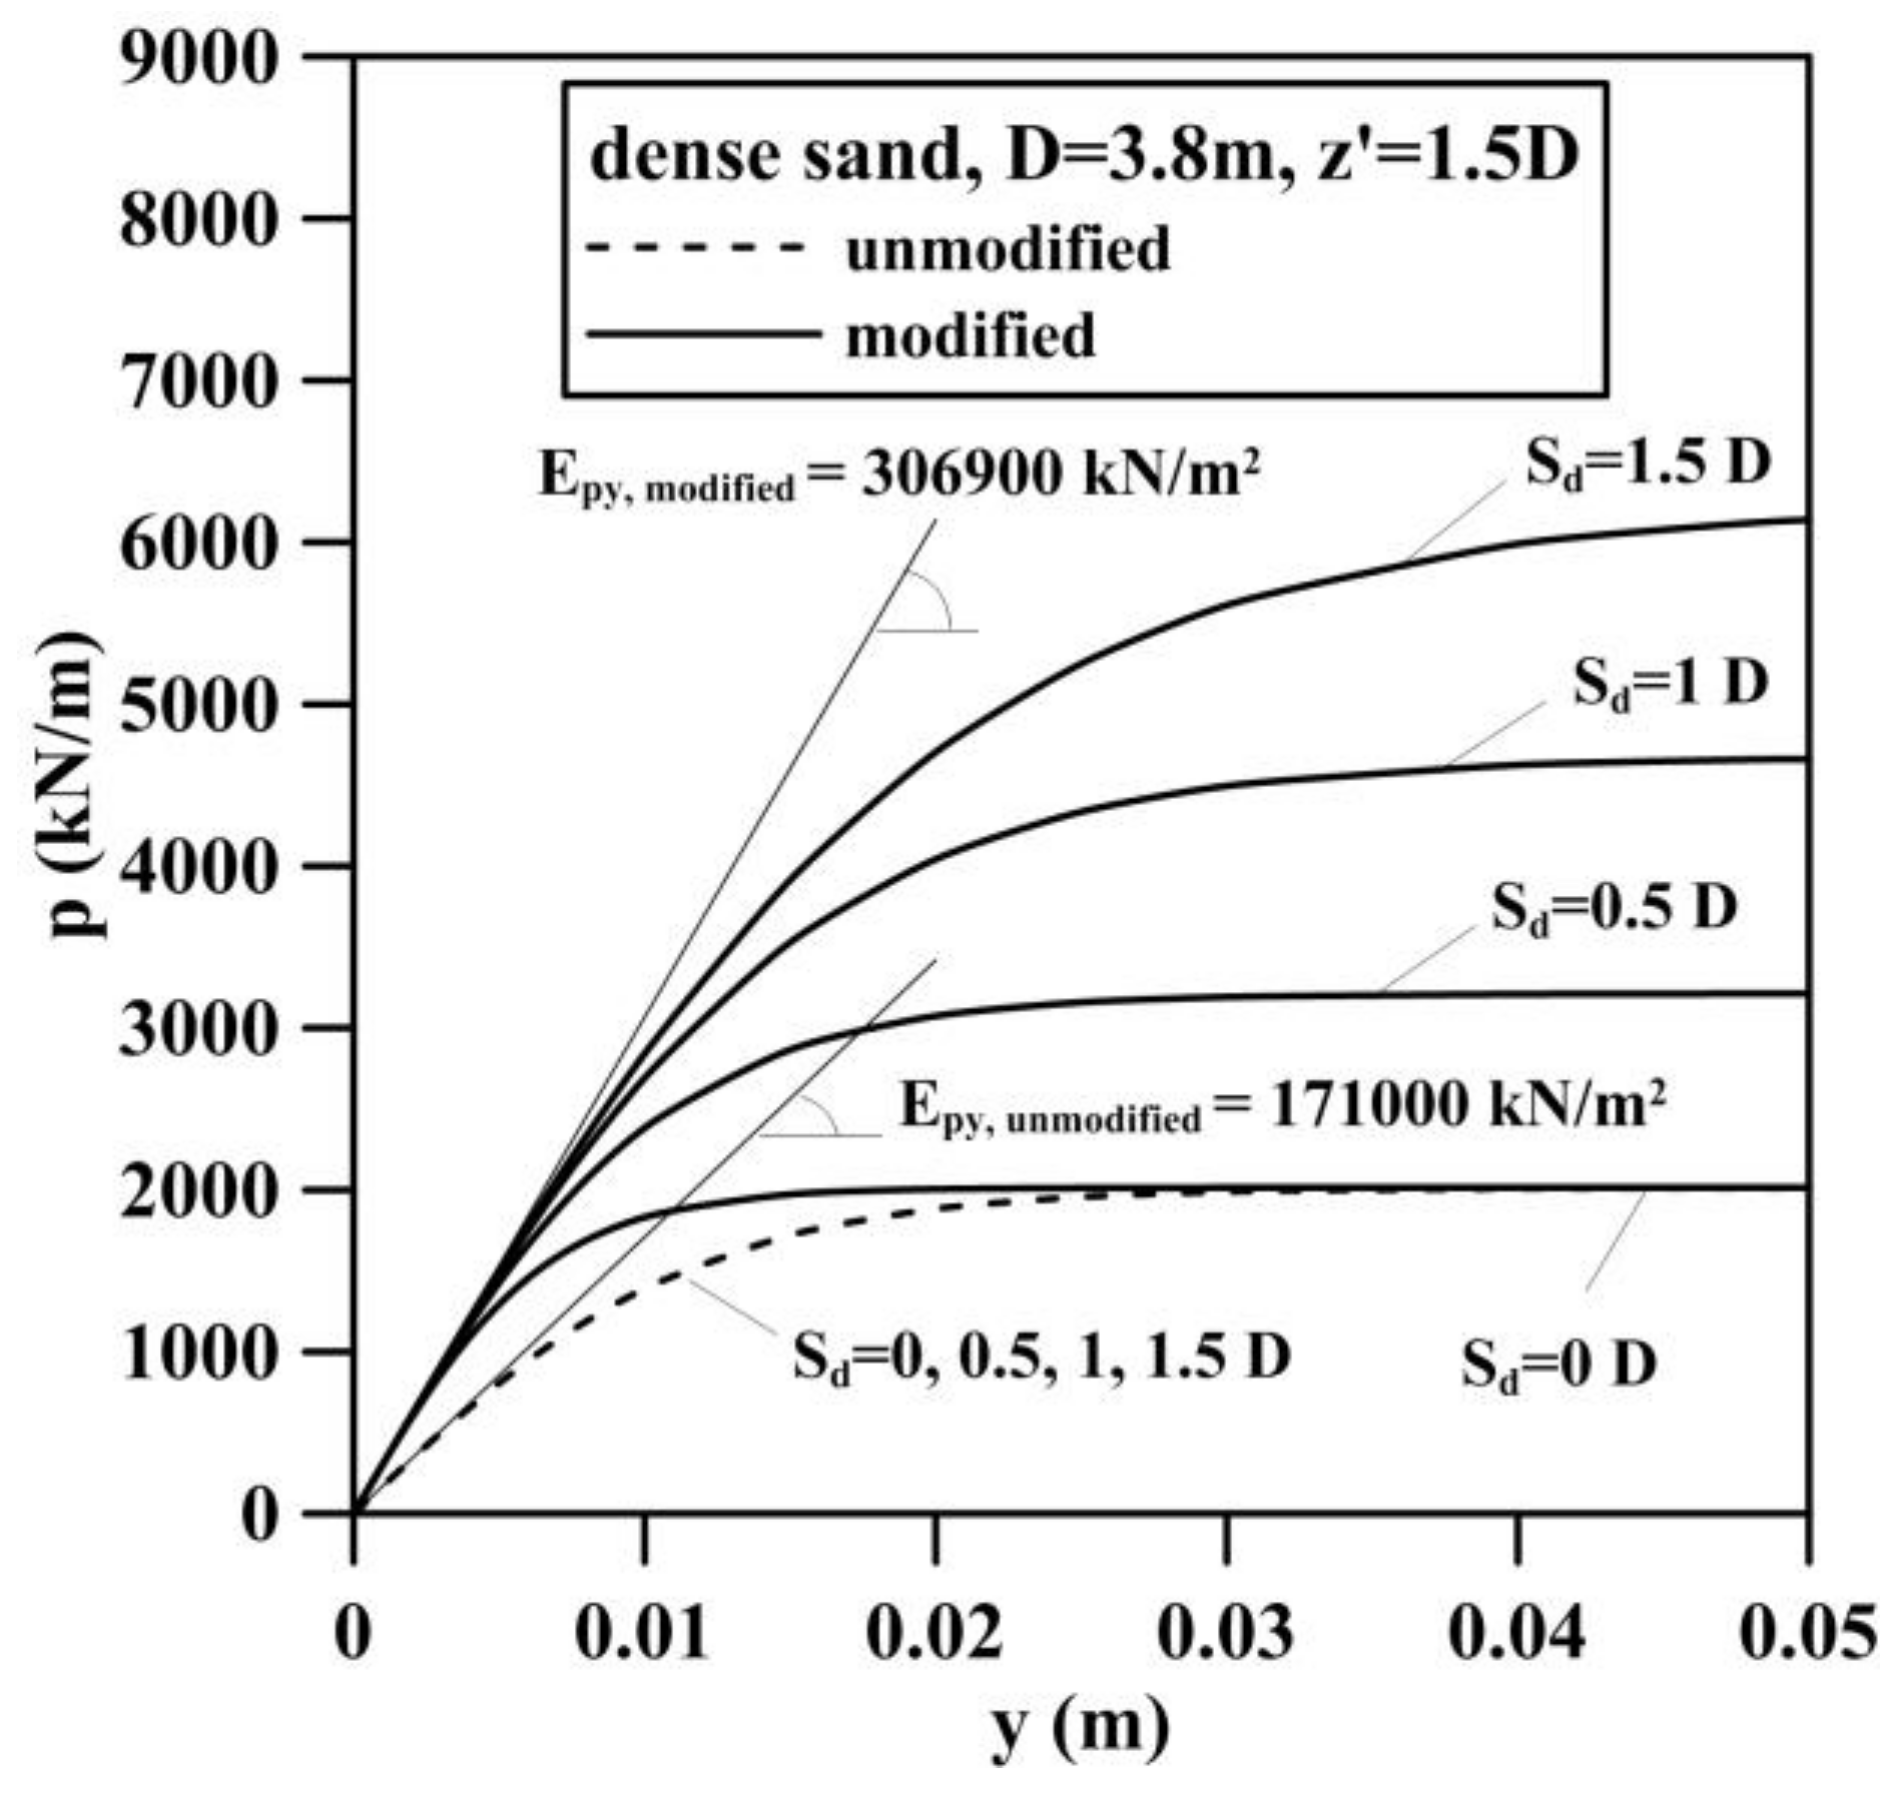
4.2. Effect of Scour on the Monopile Foundation Stiffness
5. Effect of Scour on the Vibration Responses of the Met Mast
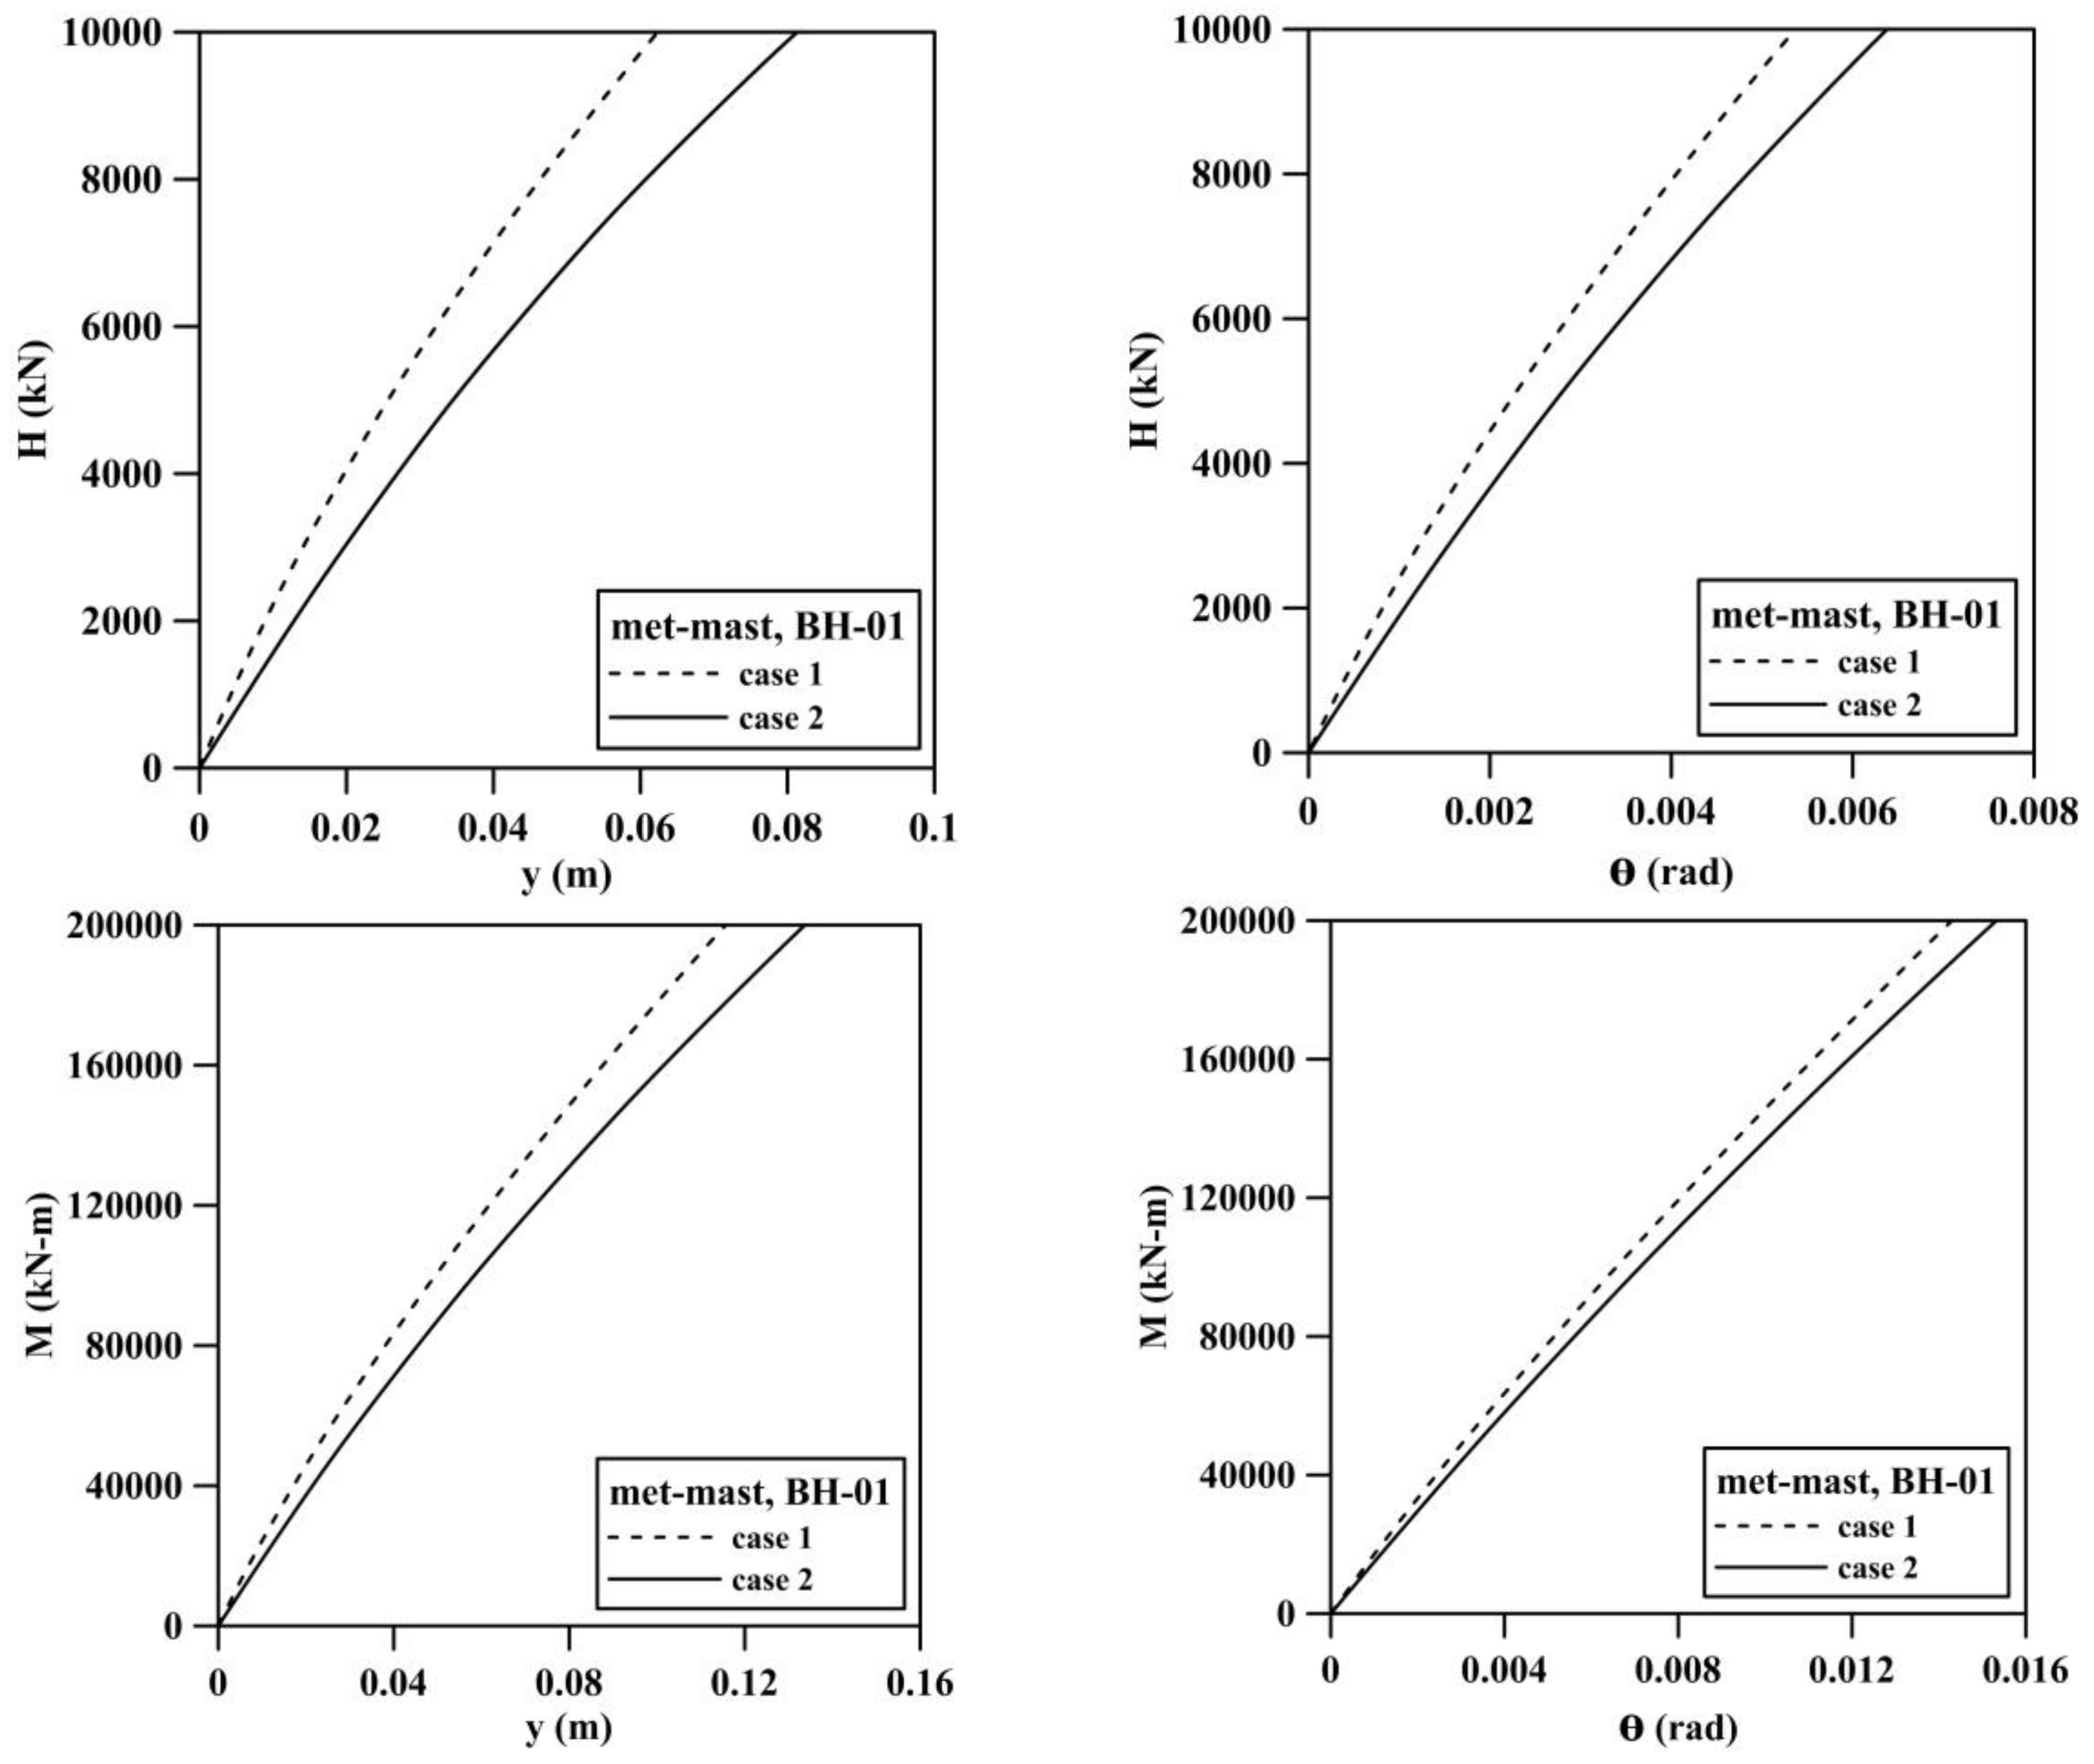
5.1. Verification of the Numerical Model
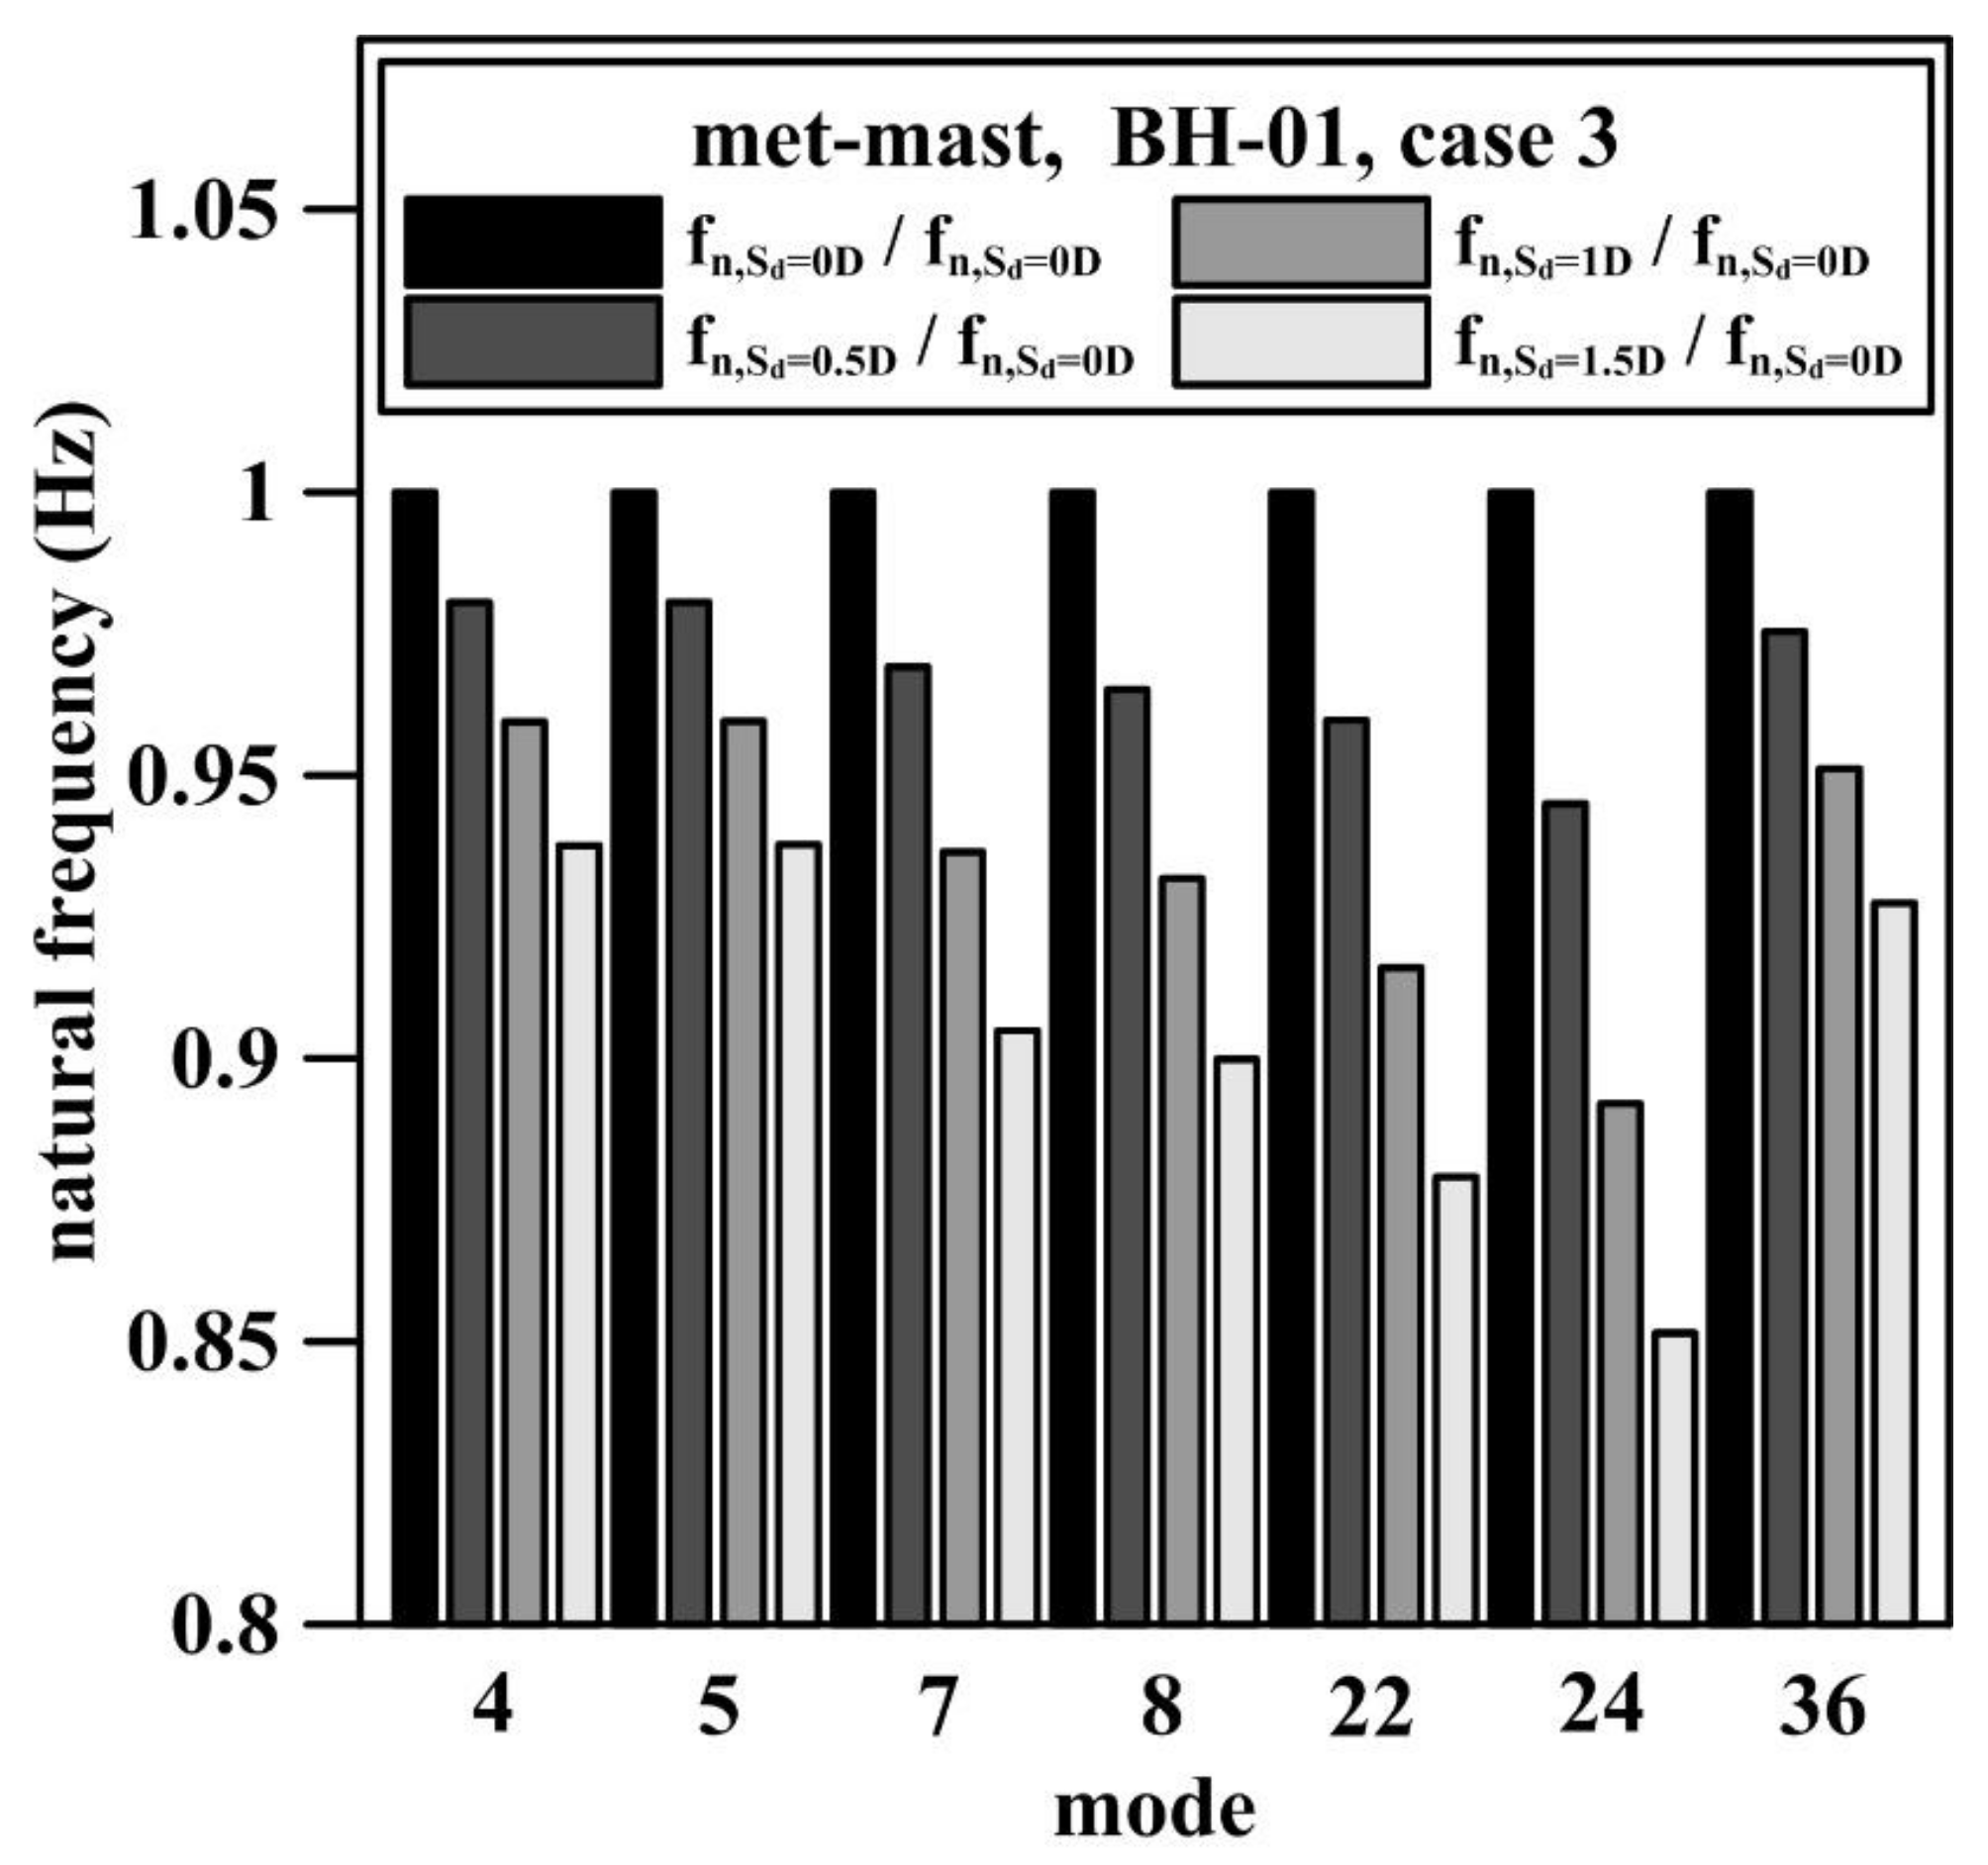
5.2. Effect of Seabed Elevation Caused by Scour on the Natural Frequency
6. Conclusions
Acknowledgments
Author Contributions
Conflicts of Interest
References
- DNV/Risø. Guidelines for Design of Wind Turbines, 2nd ed.; Jydsk Centraltrykkeri: Viby, Denmark, 2002. [Google Scholar]
- Nikitas, G.; Vimalan, N.J.; Bhattacharya, S. An innovative cyclic loading device to study long term performance of offshore wind turbines. Soil Dyn. Earthq. Eng. 2016, 82, 154–160. [Google Scholar] [CrossRef]
- Damgaard, M.; Zania, V.; Andersen, L.V.; Ibsen, L.B. Effects of soil–structure interaction on real time dynamic response of offshore wind turbines on monopiles. Eng. Struct. 2014, 75, 388–401. [Google Scholar] [CrossRef]
- Bhattacharya, S.; Nikitas, N.; Garnsey, J.; Alexander, N.A.; Cox, J.; Lombardi, D.; Wood, D.M.; Nash, D.F. Observed dynamic soil–structure interaction in scale testing of offshore wind turbine foundations. Soil Dyn. Earthq. Eng. 2013, 54, 47–60. [Google Scholar] [CrossRef]
- Arany, L.; Bhattacharya, S.; Macdonald, J.; Hogan, S.J. Design of monopiles for offshore wind turbines in 10 steps. Soil Dyn. Earthq. Eng. 2017, 92, 126–152. [Google Scholar] [CrossRef]
- Versteijlen, W.G.; Metrikine, A.V.; van Dalen, K.N. A method for identification of an effective Winkler foundation for large-diameter offshore wind turbine support structures based on in-situ measured small-strain soil response and 3D modelling. Eng. Struct. 2016, 124, 221–236. [Google Scholar] [CrossRef]
- Prendergast, L.J.; Gavin, K. A comparison of initial stiffness formulations for small-strain soil–pile dynamic Winkler modelling. Soil Dyn. Earthq. Eng. 2016, 81, 27–41. [Google Scholar] [CrossRef]
- API RP 2GEO. Geotechnical and Foundation Design Considerations; American Petroleum Institute: Washington, DC, USA, 2011. [Google Scholar]
- DNV GL AS. Support Structures for Wind Turbines; Standard DNV GL-ST-0126; DNV GL AS: Oslo, Norway, 2016. [Google Scholar]
- Abdel-Rahman, K.; Achmus, M. Finite element modelling of horizontally loaded monopile foundations for offshore wind energy converters in Germany. In Proceedings of the First International Symposium on Frontiers in Offshore Geotechnics, Perth, Australia, 19–21 September 2005; Taylor and Francis: Boca Raton, FL, USA, August 2005; pp. 391–396. [Google Scholar]
- Lesny, K.; Wiemann, J. Finite-Element-Modelling of Large Diameter Monopiles for Offshore Wind Energy Converters. In Proceedings of the GeoCongress 2006, Atlanta, GA, USA, 26 February–1 March 2006. [Google Scholar] [CrossRef]
- Sørensen, S.P.H.; Ibsen, L.B.; Augustesen, A.H. Effects of diameter on initial stiffness of py curves for large-diameter piles in sand. In Proceedings of the European Conference on Numerical Methods in Geotechnical Engineering, Trondheim, Norway, 2–4 June 2010. [Google Scholar]
- Sørensen, S.P.H. Soil-Structure Interaction for Non-Slender, Large-Diameter Offshore Monopiles. Ph.D. Thesis, Aalborg University, Aalborg, Denmark, 2012. [Google Scholar]
- Kallehave, D.; Thilsted, C.L.; Liingaard, M.A. Modification of the API py Formulation of Initial Stiffness of Sand, Offshore Site Investigation and Geotechnics: Integrated Technologies-Present and Future; Society of Underwater Technology: London, UK, 2012. [Google Scholar]
- Sumer, B.M.; Fredsøe, J. The Mechanics of Scour in the Marine Environment; World Scientific: Singapore, 2002. [Google Scholar]
- Whitehouse, R.; Sutherland, J.; O’Brien, D. Seabed scour assessment for offshore windfarm. In Proceedings of the 3rd International Conference on Scour and Erosion, Gouda, The Netherlands, 3–5 July 2006. [Google Scholar]
- Li, Y.; Chen, X.; Fan, S.; Briaud, J.L.; Chen, H.C. Is scour important for pile foundation design in deepwater? In Proceedings of the Offshore Technology Conference, Houston, TX, USA, 4–7 May 2009. [Google Scholar]
- Achmus, M.; Kuo, Y.S.; Abdel-Rahman, K. Numerical investigation of scour effect on lateral resistance of windfarm monopiles. In Proceedings of the Twentieth International Offshore and Polar Engineering Conference, Beijing, China, 20–25 June 2010. [Google Scholar]
- Qi, W.G.; Gao, F.P. Physical modeling of local scour development around a large-diameter monopile in combined waves and current. Coastal Eng. 2014, 83, 72–81. [Google Scholar] [CrossRef]
- Det Norske Veritas AS. Design of Offshore Wind Turbine Structures; DNV-OS-J101; Det Norske Veritas AS: Oslo, Norway, 2004. [Google Scholar]
- Zaaijer, M.B. Design Methods for Offshore Wind Turbines at Exposed Sites (OWTES)—Sensitivity Analysis for Foundations of Offshore Wind Turbines; Delft University of Technology: Delft, The Netherlands, 2002. [Google Scholar]
- Lin, C.; Bennett, C.; Han, J.; Parsons, R.L. Scour effects on the response of laterally loaded piles considering stress history of sand. Comput. Geotech. 2010, 37, 1008–1014. [Google Scholar] [CrossRef]
- Lin, C.; Han, J.; Bennett, C.; Parsons, R.L. Analysis of laterally loaded piles in sand considering scour hole dimensions. J. Geotech. Geoenviron. Eng. 2014, 140. [Google Scholar] [CrossRef]
- Taiwan Power Company. Development of Monitoring Database and Application Module for Meteorology Mast; Taiwan Power Company: Taipei, Taiwan, 2017. [Google Scholar]
- Wang, Y.K.; Chai, J.F.; Chang, Y.W.; Huang, T.Y.; Kuo, Y.S. Development of seismic demand for Chang-Bin offshore wind farm in Taiwan Strait. Energies 2016, 9, 1036. [Google Scholar] [CrossRef]
- Cohen, L. Time-Frequency Analysis; Prentice Hall: Upper Saddle River, NJ, USA, 1995. [Google Scholar]
- Zaaijer, M.B. Foundation modelling to assess dynamic behaviour of offshore wind turbines. Appl. Ocean Res. 2006, 28, 45–57. [Google Scholar] [CrossRef]
- Jonkman, J.; Musial, W. Offshore Code Comparison Collaboration (OC3) for IEA Wind Task 23 Offshore Wind Technology and Deployment; National Renewable Energy Laboratory: Golden, CO, USA, 2010. [Google Scholar]
- Bush, E.; Manuel, L. The influence of foundation modeling assumptions on long-term load prediction for offshore wind turbines. In Proceedings of the ASME 28th International Conference on Ocean, Offshore and Arctic Engineering, Honolulu, HI, USA, 31 May–5 June 2009. [Google Scholar]
- Lombardi, D.; Bhattacharya, S.; Wood, D.M. Dynamic soil–structure interaction of monopile supported wind turbines in cohesive soil. Soil Dyn. Earthq. Eng. 2013, 49, 165–180. [Google Scholar] [CrossRef]
- Arany, L.; Bhattacharya, S.; Adhikari, S.; Hogan, S.J.; Macdonald, J.H.G. An analytical model to predict the natural frequency of offshore wind turbines on three-spring flexible foundations using two different beam models. Soil Dyn. Earthq. Eng. 2015, 74, 40–45. [Google Scholar]
- Jung, S.; Kim, S.R.; Patil, A.; Hung, L.C. Effect of monopile foundation modeling on the structural response of a 5-MW offshore wind turbine tower. Ocean Eng. 2015, 109, 479–488. [Google Scholar] [CrossRef]
- API RP2A-WSD. Recommended Practice for Planning, Designing and Constructing Fixed Offshore Platforms—Working Stress Design; American Petroleum Institute: Washington, DC, USA, 2007. [Google Scholar]
- Tseng, W.C.; Kuo, Y.S.; Chen, J.W. An investigation into the effect of scour on the loading and deformation responses of monopile foundations. Energies 2017, 10, 1190. [Google Scholar] [CrossRef]
- Reese, L.C.; Cox, W.R.; Koop, F.D. Analysis of laterally loaded piles in sand. In Offshore Technology in Civil Engineering Hall of Fame Papers from the Early Years; American Society of Civil Engineers: Reston, VA, USA, 1974; pp. 95–105. [Google Scholar]
- Qi, W.G.; Gao, F.P.; Randolph, M.F.; Lehane, B.M. Scour effects on p–y curves for shallowly embedded piles in sand. Geotechnique 2016, 66, 648–660. [Google Scholar] [CrossRef]
- Garrad Hassan and Partners Ltd. Bladed User Manual-Version 4.5; Garrad Hassan & Partners Ltd.: Bristol, UK, 2013. [Google Scholar]


| Soil Layer | Depth () | Effective Unit Weight () | Friction Angle (o) |
|---|---|---|---|
| Sand 1 | 0–10.8 | 8.5 | 29.5 |
| Sand 2 | 10.8–26.1 | 9.5 | 32.0 |
| Sand 3 | 26.1–47.2 | 9.6 | 32.3 |
| Sand 4 | 47.2–71.5 | 9.5 | 33.0 |
| Geometry of Met-Mast | Value | |
|---|---|---|
| Tower height above MWL | (m) | 92 |
| Platform height above MWL | (m) | 19 |
| Tower mass | (ton) | 216 |
| Water depth | (m) | 15 |
| Pile diameter | (m) | 3.8 |
| Pile thickness | (m) | 0.05 |
| Embedded pile length | (m) | 36.35 |
| Mode Number | Mode Shape | Measured |
|---|---|---|
| 1 | 1st bending mode (X or Y) | 0.6 |
| 2 | 2nd bending mode (X or Y) | 1.4 |
| 3 | 3rd bending mode (X or Y) | 2.7 |
| 4 | 1st torsional mode | 3.6 |
| 5 | 2nd torsional mode | 4.6 |
| Condition | Type of Simulation for Monopile Foundation | Type of Simulation for Pile-Soil Interaction | |
|---|---|---|---|
| case 1 | coupled springs | Kallehave et al. [14] + Lin et al. [23] | (Figure 10b) |
| case 2 | coupled springs | API [8] + the entire scoured layer is removed | (Figure 10a) |
| case 3 | distributed springs | Kallehave et al. [14] + Lin et al. [23] | (Figure 10b) |
| case 4 | distributed springs | API [8] + the entire scoured layer is removed | (Figure 10a) |
| Classification of p–y Curves Used in This Study | Sd/D | 0 | 0.5 | 1 | 1.5 | |
|---|---|---|---|---|---|---|
| case 1 | () | 6.29 × 10⁵ | 6.86 × 10⁵ | 7.21 × 10⁵ | 8.08 × 10⁵ | |
| () | −4.24 × 10⁶ | −4.54 × 10⁶ | −4.71 × 10⁶ | −5.05 × 10⁶ | ||
| () | −4.24 × 10⁶ | −4.54 × 10⁶ | −4.71 × 10⁶ | −5.05 × 10⁶ | ||
| () | 4.61 × 10⁷ | 4.77 × 10⁷ | 4.84 × 10⁷ | 4.98 × 10⁷ | ||
| case 2 | () | 4.43 × 10⁵ | 4.70 × 10⁵ | 5.00 × 10⁵ | 5.36 × 10⁵ | |
| () | −3.46 × 10⁶ | −3.61 × 10⁶ | −3.76 × 10⁶ | −3.92 × 10⁶ | ||
| () | −3.46 × 10⁶ | −3.61 × 10⁶ | −3.76 × 10⁶ | −3.92 × 10⁶ | ||
| () | 4.20 × 10⁷ | 4.28 × 10⁷ | 4.36 × 10⁷ | 4.43 × 10⁷ | ||
| Mode Shape | Measured (Table 3) | Simulated | |||
|---|---|---|---|---|---|
| Sd = 0D | Sd = 0.5D | Sd = 1D | Sd = 1.5D | ||
| 1st bending mode (X or Y) | 0.6 | 0.575 | 0.568 | 0.561 | 0.555 |
| 0.588 | 0.580 | 0.572 | 0.566 | ||
| 2nd bending mode (X or Y) | 1.4 | 1.035 | 1.005 | 0.975 | 0.950 |
| 1.037 | 1.007 | 0.977 | 0.952 | ||
| 3rd bending mode (X or Y) | 2.7 | 2.196 | 2.140 | 2.088 | 2.049 |
| 2.207 | 2.151 | 2.099 | 2.059 | ||
| 1st torsional mode | 3.6 | 2.911 | 2.902 | 2.892 | 2.883 |
| 2nd torsional mode | 4.6 | 4.531 | 4.531 | 4.530 | 4.530 |
| Mode Shape | Measured (Table 3) | Simulated | |||
|---|---|---|---|---|---|
| Sd = 0D | Sd = 0.5D | Sd = 1D | Sd = 1.5D | ||
| 1st bending mode (X or Y) | 0.6 | 0.566 | 0.559 | 0.552 | 0.545 |
| 0.578 | 0.570 | 0.563 | 0.556 | ||
| 2nd bending mode (X or Y) | 1.4 | 0.996 | 0.967 | 0.939 | 0.914 |
| 0.998 | 0.969 | 0.941 | 0.915 | ||
| 3rd bending mode (X or Y) | 2.7 | 2.126 | 2.077 | 2.034 | 1.996 |
| 2.137 | 2.088 | 2.044 | 2.006 | ||
| 1st torsional mode | 3.6 | 2.910 | 2.901 | 2.891 | 2.882 |
| 2nd torsional mode | 4.6 | 4.531 | 4.531 | 4.530 | 4.529 |
| Mode Shape | Measured (Table 3) | Simulated | |||
|---|---|---|---|---|---|
| Sd = 0D | Sd = 0.5D | Sd = 1D | Sd = 1.5D | ||
| 1st bending mode (X or Y) | 0.6 | 0.623 | 0.617 | 0.611 | 0.604 |
| 0.640 | 0.633 | 0.626 | 0.619 | ||
| 2nd bending mode (X or Y) | 1.4 | 1.234 | 1.210 | 1.184 | 1.157 |
| 1.237 | 1.213 | 1.187 | 1.160 | ||
| 3rd bending mode (X or Y) | 2.7 | 2.755 | 2.670 | 2.580 | 2.493 |
| 2.785 | 2.688 | 2.595 | 2.506 | ||
| 1st torsional mode | 3.6 | 2.947 | 2.922 | 2.905 | 2.892 |
| 2nd torsional mode | 4.6 | 4.531 | 4.531 | 4.531 | 4.531 |
| Mode Shape | Measured (Table 3) | Simulated | |||
|---|---|---|---|---|---|
| Sd = 0D | Sd = 0.5D | Sd = 1D | Sd = 1.5D | ||
| 1st bending mode (X or Y) | 0.6 | 0.623 | 0.617 | 0.611 | 0.604 |
| 0.640 | 0.633 | 0.626 | 0.619 | ||
| 2nd bending mode (X or Y) | 1.4 | 1.234 | 1.210 | 1.184 | 1.157 |
| 1.237 | 1.212 | 1.187 | 1.159 | ||
| 3rd bending mode (X or Y) | 2.7 | 2.754 | 2.668 | 2.579 | 2.492 |
| 2.783 | 2.686 | 2.593 | 2.505 | ||
| 1st torsional mode | 3.6 | 2.946 | 2.922 | 2.905 | 2.892 |
| 2nd torsional mode | 4.6 | 4.531 | 4.531 | 4.531 | 4.531 |
| Mode Number | Mode Shape | Case 3 | Case 4 | ||||||
|---|---|---|---|---|---|---|---|---|---|
| Sd = 0D | Sd = 0.5D | Sd = 1D | Sd = 1.5D | Sd = 0D | Sd = 0.5D | Sd = 1D | Sd = 1.5D | ||
| 4 | fore-aft 1st bending mode | 1.234 | 1.21 | 1.184 | 1.157 | 1.234 | 1.21 | 1.184 | 1.157 |
| 5 | side-side 1st bending mode | 1.237 | 1.213 | 1.187 | 1.16 | 1.237 | 1.212 | 1.187 | 1.159 |
| 7 | fore-aft 2nd bending mode | 2.755 | 2.67 | 2.58 | 2.493 | 2.754 | 2.668 | 2.579 | 2.492 |
| 8 | side-side 2nd bending mode | 2.785 | 2.688 | 2.595 | 2.506 | 2.783 | 2.686 | 2.593 | 2.505 |
| 22 | 1st vertical mode | 12.368 | 11.87 | 11.329 | 10.872 | 12.272 | 11.77 | 11.24 | 10.803 |
| 24 | fore-aft 3rd bending mode | 12.926 | 12.215 | 11.53 | 11.006 | 12.754 | 12.074 | 11.431 | 10.923 |
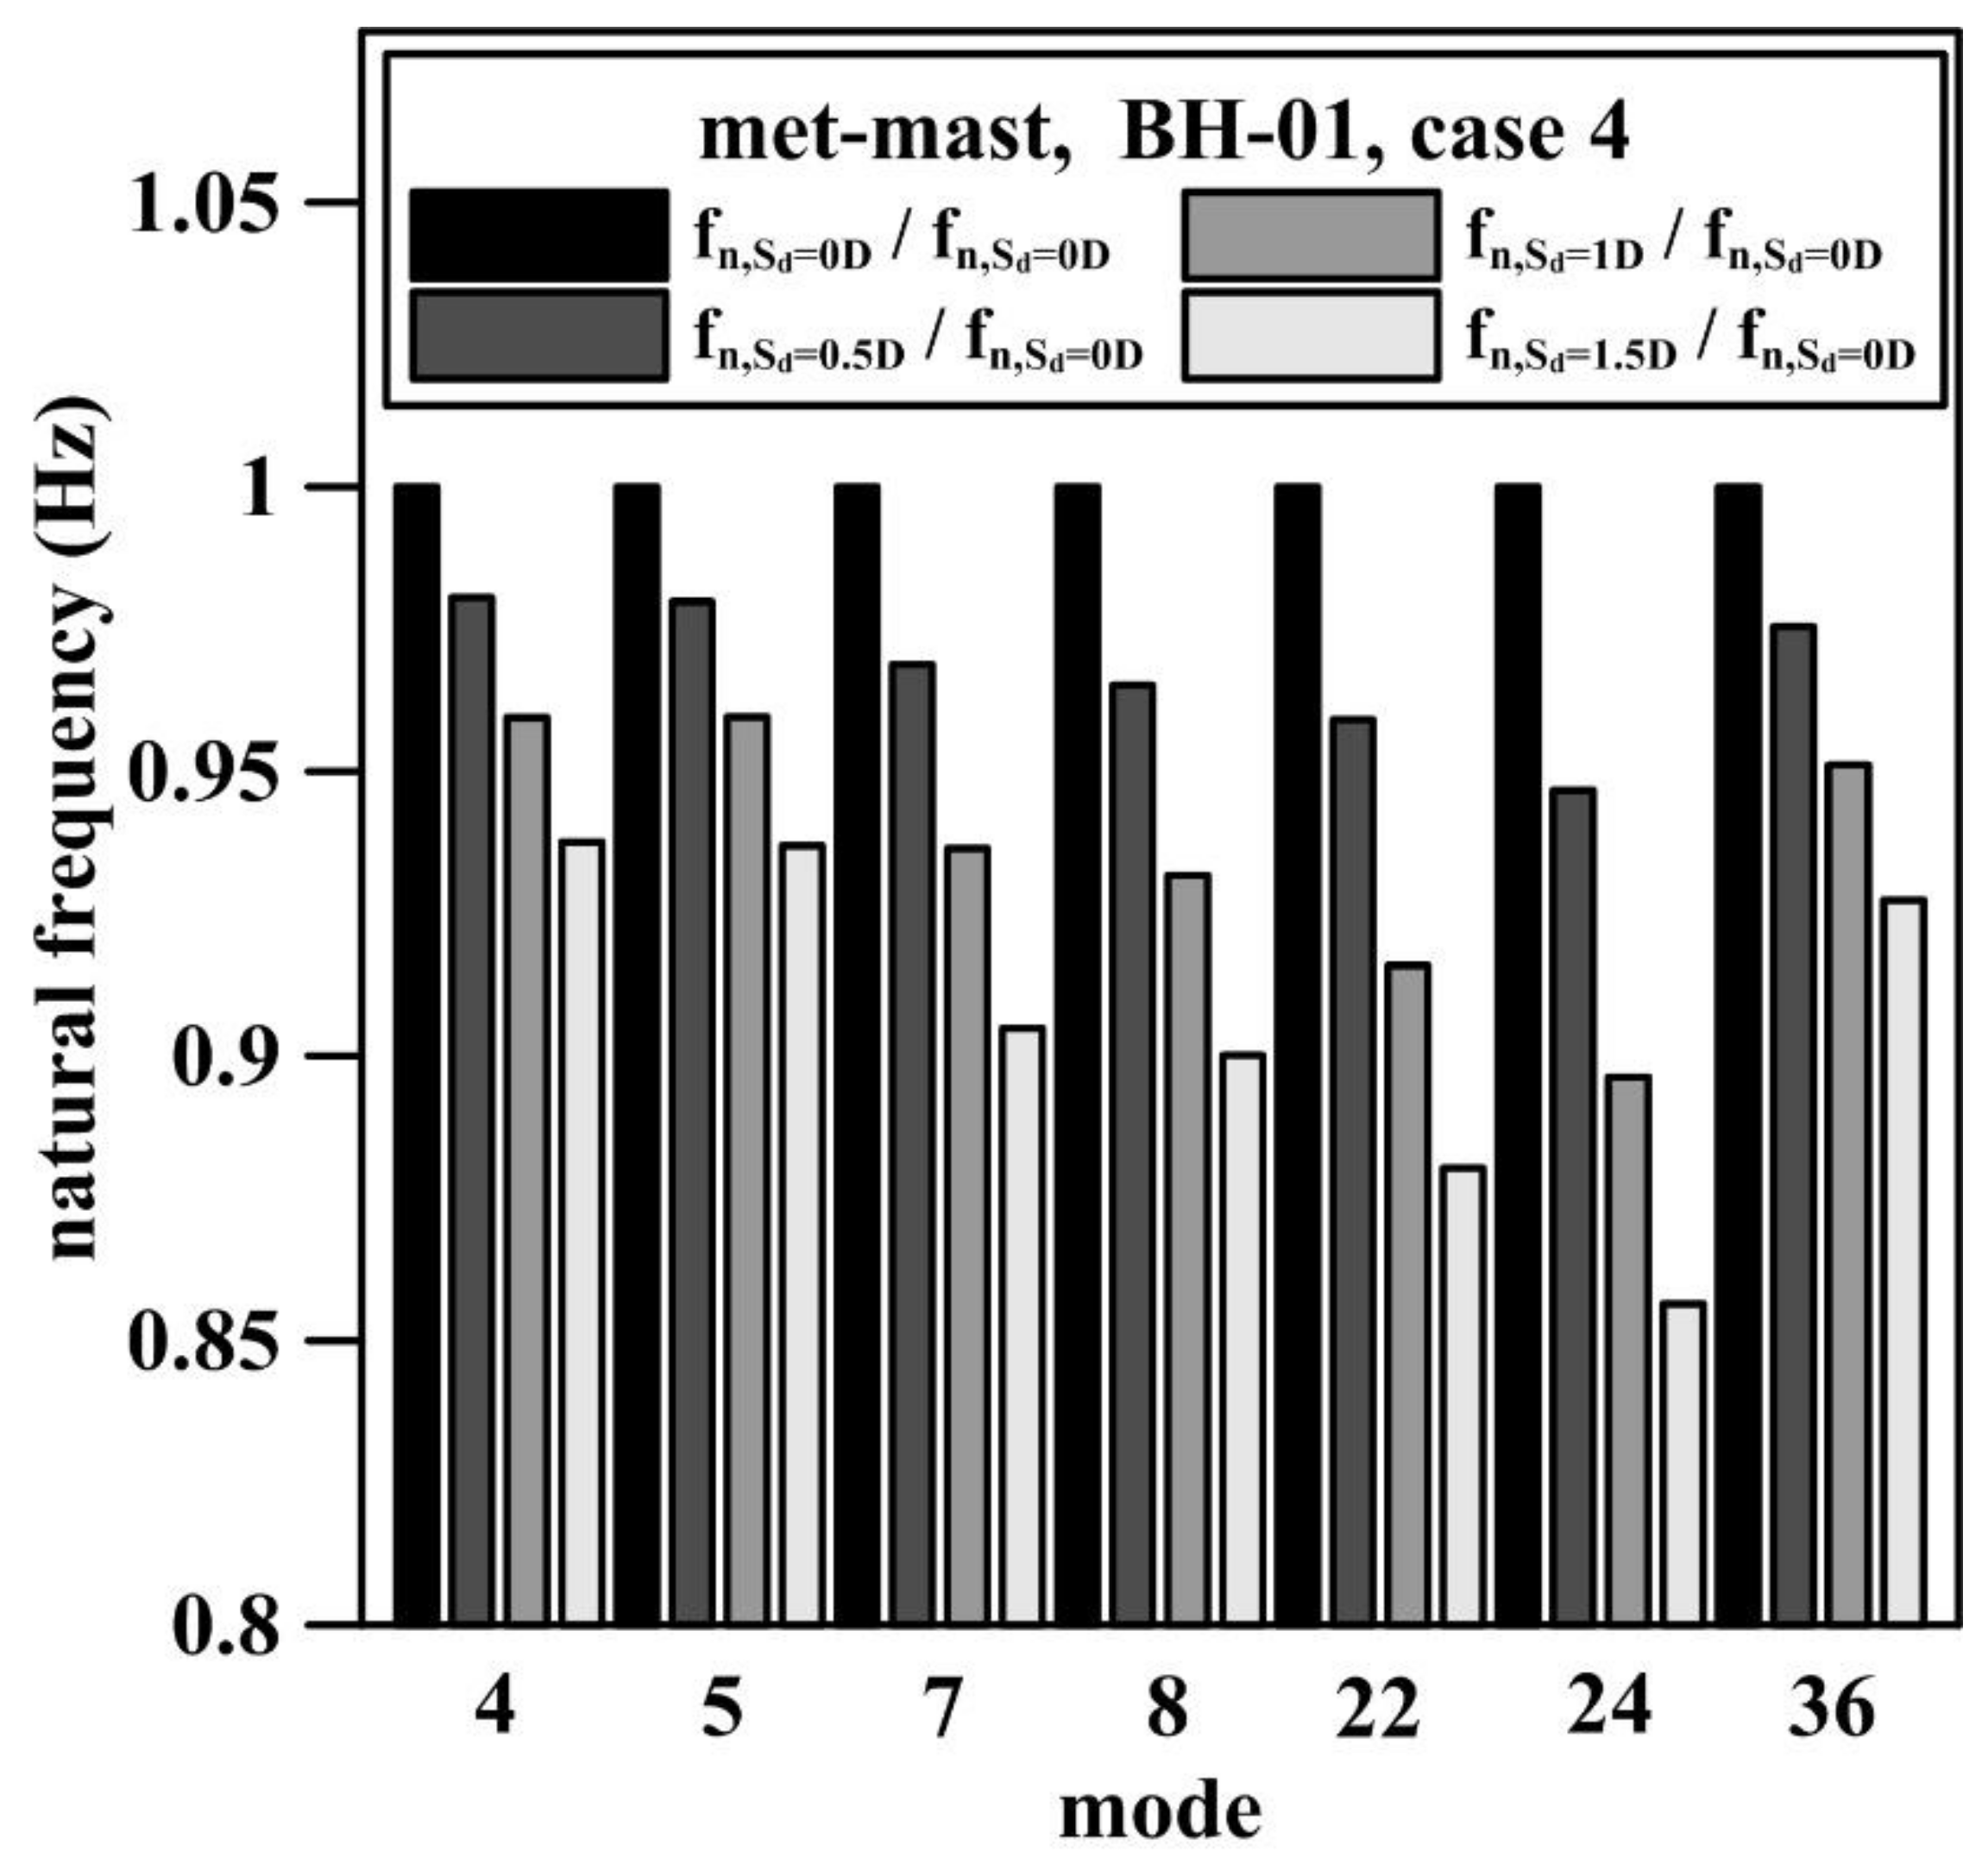
| 36 | 2nd vertical mode | 21.803 | 21.266 | 20.739 | 20.221 | 21.804 | 21.268 | 20.739 | 20.221 |
© 2018 by the authors. Licensee MDPI, Basel, Switzerland. This article is an open access article distributed under the terms and conditions of the Creative Commons Attribution (CC BY) license (http://creativecommons.org/licenses/by/4.0/).
Share and Cite
Tseng, W.-C.; Kuo, Y.-S.; Lu, K.-C.; Chen, J.-W.; Chung, C.-F.; Chen, R.-C. Effect of Scour on the Natural Frequency Responses of the Meteorological Mast in the Taiwan Strait. Energies 2018, 11, 823. https://doi.org/10.3390/en11040823
Tseng W-C, Kuo Y-S, Lu K-C, Chen J-W, Chung C-F, Chen R-C. Effect of Scour on the Natural Frequency Responses of the Meteorological Mast in the Taiwan Strait. Energies. 2018; 11(4):823. https://doi.org/10.3390/en11040823
Chicago/Turabian StyleTseng, Wei-Chen, Yu-Shu Kuo, Kung-Chun Lu, Jing-Wen Chen, Chiou-Fong Chung, and Ruey-Chyi Chen. 2018. "Effect of Scour on the Natural Frequency Responses of the Meteorological Mast in the Taiwan Strait" Energies 11, no. 4: 823. https://doi.org/10.3390/en11040823
APA StyleTseng, W.-C., Kuo, Y.-S., Lu, K.-C., Chen, J.-W., Chung, C.-F., & Chen, R.-C. (2018). Effect of Scour on the Natural Frequency Responses of the Meteorological Mast in the Taiwan Strait. Energies, 11(4), 823. https://doi.org/10.3390/en11040823