Article

Hydrodynamic Performance of an Array of Wave Energy Converters Integrated with a Pontoon-Type Breakwater

1
State Key Laboratory of Coastal and Offshore Engineering, Dalian University of Technology, Dalian 116024, China
2
Centre for Offshore Foundation Systems, The University of Western Australia, 35 Stirling Highway, Perth, WA 6009, Australia
3
School of Computing, Engineering and Mathematics, University of Western Sydney, Penrith, NSW 2751, Australia
*
Author to whom correspondence should be addressed.
Energies 2018, 11(3), 685; https://doi.org/10.3390/en11030685
Submission received: 10 February 2018 / Revised: 13 March 2018 / Accepted: 15 March 2018 / Published: 18 March 2018
(This article belongs to the Special Issue Wave Energy Potential, Behavior and Extraction)

Abstract

:
The cost of wave energy converters (WECs) can be reduced significantly by integrating WECs into other marine facilities, especially in sea areas with a mild wave climate. To reduce the cost and increase the efficiency, a hybrid WEC system, comprising a linear array (medium farm) of oscillating buoy-type WECs attached to the weather side of a fixed-type floating pontoon as the base structure is proposed. The performance of the WEC array is investigated numerically using a boundary element method (BEM) based on the linear potential flow theory. The linear power take-off (PTO) damping model is used to calculate the output power of the WEC array. The performance of the WEC array and each individual WEC device is balanced by using the mean interaction factor and the individual interaction factor. To quantify the effect of the pontoon, the hydrodynamic results of the WEC arrays with and without a pontoon are compared with each other. Detailed investigations on the influence of the structural and PTO parameters are performed in a wide wave frequency range. Results show that the energy conversion efficiency of a WEC array with a properly designed pontoon is much higher than that without a pontoon. This integration scheme can achieve the efficiency improvement and construction-cost reduction of the wave energy converters.

1. Introduction

Although many concepts of wave energy converters (WECs) have been developed, few of them have been realized, mainly because the high construction cost prevents them from being implemented [1,2]. For wave energy converters, reducing the construction-cost and improving the energy conversion efficiency are of great significance.
The construction-cost reduction can be achieved by combining WECs with other marine facilities, such as breakwaters, offshore platforms, ships, etc. [3,4,5,6]. Recently, many studies have been aimed at investigating the performance of hybrid systems, such as WEC-wind turbine [3,7] and WEC-breakwater hybrid systems [6,8,9,10]. Hybrid structures are very important for promoting wave energy harvesting because they reduce the cost.
The energy conversion efficiency of WECs can be improved through various methods, such as replacing large-size buoys with many small buoys [11], latching control [12,13], using multi-stable mechanisms [14], nonlinear model predictive control methodology [15], etc. Modifications of the shape of the WEC devices or power take-off (PTO) control systems are required in the aforementioned methods. To achieve the construction cost reduction and the improvement of the energy conversion performance of WECs simultaneously, it is of practical importance to design a hybrid-structure that can improve the energy conversion performance of the WECs significantly without modifying the original WEC devices.
Utilizing the energy from both the incident waves and the reflected waves from offshore structures has a great potential to improve the performance of WECs. The superposition of the incident waves and the reflected waves at the weather side of a pontoon-type breakwater can be beneficial to the improvement of the performance of the WECs located in this region. Viviano et al. [16] experimentally investigated the reflection coefficient of a land-based oscillating water column (OWC) WEC and their results showed that an OWC structure integrated into the vertical wall of a breakwater can also serve as a wave absorber for reducing wave reflection. Howe and Nader [17] demonstrated that the efficiency of a breakwater-integrated OWC device is significantly higher than that of an isolated OWC type WEC. McIver and Evans [18], Mavrakos et al. [19], and Schay et al. [20] found that the power obtained by point absorbers in front of a reflecting seawall is much more than that obtained by the same point absorbers without a seawall. Through analytical analysis, Zhao et al. [21] proved that the capture width ratio of a two-dimensional oscillating buoy-type WEC device in front of a fixed pontoon could be increased significantly compared to that of the same WEC without a pontoon. In the above-mentioned studies, the efficiency of WEC devices was improved because of the superposition of the incident and reflected waves from a seawall or a pontoon. In addition, attaching a WEC array to the weather side of a breakwater can provide power to the offshore operation conveniently. Meanwhile, the breakwater can provide the supporting structure for the WEC array. For the convenience of discussion, a hybrid system of a WEC array attached to a pontoon is named as a WEC-pontoon system in this paper.
The need to reduce costs drives the design of WEC-pontoon systems in the form of an array, so that the components of the WECs can be shared [22,23,24]. To the best knowledge of the authors, the performance of an array of WECs attached to a pontoon-type structure has not been studied systematically. Thorough investigation of the performance of a WEC array installed at the weather side of a pontoon-type structure will further advance the technology of WECs. Although the hydrodynamics of an array of WECs has been investigated widely [25], little research has been conducted to study a breakwater-WEC system comprising an array of WECs (at the medium level at least). In this paper, a breakwater-WEC system with an array of heaving-mode WECs that are installed at the weather side of a pontoon structure is proposed, and its hydrodynamic performance is investigated. The heaving-mode WECs are selected in the proposed system [26].
The commonly used methods for evaluating hydrodynamic performance of WECs include frequency-domain models, time-domain models, and spectral-domain models. Detailed reviews of these methods can be found in Refs. [25,27,28]. Frequency domain methods based on the linear potential flow theory are often adopted because of their high computational efficiency. Frequency domain methods include boundary element methods (BEM) [29,30,31,32] and matching eigen-function methods [33,34,35,36,37,38]. Compared with the BEM, the matching eigen-function method is more efficient, but not suitable for problems with complex geometries. Thus, as a preliminary study, the performance of a heaving-mode WEC array installed at the weather side of a pontoon is investigated using a higher order boundary element method (HOBEM) code package WAFDUT. The linear PTO damping model is used to calculate the output power.
The rest of the paper is structured as follows: In Section 2, the integrated system and the selected numerical method is introduced. In Section 3, the validation of the proposed numerical method, results for the parametric study, and some discussions are presented. Finally, conclusions are drawn in Section 4.

2. Hybrid System and Numerical Method
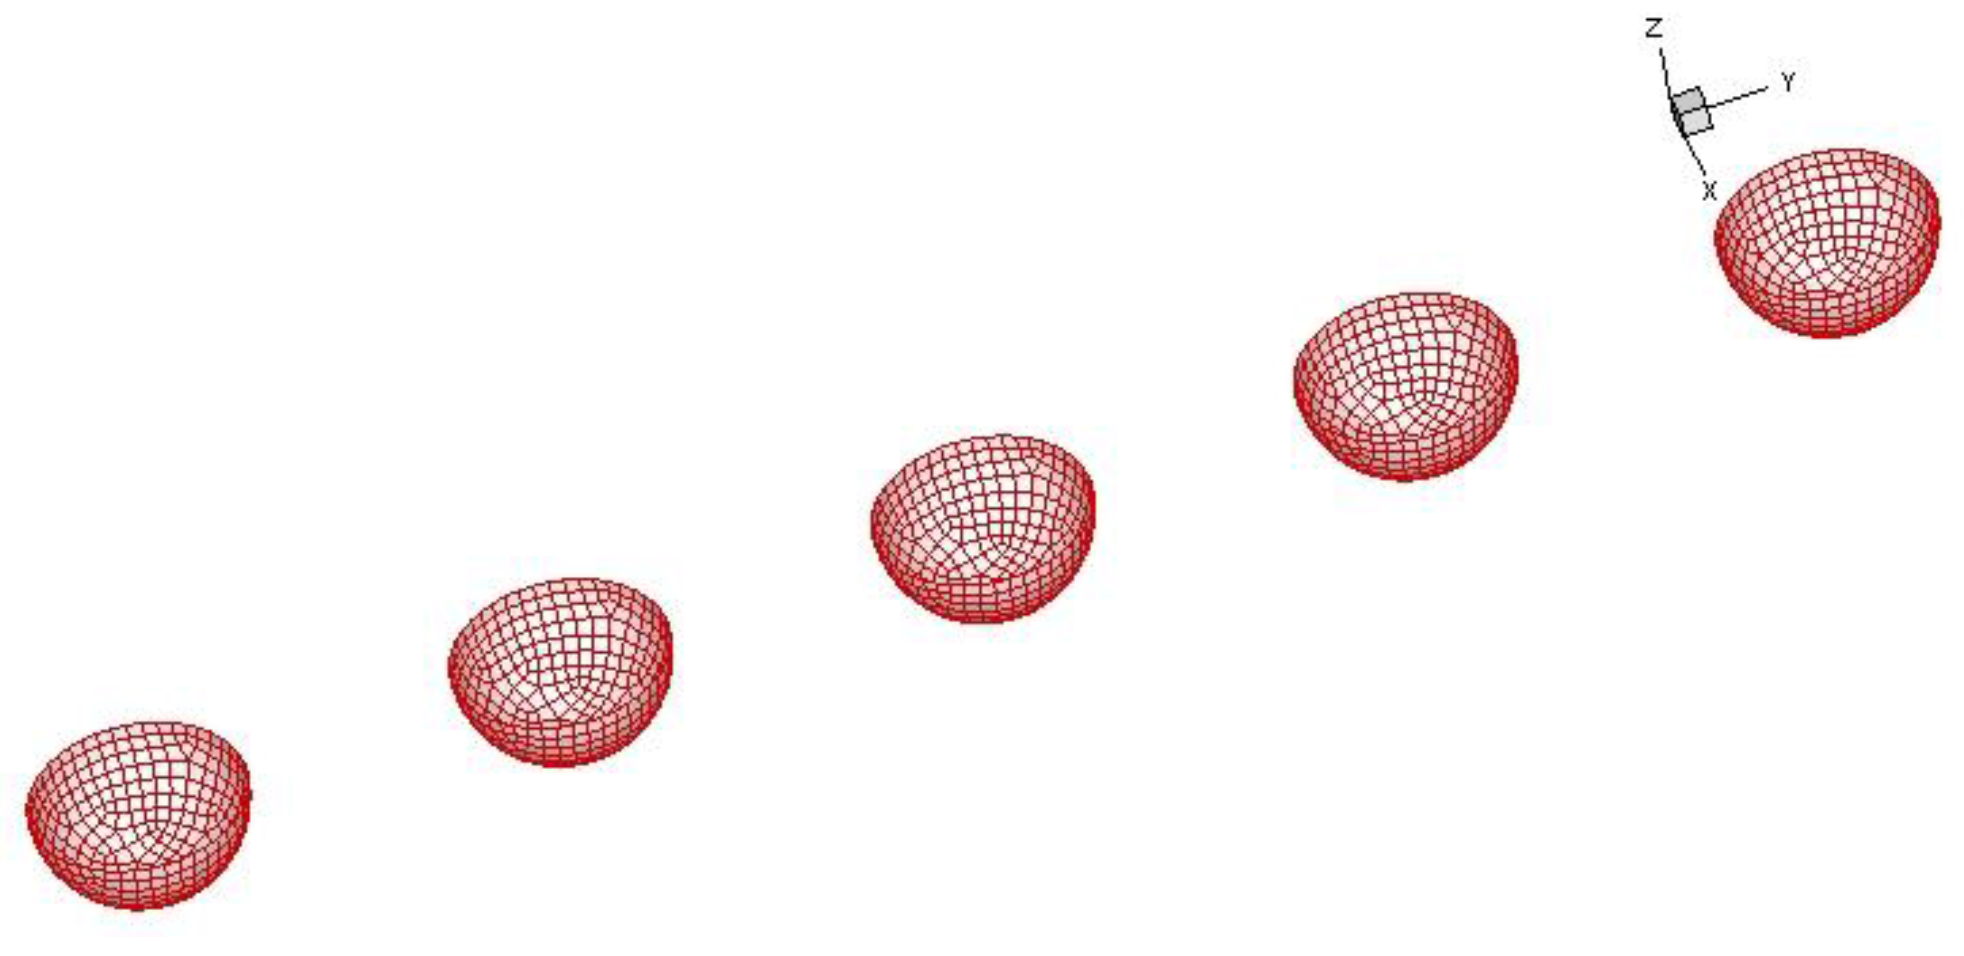
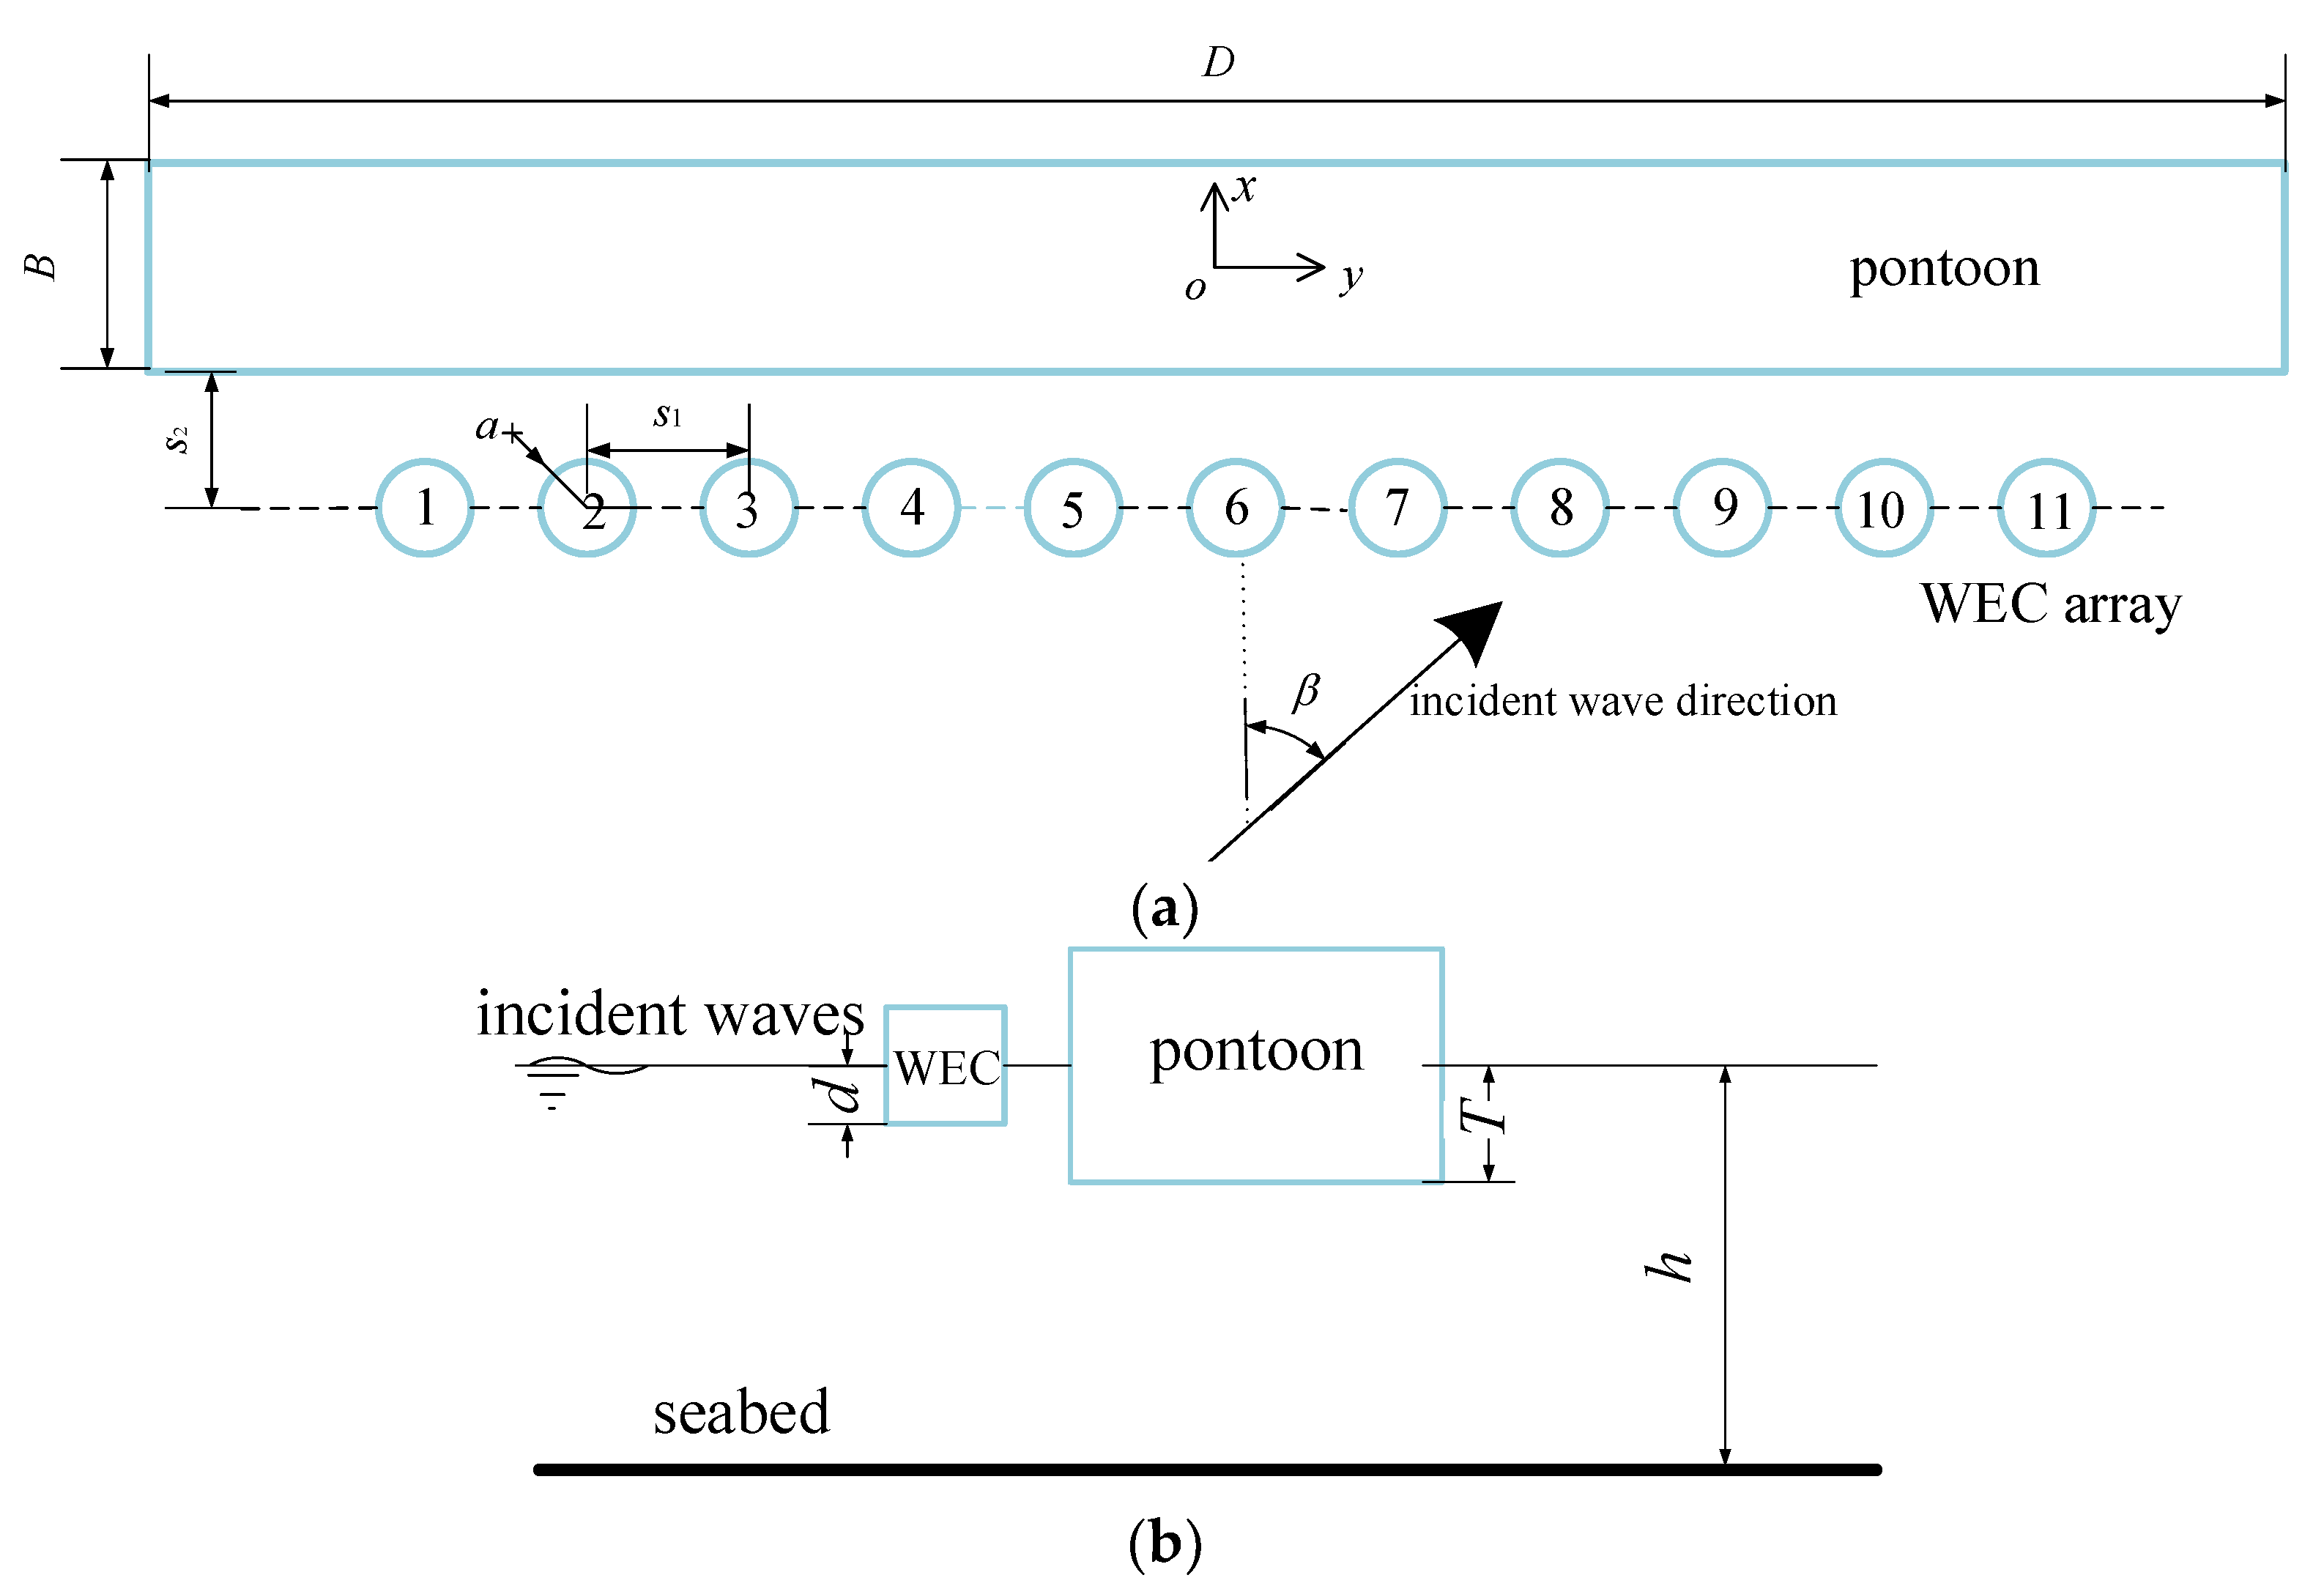
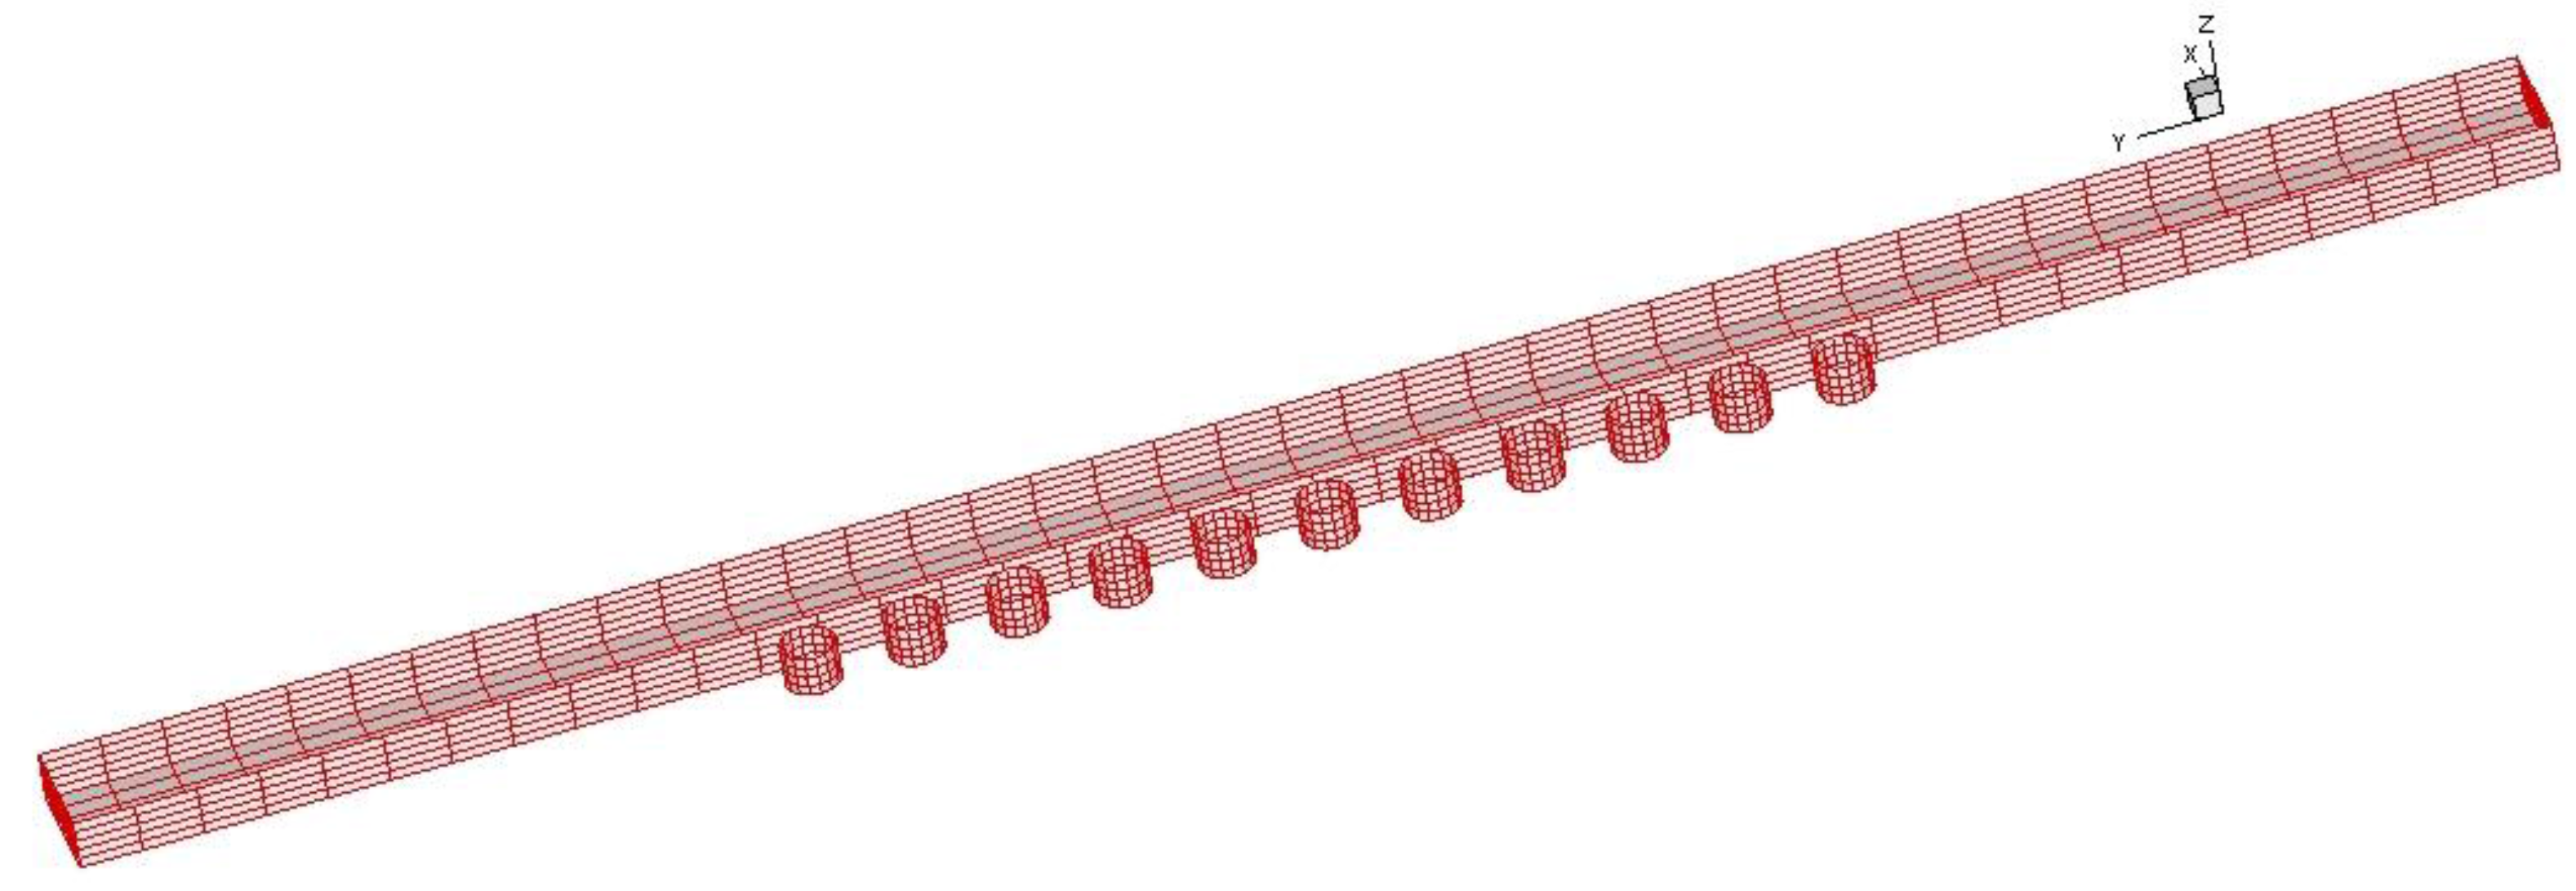
2.1. Hybird System

Figure 1 shows a sketch of a WEC-pontoon system, which comprises a collinear array of circular cylindrical heaving-mode WECs with PTO systems and a fixed pontoon. The similar collinear WEC array without a pontoon has been investigated by Bellew et al. [39]. The kinetic energy of the heave motion of each WEC is converted into energy by a PTO system. The fixed pontoon is pile-supported. The PTO system is fixed between the WECs and the pontoon. All the WEC devices in the array are identical and equally spaced. The radius and draft of each WEC device are defined as a and d, respectively, and the distance between two adjacent WEC devices (WEC-WEC spacing) is s1. The distance of the collinear array and weather side of the pontoon (WEC-pontoon spacing) is s2. The rear pontoon is defined by the length D, the breadth B, and the draft T. A medium-size WEC array generally has 10–30 WEC devices [40]. A WEC array with 11 heaving-type oscillating buoy devices is considered in this study.

2.2. Numerical Method

To investigate the hydrodynamic performance of the pontoon-WEC system, the HOBEM code package WAFDUT is used to solve the diffraction and radiation problems of the multi-body system. The program WAFDUT was developed based on the linear potential flow theory and the HOBEM is used to implement the integral equation to solve the hydrodynamic problems [41]. This HOBEM model computes six-degrees-of-freedom wave-induced motions of multiple bodies with arbitrary shapes in frequency domain. More applications of the program WAFDUT can be found in [42,43].
The rear pontoon is stationary and the buoys of the WECs only move vertically. The equation of motion of the WEC devices in the frequency domain can be written as:
{ ω 2 ( [ M 1 M N ] + [ μ 1 1 μ 1 N μ N 1 μ N N ] ) i ω ( [ λ 1 1 λ 1 N λ N 1 λ N N ] + [ λ PTO , 1 λ PTO , N ] ) + [ K 1 K N ] } ( A R , 1 A R , N ) = ( F z , 1 F z , N )
where ω is the wave angular frequency, i the imaginary unit, Mn and Kn are the mass and stiffness of the nth body, respectively, and μ i j and λ i j are the added mass and damping coefficient of the ith device in the heave mode due to the heave motion of the jth device, respectively. The diagonal element λPTO,n in the PTO damping matrix λPTO is the PTO damping acting on the nth device. AR,n and Fz,n are the heave response amplitude and wave exciting force in heave mode of the nth device (n = 1~N), respectively. N is the total number of the WECs in the array.
The power Pn(ω) produced by the nth device at frequency of ω is calculated by:
P n ( ω ) = 1 2 ω 2 λ PTO , n | A R , n | 2
Then the total power absorbed by the WEC array at the frequency of ω is:
P total ( ω ) = n = 1 N P n ( ω )
To quantify the influence of the hydrodynamic interactions on the efficiency of the WEC array, mean interaction factor qmean is introduced:
q mean ( ω ) = P total ( ω ) N × P isolated ( ω )
where Pisolated(ω) denotes the maximum absorbed power of an isolated WEC device at the frequency of ω, which can be obtained by using the optimal PTO damping [38]. qmean reflects the hydrodynamic interactions on the performance of an array: a value qmean > 1 reflects that there is positive interaction in an array, whereas qmean < 1 shows a destructive interaction.
Especially, the individual interaction factor qind,n is used to investigate the performance of the individual buoy (nth device) in the array, which is defined as [41]:
q ind , n ( ω ) = P n ( ω ) P isolated ( ω )
where Pn denotes the absorbed power by the nth device in the array.
The dimensionless total extracted power of the WEC array (Ptotal,d) and the dimensionless extracted power of the isolated WEC (Pisolated,d) are defined as Ptotal/Pin and Pisolated/Pin, respectively. Pin indicates the incident wave energy with a width of 2a.
The mean interaction factor and the individual interaction factor can be used to balance the performance of the WEC array and each individual device.

3. Results and Discussion
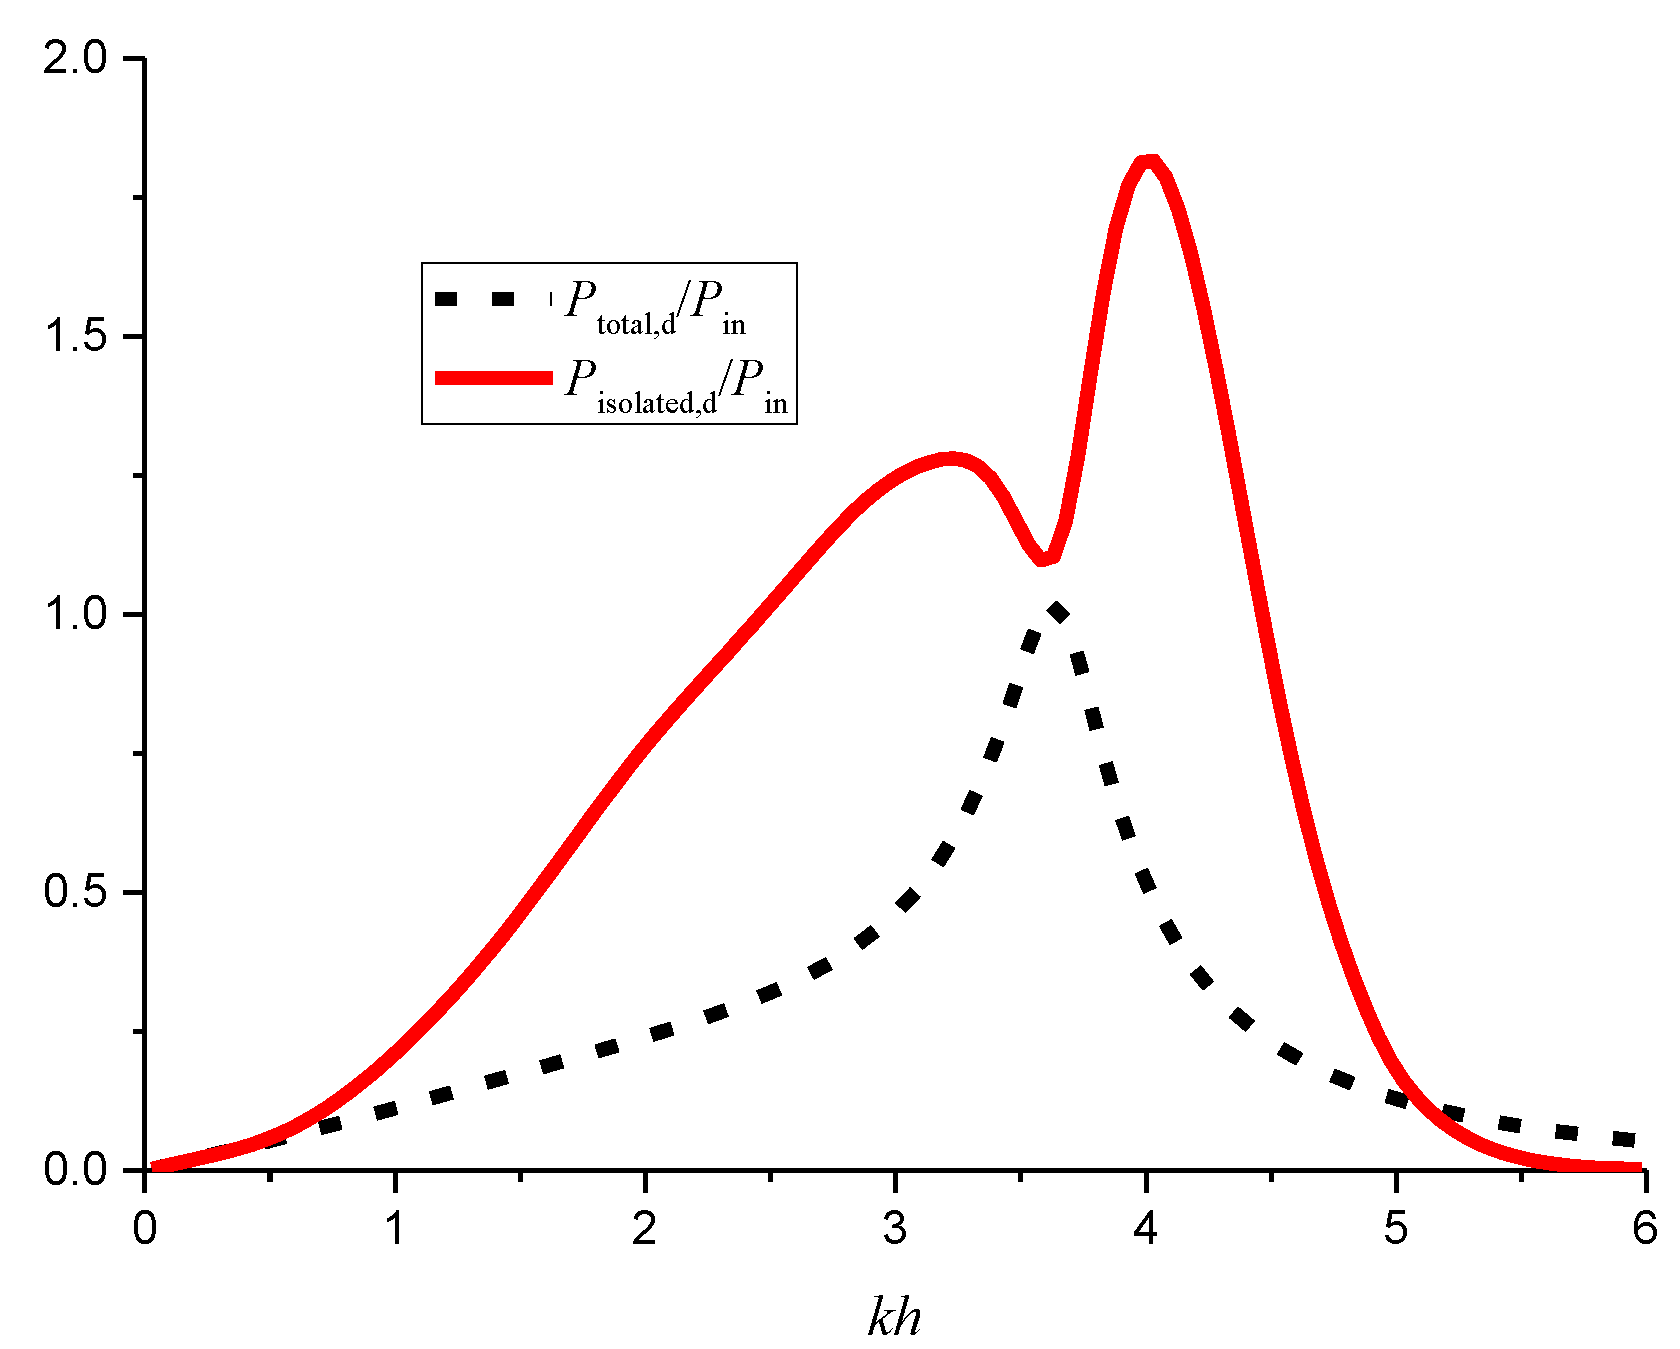
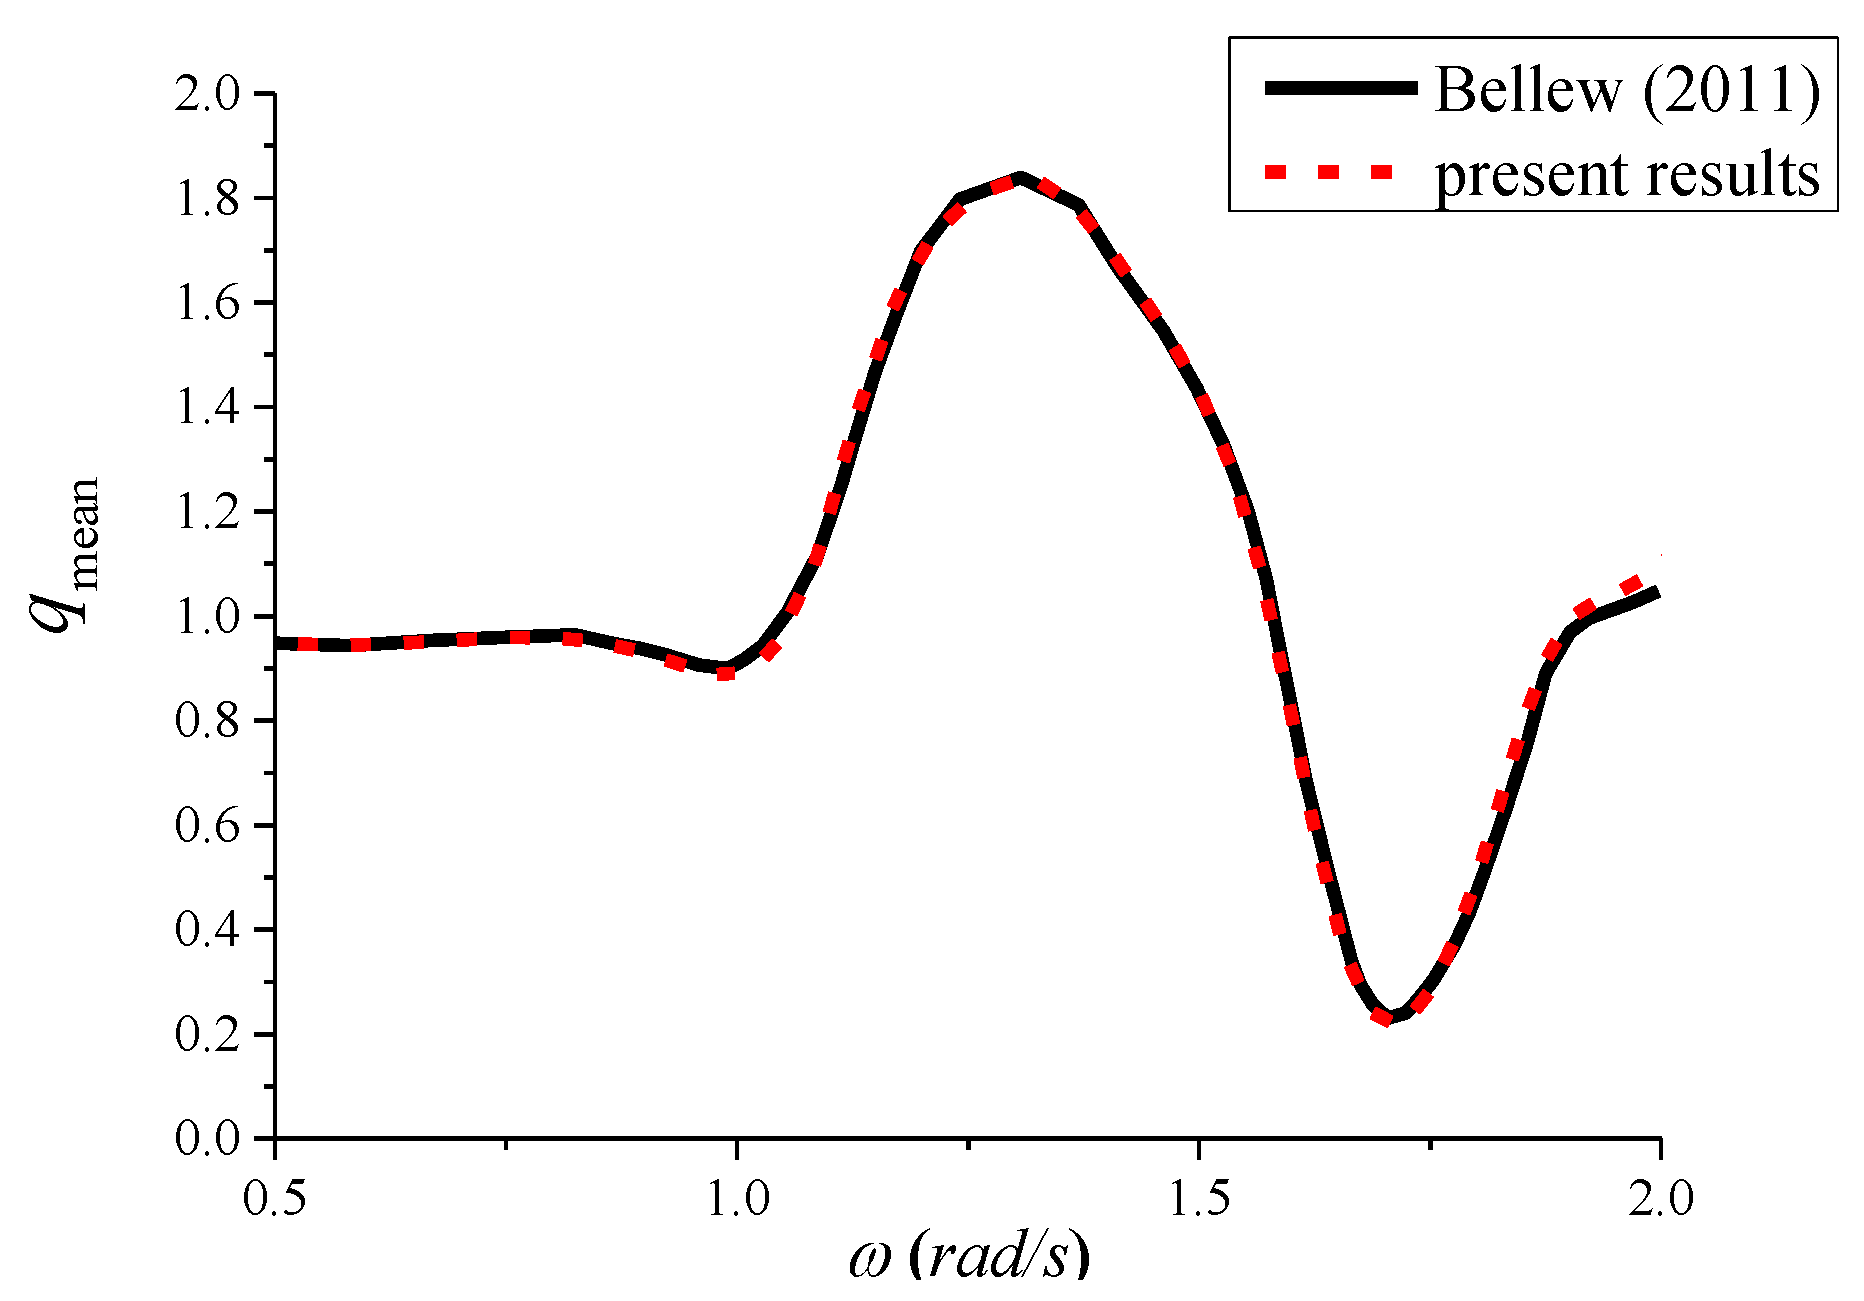
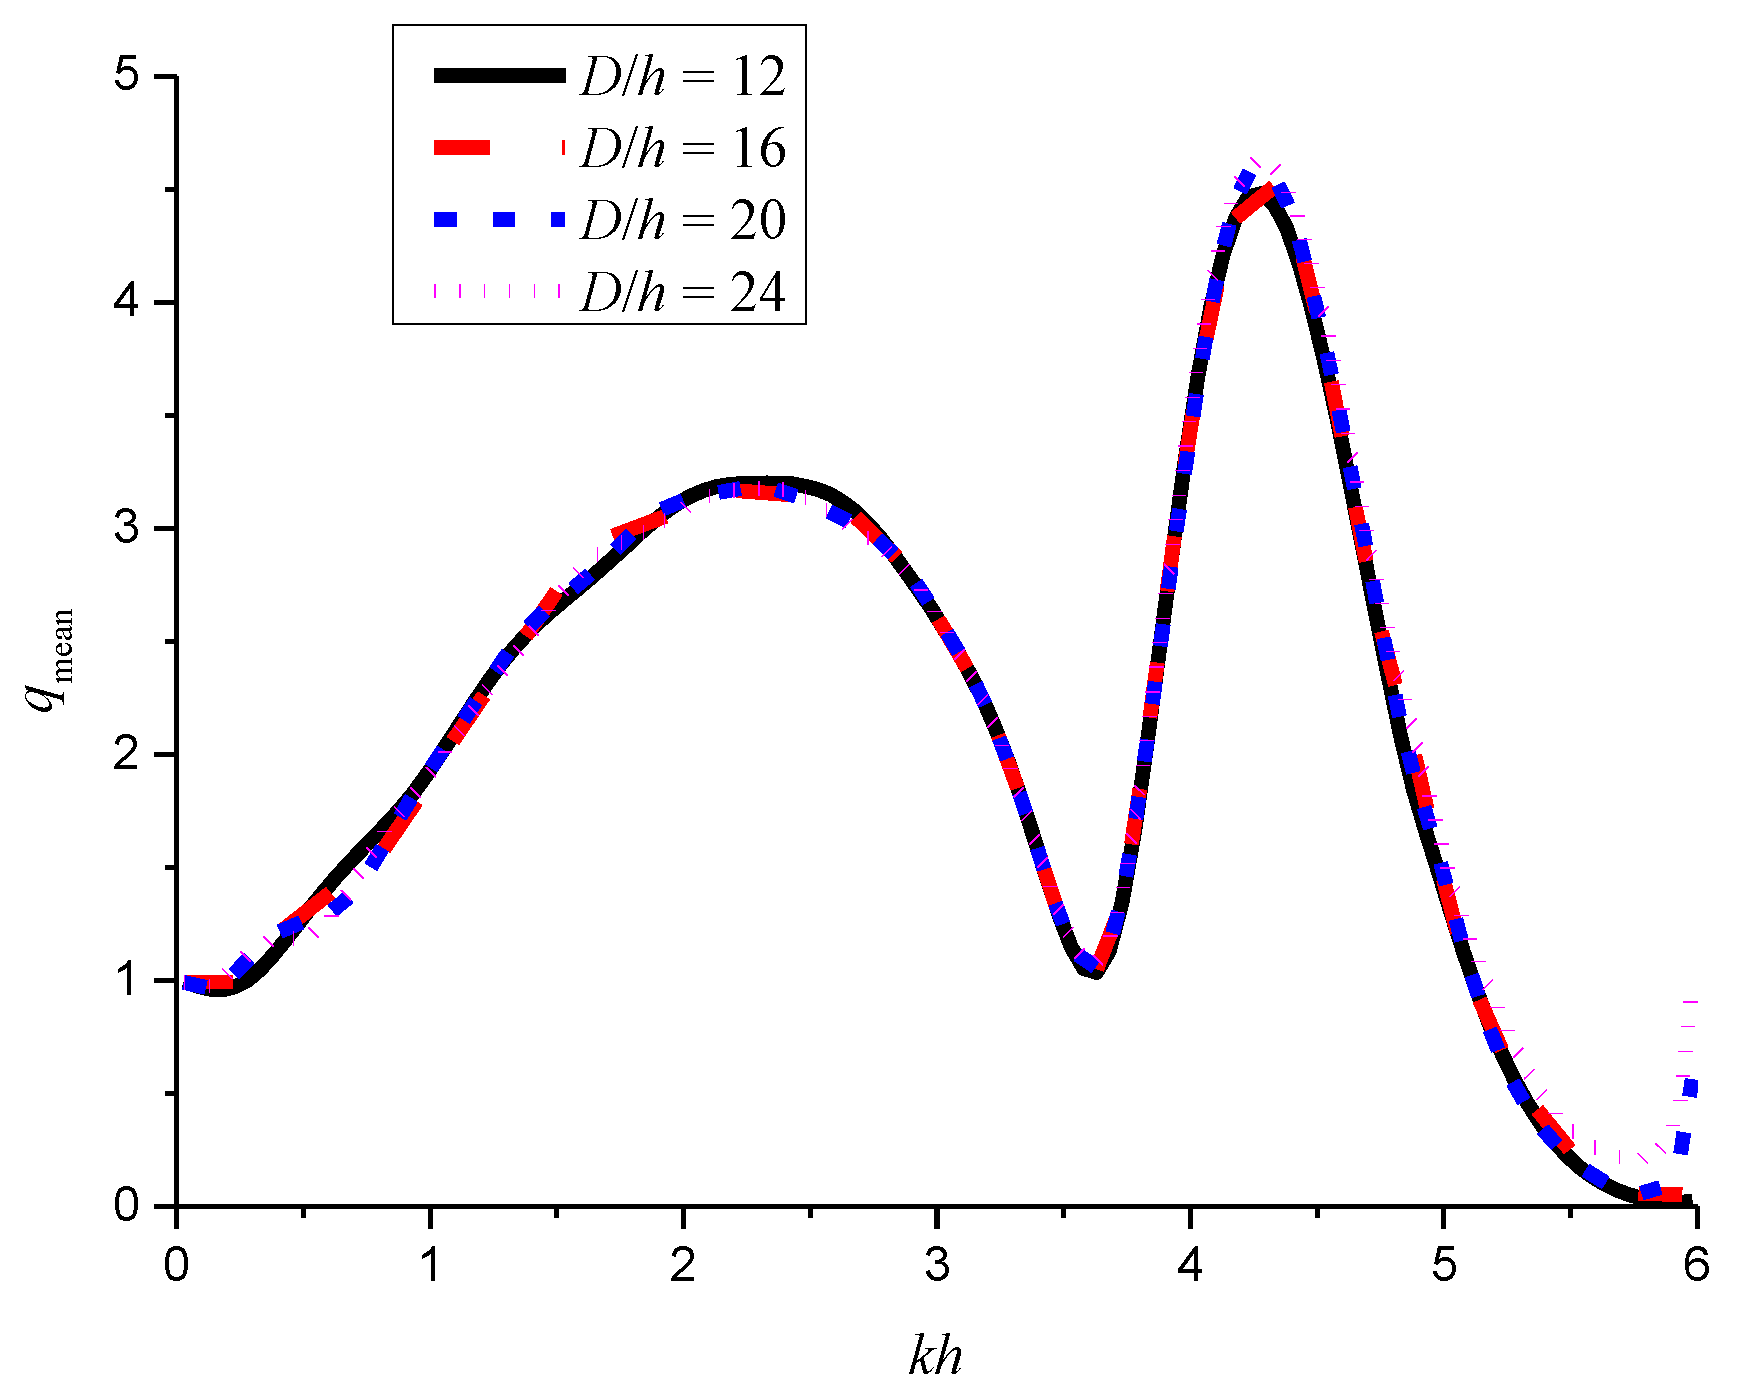
3.1. Validations

The accuracy of the HOBEM model in predicting the hydrodynamic performance of the WEC array presented in Section 2.2 is validated by comparing the present results with the published benchmark results of the mean interaction factor qmean for a 5 × 1 WEC array [39]. The WEC array consists of five hemispheres with a same radius a that only oscillate in the heave direction. The WEC-WEC spacing of 4a and a water depth of 7a were considered. The WEC array was under the action of beam seas. The hydrodynamic coefficients and wave forces were calculated by using the commercial software WAMIT in [44]. The mass of each device was twice of the displaced mass of the device. In the HOBEM simulations using WAFDUT, 150 elements are used for each hemisphere during the calculations (see Figure 2). The calculated mean interaction factor qmean are compared with the numerical results in Bellow [39] in Figure 3 and a good agreement is achieved. This provides confidence in the HOBEM model for investigating the hydrodynamics of the proposed complex WEC-pontoon system, a new concept of WECs.

3.2. Parametric Study

The shape of the considered WEC devices is circular cylinder. Three parameters remain unchanged: the water depth of h = 10 m, the draft d/h = 0.2, and the radius a/h = 0.135. The effects of the following parameters on the performance of the WEC array are investigated: the WEC-pontoon spacing s2, WEC-WEC distance s1, the wave incident angle β, the dimensions of the rear pontoon (draft T, length D, and breadth B) and PTO damping λPTO,n. Eighty-four elements for each front buoy and 700 elements for the pontoon are used throughout the calculations after the spatial convergence tests (see Figure 4). For comparisons, results of the corresponding conventional isolated WEC array without the pontoon are also included. Note that, for the China coastal areas, the frequency range of 1 < kh < 4.5 is of interest. The frequency range for the calculations is selected as 0 < kh < 6 in the present study.

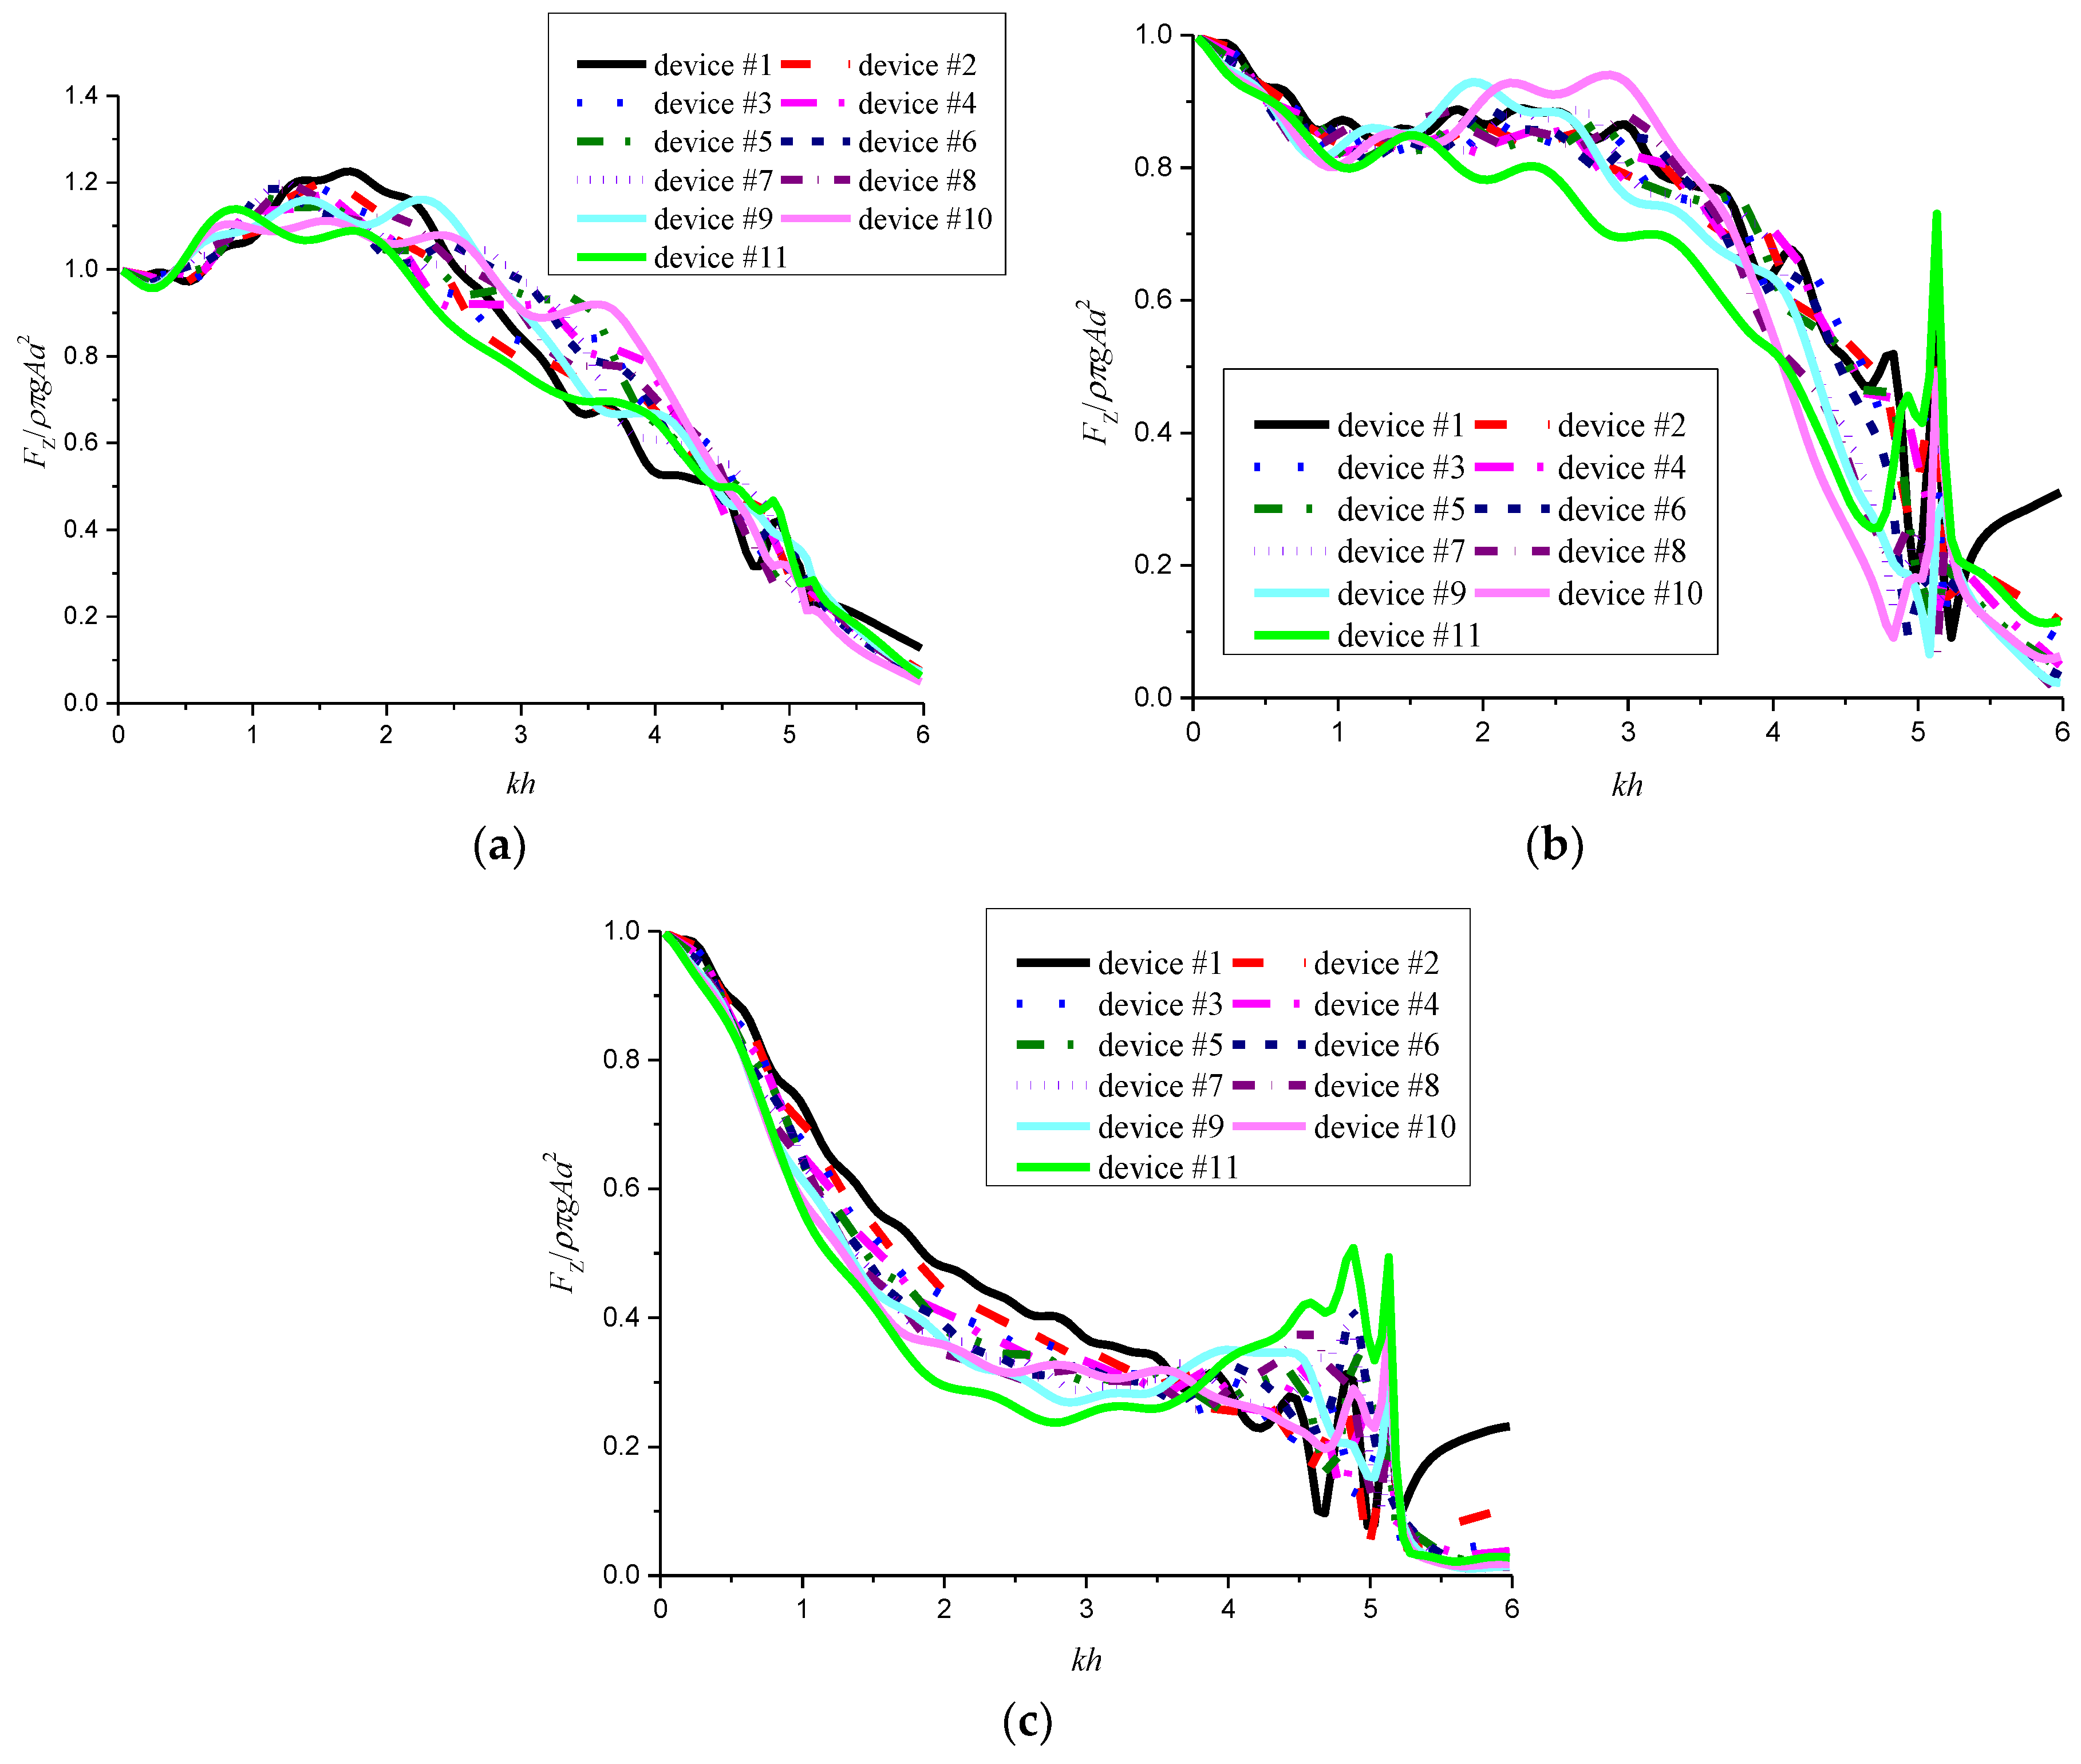
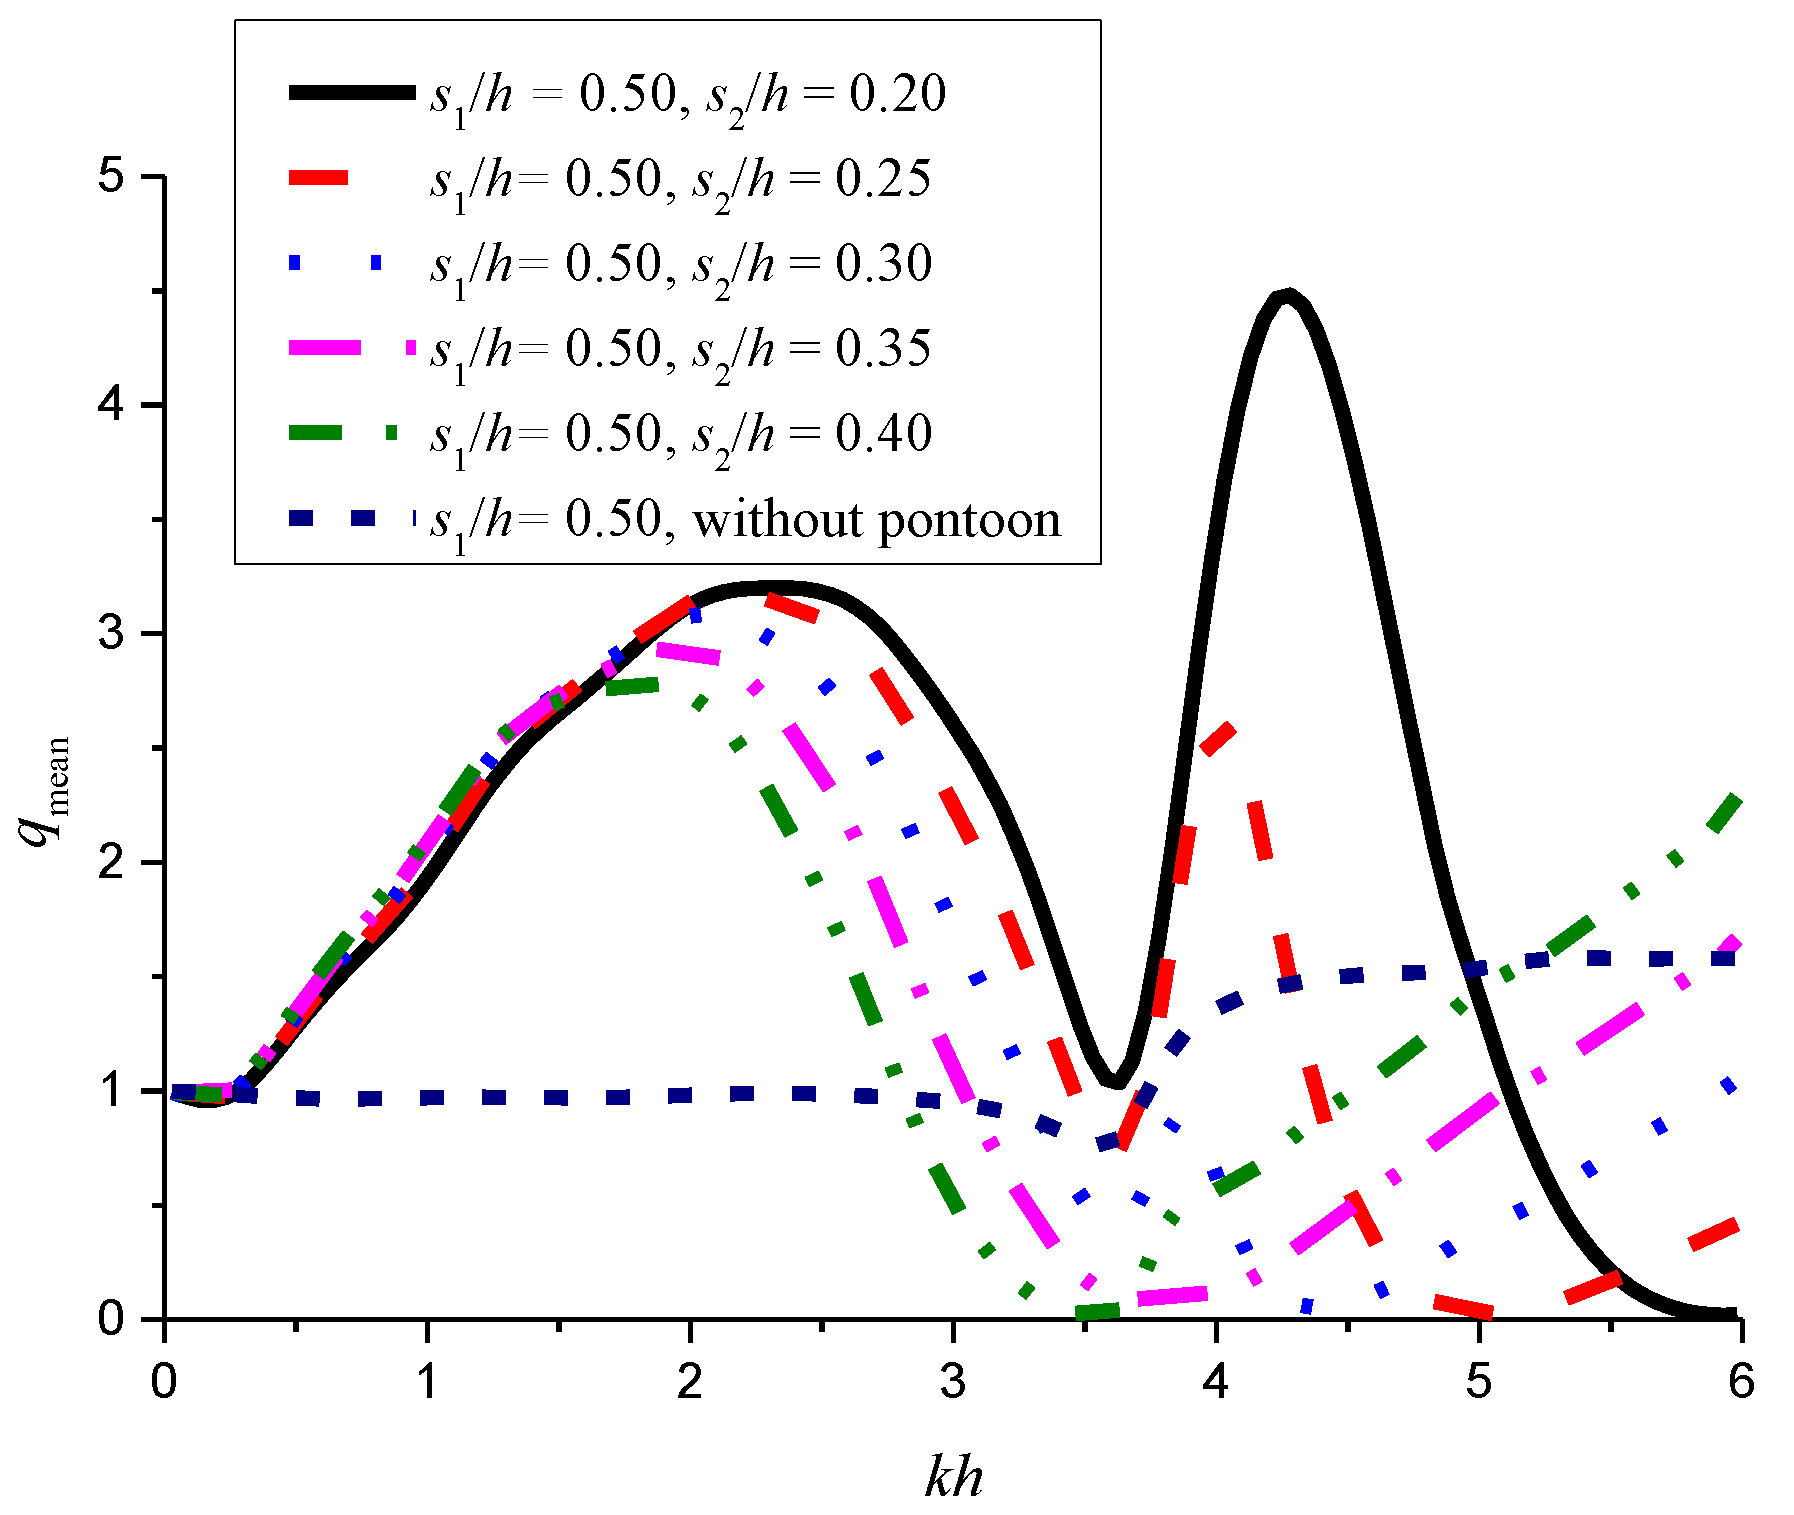
3.2.1. Effect of the WEC-Pontoon Spacing s2

Five WEC-pontoon spacings are considered in this subsection. The parameters of draft T/h, the length D/h, and the breadth B/h of the pontoon, WEC-WEC spacing s1/h, and WEC-pontoon spacing s2/h are summarized in Table 1. The parameters of the pontoon used here will also be used in Section 3.2.2 and Section 3.2.3, and Section 3.2.5. In Section 3.2.1, Section 3.2.2, Section 3.2.3 and Section 3.2.4, the diagonal element (λPTO,n) of PTO damping matrix is chosen as the optimal PTO damping corresponding to the nth device in isolation, which can be calculated as:
λ PTO , n =   ( K n / ω ω ( M n + μ n ) ) 2 + λ n 2
where μ n and λ n represent the added mass and damping coefficient of the nth buoy in the isolated case, respectively [45]. For an isolated WEC in the open water, the maximum produced power can be achieved at a wave frequency ω by using the optimal PTO damping λPTO,n. Note that the values of diagonal elements of the PTO damping matrix are the same. The mass term and stiffness term of the PTO system are not considered in this study.
From Figure 5 it can be seen that two peak values and one trough value can be found for the WEC-pontoon system with smaller s2/h (=0.2, 0.25, 0.3) within the frequency range of 0 < kh < 6, and both the first and the second peak values decrease with increasing s2. The second peak value is greater than the first one for cases with s2/h = 0.2 and the reverse trend can be found for cases with s2/h = 0.25 and 0.3. However, the second peak value approaches zero for cases with greater s2 (i.e., s2/h = 0.35, 0.4). The peak and the trough values of qmean shift towards the lower frequency range with increasing s2 (except for the cases where the second peak value vanishes). To illustrate the trend of the qmean, which is characterized by the two peaks and a trough value between them, the dimensionless quantity of the numerator (Ptotal,d) and the denominator (Pisolated,d) in Equation (4) are presented in Figure 6. From Figure 6, the parabolic trend with a slight oscillation can be observed for Ptotal,d vs. kh. Comparatively, for Pisolated,d vs. kh, the unique peak value corresponding to the slight oscillation of Ptotal,d vs. kh can be found. The presence of the trough value at a critical wavenumber kc is attributed to the fact that the denominator of the qmean occurs the maximum value at kc (see Figure 6). Therefore, the location of the trough value in Figure 5 is corresponding to the natural frequency in heave mode of the isolated WEC device. And the presence of the trough value lead to the two apparent peak values on its two sides. Furthermore, it can be seen that the energy conversion performance of the pontoon-integrated array (with proper parameter design) is obviously better than that of the isolated WEC array (i.e., without the pontoon) in a wide frequency range. Specifically, qmean > 3 can be found in some frequency range.
The dimensionless exciting wave force in the heave-mode (Fz/ρπgAa2), the added mass (μnn/ρπa2d) and the damping coefficient (λnn/ρωπa2d) of individual devices for both the isolated and integrated WEC array (i.e., with and without pontoon) are shown in Figure 7.
The symbols ρ and g are the water density and the gravitational acceleration, respectively. Note that only the diagonal elements of the added mass matrix and damping coefficient matrix are presented. Since the WEC array is under the action of beam waves (β = 0°), the hydrodynamic coefficients of all WEC devices are symmetrical about the central point of the array. Thus, only the results for the WEC devices #1–#6 are given. The dimensionless added mass of each device of the WEC array without the pontoon decreases with increasing kh. The dimensionless added masses of the WEC-pontoon system have minimum values at about kh = 4.75. However, the added mass of each WEC device of the array without the pontoon is smaller than that of the WEC-pontoon system. The damping coefficients of all the WEC devices in both WEC arrays with and without a pontoon increase firstly and then decrease with increasing kh. Additionally, the damping coefficient of the WEC array without the pontoon is less than that of the WEC array with the pontoon in the frequency range of kh < 5. For both the WEC array without and with the pontoon, the damping coefficients of the WEC devices at the edges of the array (i.e., device #1 and #11) are smaller than the others. The exciting wave force of each WEC device decreases with increasing kh for the array without the pontoon. However, the exciting forces of the pontoon-integrated array increase firstly and then decrease with increasing kh. The exciting force of each device in the pontoon-integrated array is greater than that in the array without the pontoon in the range of kh < 5 approximately. However, the reverse trend is presented in the range of kh > 5. For the pontoon-integrated array, the improvement of the capture efficiency is mainly attributed to the incensement of the exciting wave force acting on the WEC devices, which is ultimately due to the wave reflection from the pontoon.

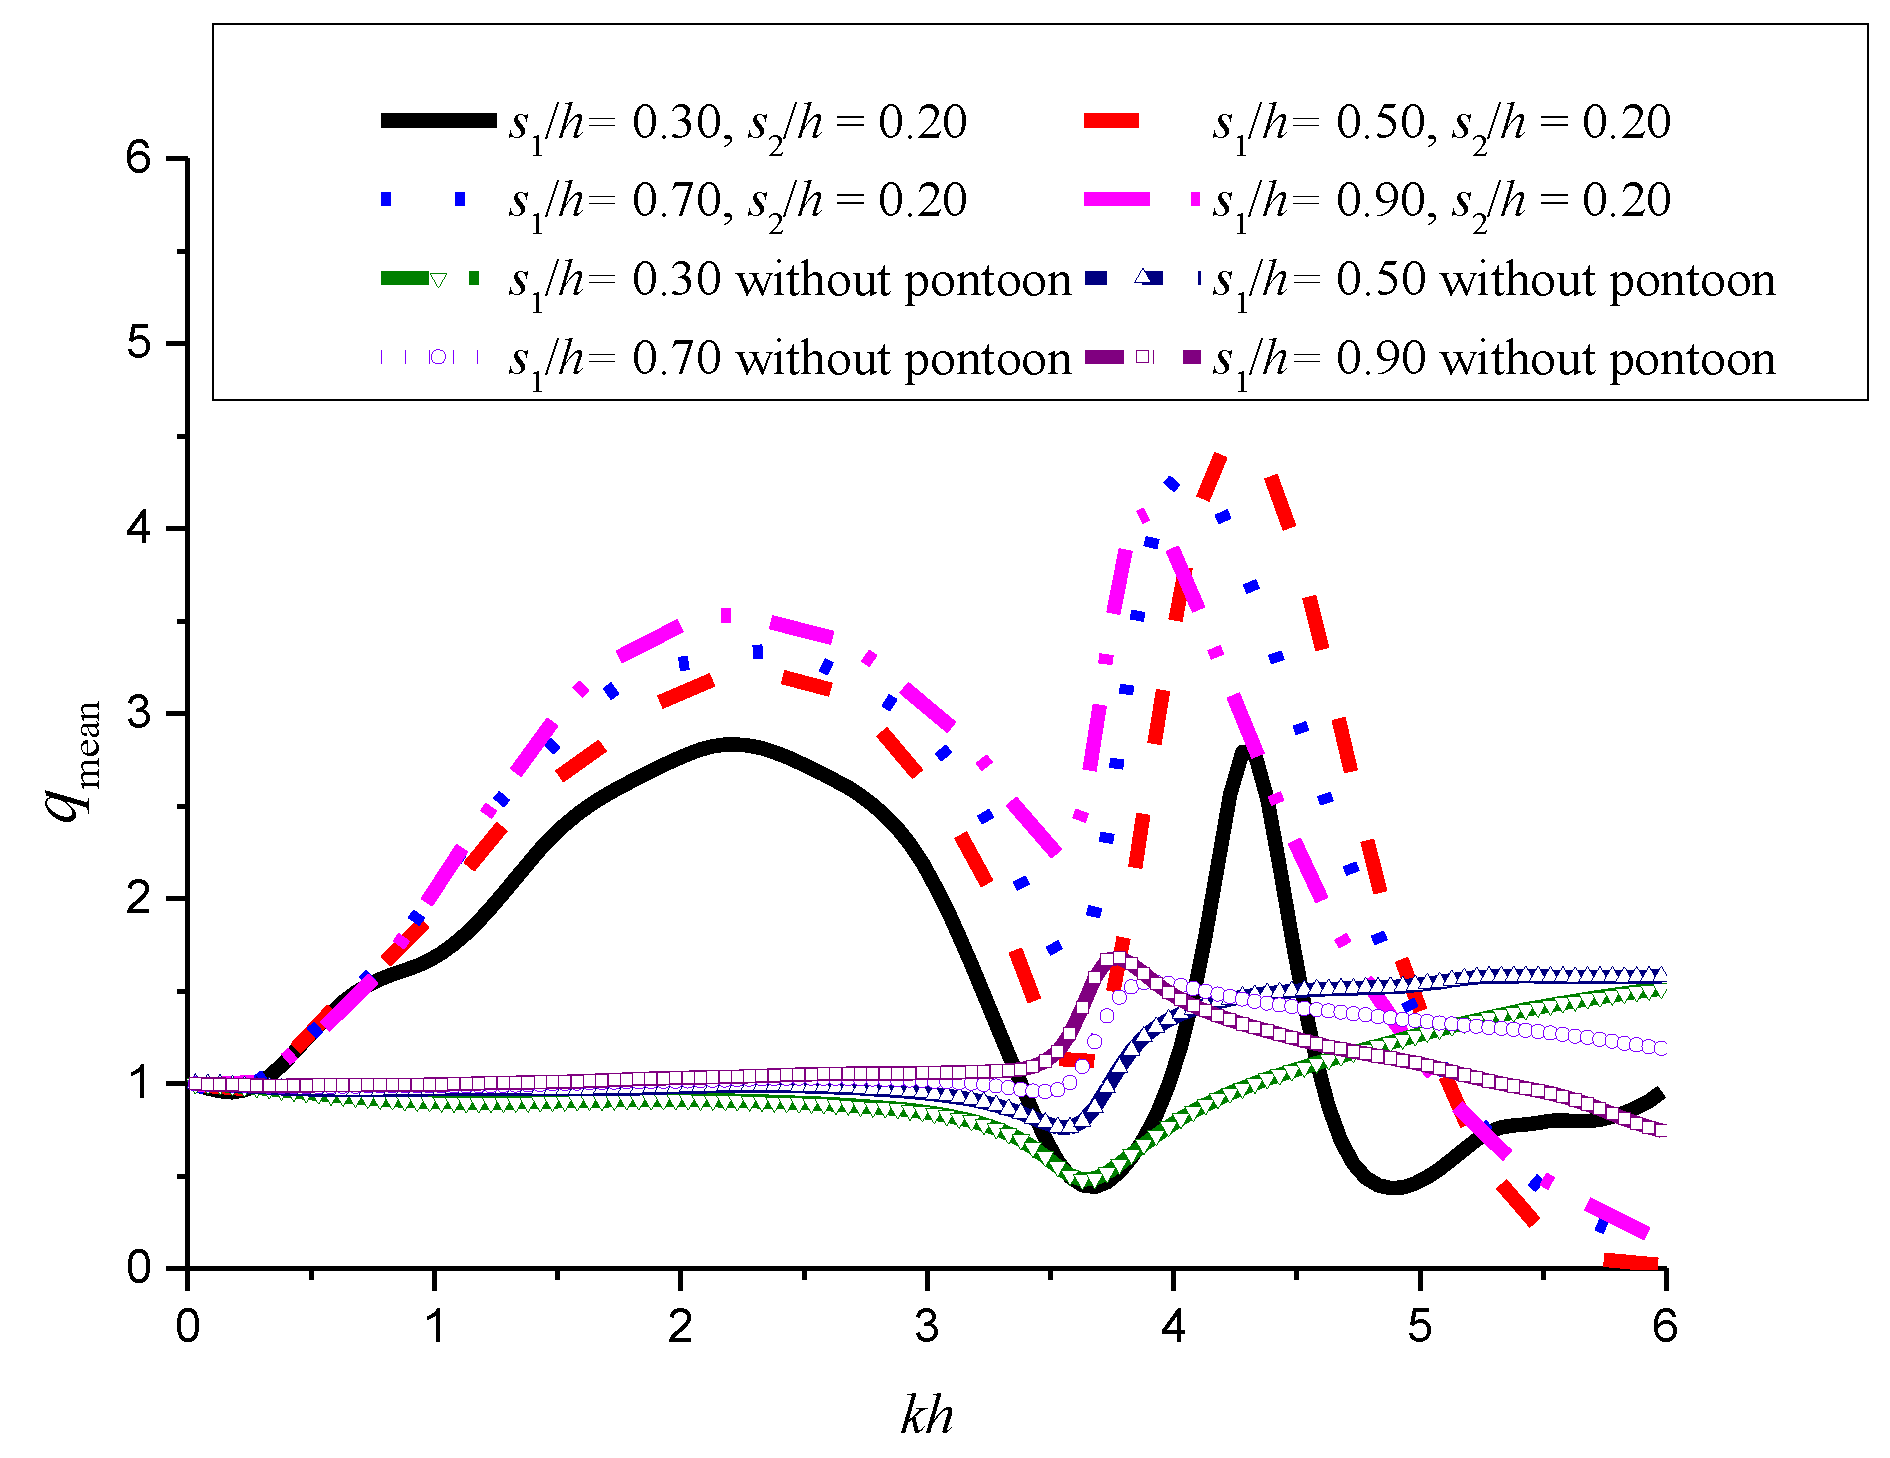
3.2.2. Effect of the WEC-WEC Spacing s1

The arrays with WEC-WEC spacing of s1/h = 0.3, 0.5, 0.7, and 0.9 are considered, while the WEC-pontoon distance remains s2/h = 0.20. The corresponding results for the array without the pontoon with the same WEC-WEC spacing are also calculated. The results in Figure 8 show that, for the WEC-pontoon system, the variations of qmean with kh for different s1 are similar to each other and they are very different from the corresponding array without a pontoon. The qmean of a WEC array without the pontoon is nearly 1 until kh = 3, beyond which qmean slightly increases with increasing kh. The significant increase in the efficiency of the WEC array with the pontoon can be found at the two frequency ranges (high-efficiency ranges), which are defined as range-1 and range-2 for the low- and high-frequency ranges, respectively. A minimum value of qmean occurs between these two ranges of kh. The maximum qmean in the range-1 is lower than that in range-2. However, range-1 is much wider than range-2. When s1/h > 0.50, even the minimum value of qmean between the range-1 and range-2 is greater than 1, indicating that the efficiency of the WEC-array with a pontoon is higher than that without a pontoon at a wide range of kh. A WEC-array with a very small s1/h (=0.3) is found to have a smaller qmean than any other larger s1/h considered. Between these two high-efficiency ranges, qmean reaches its minimum value. In practice, the minimum value of qmean should be avoided in order to gain as much energy as possible.

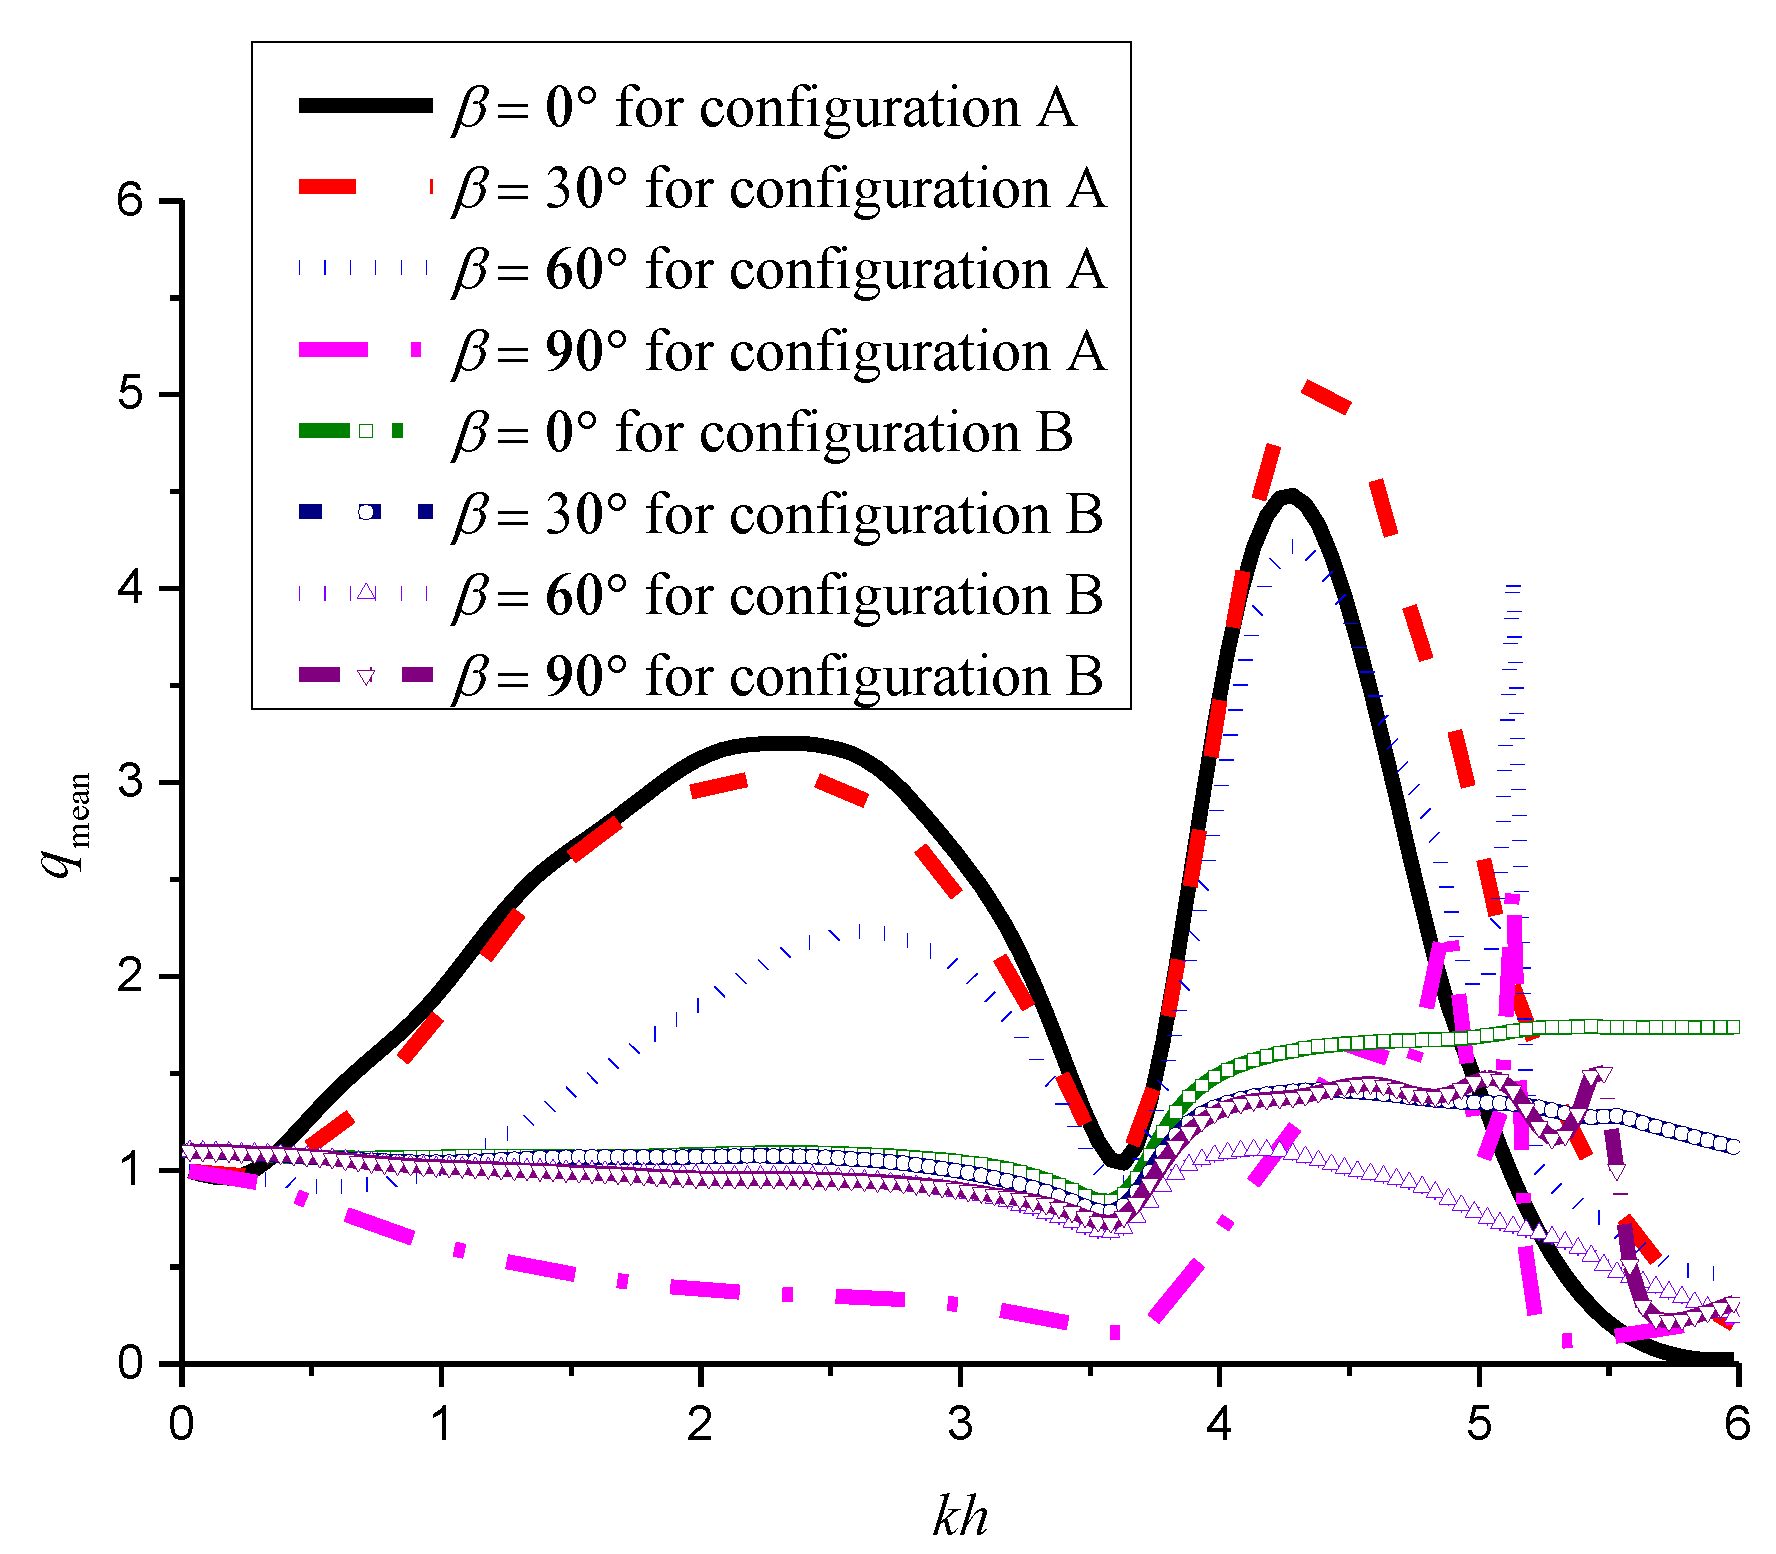
3.2.3. Effect of the Wave Incident Angle β

The WEC arrays with β = 0°, 30°, 60°, and 90° are considered. The WEC-WEC spacing of the array and the WEC-pontoon distance are s1/h = 0.5 and s2/h = 0.2, respectively. Figure 9 shows the variation of qmean with kh for all the wave incident angles considered. Furthermore, to investigate the performance of each individual WEC device, the results of individual interaction factors of all WEC devices are presented in Figure 10.
It can be seen from Figure 9 that the effect of the wave-incident angle on qmean is quite significant. The variation trends of qmean with kh for β = 0°, 30°, and 60° are similar with each other. For these three incident angles, two high-efficiency ranges are found. As β = 60°, qmean in the first high-efficiency range is significantly reduced, and as β = 90° the first high-efficiency range disappears and the qmean in the second high-efficiency range significantly reduces. This is due to a weaker interaction between the WEC array and the pontoon when the incident wave is parallel with the pontoon. The effect of the wave incident angle on qmean in the second high-efficiency range is the smallest for β ≤ 60°. The strong wave-multibody structure interactions in shorter waves lead to the spiking observed at the high frequency range for larger wave incidence angle (i.e., β = 60° and 90°). Similarly, the spiking phenomenon can be observed for the wave exciting forces (see Figure 11).
For the WEC array without a pontoon, the effect of the β on the efficiency is weak when kh < 3.75. When kh > 3.75, the minimum qmean occurs when β = 60°. For the pontoon-integrated array, as kh > 5.5, qmean of the array becomes lower than that of a WEC array without the pontoon, which is due to the fact that the standing waves can be formed at this frequency band. The standing waves are not beneficial for the energy extraction of the oscillating buoy WEC.
In Figure 10, the variations of the qind with kh follow the trend of the mean interaction factor qmean. The difference between the qind of all the WEC devices increases with increasing β. At large values of β the interaction factor varies among the WEC devices mainly because the WEC devices in the lee side of the array are significantly affected by the weather side WEC devices. For β = 60° and 90°, a ‘spike’ of qind can be found for devices close to the weather sea side at the higher frequency range in Figure 10.
This spike is corresponding to the spike in the wave exciting force at the corresponding location for β = 60° and 90° shown in Figure 11b,c. In addition, it can also be seen from Figure 11a–c and Figure 7c that the variation of wave exciting force against kh of the WEC devices for β = 0° and 30° is different from that for β = 60° and 90°. It is mainly reflected in that the decreasing trend with increasing kh and ‘spikes’ in the high-frequency range can be found for cases with β = 60° and 90°. At the locations of the ‘spikes’, the wave exciting force of the WEC devices at the shadow side is greater than that of the others. By contrast, the trend that increases first, and then decreases can be found and no ‘spikes’ are found for cases with β = 0° and 30°. Strong high-frequency oscillations of the exciting forces can be observed for the multi-bodies under action of (quasi) beam seas. This may lead to the spikes in at the high frequency range while the pontoon-WEC system is under action of the oblique waves with β = 60° and 90°.

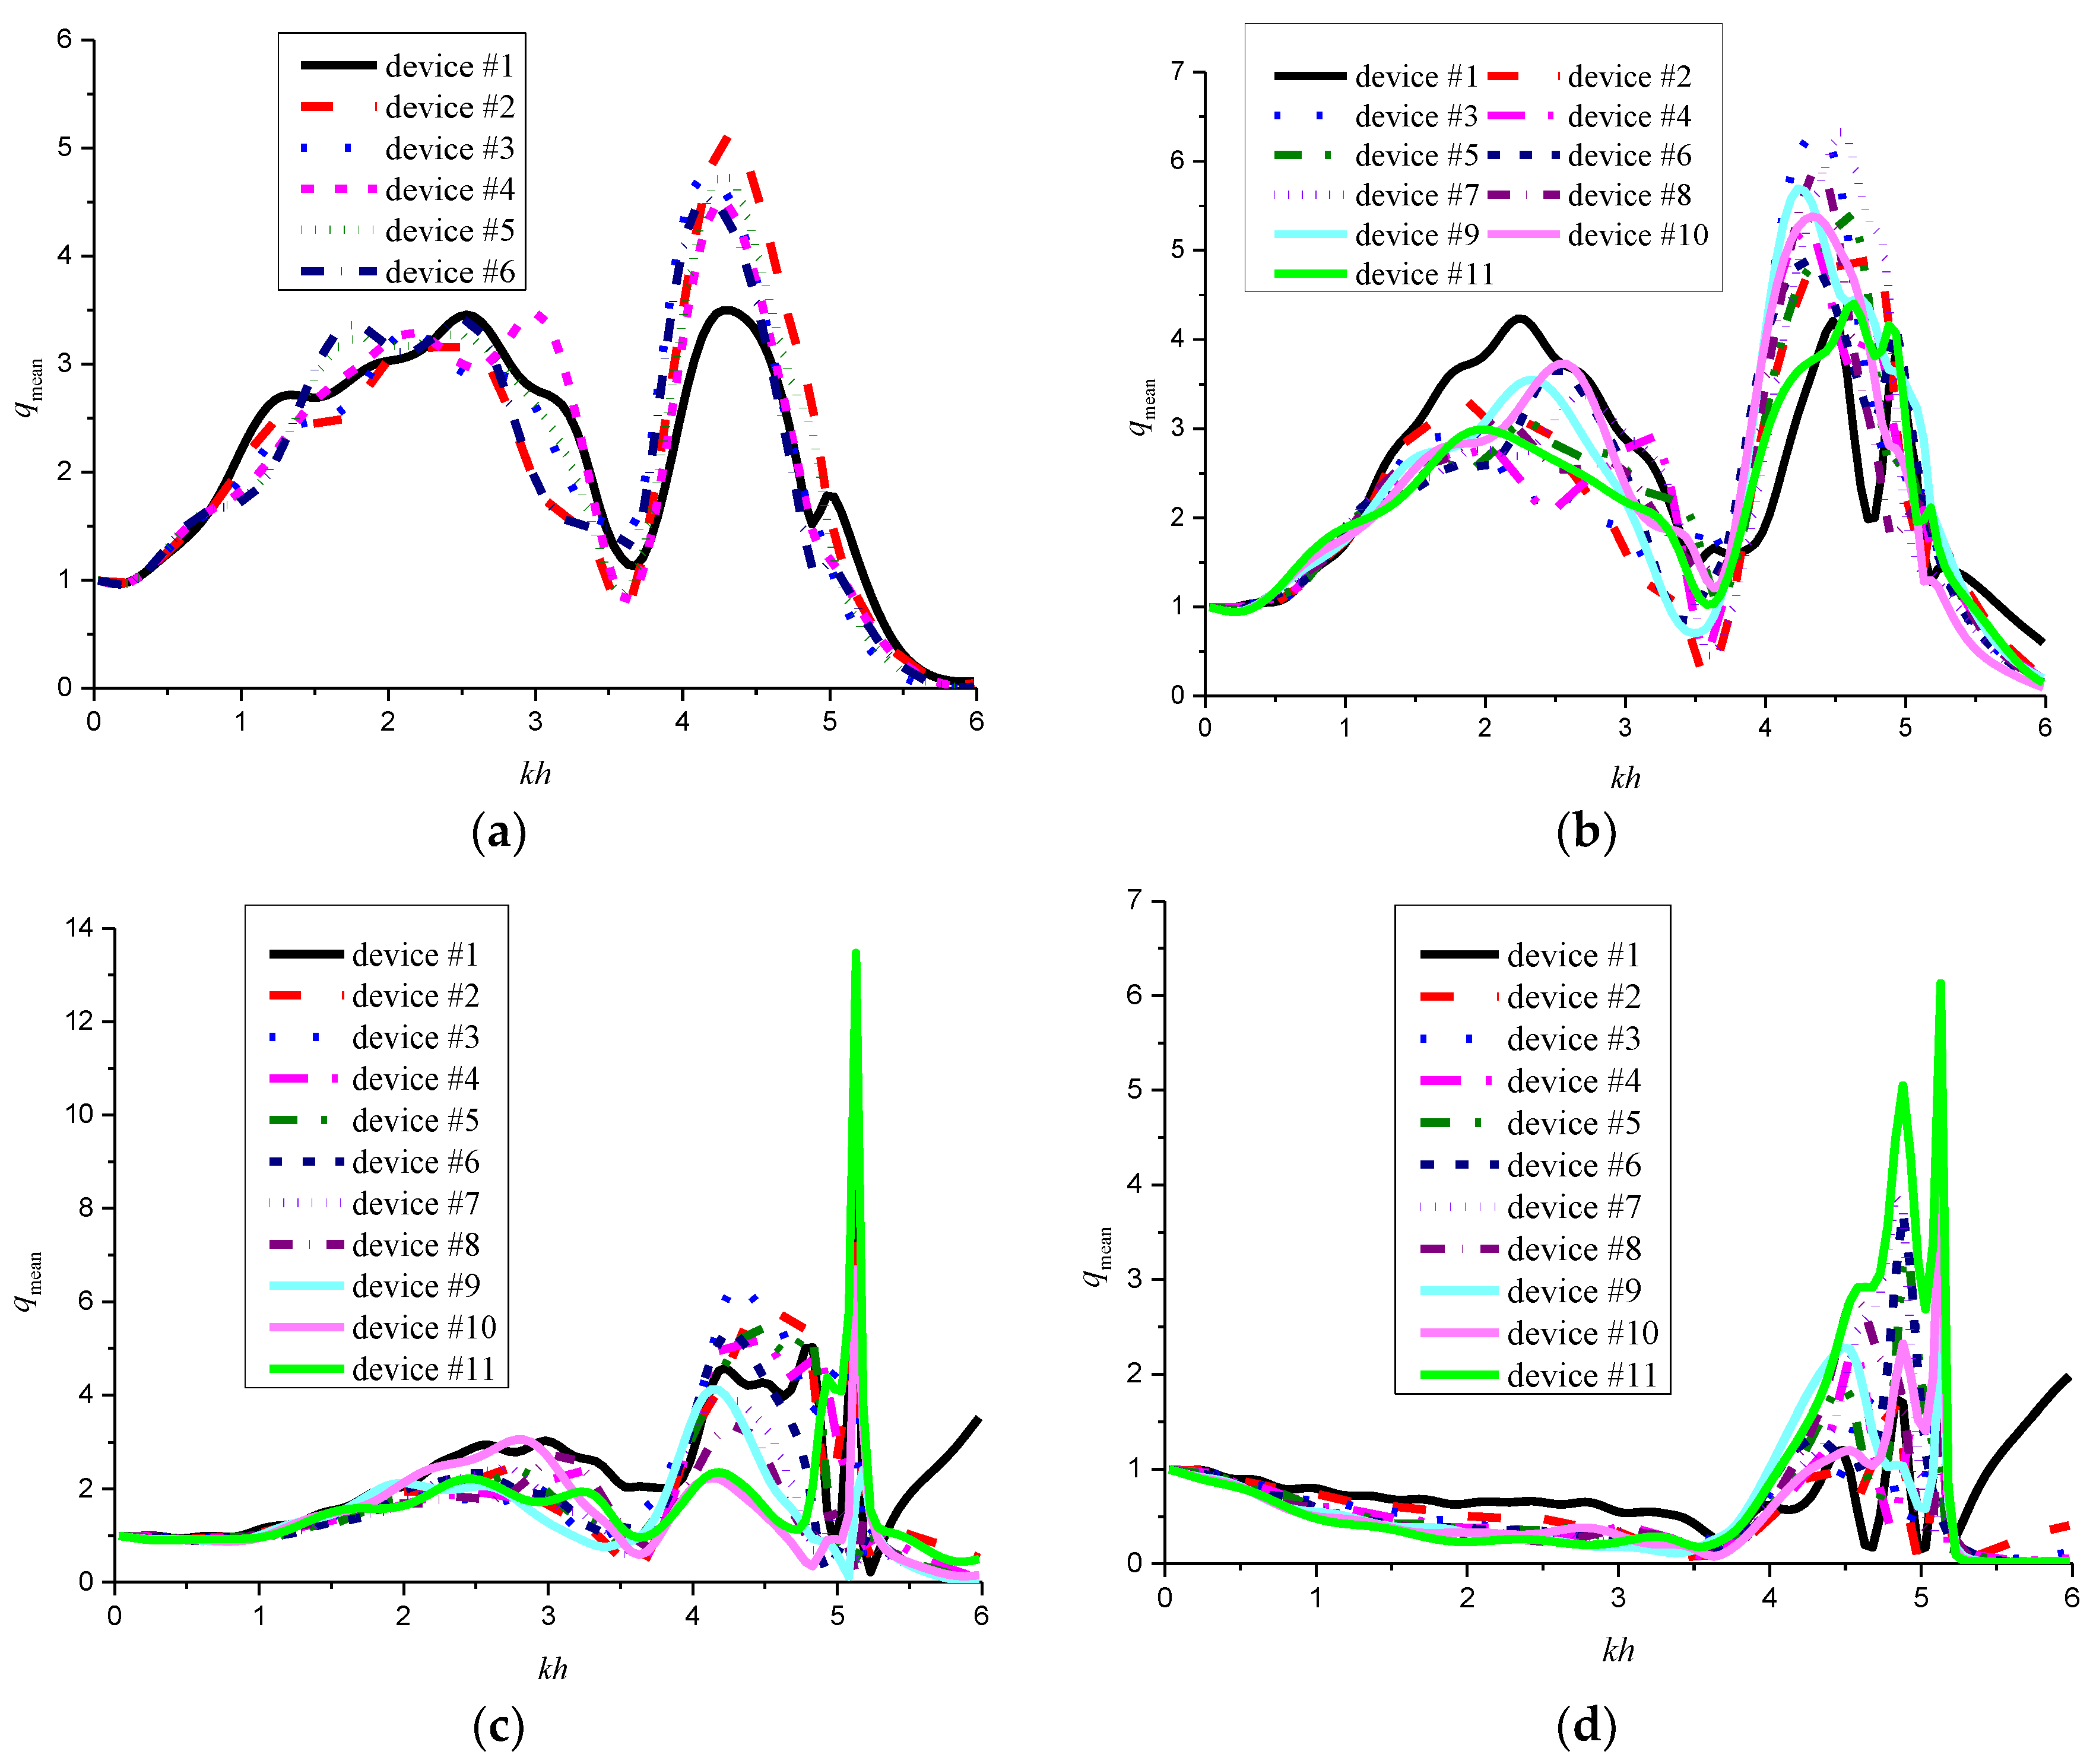
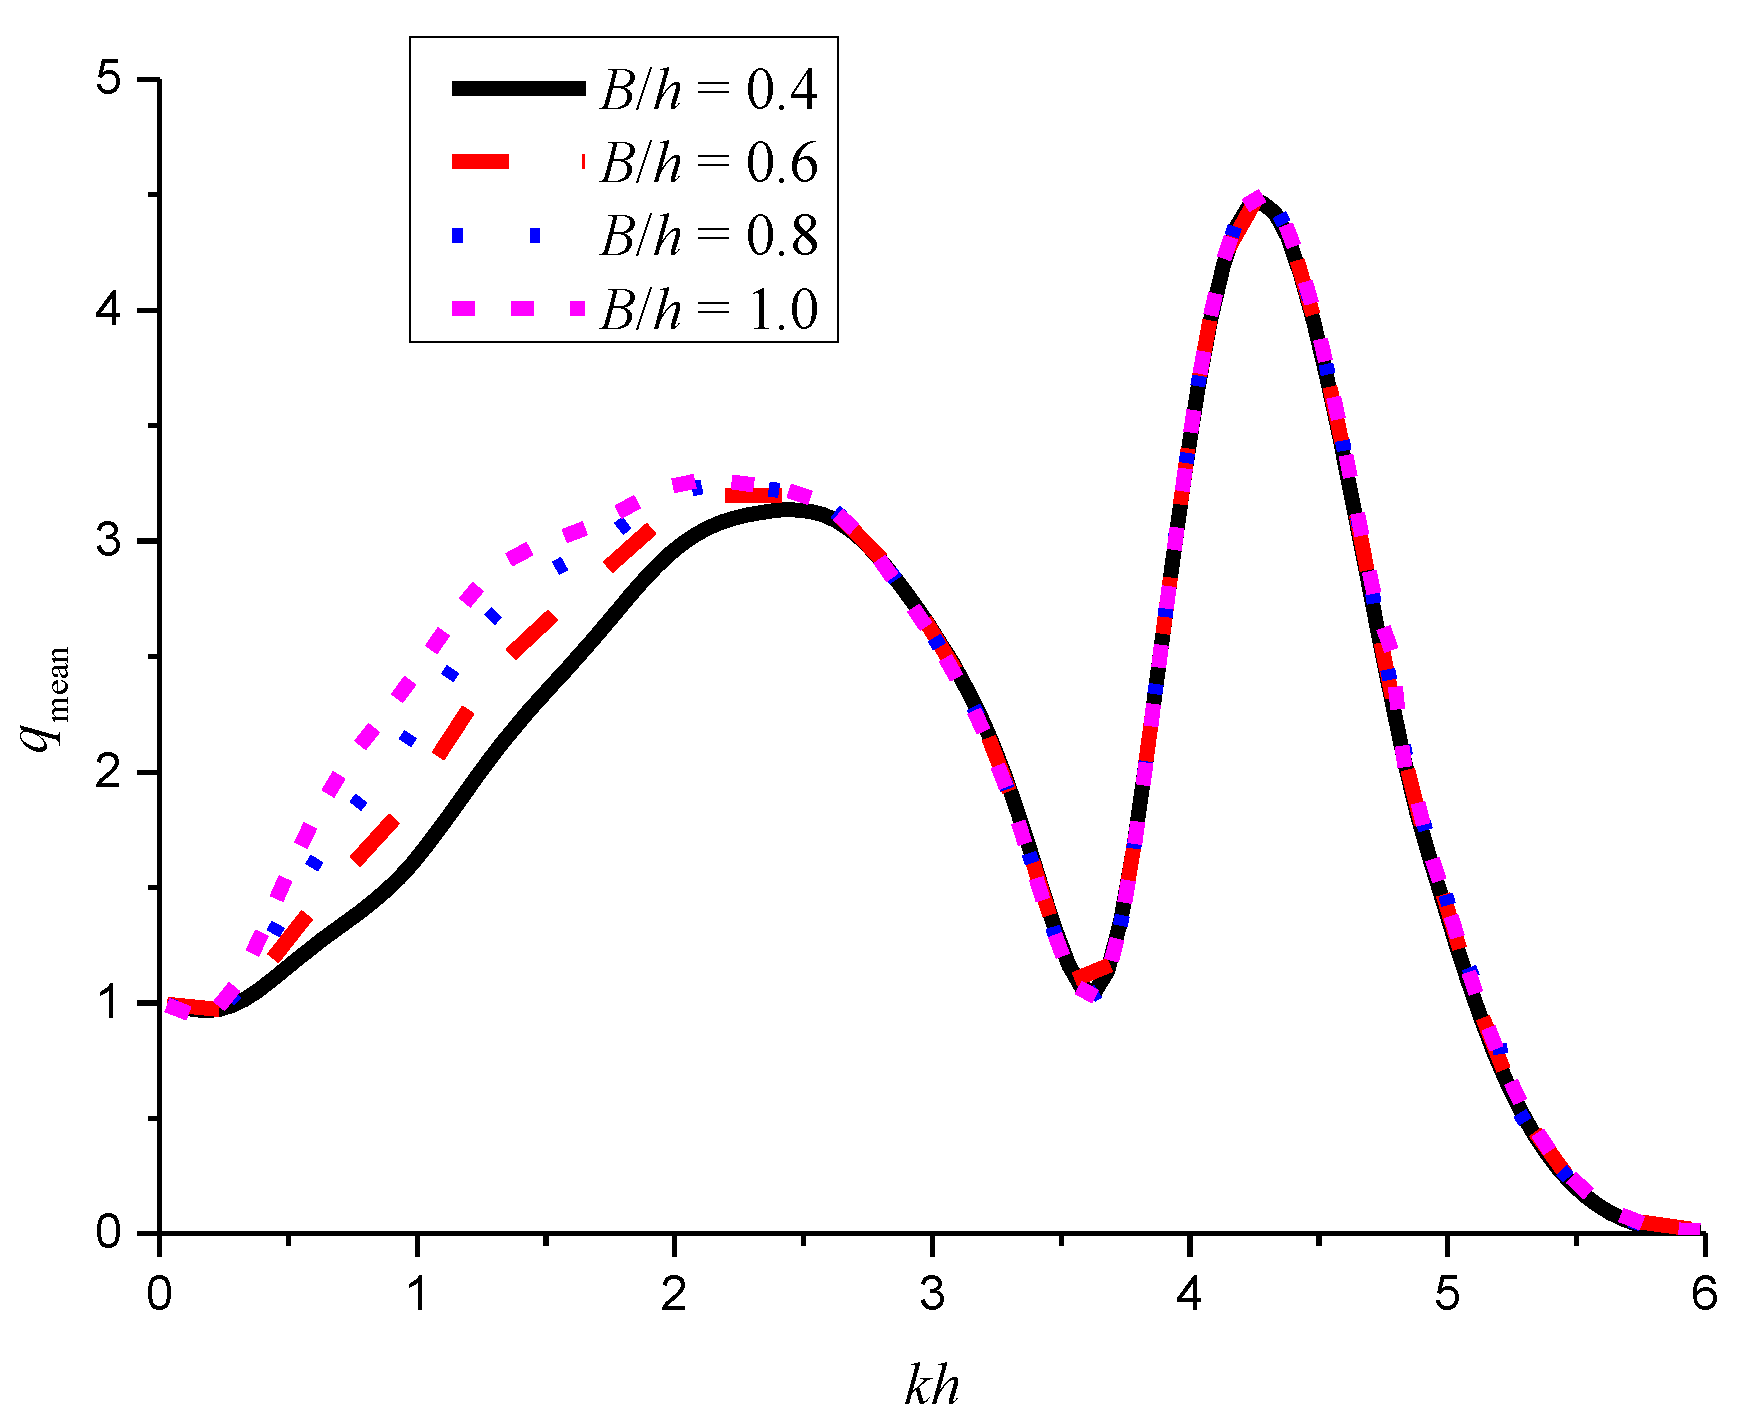
3.2.4. Effect of the Dimension of the Rear Pontoon

Compared with the WEC array without a pontoon, the improvement of the energy conversion performance of the WEC-pontoon system is attributed to the reflected waves caused by the rear pontoon. It is believed that the dimensions of a pontoon determine the reflection coefficient and transmission coefficient. The influence of the draft T, breadth B, and length D of the rear pontoon on system performance is investigated in this section. While both parameters s1 and s2 are fixed as 0.5 h, calculations are performed for B/h = 0.6, D/h = 12, T/h = 0.15, 0.20, 0.25, 0.30, 0.35, and 0.40. The corresponding results are presented in Figure 12. It can be seen that the variations of qmean with kh for different drafts of the rear pontoon are similar with each other. With increasing T, the first peak value of qmean increases and second peak value decreases. The kh corresponding to both peak values shift towards a lower frequency range with increasing T. For cases in the low-frequency range, the increase in the draft leads to an increase of the reflection coefficient. Thus, the increase of the efficiency can be found. For cases in the high frequency range, the increase in the draft leads to strong standing waves. This may have a negative impact on the wave energy extraction of the heaving WEC devices. i.e., reduce the efficiency of the system. However, the minimum value and its location changes little with increasing T. Although the modification of the qmean occurs for different cases, the qmean is still greater than 1 as kh < 5.
The effect of pontoon breadth is investigated by carrying out calculations with D/h = 12, T/h = 0.25 and four pontoon breadths of B/h = 0.4, 0.6, 0.8, and 1.0. The corresponding results are given in Figure 13. The breadth is found to affect qmean in the lower frequency range 0.5 < kh < 2.6, where qmean increases with increasing breadth. qmean in the range of kh > 2.6 are nearly independent on the pontoon breadth. This is due to the fact that the change of the pontoon width only affects the hydrodynamic interactions of the pontoon-WEC system in the longer waves.
Finally, the effect of length of the pontoon is investigated by the calculations with T/h = 0.25, B/h = 0.6 and four pontoon lengths of D/h = 12, 16, 20, and 24. From the corresponding results in Figure 14, it can be seen that the length of the pontoon has little effect on the variations of qmean.

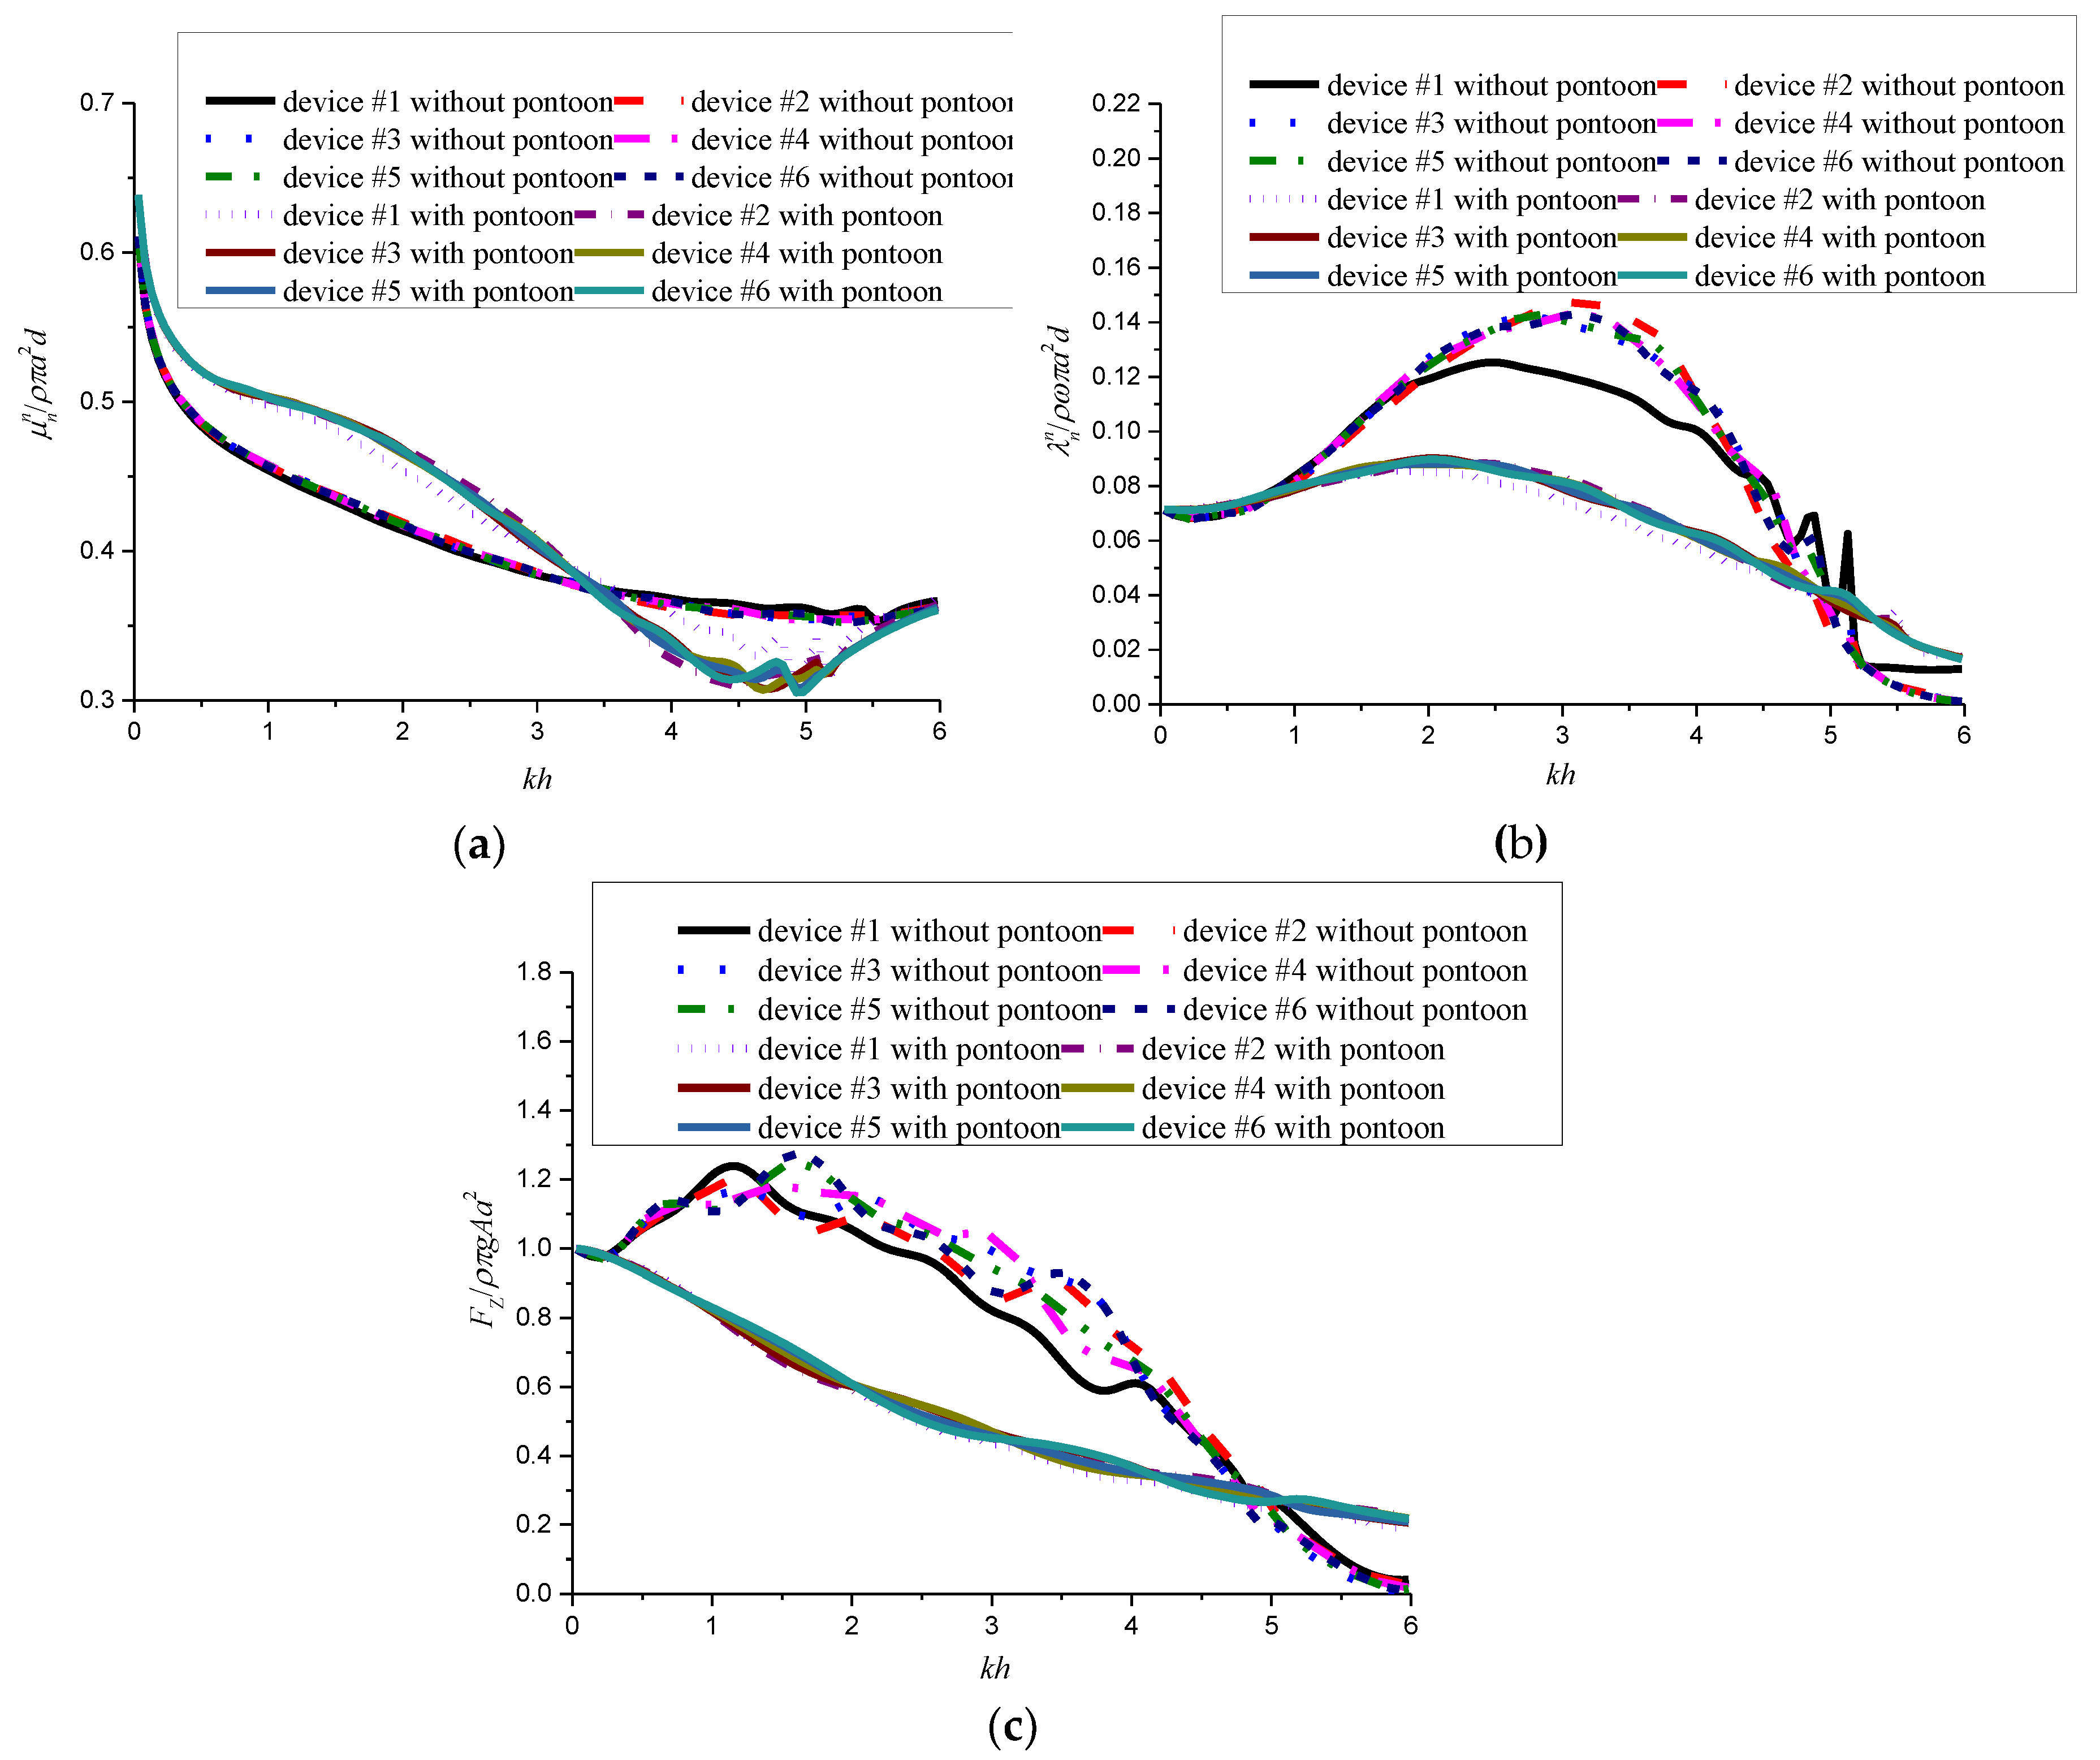
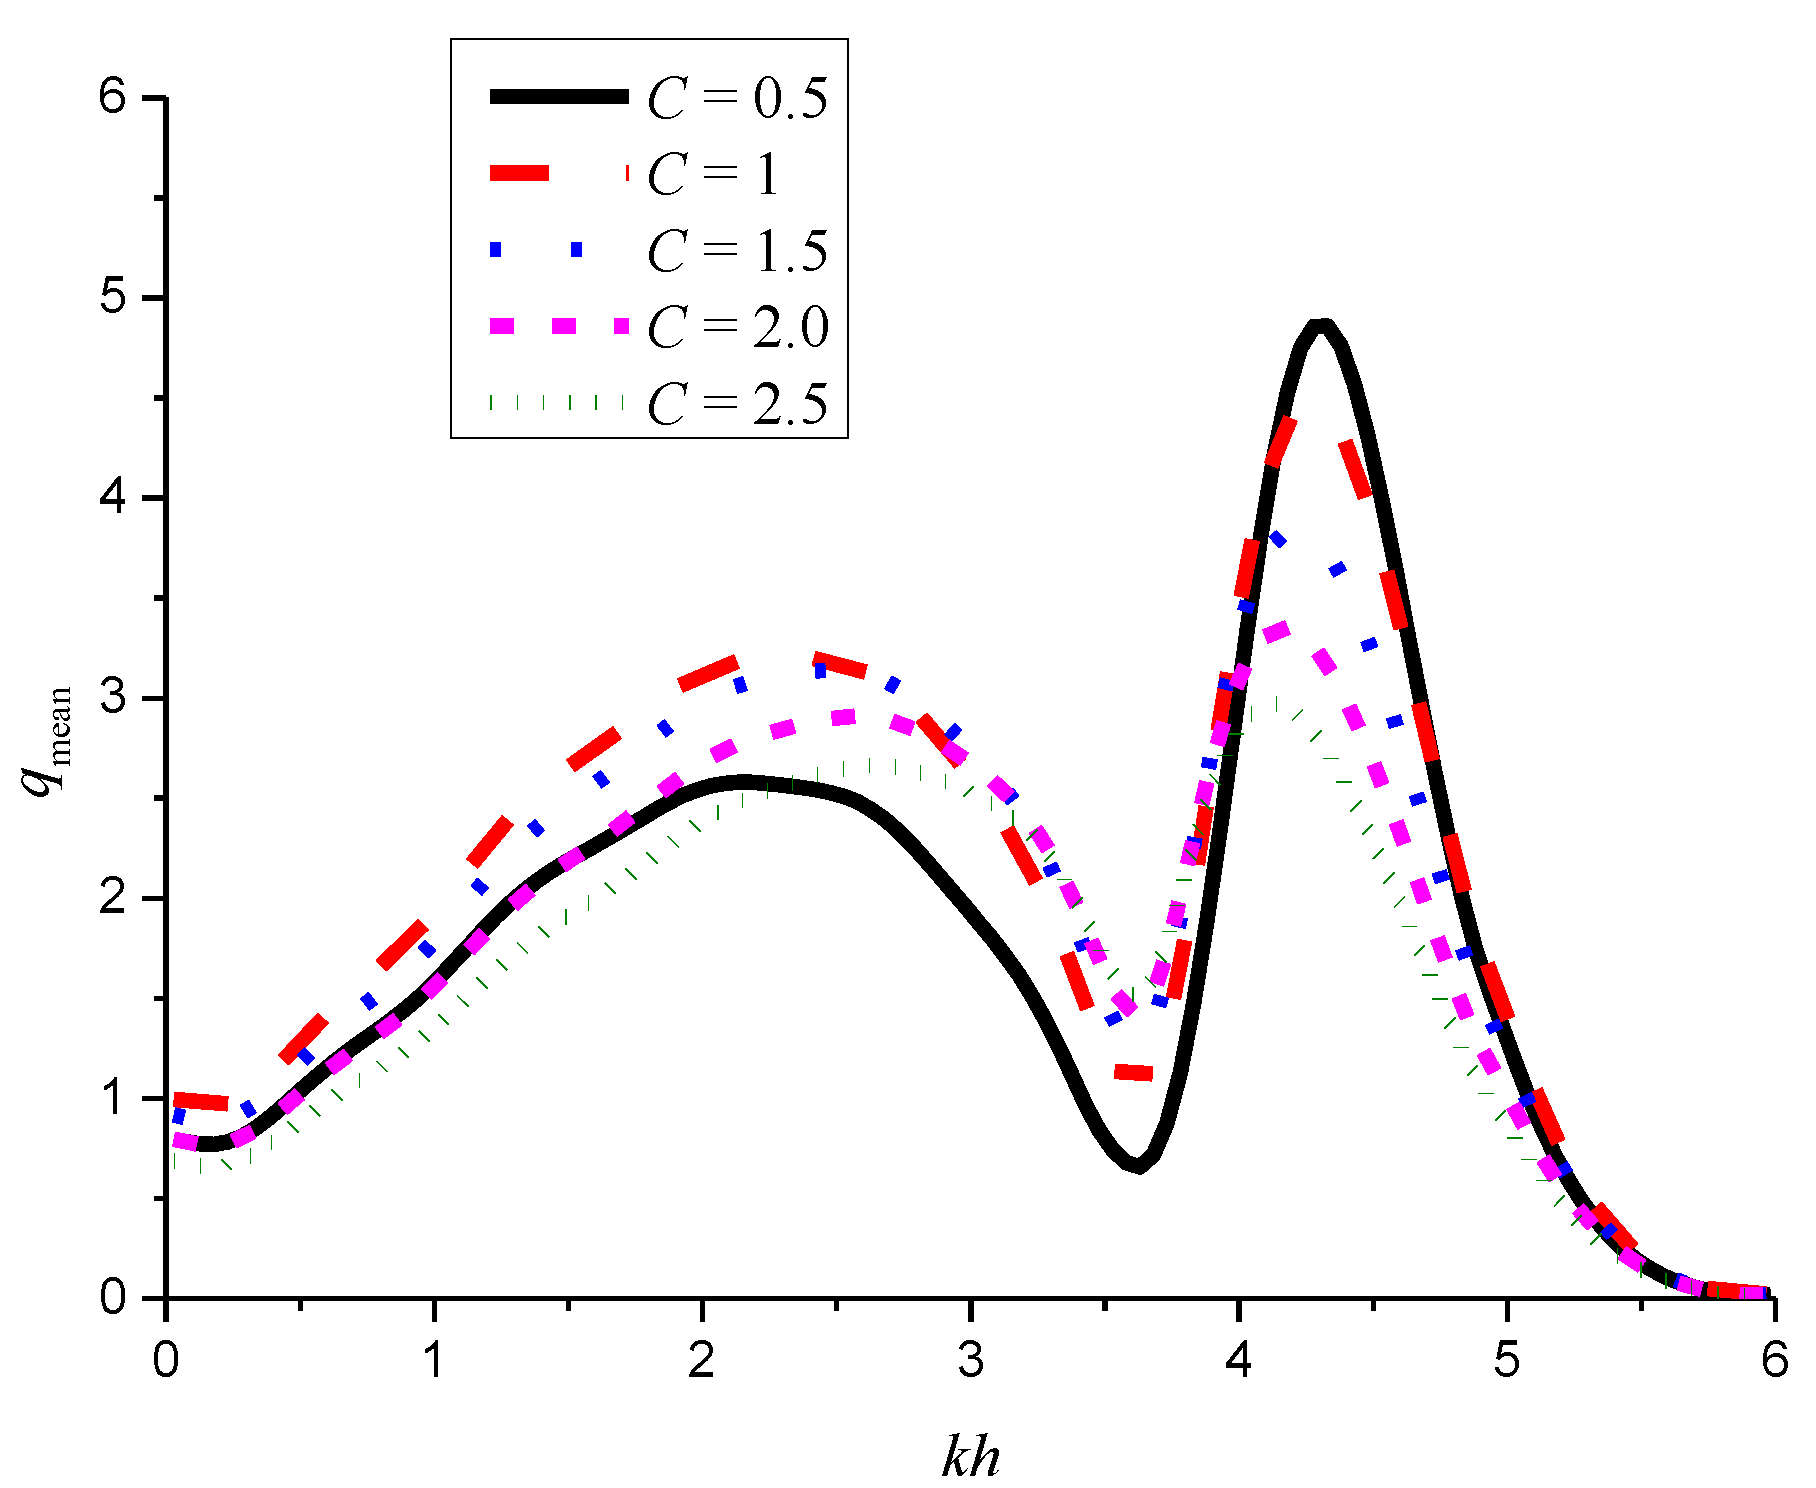
3.2.5. Effect of the PTO Damping

PTO system is an essential part of WECs. In the aforementioned sections, the diagonal elements (λPTO,n) of the PTO damping matrix are chosen as the optimal PTO damping of an isolated WEC device. The PTO damping can be calculated as:
λ PTO , n = C ( K n / ω ω ( M n + μ n ) ) 2 + λ n 2
where C is a constant. To investigate the effects of the coefficient C, calculations for various C = 0.5, 1, 1.5, 2, and 2.5 are performed. The WEC-WEC spacing and the WEC-pontoon spacing are s1/h = 0.5 and s2/h = 0.2, and the wave incidence angle β = 0° is considered. It is clear from Figure 15 that the PTO damping affects the output power significantly and its influences are different for different frequency range. It is mainly reflected in that, within the test cases, the qmean with C = 1 is optimal at a lower frequency range (i.e., kh < 3, approximately). The valley value increases with increasing PTO damping. However, the system with light PTO damping performs better at the frequency range of 4.0 < kh < 5.0.
For a WEC array without a pontoon with the same value of diagonal elements of the PTO damping matrix, the maximum output power can be achieved by choosing the optimal diagonal elements of the PTO damping matrix (i.e., C = 1) [45]. However, this may be not correct for the WEC-pontoon system due to the interference between the WECs and the pontoon. In this paper, although the effect of the PTO damping is investigated, the maximum output power cannot be obtained. Other optimization strategies, such as using the damping value determined by iterative approach [45], could improve the energy conversion performance of the proposed WEC array. Although the optimal PTO damping matrix is not obtained at the whole tested frequency range, the present results give a guide for choosing PTO damping at different frequency range.

3.2.6. Discussions

One aim of the present work is to compare the energy conversion performance of the pontoon-integrated WEC array and the conventional WEC array (i.e., the array without the pontoon). The coefficient qmean is used to indicate the energy conversion performance of the WEC array. From Section 3.2.1 and Section 3.2.3, it can be found that the qmean of the pontoon-integrated WEC array is greater than that of the conventional array with different parameters (WEC-WEC spacing, WEC-poontoon spacing, wave incidence angle) at a wide frequency range. It is interesting that a trough value of qmean (between two peak values) is observed, and the location of the trough value is corresponding to the location of the peak value of the Pisolated(ω) (i.e., the optimal power produced by an isolated WEC device). Despite this, the trough value of the qmean for the pontoon integrated array is greater than that of the corresponding conventional WEC array with same parameters. The qmean of the pontoon-integrated WEC array is less than that of the conventional array at the high frequency range. This is due to the fact that the standing waves form in front of the pontoon for certain frequencies, which may lead to the significant reduction of the heave response of the bodies in front of the pontoon. Anyway, the present integration scheme with proper design may provide a way to improve the energy conversion performance of an array of OB-WECs.
Interestingly, a spike of qmean can be found at the high frequency range while the pontoon-WEC system under action of oblique waves (with β = 60° and 90°). This is due to the fact that a distinct spike of qind can be found for the WECs in the shadow side. Additionally, at the frequencies corresponding to the spikes, the qind of WECs in the shadow side is greater than that of the WECs in the front side. However, the reverse trend can be observed in the lower frequency range. For cases with β = 90°, the qmean of the pontoon-integrated WEC array is less than that of the conventional WEC array, which remind us that the proposed system should be configured in beam seas or slight oblique seas.

4. Conclusions

The hydrodynamic performance of a hybrid system consisting of an oscillating buoy WEC array and a fixed rear pontoon have been investigated theoretically using linear potential flow theory. The HOBEM program (i.e., WAFDUT) is used to solve the diffraction/radiation problem of the multi-body system. The linear PTO damping is used to calculate the absorbed power. In the validation of the WAFDUT, the calculated mean interaction factor of a linear heaving WEC array agree well with previous published data.
The numerical results for a range of configurations are presented to investigate the influence of the different structural and PTO parameters on the performance of the integrated system. By comparing the energy conversion performance of the pontoon integrated array with that of the conventional array under a variety of parameters, the following conclusions can be found:
(1)
The efficiency a properly designed WEC-pontoon system is much higher to that of the WEC array without pontoons over a wide frequency range.
(2)
The qmean of the pontoon integrated array is smaller than the convention array in the high frequency range because of the standing waves in front of the pontoon at certain frequencies.
(3)
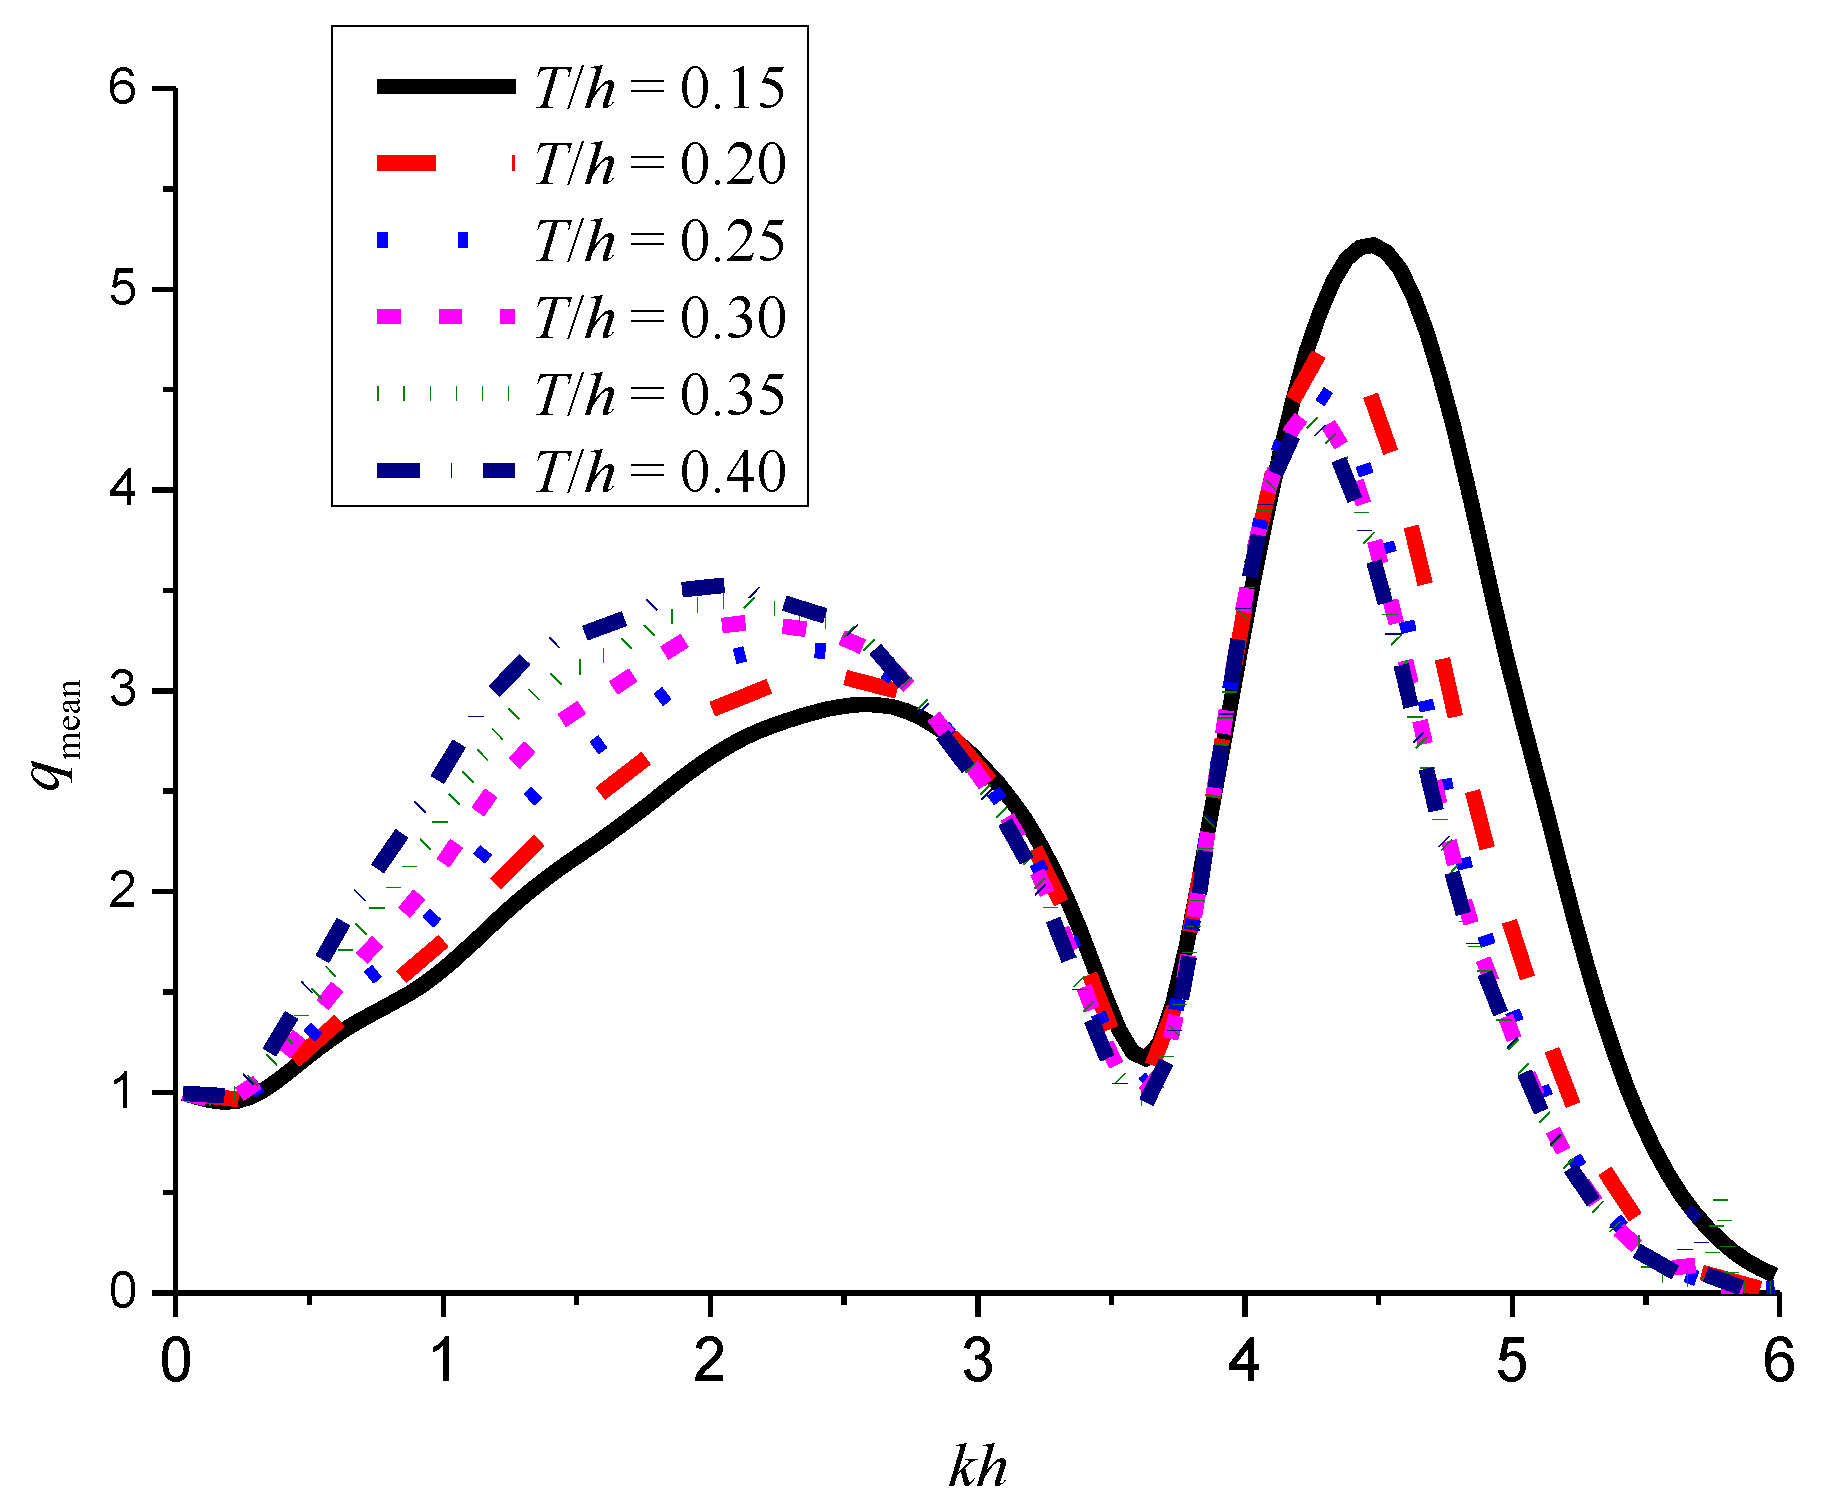
With regard to the dimension of the pontoon, the draft of the pontoon is an important factor that affects the performance of the integrated system.
(4)
The performance of the integrated system is sensitive to the PTO damping at a wide frequency range.
(5)
Standing waves formed in the front of the pontoon are not beneficial to the energy extraction of WECs. This phenomenon shall be avoided while designing such a system.
The proposed system improves the energy extraction over a wide frequency range and reduces the construction cost through a cost-sharing strategy.

Acknowledgments

The authors would like to acknowledge the financial support the National Natural Science Foundation of China (grant Nos. 51679036, 51628901, and 51761135011) and the Royal Academy of Engineering under the UK-China Industry Academia Partnership Programme (grant no. UK-CIAPP\73).

Author Contributions

Dezhi Ning, Xuanlie Zhao, Lifen Chen and Ming Zhao draft the work, make substantial contributions to the design of the work, make final approval of the version to be published and make agreement to be accountable for all aspects of the work in ensuring that questions related to the accuracy or integrity of any part of the work are appropriately investigated and resolved.

Conflicts of Interest

The authors declare no conflict of interest.

Nomenclature

AbbreviationAppellation
WECwave energy converter
PTOpower take-off
OWCoscillating water column
CWRcapture width ratio
BEMboundary element methods
HOBEMhigher order boundary element method
WAFDUTBEM solver used in this paper
WAMITCommercial BEM solver

References

  1. Ferro, B.D. Wave and tidal energy: Its emergence and the challenges it faces. Refocus 2006, 7, 46–48. [Google Scholar] [CrossRef]
  2. Pecher, A.; Kofoed, J.P. Handbook of Ocean Wave Energy; Springer International Publishing: Cham, Switzerland, 2017. [Google Scholar]
  3. Astariz, S.; Iglesias, G. Enhancing wave energy competitiveness through co-located wind and wave energy farms. A review on the shadow effect. Energies 2015, 8, 7344–7366. [Google Scholar] [CrossRef]
  4. Mustapa, M.A.; Yaakob, O.B.; Ahmed, Y.M.; Rheem, C.-K.; Koh, K.K.; Adnan, F.A. Wave energy device and breakwater integration: A review. Renew. Sustain. Energy Rev. 2017, 77, 43–58. [Google Scholar] [CrossRef]
  5. Vicinanza, D.; Margheritini, L.; Kofoed, J.P.; Buccino, M. The SSG Wave Energy Converter: Performance, Status and Recent Developments. Energies 2012, 5, 193–226. [Google Scholar] [CrossRef]
  6. Zhao, X.L.; Ning, D.Z.; Zhang, C.W.; Kang, H.G. Hydrodynamic Investigation of an Oscillating Buoy Wave Energy Converter Integrated into a Pile-Restrained Floating Breakwater. Energies 2017, 10, 712. [Google Scholar] [CrossRef]
  7. Pérez-Collazo, C.; Greaves, D.; Iglesias, G. A review of combined wave and offshore wind energy. Renew. Sustain. Energy Rev. 2015, 42, 141–153. [Google Scholar]
  8. He, F.; Huang, Z.; Law, A.W. An experimental study of a floating breakwater with asymmetric pneumatic chambers for wave energy extraction. Appl. Energy 2013, 106, 222–231. [Google Scholar] [CrossRef]
  9. Iuppa, C.; Contestabile, P.; Cavallaro, L.; Foti, E.; Vicinanza, D. Hydraulic performance of an innovative breakwater for overtopping wave energy conversion. Sustainability 2016, 8, 1226. [Google Scholar] [CrossRef]
  10. Naty, S.; Viviano, A.; Foti, E. Wave Energy Exploitation System Integrated in the Coastal Structure of a Mediterranean Port. Sustainability 2016, 8, 1342. [Google Scholar] [CrossRef]
  11. Garnaud, X.; Mei, C.C. Comparison of wave power extraction by a compact array of small buoys and by a large buoy. IET Renew. Power Gener. 2010, 4, 519–530. [Google Scholar] [CrossRef]
  12. Babarit, A.; Duclos, G.; Clément, A.H. Comparison of latching control strategies for a heaving wave energy device in random sea. Appl. Ocean Res. 2004, 26, 227–238. [Google Scholar] [CrossRef]
  13. Babarit, A.; Clément, A.H. Optimal latching control of a wave energy device in regular and irregular waves. Appl. Ocean Res. 2006, 28, 77–91. [Google Scholar] [CrossRef]
  14. Younesian, D.; Alam, M. Multi-stable mechanisms for high-efficiency and broad band ocean wave energy harvesting. Appl. Energy 2017, 197, 292–302. [Google Scholar] [CrossRef]
  15. Son, D.; Yeung, R.W. Optimizing ocean-wave energy extraction of a dual coaxial-cylinder WEC using nonlinear model predictive control. Appl. Energy 2017, 187, 746–757. [Google Scholar] [CrossRef]
  16. Viviano, A.; Naty, S.; Foti, E.; Bruce, T.; Allsop, W.; Vicinanza, D. Large-scale experiments on the behaviour of a generalised Oscillating Water Column under random waves. Renew. Energy 2016, 99, 875–887. [Google Scholar] [CrossRef]
  17. Howe, D.; Nader, J. OWC WEC integrated within a breakwater versus isolated: Experimental and numerical theoretical study. Int. J. Mar. Energy 2017, 20, 165–182. [Google Scholar] [CrossRef]
  18. McIver, P.; Evans, D.V. An approximate theory for the performance of a number of wave-energy devices set into a reflecting wall. Appl. Ocean Res. 1988, 10, 58–65. [Google Scholar] [CrossRef]
  19. Mavrakos, S.A.; Katsaounis, G.M.; Nielsen, K.; Lemonis, G. Numerical performance investigation of an array of heaving wave power converters in front of a vertical breakwater. In Proceedings of the International Offshore and Polar Engineering Conference, Toulon, France, 23–28 May 2004; pp. 238–245. [Google Scholar]
  20. Schay, J.; Bhattacharjee, J.; Soares, C.G. Numerical Modelling of a Heaving Point Absorber in Front of a Vertical Wall. In Proceedings of the 32nd International Conference on Ocean, Offshore and Arctic Engineering, Nantes, France, 9–14 June 2013. [Google Scholar]
  21. Zhao, X.L.; Ning, D.Z.; Zhang, C.W.; Liu, Y.Y.; Kang, H.G. Analytical study on an oscillating buoy wave energy converter integrated into a fixed box-type breakwater. Math. Probl. Eng. 2017, 2017, 3960401. [Google Scholar] [CrossRef]
  22. Collins, K.M.; Howey, B.; Hann, M.; Iglesias, G.; Greaves, D.; Vicente, P.; Harnois, V. Breakthroughs in WEC arrays: shared moorings and cablings in the WETFEET project. In Proceedings of the 6th International Conference on Ocean Energy, Edinburgh, UK, 23–25 February 2016. [Google Scholar]
  23. Vicente, P.C.; António, F.D.O.; Gato, L.M.C.; Justino, P.A.P. Dynamics of arrays of floating point-absorber wave energy converters with inter-body and bottom slack-mooring connections. Appl. Ocean Res. 2009, 31, 267–281. [Google Scholar] [CrossRef]
  24. Mercadé Ruiz, P.; Ferri, F.; Kofoed, P.J. Experimental Validation of a Wave Energy Converter Array Hydrodynamics Tool. Sustainability 2017, 9, 115. [Google Scholar] [CrossRef]
  25. Folley, M. Numerical Modelling of Wave Energy Converters: State-of-the-Art Techniques for Single Devices and Arrays; Academic Press: New York, NY, USA, 2016. [Google Scholar]
  26. Falnes, J. A review of wave-energy extraction. Mar. Struct. 2007, 4, 185–207. [Google Scholar] [CrossRef]
  27. Folley, M.; Babarit, A.; Child, B.; Forehand, D.; O’Boyle, L.; Silverthorne, K.; Spinneken, J.; Stratigaki, V.; Troch, P. A review of numerical modelling of wave energy converter arrays. In Proceedings of the 31st International Conference on Offshore Mechanics and Arctic Engineering, Rio de Janeiro, Brazil, 1–6 June 2012. [Google Scholar]
  28. Mavrakos, S.A.; McIver, P. Comparison of methods for computing hydrodynamic characteristics of arrays of wave power devices. Appl. Ocean Res. 1997, 19, 283–291. [Google Scholar] [CrossRef]
  29. Chen, W.X.; Gao, F.; Meng, X.D.; Fu, J.X. Design of the wave energy converter array to achieve constructive effects. Ocean Eng. 2016, 124, 13–20. [Google Scholar] [CrossRef]
  30. Taghipour, R.; Arswendy, A.; Devergez, M.; Moan, T. Structural analysis of a multi-body wave energy converter in the frequency domain by interfacing WAMIT and ABAQUS. In Proceedings of the 27th International Conference on Offshore Mechanics and Arctic Engineering, Estoril, Portugal, 15–20 June 2008. [Google Scholar]
  31. Fàbregas, F.; Babarit, A.; Clément, A.H. On the numerical modeling and optimization of a bottom-referenced heave-buoy array of wave energy converters. Int. J. Mar. Energy 2017, 19, 1–15. [Google Scholar] [CrossRef]
  32. Wolgamot, H.A.; Taylor, P.H.; Taylor, R.E. The interaction factor and directionality in wave energy arrays. Ocean Eng. 2012, 47, 65–73. [Google Scholar] [CrossRef]
  33. Göteman, M. Wave energy parks with point-absorbers of different dimensions. J. Fluids Struct. 2017, 74, 142–157. [Google Scholar] [CrossRef]
  34. Göteman, M.; Engström, J.; Eriksson, M.; Isberg, J. Optimizing wave energy parks with over 1000 interacting point-absorbers using an approximate analytical method. Int. J. Mar. Energy 2015, 10, 113–126. [Google Scholar] [CrossRef]
  35. Child, B.F.M.; Venugopal, V. Optimal configurations of wave energy device arrays. Ocean Eng. 2010, 37, 1402–1417. [Google Scholar] [CrossRef]
  36. Simon, M.J. Multiple scattering in arrays of axisymmetric wave-energy devices. Part 1. A matrix method using a plane-wave approximation. J. Fluid Mech. 1982, 120, 1–25. [Google Scholar] [CrossRef]
  37. Siddorn, P.; Taylor, R.E. Diffraction and independent radiation by an array of floating cylinders. Ocean Eng. 2008, 35, 1289–1303. [Google Scholar] [CrossRef]
  38. Konispoliatis, D.N.; Mavrakos, S.A. Hydrodynamic analysis of an array of interacting free-floating oscillating water column (OWC׳s) devices. Ocean Eng. 2016, 111, 179–197. [Google Scholar] [CrossRef]
  39. Bellew, S. Investigation of the Response of Groups of Wave Energy Devices. Ph.D. Thesis, University of Manchester, Manchester, UK, 2011. [Google Scholar]
  40. Penalba, M.; Touzón, I.; Lopez-Mendia, J.; Nava, V. Anumerical study on the hydrodynamic impact of device slenderness and array size in wave energy farms in realistic wave climates. Ocean Eng. 2017, 142, 224–232. [Google Scholar] [CrossRef]
  41. Teng, B.; Taylor, R.E. New higher-order boundary element methods for wave diffraction/radiation. Appl. Ocean Res. 1995, 17, 71–77. [Google Scholar] [CrossRef]
  42. Teng, B.; Gou, Y.; Wang, G.; Cao, G. Motion response of hinged multiple floating bodies on local seabed. In Proceedings of the 24th International Offshore and Polar Engineering Conference, Busan, Korea, 15–20 June 2014. [Google Scholar]
  43. Li, B.B.; Ou, J.P. Concept design of a new deep draft platform. J. Mar. Sci. Appl. 2010, 9, 241–249. [Google Scholar] [CrossRef]
  44. WAMIT User Manual, WAMIT, Inc. 2008.
  45. Bellew, S.; Stallard, T.; Stansby, P.K. Optimisation of a Heterogeneous Array of Heaving Bodies. In Proceedings of the 8th European Wave and Tidal Energy Conference, Uppsala, Sweden, 7–10 September 2009. [Google Scholar]
Figure 1. The sketch of the proposed WEC-pontoon system: (a) the top view; and (b) the side view (the WECs in the array are labelled as devices #1–#11, respectively, on the top view).
Energies 11 00685 g001
Figure 2. 3D mesh of the calculation model for the five hemispherical WEC devices in the validation test.
Energies 11 00685 g002
Figure 3. Comparison of the calculated mean interaction factor qmean with the numerical results in [39].
Energies 11 00685 g003
Figure 4. 3D mesh of the calculation model for the parametric study. (T/h = 0.25, D/h = 12, B/h = 0.6, s1/h = 0.5, s2/h = 0.2)
Energies 11 00685 g004
Figure 5. Variations of mean interaction factor qmean with the dimensionless wave number kh for different WEC-pontoon spacing s2.
Energies 11 00685 g005
Figure 6. Variations of dimensionless total extracted power of the WEC array (Ptotal,d) and the dimensionless extracted power of the isolated WEC (Pisolated,d) with the dimensionless wave number kh.
Energies 11 00685 g006
Figure 7. Variations of dimensionless heave added mass (a), dimensionless heave damping coefficient (b), and dimensionless heave wave exciting force (c) of individual WECs with and without the pontoon. (s2/h = 0.2, β = 0°).
Energies 11 00685 g007
Figure 8. Variations of qmean with kh for WEC arrays with different WEC-WEC spacing of s1/h = 0.3, 0.5, 0.7, and 0.9. The WEC-pontoon spacing is s2/h = 0.2.
Energies 11 00685 g008
Figure 9. Variations of qmean with kh for WEC array with (configuration A) and without (configuration B) pontoon with different wave incident angles.
Energies 11 00685 g009
Figure 10. Individual interaction factors of all WEC devices for the WEC-pontoon system with β = 0° (a), 30° (b), 60° (c), and 90° (d).
Energies 11 00685 g010
Figure 11. Dimensionless heave wave exciting forces on each WEC device for β = 30° (a), 60° (b), and 90° (c).
Energies 11 00685 g011
Figure 12. Variations of qmean vs. kh for the WEC array with different drafts T of the rear pontoon.
Energies 11 00685 g012
Figure 13. Variations of qmean vs. kh for the WEC array with different breadths B of the rear pontoon.
Energies 11 00685 g013
Figure 14. Variations of qmean vs. kh for the WEC array with different lengths D of the rear pontoon.
Energies 11 00685 g014
Figure 15. Variations of qmean vs. kh for the WEC array with various PTO damping.
Energies 11 00685 g015
Table 1. Parameters considered in Section 3.2.1.
T/hD/hB/hs1/hs2/h
0.25120.60.50.2, 0.25, 0.3, 0.35, 0.4

