Article

An Agent-Based Model for Zip-Code Level Diffusion of Electric Vehicles and Electricity Consumption in New York City

Department of Systems Science and Industrial Engineering, Binghamton University, Binghamton, NY 13902, USA
*
Author to whom correspondence should be addressed.
Energies 2018, 11(3), 640; https://doi.org/10.3390/en11030640
Submission received: 15 February 2018 / Revised: 9 March 2018 / Accepted: 11 March 2018 / Published: 13 March 2018

Abstract

:
Current power grids in many countries are not fully prepared for high electric vehicle (EV) penetration, and there is evidence that the construction of additional grid capacity is constantly outpaced by EV diffusion. If this situation continues, then it will compromise grid reliability and cause problems such as system overload, voltage and frequency fluctuations, and power losses. This is especially true for densely populated areas where the grid capacity is already strained with existing old infrastructure. The objective of this research is to identify the zip-code level electricity consumption that is associated with large-scale EV adoption in New York City, one of the most densely populated areas in the United States (U.S.). We fuse the Fisher and Pry diffusion model and Rogers model within the agent-based simulation to forecast zip-code level EV diffusion and the required energy capacity to satisfy the charging demand. The research outcomes will assist policy makers and grid operators in making better planning decisions on the locations and timing of investments during the transition to smarter grids and greener transportation.

1. Introduction

Electric Vehicles (EVs) consist of Battery Electric Vehicles (BEVs) and Plug-in Hybrid Electric Vehicles (PHEVs), and both are required to be charged from the power grids [1,2,3]. The overall sales of EVs have been steadily rising [4]. The worldwide sales of EVs have passed the one-million milestone in 2015, as shown in Figure 1 [4,5]. As EV sales boom, the market share of EVs is also increasing, and the energy consumption of the transportation sector is gradually shifting from fossil fuels to electricity. However, the current power grids in many countries are not fully prepared for high EV penetration, and the construction of additional grid capacity is constantly outpaced by EV diffusion [6,7,8,9]. If this situation continues, it will compromise grid reliability and cause problems, such as voltage and frequency fluctuations and power losses [10,11,12]. This is especially true for densely populated areas, as shown in Figure 2 [13,14], where the grid capacity is already strained with the existing infrastructure. For example, a recent study showed that charging EVs in households of San Francisco could potentially triple the peak load [15].
In order to estimate the overload risks, some researchers have characterized the diffusion of EVs at the national level. However, the national level estimation may greatly underestimate these risks because it does not take into account local heterogeneity. The sales of EVs and the expected additional load are usually unevenly distributed, and so are the needs for adding more grid capacity. As a result, the risks are expected to be higher for some areas than others [8,15], and a national average cannot accurately reflect the local situations, hence the need for more research that is able to offer useful local information for both planning and operation.
To address the abovementioned issues, this paper contributes to the literature by expanding the current knowledge base and establishing a new method to characterize the zip-code level electricity consumption associated with large-scale EV diffusion over the next several decades. We perform a case study using the proposed method on the 175 zip codes in New York City (NYC), one of the most densely populated areas in the U.S.A. We fuse Roger’s [16] as well as Fisher and Pry’s [17] diffusion models with the agent-based simulation to forecast zip-code level EV diffusion and the required energy capacity to satisfy the charging demand.
The diffusion model reflects the process of how a new technology or product gets adopted among a group of people who interact with each other. It describes the exemplary effects of current adopters’ behaviors on potential adopters [18]. The effects can be caused by word-of-mouth or just seeing the product in the neighborhood. More recent studies of diffusion patterns have drawn great attention in social science (e.g., socioeconomics) and management science (e.g., marketing) [19,20]. This research is based on and will advance the tradition methods.
A key step of building the diffusion model is to estimate the innovation and imitation parameters that jointly determine the cumulative adoption over time. Agent-based modeling (ABM) will be used to estimate these parameters at the zip-code level. We see each zip code as an agent that is characterized by different properties. Agent-based modeling has proven capability of simulating the dynamic interactions among discrete agents in a social network [21,22,23,24,25,26,27,28]. We will observe the diffusion progress resulted from the dynamic and interactive behaviors of agents.
The model will use geocoding data of NYC to display the spatial results. Previous studies have already emphasized the importance of the geographic information system (GIS) data for studies related to energy and society [29]. Our research highlights the geographical interest of the pattern recognition and calibrates the computational approach for modeling the overload risks.
The proposed research will become one of the fundamental building blocks of the future research on EV integration in smart grids, which aims to improve the quality, reliability, and sustainability of power systems, while satisfying the needs of all the participants. The research outcomes will assist policy makers and grid operators in making better planning decisions on the locations and timing of investments during the transition to smarter grids and greener transportation. The issue of grid overload that is associated with large-scale EV adoptions is indeed a common problem for many populous cities. The case study of NYC can be customized in the future for data of other areas.
The rest of the paper is organized as follows: First, an introduction to the innovation diffusion theories and a brief literature on agent-based modeling and its application in EV diffusion are reviewed. Then, data gathering, the methodologies, and the assumptions are explained. After that, the results and analysis are presented. Finally, the conclusions and future work are provided.

2. Innovation Diffusion Theories

According to Fisher and Pry [17], diffusion of innovation follows an S-curve pattern. The Fisher and Pry model is used for technologies that do not require significant behavioral changes. The innovation diffusion rate in Fisher and Pry’s model is given by:
f ( t ) = { 1 + t a n h   [ α ( t t 50 ) ] } / 2
where
  • f ( t ) : the rate of market growth by the new technology at a given time t;
  • α : the half of fractional growth in early years of diffusion; and
  • t 50 : the time taken to reach a 50% of market share.
Calculating t 50 depends on the starting time of the simulation ( t 0 ) and the whole planning horizon (T). Herein, t 50 is equal to t 0 + T / 2 .
Eising et al. [30] have applied Fisher and Pry’s model to a case study in the Netherlands to assess the EV diffusion using empirical data. The study helps to identify the potential places with higher risks regarding the required electricity demand. According to their study, recognizing patterns of EV adoption can provide insights about better planning on how to invest and consequently how to fulfill required power grid demand.
Rogers [16] has categorized potential consumers in five classes, as it is shown in Figure 3. It has a descending order of adoption: 2.5% innovators, 13.5% early adopters, 34% early majority, 34% late majority, and 16% laggards. In general, it is shown that innovators and early majority are among the consumers with higher income and higher social class in society. Rogers has indicated that early adopters influence later adopters in adoption decision through increasing the observability of the new technology. More consumers are willing to adopt the innovation if they see it in their nationhood. As mentioned in [31], spatial remoteness, for example in rural areas, lessens the observability of the innovation and leave negative influences in adoption decision. In contrast, urbanization, as studied by [32], is considered as a positive impact on the diffusion of PHEVs.
In this paper, Rogers’ innovation diffusion theory is used to define a threshold model to study consumers’ adoption behavior. We set a planning horizon of 34 years (2016–2050). This duration would be long enough to allow for us to observe the adoption pattern of several decades, any longer would make it hard to anticipate other factors which might be influential in the long run. Three different scenarios are defined to obtain a low, medium, and high penetration pattern, and their impacts are analyzed on power consumption over the defined planning horizon.

3. Agent-Based Modeling and Its Applications in EV Diffusion

Consumers’ behaviors while adopting EVs can be modeled using an agent-based modeling approach, which is known as a bottom-up simulation methodology [21]. ABM has its roots in Complex Adaptive Systems. It is a computational method that involves independent, self-organized, autonomous entities interacting with each other within an environment under defined rules [33]. This methodology is useful since it allows a micro-level simulation of simple agents that exhibit emergent behaviors, while leading to a subtle conclusion by aggregating individual behaviors of agents. ABM has many applications in a variety of fields of studies, such as economics, social sciences, ecology, biology, physics, etc. Recently, this methodology has been used to model innovation diffusion. In the field of vehicle technology adoption, there are some studies that used ABM to study the diffusion of EVs as well [21,34,35].
Eppstein et al. [23] have developed a spatial agent-based model to capture dynamic and nonlinear interactions of some influential factors in EVs market share. The model considers social and spatial consequences, such as threshold effects, heterogeneity, or similarity influences, besides the media effects. Cui et al. [36] have introduced a multi-agent based simulation network for demonstrating the spatial distribution of PHEV ownership in a neighborhood in a local region and assessing the effect of PHEVs’ charging load on a private electric distribution network. McCoy et al. [25] have proposed a threshold model for the adoption decision-making process of consumers. Agent-based modeling is used to study agents’ interactions in a micro-simulation perspective. Bale et al. [37] have studied the adoption of energy technologies in the domestic sector under the influence of social networks. A threshold approach is proposed for analyzing the behavior of agents in the social network, where the local authorities play the dominating role in the adoption of EVs. In another study by [38], an agent-based decision support system is proposed to distinguish various designs in residential EV ownership and to aid in decision making for the expansion of new charging infrastructures. Linder and Wirges [39] embedded the Bass model into an ABM to simulate the adoption of EVs among households of Stuttgart in 2020. Using available micro-data different adopter types are defined and simulated in various scenarios of spatial diffusion. Results indicate that EV adoption is more concentrated in urban areas where less spatial differences are apparent by 2020. Noori and Tatari [40] have built up the Electric Vehicle Regional Market Penetration tool to assist decision makers and transportation organizers to distinguish the future market share of EVs in the United States. An agent-based model is proposed using different preferences for consumers for different types of EVs.
This paper is inspired by a number of other studies in which agents are allowed to have a utility function in association with the adoption process. The focus is to identify the zip-code level electricity consumption associated with large-scale EV adoption in New York City, which is one of the most densely populated areas in the U.S. Considering the complexity of the problem, there are many uncertainties regarding the factors affecting the market share of EVs [41]. Herein, we are trying to verify the effect of word of mouth on consumer purchase behavior. To do this, we have integrated an agent-based framework with a threshold model to simulate the spatial distribution of EV adoption in a local populated area and assessed the impacts of EV charging load on the electric distribution grid. ABM is used to estimate the diffusion of EVs in each zip code when considering Fisher and Pry’s diffusion model and Rogers model. The threshold approach proposed by Eising et al. [30] will be integrated within the ABM.

4. Methodology

4.1. Data Gathering

We consider the case of NYC since it is one of the most densely populated cities and its electricity use is among the top in the U.S. Besides, it has the highest number of power outages [42]. However, the issue of power overload due to large-scale EV adoptions could be a potential problem for many other populated cities.
According to The Official Website of New York State [43], there are 175 zip codes in all the five boroughs of NYC. We consider each zip code as an agent, which has its own local characteristics. These spatial characteristics help us identify influential factors on EV adoption using multiple regression analysis. Based on the zip-code level data provided by [44], we have considered population (pop), population density (popd), housing units (hu), median home values (mhv), land area (la), water area (wa), occupied housing units (ohu), median household income (mhi), median age (ma), gender (gen), different races (i.e., white (rw), black or African American (rb), American Indian or Alaskan native (ra), Asian (ras), native Hawaiian & other pacific islander (rnh) and, other races (roth)), families (fam)/singles (sing), households with or without kids (nkid), housing occupancy (owner (own) or renter (rent)), employment status (full-time, part-time (wpop), or unemployed (unpop)), means of transportation (use of car, truck, or van (ctv) vs. public transportation (pubt)), and educational status (high education (he) vs. lower education (le)) in the regression model for all of the zip codes. Results indicate that influential factors in consumers’ adoption of EVs are the land area, the use of car/truck/van and, and the median home value. These factors are chosen based on the p-values. Multiple regression analysis is performed in R and the results are provided in Table 1.
Based on the report of Clark [45], there are 2787 EVs in NYC as of December 2016. Figure 4 shows the number of BEV and PHEV in the zip codes of each NYC borough ((a) through (e)). We combined the numbers of BEVs and PHEVs for each zip code to use as local observability at the beginning of the simulation.

4.2. Utility Function Formulation

Rogers [16] indicates that new technology adoption in a new environment is influenced by the degree of observability of the technology. Consumers are more inclined to adopt a new technology after they actually observe others using it around themselves. We assume EVs as a new technology when compared with fossil fuel powered vehicles [46]. Spatial remoteness or closeness will affect consumers’ choice of adoption [16]. Subsequently, in local diffusion of EVs, observability and word of mouth are influential factors. According to [25], there are studies that have defined a utility function for EV adoption. Herein, we defined a utility function based on word of mouth as an observability factor for each agent. It is characterized by three weighted elements. First, the influence of each zip code on itself. This means how each zip code affects its population on adoption of another EV. Second, how each zip code’s neighbors affect its adoption decision making. Third, how the whole NYC influences each zip code’s decision process. The idea of using a weighted utility function is inspired by [47]. The utility function is defined, as follows:
U i t = W 1 X i t + W 2 X i t + W 3 X i t
where
  • Uit: the utility value for zip code i at iteration t;
  • W 1 + W 2 + W 3 = 1 ; and,
  • Xit: the number of EVs for zip code i in each weight elements in each iteration.
In order to define neighbors of each zip code, we have defined a neighborhood radius. When considering the coordinates of zip codes, and based on different trials and errors, we have chosen 0.02 (decimal degrees—a unit that is being used in GIS to express latitude and longitude of geographic coordinates) as the neighborhood radius. Different weight values between 0 and 1 represent different importance of observability factors. The weight values are selected after some trials and errors considering other factors such as adoption threshold, reaching to an S curve shape, and the defined neighborhood radius. We have chosen 8.9, 1.01, and 0.09 as W1, W2, and W3 values, respectively, and they perform well in the proposed model. The Euclidian method is used to calculate the neighborhood distances. After calculating the utility for each zip code, they are ordered based on Rogers’ [16] adoption categories, which means that the higher the utility, the more likely they are to adopt a new EV.
As the input values, we use neighborhood characteristics to define an adoption threshold model. Also, current numbers of EVs in each zip code is used to define the utility function in the beginning of the simulation. Zip codes with zero EV are randomly assigned to the next iteration, with 1 EV as the beginning number. Then, Rogers’ model is applied to classify different adopters. After that, we estimate the number of EVs for each year (from 2016 to 2050). The EV values that were obtained from the simulation are used as the local adoption for each zip code. Afterwards, the required electricity consumption for each zip code is calculated.

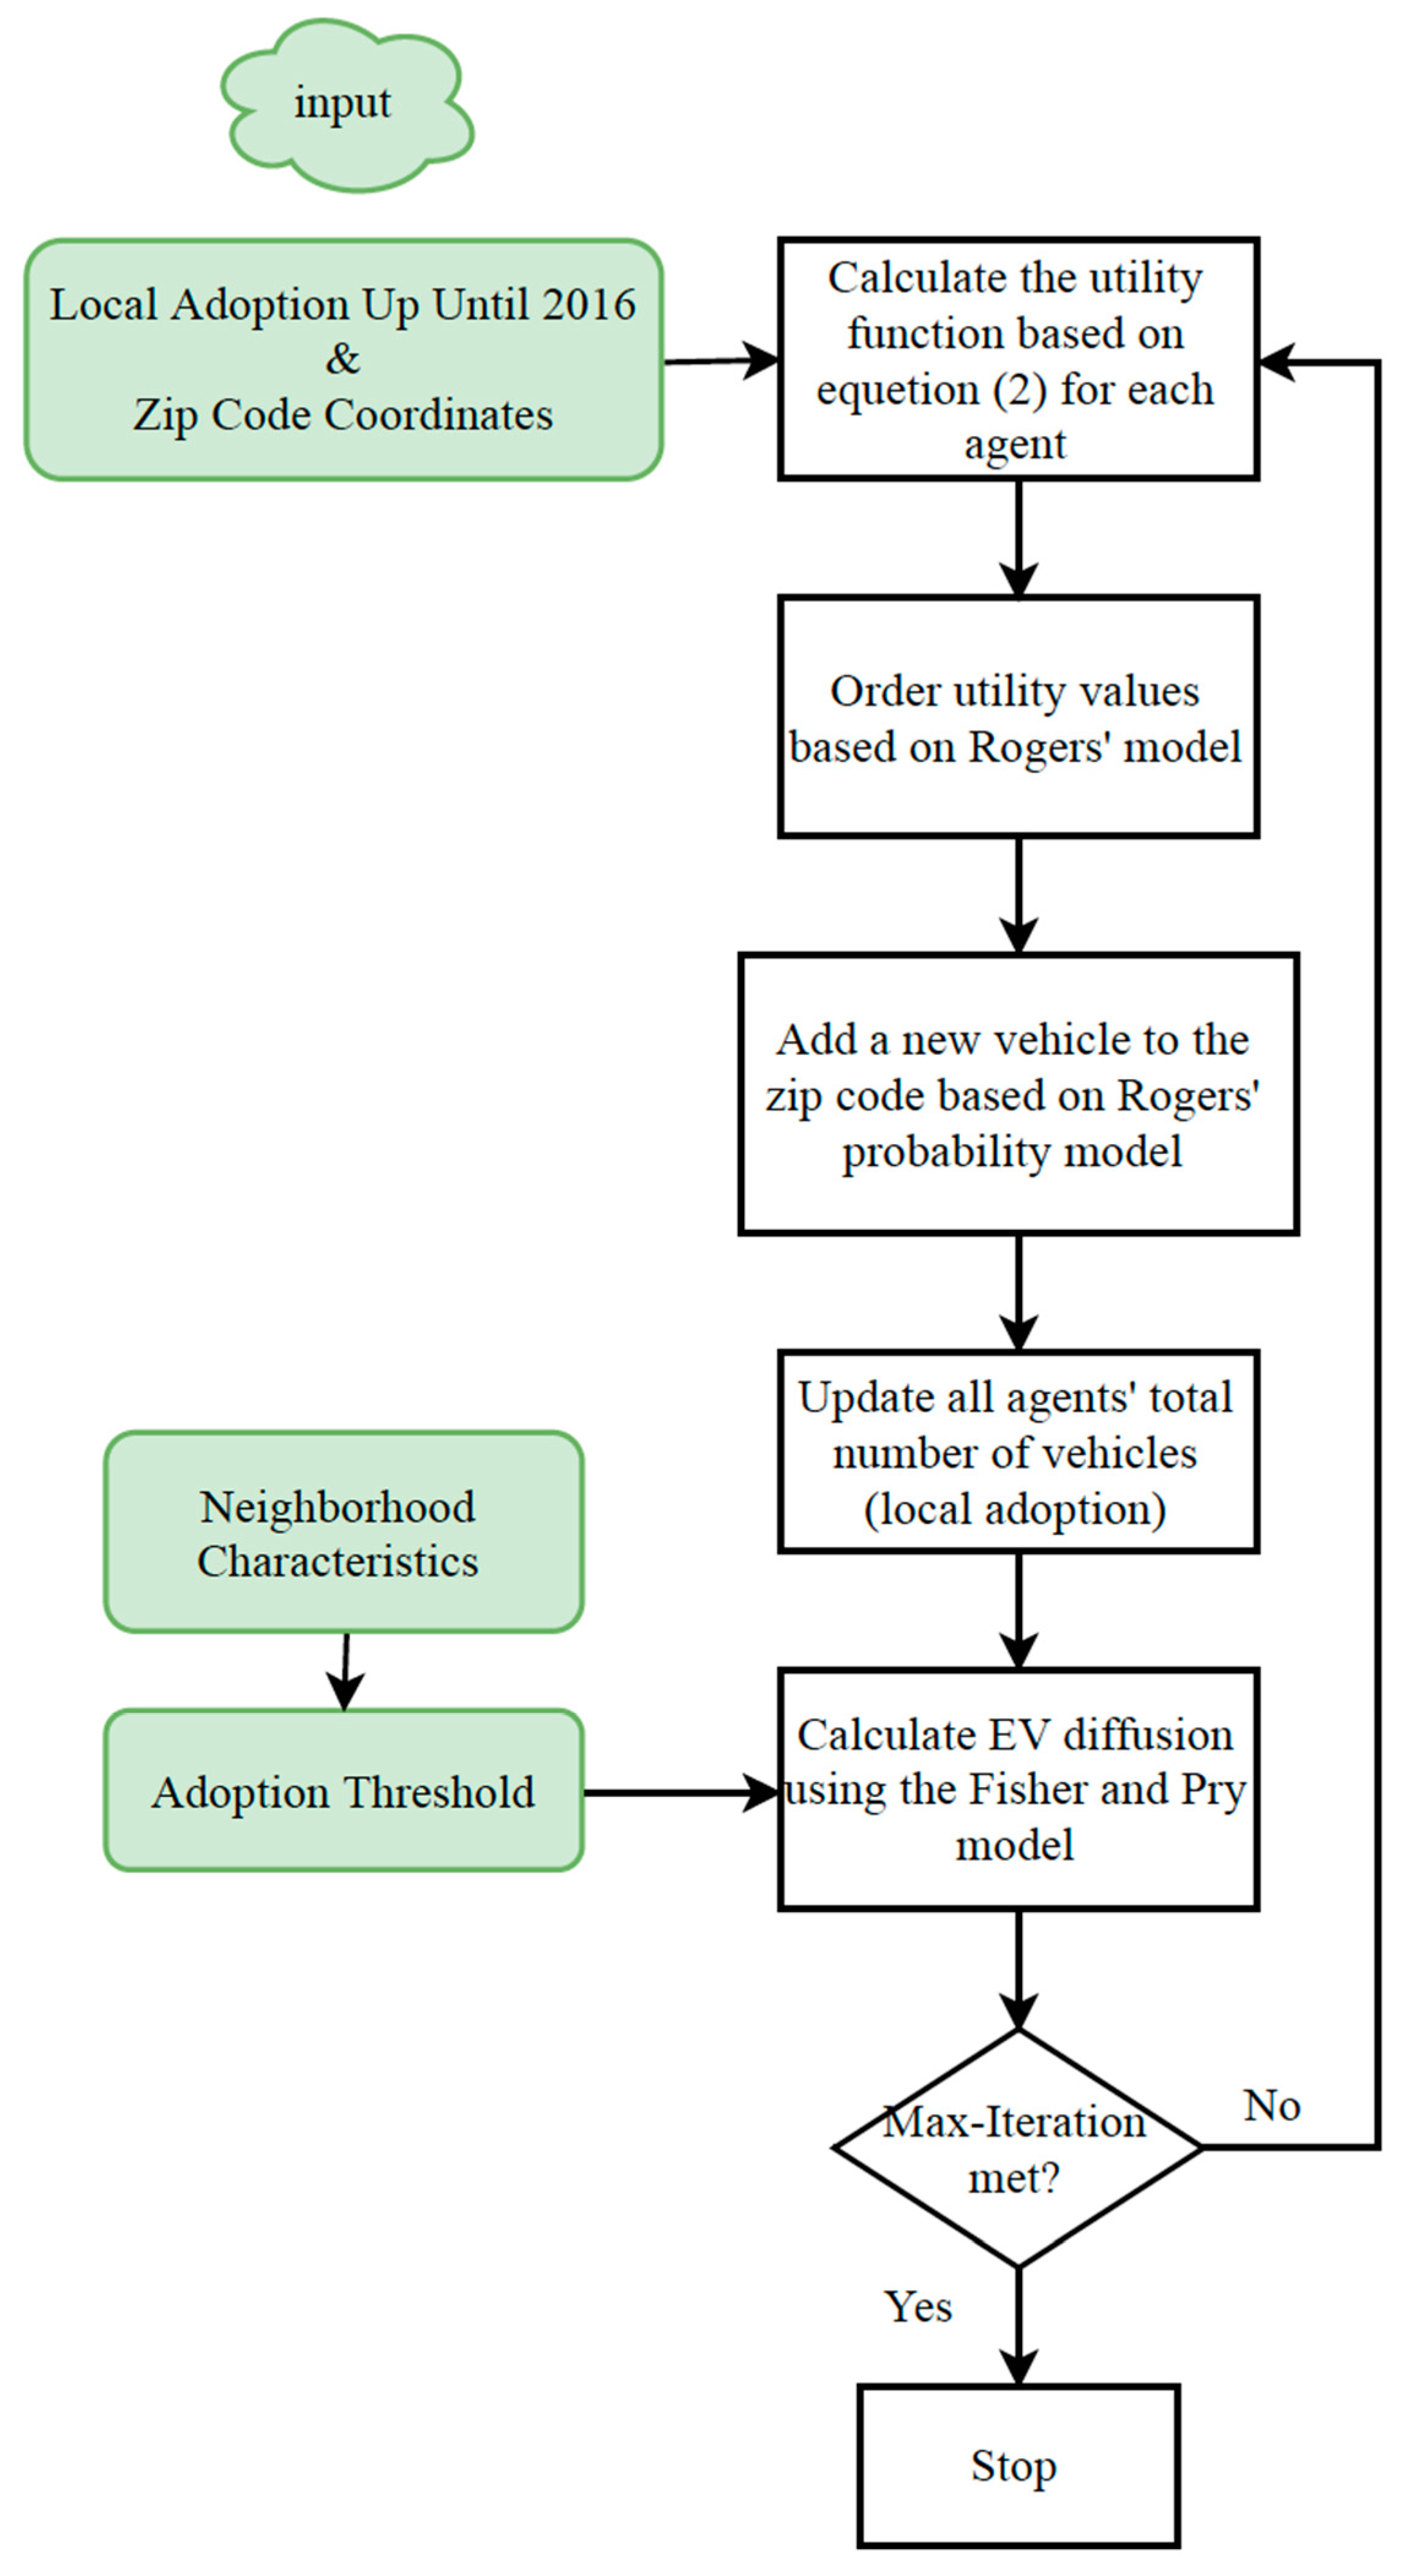
4.3. Agent-Based Approach
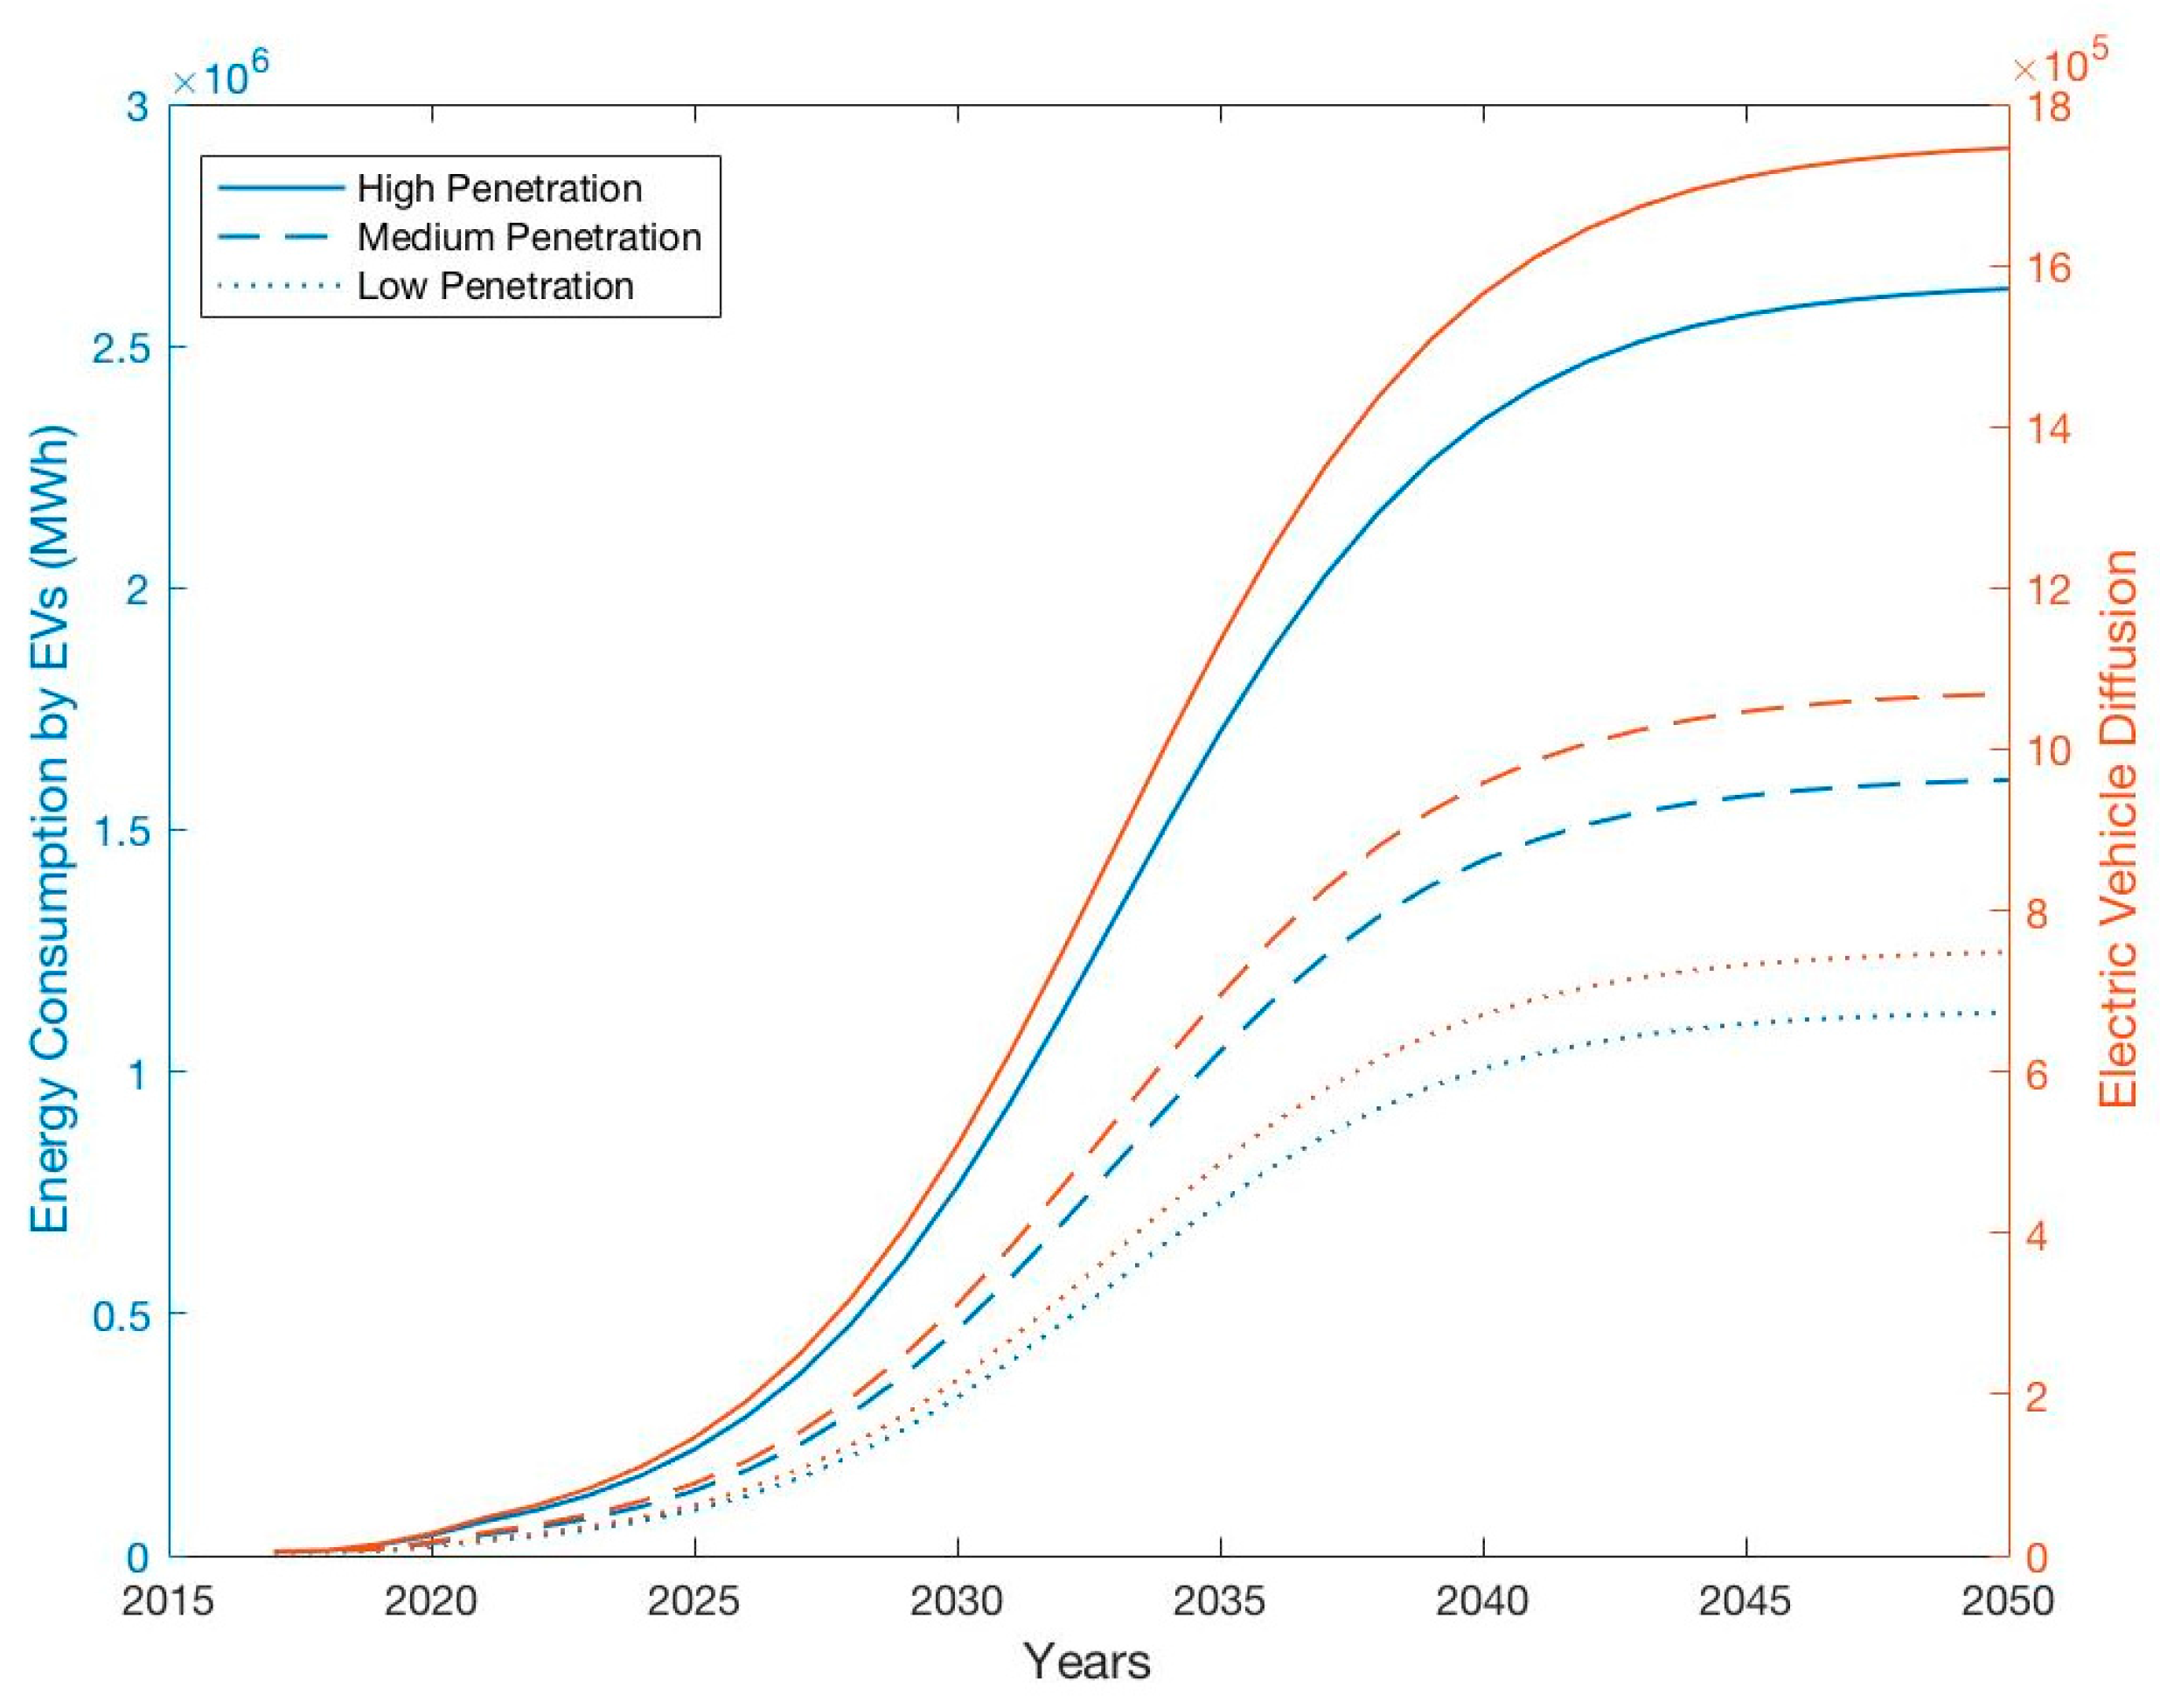
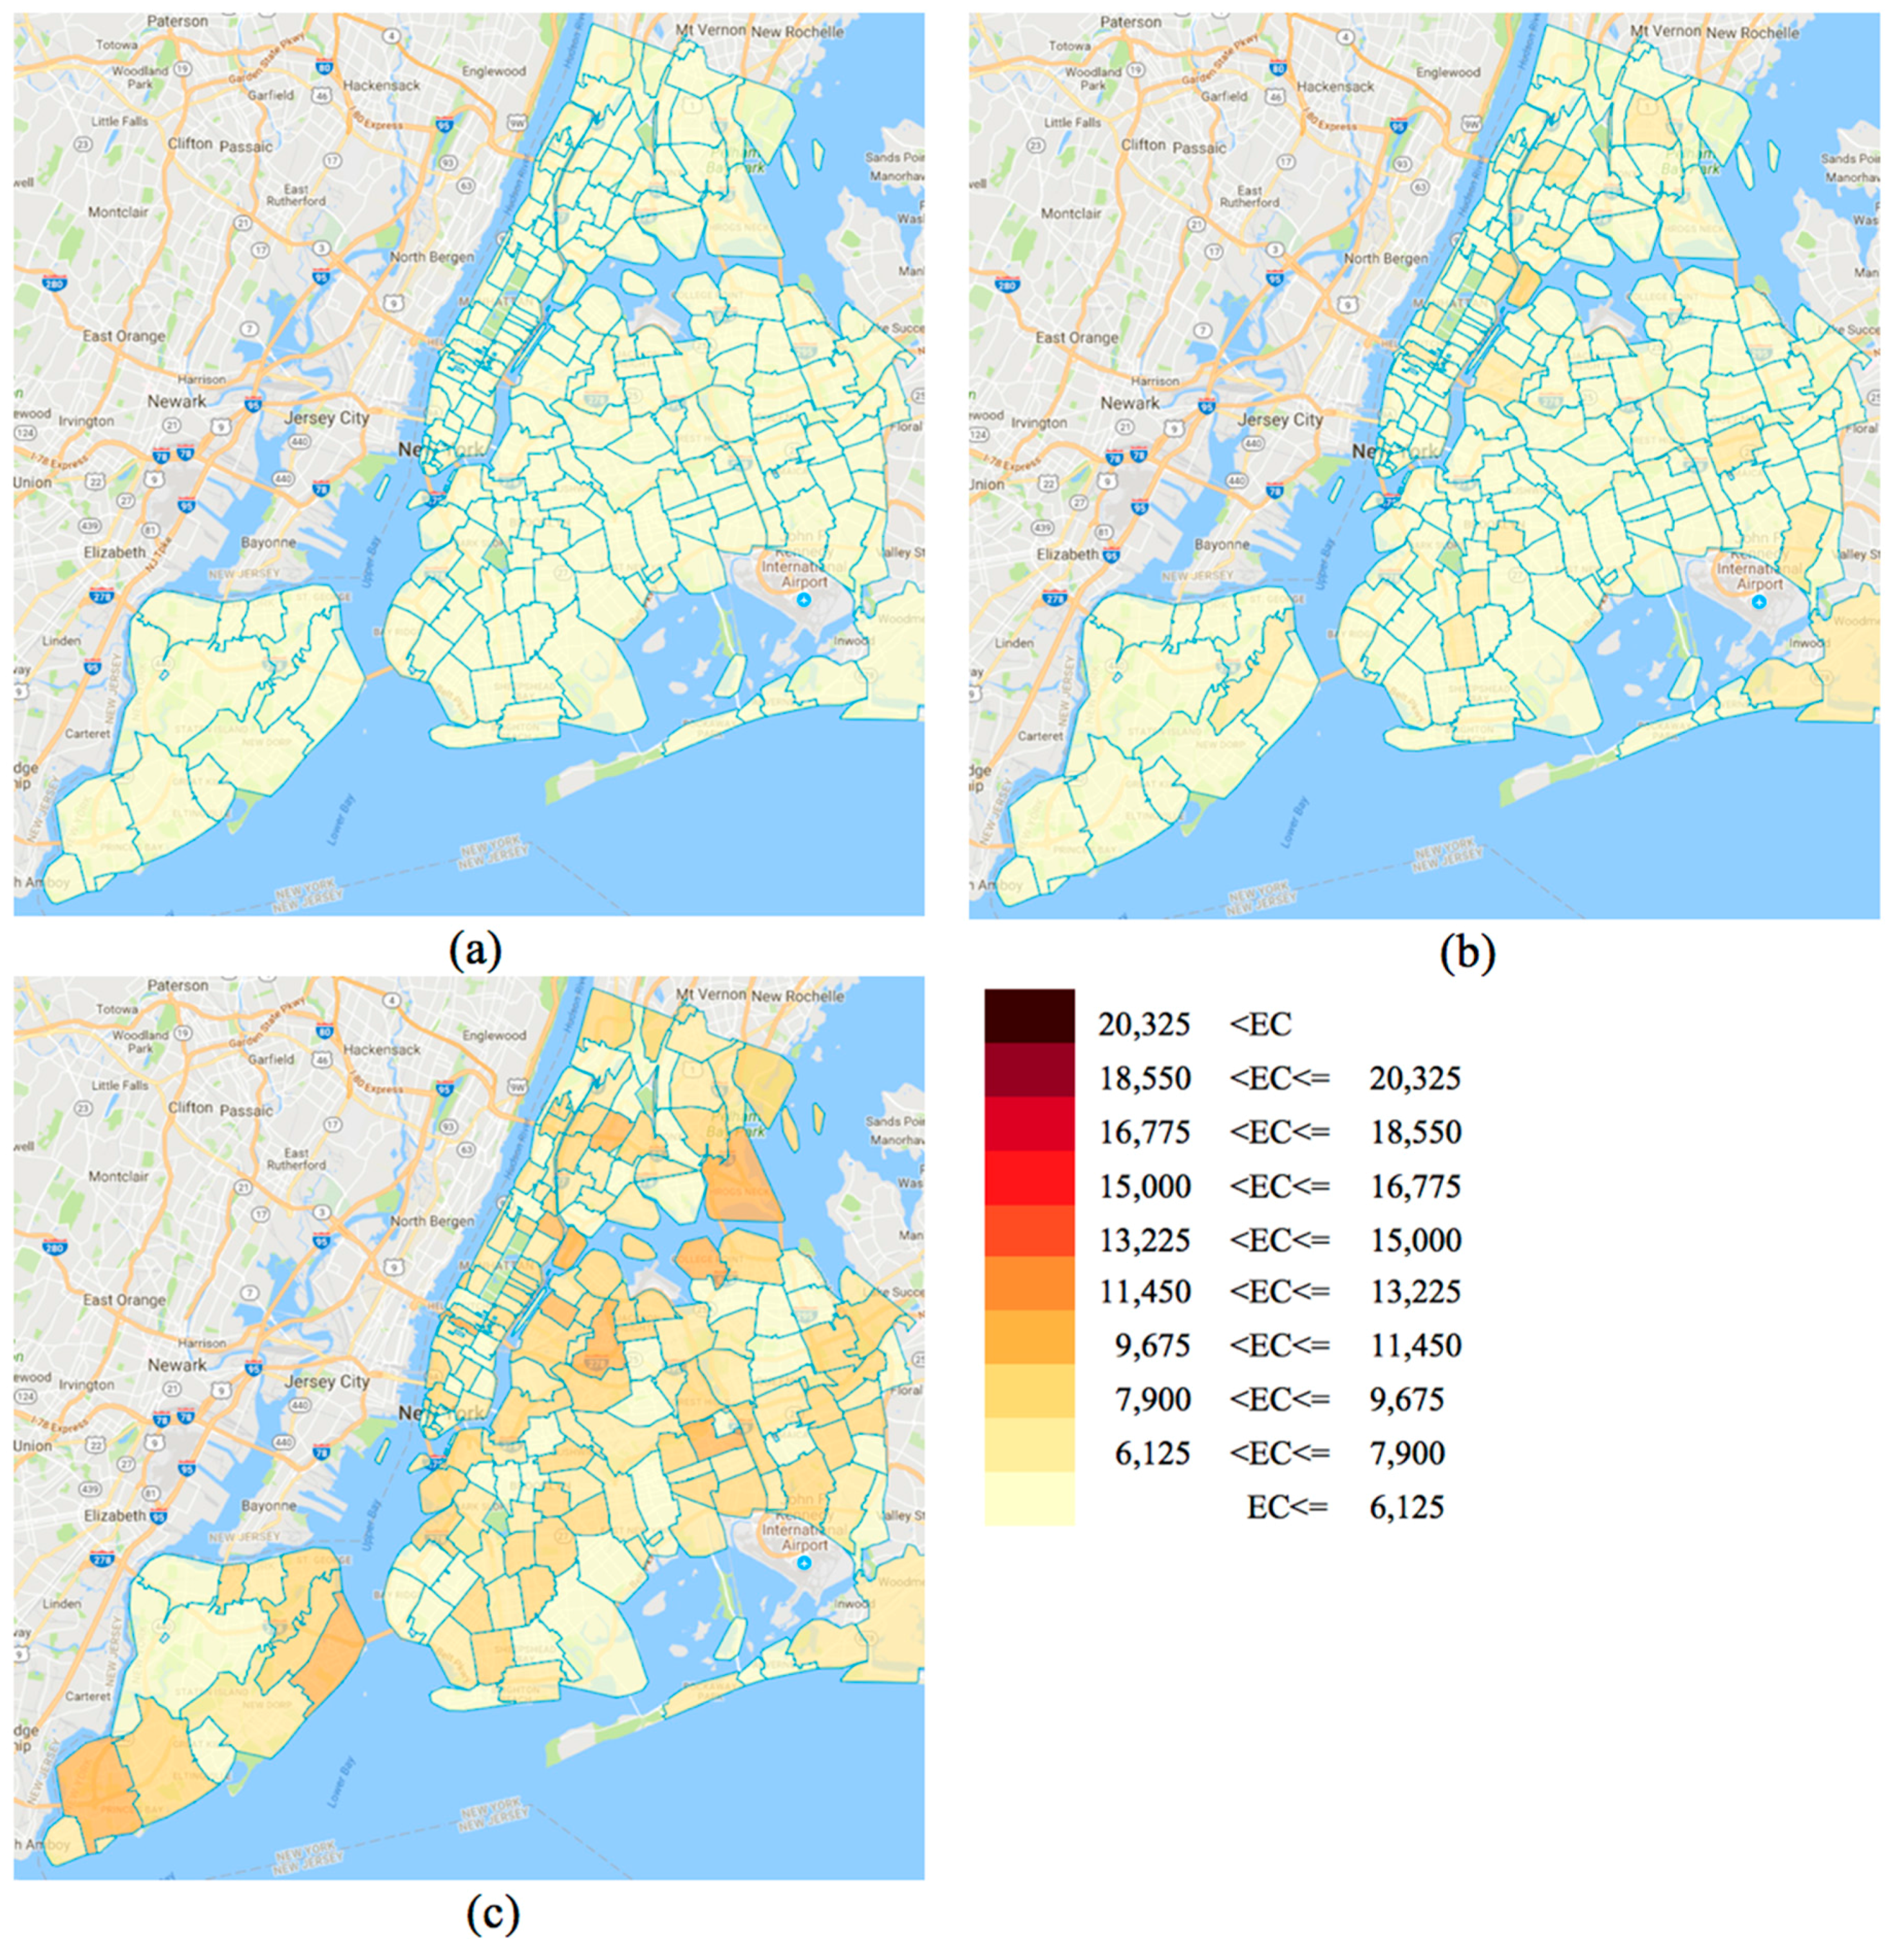
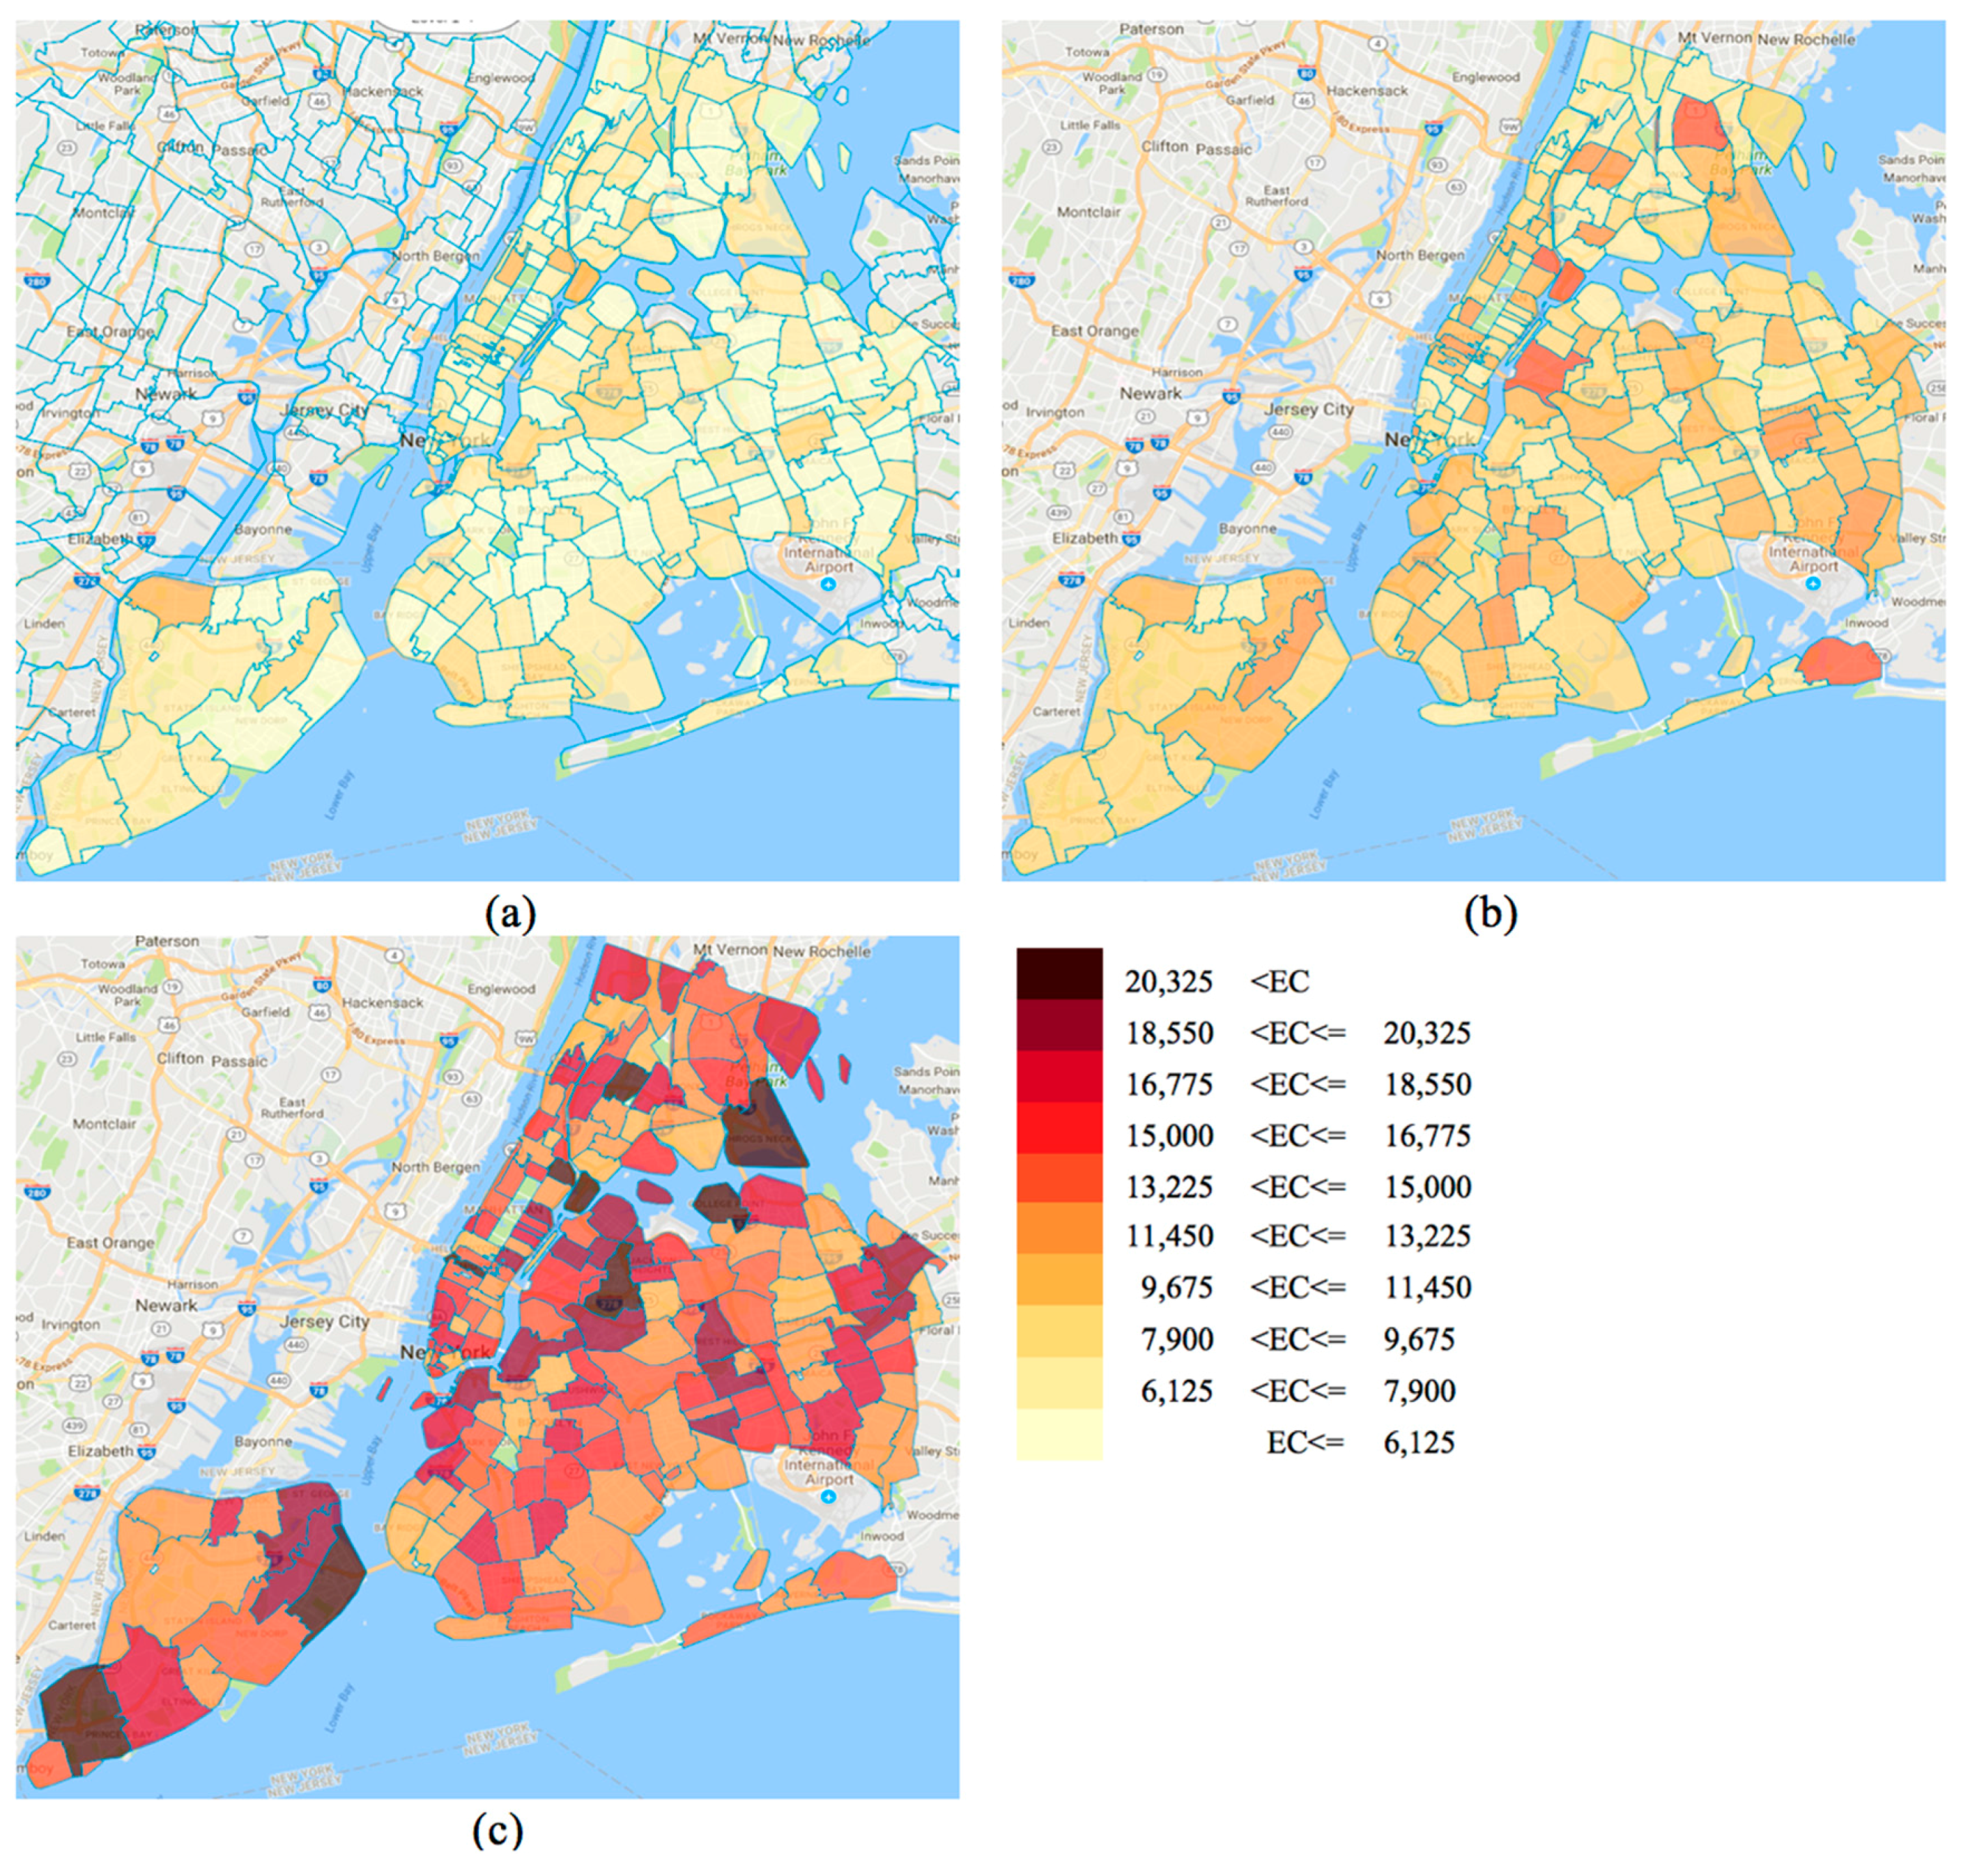
In this section, agents are defined and different assumptions are described. We consider each zip code as an agent with different spatial characteristics. Each agent has an adoption threshold that allows it to be recognized in different categories as defined by Rogers’ model. In addition, each agent has a utility value based on the adoption rate (observability of EVs). The utility increases as more agents adopt EVs. The observability effect could be from EVs in the zip code itself, from the zip code’s neighbors, and from the whole NYC. The utility is the weighted value of these three components, as described in Equation (2).
After calculating the utility values for each agent based on Equation (2) and putting the values in order, the values were then placed in Rogers’ distribution curve. Consumers adjust to each category and adopt a new vehicle based on the probabilities of the curve. The simulation is being continued until the maximum iteration is met. The maximum number is when the saturation is reached in 2050. Steps are described in the flowchart in Figure 5.
EV diffusion for each agent is calculated using Fisher and Pry’s model. Since this model provides the rate of the innovation diffusion, we use the following equation proposed by [30] to obtain an absolute number of EVs for each zip code.
D i f f u s i o n ( t ) = l o c a l   a d o p t i o n × { 1 + t a n h [ α ( t t 50 ) ] } / 2
According to Equation (3), the d i f f u s i o n in each year t is obtained based on the l o c a l   a d o p t i o n , α values, t , and t 50 . As we explained earlier in Equation (1), t 50 is equal to t 0 + T / 2 (which is 2017 + 34 / 2 = 2034 ), t a n h ( · ) is the hyperbolic tangent function. The l o c a l   a d o p t i o n in each zip code is obtained from the ABM results. The α value needs to be determined. The α value is the slope of the cumulative curve of EV diffusion over the years. We have defined an adoption threshold (at) for each zip code using the significant factors that were obtained from the multiple regression analysis. The coefficients of significant factors of median home values (a1), land area (a2), and use of car/truck/van (a3) we obtained in Section 3 are used here to define the threshold for each zip code using the following equation:
a t = 0.0000255 · a 1 + 7.86 · a 2 0.00261 · a 3 + 9.44
The obtained adoption thresholds follow a normal distribution that can be applied to the Rogers’ [16] model to define five different categories of adopters. Different values for each category have obtained from [30] with an average value equals to 0.2, as described in Table 2. Based on this assignment, fewer values are given to the innovators and early-adopters when compared to other groups. That means, the cumulative S-curve is steeper for these agents. These zip codes are characterized by higher median home values, land area, and less use of other modes of transportation.
Three different scenarios (low, medium, and high) are defined based on different maximum adoption number of EVs in the simulation. The medium scenario is in line with a market share of 30% of car fleet when considering NYC population growth. Low and high penetrations of EVs are considered as other scenarios so that we are able to analyze other possibilities. In each run, all of the agents will be updated and the total number of EVs is enumerated to update the whole population and to rerun the simulation. The simulation is run until the planning horizon timeline is met.

5. Results

In this section, the outcome of the simulation is used to estimate electricity consumption by EVs in each zip code. It is shown that under the low, medium, and high penetration scenarios, the cumulative number of EVs in 2035 is equal to 485,992, 694,275, and 1,133,982, respectively. These values in 2050 are 748,150, 1,068,785, and 1,745,681, respectively. The gradually increasing trends of EVs and the associated energy consumption over years are illustrated in Figure 6. This figure is the cumulative result of all the 175 zip codes of the NYC. For each zip code, the diffusion curves have similar shapes as those shown in Figure 6, but with much smaller magnitudes.
The average electricity consumption by each EV is approximately 1.5 MWh per year [48]. Thereby, by multiplying this value by the number of EVs, the estimated energy consumption by EVs is calculated. The zip-code level distribution of energy consumption in 2035 and 2050 are shown in Figure 7 and Figure 8, respectively. These figures illustrate ten levels of electricity consumption for all the 175 zip codes. Each figure shows the results of estimated electricity consumption with low, medium, and high EV penetrations.
For the cases of 2035 (i.e., Figure 7), in the low diffusion scenario, all the zip codes have less than 6125 MWh of energy consumption. In the medium diffusion scenario, all the zip codes have less than 8000 MWh of energy consumption. In the high diffusion scenario, all the zip codes have less than 11,300 MWh of energy consumption. Figure 6 shows that the cumulative energy consumption in 2035 in low, medium, and high EV diffusion scenario are 728,989 MWh, 1,041,412 MWh, and 1,700,974 MWh, respectively.
For the cases of 2050 (i.e., Figure 8), in the low diffusion scenario, all the zip codes have less than 10,287 MWh of energy consumption. In the medium diffusion scenario, all the zip codes have less than 14,503 MWh of energy consumption. In the high diffusion scenario, all the zip codes have less than 23,020 MWh of energy consumption. Figure 6 shows that the cumulative energy consumption in 2050 in low, medium, and high EV diffusion scenario are 1,119,368 MWh, 1,607,833 MWh, and 2,617,912 MWh, respectively. Such additional energy needs may put a burden on the exiting power system.
Table 3 provides the number of zip codes in different categories of energy consumption for each scenario in 2035 and 2050. In 2035, only in high penetration scenario there are some zip codes with energy consumption exceeding 9675 MWh. In 2050 low scenario, all of the zip codes have the energy consumption less than 15,000 MWh. Most of them have an energy consumption between 4350 MWh and 9675 MWh. In 2050 medium scenario, about 64% of zip codes have electricity consumption less than 9675 MWh. In 2050 high scenario, all zip codes have energy consumption higher than 9675 MWh, 43% of the zip codes have an electricity consumption higher than 15,000 MWh, and there are a few zip codes with energy consumption higher than 20,325 MWh.

6. Conclusions and Future Work

This paper identifies the zip-code level EV diffusion and the associated electricity consumption in New York City, U.S. The spatial distribution of energy can bring awareness about when and where electricity is needed to cover the increasing demand from EVs. The diffusion of EVs will affect the zip-code level grid infrastructure. The case study using the established model on NYC demonstrates that the energy consumption of EVs will have a substantial increase over the next few decades. Widespread use of EVs in populated areas like NYC requires a more established grid infrastructure with additional capacity. The results provide insights to grid administrators and decision-makers to animate the progress to secure energy and transportation systems. Results can be used for strategic planning regarding investment in grid infrastructure as well. The proposed research can serve as a fundamental building block of the future research on EVs integration in smart grids, which aim to improve the quality, reliability, and sustainability of power systems, while satisfying the needs of all the participants.
An extension of this work could be considering the supply-side and comparing two sides (supply and demand) to estimate overload risks while the number of EVs increases. Another effort to refine the established model could be to consider the street block level distribution of EVs over NYC or other populated areas. Insufficient data currently prevent us from performing a daily assessment of the diffusion model, and our results come up with an annual estimation of EV diffusion and accordingly the energy consumption. In the future, the block-level and daily estimation could potentially be applied to the framework to provide finer-grained insights.

Author Contributions

Yong Wang conceived the idea and provided financial support for this research. Azadeh Ahkamiraad and Yong Wang are both involved in model establishment, data collection, data analysis, and result interpretation. They drafted the article together. Both authors provided final approval of the version to be published.

Conflicts of Interest

The authors declare no conflict of interest.

References

  1. Daziano, R.A.; Chiew, E. Electric vehicles rising from the dead: Data needs for forecasting consumer response toward sustainable energy sources in personal transportation. Energy Policy 2012, 51, 876–894. [Google Scholar] [CrossRef]
  2. Nezamoddini, N.; Wang, Y. Risk management and participation planning of electric vehicles in smart grids for demand response. Energy 2016, 116, 836–850. [Google Scholar] [CrossRef]
  3. Rezvani, Z.; Jansson, J.; Bodin, J. Advances in consumer electric vehicle adoption research: A review and research agenda. Transp. Res. Part D Transp. Environ. 2015, 34, 122–136. [Google Scholar] [CrossRef]
  4. Lutsey, N. Global Milestone: The First Million Electric Vehicles. 2015. Available online: http://www.theicct.org/blogs/staff/global-milestone-first-million-electric-vehicles (accessed on 31 July 2017).
  5. Fazli Khalaf, A.; Wang, Y. Economic and environmental evaluations of dedicated and residential electric tariffs for plug-in electric vehicles. Int. J. Energy Res. 2018, 42, 542–558. [Google Scholar] [CrossRef]
  6. Brouwer, A.S.; Kuramochi, T.; van den Broek, M.; Faaij, A. Fulfilling the electricity demand of electric vehicles in the long term future: An evaluation of centralized and decentralized power supply systems. Appl. Energy 2013, 107, 33–51. [Google Scholar] [CrossRef]
  7. Clement-Nyns, K.; Haesen, E.; Driesen, J. The impact of vehicle-to-grid on the distribution grid. Electr. Power Syst. Res. 2011, 81, 185–192. [Google Scholar] [CrossRef]
  8. Mu, Y.; Wu, J.; Jenkins, N.; Jia, H.; Wang, C. A spatial–temporal model for grid impact analysis of plug-in electric vehicles. Appl. Energy 2014, 114, 456–465. [Google Scholar] [CrossRef]
  9. Römer, B.; Reichhart, P.; Kranz, J.; Picot, A. The role of smart metering and decentralized electricity storage for smart grids: The importance of positive externalities. Energy Policy 2012, 50, 486–495. [Google Scholar] [CrossRef]
  10. Arellano, B.; Sena, S.; Abdollahy, S.; Lavrova, O.; Stratton, S.; Hawkins, J. Analysis of electric vehicle impacts in New Mexico urban utility distribution infrastructure. In Proceedings of the Transportation Electrification Conference and Expo (ITEC), Detroit, MI, USA, 16–19 June 2013. [Google Scholar]
  11. Paevere, P.; Higgins, A.; Ren, Z.; Horn, M.; Grozev, G.; McNamara, C. Spatio-temporal modelling of electric vehicle charging demand and impacts on peak household electrical load. Sustain. Sci. 2014, 9, 61–76. [Google Scholar] [CrossRef]
  12. Yang, Z.; Li, K.; Foley, A. Computational scheduling methods for integrating plug-in electric vehicles with power systems: A review. Renew. Sustain. Energy Rev. 2015, 51, 396–416. [Google Scholar] [CrossRef]
  13. Schaal, E. The State of Electric Vehicle Charging. 2016. Available online: https://www.fleetcarma.com/electric-vehicle-charging-2016-maps/ (accessed on 27 June 2017).
  14. U.S. Department of Energy. Electric Vehicle Charging Station Locations. 2017. Available online: http://www.afdc.energy.gov/fuels/electricity_locations.html (accessed on 27 July 2017).
  15. Bullis, K. Could Electric Cars Threaten the Grid? MIT Technology Review. 2013. Available online: https://www.technologyreview.com/s/518066/could-electric-cars-threaten-the-grid/ (accessed on 28 June 2017).
  16. Rogers, E.M. Diffusion of Innovations; Free Press: New York, NY, USA, 2003. [Google Scholar]
  17. Fisher, J.C.; Pry, R.H. A simple substitution model of technological change. Technol. Forecast. Soc. Chang. 1971, 3, 75–88. [Google Scholar] [CrossRef]
  18. Bass, F.M. A new product growth for model consumer durables. Manag. Sci. 1969, 15, 215–227. [Google Scholar] [CrossRef]
  19. Hannisdahl, O.H.; Malvik, H.V.; Wensaas, G.B. The future is electric! The EV revolution in Norway—Explanations and lessons learned. In Proceedings of the IEEE 2013 World Electric Vehicle Symposium and Exhibition (EVS27), Barcelona, Spain, 17–20 November 2013; pp. 1–13. [Google Scholar]
  20. Schelly, C. Residential solar electricity adoption: What motivates, and what matters? A case study of early adopters. Energy Res. Soc. Sci. 2014, 2, 183–191. [Google Scholar] [CrossRef]
  21. Adepetu, A.; Keshav, S.; Arya, V. An agent-based electric vehicle ecosystem model: San Francisco case study. Transp. Policy 2016, 46, 109–122. [Google Scholar] [CrossRef]
  22. Bertotti, M.L.; Brunner, J.; Modanese, G. The Bass diffusion model on networks with correlations and inhomogeneous advertising. Chaos Solitons Fractals 2016, 90, 55–63. [Google Scholar] [CrossRef]
  23. Eppstein, M.J.; Grover, D.K.; Marshall, J.S.; Rizzo, D.M. An agent-based model to study market penetration of plug-in hybrid electric vehicles. Energy Policy 2011, 39, 3789–3802. [Google Scholar] [CrossRef]
  24. Lai, M.; Poltera, Y. Lecture with Computer Exercises: Modelling and Simulating Social Systems with Matlab; Technical Report; Swiss Federal Institute of Technology: Zurich, Switzerland, 2009; p. 27. [Google Scholar]
  25. McCoy, D.; Lyons, S. Consumer preferences and the influence of networks in electric vehicle diffusion: An agent-based micro simulation in Ireland. Energy Res. Soc. Sci. 2014, 3, 89–101. [Google Scholar] [CrossRef]
  26. Shin, J.K.; Sayama, H. Theoretical investigation on the Schelling’s critical neighborhood demand. Commun. Nonlinear Sci. Numer. Simul. 2014, 19, 1417–1423. [Google Scholar] [CrossRef]
  27. Silvia, C.; Krause, R.M. Assessing the impact of policy interventions on the adoption of plug-in electric vehicles: An agent-based model. Energy Policy 2016, 96, 105–118. [Google Scholar] [CrossRef]
  28. Wolf, I.; Schröder, T.; Neumann, J.; de Haan, G. Changing minds about electric cars: An empirically grounded agent-based modeling approach. Technol. Forecast. Soc. Chang. 2015, 94, 269–285. [Google Scholar] [CrossRef]
  29. Pasqualetti, M.J.; Brown, M.A. Ancient discipline, modern concern: Geographers in the field of energy and society. Energy Res. Soc. Sci. 2014, 1, 122–133. [Google Scholar] [CrossRef]
  30. Eising, J.W.; van Onna, T.; Alkemade, F. Towards smart grids: Identifying the risks that arise from the integration of energy and transport supply chains. Appl. Energy 2014, 123, 448–455. [Google Scholar] [CrossRef]
  31. Hagerstrand, T. Innovation Diffusion as a Spatial Process; University of Chicago Press: Chicago, IL, USA, 1967. [Google Scholar]
  32. Saarenpää, J.; Kolehmainen, M.; Niska, H. Geodemographic analysis and estimation of early plug-in hybrid electric vehicle adoption. Appl. Energy 2013, 107, 456–464. [Google Scholar] [CrossRef]
  33. Macal, C.M.; North, M.J. Tutorial on agent-based modelling and simulation. J. Simul. 2010, 4, 151–162. [Google Scholar] [CrossRef]
  34. Daina, N.; Sivakumar, A.; Polak, J.W. Modelling electric vehicles use: A survey on the methods. Renew. Sustain. Energy Rev. 2017, 68, 447–460. [Google Scholar] [CrossRef]
  35. Shafiei, E.; Thorkelsson, H.; Ásgeirsson, E.I.; Davidsdottir, B.; Raberto, M.; Stefansson, H. An agent-based modeling approach to predict the evolution of market share of electric vehicles: A case study from Iceland. Technol. Forecast. Soc. Chang. 2012, 79, 1638–1653. [Google Scholar] [CrossRef]
  36. Cui, X.; Liu, C.; Kim, H.K.; Kao, S.C.; Tuttle, M.A.; Bhaduri, B.L. A multi agent-based framework for simulating household PHEV distribution and electric distribution network impact. TRB Commit. Transp. Energy 2010, 1250, 21. [Google Scholar]
  37. Bale, C.S.; McCullen, N.J.; Foxon, T.J.; Rucklidge, A.M.; Gale, W.F. Harnessing social networks for promoting adoption of energy technologies in the domestic sector. Energy Policy 2013, 63, 833–844. [Google Scholar] [CrossRef]
  38. Sweda, T.; Klabjan, D. An agent-based decision support system for electric vehicle charging infrastructure deployment. Paper Presented at Vehicle Power and Propulsion Conference (VPPC), Chicago, IL, USA, 6–9 September 2011. [Google Scholar]
  39. Linder, S.; Wirges, J. Spatial Diffusion of Electric Vehicles in the German Metropolitan Region of Stuttgart; ERSA Conference Papers, No. ersa11p557; European Regional Science Association: Barcelona, Spain, 2011. [Google Scholar]
  40. Noori, M.; Tatari, O. Development of an agent-based model for regional market penetration projections of electric vehicles in the United States. Energy 2016, 96, 215–230. [Google Scholar] [CrossRef]
  41. Al-Alawi, B.M.; Bradley, T.H. Review of hybrid, plug-in hybrid, and electric vehicle market modeling studies. Renew. Sustain. Energy Rev. 2013, 21, 190–203. [Google Scholar] [CrossRef]
  42. New York State Energy Research & Development Authority (NYSERDA). 2012. Available online: https://www.nyserda.ny.gov/ (accessed on 11 October 2017).
  43. The Official Website of New York State. Welcome to the State of New York. 2017. Available online: https://www1.nyc.gov/assets/doh/downloads/pdf/data/appb.pdf (accessed on 18 July 2017).
  44. United States Zip Codes. U.S. ZIP Codes: Free ZIP Code Map and Zip Code Lookup. 2017. Available online: http://www.unitedstateszipcodes.org (accessed on 21 July 2017).
  45. Clark, S. Zonal States Overlapping Polys Tool. 2012. Available online: http://www.arcgis.com/home/item.html?id=b859b33c616a47d2b99b5e133942db02 (accessed on 12 June 2017).
  46. Massiani, J.; Gohs, A. The choice of Bass model coefficients to forecast diffusion for innovative products: An empirical investigation for new automotive technologies. Res. Transp. Econ. 2015, 50, 17–28. [Google Scholar] [CrossRef] [Green Version]
  47. Delre, S.A.; Jager, W.; Bijmolt, T.H.; Janssen, M.A. Will it spread or not? The effects of social influences and network topology on innovation diffusion. J. Prod. Innov. Manag. 2010, 27, 267–282. [Google Scholar] [CrossRef]
  48. Mesarić, P.; Krajcar, S. Home demand side management integrated with electric vehicles and renewable energy sources. Energy Build. 2015, 108, 1–9. [Google Scholar] [CrossRef]
Figure 1. Cumulative electric vehicle (EV) Sales.
Energies 11 00640 g001
Figure 2. Distribution of EV Chargers in the United States (U.S.)
Energies 11 00640 g002
Figure 3. The diffusion of innovation based on Rogers’ model. The curve shows consecutive group of adopters.
Energies 11 00640 g003
Figure 4. Zip-code level distribution of EVs for each borough of New York City (NYC) in 2016. (a) Bronx; (b) Brooklyn; (c) Manhattan; (d) Queens; and,(e) Staten Island.
Energies 11 00640 g004aEnergies 11 00640 g004bEnergies 11 00640 g004c
Figure 5. ABM flowchart of agents adopting EVs.
Energies 11 00640 g005
Figure 6. EV and energy consumption growth over years.
Energies 11 00640 g006
Figure 7. Electricity consumption (MWh) in 2035 in three different scenarios of EV penetration: (a) low; (b) medium; and, (c) high.
Energies 11 00640 g007
Figure 8. Electricity consumption (MWh) in 2050 in three different scenarios of EV penetration: (a) low; (b) medium; and, (c) high.
Energies 11 00640 g008
Table 1. Influential local-factors in EV adoption behavior.
ParameterEstimateStd. Errort ValuePr(>|t|)
(Intercept)9.4415.90.5940.553534
pop−97,4000.00546−0.1780.858661
popd−11,5000.0000817−1.4030.16267
hu0.003010.002771.0840.280251
mhv0.00002550.00001471.7380.008437
la7.862.163.6480.000367
wa−0.28423.5−1.2070.229384
ohu−2370.0177−1.340.182395
mhi−10,8000.0000841−1.2810.202055
ma−17.90.344−0.520.604067
gen0.004560.002911.5710.118294
rw−19600.00481−0.4080.684106
rb−12100.00487−0.2470.804964
ra−70000.0299−0.2340.815324
ras−12700.00486−0.2620.793924
rnh−14.80.11−1.3510.178874
roth0.0001230.004970.0250.980256
fam0.003140.004960.6340.526823
sing−78,5000.00354−0.2220.824763
nkid0.002340.003830.6110.541949
own0.02250.01661.3550.177377
rent0.02070.01651.2530.212281
wpop−14,4000.000871−0.1660.86873
unpop−40,8000.00115−0.3540.723624
ctv−26100.00144−1.8070.01287
pubt0.0003490.0009660.3620.718217
le−20000.00187−1.0650.288733
he−0.0017430.00256−0.6810.496768
Observation175
R-Square0.7553
Adj R-Sq0.6523
Table 2. α values obtained by adoption threshold using Rogers’ model.
Adopter Category (% of Total)Adoption Threshold Scoreα
Innovator (2.5%) 1.45 a t 0.1
Early-adopter (13.5%) 1.03 a t 1.45 0.15
Early-majority (34%) 0.47 a t 1.03 0.175
Late-majority (34%) 0.141 a t 0.47 0.225
Laggards (16%) a t < 0.141 0.25
Table 3. Number of zip codes in each scenario with energy consumption.
Annual EC (MWh)LowMediumHigh
2035
Zip Code
2050
Zip Code
2035
Zip Code
2050
Zip Code
2035
Zip Code
2050
Zip Code
#%#%#%#%#%#%
E C 9675 175100172981751001136416594
9675 < E C 15 , 000 32 62361069857
15 , 000 < E C 20 , 325 6939
20 , 325 < E C 84
Total175100175100175100175100175100175100

