Optimization of Phasor Measurement Unit (PMU) Placement in Supervisory Control and Data Acquisition (SCADA)-Based Power System for Better State-Estimation Performance


Abstract
:1. Introduction
2. Modified Weighted Least Square with Phasor Measurements
- The phasor measurements and the traditional measurements are taken at the same snapshot—there is no time skew between them.
- A PMU should be always available at the slack bus so that the reference angle of both measurements is the same.
- When a PMU is installed at a certain bus, it can read the bus voltage phasor in addition to all the branch current phasors connected to that bus and flowing away from that bus.
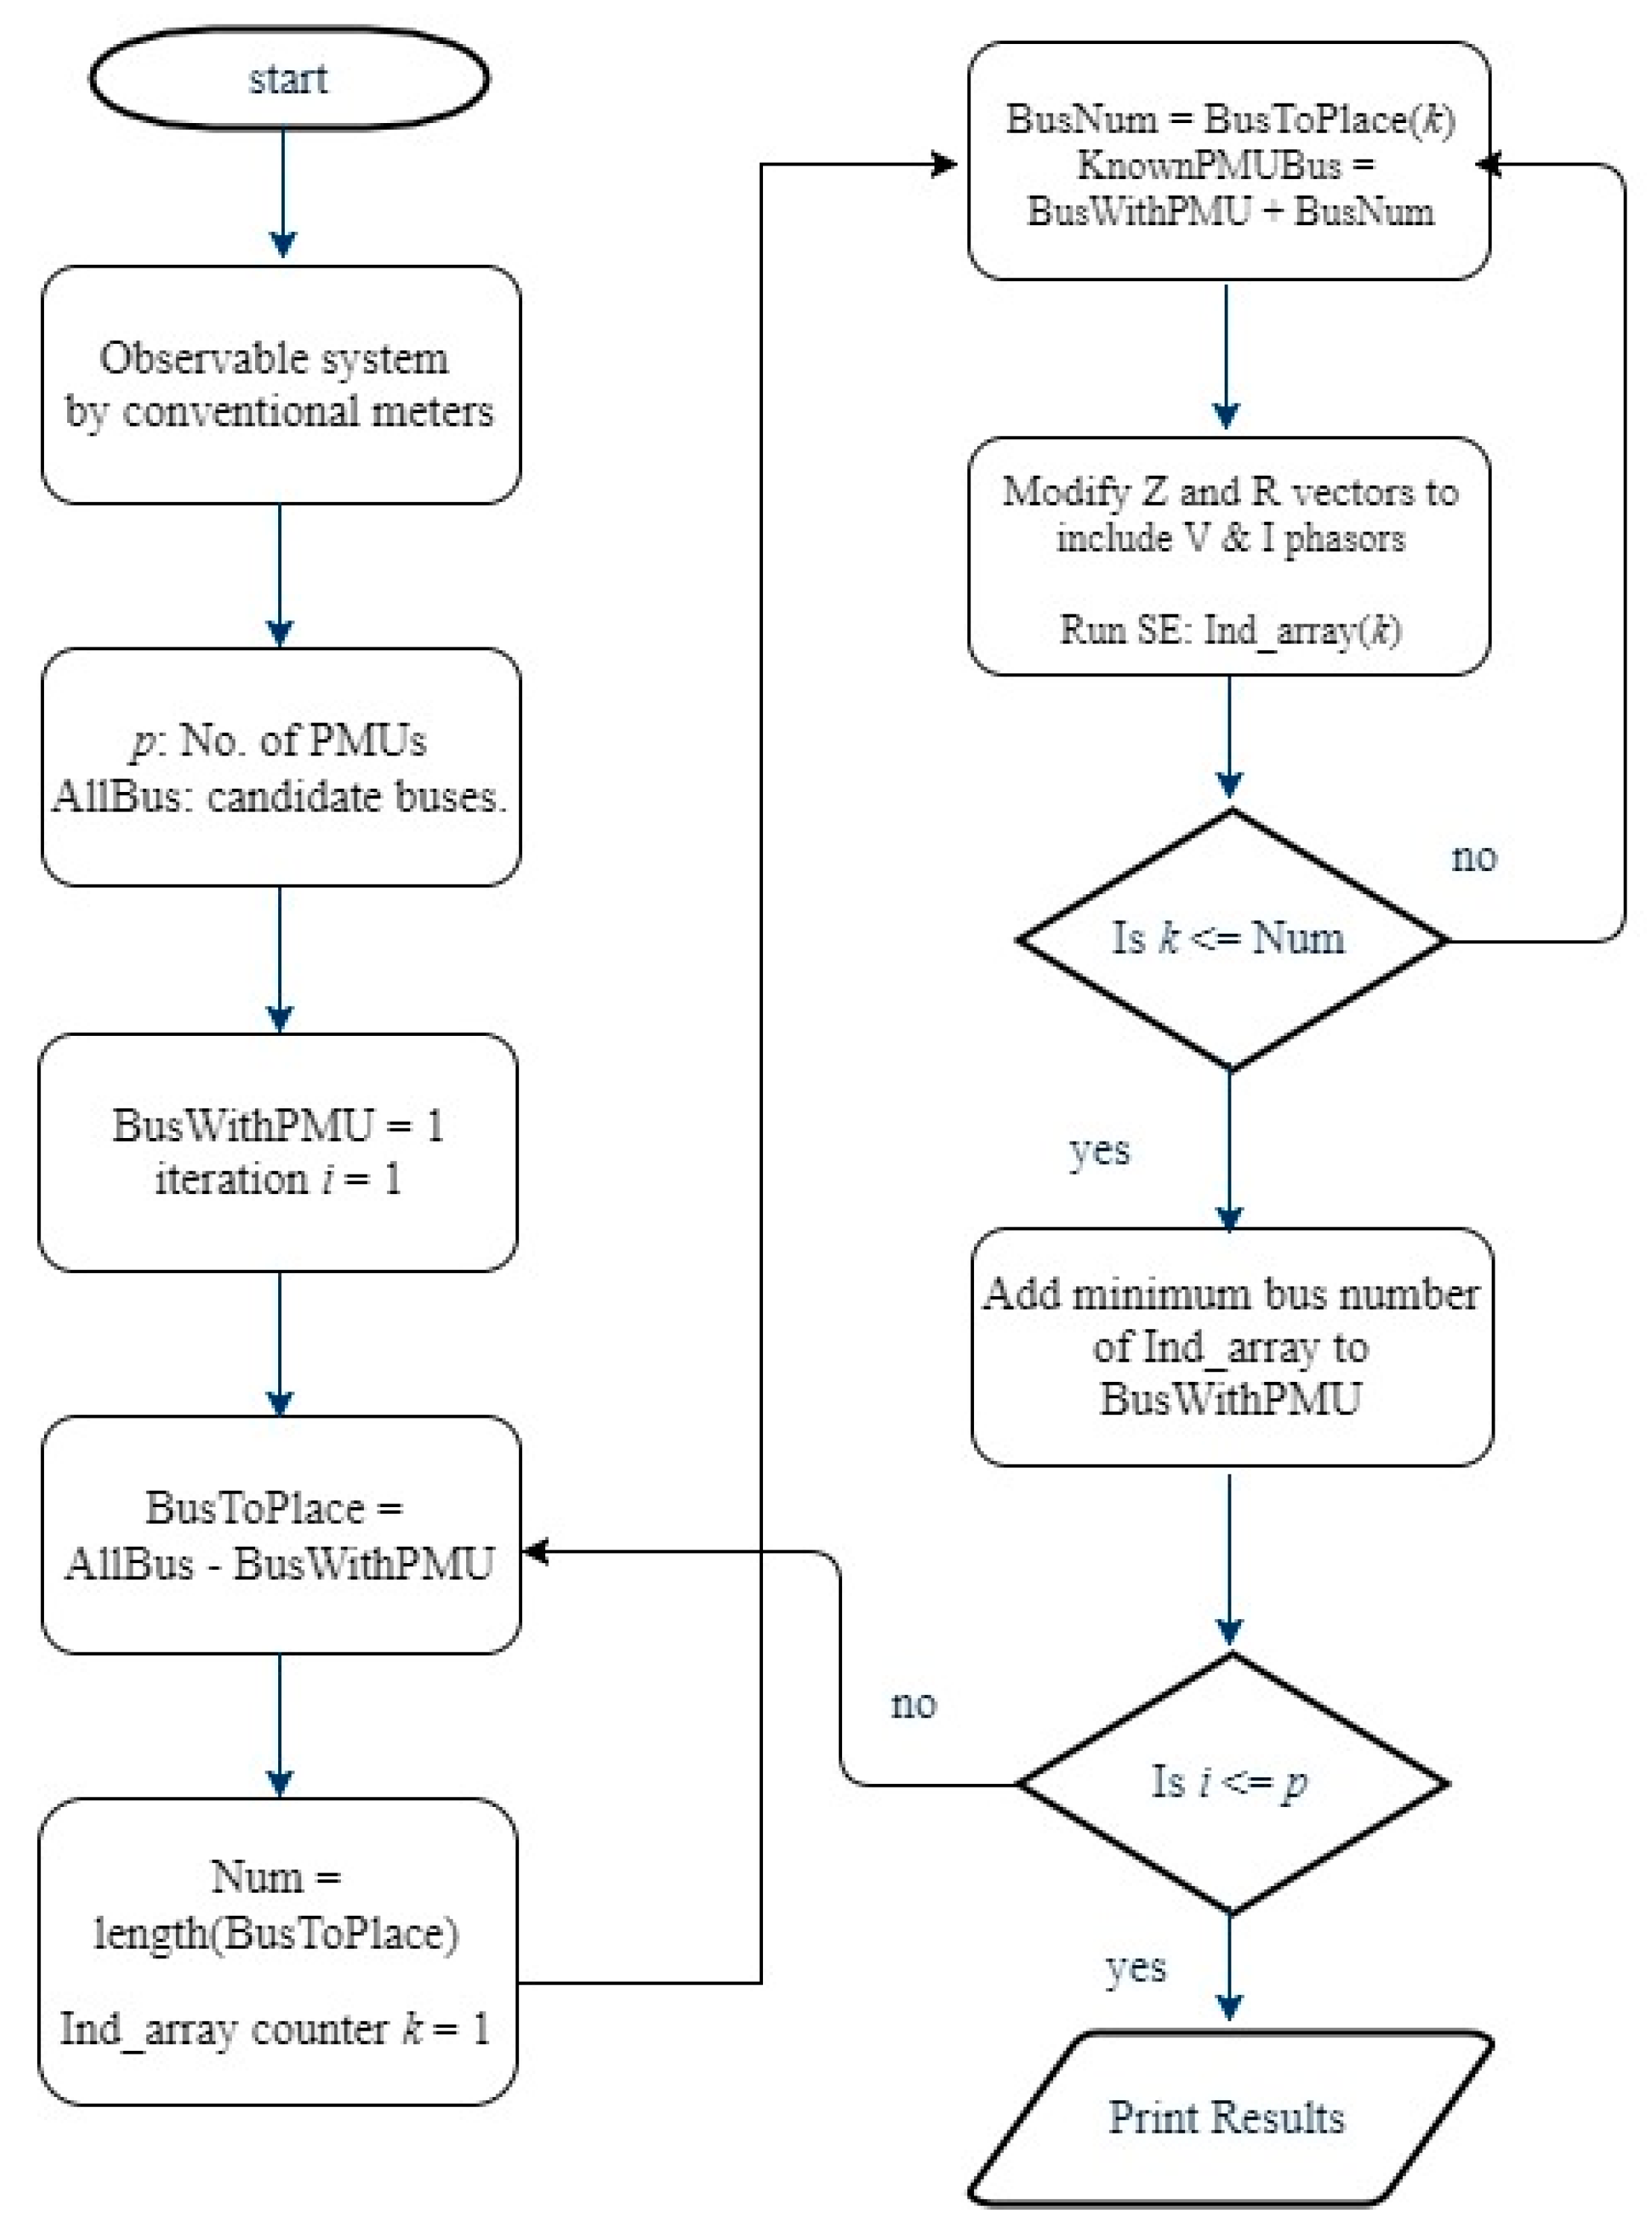
3. Heuristic Approach to Optimization
- z: the measurement vector with white noise;
- R: the vector of measurement error variance;
- p: number of PMUs required to be placed in the system;
- AllBus: contains all the numbers of candidate buses;
- BusWithPMU: includes the bus numbers which have been assigned a PMU;
- BusToPlace: the vector which includes the bus numbers that will be equipped with PMUs. It is acquired by eliminating BusWithPMU from AllBus;
- Num: the length of BusToPlace vector;
- BusNum: the parameter that includes the bus number that will be equipped with a PMU;
- KnownPMUBus: composed by merging BusWithPMU vector and BusNum variable;
- Ind_array: contains NCE values of state estimation.
4. Optimization with Genetic Algorithm
4.1. Problem Formulation of Optimal Phasor Measurement Unit (PMU) Placement:
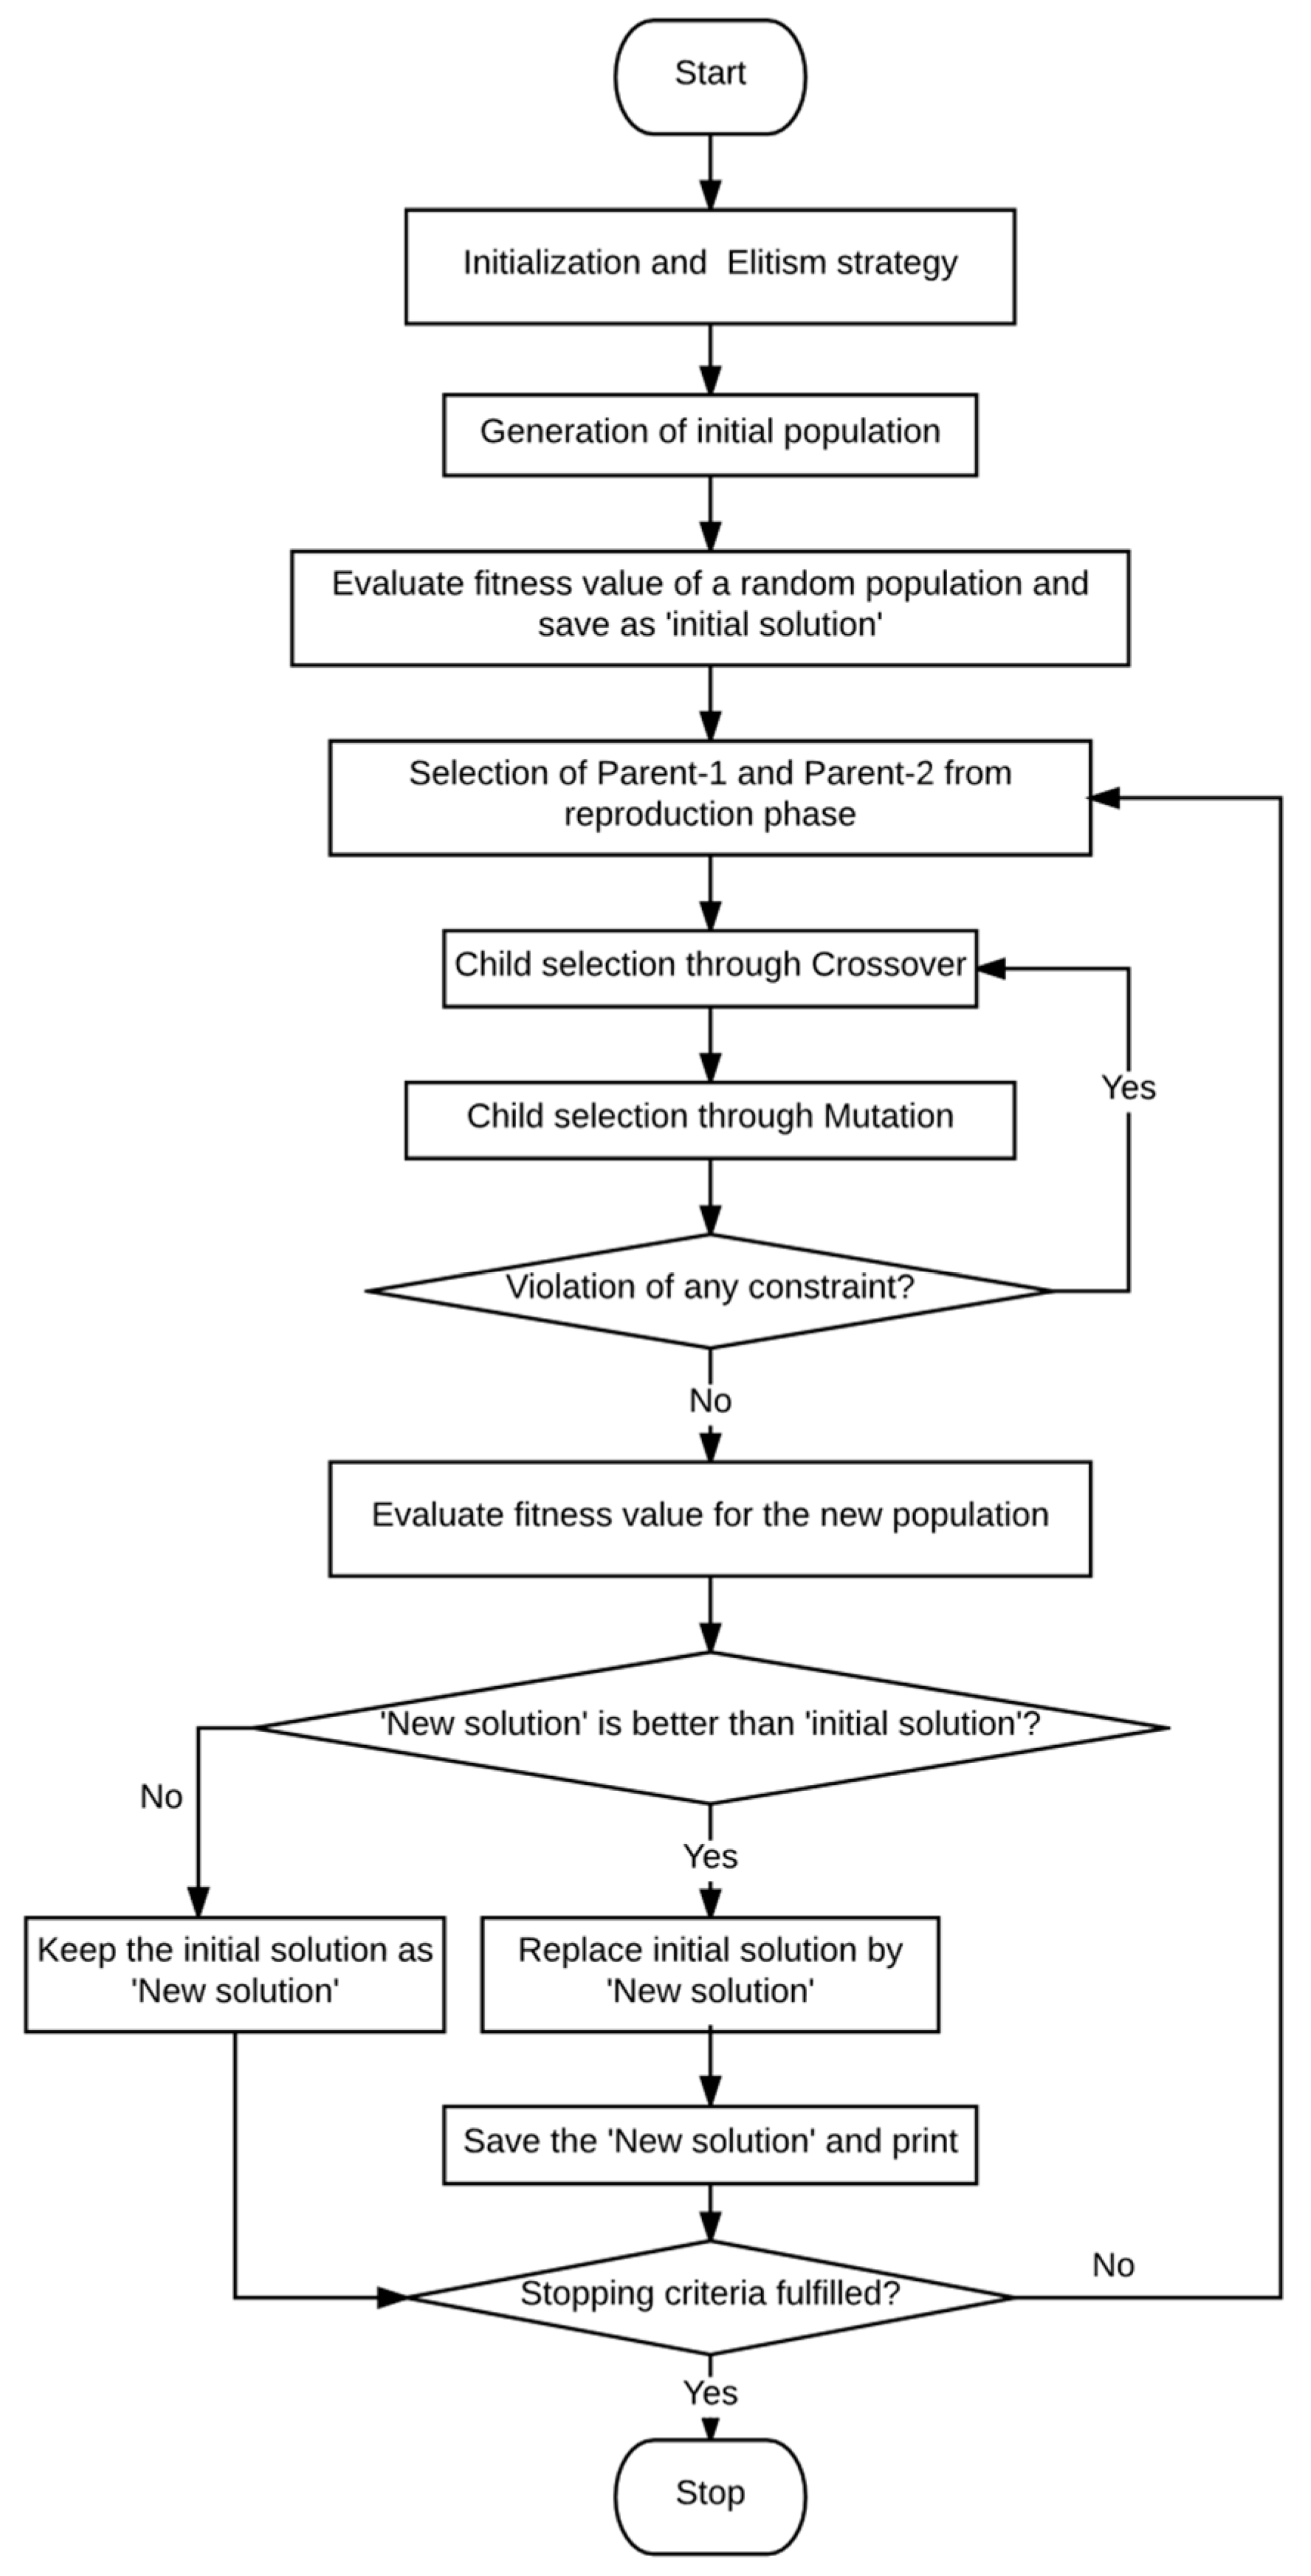
4.2. Basic Working Principle of the Binary Genetic Algorithm (BGA)
- Selection or reproduction: this phase generates the chromosomes or parents based on their fitness value. Error indicator of the state estimation is used as the fitness for this work. A lower indicator represents better chromosome or a PMU location set.
- Crossover: this creates the children or off-springs from the parents with the view that the child could be fitter than the parents. Off-springs are formed by taking the best characteristics from both parents based on a user-defined probability. Crossover could be done on a single or multiple point based on the size of the chromosomes.
- Mutation: this works on the off-springs, checking each bit individually to search for a better solution.
5. Test Case Preparation
6. Results
6.1. Comparison with Heuristic Approach
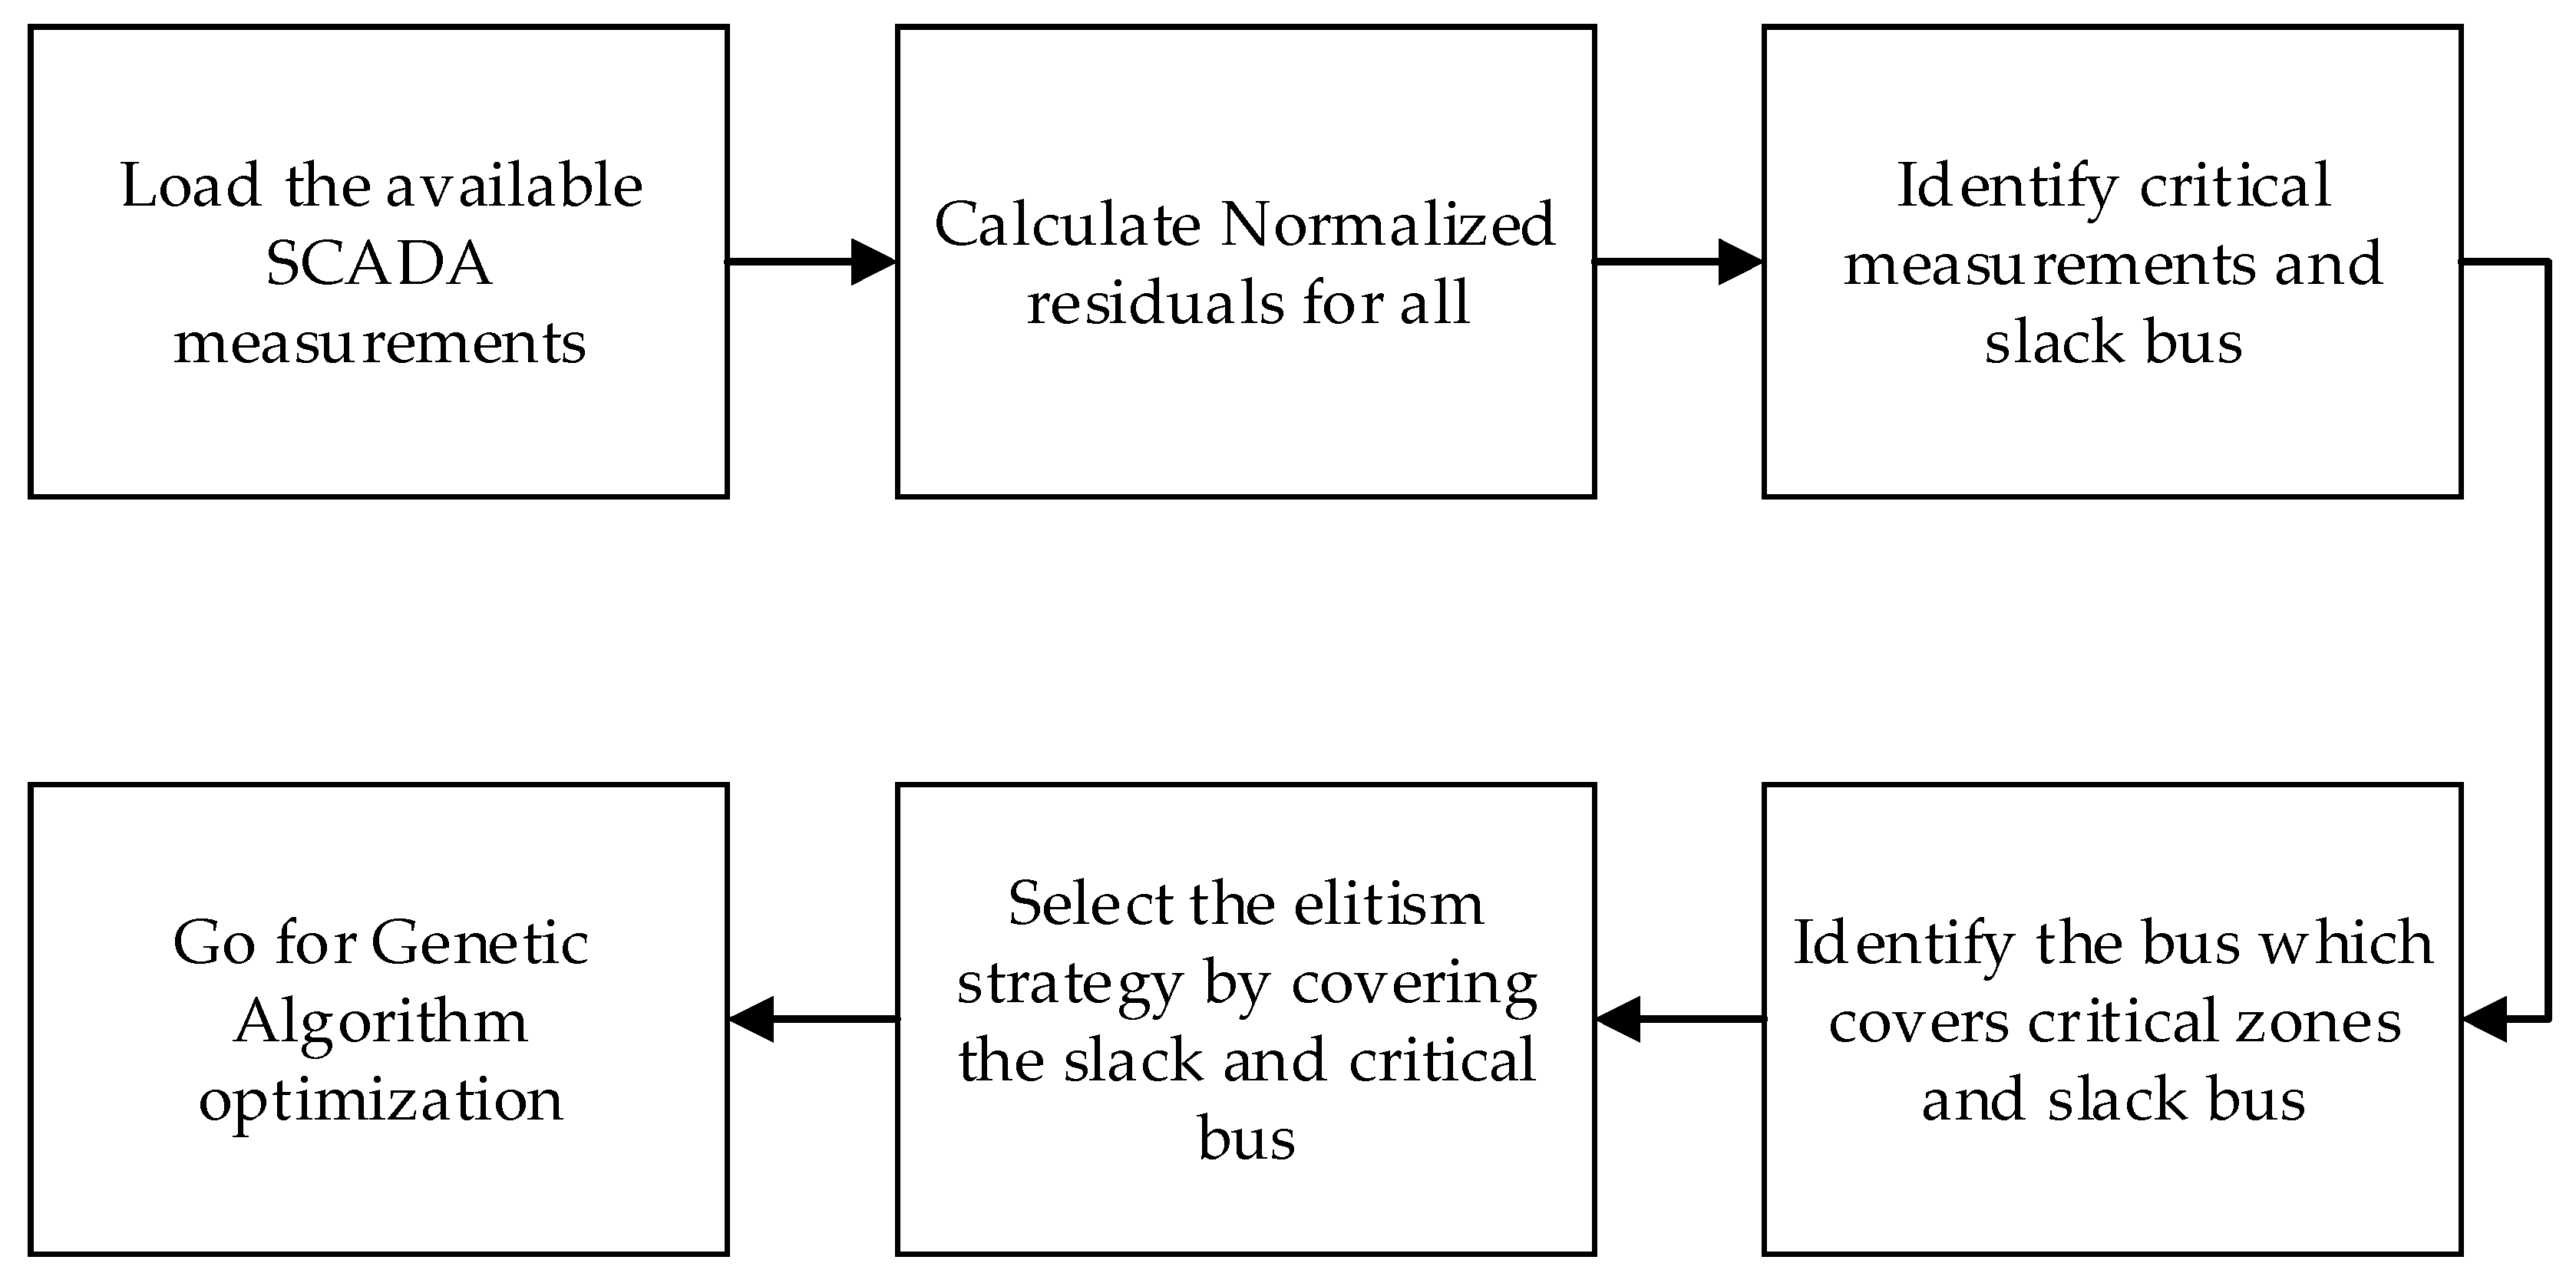
6.2. Optimal PMU Locations by Covering Critical Zones
6.3. Optimization when the Critical Zones are Non-Interacting
6.4. Significance of Covering Critical Locations
7. Conclusions
Acknowledgments
Author Contributions
Conflicts of Interest
References
- Hurtgen, M.; Maun, J.-C. Advantages of power system state estimation using Phasor Measurement Units. In Proceedings of the 16th Power Systems Computation Conference (PSCC), Glasgow, Scotland, UK, 14–18 July 2008; Curran Associates: Red Hook, NY, USA, 2010; pp. 1161–1167. [Google Scholar]
- Gómez-Expósito, A.; Abur, A.; Rousseaux, P.; Jaén, A.; Gómez-Quiles, C. On the Use of PMUs in Power System State Estimation. In Proceedings of the 17th Power Systems Computation Conference (PSCC), Stockholm, Sweden, 22–26 August 2011; Curran Associates: Red Hook, NY, USA, 2012; pp. 1080–1092. [Google Scholar]
- Manousakis, N.M.; Korres, G.N.; Georgilakis, P.S. Optimal placement of phasor measurement units: A literature review. In Proceedings of the 16th International Conference on Intelligent System Applications to Power Systems (ISAP), Hersonissos, Greece, 25–28 September 2011; IEEE: Piscataway, NJ, USA, 2011; pp. 1–6. [Google Scholar]
- More, K.K.; Jadhav, H.T. A literature review on optimal placement of phasor measurement units. In Proceedings of the International Conference on Power, Energy and Control (ICPEC), Dindigul, India, 6–8 February 2013; IEEE: Piscataway, NJ, USA, 2013; pp. 220–224. [Google Scholar]
- Nazari-Heris, M.; Mohammadi-Ivatloo, B. Application of heuristic algorithms to optimal PMU placement in electric power systems: An updated review. Renew. Sustain. Energy Rev. 2015, 50, 214–228. [Google Scholar] [CrossRef]
- Negash, K.; Khan, B.; Yohannes, E. Artificial Intelligence Versus Conventional Mathematical Techniques: A Review for Optimal Placement of Phasor Measurement Units. Technol. Econ. Smart Grids Sustain. Energy 2016, 1, 10. [Google Scholar] [CrossRef]
- Aminifar, F.; Fotuhi-Firuzabad, M.; Safdarian, A.; Davoudi, A.; Shahidehpour, M. Synchrophasor Measurement Technology in Power Systems: Panorama and State-of-the-Art. IEEE Access 2014, 2, 1607–1628. [Google Scholar] [CrossRef]
- Chakhchoukh, Y.; Vittal, V.; Heydt, G.T.; Ishii, H. LTS-Based Robust Hybrid SE Integrating Correlation. IEEE Trans. Power Syst. 2017, 32, 3127–3135. [Google Scholar] [CrossRef]
- Zivanovic, R.; Cairns, C. Implementation of PMU technology in state estimation: An overview. In Proceedings of the IEEE AFRICON 4th Conference in Africa, Stellenbosch, South Africa, 27 September 1996; IEEE: Piscataway, NJ, USA, 2002; pp. 1006–1011. [Google Scholar]
- Zhou, M.; Centeno, V.A.; Thorp, J.S.; Phadke, A.G. An Alternative for Including Phasor Measurements in State Estimators. IEEE Trans. Power Syst. 2006, 21, 1930–1937. [Google Scholar] [CrossRef]
- Nuqui, R.F.; Phadke, A.G. Hybrid Linear State Estimation Utilizing Synchronized Phasor Measurements. In Proceedings of the IEEE Lausanne PowerTech, Lausanne, Switzerland, 1–5 July 2007; IEEE: Piscataway, NJ, USA, 2008; pp. 1665–1669. [Google Scholar]
- Abbasy, N.H.; Ismail, H.M. A Unified Approach for the Optimal PMU Location for Power System State Estimation. IEEE Trans. Power Syst. 2009, 24, 806–813. [Google Scholar] [CrossRef]
- Zhu, K.; Nordstrom, L.; Ekstam, L. Application and analysis of optimum PMU placement methods with application to state estimation accuracy. In Proceedings of the IEEE Power & Energy Society General Meeting, Calgary, AB, Canada, 26–30 July 2009; IEEE: Piscataway, NJ, USA, 2009; pp. 1–7. [Google Scholar]
- Celik, M.K.; Liu, W.-H.E. An incremental measurement placement algorithm for state estimation. IEEE Trans. Power Syst. 1995, 10, 1698–1703. [Google Scholar] [CrossRef]
- Li, Q.; Negi, R.; Ilić, M.D. Phasor measurement units placement for power system state estimation: A greedy approach. In Proceedings of the IEEE Power and Energy Society General Meeting, Detroit, MI, USA, 24–29 July 2011; IEEE: Piscataway, NJ, USA, 2011; pp. 1–8. [Google Scholar]
- Yucra, M.; Schmidt, F.; de Almeida, M.C. A comparative analysis of inclusion of PMUs in the power system state estimator. In Proceedings of the IEEE 6th Latin American Symposium on Circuits & Systems (LASCAS), Montevideo, Uruguay, 24–27 February 2015; IEEE: Piscataway, NJ, USA, 2015; pp. 1–4. [Google Scholar]
- Göl, M.; Abur, A. PMU placement for robust state estimation. In Proceedings of the North American Power Symposium (NAPS), Manhattan, KS, USA, 22–24 September 2013; IEEE: Piscataway, NJ, USA, 2013; pp. 1–5. [Google Scholar]
- Wu, J.; Xiong, J.; Shil, P.; Shi, Y. Optimal PMU placement for identification of multiple power line outages in smart grids. In Proceedings of the IEEE 57th International Midwest Symposium on Circuits and Systems (MWSCAS), College Station, TX, USA, 3–6 August 2014; IEEE: Piscataway, NJ, USA, 2014; pp. 354–357. [Google Scholar]
- Lu, Z.-G.; Tian, S.-S.; Liu, X.-Y.; Zhao, H. A new numerical algorithm to check the observability and bad-data processing ability of the metering scheme. Int. J. Electr. Power Energy Syst. 2015, 66, 144–153. [Google Scholar] [CrossRef]
- Gou, B.; Kavasseri, R.G. Unified PMU Placement for Observability and Bad Data Detection in State Estimation. IEEE Trans Power Syst. 2014, 29, 2573–2580. [Google Scholar] [CrossRef]
- Chen, J.; Liao, Y. Optimal Placement of Phasor Measurement Units for Improving Power System State Estimation Accuracy: A Heuristic Approach. J. Electr. Eng. Electron. Technol. 2012, 1. [Google Scholar] [CrossRef]
- Shahriar, M.S.; Ahmad, F.A.; Habiballah, I.O.; Asif, M.A.; Mukherjee, S. Artificial Bee Colony based Optimal PMU Placement in Power System State Estimation. In Proceedings of the 1st International Conference on Advanced Information and Communication Technology (ICAICT), Chittagong, Bangladesh, 16–17 May 2016. [Google Scholar]
- Abur, A.; Gómez-Expósito, A. Power System State Estimation: Theory and Implementation, 1st ed.; Marcel Dekker: New York, NY, USA, 2004; ISBN 0-8247-5570-7. [Google Scholar]
- Zimmerman, R.D.; Murillo-Sanchez, C.E.; Thomas, R.J. MATPOWER: Steady-State Operations, Planning and Analysis Tools for Power Systems Research and Education. IEEE Trans. Power Syst. 2011, 26, 12–19. [Google Scholar] [CrossRef]
- Göl, M.; Abur, A. LAV Based Robust State Estimation for Systems Measured by PMUs. IEEE Trans. Smart Grid 2014, 5, 1808–1814. [Google Scholar] [CrossRef]
- Do Coutto Filho, M.B.; de Souza, J.C.S.; de Oliveira, F.M.F.; Schilling, M.T. Identifying critical measurements and sets for power system state estimation. In Proceedings of the IEEE Porto Power Tech Proceedings, Porto, Portugal, 10–13 September 2001; IEEE: Piscataway, NJ, USA, 2002; pp. 6–12. [Google Scholar]
- Houck, C.R.; Joines, J.A.; Kay, M.G. A Genetic Algorithm for Function Optimization: A Matlab Implementation; Technical Report NCSU-IE TR-95-09; North Carolina State University: Raleigh, NC, USA, 1995. [Google Scholar]
- Schmitt, L.M. Theory of genetic algorithms. Theor. Comput. Sci. 2001, 259, 1–61. [Google Scholar] [CrossRef]
- Kamireddy, S. Comparison of State Estimation Algorithms Considering Phasor Measurement Units and Major and Minor Data Loss. Master’s Thesis, Mississippi State University, Starkville, MS, USA, 2008. [Google Scholar]


| Measurement Description | 30-Bus System | 118-Bus System |
|---|---|---|
| Total measurements | 126 | 440 |
| Redundancy | 2.13 | 1.87 |
| Number of voltage-magnitudes (Vm) | 14 | 62 |
| Number of real power-injections (PG) | 16 | 55 |
| Number of reactive power-injections (QG) | 15 | 55 |
| Number of real power-flows from a bus (PF) | 25 | 68 |
| Number of reactive power-flows from a bus (QF) | 24 | 68 |
| Number of real power-flows to a bus (PT) | 16 | 66 |
| Number of reactive power-flows to a bus (QT) | 16 | 66 |
| Measurement Type | Measurement Locations |
|---|---|
| Voltage-magnitude buses | 1, 6, 24 |
| Voltage-angle buses | 1, 6, 24 |
| Current flow branches (real and reactive) | 1-2, 1-3, 6-7, 6-8, 6-9, 6-10, 6-28, 24-25 |
| Measurement Type | Standard Deviation σ (Per Unit) |
|---|---|
| SCADA voltage magnitude | 0.01 |
| Real power injection | 0.02 |
| Reactive power injection | 0.04 |
| Real power flow | 0.02 |
| Reactive power flow | 0.04 |
| PMU voltage magnitude | 0.0001 |
| PMU voltage angle | 0.006 |
| PMU current magnitude | 0.0001 |
| PMU current angle | 0.006 |
| Criteria | Considered Parameter |
|---|---|
| Population size | 100 |
| Selection probability | 1 |
| Crossover probability | 0.9 |
| Mutation probability | 0.25 |
| Maximum number of iterations | 250 |
| Elite chromosome (PMU must be installed) | Slack bus: Bus-1 for 30-bus and bus-69 for 118-bus system |
| Buses which cover the critical zones | |
| Crossover point | 30-bus: Double |
| 118-bus: Triple | |
| Stopping criteria | 1. Reaching the maximum number of iterations |
| 2. If the fitness value does not change for consecutive 100 iterations |
| Number of PMUs | Heuristic | BGA | ||
|---|---|---|---|---|
| Optimal PMU Locations | Normalized Cumulative Error (NCE) Value | Optimal PMU Locations | NCE Value | |
| 2 | 1, 6 | 2.89 × 10⁻⁴ | 1, 6 | 2.89 × 10⁻⁴ |
| 3 | 1, 6, 25 | 1.81 × 10⁻⁴ | 1, 10, 25 | 1.78 × 10⁻⁴ |
| 4 | 1, 6, 22, 25 | 1.28 × 10⁻⁴ | 1, 6, 12, 24 | 1.27 × 10⁻⁴ |
| 5 | 1, 6, 12, 22, 25 | 7.69 × 10⁻⁵ | 1, 6, 12, 22, 25 | 7.69 × 10⁻⁵ |
| Number of PMUs | Heuristic | BGA | ||
|---|---|---|---|---|
| Optimal PMU Locations | NCE Value | Optimal PMU Locations | NCE Value | |
| 2 | 69, 100 | 6.35 × 10⁻⁴ | 69, 100 | 6.35 × 10⁻⁴ |
| 3 | 69, 100, 30 | 5.41 × 10⁻⁴ | 69, 38, 26 | 5.397 × 10⁻⁴ |
| 4 | 69, 100, 30, 25 | 4.63 × 10⁻⁴ | 26, 38, 69, 100 | 4.362 × 10⁻⁴ |
| 5 | 69, 100, 30, 25, 64 | 3.83 × 10⁻⁴ | 69, 100, 30, 25, 64 | 3.83 × 10⁻⁴ |
| 6 | 69, 100, 30, 25, 64, 32 | 3.32 × 10⁻⁴ | 69, 100, 30, 25, 64, 32 | 3.32 × 10⁻⁴ |
| 7 | 69, 100, 30, 25, 64, 32, 1 | 2.97 × 10⁻⁴ | 69, 100, 30, 25, 64, 32, 1 | 2.97 × 10⁻⁴ |
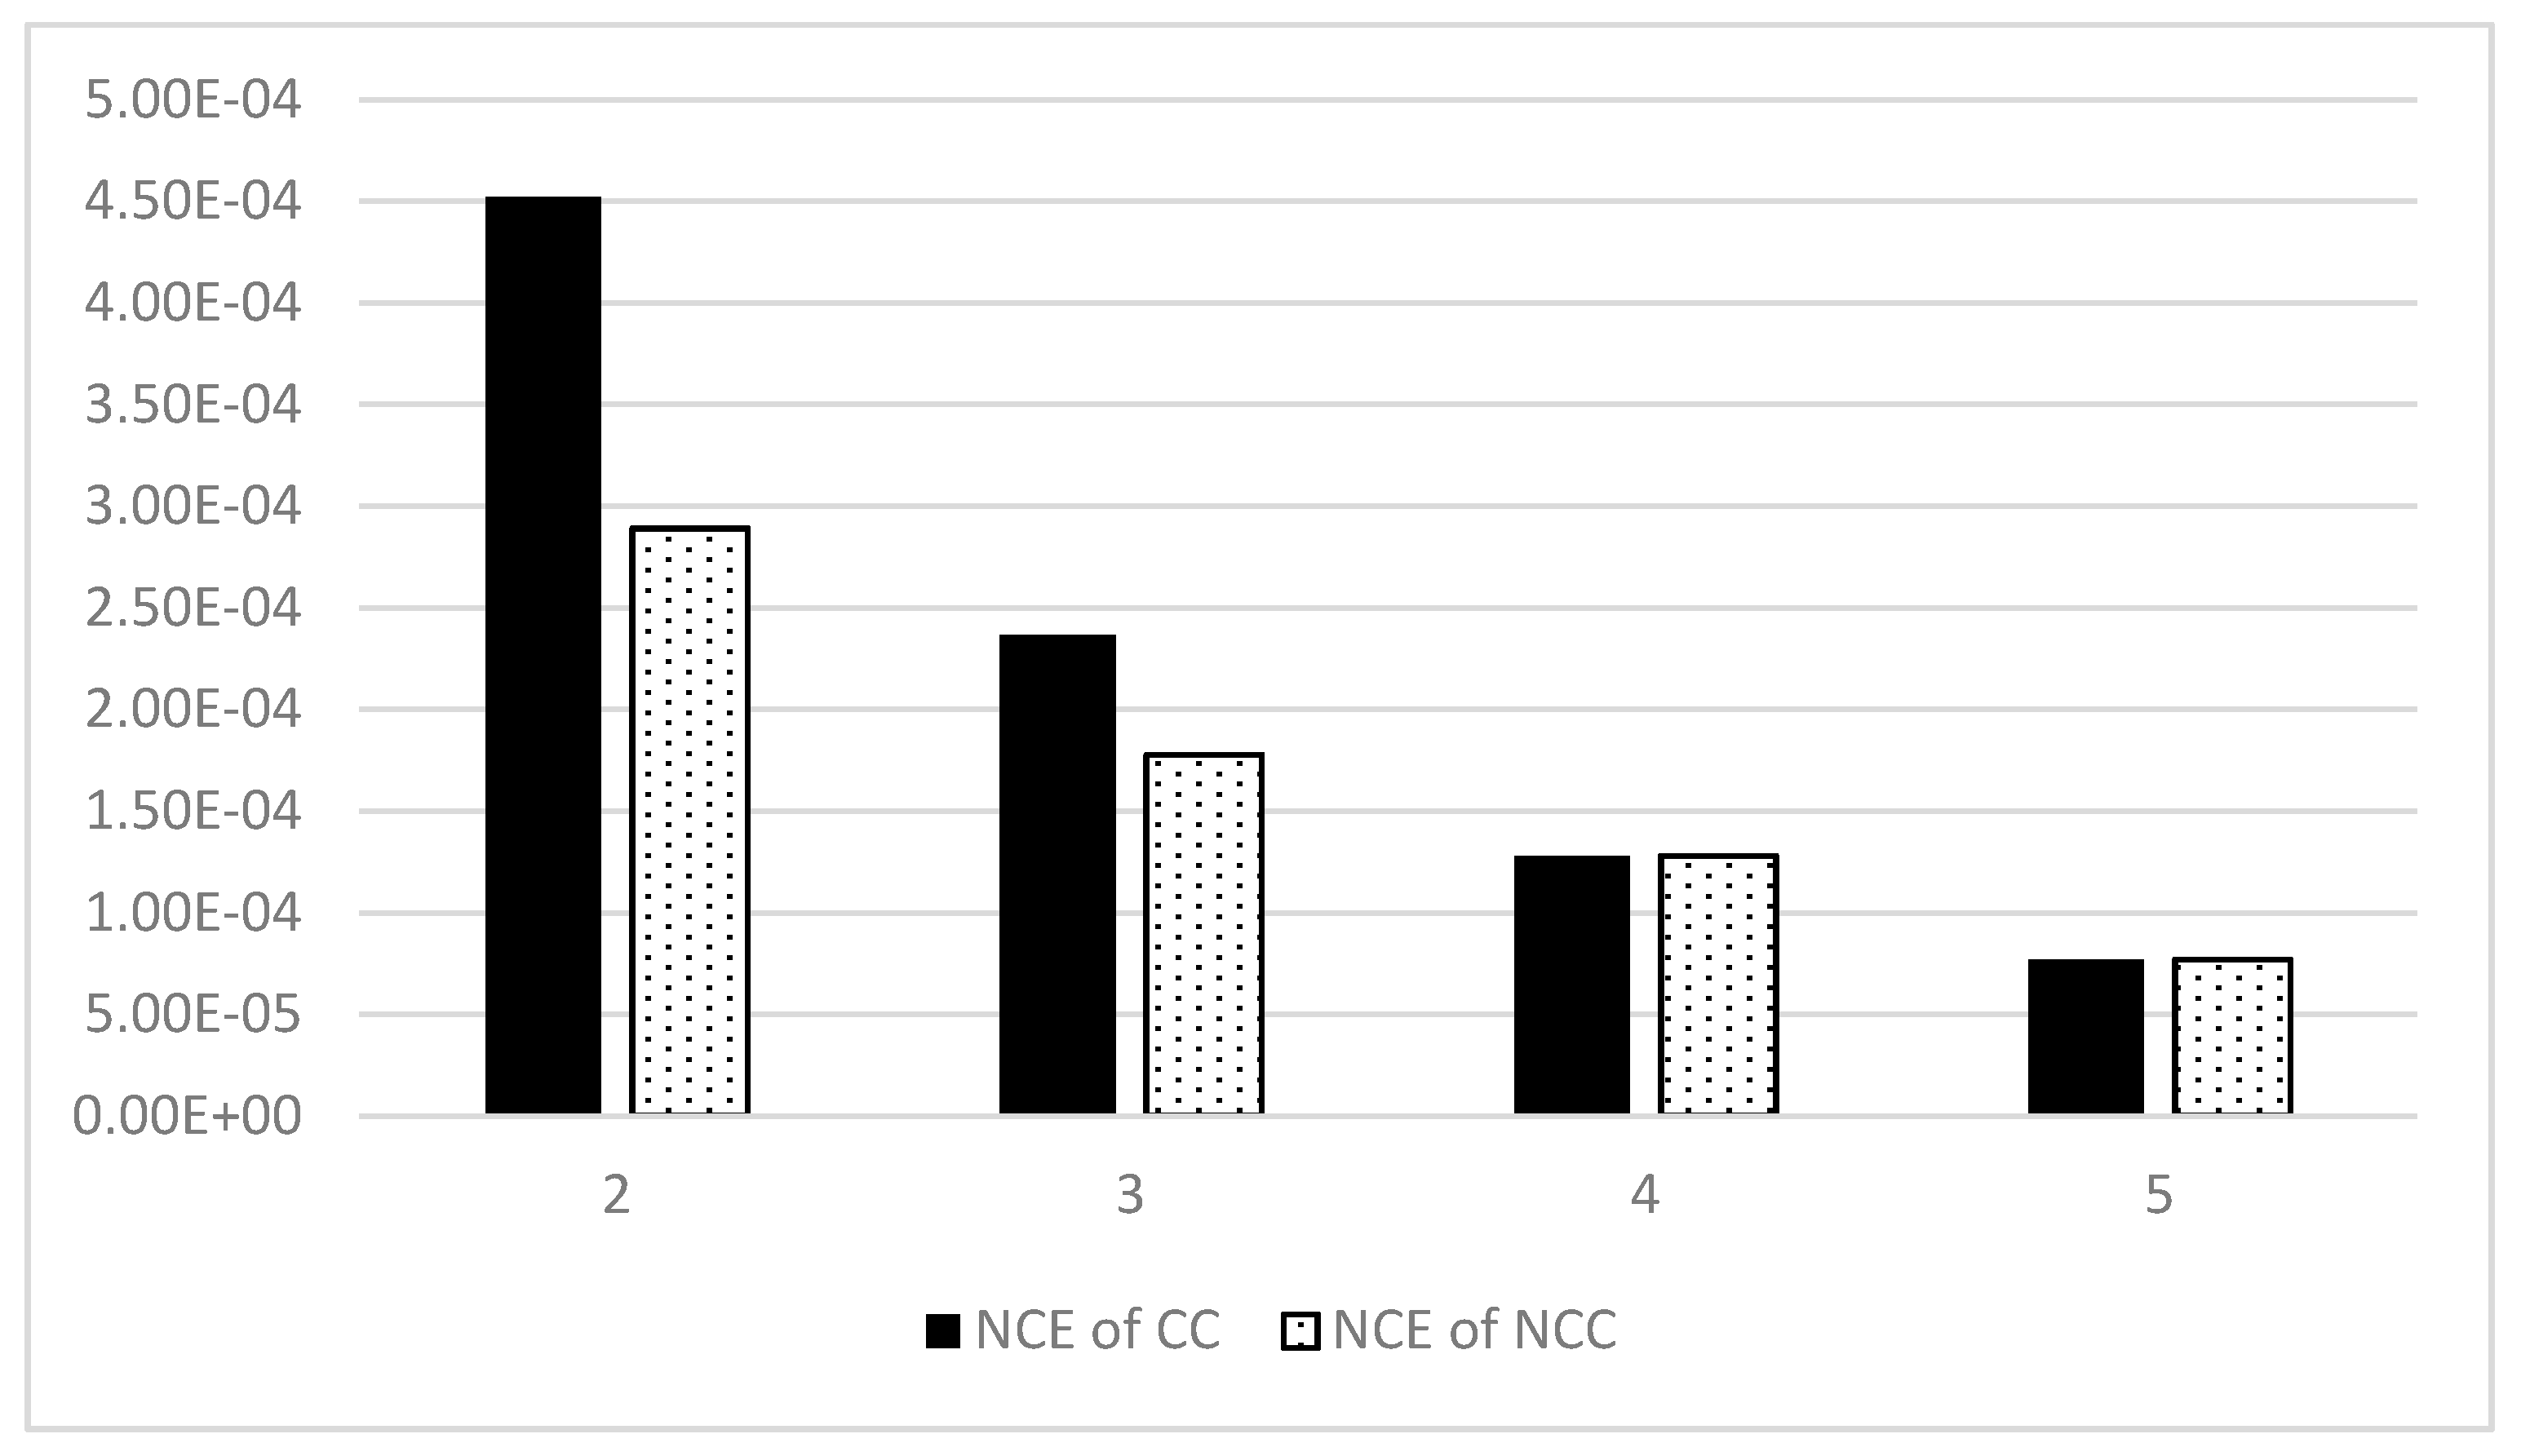
| Number of PMUs | NCC (Not Covering Critical) | CC (Covering Critical) | ||
|---|---|---|---|---|
| Optimal PMU Locations | NCE Value | Optimal PMU Locations | NCE Value | |
| 2 | 1, 6 | 2.89 × 10⁻⁴ | 1, 12 | 4.5202 × 10⁻⁴ |
| 3 | 1, 10, 25 | 1.7755 × 10⁻⁴ | 1, 12, 6 | 2.3653 × 10⁻⁴ |
| 4 | 1, 6, 12, 24 | 1.2792 × 10⁻⁴ | 1, 6, 12, 24 | 1.2792 × 10⁻⁴ |
| 5 | 1, 6, 25, 22, 12 | 7.69 × 10⁻⁵ | 1, 6, 25, 22, 12 | 7.69 × 10⁻⁵ |
| Number of PMUs | NCC (Not Covering Critical) | CC (Covering Critical) | ||
|---|---|---|---|---|
| Optimal PMU Locations | NCE Value | Optimal PMU Locations | NCE Value | |
| 2 | 69, 100 | 6.35 × 10⁻⁴ | 39, 69 | 7.095 × 10⁻⁴ |
| 3 | 69, 38, 26 | 5.396 × 10⁻⁴ | 39, 69, 100 | 6.08 × 10⁻⁴ |
| 4 | 26, 38, 69, 100 | 4.362 × 10⁻⁴ | 39, 49, 69, 100 | 5.226 × 10⁻⁴ |
| 5 | 69, 100, 30, 25, 64 | 3.83 × 10⁻⁴ | 39, 69, 31, 100, 116 | 4.699 × 10⁻⁴ |
| 6 | 69, 100, 30, 25, 64, 32 | 3.32 × 10⁻⁴ | 39, 69, 26, 29, 38, 100 | 4.12 × 10⁻⁴ |
| 7 | 69, 100, 30, 25, 64, 32, 1 | 2.97 × 10⁻⁴ | 39, 69, 12, 61, 19, 100, 32 | 3.59 × 10⁻⁴ |
| Critical Measurements | Elite Chromosomes | Optimization Results | ||
|---|---|---|---|---|
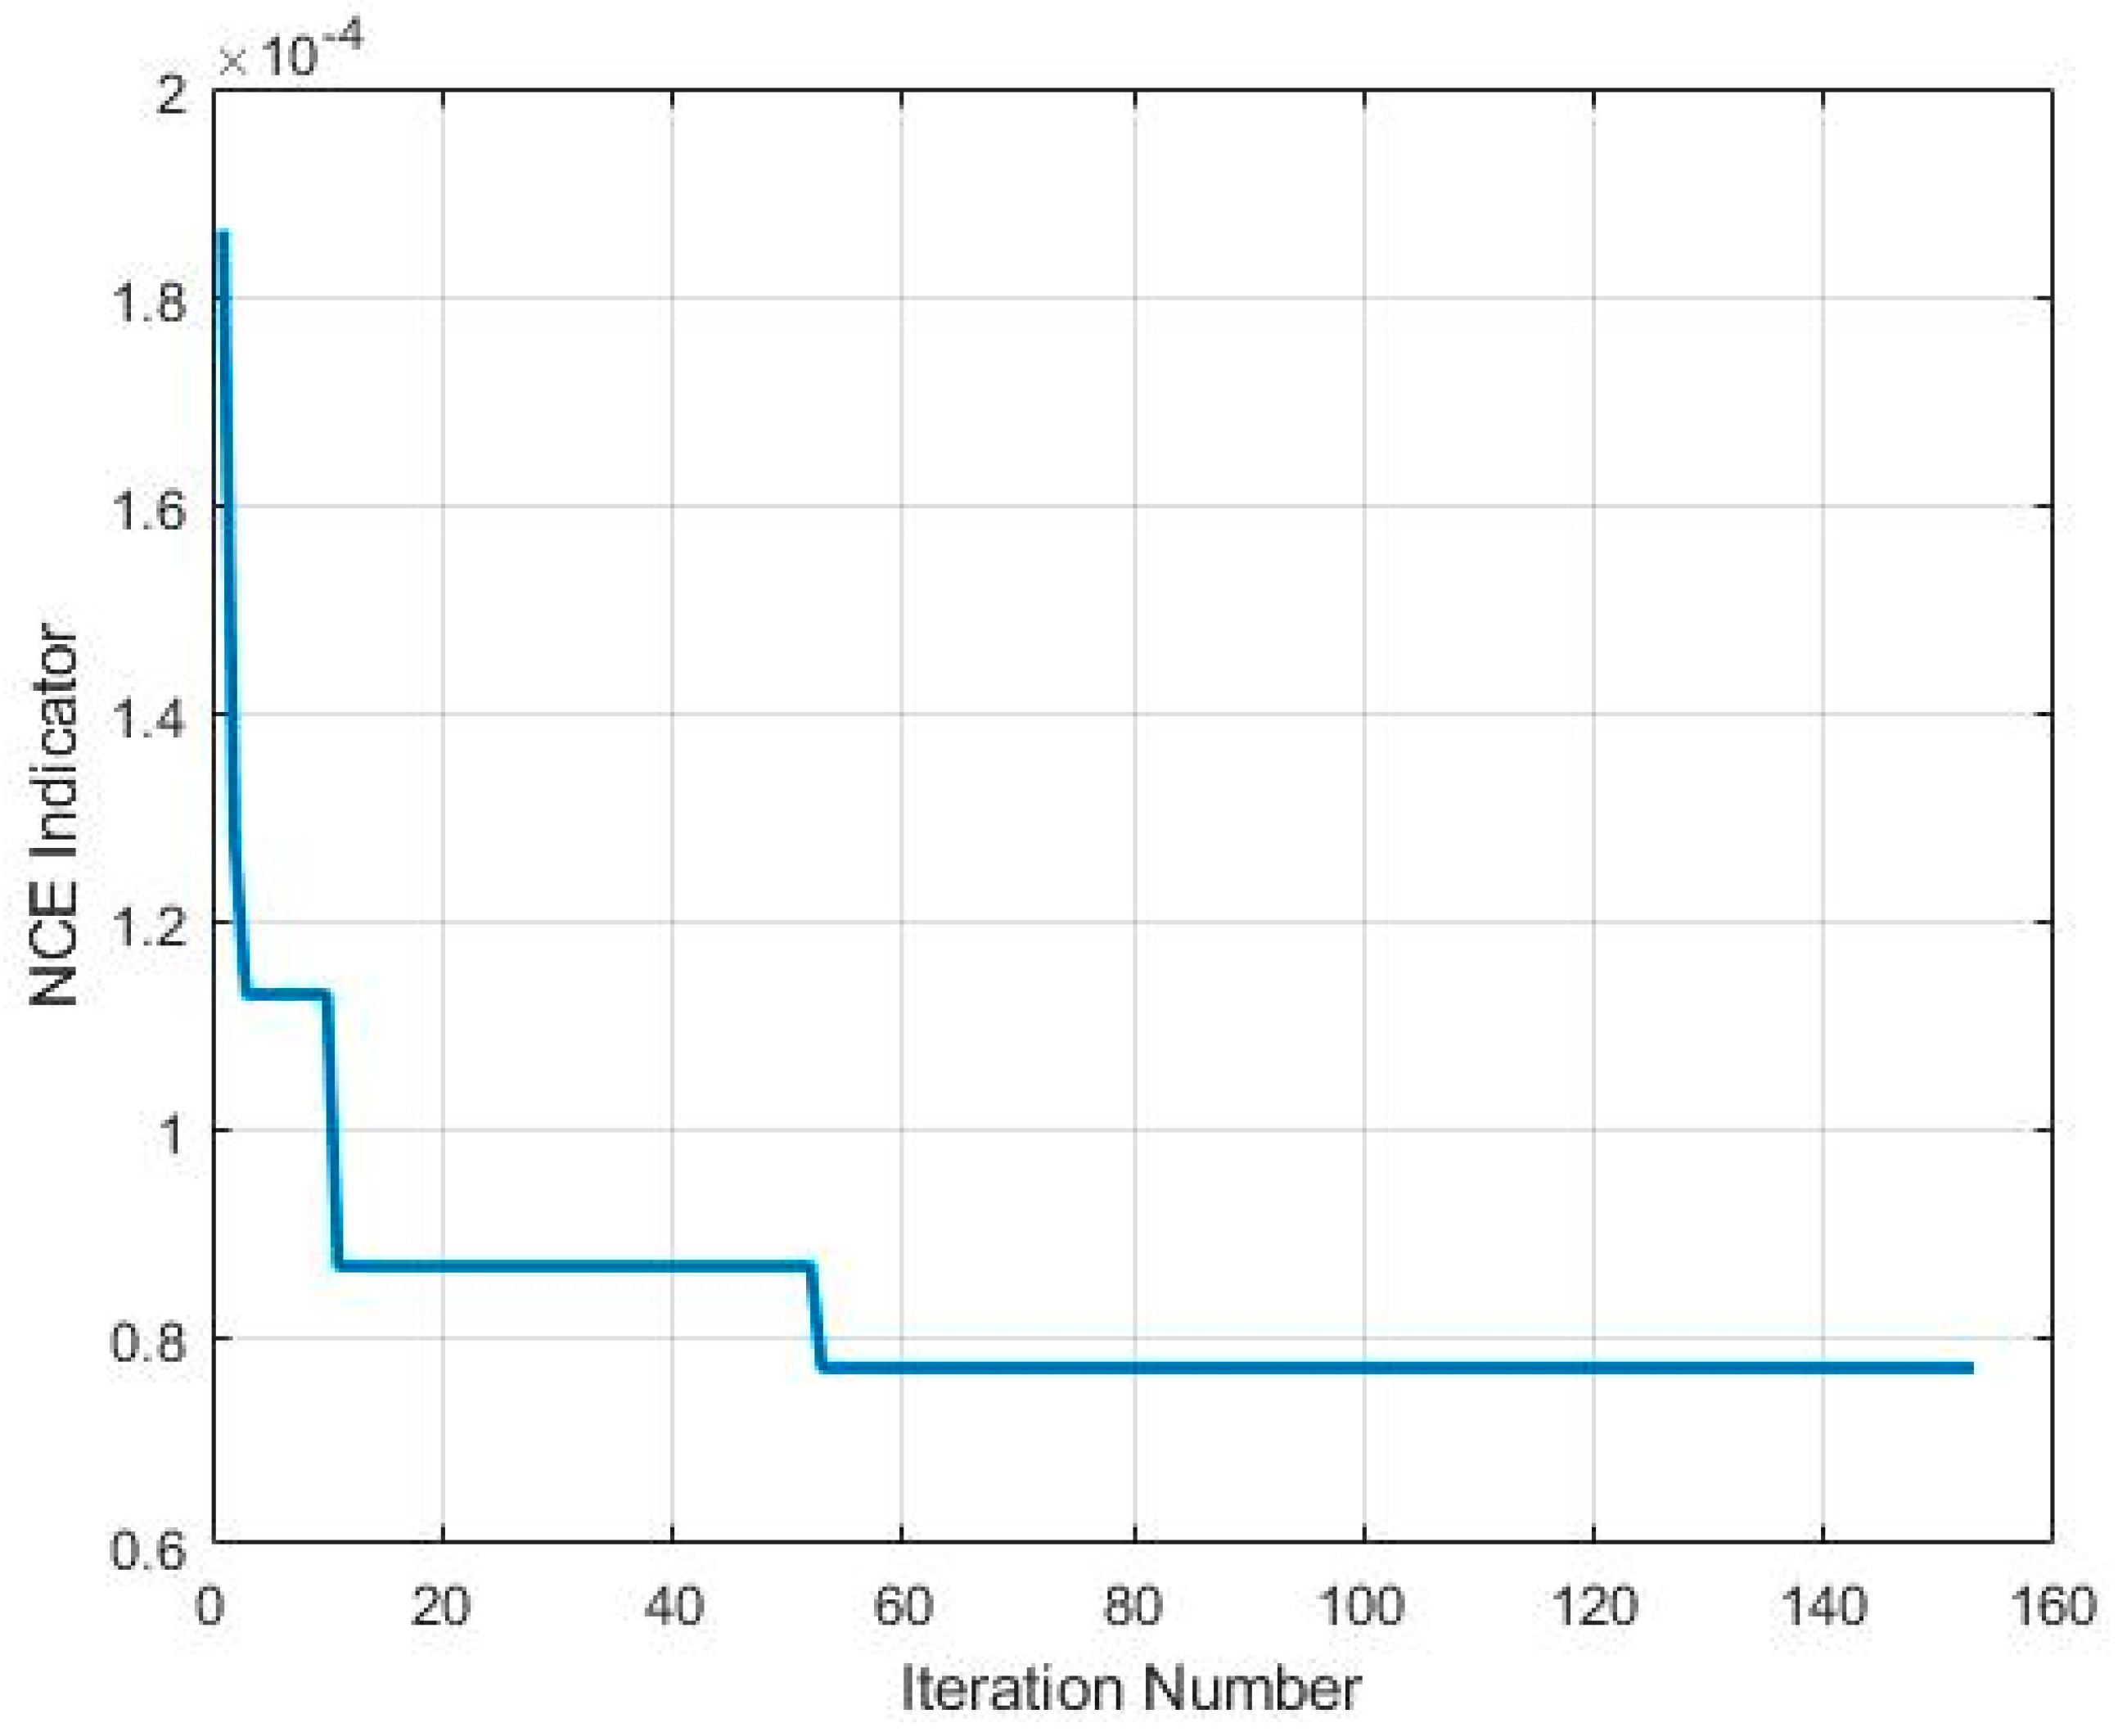
| PF_12-13, QF_12-13, QF_25-26, Vm_26 | 1 (slack bus), 12, 26 | No of PMUs | Optimal PMU Locations | NCE Indicator |
| 2 | 1, 12 | 8.198 × 10⁻⁴ | ||
| 3 | 1, 12, 26 | 6.707 × 10⁻⁴ | ||
| 4 | 1, 6, 12, 26 | 4.004 × 10⁻⁴ | ||
| 5 | 1, 6, 12, 24, 26 | 2.245 × 10⁻⁴ | ||
| 6 | 1, 6, 12, 24, 26, 4 | 1.011 × 10⁻⁴ | ||
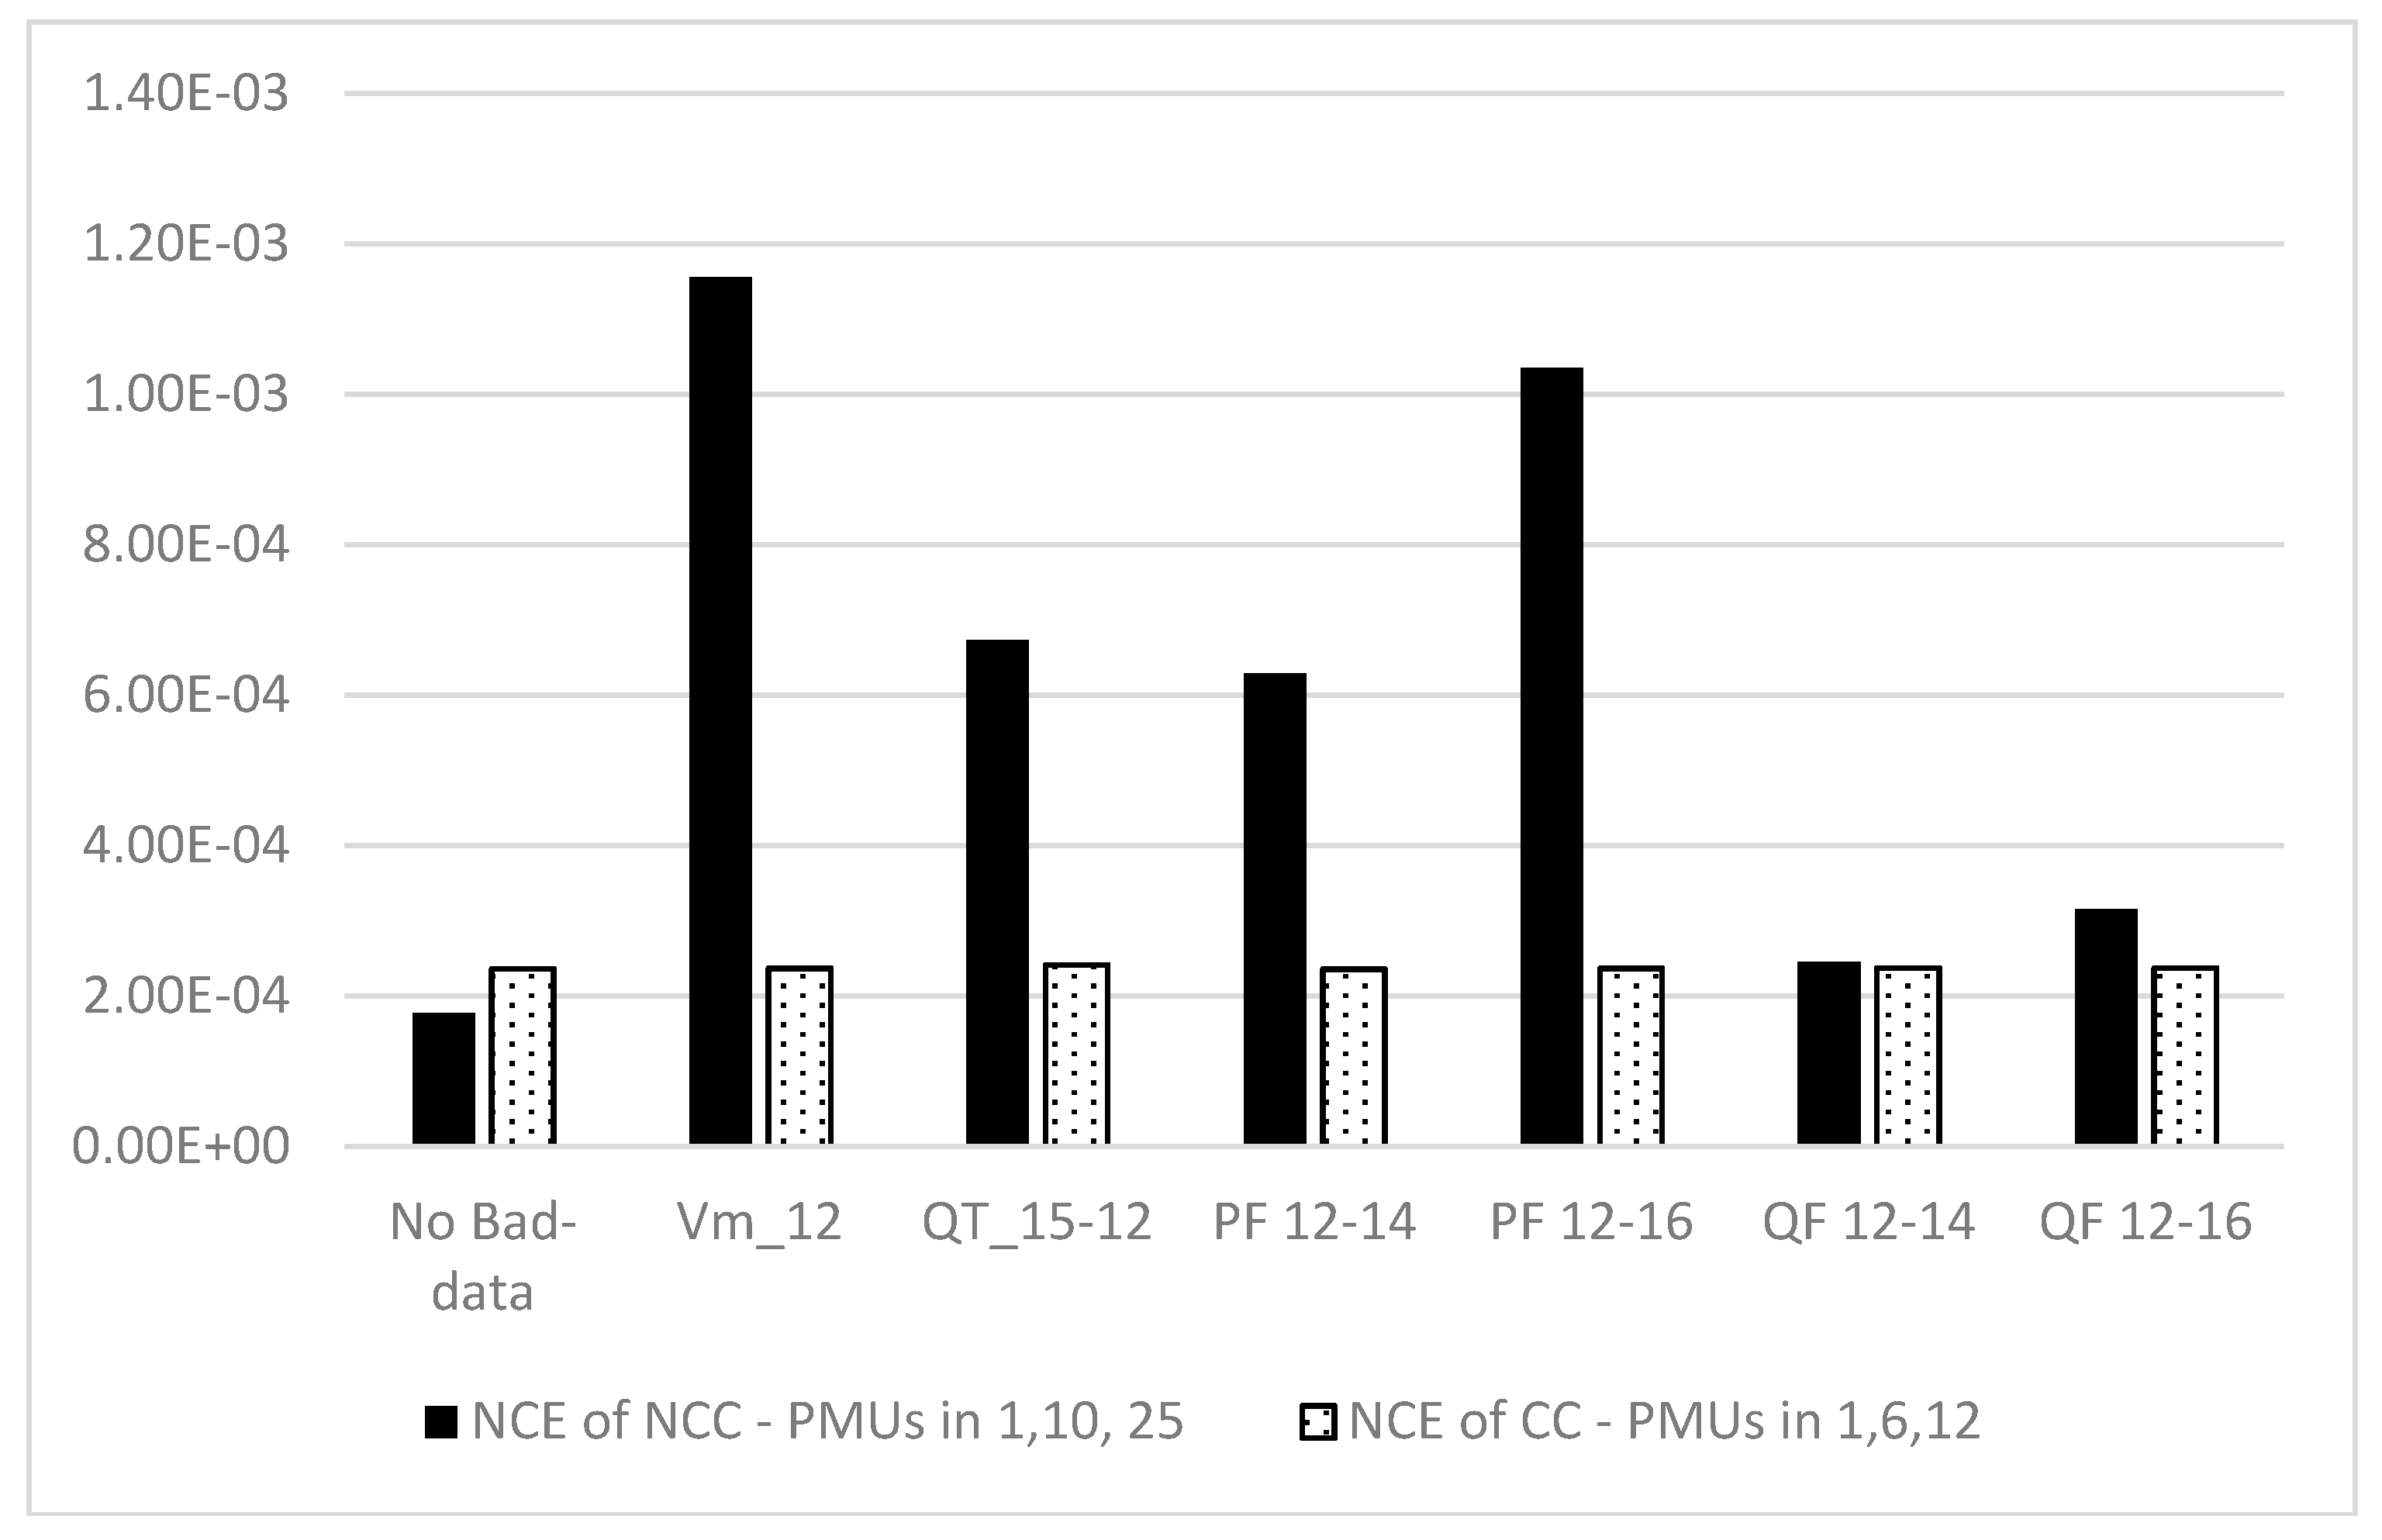
| Cases | Bad-Data Location | NCC (Not Covering Critical) (PMUs in 1, 10, 25) | CC (Covering Critical) (PMUs in 1, 6,12) |
|---|---|---|---|
| White noises only | N/A | 1.7755 × 10⁻⁴ | 2.3653 × 10⁻⁴ |
| Single bad-data around critical locations | Vm_12 | 1.155 × 10⁻³ | 2.370 × 10⁻⁴ |
| QT_15-12 | 6.733 × 10⁻⁴ | 2.415 × 10⁻⁴ | |
| PF_12-14 | 6.294 × 10⁻⁴ | 2.358 × 10⁻⁴ | |
| PF_12-16 | 1.035 × 10⁻³ | 2.366 × 10⁻⁴ | |
| QF_12-14 | 2.453 × 10⁻⁴ | 2.373 × 10⁻⁴ | |
| QF_12-16 | 3.157 × 10⁻⁴ | 2.375 × 10⁻⁴ |
© 2018 by the authors. Licensee MDPI, Basel, Switzerland. This article is an open access article distributed under the terms and conditions of the Creative Commons Attribution (CC BY) license (http://creativecommons.org/licenses/by/4.0/).
Share and Cite
Shahriar, M.S.; Habiballah, I.O.; Hussein, H. Optimization of Phasor Measurement Unit (PMU) Placement in Supervisory Control and Data Acquisition (SCADA)-Based Power System for Better State-Estimation Performance. Energies 2018, 11, 570. https://doi.org/10.3390/en11030570
Shahriar MS, Habiballah IO, Hussein H. Optimization of Phasor Measurement Unit (PMU) Placement in Supervisory Control and Data Acquisition (SCADA)-Based Power System for Better State-Estimation Performance. Energies. 2018; 11(3):570. https://doi.org/10.3390/en11030570
Chicago/Turabian StyleShahriar, Mohammad Shoaib, Ibrahim Omar Habiballah, and Huthaifa Hussein. 2018. "Optimization of Phasor Measurement Unit (PMU) Placement in Supervisory Control and Data Acquisition (SCADA)-Based Power System for Better State-Estimation Performance" Energies 11, no. 3: 570. https://doi.org/10.3390/en11030570
APA StyleShahriar, M. S., Habiballah, I. O., & Hussein, H. (2018). Optimization of Phasor Measurement Unit (PMU) Placement in Supervisory Control and Data Acquisition (SCADA)-Based Power System for Better State-Estimation Performance. Energies, 11(3), 570. https://doi.org/10.3390/en11030570